Timing of Sandeel Spawning and Hatching Off the East Coast of Scotland
 Alan MacDonald
 Michael R. Heath
 Simon P. R. Greenstreet2
  Douglas C. Speirs
- 1Department of Mathematics and Statistics, University of Strathclyde, Glasgow, United Kingdom
- 2Marine Laboratory, Marine Scotland Science, Aberdeen, United Kingdom
The lesser sandeel, Ammodytes marinus, is a key forage fish species in the North Sea. Mean lengths and abundances of sandeels have declined steeply since the 1990's and these are associated with declining breeding success of various seabird species on the east coast of Scotland, especially kittiwakes. The declining lengths have led to a mismatch between the peak in food demand arising from chick rearing, and the appearance of appropriately sized young sandeels in the foraging areas of the birds. A 10-year time series of sandeel larval samples between 2000 and 2009 offer a rare opportunity to analyze trends in spawning and hatch dates and determine whether they contributed to changes in mean lengths. By analyzing the abundance, length, and age distributions of sandeel larvae we were able to determine the temporal distribution of hatching rates each year, and back-track to the likely spawning dates of the sandeels. Estimated spawning dates showed no evidence of correlation with environmental cues such as tidal or lunar phases. However, hatch end dates varied by 20 days over the 10-year period and were correlated with the date of the seasonal minimum of sea bottom temperature. We show a significant decline between growth rate and 0-group length between 2000 and 2009, and suggest that changes in food quality and availability, rather than shifts in hatch dates, are likely to be responsible for current declines in the availability of sandeels to seabirds.
Introduction
Ongoing climate change is causing significant changes in the phenology of marine organisms (Edwards and Richardson, 2004; Thackeray et al., 2010). These changes have a number of effects at the level of interactions between species, with mismatches between the timing of life cycle events being suggested as a major driver of recruitment in some species (Beaugrand et al., 2003; Platt et al., 2003). Significant oceanic warming is likely unavoidable this century (Intergovernmental Panel on Climate Change (IPCC) WGI, 2007). Therefore, understanding the environmental drivers of the timing of life cycle events is a key challenge of current marine biology and ecology. Phenological changes in prey that trigger changes in predator abundance are referred to as bottom-up trophic cascades (Carpenter et al., 1985; Pace et al., 1999; Polis et al., 2000; Heath et al., 2014). In the North Sea, the connection between seabirds and sandeels provides an illustrative example of a trophic cascade. Here a reduction in sandeel quality and availability has likely contributed to the decline in seabird breeding numbers (MacDonald et al., 2015).
Sandeels are small lipid rich fish that account for approximately 25% of North Sea fish biomass (Christensen et al., 2013). A. marinus, hereafter sandeels, is the most abundant sandeel, usually comprising more than 90% of the sandeel fishery catch (Macer, 1966; Goodlad and Napier, 1997). Off the Scottish east coast, 0-group sandeels play a key role in the diet of the chicks of several seabird species during the breeding season (Wanless et al., 1998, 2004; Lewis et al., 2001; Lahoz-Monfort et al., 2011). In some years, several seabird species feed their chicks a diet comprised almost exclusively of 0-group sandeels (Lewis et al., 2001). Seabirds are influenced by a number of factors, including total abundance and timing of seasonal abundance peaks in 0-group sandeels (Wright, 1996; Frederiksen et al., 2006, 2007). In addition, seabirds are sensitive to 0-group energy value (Wanless et al., 2004; Wilson et al., 2004; Burthe et al., 2012). This energy value is mostly determined by sandeel length, which is why poor breeding success has often occurred in years when length is smaller than average (Wright, 1996; Lewis et al., 2001). Hence, it is a concern that 0-group length has been declining for the past few decades off the Firth of Forth (Wanless et al., 2004; Frederiksen et al., 2011).
Several mechanisms could drive a long-term decline in 0-group length. Changes in larval mortality with respect to hatch date could explain this decline if mortality of early hatching larvae gradually increased. Other mechanisms that could drive this decline are changes in spawning and hatching dates. Additionally, a decline in length could arise from decreasing growth rate of sandeels between hatching and sampling as 0-group, hereafter referred to as juvenile growth rate. Only Frederiksen et al. (2011) have attempted to address which mechanisms have caused this decline in 0-group size. This study used data on sandeels caught by Atlantic puffins Fratercula arctica and Continuous Plankton Recorder (CPR) survey samples to reconstruct changes in hatch date and juvenile growth rates between 1973 and 2006 across the northwestern North Sea. It was concluded that the principal driver of a reduction in 0-group size between 1973 and 1995 was later hatching. This would result in sandeels being younger, and therefore smaller during seabird breeding season. Between 1996 and 2006 hatch dates were estimated to become earlier which would lead to increases in length. However, length continued to decrease, so declining growth rate must have been the driver. The difficulty in using CPR data to estimate sandeel hatch dates is that catches by the CPR sampler are low and are conducted at 1-month nominal intervals. To correct for this, catch data has to be aggregated over a large area. However, this is problematic if there is large spatio-temporal variation in hatching which is the case in sandeels (Lynam et al., 2013). If large spatial variation in hatch timing exists, then aggregating CPR data over a large area to correct for small catches of sandeel larvae might result in a skewed estimation of hatch date. In this case, it is wise to derive hatch dates from a single location, so long as there is high temporal resolution.
The mechanisms underpinning spawning and hatching are poorly understood. This is largely due to a lack of long-term data, which makes it difficult to analyse correlations with environmental variables such as temperature. Spawning has been recorded directly in December and January (Macer, 1966; Reay, 1970; Gauld and Hutcheon, 1990; Bergstad et al., 2001). Temperature can be a major driver of spawning time (Carscadden et al., 1997) or not at all (Gordoa and Carreras, 2014). The little we do know about spawning mechanisms is gathered from the pacific sandeel (A. hexapterus). This species occasionally spawns en masse during the high tide period (Pentilla, 1995).
Hatching in A. marinus occurs well in advance of the spring bloom (Coombs, 1980; Wright and Bailey, 1996). There are two main drivers of hatch date—a temperature-dependent incubation period and spawning date (Winslade, 1971). One of the few studies on hatch date variability showed that large inter-annual changes in hatching were not driven by temperature during the incubation period. Instead, changes in spawning dates or oxygen concentration were proposed as potential hatch date drivers (Winslade, 1971). Recent laboratory work shows that the effect of temperature on the duration of ovarian development, and therefore spawning date, may be much greater than the effect on the duration of embryonic development (Wright et al., 2017).
To carry out the analysis, we rule out changes in spawning and hatch dates as potential drivers of declining 0-group length between 2000 and 2009, and show that the decline is likely caused by a reduction in juvenile growth rate. Further, to determine whether spawning and hatching will become earlier or later over time, which may subsequently reduce 0-group length, we analysed possible environmental drivers of sandeel spawning and hatching. If spawning and hatching are environmentally cued, this would provide a buffer from future temperature rises.
Materials and Methods
Sandeel Sampling Locations
Sandeel samples were taken in two different monitoring sites off the east coast of Scotland between 2000 and 2009, a larval sampling site, and a juvenile and adult sampling site. Larval sampling was conducted in a site off the northeast coast of Scotland (56°57.83′N, 002°06.74′W, water depth = 45 m; Figure 1). For full sampling details of larvae, see Heath et al. (2012). Sampling of larvae took place almost every week between 2000 and 2009 so the temporal coverage was satisfactory for estimation of sandeel abundance. The least coverage occurred in 2004 when surveys did not take place in 5 weeks of the first half of the year (1st January−1st July). Plankton were sampled with a 100 cm mouth diameter net of 350 μm mesh. The net was towed obliquely at a speed of 1 m.s−1 to within ~3 m of the seabed depth (45 m). Upon recovery of the net, the whole catch was washed into the cod-end. Temperature data was recorded during each survey at 1 and 45 m depths, respectively, using reversing thermometers and CTD probes.
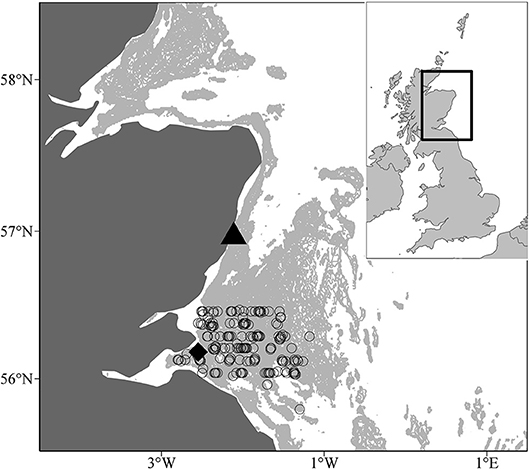
Figure 1. Location of larval (black traingle, 56° 57.83′N, 002° 06.74′W) and juvenile and adult sampling (open circles) sites off the Scottish east coast. The black diamond denotes the Isle of May seabird colony. The pale grey shaded area indicates water depths between 30 and 70m, the range of depth sandeels are most commonly found (Wright et al., 2000), and marks out the three main sandbanks, Wee Bankie, Marr Bank, and Berwick's Bank.
Juvenile and adult sandeel sampling was conducted in the sandbanks off the Firth of Forth (between 56°00′N and 56°30′N and 003°00′W and 001°00′W) (Open circles; Figure 1). In each year, trawling was carried out between 0400 and 1800 h GMT between late May and early July. Surveys covered the main sandbanks, the Wee Bankie, Marr Bank, and Berwick's Bank, prime habitat for sandeels in this area (Proctor et al., 1998; Pedersen et al., 1999). Sampling was undertaken by the FRV Clupea for the majority of the study period (1997–2007), before it was replaced by the FRV Alba na Mara (2008–2009). The range of dates sandeels were caught was between the 25th May and 20th June (Table 1). No sampling took place in 2004. Juvenile and adult sandeels were sampled with an International Young Gadoid pelagic trawl with a 6 mm mesh cod-end and a bobbin ground gear.
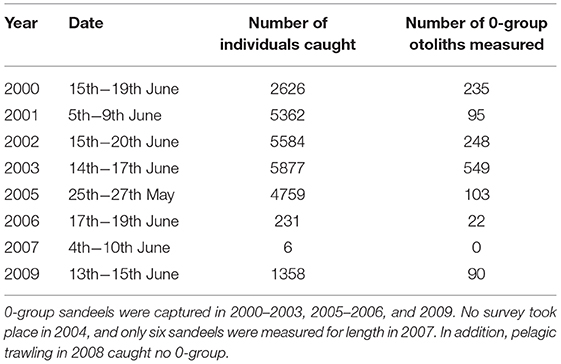
Table 1. The number of sandeels caught and aged from pelagic trawls.
Year-to-Year Changes in 0-Group Mean Length Between 2000 and 2009
Changes in summer 0-group length were estimated from pelagic trawl catch data (Table 1). The total catch in each trawl sample was quantified (number caught per 0.5 cm size class). Length-stratified subsamples were taken and otoliths were extracted to determine age length keys for each cruise. Age (years) was determined from otolith macrostructure using counts of annuli (ICES, 1995). To generate probability distributions of age-given-length for each 1 mm length class in the sample, the continuation-ratio logit method was applied to otolith data to produce smooth age length keys (Kvist et al., 2000; Rindorf and Lewy, 2001; Stari et al., 2010). Changes in distribution of age at a given length, as a function of length, were estimated using Generalised Linear Modelling. Fitting was performed using Maximum Likelihood Estimation. For each sample, abundance-at-age-and length was given by the product of abundance-at-length and probability of age given length. This produced a matrix of abundance at age (columns) and length (rows). Mean length at age a (ML) was given by
where Li is length i (cm) and fi,a is the abundance of sandeels at age a (years) and length i.
Hatch Date Estimation Between 2000 and 2009
For full details of the methodology employed to estimate hatch date distributions, see Heath et al. (2012). Only larvae younger than 7 days old are considered in the estimation of hatch dates. This is because, unlike older larvae, that may have been imported from distant spawning grounds, these newly hatched larvae are likely to have originated exclusively from local spawning sites (Figure 2). Note that year-to-year variation in larval growth rate is unlikely to have a large effect on length-at-age of young larvae. Therefore, the uncertainty associated with assuming a fixed probability distribution of age given length, as done by Heath et al. (2012), is likely to be minimal. We shall quantify this uncertainty later in the Methods section. The 10, 50, and 90th percentiles of the cumulative abundance of newly hatched larvae were used as proxies for hatch start DHs, hatch median DHm, and hatch end DHe, for each year.
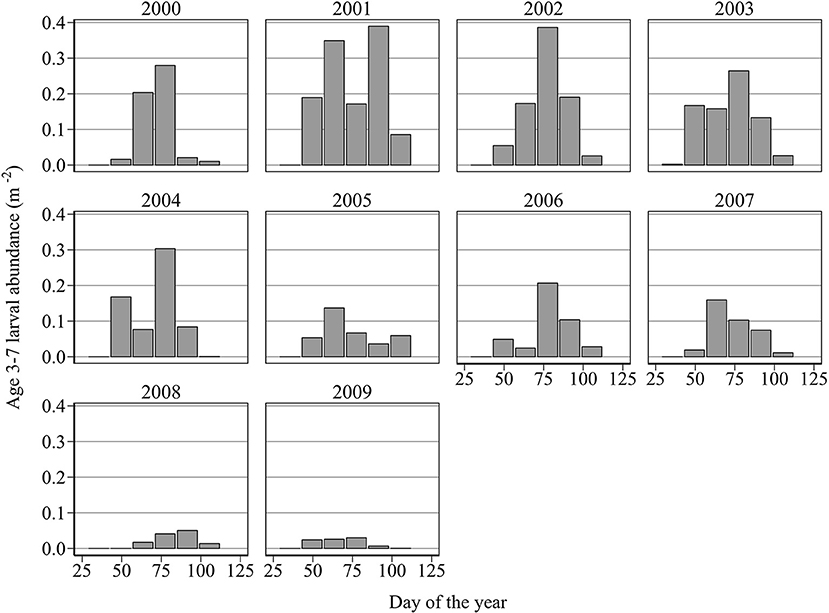
Figure 2. Mean abundance (m−2) of newly hatched larvae (age 3–7 days old when caught) at successive hatch intervals of (days 29–42, 43–56, 57–70, 71–84, 85–98, 99–112, 113–126, and 127–140).
Hindcasting Spawning Dates Between 2000 and 2009
Given hatch date, spawning dates were estimated by assuming a temperature dependent egg development time. To achieve this, a smooth (LOESS, span = 0.065) was fitted to the weekly resolution time series of 45 m temperature measurements, and interpolated to daily intervals. Then, with egg incubation time as a function of temperature (f(T), days), the estimated spawning day tspawn, is described by the equation
where thatch is DHs, DHm, or DHe. f(T) was derived using laboratory data on A. marinus egg incubation times (Régnier et al., 2018). Using nonlinear regression, exponential functions were fitted to the data to give the incubation time from spawning to hatch start date (DHs), hatch median date (DHm), and hatch end date (DHe), as a function of temperature.
where f(T) is either the time to hatch onset (DsT), the median incubation time (DmT), or the time to hatch cessation (DeT). A is the incubation time constant (days) and k is the inclubation time slope (°C−1). Values for A and k are provided in Table 2.
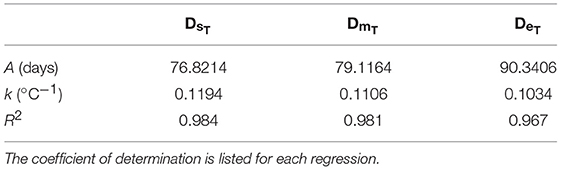
Table 2. Parameters for incubation times to hatch start, median and end dates, estimated using egg incubation data for A. marinus (Régnier et al., 2018).
Estimating Juvenile Growth Rate Between 2000 and 2009
The overall growth rates of sandeels between hatch date and the time of sampling as 0-group individuals, referred to as juvenile growth rate, were estimated by using information on hatch dates and 0-group length.
Estimated growth rate gl (mm day−1) was estimated in the following way:
where L is mean 0-group length (mm) and a is mean age (days). Hatch length is assumed to be 5 mm given that this is the length of the smallest larvae caught in CPR samples (Frederiksen et al., 2011).
Environmental Cues for Spawning and Hatching Between 2000 and 2009
Various environmental cues for spawning and hatching were considered. First, the influence of absolute temperature on hatch and spawning dates were investigated. Then, the existence of lunar and tidal cues was investigated. Dates of new and full moon, and tidal height at Aberdeen (15 km north of the larval sampling site) between 2000 and 2009 were obtained from the Xtide Prediction Server (Flater, 2017). The hypothesis of lunar and tidal cued hatching/spawning was tested using the following procedure: The length of the lunar cycle is ~29.53 days. lc, DH/S, Dnt, and Dfm are defined as the period of the lunar cycle, hatch date, spawning date, the date of the closest neap tide, and date of the closest full moon date, respectively. Tidal phase is therefore defined as
Hence, a phase value of one corresponds to a neap tide. Hatch/spawning and neap tide dates are used to produce phase values for each year in the study period. We define the mean 10-year tidal phase as xobs. Ten random phase values are generated from a uniform distribution with range , and the mean phase is calculated. This is repeated 10,000 times to derive a probability distribution of the mean of 10 random tidal phases. The observed 10-year mean tidal phase xobs is compared with the distribution to find the probability of observing a more extreme value, i.e., p = Pr(X ≥ xobs), where X is the mean of 10 phases. The corresponding p-value for spring tide cued hatching/spawning is simply 1 − p. Lunar cued hatching/spawning is tested in a similar way.
Sensitivity of Hatch Day and Spawning Day Estimates to Variability in Growth Rates Between 2000 and 2009
The application of a fixed probability distribution of age given length derived from the 2000–2001 otolith data in order to transpose the abundance-at-length to abundance-at age in every sample, carried the implicit assumption that there was no variability in larval growth rates. This is despite evidence of large variation in larval length-at-age between years (Wright and Bailey, 1996). To assess the sensitivity of hatch and spawning day estimates to inter-annual variations in annual average growth rate, we conducted a bootstrap analysis in which age-length probability distributions representing discrete variations from the 2000–2001 average growth rate were randomly assigned to all the samples collected in each sampling year. A set of 81 age-length probability distributions was generated to represent discrete annual growth rates in the range ±20% of the 2000–2001 average rate in 0.5% intervals, by rescaling the measured lengths-at-age of individual larvae in the otolith data set and repeating the continuation-ratio logits analysis. Individual lengths were rescaled according to:
where L was an individual length-at-age measurement in the 2000–2001 data set, Lminwas the minimum length in the data set, Lgwas the rescaled length-at-age, and g was the growth rate scaling factor (0.8 ≤ g ≤ 1.2, in intervals of 0.005). The generated distributions were indexed by integer values in the range −40 to +40. We then repeated the process of transposing abundances-at-length to abundances-at-age in each sample through to calculating hatch and spawning dates, having randomly assigned one of the 81 age-length probability distributions to each year-set of samples. The assignment was carried out by randomly drawing an integer index value for each year from a unifrom distribution (see Supplementary Material). This range of values was qualitatively selected to reflect the scale of the most extreme inter-annual variation in growth rate that might be expected from variations in temperature and zooplankton abundances, and by reference to published data for sandeel larvae (Wright and Bailey, 1996). This entire procedure was iterated many times to generate a distribution of hatch and spawning day estimates for each year in the study period.
Results
Year-to-Year Changes in 0-Group Length
There was a pattern of decreasing length between 2000 and 2005, with length increasing thereafter (Figure 3). Length decreased from 6.7 cm in 2000 to 4.3 cm in 2005, then increased to 6 cm in 2009 (Figure 3). This translates to a rate of decrease of 0.53 cm year−1 between 2000 and 2005, and a rate of increase of 0.42 cm year−1 between 2005 and 2009. The proportion of fish >7 cm decreased substantially towards the end the decade. For example, 32% of 0-group sandeels exceeded 7 cm in 2000, compared to only 11% in 2009.
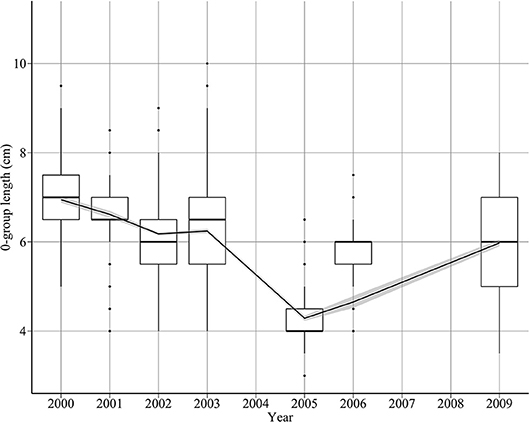
Figure 3. Changes in sandeel 0-group length between 2000 and 2009. The solid line indicates a loess smooth through the data.
Environmental Cues for Hatching
Median hatch date varied over the 10-year period between day 67 in 2009 and day 85 in 2008. The 10-year mean of median hatch date was day 74 (standard deviation = 5 days) (Figure 4). Hatch interval (90th−10th percentiles) varied between 23 days in 2000 and 50 days in 2005 (mean duration = 38 days, standard deviation = 8 days). Median hatch date at the larval sampling site was significantly related to mean hatch dates across the northwestern North Sea in 2000–2006 (54 to 59°N, and from 2°W to 2°E) (adjusted R2: 0.5, p < 0.05). Mean difference between the two measures of hatch date was 5 days (standard deviation = 2 days).
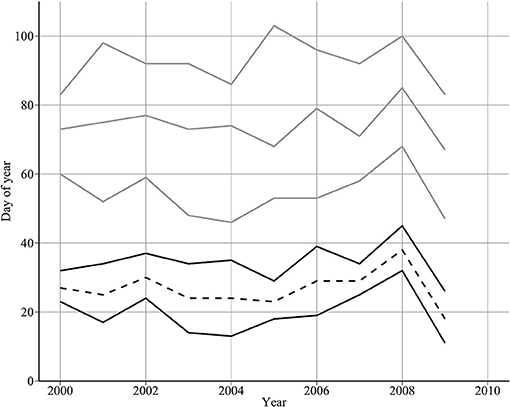
Figure 4. Year-to-year changes in spawning and hatch dates. The top three lines show median hatch date (dotted grey line) enclosed by hatch start and end dates (dashed and solid grey lines, respectively). The bottom two solid lines show the estimated spawning interval derived by backtracking from hatch dates. The bottom dashed line shows the estimated mean spawning date.
Annual minimum temperature (Tmin) varied between 5.7°C in 2001 and 6.9°C in 2007 (Figure 5). Hatching occurred around the day of annual minimum temperature (DTmin). DTmin occurred an average 12 days after hatch onset, and 8 days before median hatch date. The relationship between the hatch end date and DTmin was statistically significant (adjusted R2: 0.44, p < 0.03) (DHe = 35.81 + 0.85 DTmin) possibly suggesting at least some larvae hatch in response to rising spring temperatures (Figure 6). No significant relationships were found between median hatch date and DTmin (p > 0.05), or hatch start date and DTmin (p >0.05). Further, there was no relationship between hatch date and temperature (Table 3). In addition, no significant relationship was found between hatch date (DHs, DHm and DHe) and lunar or tidal events (Table 3).
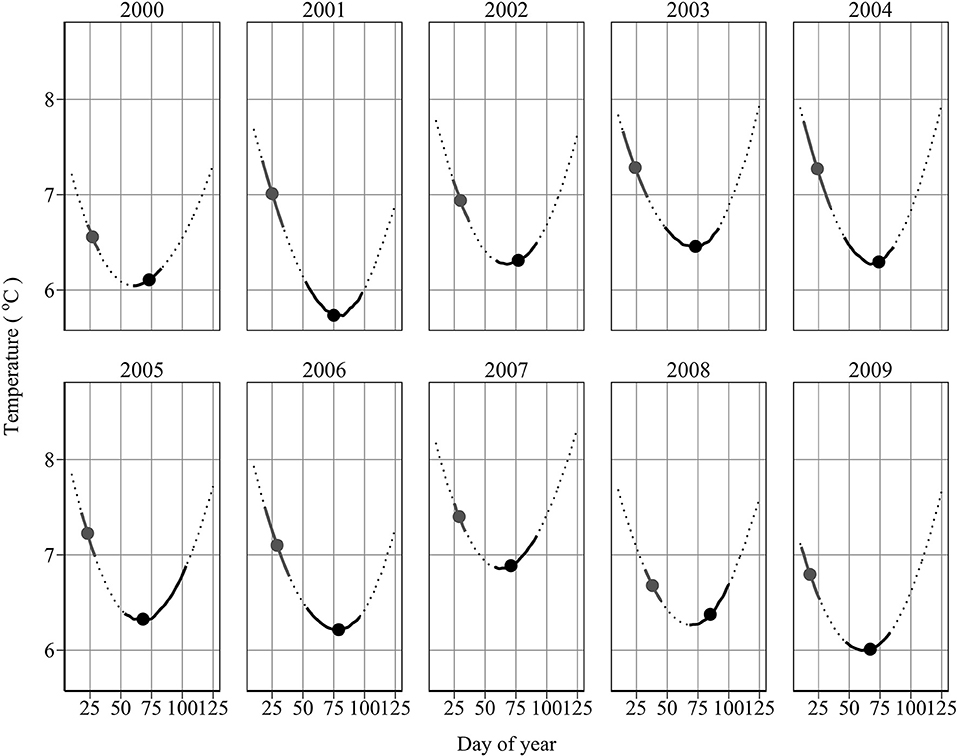
Figure 5. Spawning and hatch dates in relation to temperature. Shown is the temperature profile at 45m depth (dotted line) with overlaid spawning and hatch dates between 10th January and 1st May. Filled circles denote the mean spawning and median hatch dates, respectively. Solid black lines denote the spawning and hatch intervals, respectively.
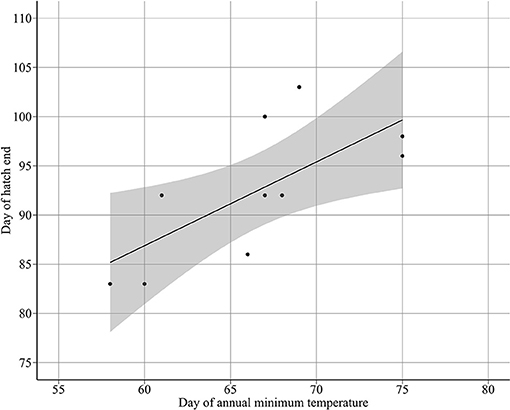
Figure 6. Relationship between day of hatch end DHe and the day of annual minimum temperature DTmin (DHe = 35.8097 + 0.8512 DTmin).
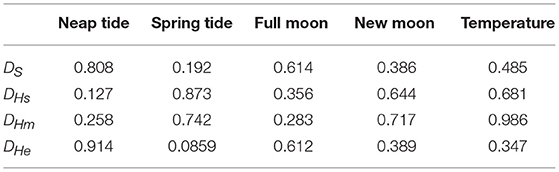
Table 3. P-values for relationships between environmental events and hatching and spawning using the statistical test outlined in the Material and Methods section.
Drivers of Changes in 0-Group Length Between 2000 and 2009
Juvenile growth rates followed a similar trend as 0-group mean length between 2000 and 2009 (Figure 7, top panels). 0-group length was significantly related to juvenile growth rate (Figure 7, upper right panel) (adjusted R2: 0.71, p < 0.02) (). We found no significant relationship between 0-group length and hatch median date (p > 0.05) (Figure 7, bottom left panel), hatch start date (p > 0.05), or hatch end date (p > 0.05).
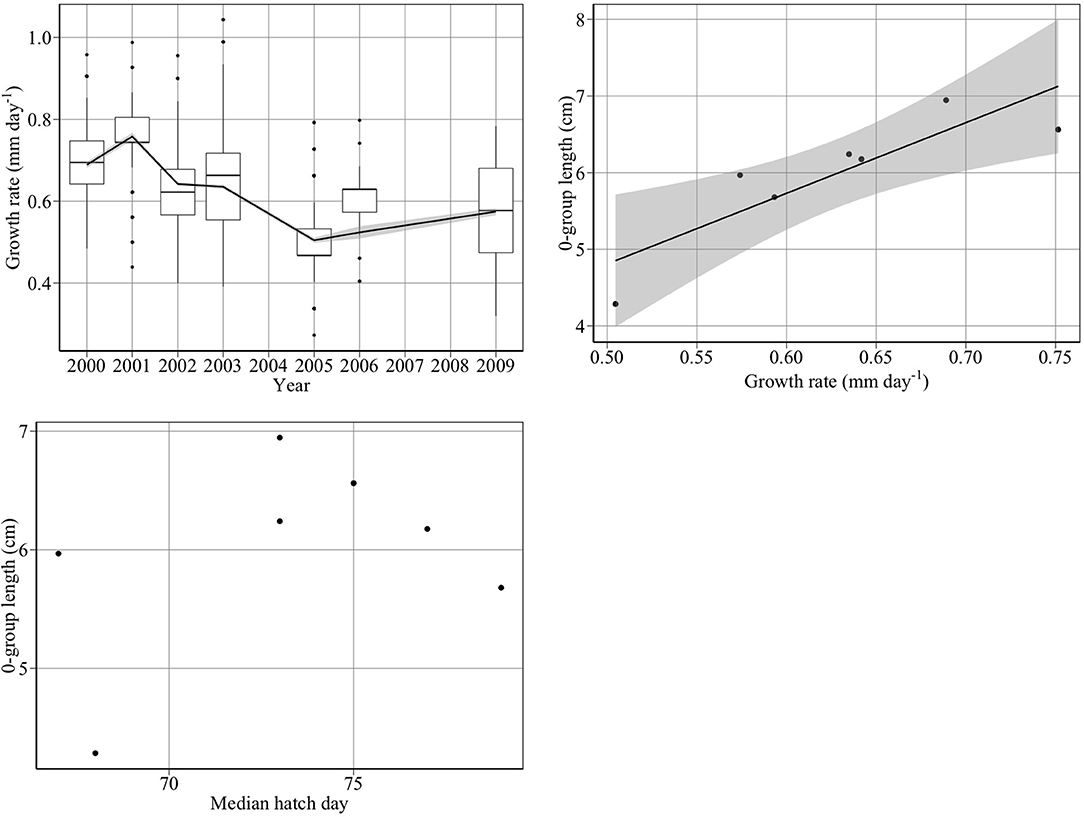
Figure 7. Drivers of changes in 0-group length between 2000 and 2009. The top left panel shows year-to-year changes in juvenile growth rate (mm day−1). The top right panel shows that changes in juvenile growth rate (gl) are significantly related to changes in 0-group length (L) (adjusted R2: 0.71, p < 0.02) (L = 0.198 + 9.22*gl). The bottom left panel shows that changes in median hatch date did not account for changes in 0-group length.
Growth rate declined by 27% between 2000 and 2005, consistent with Frederiksen et al. (2011), who found a significant decline in growth rate between 2000 and 2006 (R2 = 0.66, p < 0.02).
Hindcasting Spawning Dates Between 2000 and 2009
The estimated spawning interval was short compared to the hatching interval (Figure 4, mean = 14.9 days). Further, in 6 out of 10 years, the two spawning day estimates diverged by 15 days or less (Table 4). Mean spawning date was day 26.7 (S.D = 5.33 days), varying between day 18 in 2009, and day 38 in 2008. A high proportion of variability was due to 2008 and 2009. Excluding these years, the mean spawning date was day 26.375 (s.d. = 2.72 days). There was no evidence that spawning was triggered by environmental cues (Table 3).
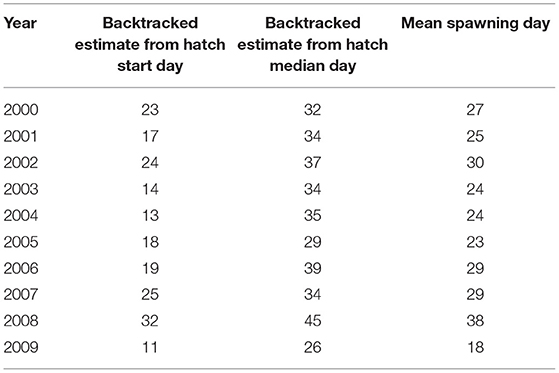
Table 4. Estimates of spawning days between 2000 and 2009. Shown are the spawning start days, spawning end days, and mean spawning days.
Uncertainty in Spawning and Hatch Day Estimates
In our estimation of hatch and spawning days we assumed that larval length-at-age for young larvae does not vary significantly year-to-year and so assigned a fixed probability distribution of age given length for all years, based on the otoliths collected in 2000 and 2001. To assess uncertainty in our results as a consequence of these assumptions we conducted a bootstrap analysis of larval growth rate variability. Uncertainty in hatch and spawning days is minimal, likely because inter-annual variability in length-at-age of young larvae (age <7 days) is negligible (Figure S1).
Discussion
No trends in hatch or spawning dates were evident during a period of declining sandeel length between 2000 and 2009, suggesting other factors e.g., changes in food availability are driving a reduction in sandeel length. However, we must acknowledge uncertainties and limitations in our study. We assumed that eggs undergo a temperature dependent development time, however, lowered oxygen concentration can delay egg development (Winslade, 1971). Moreover, in addition to having a small number of years we analysed variation in hatch and spawning days over a small area. For our results to support the original hypothesis, we must assume hatch and spawning days, and length-at-age does not vary significantly across the Scottish east coast, even if the latter varies considerably on the scale of the North Sea (Boulcott et al., 2007; Boulcott and Wright, 2011).
Spawning does not appear to be synchronous. This is clear from the differences in the observed hatch date interval and the expected hatch date interval given a synchronous spawning day (Régnier et al., 2018). The mean hatch duration of A. marinus between 2000 and 2009 was 38.1 days under a mean temperature of 6.33°C. In contrast, synchronous spawning should produce a hatch interval of approximately 9 days under 6.28°C (Régnier et al., 2018). Spawning may not be synchronous partly because larger A. marinus likely spawn earlier than smaller individuals (Boulcott et al., 2017). Our model, which shows that sandeels did not spawn en masse, is consistent with recent field observations, which showed large females with hydrating oocytes in December (Boulcott et al., 2017).
We found no evidence that spawning was environmentally cued. However, this finding is possible since spawning date appears to be related to sandeel size (Boulcott et al., 2017) and smaller individuals may not be ready to spawn when a temperature cue arrives. There is evidence for lunar and semilunar cued sandeel spawning. For example, Daunt et al. (2006) found distinct episodes of reduced foraging time in European shags Phalacrocorax aristotelis that were exactly 1 month apart and hypothesised this was associated with lunar cued sandeel spawning. Other sandeel species may spawn on a semi lunar cycle. For example, Ammodytoides pylei and A. tobianus spawn 3–5 days before a full moon (Thomopoulos, 1954; Randall et al., 1994). In addition, although Robards et al. (1999) find no clear link between spawning and tidal stage, 6 out of 8 observed spawning days occurred within 3 days of a neap tide (Flater, 2017). A similar forage fish, Atlantic herring Clupea harengus, also spawn at neap tides (Clarke and King, 1985; Hay, 1990).
Hatch end dates were associated with the shift from decreasing to increasing temperature in spring (Figure 5). However, no relationship was found between hatch median dates and the day of annual minimum temperature, therefore the majority of sandeels did not hatch in response to changes in the temperature cycle. The relationship between hatch end dates and the day of annual minimum temperature may indicate that at least some sandeels hatch in response to the temperature cycle but we cannot state this definitively. However, if true, it would be the first evidence of temperature-phase cued fish hatching, which is more common in reptiles and amphibians (Doody, 2011; Spencer and Janzen, 2011; Warkentin, 2011). That no such cue was found for spawning could be because, in comparison to spawning dates, hatch dates appear to be very flexible. Sandeels have an egg incubation period exceptionally longer than other pelagic fish (around 40 days at 6.28°C, Régnier et al., 2018). In addition, there is moderate natural variability in incubation rates at similar temperatures (Régnier et al., 2018). There may be several reasons for a hatch cue. Newly hatched larvae require adequate food supply in the form of copepod nauplii (Ryland, 1964). Estimated median hatch dates occurred in March, the time of peak egg production in the important calanoid copepod C. finmarchicus (Jónasdóttir et al., 2005). Using the temperature cycle to time important life cycle events may act as a buffer against climate change. It is generally accepted that egg incubation periods are primarily temperature dependent (Pauly and Pullin, 1988), which, under changing temperature conditions, may cause vulnerability for species, and food webs. Since sandeels use rising spring temperatures as a hatch cue, it is possible that, similar to other birds (Schaper et al., 2012), sandeel-dependent seabirds use the same cue to time reproduction.
Changes in hatch dates, juvenile growth rate and survival are the most plausible factors driving a long term decline in sandeel length (Wanless et al., 2004; Frederiksen et al., 2011). Our results show that changes in 0-group length between 2000 and 2009 are driven by changes in juvenile growth rate not hatch dates. Hatch dates and growth rates are consistent with Frederiksen et al. (2011) between 2000 and 2006 when the two studies overlap; significant correlations exist between median hatch dates estimated in this study and mean hatch date estimated by Frederiksen et al. (2011) (adjusted R2 = 0.5, p < 0.05, n = 7), and juvenile growth rates (adjusted R2 = 0.98, p < 0.001, n = 7). Frederiksen et al. (2011) and our study find no trend in hatch dates yet a significant decline in juvenile growth rates between 2000 and 2006. There has been no decline in the growth rate of young larvae (Heath et al., 2012), so the only potential for a decline in growth rate is between the late-larval stage and the survey period between late May and early July. 0-group length has also declined in the Southern North Sea, and has been linked to a reduction in copepod size (van Deurs et al., 2014). This could have affected the growth rate of late-stage larvae, especially as metamorphosis is a particularly vulnerable stage to reduction in food availability. Another explanation for the reduction in 0-group length is a change in mortality patterns with respect to hatch date (Wright and Bailey, 1996), however, this was not evident from analysis of year-to-year patterns in the loss rate of larvae (Heath et al., 2012).
Sandeel hatch dates are likely to be directly influenced by a combination of selection by prey phenology and temperature (Wright and Bailey, 1996; Wright et al., 2017). It is unclear as to what extent the former plays a role in sandeel hatch dates. However, it appears that recent temperature variations did not significantly alter hatch dates. We suggest that other ecological factors should be investigated to understand the decline in length of this important North Sea forage species.
Author Contributions
AM, MH, and DS designed the manuscript. AM performed the analysis and wrote most of the manuscript. All authors contributed to the interpretation of results and the writing of the manuscript.
Funding
This work received funding from the MASTS pooling initiative (The Marine Alliance for Science and Technology for Scotland) and Marine Scotland Science whose support is gratefully acknowledged. MASTS is funded by the Scottish Funding Council (grant reference HR09011) and contributing institutions.
Conflict of Interest Statement
The authors declare that the research was conducted in the absence of any commercial or financial relationships that could be construed as a potential conflict of interest.
Acknowledgments
Many thanks to Phil Boulcott for data and fruitful discussions. The long-term commitment to sampling at Stonehaven and off the Firth of Forth was provided by the Scottish Government. We gratefully acknowledge the assistance of the crew members of the survey vessels Shuna and Temora at Stonehaven, and Clupea and Alba Na Mara off the Firth of Forth. We thank the two reviewers for helpful comments and suggestions which greatly improved the manuscript.
Supplementary Material
The Supplementary Material for this article can be found online at: https://www.frontiersin.org/articles/10.3389/fmars.2019.00070/full#supplementary-material
References
Beaugrand, G., Brander, K. M., Lindley, J. A., Souissi, S., and Reid, P. C. (2003). Plankton effect on cod recruitment in the North Sea. Nature 426, 661–664. doi: 10.1038/nature02164
Bergstad, O. A., Høines, Å. S., and Krüger-Johnsen, E. M. (2001). Spawning time, age and size at maturity, and fecundity of sandeel, Ammodytes marinus, in the north-eastern North Sea and in unfished coastal waters off Norway. Aquatic Living Resources 14, 293–301. doi: 10.1016/S0990-7440(01)01134-2
Boulcott, P., Clarke, J., and Wright, P. J. (2017). Effect of size on spawning time in the lesser sandeel Ammodytes marinus. J. Fish Biol. 91, 362–367. doi: 10.1111/jfb.13341
Boulcott, P., and Wright, P. (2011). Variation in fecundity in the lesser sandeel: implications for regional management. J. Mar. Biol. Assoc. UK 91, 1273–1280. doi: 10.1017/S0025315410000688
Boulcott, P., Wright, P. J., Gibb, F. M., Jensen, H., and Gibb, I. M. (2007). Regional variation in maturation of sandeels in the North Sea. ICES J. Mar. Sci. 64, 369–376.
Burthe, S., Daunt, F., Butler, A., Elston, D. A., Frederiksen, M., Johns, D., et al. (2012). Phenological trends and trophic mismatch across multiple levels of a North Sea pelagic food web. Mar. Ecol. Progr. Ser. 454, 119–133. doi: 10.3354/meps09520
Carpenter, S. R., Kitchell, J. F., and Hodgson, J. R. (1985). Cascading trophic interactions and lake productivity. Biosciences 35, 634–639. doi: 10.2307/1309989
Carscadden, J., Nakashima, B. S., and Frank, K. T. (1997). Effects of fish length and temperature on the timing of peak spawning in capelin (Mallotus villosus). Can. J. Fish. Aquatic Sci. 54, 781–787. doi: 10.1139/f96-331
Christensen, A., Butenschön, M., Gürkan, Z., and Allen, I. J. (2013). Towards an integrated forecasting system for fisheries on habitat-bound stocks. Ocean Sci. 9, 261–279. doi: 10.5194/os-9-261-2013
Clarke, D. R., and King, P. E. (1985). Spawning of herring in milford haven. J. Mar. Biol. Assoc. U.K. 65, 629–639. doi: 10.1017/S0025315400052474
Coombs, S. H. (1980). Supplement 5: young fish, 1948-1972. In: continuous plankton records: a plankton atlas of the North Atlantic and North Sea. Bull. Mar. Ecol. 8, 229–281.
Daunt, F., Afanasyev, V., Silk, J. R. D., and Wanless, S. (2006). Extrinsic and intrinsic determinants of winter foraging and breeding phenology in a temperate seabird. Behav. Ecol. Sociobiol. 59, 381–388. doi: 10.1007/s00265-005-0061-4
Doody, J. S. (2011). Environmentally cued hatching in reptiles. Integr. Compar. Biol. 51, 49–61. doi: 10.1093/icb/icr043
Edwards, M., and Richardson, A. J. (2004). Impact of climate change on marine pelagic phenology and trophic mismatch. Nature 430, 881–884. doi: 10.1038/nature02808
Flater, D. (2017). XTide. Available online at: http://www.flaterco.com/xtide/
Frederiksen, M., Edwards, M., Richardson, A. J., Halliday, N. C., and Wanless, S. (2006). From plankton to top predators: bottom-up control of a marine food web across four trophic levels. J. Anim. Ecol. 75, 1259–1268. doi: 10.1111/j.1365-2656.2006.01148.x
Frederiksen, M., Elston, D. A., Edwards, M., Mann, A. D., and Wanless, S. (2011). Mechanisms of long-term decline in size of lesser sandeels in the North Sea explored using a growth and phenology model. Mar. Ecol. Progr. Ser. 432, 137–147. doi: 10.3354/meps09177
Frederiksen, M., Furness, R. W., and Wanless, S. (2007). Regional variation in the role of bottom-up and top-down processes in controlling sandeel abundance in the North Sea. Mar. Ecol. Prog. Ser. 337, 279–286. doi: 10.3354/meps337279
Gauld, J. A., and Hutcheon, J. (1990). Spawning and fecundity in the lesser sandeel, Ammodytes marinus Raitt, in the north-western North Sea. J. Fish. Biol. 36, 611–613. doi: 10.1111/j.1095-8649.1990.tb03561.x
Goodlad, D., and Napier, I. (1997). Assessment of the Shetland Sandeel Fishery – 1996. PhD thesis, Fisheries Development Note, No. 6. Scalloway: North Atlantic Fisheries College.
Gordoa, A., and Carreras, G. (2014). Determination of temporal spawning patterns and hatching time in response to temperature of atlantic bluefin tuna (Thunnus thynnus) in the Western Mediterranean. PLoS ONE 9:E90691. doi: 10.1371/journal.pone.0090691
Hay, D. E. (1990). Tidal influence on spawning time of Pacific herring (Clupea harengus pallasi). Can. J. Fish. Aquatic Sci. 47, 2390–2401. doi: 10.1139/f90-266
Heath, M. R., Rasmussen, J., Bailey, M. C., Dunn, J., Fraser, J., Gallego, A., et al. (2012). Larval mortality rates and population dynamics of Lesser Sandeel (Ammodytes marinus) in the northwestern North Sea. J. Mar. Sys. 93, 47–57. doi: 10.1016/j.jmarsys.2011.08.010
Heath, M. R., Speirs, D. C., and Steele, J. H. (2014). Understanding patterns and processes in models of trophic cascades. Ecol. Lett. 17, 101–114. doi: 10.1111/ele.12200
ICES (1995). Report of the ICES Workshop on Sandeel Otolith Analysis: Review Of Sandeel Biology. International Council for the Exploration of the Sea, Copenhagen, Denmark. ICES CM 1995/G:4.
Intergovernmental Panel on Climate Change (IPCC) WGI (2007). Climate Change 2007: Impacts, Adaptation and Vulnerability. Cambridge: Cambridge University Press. doi: 10.1017/CBO9780511546013
Jónasdóttir, S. H., Trung, N. H., Hansen, F., and Gärtner, S. (2005). Egg production and hatching success in the calanoid copepods Calanus helgolandicus and Calanus finmarchicus in the North Sea from March to September 2001. J. Plankton Res. 27, 1239–1259. doi: 10.1093/plankt/fbi091
Kvist, T., Gislason, H., and Thyregod, P. (2000). Using continuation-ratio logits to analyze the variation of the age composition of fish catches. J. Appli. Stat. 27, 303–319. doi: 10.1080/02664760021628
Lahoz-Monfort, J. J., Morgan, B. J. T., Harris, M. P., Wanless, S., and Freeman, S. N. (2011). A capture–recapture model for exploring multi-species synchrony in survival. Methods Ecol. Evolu. 2, 116–124. doi: 10.1111/j.2041-210X.2010.00050.x
Lewis, S., Wanless, S., Wright, P. J., Harris, M. P., Bull, J., and Elston, D. A. (2001). Diet and breeding performance of black-legged kittiwakes Rissa tridactyla at a North Sea colony. Mar. Ecol. Prog. Seri. 221, 277–284. doi: 10.3354/meps221277
Lynam, C. P., Halliday, N. C., Höffle, H., Wright, P. J., van Damme, C. J. G., Edwards, M., et al. (2013). Spatial patterns and trends in abundance of larval sandeels in the North Sea: 1950–2005. ICES J. Mar. Sci. 70, 540–553. doi: 10.1093/icesjms/fst006
MacDonald, A., Heath, M., Edwards, M., Furness, R., Pinnegar, J. K., Wanless, S., et al. (2015). Climate driven trophic cascades affecting seabirds around the British Isles. Oceanogr. Mar. Biol. 53, 55–80. doi: 10.1201/b18733-3
Macer, C. T. (1966). Sand eels (Ammodytidae) in the south-western North Sea; their biology and fishery. Fish. Investig. Lond. Seri. 24, 1–55.
Pace, M. L., Cole, J. J., Carpenter, S. R., and Kitchell, J. F. (1999). Trophic cascades revealed in diverse ecosystems. Trends Ecol. Evolu. 14, 483–488. doi: 10.1016/S0169-5347(99)01723-1
Pauly, D., and Pullin, R. S. V. (1988). Hatching time in spherical, pelagic, marine fish eggs in response to temperature and egg size. Environ. Biol. Fishes 22, 261–271. doi: 10.1007/BF00004892
Pedersen, S., Lewy, P., and Wright, P. (1999). Assessments of the lesser sandeel (Ammodytes marinus) in the North Sea based on revised stock divisions. Fish. Res. 41, 221–241. doi: 10.1016/S0165-7836(99)00026-0
Pentilla, D. (1995). “Investigations of the spawning habitat of the Pacific sand lance, (Ammodytes hexapterus),” in Puget Sound. Puget Sound Research-95 Conference Proceedings, Vol. 2. Puget Sound Water Quality Authority (Olympia, WA). 855–859.
Platt, T., Fuentes-Yaco, C., and Frank, K. T. (2003). Marine ecology: spring algal bloom and larval fish survival. Nature 423, 398–399. doi: 10.1038/423398b
Polis, G. A., Sears, A. L. W., Huxel, G. R., Strong, D. R., and Maron, J. (2000). When is a trophic cascade a trophic cascade? Trends Ecol. Evolu. 15, 473–475. doi: 10.1016/S0169-5347(00)01971-6
Proctor, R., Wright, P. J., and Everitt, A. (1998). Modelling the transport of larval sandeels on the north-west European shelf. Fish. Oceanogr. 7, 347–354. doi: 10.1046/j.1365-2419.1998.00077.x
Randall, J. E., Ida, H., and Earle, J. L. (1994). Ammodytoides pylei, a New Species of Sand Lance (Ammodytidae) from the Hawaiian Islands. Pacific Sci. 48, 80–89.
Reay, P. J. (1970). Synopsis of biological data on North Atlantic sand eels of the genus Ammodytes (A. tobianus, A. dubius, A. americanus and A. marinus). FAO Fish Synop. 82, 1–51.
Régnier, T., Gibb, F. M., and Wright, P. J. (2018). Temperature effects on egg development and larval condition in the lesser sandeel, Ammodytes marinus. J. Sea Res. 134, 34–41. doi: 10.1016/j.seares.2018.01.003
Rindorf, A., and Lewy, P. (2001). Analyses of length and age distributions using continuation-ratio logits. Can. J. Fish. Aquatic Sci. 58, 1141–1152. doi: 10.1139/f01-062
Robards, M. D., Piatt, J. F., and Rose, G. A. (1999). Maturation, fecundity, and intertidal spawning of Pacific sand lance in the northern Gulf of Alaska. J. Fish Biol. 54, 1050–1068. doi: 10.1111/j.1095-8649.1999.tb00857.x
Ryland, J. S. (1964). The feeding of plaice and sandeel larvae in the southern North Sea. J. Mar. Biol. Assoc. U.K. 44, 343–364. doi: 10.1017/S0025315400024875
Schaper, S. V., Dawson, A., Sharp, P. J., Gienapp, P., Caro, S. P., and Visser, M. E. (2012). Increasing temperature, not mean temperature, is a cue for avian timing of reproduction. Am. Nat. 179, E55–69. doi: 10.1086/663675
Spencer, R.-J., and Janzen, F. J. (2011). Hatching behavior in Turtles. Integr. Compar. Biol. 51, 100–110. doi: 10.1093/icb/icr045
Stari, A., Preedy, K. F., McKenzie, E., Gurney, W. S. C., Heath, M., Kunzlik, P., et al. (2010). Smooth age length keys: observations and implications for data collection on North Sea haddock. Fish. Res. 105, 2–12. doi: 10.1016/j.fishres.2010.02.004
Thackeray, S. J., Sparks, T. H., Frederiksen, M., Burthe, S., Bacon, P. J., Bell, J. R., et al. (2010). Trophic level asynchrony in rates of phenological change for marine, freshwater and terrestrial environments. Glob. Change Biol. 16, 3304–3313. doi: 10.1111/j.1365-2486.2010.02165.x
Thomopoulos, A. (1954). Sur l'oeuf d'equille (Ammodytes tobianus L.). Bull. Société Zoologique France T. 79, 112–120.
van Deurs, M., Koski, M., and Rindorf, A. (2014). Does copepod size determine food consumption of particulate feeding fish? ICES J. Mar. Sci. 71, 35–43. doi: 10.1093/icesjms/fst090
Wanless, S., Harris, M. P., and Greenstreet, S. P. R. (1998). Summer sandeel consumption by seabirds breeding in the Firth of Forth, south-east Scotland. ICES J. Mar. Sci. 55, 1141–1151. doi: 10.1006/jmsc.1998.0372
Wanless, S., Wright, P. J., Harris, M. P., and Elston, D. A. (2004). Evidence for decrease in size of lesser sandeels Ammodytes marinus in a North Sea aggregation over a 30-yr period. Mar. Ecol. Prog. Seri. 279, 237–246. doi: 10.3354/meps279237
Warkentin, K. M. (2011). Environmentally cued hatching across taxa: embryos respond to risk and opportunity. Integr. Compar. Biol. 51, 14–25. doi: 10.1093/icb/icr017
Wilson, L. J., Daunt, F., and Wanless, S. (2004). Self-feeding and chick-provisioning diet differ in the common guillemot Uria aalge. Ardea 92, 197–208.
Winslade, P. (1971). Behavioural and Embryological Studies on the Lesser Sandeel Ammodytes marinus (Raitt). PhD thesis. England: University of East Anglia. doi: 10.1111/j.1095-8649.1974.tb05102.x
Wright, P., Jensen, H., and Tuck, I. (2000). The influence of sediment type on the distribution of the lesser sandeel, Ammodytes marinus. J. Sea Res. 44, 243–256. doi: 10.1016/S1385-1101(00)00050-2
Wright, P. J. (1996). “Is there a conflict between sandeel fisheries and seabirds? A case study at Shetland,” in Aquatic Predators and Their Prey, Fishing News Books, eds S. P. R. Greenstreet and M. L. Tasker (Oxford: Blackwell Science), 154–165.
Wright, P. J., and Bailey, M. C. (1996). Timing of hatching in Ammodytes marinus from Shetland waters and its significance to early growth and survivorship. Mar. Biol. 126, 143–152. doi: 10.1007/BF00571386
Keywords: Ammodytes marinus, fish, larvae, spawning, hatching, growth, length, 0-group
Citation: MacDonald A, Heath MR, Greenstreet SPR and Speirs DC (2019) Timing of Sandeel Spawning and Hatching Off the East Coast of Scotland. Front. Mar. Sci. 6:70. doi: 10.3389/fmars.2019.00070
Received: 03 July 2018; Accepted: 07 February 2019;
Published: 06 March 2019.
Edited by:
Athanassios C. Tsikliras, Aristotle University of Thessaloniki, GreeceReviewed by:
Fabio Fiorentino, Istituto per le Risorse Biologiche e le Biotecnologie Marine (IRBIM), ItalyAnders Frugård Opdal, University of Bergen, Norway
Copyright © 2019 MacDonald, Heath, Greenstreet and Speirs. This is an open-access article distributed under the terms of the Creative Commons Attribution License (CC BY). The use, distribution or reproduction in other forums is permitted, provided the original author(s) and the copyright owner(s) are credited and that the original publication in this journal is cited, in accordance with accepted academic practice. No use, distribution or reproduction is permitted which does not comply with these terms.
*Correspondence: Alan MacDonald, alan.macdonald@strath.ac.uk