Forecasts of Wave-Induced Coastal Hazards in the United States Pacific Islands: Past, Present, and the Future
 Martin Guiles1*
  Assaf Azouri1
  Volker Roeber1
  Melissa M. Iwamoto2
  Fiona Langenberger2 Douglas S. Luther1,3
- 1Department of Oceanography, School of Ocean and Earth Science and Technology, University of Hawai‘i at Mânoa, Honolulu, HI, United States
- 2Pacific Islands Ocean Observing System, School of Ocean and Earth Science and Technology, University of Hawai‘i at Mânoa, Honolulu, HI, United States
- 3Joint Institute for Marine and Atmospheric Research, University of Hawai‘i at Mânoa, Honolulu, HI, United States
This paper summarizes the existing coastal hazard forecast methods of PacIOOS, such as wave-induced run-up, by focusing on the critical components that need to be addressed in order to improve these forecasts and make them more accurate and available to broader coastal communities. We then propose that a horizontally, two-dimensional numerical modeling approach method should be adopted for developing future wave-induced coastal forecasts. To reach a future in which real-time two-dimensional model-based forecasts are a reality, we identify existing technologies that could lead to improvements, such as: (i) more accurate, accessible and frequently updated bathymetry and topography datasets; (ii) increased computational and software capabilities; and, (iii) more accurate sea level datasets. These advances, combined with crowdsourced-based model-data validation, will result in faster and more accurate forecasting tools that could greatly benefit coastal communities in need of more efficient risk mitigation programs.
Introduction
Researchers at the University of Hawai‘i have successfully developed and implemented real-time forecasts of coastal flooding driven by remotely generated gravity waves impinging on shorelines during periods of high sea level. These forecasts have proven quite valuable to coastal managers and property owners for mitigating threats to lives and property in Hawai‘i and in the Republic of the Marshall Islands (RMI; Hess et al., 2015). High sea level events in the future have the potential to increase both in total magnitude and in number of events that exceed present day thresholds. This future scenario compels us to increase our efforts toward accurate and more widespread forecasting of wave-driven run-up and flooding1. Research into higher levels of accuracy and coverage for these types of forecasts continues today with projects covering the West Maui, Hawai‘i, coastline using new modeling techniques. In the future, we expect that the ability to provide communities with advance notice of wave-driven inundation will be universal for all coastlines. In this manuscript, we provide a brief history of what led to our original forecast and a guide to what we know now. Also, we project into the future and provide recommendations to advance toward universal forecast coverage for all impacted coastlines.
High Sea Level and Wave Run-Up Forecast Development
First Phase: Empirical Forecasts
Under the program that is now known as the Pacific Islands Ocean Observing System (PacIOOS), the development of a near-term sea level forecast tool, comprised of a highly accurate tidal re-analysis and non-tidal diurnal and multi-day variability forecast elements, was proposed and initiated. This tool, originally designed for Honolulu Harbor, came online in 2010 and was eventually extended to nine locations in the Hawaiian Islands and in the Insular Pacific (Guiles et al., 2012). This was a valuable first step toward the prediction of inundation for wave-sheltered, low-lying areas in and around these harbors. After developing and validating these 6-day high sea level forecasts2, the PacIOOS Coastal Hazards Group began to examine how other stakeholder needs could be addressed and how to develop a wave run-up forecast for wave-exposed coastlines based on the empirical model of Stockdon et al. (2006) calibrated with nearshore data collected by PacIOOS co-investigator, Professor Mark Merrifield.
The essential elements were in place to make this forecast a reality. The wave field was provided by NOAA’s WAVEWATCH III (WW3; Tolman, 2009) model. Virtual buoys were placed in the model, and 7-day swell forecast directional spectra were acquired on a real-time basis. The WW3 virtual buoys corresponded to PacIOOS’ Datawell WaveRider Buoy (Datawell, 2009) locations where near real-time observations are collected. In concert with the wave forecast, the aforementioned 6-day high sea level forecasts provided the localized prediction of the sea level. These two forecasts are the main necessary input components of the empirical wave run-up model.
Initially, two locations were chosen to create the wave run-up forecast—Waikīkī on the South Shore of O‘ahu, and Rockpiles on the North Shore of O‘ahu. The locations were selected based on the available near-shore pressure records collected by Merrifield. These records were unique in that they spanned periods of time when either the PacIOOS Barbers Point WaveRider Buoy was in place to provide data for Waikīkī or when the PacIOOS Waimea Buoy was in place for the pressure gauges deployed at Rockpiles. These data allowed for the adjustment of the parameters in the Stockdon model to accommodate the unique conditions at each location.
From the above description, it is clear that the success of the parameterized model forecast products depended on multiple factors that were not available a decade before. A short list includes: accurate wave model (WW3), accepted parameterized model (Stockdon et al., 2006), real-time wave observations (PacIOOS Wave Buoy Program), accurate sea level forecast (PacIOOS 6-Day High Sea Level Forecasts), and including (though not directly limited by) field observations for specific site implementation. Since 2012, this forecast has been available to the public and is continually undergoing threshold verification and documentation.
During implementation of the O‘ahu wave run-up forecasts, a severe wave run-up event in the RMI led to a government-declared state of emergency, and stakeholders asked PacIOOS if they could help by providing advanced notification to the community before similar future events (Iwamoto et al., 2016). Fortunately, the data analysis for two other locations became available in the RMI: Roi-Namur (Kwajalein Atoll) and Majuro Atoll. Additional parameterization work done by Merrifield et al. (2014) and Becker et al. (2014) modified Stockdon’s empirical model by extending it to account for run-up on a fringing reef system. Two forecasts were constructed and made publicly available online by 2014 with threshold verification and historical event analysis. Each of the forecasts, one for Kwajalein Atoll and one for Majuro Atoll, incorporated directional filters for the prevailing wave forecast, thus allowing for shoreline-specific forecasts. This represented a step toward extending the parameterization model from being statistically valid at a single location to being valid along a range of geographic locations3. Other institutions have followed the same empirical approach, including the United States Geological Survey Total Water Level and Coastal Change Forecast Viewer, and the Coastal Data Information Program at Scripps Institute of Oceanography Potential Flooding Index products. These efforts now extend the empirical wave run-up forecast coverage to coastal regions along the eastern and western United States seaboard.
One critical part of the forecast development, for both the high sea level and wave run-up forecasts, is to establish accurate and useful metrics for extreme conditions. Part of this can be accomplished through historical data analysis and hindcasting, but this may not always yield thresholds that relate to the forecast user base. Effective thresholds require local knowledge, images, descriptions—all forms of communication that make the forecast output contextually relevant for the user. During development, PacIOOS researchers began asking partners, agencies, interested parties, and friends to record impactful situations. This step takes time to generate a robust collection of events and their impacts. However, without this type of documented validation, the forecasts would have limited value at most locations.
Around the time that the Kwajalein and Majuro forecast tools were released, we began exploring ways to accurately extend the forecasts along a coastline without being confined (in terms of statistical reliability) to one narrow beach zone. This exposed one of the weaknesses of using the empirical model: for every location that a forecast was desired, a fairly extensive field program was needed. As the nearshore wave models were becoming more mature and the available computational power continued to increase, the idea of applying modern numerical models to address this problem began to evolve.
Recent Advancements in Forecast Development
Over the past two decades, numerous numerical models for water wave propagation and transformation have been developed. Phase-averaged models like WAVEWATCH III and SWAN (SWAN Team, 2015), which propagate wave energy over long distances with computational efficiency, are robust solutions that have been integrated into the general environmental prediction regime. These schemes work with averaged/integrated quantities, they do not properly account for infragravity4 (IG) waves or run-up. To accurately resolve IG waves we need to use phase-resolving models. A number of these models have been developed, including COULWAVE (Lynett et al., 2002), FUNWAVE (Shi et al., 2012), XBeach (Roelvink et al., 2009), and BOSZ (Boussinesq Ocean and Surf Zone model; Roeber and Cheung, 2012). The latter was chosen for the development and implementation of our forecast. These phase-resolving models not only allow for the generation and propagations of IG waves, they explicitly track the free surface along the wet-dry boundaries which can then be used to directly compute the run-up along a coastline.
Figure 1 provides an example of the level of detail and kind of information that can be obtained from such models. Forcing BOSZ with a southerly wave event with significant wave height Hs = 1.5 m and peak period Tp = 14 s, Figure 1 shows the difference in hydrodynamic force (kg m/s2) per unit shoreline between high tide (MSL + 0.6 m) and low tide (MSL - 0.3 m) at Olowalu, Ukumehame, West Maui. Under high tide conditions, the reef becomes less effective in dissipating swell energy through breaking compared to a low tide level. The hydrodynamic force increases at high tide levels, i.e., the resulting waves over the reef lagoon and along the shoreline are not only higher but also faster. Though these results are site-specific, locations with fringing reefs tend to face an increased risk of damaging and erosive wave conditions at high sea levels.
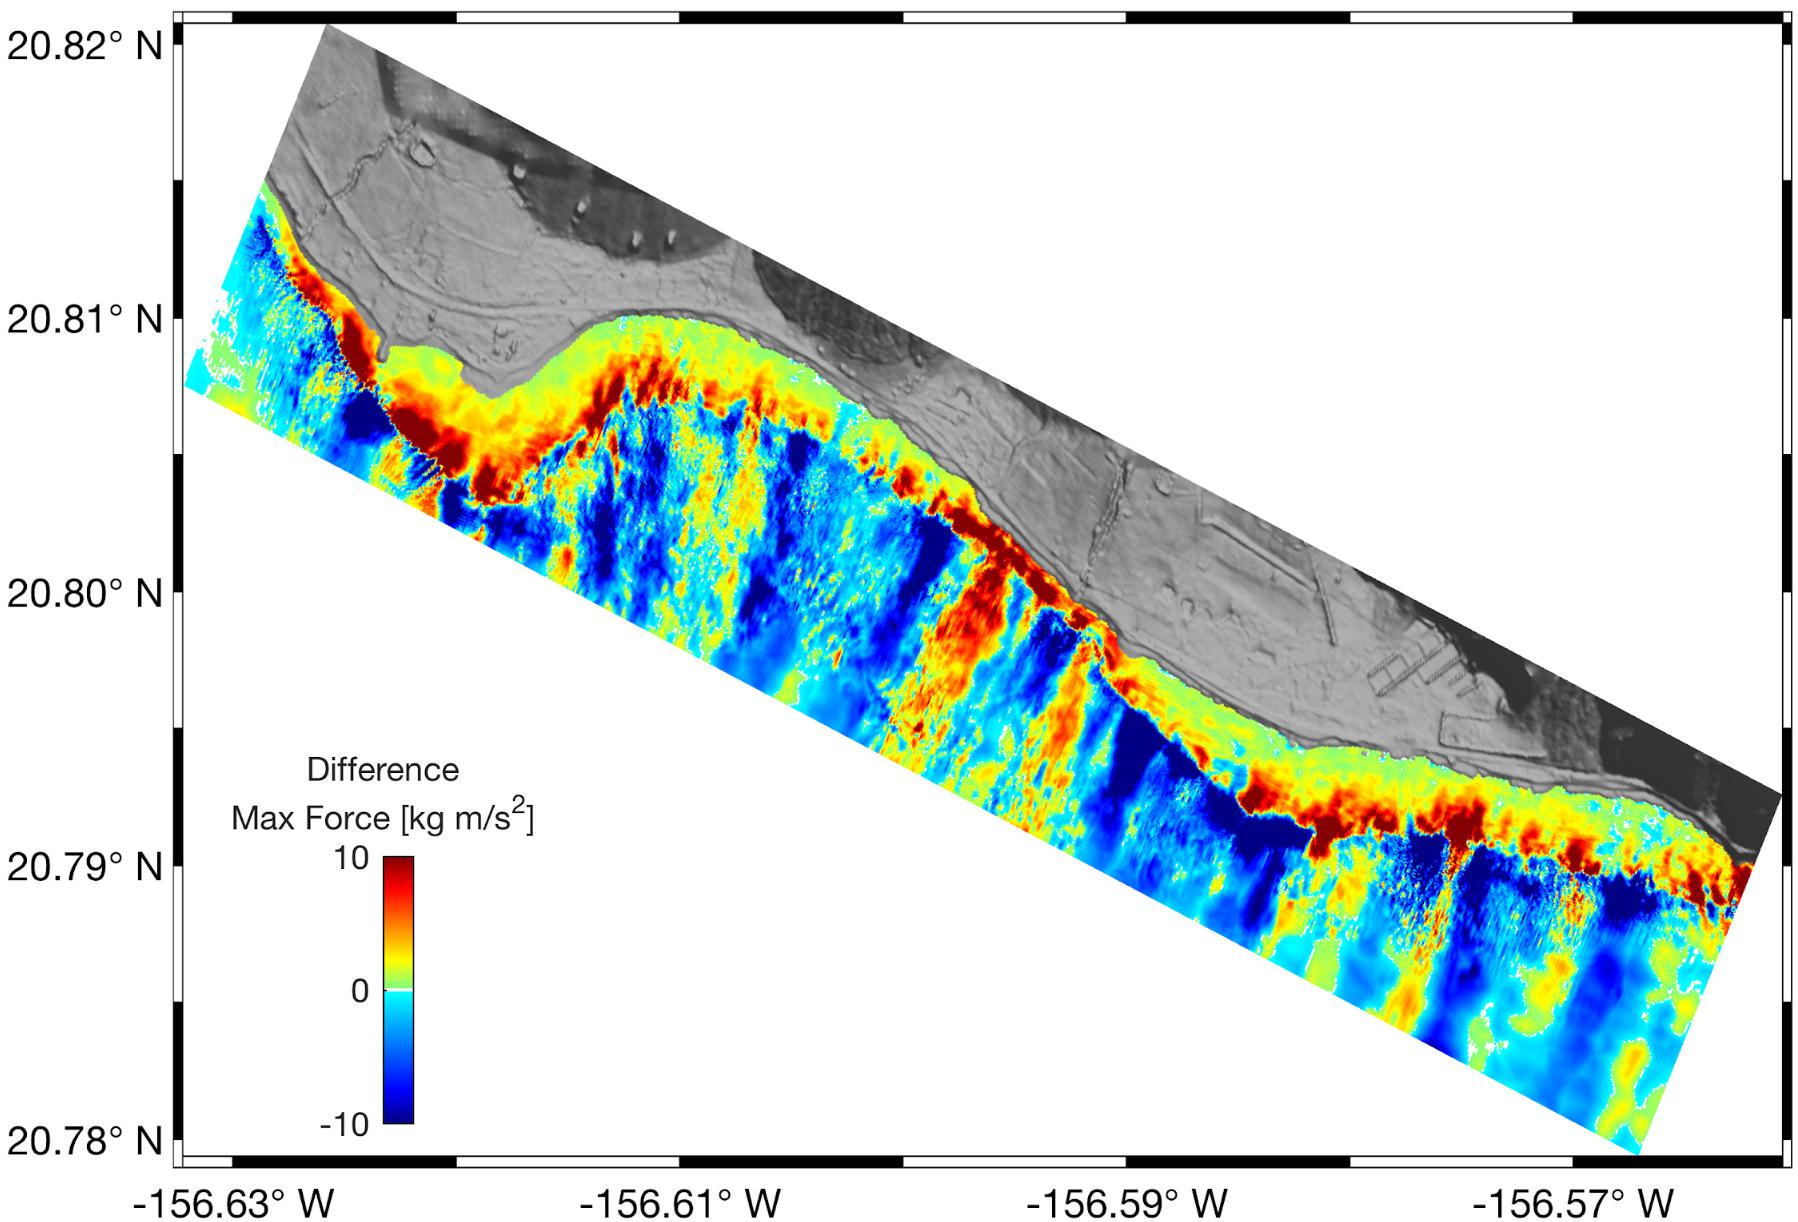
Figure 1. The difference in maximum hydrodynamic force per unit shoreline width from the BOSZ model for a wave event at Olowalu, Ukumehame, West Maui (high tide minus low tide). The tidal levels where set at MSL + 0.6 m for high tide and MSL – 0.3 m for low tide. The wave input conditions are identical in both scenarios, arriving from due south with Hs = 1.5 m, Tp = 14 s, and a typical directional spreading of 30°.
Although the existing empirical wave run-up models can provide very useful real-time results, they are based on highly simplified assumptions (such as one dimensionality), and are not valid everywhere. On the other hand, a horizontally two-dimensional (2-D) model provides a more complete picture of the gravity and IG wave dynamics. Running a phase-resolving model in 2-D mode requires the following inputs: (i) bathymetry and topography; (ii) directional spectra that are representative of the sea/swell conditions in the vicinity of the wavemaker; and (iii) water/tide level information. Since the accuracy of a 2-D model-based wave run-up forecast greatly depends on these inputs, it is crucial to assure that they are as accurate as possible.
In addition to swell waves, infragravity (IG) waves play an important role in the total run-up. Similar to the response of the coastline to tsunamis, an IG wave field can trigger resonances in harbors, bays, and over other bathymetric features. As a result, large computational domains are necessary to capture these large-scale responses and the subsequent variations of wave run-up, especially along fringing reefs and near headlands. Figure 2 provides an example of such spatial variability of the power spectral density (PSD) in the 1–2 min period band, found in the BOSZ model in response to sea/swell forcing from due north with significant wave height Hs = 2 m and peak period Tp = 16 s.
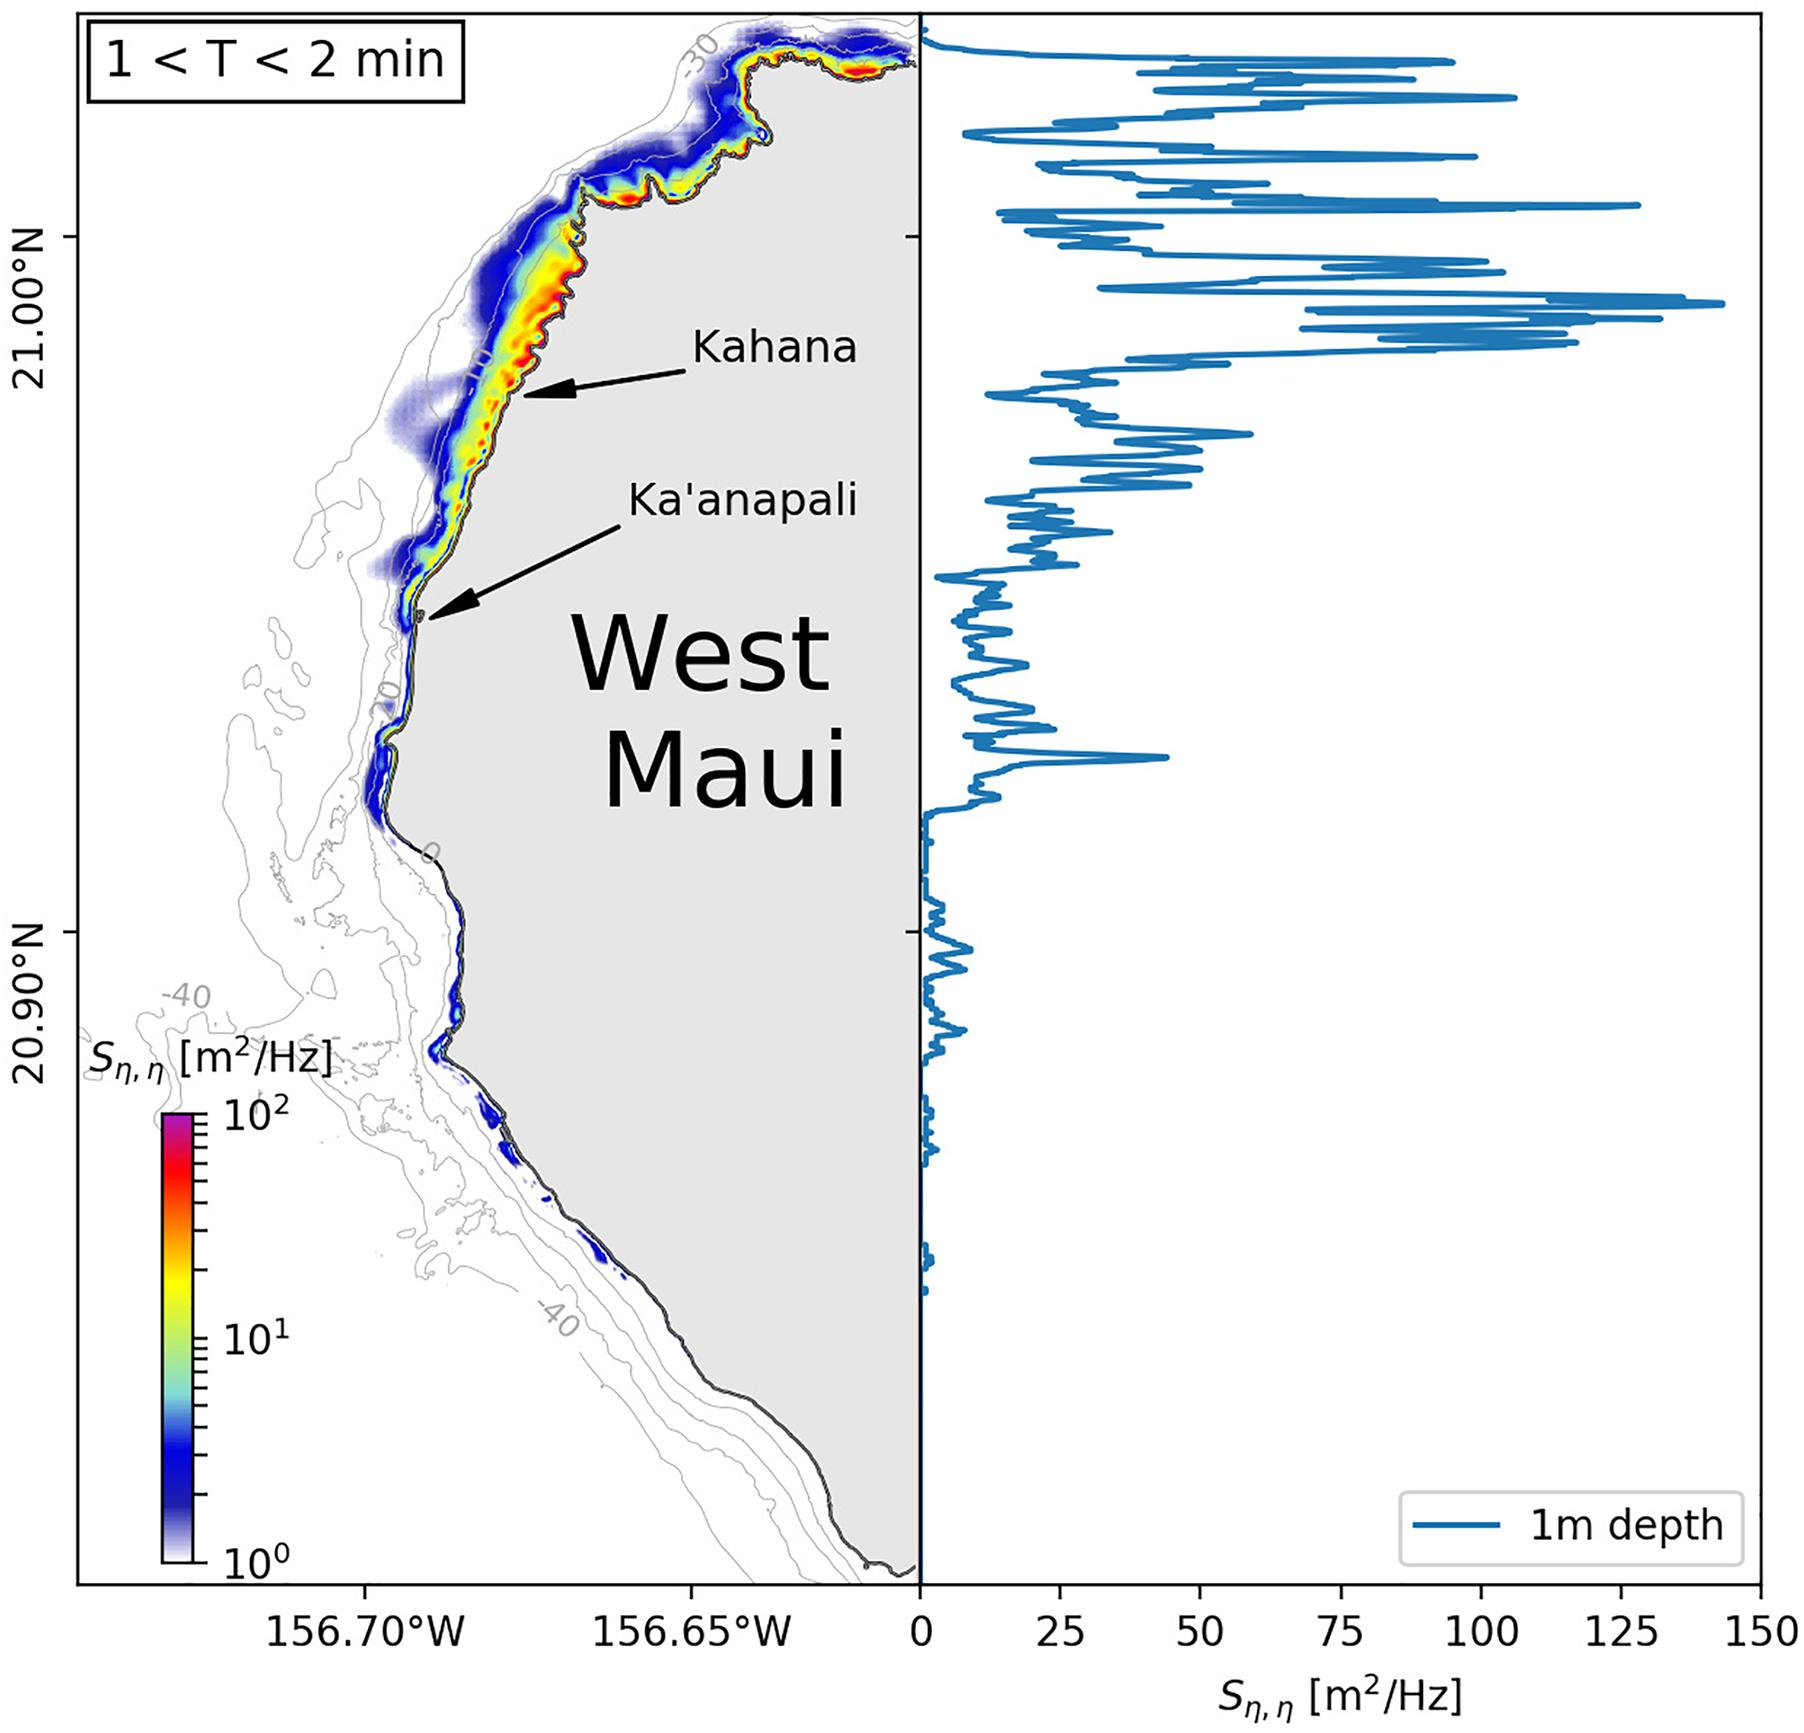
Figure 2. Left panel: Map of computed power spectral density (PSD) along the West Maui coastline from the BOSZ model, in the 1–2 min IG band. Right panel: The corresponding PSD levels along the 1 m depth contour line. The sea/swell input conditions are from due north with Hs = 2 m and Tp = 16 s.
For the West Maui domain, under a National Oceanographic and Atmospheric Administration (NOAA) Coastal Resilience award, we have brought together all the necessary pieces to implement a real time 2-D inundation forecast. WWIII is feeding a high resolution SWAN model that provides 42 directional wave spectral at the exterior of two large BOSZ model grids. The BOSZ model was selected for familiarity after testing three separate models (publication in works). Sea level comes from a new high resolution sea level forecast for Lahaina in the center of the domain. The forecast requires one dedicated server of 40 cores for the BOSZ model and will provide 6 days of run-up forecast for thirteen zones along the shoreline.
Expectations and Recommendations for Projected Forecast Development
To actualize a future where any impacted coastal location on the globe has a live, near-term wave run-up forecast that provides the accuracy equivalent to or better than existing forecasts will require significant but achievable progress. We have identified a set of technologies that will be necessary to meet this goal. These include data acquisition, computational efficiency, and impact validation.
There are two main types of data required for the live model approach to forecasting. One is the need for accurate real-time sea level at periods longer than about an hour. This data is required for the empirical model as well as for any other accurate wave run-up forecast. The sensitivity of run-up to sea level conditions precludes using just global tide solutions and/or remote sensing (at its current level of accuracy) if high forecast accuracy is desired. In the future, it is likely that the combination of eddy resolving Global Circulation Models (GCM), advances in remote sensing, and a proliferation of sea level gauges, will lead to accurate coastal sea level prediction being available for most coastal areas.
The other data that is required for the live 2-D model approach is accurate nearshore bathymetry and topography. This has a complication in that the nearshore topography (and in some cases the bathymetry as well) is often changing within very short time scales due to natural and anthropogenic causes. New technologies are being introduced that will allow for the collection of these datasets for coastlines with high population density (Casella et al., 2016). Products such as Google Earth continuously advance in the assimilation of data. Also, existing digital elevation model services such as Autodesk ReCap and DroneDeploy for the construction and agriculture sectors, are now appealing to the general public. One could imagine in the near future that citizen scientist networks, subscribers to crowdsourcing data collection apps, or another conduit yet to be created will be able to respond to simple requests in areas where new topography is necessary. Such requests might be filled by the general public flying their consumer drones and submitting the images for photogrammetric processing.
Apart from community sourced topography, new bathymetric lidar is now available for drone usage (e.g., RIEGL Bathycopter, Fugro RAMMS, etc.), so the cost and complexity of small scale nearshore bathymetric surveys will drop exponentially. Additionally, with the smaller scale and lower heights of acquisition, the bathymetric accuracy will increase. In tandem with the new drone technology is the implementation of small scale side scan sonar mounted on autonomous surface vehicles (e.g., EvoLogics Sonobot, Seafloor Systems Echoboat, implementation example see Giordano et al., 2016). These new advances mean that the critical bathymetric and topographic component for implementing live model-based forecasts will cease to be a major impediment. Additionally, changes in model accuracy due to fluctuation in the nearshore topography will adjust as updated topographic models are generated in a timely response cycle as opposed to waiting multiple years.
To increase the accuracy of the live model-based forecast approach one can reduce the grid size and increase the resolution of the input wave spectrum. Both of these conditions will happen in time naturally as increased processing power becomes more accessible. But advances in the numerical schemes of the Boussinesq phase-resolving models used will continue as well. The potential to optimize some of the computational workload and shift it toward Graphics Processing Unit (GPU) style massive multithreading remains (Kim et al., 2018). This should eventually lead to much higher accuracy and much shorter run times, as it has for other types of computational fluid dynamic models.
The next critical advancement in bringing live 2-D numerical model forecasts of wave run-up to many (if not all) coastal zones in the future is the process of validation. Validating the forecasts often requires many man hours of on-site assessments, plus photo and video records for each individual event. This critical information was necessary to make our original empirical forecasts useful and accurate, and it is equally necessary for the live numerical models. New community-based methods of collecting this information are being implemented now which should increase the amount of observations while decreasing the workload on professionals.
These community-based ground-truthing methods, as they mature, will bring a whole new level of value to run-up and inundation forecast products. The Hawai‘i and Pacific Islands King Tides Project, a citizen scientist crowdsourced initiative led by the University of Hawai‘i Sea Grant College Program, has already collected thousands of images revealing the extent of specific inundation events and how they impact local coastlines. A similar approach will be employed to document the impacts of wave run-up along West Maui. Efforts like this are spreading quickly (e.g., Massachusetts Institute of Technology’s product Riskmap.org), and our expectation is that crowdsourced data collection methodologies will aggregate and be standardized over time. Federal agencies, such as Federal Emergency Management Agency’s Disaster Reporter and associated mobile app, also take advantage of community-based data and information collection.
As the crowdsourced methods become widespread and mature in the level of accuracy and coverage, the other forecast technologies will advance in conjunction. The future of the wave run-up and inundation forecasts will become an interesting interplay between scientists, hazard management agencies, and end users. We have realized the importance of communicating the forecast products in a way that enables the user to mitigate risk most effectively. An additional realization is that we, the forecast creators, will be relying on the end users directly for critical components necessary to increase accuracy and coverage. This adaptive confirmation and application of the forecast models will strengthen their usage and avoid major pitfalls of similar efforts (Oreskes et al., 1994).
We are optimistic that in the near future there will be a distinct increase in both the area of coastline covered by run-up and inundation forecast tools and an increase in the accuracy of those tools. In other words, the deployment of live 2-D wave models in the nearshore combined with a campaign of event validation will lead to much higher levels of risk mitigation and response. These advancements will result in more users that rely on these forecasts. A threshold of acceptability is dawning for this type of forecast, and once the tools mature and become widespread, their ubiquitous inclusion into existing public forecasts such as those of the NOAA’s National Weather Service should be encouraged. Institutionalization of these forecasts increases stakeholder reach, thereby increasing societal benefit.
With the goal of bringing inundation forecasting to the level of existing national public forecasts, we recommend forming a national steering committee to begin planning the extensive process to make this a reality. A set of workshops in the near future could help bridge the inundation community together and illuminate an acceptable objective that matches the accuracy and availability of public forecasts like precipitation, winds, tides, etc. The committee could outline and bring together the cross-discipline science needed for crowd sourced validations and citizen scientist data collection. Also, a national steering committee would help promote the funding necessary to make the forecasts tools a reality in a timely fashion.
Author Contributions
MG led the review, the design, and the development of the manuscript. AA and VR generated the figures and associated text. MI, FL, and DL contributed to the focus of the text and to the drafting of the manuscript. All authors have reviewed the final version of the manuscript and approved it for publication.
Funding
The development of the Six-Day High Sea Level Forecasts and the first versions of the Wave Run-up Forecasts were developed by PacIOOS under funding from the National Oceanic and Atmospheric Administration via the Integrated Ocean Observing System Award #NA11NOS0120039. Active forecast development in West Maui was supported by the National Oceanic and Atmospheric Administration’s Office for Coastal Management Regional Coastal Resilience Program Award #NA17NOS4730143, Integrated Ocean Observing System Award #NA16NOS0120024, Hawai‘i Sea Grant Award #NA140AR4170071, and the Joint Institute for Marine and Atmospheric Research.
Conflict of Interest Statement
The authors declare that the research was conducted in the absence of any commercial or financial relationships that could be construed as a potential conflict of interest.
Acknowledgments
We would like to acknowledge Dr. Mark Merrifield and Dr. Janet Becker for providing access to their nearshore pressure data archive. We would also like to thank all the partners, agencies and citizen scientists alike, who continue to help us to get the word out, to validate the forecasts, and to continually press us to improve and do more and better. There are too many partners and individuals to name them all here, but we would like to give a special thanks to Karl Fellenius (former Hawai‘i Sea Grant extension agent in the RMI), Dolan Eversole (Waikīkī Beach management coordinator), and Tara Owens (Hawai‘i Sea Grant extension agent on Maui) for their years of feedback, dedication, and partnership.
Footnotes
- ^A note on terminology. Run-up is considered the maximum topographic elevation the water reaches on land, and in the case of swell wave-driven run-up (as opposed to tsunami run-up, for instance) it is usually quantified as the elevation reached by 2% of wave bores running up the shore (the 2% exceedance point). The inundation is the distance the seawater travels inland (measured horizontally) that is driven by wave run-up or non-swell wave processes affecting the sea level height at the shore. Flooding results from significant and/or repeated inundation. Inundation often occurs somewhere within a region where high run-up occurs, but this all depends on the near-coast topography.
- ^http://www.pacioos.hawaii.edu/shoreline-category/highsea/
- ^http://www.pacioos.hawaii.edu/shoreline-category/runup/
- ^Commonly, the term “infragravity waves” refers to gravity waves at periods from approximately 25 s to a few minutes. Here we include waves in this term that have periods as long as an hour.
References
Becker, J. M., Merrifield, M. A., and Ford, M. (2014). Water level effects on breaking wave setup for Pacific Island fringing reefs. J. Geophys. Res. Oceans 119, 914–932. doi: 10.1002/2013JC009373
Casella, E., Rovere, A., Pedroncini, A., Stark, C. P., Casella, M., Ferrari, M., et al. (2016). Drones as tools for monitoring beach topography changes in the Ligurian Sea (NW Mediterranean). Geo-Mar. Lett. 36, 151–163. doi: 10.1007/s00367-016-0435-9
Datawell, B. V. (2009). Oceanographic Instruments. Datawell Waverider Reference Manual, WR-SG, DWR-MkIII, DWR-G. Heerhugowaard: Datawell BV Oceanographic Instruments.
Giordano, F., Mattei, G., Parente, C., Peluso, F., and Santamaria, R. (2016). Integrating sensors into a marine drone for bathymetric 3D surveys in shallow waters. Sensors 16:41. doi: 10.3390/s16010041
Guiles, M., Luther, D., and Merrifield, M. (2012). Part 1 - Sea Level Forecasts at Harbors in Hawaii and on Other Pacific Islands. Manoa: SOEST Publication.
Hess, D., Hwang, D., Fellenius, K., Robertson, I., Stege, M., and Chutaro, B. (2015). Homeowner’s Handbook to Prepare for Natural Hazards. Majuro: University of Hawai‘i Sea Grant College Program.
Iwamoto, M. M., Langenberger, F., and Ostrander, C. E. (2016). Ocean observing: serving stakeholders in the Pacific Islands. Mar. Technol. Soc. J. 50, 47–54. doi: 10.4031/MTSJ.50.3.2
Kim, B., Oh, C., Yi, Y., and Kim, D. H. (2018). GPU-accelerated boussinesq model using compute unified device architecture FORTRAN. J. Coast. Res. 85, 1176–1180. doi: 10.2112/SI85-236.1
Lynett, P. J., Wu, T. R., and Liu, P. L. F. (2002). Modeling wave runup with depth-integrated equations. Coast. Eng. 46, 89–107. doi: 10.1016/S0378-3839(02)00043-1
Merrifield, M. A., Becker, J. M., Ford, M., and Yao, Y. (2014). Observations and estimates of wave-driven water level extremes at the Marshall Islands. Geophys. Res. Lett. 41, 7245–7253. doi: 10.1002/2014GL061005
Oreskes, N., Shrader-Frechette, K., and Belitz, K. (1994). Verification, validation, and confirmation of numerical models in the earth sciences. Science 263, 641–646. doi: 10.1126/science.263.5147.641
Roeber, V., and Cheung, K. F. (2012). Boussinesq-type model for energetic breaking waves in fringing reef environments. Coast. Eng. 70, 1–20. doi: 10.1016/j.coastaleng.2012.06.001
Roelvink, D., Reniers, A., Van Dongeren, A. P., de Vries, J. V. T., McCall, R., and Lescinski, J. (2009). Modelling storm impacts on beaches, dunes and barrier islands. Coast. Eng. 56, 1133–1152. doi: 10.1016/j.coastaleng.2009.08.006
Shi, F., Kirby, J. T., Harris, J. C., Geiman, J. D., and Grilli, S. T. (2012). A high-order adaptive time-stepping TVD solver for Boussinesq modeling of breaking waves and coastal inundation. Ocean Model. 43, 36–51. doi: 10.1016/j.ocemod.2011.12.004
Stockdon, H. F., Holman, R. A., Howd, P. A., and Sallenger, A. H. Jr. (2006). Empirical parameterization of setup, swash, and runup. Coast. Eng. 53, 573–588. doi: 10.1016/j.coastaleng.2005.12.005
Team, S. W. A. N. (2015). Scientific and Technical Documentation, SWAN Cycle III Version 41.01. Delft: Delft University of Technology, Department of Civil Engineering.
Keywords: run-up, coastal hazards, wave forecasts, inundation, high sea level, nearshore bathymetry, crowdsourced validation
Citation: Guiles M, Azouri A, Roeber V, Iwamoto MM, Langenberger F and Luther DS (2019) Forecasts of Wave-Induced Coastal Hazards in the United States Pacific Islands: Past, Present, and the Future. Front. Mar. Sci. 6:170. doi: 10.3389/fmars.2019.00170
Received: 30 November 2018; Accepted: 18 March 2019;
Published: 05 April 2019.
Edited by:
Fei Chai, State Oceanic Administration, ChinaReviewed by:
Fengyan T. Shi, University of Delaware, United StatesLei Shi, National Ocean Service (NOAA), United States
Copyright © 2019 Guiles, Azouri, Roeber, Iwamoto, Langenberger and Luther. This is an open-access article distributed under the terms of the Creative Commons Attribution License (CC BY). The use, distribution or reproduction in other forums is permitted, provided the original author(s) and the copyright owner(s) are credited and that the original publication in this journal is cited, in accordance with accepted academic practice. No use, distribution or reproduction is permitted which does not comply with these terms.
*Correspondence: Martin Guiles, guiles@hawaii.edu