Assessing the Influence of Water Constituents on the Radiative Heating of Laptev Sea Shelf Waters
 Mariana A. Soppa1*
  Vasileios Pefanis1,2
  Sebastian Hellmann1,3
  Svetlana N. Losa1 Jens Hölemann1 Fedor Martynov4
  Birgit Heim5
  Markus A. Janout1
  Tilman Dinter1 Vladimir Rozanov2
  Astrid Bracher1,2
- 1Department of Climate Sciences, Alfred Wegener Institute Helmholtz Centre for Polar and Marine Research, Bremerhaven, Germany
- 2Institute for Environmental Physics, Department of Physics and Electrical Engineering, University Bremen, Bremen, Germany
- 3Laboratory of Hydraulics, Hydrology and Glaciology (VAW), ETH Zurich, Zurich, Switzerland
- 4Otto Schmidt Laboratory for Marine and Polar Research, Arctic and Antarctic Research Institute, St. Petersburg, Russia
- 5Department of Geosciences, Alfred Wegener Institute Helmholtz Centre for Polar and Marine Research, Potsdam, Germany
The presence of optically active water constituents is known to attenuate the light penetration in the ocean and impact the ocean heat content. Here, we investigate the influence of colored dissolved organic matter (CDOM) and total suspended matter (TSM) on the radiative heating of the Laptev Sea shelf waters. The Laptev Sea region is heavily influenced by the Lena River, one of the largest river systems in the Arctic region. We simulate the radiative heating by using a coupled atmosphere-ocean radiative transfer model (RTM) and in situ measurements from the TRANSDRIFT XVII expedition carried out in September 2010. The results indicate that CDOM and TSM have significant influence on the energy budget of the Laptev Sea shelf waters, absorbing most of the solar energy in the first 2 m of the water column. In the station with the highest CDOM absorption (aCDOM(443) = 1.77 m−1) ~43% more energy is absorbed in the surface layer compared to the station with the lowest aCDOM(443) (~0.2 m−1), which translates to an increased radiative heating of ~0.6°C/day. The increased absorbed energy by the water constituents also implies increased sea ice melt rate and changes in the surface heat fluxes to the atmosphere. By using satellite remote sensing and RTM we quantify the spatial distribution of the radiative heating in the Laptev Sea for a typical summer day. The combined use of satellite remote sensing, RT modeling and in situ observations can be used to improve parameterization schemes in atmosphere-ocean circulation models to assess the role of the ocean in the effect of Arctic amplification.
1. Introduction
The Arctic region currently shows the most rapid increase in near-surface temperatures (McCarthy et al., 2001). Although the trigger mechanisms are not yet fully understood (Serreze and Barry, 2011), this phenomenon known as Arctic amplification has been linked to the reduction of sea ice concentration and thickness. As the temperature increases, the melting of ice decreases the surface albedo and increases the absorption of solar radiation (Grosse et al., 2016). Larger open water regions increase air-sea heat fluxes and enhance the warming of surface air, and further intensify surface evaporation and precipitation (Bintanja and Andry, 2017).
The warming in the Arctic also contributes to the thawing of the upper permafrost (Grosse et al., 2016), where large amounts of organic carbon are stored. Consequently, progressive permafrost thawing together with an increase in precipitation and freshwater discharge is expected to result in higher loads of dissolved organic matter (DOM) and suspended matter (SM) entering the Arctic Ocean. Part of the DOM is an optically active water constituent and absorbs light in the ultraviolet and visible wavelengths, the colored or chromophoric dissolved organic matter (CDOM). CDOM and SM drive solar energy absorption and reduce light penetration in the water at short wavelengths. In the western Arctic Ocean, CDOM absorption (aCDOM) is responsible for almost 76% of the total non-water absorption (atw) at 443 nm, whereas phytoplankton absorption (aph) contributes to around 16% and non-algal particles absorption (aNAP) less than 1% (Matsuoka et al., 2007). In the eastern and central Arctic Ocean, the contribution of aCDOM, aph and aNAP to atw reaches 85, 12, and 3% (Gonçalves-Araujo et al., 2018), respectively.
The presence of CDOM in the Arctic waters results in increased absorption of solar energy in the mixed layer (Pegau, 2002; Hill, 2008; Kutser, 2010; Granskog et al., 2015; Kim et al., 2016); potentially contributing to the general sea ice retreat. Moreover, Hill (2008) reported that particle absorption can equally contribute to the observed enhanced summer warming of surface waters in the Chukchi Sea. Earlier studies (Chang and Dickey, 2004; Kim et al., 2016) also emphasized the importance of including water constituents in the parameterizations of Earth system models because of their influence on ocean and sea ice dynamics.
Yet, little is known about the influence of CDOM and SM on the radiative heating in most of the Arctic coastal regions. Here, we focus on the Laptev Sea shelf, a vast Siberian Arctic shelf region that is influenced by the Lena River, one of the largest rivers on earth and with the highest annual flux of dissolved organic carbon and silica to the Arctic Ocean (Stedmon et al., 2011; Holmes et al., 2012). The Lena's watershed covers an area of 2.46 × 10⁶ km2 (Holmes et al., 2012) and comprises the largest delta in the Arctic region (Heim et al., 2014). In the Laptev Sea, the sea ice retreat and break up of landfast ice is coupled with the Lena River discharge (Bauch et al., 2013; Selyuzhenok et al., 2015). The river runoff peaks in June, contributes with heat and freshwater to the shallow Laptev Sea shelf, increases sea ice melt and sets up the summer stratification (Janout et al., 2016). We hypothesize that the high concentrations of CDOM and SM contained in the shelf waters enhance the absorption of solar energy in the first few meters of the water column, and trap additional heat above the thermocline which could potentially enhance the sea ice melt in the region.
To shed light on this hypothesis, we combine satellite remote sensing, radiative transfer modeling (RTM), and in situ observations to simulate the radiative heating in the interior of the water column and surface waters. Specifically, we employ a coupled RTM and simulated realistic ocean characteristics based on measurements of aCDOM (m−1), suspended particulate matter (here after called total suspended matter - TSM, g/m3) and chlorophyll concentration (Chla, mg/m3) from the TRANSDRIFT XVII expedition carried out in September 2010. In addition, we show the potential of using satellite information together with RTM to investigate the spatial variability of the radiative heating and further aim to evaluate the quality of satellite remote sensing products of Chla and aCDOM(443) in this region by comparing satellite products with ocean observations. Finally, by use of satellite data of aCDOM(443), TSM, Chla and sea surface temperature as input to our RTM, we perform a case study to quantify the spatial distribution of radiative heating in the surface waters of the Laptev Sea for August 4, 2010.
2. Materials and Methods
This section is organized in three parts: validation of MEdium Resolution Imaging Spectrometer (MERIS) ocean color products, evaluation of the RTM SCIATRAN, and investigation of simulated radiative heating for various scenarios. At first we validate MERIS Chla and aCDOM(443) retrievals from Case-2 Regional/Coast Color (C2RCC) and C2X algorithms against in situ measurements to determine the best products for the later use in the RT simulations (section 2.2). In a second step we evaluate the SCIATRAN simulations by comparing simulated top-of-atmosphere radiances (LTOA) to MERIS LTOA (section 2.3.2). In the last step we investigate how changes in the water constituents impact the radiative heating of Laptev Sea surface waters based on point measurements and in terms of spatial distribution initialized by satellite data (sections 2.3.3 and 2.3.4).
2.1. In situ Data
The in situ dataset is composed of data of CDOM absorption spectra, TSM, Chla concentration, temperature and salinity measured during the TRANSDRIFT XVII and TRANSDRIFT XIX expeditions in August-September 2010 and 2011, respectively (Figure 1). For validation of Chla and aCDOM(443) satellite products surface measurements (first 2 m of the water column) from both expeditions were used. No radiometric measurements were taken during these expeditions. For evaluation of the RTM SCIATRAN and further RTM simulations, only data from TRANSDRIFT-XVII were used. Chla, temperature and salinity were measured at depth intervals of 1 m, whereas for aCDOM and TSM the vertical resolution varied between stations. A detailed description of water sampling and analysis for the TRANSDRIFT-XVII expedition can be found in Heim et al. (2014). The TRANSDRIFT XIX expedition was carried out with the same methodology of water sampling, analysis and instrumentation as for TRANSDRIFT-XVII. Data are available at https://doi.pangaea.de/10.1594/PANGAEA.897894.
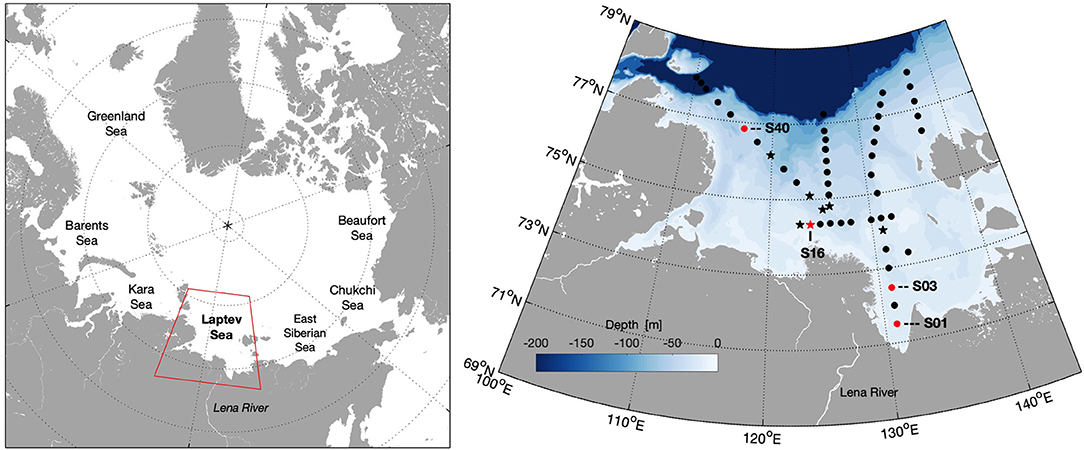
Figure 1. Study area and location of sampling stations of TRANSDRIFT-XVII and TRANSDRIFT XIX expeditions (black). Stations used for RT simulations are in red and stations matched with satellite data for validation of ocean color products are marked as stars.
2.2. Ocean Color Products and Validation
Daily MERIS Level 1b data (Reduced Resolution, 1.2-km resolution) were obtained for August and September 2010 and 2011 and processed with C2RCC and C2X algorithms. C2RCC and C2X are based on a large database of radiative transfer simulations inverted by neural networks (Brockmann et al., 2016). C2X is a modified version of C2RCC with neural nets that have been trained for extreme ranges of scattering and absorption. The algorithms have two main set of nets. A first set of neural nets is used to perform the atmospheric correction, going from LTOA to water leaving radiances (LW), and a second set of nets retrieves inherent water optical properties (aph(443), aCDOM(443), absorption coefficient of detritus at 443 nm, scattering coefficient of marine particles at 443 nm and scattering coefficient of white particles at 443 nm) and apparent optical properties (e.g., irradiance attenuation coefficient at 489 nm and first optical depth) from the LW and with corresponding uncertainties. Chla is determined from aph(443) using a scaling factor of 21. For both algorithms, we also evaluated the Chla products using the Chla scaling factor of Örek et al. (2013) [Chla=7.8 aph(442) assuming aCDOM(442) ≈ aCDOM(443)] derived from measurements carried out in the Lena River in June/July 2011, hereafter called C2RCC Laptev Sea and C2X Laptev Sea.
To compare the satellite products and in situ measurements the root mean squared error (RMSE), bias, slope and determination coefficient were used (for Chla in log 10 space). To derive high quality match-ups we checked the spatial homogeneity over a 3 x 3 pixel box centered on the location of the in situ data (for satellite and in situ data taken on the same day). Following Bailey and Werdell (2006), match-ups were regarded as valid if more than 50% of the nine pixels were not flagged after applying the atmospheric correction (AC) flags (Rtosa_OOS, Rtosa_OOR, Rhow_OOR, and l1_flags) and if the median coefficient of variation (ratio of the standard deviation to the median value) of the remaining pixels was lower than 0.15 in remote sensing reflectances at 412, 443, 490, and 560 nm. The median values of Chla and aCDOM(443) were then used for comparison with in situ data.
2.3. Radiative Transfer Simulations
2.3.1. RTM Description
Radiative heating simulations were performed by use of the coupled atmosphere–ocean RTM SCIATRAN release version 3.7.1 (Rozanov et al., 2002, 2014, 2017). The model spectral range covers from 175.44 nm to 40 μm and simulations were carried out from 300 to 800 nm where the water constituents mostly impact the light penetration. The RTM was run in pseudo-spherical mode, where the attenuation of the incoming solar light is calculated in a spherical atmosphere and all further processes are solved in a plane-parallel scenario.
The atmospheric component includes thermal emission, absorption by several trace gases, Rayleigh scattering and attenuation by aerosol and cloud particles. The ocean surface reflection properties are described by the bidirectional reflection function taking into account Fresnel effects and a wind roughened ocean-atmosphere interface using 10 m wind speed derived from MERIS L1b data. The solar spectrum is derived from MODerate spectral resolution atmospheric TRANsmittance algorithm and computer model (MODTRAN) 3.7 for a spectral range from 300 to 900 nm interpolated (1 nm) and convolved with a Gaussian slit function (Rozanov et al., 2017). For the trace gases we used the HITRAN 2012 spectral line parameters and profiles from the LOWTRAN database. The aerosol properties were selected as in Rozanov et al. (2017) and the aerosol optical thickness was set to 0.09 at 500 nm based on measurements from the Tiksi AERONET station. Rotational Raman scattering and polarization effects were not included in the simulations because the effect is assumed to be negligible in broadband radiation budget calculations.
The ocean component consists of biooptical models as described in Blum et al. (2012). Chlorophyll-a specific phytoplankton absorption coefficient is based on Prieur and Sathyendranath (1981) and Haltrin (2006), and mass-specific absorption spectrum of non-algal particles based on Örek et al. (2013). The pure sea water absorption (aw) spectrum is a merged spectrum based on Smith and Baker (1981) for 200–300 nm with transition to Sogandares and Fry (1997) between 300 and 340 nm, Sogandares and Fry (1997) for 340–380 nm, Pope and Fry (1997) for 380–725 nm, Smith and Baker (1981) for 725–800 nm, and Segelstein (1981) for 800–1150 nm. We further implemented a temperature and salinity correction following Röttgers et al. (2014). Particle scattering is based on Kopelevich (1983) with the concentrations of small and large particles determined following Haltrin (1999). No effects of vibrational Raman scattering and fluorescence by CDOM or Chla were included in the simulations.
Studies using SCIATRAN for ocean application include (Dinter et al., 2015; Wolanin et al., 2015a,b; Losa et al., 2017). More information on the evaluation of the RTM SCIATRAN can be found in Blum et al. (2012), Peters et al. (2014), and (Rozanov et al., 2014, 2017).
2.3.2. RTM Evaluation
To evaluate SCIATRAN simulation capabilities, we compared simulated LTOA with MERIS LTOA from Level 1b data (Reduced Resolution, 1.2-km resolution). The MERIS imaging geometry information (solar zenith angle, satellite viewing angle, and azimuth angle) was implemented in the RTM, extracted for the specific day and location of the stations. To compare the continuous SCIATRAN LTOA spectrum with the discrete MERIS LTOA data, the simulated hyperspectral LTOA were convolved with MERIS spectral response functions to compute weight band-average radiance values for each nominal band center (j):
where RSR is the MERIS relative spectral response function.
Simulated LTOA and MERIS LTOA were compared using the metrics described in section 2.2. Match-ups were considered valid if MERIS LTOA data were not flagged (cosmetic, duplicated, glint risk, suspect, bright, and invalid) and satellite—in situ measurements were taken maximum 5 h apart. This first quality control reduced the initial number of match-ups from 20 to six data points. A visual inspection of the images identified two other stations cloud covered further reducing the number of valid match-ups to four data points. In addition, as the water constituents influence the shape and magnitude of the LW, the RTM SCIATRAN was also evaluated by investigating the spectral distribution of the LW at the four selected stations for simulations (Figure 1). The stations used for simulations are different from the good match-ups with MERIS LTOA. The simulated stations were selected because they presented the highest and lowest values of aCDOM(443) among all sampled stations with changing TSM and Chla concentrations (Table 1) and they are representative of river (S01, S03, and S16) and marine (S40) influenced waters.
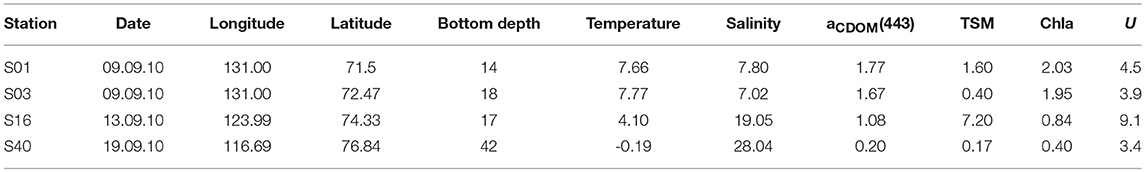
Table 1. CDOM absorption (aCDOM in m−1), Chla (mg/m3), TSM (g/m3) at 2 m depth (except for aCDOM at station 40, S40, sampled at 5 m) and wind speed (m/s).
2.3.3. Radiative Heating Simulations
As input parameters in the simulations, we used in situ profiles of aCDOM spectrum, Chla, TSM, temperature, and salinity. To demonstrate the heating effect of large concentrations of the water constituents CDOM and TSM, simulations were performed for four stations of the TRANSDRIFT-XVII expedition (Figure 1 and Table 1). To assess only the effect of the water constituents on the radiative heating, we simulated the spectrally integrated downwelling (Ed, W/m2) and upwelling irradiances (Eu, W/m2) at a depth, z, for July 1 at 76°N, 126°E, and for 24 solar zenith angles (representing hourly resolution) from 300 to 800 nm. All metrics refer to an integral over one day except for the sea ice melt rate.
The net irradiance (En, W/m2) was determined as:
From the En summed over the course of a day (KJ/m2) we estimated the absorbed energy (Enabs) at every vertical layer in the water based on the provided depth grid dz as:
with i ranging from zero to the maximum depth.
Simulations were performed for different scenarios, including and excluding absorbers. The difference in the net absorbed energy (ΔEnabs) was determined for example, by calculating the difference between Enabs at S01 (highest aCDOM) and at S40 (lowest aCDOM).
The difference in the absorbed energy (ΔEnabs) for the upper 2 m can be translated in terms of radiative heating (RH, °C) as:
where ρ is the density of seawater (kg/m3) measured in situ, V is the volume of water (i.e., 2 m3), and cp is the seawater specific heat (4100 J/kgK).
Following the method described by Hill (2008), we estimated the potential increase in the rate of sea ice melt (Δ(dH/dt), mm/h) caused by the presence of CDOM and TSM (considering that all Enabs is converted to ice melt):
where ρ is the density of sea ice (900 kg/m3) and L is the latent heat of fusion of sea ice (300 KJ/kg).
We further investigated the influence of the changes in CDOM and TSM to the surface heat flux. The difference in the summed heat flux (ΔQsum) was determined as the sum of the differences in the sensible (ΔQsen) and latent heat flux (ΔQlat), and longwave radiation (ΔQlw).
Assuming that the atmosphere does not change, ΔQsen and ΔQlat were determined as:
where ρa denotes the air density (1.22 kg/m3), cpa is the specific heat of air at constant pressure (1003 J/kgK), cH and cE are bulk transfer coefficients (9.7 × 10⁻⁴ and 1.5 × 10⁻³, respectively and both unitless), U10 is the wind speed at 10 m height (m/s) derived from MERIS. The respective sea surface temperatures Twith and Twithout are the in situ surface water temperatures (which includes the influence of the water constituents) and the in situ surface water temperature minus ΔRH (both in K). Lv is the latent heat of evaporation of water (2.45 × 10⁶ J/kg), qwith and qwithout are the air specific humidity (both unitless) respectively. The specific humidities were calculated with the COARE-Met Flux Algorithm (https://coaps.fsu.edu/COARE/flux_algor/) using MERIS wind speed (average value of wind speed at selected stations), the respective sea surface temperature and atmospheric pressure (1012.5 mbar).
The Qlw was determined based on the longwave SCIATRAN simulations from 800 to 1190 nm. In the computation of heat fluxes we considered the upper 1 m of the water column.
2.3.4. Spatial Distribution
The spatial analysis of radiative heating was simulated with satellite information of Chla, aCDOM(443), TSM and sea surface temperature (SST) for August 4, 2010; the least cloudy satellite image. More specifically, we used the C2RCC Laptev Sea Chla and C2RCC aCDOM(443) MERIS products after the evaluation of the satellite retrievals (section 3.1). CDOM absorption spectra were derived from aCDOM(443) product using a spectral slope value of 0.018 (Matsuoka et al., 2014). TSM product was derived from the C2RCC algorithm.
Temperature was estimated from SST using the Group for High Resolution Sea Surface Temperature (GHRSST) Multi-scale Ultra-high Resolution (MUR) SST data (Naval Oceanographic Office, 2018) that combines information from microwave and infrared sensors and represents the temperature at 1 m depth. Salinity (S) was estimated empirically from satellite aCDOM(443) using a linear relationship derived from in situ measurements of TRANSDRIFT XVII and assuming aCDOM(440) ≈ aCDOM(443):
Considering that the shelf areas of the Laptev Sea are very shallow (Figure 1), we assumed homogeneous profiles of temperature and salinity as our in situ profiles show homogeneous distributions in the upper 10 m (Figure 7) and we do not have vertically resolved information from remote sensing. To properly model the coupled atmosphere-ocean RT it is necessary to choose a water depth deeper than the penetration depth of photons in the ocean. Here we assume a constant bottom depth of 10 m because at all stations we simulated (see section 3.3.1) the radiation was absorbed within the upper 5 m of the water column and by choosing a shallower depth than the actual water depth we also sped up the computation. Constant light conditions were selected during simulations representing August 4, 2010, using an average solar zenith angle for the day at 74°N and 140°E. Because the mean value of the first optical depth was 2.6 m, the vertical distribution of Chla, aCDOM(443) and TSM were set homogeneous.
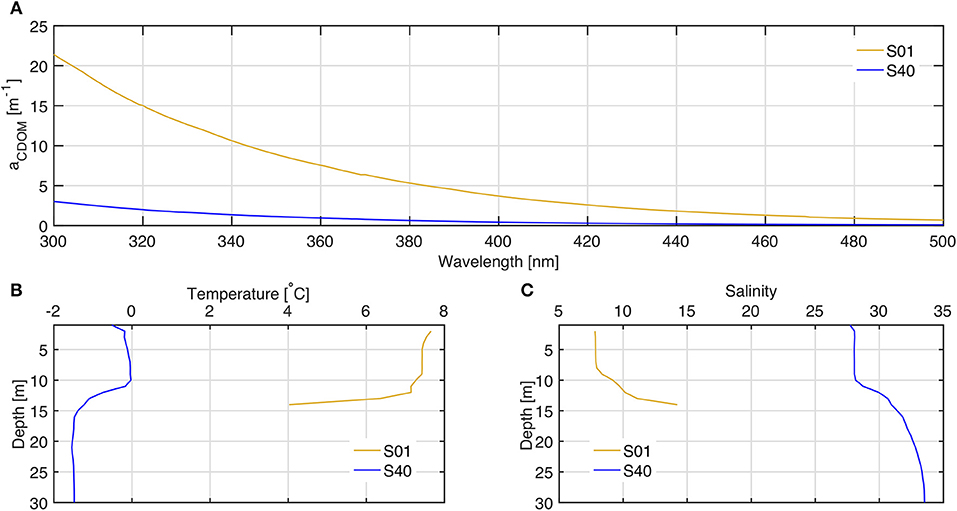
Figure 7. Total absorption spectra at 5 m depth (A), temperature (B), and salinity (C) profiles of S01 (yellow) and S40 (blue) measured in situ.
To investigate the increase in the RH due to the water constituents, we estimated the ΔEnabs by subtracting the minimum Enabs observed in the region, representing the clearest water, from the Enabs of each pixel. In a second step, we calculated ΔRH as in Equation (4), but using a constant ρs value of 1014 kg/m3. The spatial distribution of ΔQsum was computed as described in section 2.3.3 for stations simulations and assuming constant wind speed of 5 m/s, so that ΔQsum would only respond to changes in temperature due to bio-optical influence.
3. Results and Discussion
3.1. Validation of Ocean Color Products
Overall, the two algorithms C2RCC and C2X perform similarly, however the few high quality match-ups between satellite and in situ data are not sufficient to determine which algorithm performs better in the Laptev Sea (Table 2). The C2RCC product underestimates aCDOM(443) when compared with the in situ values as reported by Heim et al. (2014), whereas C2X shows a small overestimation. Nevertheless, overall C2RCC aCDOM(443) product shows better statistics (lower RMSE and slope closer to one) than C2X and for this reason it was selected for the spatial distribution case study. In case of Chla, all four products overestimate Chla, but to a lesser extent when using the Laptev Sea conversion factor for aph(443) to Chla of Örek et al. (2013) of 7.8.
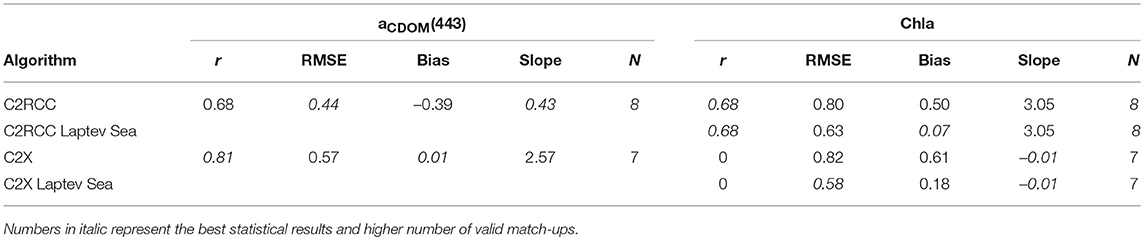
Table 2. Statistical results for aCDOM(443) and Chla obtained with C2RCC and C2X algorithms.
Based on the work of Heim et al. (2014), we restrict our investigation to MERIS data and ocean color products from the neural network algorithms. Heim et al. (2014) reported a higher number of match-ups using MERIS compared to MODIS and similar or better validation statistics using C2RCC compared to standard MERIS and MODIS Chla algorithms, respectively. Compared to Heim et al. (2014), we extend the investigation by evaluating the C2X algorithm in addition to C2RCC algorithm. We also include in situ measurements of the TRANSDRIFT XIX expedition and apply a more strict match-up analysis by selecting only match-ups for the same day and further applying the spatial homogeneity criteria for the selection of valid match-ups. We also validate Chla and CDOM products derived using Garver-Siegel-Maritorena—GSM algorithm applied to Polymer atmospheric correction, but the statistics were worse. Unfortunately only few in situ TSM measurements were available and did not allow a proper evaluation of satellite derived TSM. We emphasize the importance of new in situ measurements for validation of satellite products in the Laptev Sea.
To better illustrate the differences between C2RCC and C2X not captured by the match-up analysis, we also compare the spatial distribution of aCDOM(443) and Chla on August 04, 2010 (Figures 2, 3). Sharp frontal regions and fine features are seen in both products and algorithms. C2X presents higher values of aCDOM(443) than C2RCC for areas closer to the coast. For Chla, higher concentrations are derived by C2RCC and lower by C2X Laptev Sea.
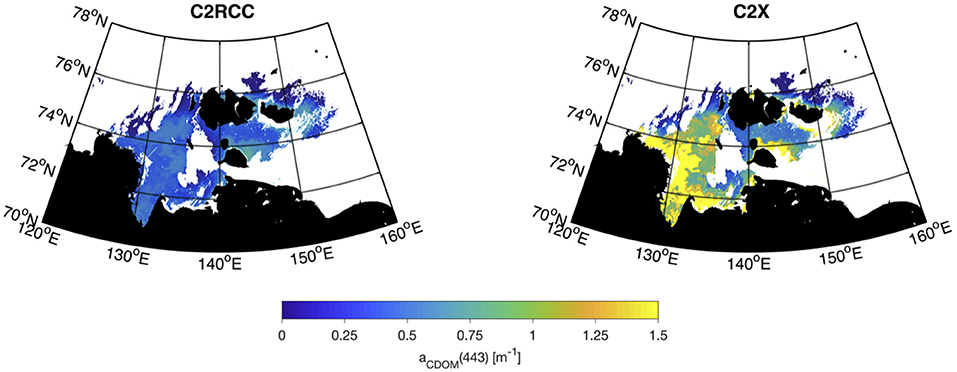
Figure 2. Retrieved MERIS aCDOM(443) using C2RCC (Left) and C2X (Right) algorithms on August 04, 2010. White areas correspond to flagged pixels (Rtosa_OOS, Rtosa_OOR, Rhow_OOR, and l1_flags).
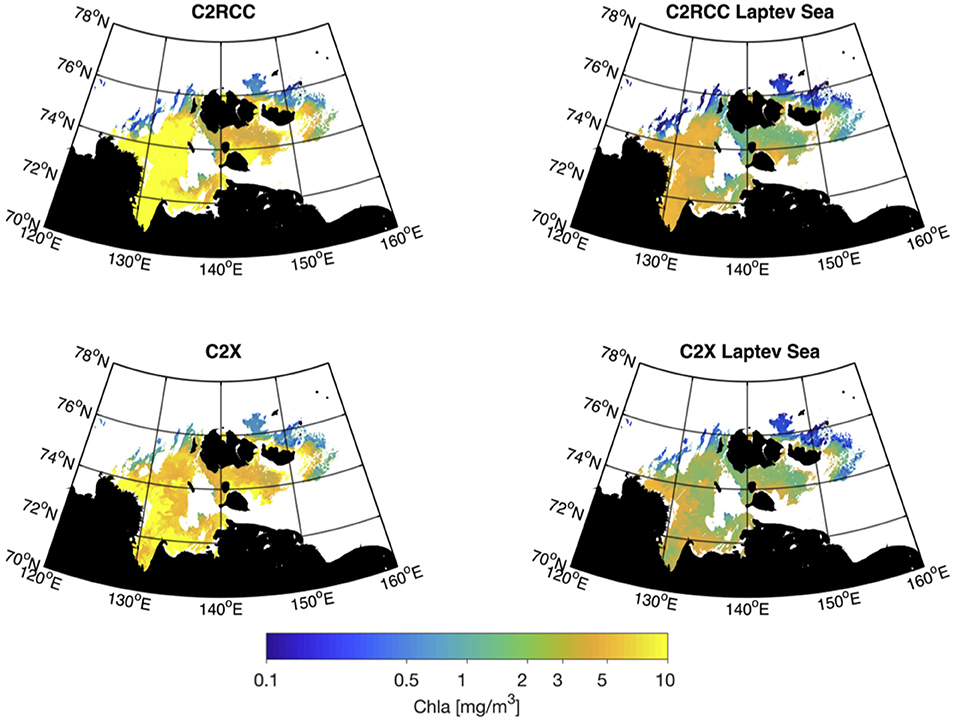
Figure 3. Same as Figure 2, but for Chla.
3.2. Evaluation of RTM
The evaluation of SCIATRAN RTM shows that the radiative processes are well implemented in the model. Simulated LTOA agrees well with matched MERIS LTOA (Figures 4, 5). Statistics per band show greater uncertainties at the wavelengths closer to the ozone absorption bands (560 to 681 nm, bands 5 to 8) (Figure 4 and Table 3). Uncertainties in the RTM can originate from the input data (e.g., imprecise characterization of the atmospheric aerosol particles) and formulation of the radiative transfer processes in the model (Blum et al., 2012). Figure 5 depicts the simulated SCIATRAN spectrum at S35 compared with matched MERIS-L1b LTOA showing simulated and satellite measured LTOA with similar spectral shape and magnitude.
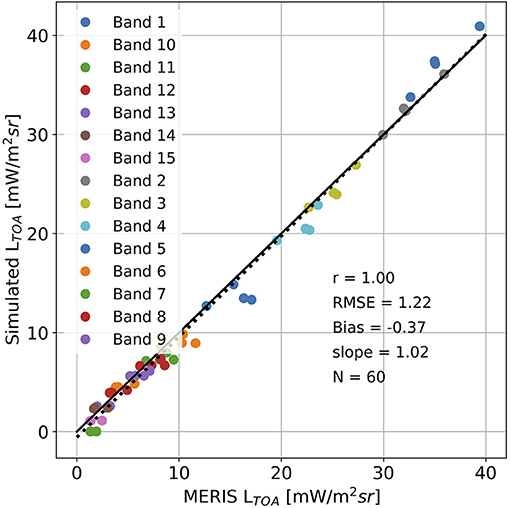
Figure 4. Scatterplot of SCIATRAN simulated LTOA against MERIS LTOA in the visible and near infrared spectral bands.
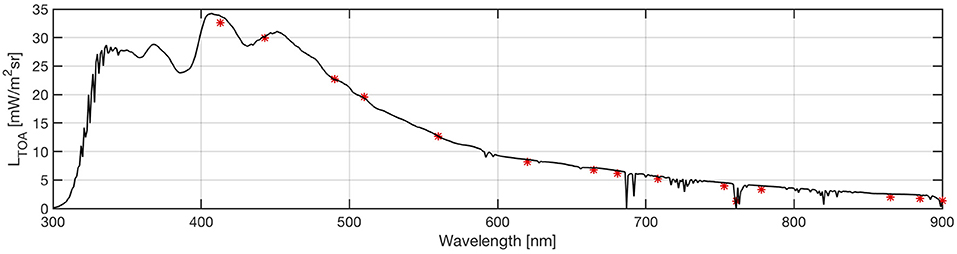
Figure 5. Comparison of SCIATRAN simulated (black) and MERIS-L1b (red) LTOA at S35.
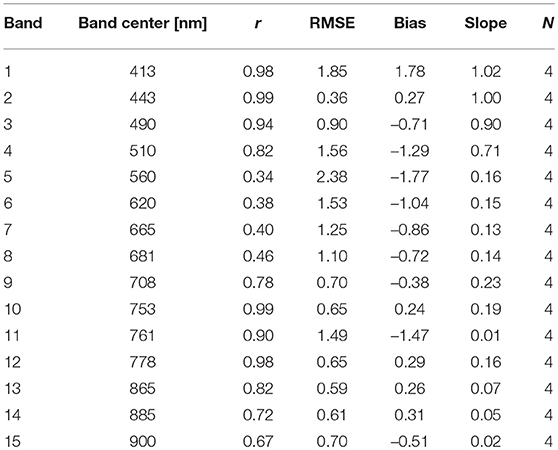
Table 3. Statistical results of the validation of SCIATRAN simulated LTOA against MERIS LTOA per band.
Figure 6 presents the LW spectrum of stations selected for radiative heating simulations. The magnitude and shape of LW reflect the influence of the water constituents: stations with higher concentrations of absorbers (continuous lines) display lower values of LW in the visible part of the spectra as well as flatter spectra than S40, with lower amounts of absorbers (dashed lines).
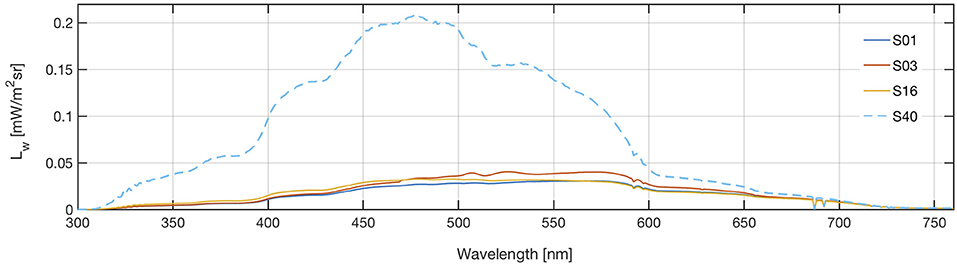
Figure 6. Simulated water leaving radiance (LW) spectra of stations selected for radiative heating simulations.
3.3. Bio-Optical Effect of CDOM and TSM on the Radiative Heating
Figure 7 shows aCDOM spectra, temperature and salinity profiles of S01 (yellow), located on the inner shelf close to the main branches of the Lena River, and S40 (blue), located on the northwestern Laptev Sea shelf. The presence and concentration of CDOM and TSM are associated with the proximity to the Lena River Delta indicating that the main sources of the water constituents are from river input and coastal erosion, as shown by several studies (e.g., Stedmon et al., 2011; Holmes et al., 2012; Bröder et al., 2016). The influence of the fresh river water on S01 can be seen by the much higher aCDOM, temperature and lower salinity than at S40, which is under the influence of marine waters entering the central Laptev Sea (Bauch and Cherniavskaia, 2018). S01 presents aCDOM(443) values almost nine times higher than at S40.
It is also likely that the concentrations of CDOM and TSM were higher before our expedition. Other studies observed maximum concentrations of CDOM and of silica flux by the Lena River to the Arctic in spring (Wegner et al., 2005; Stedmon et al., 2011; Holmes et al., 2012). In summer, when our expedition took place, the loads of CDOM and TSM are generally lower and the waters over the shelf are mainly dominated by river runoff, sea ice melt, and marine and polynya waters (Bauch and Cherniavskaia, 2018). On interannual time scales, the river water transport and ocean circulation on the Siberian shelves is controlled by two summer atmospheric regimes linked to the Arctic Oscillation (AO) (Morison et al., 2012). During a positive phase of AO, cyclonic atmospheric circulation prevails with northerly winds advecting Lena River water eastwards along the coast into the East Siberian Sea. The opposite holds during a negative phase, as found during TRANSDRIFT XVII, when prevailing southerly winds allow the Lena River plume to move north- and westward. Besides the large-scale atmospheric circulation, regional wind patterns dominate the extent of the river plume on monthly time scales (Dmitrenko et al., 2005; Janout et al., 2015).
3.3.1. Absorbed Energy and Radiative Heating
Profiles of Enabs show that in high CDOM and TSM regimes, the incident solar radiation is strongly absorbed in the first meter of the water column and almost fully attenuated in the upper three meters (Figure 8A). A closer look at S03 (Figure 8B), also a high aCDOM station but with lower concentrations of TSM than S01, shows a turning point at about 1.7 m; below this depth less energy is available and absorbed in waters under the presence of CDOM. Similar is found at S16 for simulations without CDOM or TSM, but at shallower depths (Figure 8C). As expected, in the marine-influenced waters of S40, where the concentration of CDOM, TSM, and Chla are low, the radiation penetrates deeper compared to the river-influenced stations and in turn, some of the heat could potentially be trapped in or below the pycnocline.
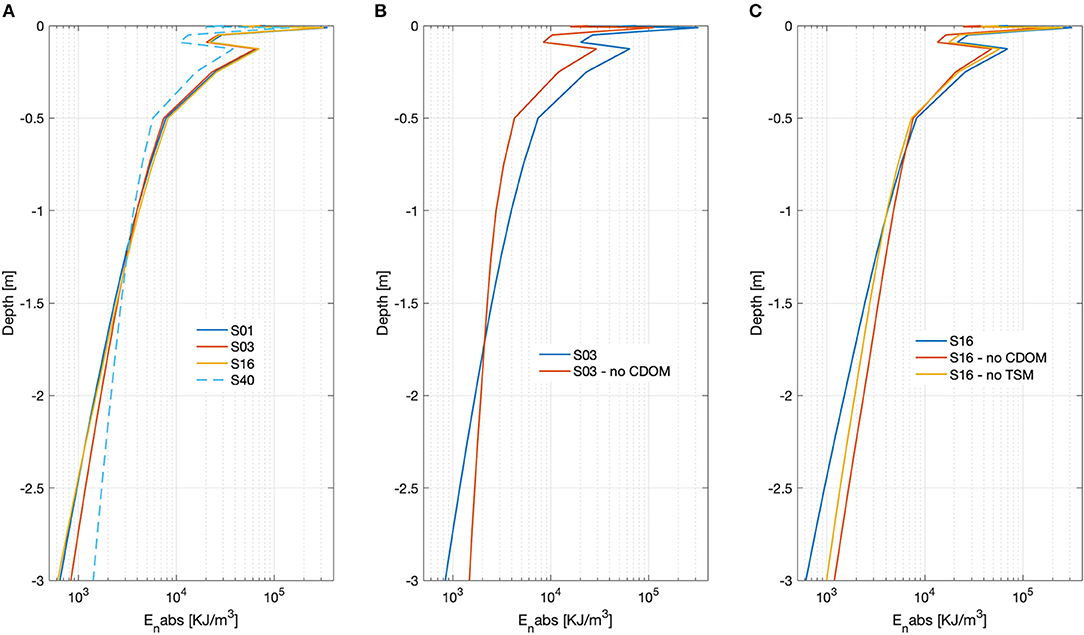
Figure 8. (A) Profiles of daily absorbed energy (Enabs, normalized by dz) including all absorbers. (B) Profiles of daily absorbed energy (Enabs, normalized by dz) at S03 including all absorbers (blue) and without CDOM (red). (C) Profiles of daily absorbed energy (Enabs, normalized by dz) at S16 including all absorbers (blue), without CDOM (red), and without TSM (orange).
The fate of heat that is trapped in the interior water column generally depends on the physical processes that dominate the ocean dynamics. For instance, Janout et al. (2016) discussed observations of warm (~0°C) waters near the seafloor due to downward mixing of summer-warmed near-surface waters by tidal mixing and other processes. The warm waters that are episodically observed in the interior water column by oceanographic moorings could well affect the sea ice cover if released toward the surface. However, whether warm waters are being released back to the surface or whether they are mixed with near-freezing shelf waters at depth remains unclear. In the Canada Basin of the Arctic Ocean, Timmermans (2015) found the presence of a near-surface temperature maximum, a solar-heated warm water mass stored under the mixed layer. By use of high-resolution measurements, Timmermans (2015) was able to identify the upward release of this heat and estimated that this process contributed 25% of sea ice loss.
When CDOM is removed in the simulation at S03 (other absorbers were kept), there is a decrease of ~76% in the Enabs in the upper 2 m of the water column (Table 4). Enabs by S01 is ~43% higher relative to S40, underlining the role of CDOM in the river influenced waters of the Laptev Sea. TSM presence also plays a notable role on how much energy is absorbed in the surface. But, even considering the highest TSM value measured in the field at S16 the concentration is not high enough to overcome the optical influence of CDOM on Enabs (Figure 8C).
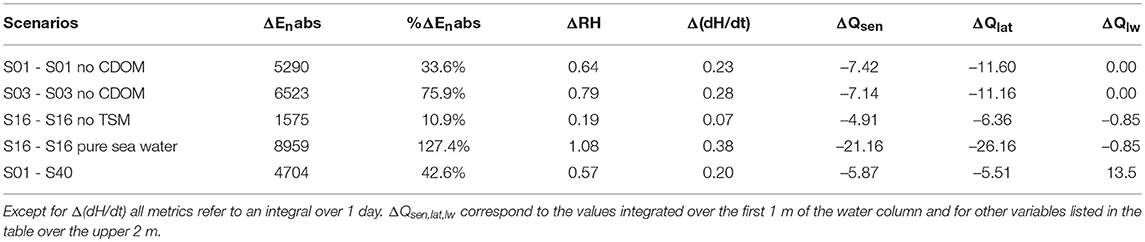
Table 4. Absorbed energy difference (ΔEnabs, KJ/m2) and relative difference (%ΔEnabs), radiative heating difference (ΔRH, °C), ice melting rate difference (Δ(dH/dt), mm/h), sensible (ΔQsen, W/m2), latent (ΔQlat, W/m2) heat flux, and net longwave radiation (ΔQlw, W/m2) differences for the selected scenarios.
The greater Enabs by CDOM and TSM increases the RH. There is a ΔRH of ~0.8°C in the top 2 m when aCDOM is included in the simulations at S03 and of ~0.2°C when TSM is included in the simulations at S16 (Table 4). A comparison between S01 and S40 shows an increased RH of ~0.6°C. The ΔRH induced by CDOM and TSM is the greatest in the upper meter of the water column at S01 and S16 and for both stations less energy is deposited at greater depths.
The net surface warming and possible steeper thermoclines may have a stabilizing effect that leads to more intense stratification and to lower mixed layer depths (MLD) as the surface becomes warmer and the underneath layer colder. This effect may be not prominent in the areas very close to Lena Delta that are under direct influence of the river outflow. However, surface heating may affect stratification in open ocean regions of the Laptev Sea and other regions in the Arctic. CDOM and TSM induced light attenuation at the surface limits the available energy in the MLD, leading to stronger stratification and less vertical turbulent mixing, with profound importance on primary productivity, ocean circulation, air-sea exchange, and sea-ice melting.
3.3.2. Sea Ice Melt and Atmosphere-Ocean Heat Flux
The potential contribution of CDOM to sea ice melt is ~0.3 mm/h at S03 (Table 4). In comparison, Δ(dH/dt) caused by energy absorption due to TSM is lower, ~0.1 mm/h at S16, whereas the combined effect of the water constituents leads to a Δ(dH/dt) of ~0.4 mm/h. In waters under the influence of the Lena River plume, there is an increase of 0.2 mm/h in the ice melt rate relative to the marine-influenced waters. Given the bio-optical influence on the radiative heating in the Laptev Sea, a future with an amplified Arctic could have consequences for sea ice melt and thus, Arctic and global climate.
The bio-optical influence on the SST also results in changes in the atmosphere-ocean heat exchange. If we consider that the measured in situ SST during both expeditions (Table 1) has been influenced by water constituents, the difference between observed in situ SST and ΔRH represents SST without bio-optical influence. In this case, for an air temperature of 6.7°C (average air temperature for the location and time of the measurements from ERA-Interim reanalysis) at S01 and S03, SST would be warmer than the overlying atmosphere in both cases, with and without the influence of CDOM and the sensible heat would be transferred from the ocean to the atmosphere (Table 4). At S16 on the other hand, in all scenarios the atmosphere is warmer than the ocean, but the presence of TSM and other bio-optical water constituents reduces the temperature gradient between ocean and atmosphere and also decreases the sensible heat uptake by the ocean. The effect of TSM leads to a ΔQsum of ~−12 W/m2 and, as could be expected, would lead to more oceanic heat uptake of ~48 W/m2 (ΔQsum) at S16 without any bio-optical effect. The small but positive value of ΔQlw by comparing S01 and S40 is likely due to the influence of salinity rather then CDOM and TSM in the RTM, but it needs to be further investigated.
3.4. Radiative Heating Distribution
By combining satellite remote sensing and RTM, we extend the study and investigate the spatial distribution of the radiative heating in the Laptev Sea for a summer day. The spatial patterns of Enabs, ΔRH and ΔQsum confirm that the water constituents have a significant influence on the radiative heating in the Laptev Sea surface waters. Here we only show the spatial distribution of ΔRH as the patterns are very similar for all three parameters because Enabs, ΔRH (Figure 9) and ΔQsum are related with each other (see Equations 4–7). The largest Enabs occurred over river-influenced waters where also the ΔRH and ΔQsum are higher as in our simulations. The values of ΔRH and heat fluxes could also be higher considering that the C2RCC underestimates aCDOM(443) in the Laptev Sea.
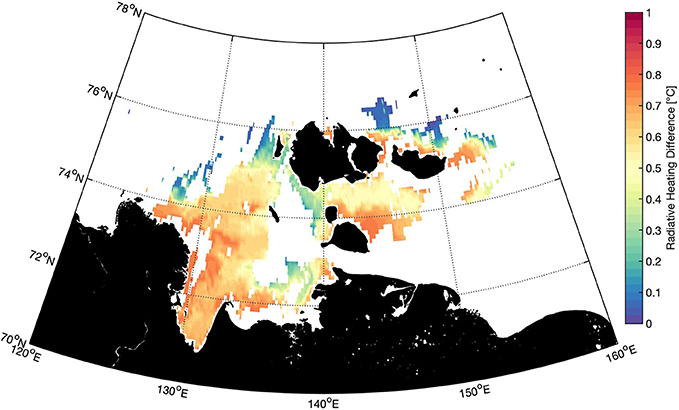
Figure 9. Spatial distribution of radiative heating difference (ΔRH, integrated over one day) of the Laptev Sea surface waters (upper 2 m) for August 4, 2010.
An analysis of the correlation between Enabs, aCDOM(443), TSM and Chla reveals a more complex nature of the relationship between the radiative heating and the water constituents that failed to be captured by point simulations (Figure 10). Although Enabs increases with increasing aCDOM(443), the relationship becomes less obvious with concentrations of TSM and Chla higher than 10 g/m3 and 3 mg/m3, respectively. As the concentration of TSM and Chla increases, also the size of these particles in the water increases and causes higher scattering and light attenuation in the water; evidence that should be supported by in situ observations in the future.
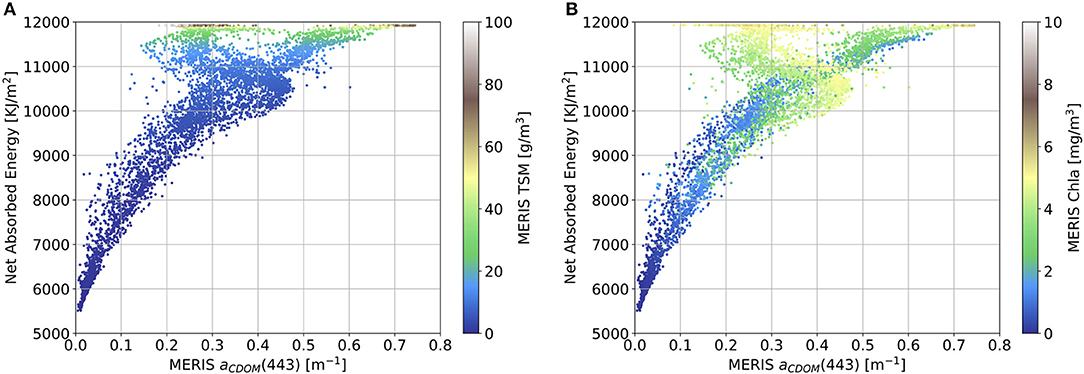
Figure 10. (A) Scatterplot of Enabs, aCDOM(443) and TSM. (B) Scatterplot of Enabs, aCDOM(443) and Chla.
4. Conclusions
The effect of optically active water constituents on the radiative heating of Laptev Sea shelf waters has been investigated with the combined effort of satellite remote sensing, RT modeling and in situ observations. The results show that the radiative heating of Laptev Sea surface waters is strongly influenced by the concentration of CDOM and TSM. The presence of optically active constituents leads to enhanced absorption and deposition of energy in the upper 2 m of the water column. Likewise, waters with a higher amount of CDOM/TSM show an increased sea ice melt rate compared to clearer waters and higher differences in the atmosphere-ocean heat flux. Hence, the presence of optically active water constituents in the Arctic can potentially strengthen the effect of Arctic amplification due to the positive feedback between near-surface water temperature, sea ice melt, precipitation. and river loads.
We have also shown that the lack of in situ measurements can be compensated to some extent by satellite information in connection with RTM; this is especially valuable for remote regions like the Laptev Sea. With the increased spatial resolution and temporal coverage of the region by the Sentinel 2 and Sentinel 3 satellite ocean color sensors, the spatial and temporal variability of radiative heating in this region should be investigated in future research projects. Newly developed algorithms such as the OLCI Neural Network Swarm–ONNS (Hieronymi et al., 2017) which is especially designed for different optical water classes could increase the performance of ocean color products in this region as well.
This study confirms that absorption of radiation by water constituents is an important parameter to be considered in Earth system models as it affects radiative heating, surface ocean temperatures, and the air-sea heat fluxes between the ocean and the atmosphere. The current generation of 3D coupled atmosphere-ocean models can neither capture nor spectrally resolve the necessary details of the relevant RT processes of different water constituents. This study is a step in this direction and the findings will lead us to improved parameterizations in coupled 3D modeling. A detailed and realistic representation of optical properties such as CDOM and TSM is necessary to accurately model coastal waters and shelf regions that are influenced by high river loads of optically active constituents.
Author Contributions
AB and MS: conceptualization. AB, MS, SL, and VP: methodology. JH and MJ: in situ data. VR, VP, SH, and TD: software. VP and MS: formal analysis, investigation, writing–original draft preparation, and visualization. All authors: writing–review & suggestions. AB: supervision.
Funding
We gratefully acknowledge the funding by the Deutsche Forschungsgemeinschaft (DFG, German Research Foundation)– Projektnummer 268020496–TRR 172, within the Transregional Collaborative Research Center ArctiC Amplification: Climate Relevant Atmospheric and SurfaCe Processes, and Feedback Mechanisms (AC)3 (Projects C3, B1, and B2). We also thank the funding by the Helmholtz Climate Initiative REKLIM (regional climate changes) and by the Federal Ministry of Economics and Technology (BMWi) and the German Aerospace Centre grant number 50 EE 1620. The long-term Russian-German TRANSDRIFT expeditions in the Laptev Sea region were supported by the German Federal Ministry of Education and Research project numbers (03G0833, 03F0776) and the Russian Ministry of Education and Science.
Conflict of Interest Statement
The authors declare that the research was conducted in the absence of any commercial or financial relationships that could be construed as a potential conflict of interest.
Acknowledgments
ESA is acknowledged for the MERIS satellite. The NASA EOSDIS Physical Oceanography Distributed Active Archive Center (PO.DAAC) at the Jet Propulsion Laboratory, Pasadena, CA, is acknowledged for the SST data. We thank the AERONET principal investigators for their effort in establishing and maintaining the Tiksi site.
References
Bailey, S. W., and Werdell, P. J. (2006). A multi-sensor approach for the on-orbit validation of ocean color satellite data products. Remote Sens. Environ. 102, 12–23. doi: 10.1016/j.rse.2006.01.015
Bauch, D., and Cherniavskaia, E. (2018). Water mass classification on a highly variable arctic shelf region: origin of laptev sea water masses and implications for the nutrient budget. J. Geophys. Res. Oceans 123, 1896–1906. doi: 10.1002/2017JC013524
Bauch, D., Hölemann, J. A., Nikulina, A., Wegner, C., Janout, M. A., Timokhov, L. A., et al. (2013). Correlation of river water and local sea-ice melting on the laptev sea shelf (siberian arctic). J. Geophys. Res. Oceans 118, 550–561. doi: 10.1002/jgrc.20076
Bintanja, R., and Andry, O. (2017). Towards a rain-dominated arctic. Nat. Clim. Change 7, 263–267. doi: 10.1038/nclimate3240
Blum, M., Rozanov, V., Burrows, J., and Bracher, A. (2012). Coupled ocean-atmosphere radiative transfer model in the framework of software package sciatran: selected comparisons to model and satellite data. Adv. Space Res. 49, 1728–1742. doi: 10.1016/j.asr.2012.02.012
Brockmann, C., Doerffer, R., Peters, M., Kerstin, S., Embacher, S., and Ruescas, A. (2016). “Evolution of the c2rcc neural network for sentinel 2 and 3 for the retrieval of ocean colour products in normal and extreme optically complex waters,” in Living Planet Symposium, vol. 740 (Prague), 54.
Bröder, L., Tesi, T., Salvadó, J. A., Semiletov, I. P., Dudarev, O. V., and Gustafsson, O. (2016). Fate of terrigenous organic matter across the laptev sea from the mouth of the lena river to the deep sea of the arctic interior. Biogeosciences 13, 5003–5019. doi: 10.5194/bg-13-5003-2016
Chang, G. C., and Dickey, T. D. (2004). Coastal ocean optical influences on solar transmission and radiant heating rate. J. Geophys. Res. Oceans 109:C01020 doi: 10.1029/2003JC001821
Dinter, T., Rozanov, V. V., Burrows, J. P., and Bracher, A. (2015). Retrieving the availability of light in the ocean utilising spectral signatures of vibrational raman scattering in hyper-spectral satellite measurements. Ocean Sci. 11, 373–389. doi: 10.5194/os-11-373-2015
Dmitrenko, I., Kirillov, S., Eicken, H., and Markova, N. (2005). Wind-driven summer surface hydrography of the eastern siberian shelf. Geophys. Res. Lett. 32:L14613 doi: 10.1029/2005GL023022
Gonçalves-Araujo, R., Rabe, B., Peeken, I., and Bracher, A. (2018). High colored dissolved organic matter (cdom) absorption in surface waters of the central-eastern arctic ocean: implications for biogeochemistry and ocean color algorithms. PLoS ONE 13:e0190838. doi: 10.1371/journal.pone.0190838
Granskog, M. A., Pavlov, A. K., Sagan, S., Kowalczuk, P., Raczkowska, A., and Stedmon, C. A. (2015). Effect of sea-ice melt on inherent optical properties and vertical distribution of solar radiant heating in arctic surface waters. J. Geophys. Res. Oceans 120, 7028–7039. doi: 10.1002/2015JC011087
Grosse, G., Goetz, S., McGuire, A. D., Romanovsky, V. E., and Schuur, E. A. (2016). Changing permafrost in a warming world and feedbacks to the earth system. Environ. Res. Lett. 11:040201. doi: 10.1088/1748-9326/11/4/040201
Haltrin, V. I. (1999). Chlorophyll-based model of seawater optical properties. Appl. Opt. 38, 6826–6832.
Haltrin, V. I. (2006). “Absorption and scattering of light in natural waters,” in Light Scattering Reviews (Chichester: Springer, PraxisPublishing), 445–486.
Heim, B., Abramova, E., Doerffer, R., Günther, F., Hölemann, J. A., Kraberg, A., et al. (2014). Ocean colour remote sensing in the southern laptev sea: evaluation and applications. Biogeosciences 11, 4191–4210. doi: 10.5194/bg-11-4191-2014
Hieronymi, M., Müller, D., and Doerffer, R. (2017). The olci neural network swarm (onns): a bio-geo-optical algorithm for open ocean and coastal waters. Front. Mar. Sci. 4:140. doi: 10.3389/fmars.2017.00140
Hill, V. J. (2008). Impacts of chromophoric dissolved organic material on surface ocean heating in the chukchi sea. J. Geophys. Res. Oceans 113:C07024 doi: 10.1029/2007JC004119
Holmes, R. M., McClelland, J. W., Peterson, B. J., Tank, S. E., Bulygina, E., Eglinton, T. I., et al. (2012). Seasonal and annual fluxes of nutrients and organic matter from large rivers to the arctic ocean and surrounding seas. Estuar. Coasts 35, 369–382. doi: 10.1007/s12237-011-9386-6
Janout, M., Hölemann, J., Juhls, B., Krumpen, T., Rabe, B., Bauch, D., et al. (2016). Episodic warming of near-bottom waters under the arctic sea ice on the central laptev sea shelf. Geophys. Res. Lett. 43, 264–272. doi: 10.1002/2015GL066565
Janout, M. A., Aksenov, Y., Hölemann, J. A., Rabe, B., Schauer, U., Polyakov, I. V., et al. (2015). Kara sea freshwater transport through vilkitsky strait: Variability, forcing, and further pathways toward the western arctic ocean from a model and observations. J. Geophys. Res. Oceans 120, 4925–4944. doi: 10.1002/2014JC010635
Kim, G. E., Gnanadesikan, A., and Pradal, M.-A. (2016). Increased surface ocean heating by colored detrital matter (cdm) linked to greater northern hemisphere ice formation in the gfdl cm2mc esm. J. Clim. 29, 9063–9076. doi: 10.1175/JCLI-D-16-0053.1
Kopelevich, O. (1983). Small-parameter model of optical properties of sea water. Ocean Opt. 1, 208–234.
Kutser, T. (2010). “Global change and remote sensing of cdom in arctic coastal waters,” in OCEANS 2010 IEEE-Sydney (SYDNEY: IEEE), 1–4.
Losa, S. N., Soppa, M. A., Dinter, T., Wolanin, A., Brewin, R. J. W., Bricaud, A., et al. (2017). Synergistic exploitation of hyper- and multi-spectral precursor sentinel measurements to determine phytoplankton functional types (synsenpft). Front. Mar. Sci. 4:203. doi: 10.3389/fmars.2017.00203
Matsuoka, A., Babin, M., Doxaran, D., Hooker, S. B., Mitchell, B. G., Bélanger, S., et al. (2014). A synthesis of light absorption properties of the arctic ocean: application to semianalytical estimates of dissolved organic carbon concentrations from space. Biogeosciences 11, 3131–3147. doi: 10.5194/bg-11-3131-2014
Matsuoka, A., Huot, Y., Shimada, K., Saitoh, S.-I., and Babin, M. (2007). Bio-optical characteristics of the western arctic ocean: implications for ocean color algorithms. Can. J. Remote Sens. 33, 503–518. doi: 10.5589/m07-059
McCarthy, J. J., Canziani, O. F., Leary, N. A., Dokken, D. J., and White, K. S. (2001). Climate Change 2001: Impacts, Adaptation, and Vulnerability: Contribution of Working Group II to the Third Assessment Report of the Intergovernmental Panel on Climate Change, Vol. 2. Cambridge University Press.
Morison, J., Kwok, R., Peralta-Ferriz, C., Alkire, M., Rigor, I., Andersen, R., et al. (2012). Changing arctic ocean freshwater pathways. Nature 481:66. doi: 10.1038/nature10705
Naval Oceanographic Office, N. O. O. (2018). Ghrsst Level 4 k10_sst Global 1 Meter Sea Surface Temperature Analysis. ver. 1.0. po.daac, ca, usa. Available online at: http://dx.doi.org/10.5067/GHK10-41N01 (accessed Feburary 27, 2018).
Örek, H., Doerffer, R., Röttgers, R., Boersma, M., and Wiltshire, K. H. (2013). Contribution to a bio-optical model for remote sensing of lena river water. Biogeosciences 10, 7081–7094. doi: 10.5194/bg-10-7081-2013
Pegau, W. S. (2002). Inherent optical properties of the central arctic surface waters. J. Geophys. Res. Oceans 107:8035 doi: 10.1029/2000JC000382
Peters, E., Wittrock, F., Richter, A., Alvarado, L. M. A., Rozanov, V. V., and Burrows, J. P. (2014). Liquid water absorption and scattering effects in doas retrievals over oceans. Atmos. Meas. Techniques 7, 4203–4221. doi: 10.5194/amt-7-4203-2014
Pope, R. M., and Fry, E. S. (1997). Absorption spectrum (380–700 nm) of pure water. ii. integrating cavity measurements. Appl. Opt. 36, 8710–8723.
Prieur, L., and Sathyendranath, S. (1981). An optical classification of coastal and oceanic waters based on the specific spectral absorption curves of phytoplankton pigments, dissolved organic matter, and other particulate materials 1. Limnol. Oceanogr. 26, 671–689.
Röttgers, R., McKee, D., and Utschig, C. (2014). Temperature and salinity correction coefficients for light absorption by water in the visible to infrared spectral region. Opt. Express 22, 25093–25108. doi: 10.1364/OE.22.025093
Rozanov, V., Dinter, T., Rozanov, A., Wolanin, A., Bracher, A., and Burrows, J. (2017). Radiative transfer modeling through terrestrial atmosphere and ocean accounting for inelastic processes: Software package sciatran. J. Quant. Spectrosc. Radiat. Transfer 194, 65–85. doi: 10.1016/j.jqsrt.2017.03.009
Rozanov, V., Rozanov, A., Kokhanovsky, A., and Burrows, J. (2014). Radiative transfer through terrestrial atmosphere and ocean: Software package SCIATRAN. J. Quant. Spectr. Radiat. Transfer 133, 13–71. doi: 10.1016/j.jqsrt.2013.07.004
Rozanov, V. V., Buchwitz, M., Eichmann, K.-U., de Beek, R., and Burrows, J. P. (2002). SCIATRAN - a new radiative transfer model for geophysical applications in the 240–2400 nm spectral region: the pseudo-spherical version. Adv. Space Res. 29, 1831–1835. doi: 10.1016/S0273-1177(02)00095-9
Segelstein, D. J. (1981). The Complex Refractive Index of Water. PhD thesis, University of Missouri, Kansas City, MO.
Selyuzhenok, V., Krumpen, T., Mahoney, A., Janout, M., and Gerdes, R. (2015). Seasonal and interannual variability of fast ice extent in the southeastern laptev sea between 1999 and 2013. J. Geophys. Res. Oceans 120, 7791–7806. doi: 10.1002/2015JC011135
Serreze, M. C., and Barry, R. G. (2011). Processes and impacts of arctic amplification: a research synthesis. Global Planet. Change 77, 85–96. doi: 10.1016/j.gloplacha.2011.03.004
Smith, R. C., and Baker, K. S. (1981). Optical properties of the clearest natural waters (200–800 nm). Appl. Opt. 20, 177–184. doi: 10.1364/AO.20.000177
Sogandares, F. M., and Fry, E. S. (1997). Absorption spectrum (340–640 nm) of pure water. i. photothermal measurements. Appl. Opt. 36, 8699–8709. doi: 10.1364/AO.36.008699
Stedmon, C., Amon, R., Rinehart, A., and Walker, S. (2011). The supply and characteristics of colored dissolved organic matter (cdom) in the arctic ocean: pan arctic trends and differences. Mar. Chem. 124, 108–118. doi: 10.1016/j.marchem.2010.12.007
Timmermans, M.-L. (2015). The impact of stored solar heat on arctic sea ice growth. Geophys. Res. Lett. 42, 6399–6406. doi: 10.1002/2015GL064541
Wegner, C., Hölemann, J. A., Dmitrenko, I., Kirillov, S., and Kassens, H. (2005). Seasonal variations in arctic sediment dynamics—evidence from 1-year records in the laptev sea (siberian arctic). Global Planet. Change 48, 126–140. doi: 10.1016/j.gloplacha.2004.12.009
Wolanin, A., Rozanov, V., Dinter, T., and Bracher, A. (2015a). Detecting CDOM Fluorescence Using High Spectrally Resolved Satellite Data: A Model Study. Cham: Springer International Publishing, 109–121.
Wolanin, A., Rozanov, V., Dinter, T., Noël, S., Vountas, M., Burrows, J., et al. (2015b). Global retrieval of marine and terrestrial chlorophyll fluorescence at its red peak using hyperspectral top of atmosphere radiance measurements: feasibility study and first results. Remote Sens. Environ. 166, 243–261. doi: 10.1016/j.rse.2015.05.018
Keywords: radiative transfer modeling, remote sensing, MERIS, heat budget, optically active water constituents, CDOM, TSM, Arctic
Citation: Soppa MA, Pefanis V, Hellmann S, Losa SN, Hölemann J, Martynov F, Heim B, Janout MA, Dinter T, Rozanov V and Bracher A (2019) Assessing the Influence of Water Constituents on the Radiative Heating of Laptev Sea Shelf Waters. Front. Mar. Sci. 6:221. doi: 10.3389/fmars.2019.00221
Received: 26 October 2018; Accepted: 09 April 2019;
Published: 15 May 2019.
Edited by:
Sergio M. Vallina, Instituto Español de Oceanografía (IEO), SpainReviewed by:
Moritz Mathis, Max-Planck-Institut für Meteorologie, GermanyGang Li, South China Sea Institute of Oceanology (CAS), China
Copyright © 2019 Soppa, Pefanis, Hellmann, Losa, Hölemann, Martynov, Heim, Janout, Dinter, Rozanov and Bracher. This is an open-access article distributed under the terms of the Creative Commons Attribution License (CC BY). The use, distribution or reproduction in other forums is permitted, provided the original author(s) and the copyright owner(s) are credited and that the original publication in this journal is cited, in accordance with accepted academic practice. No use, distribution or reproduction is permitted which does not comply with these terms.
*Correspondence: Mariana A. Soppa, msoppa@awi.de