Leveraging Automated Image Analysis Tools to Transform Our Capacity to Assess Status and Trends of Coral Reefs
 Ivor D. Williams1*
  Courtney S. Couch1,2
  Oscar Beijbom3,4
  Thomas A. Oliver1
  Bernardo Vargas-Angel1,2
  Brett D. Schumacher5 Russell E. Brainard1
- 1Ecosystem Sciences Division, Pacific Islands Fisheries Science Center, National Oceanic and Atmospheric Administration (NOAA), Honolulu, HI, United States
- 2Joint Institute for Marine and Atmospheric Research, University of Hawai’i at Mānoa, Honolulu, HI, United States
- 3Global Change Institute, The University of Queensland, St Lucia, QLD, Australia
- 4Berkeley Artificial Intelligence Research, University of California, Berkeley, Berkeley, CA, United States
- 5Sustainable Fisheries Division, Pacific Islands Regional Office, National Oceanic and Atmospheric Administration, Honolulu, HI, United States
Digital photography is widely used by coral reef monitoring programs to assess benthic status and trends. In addition to creating a permanent archive, photographic surveys can be rapidly conducted, which is important in environments where bottom-time is frequently limiting. However, substantial effort is required to manually analyze benthic images; which is expensive and leads to lags before data are available. Using previously analyzed imagery from NOAA’s Pacific Reef Assessment and Monitoring Program, we assessed the capacity of a trained and widely used machine-learning image analysis tool – CoralNet coralnet.ucsd.edu – to generate fully-automated benthic cover estimates for the main Hawaiian Islands (MHI) and American Samoa. CoralNet was able to generate estimates of site-level coral cover for both regions that were highly comparable to those generated by human analysts (Pearson’s r > 0.97, and with bias of 1% or less). CoralNet was generally effective at estimating cover of common coral genera (Pearson’s r > 0.92 and with bias of 2% or less in 6 of 7 cases), but performance was mixed for other groups including algal categories, although generally better for American Samoa than MHI. CoralNet performance was improved by simplifying the classification scheme from genus to functional group and by training within habitat types, i.e., separately for coral-rich, pavement, boulder, or “other” habitats. The close match between human-generated and CoralNet-generated estimates of coral cover pooled to the scale of island and year demonstrates that CoralNet is capable of generating data suitable for assessing spatial and temporal patterns. The imagery we used was gathered from sites randomly located in <30 m hard-bottom at multiple islands and habitat-types per region, suggesting our results are likely to be widely applicable. As image acquisition is relatively straightforward, the capacity of fully-automated image analysis tools to minimize the need for resource intensive human analysts opens possibilities for enormous increases in the quantity and consistency of coral reef benthic data that could become available to researchers and managers.
Introduction
The scale and severity of threats to coral reefs have increased substantially in recent years (Burke et al., 2011; De’ath et al., 2012; Hughes et al., 2018a). Local stressors, such as land-based pollution, crown-of-thorns seastar predation, disease outbreaks, over-exploitation, and destructive fishing practices have caused significant localized reef decline (Edinger et al., 1998; Fabricius, 2005; Miller et al., 2009). Additionally, coral reefs have recently experienced consecutive years of thermal stress and mass coral bleaching resulting in widespread coral mortality (Heron et al., 2016; Couch et al., 2017; Hughes et al., 2018a,b). Given the speed of change and the increasing severity of threats, scientists and managers need the capability to rapidly assess coral reef status, ideally over large areas, and to quantify change. In addition, broad-scale data on benthos are critical to understanding drivers of change and identifying management responses that promote or undermine coral reef resilience, i.e., the ability to resist or recover from stressors (Maynard et al., 2010; McClanahan et al., 2012).
While a variety of metrics are used to assess coral reef status and trends, the majority of coral reef surveys and monitoring programs gather information on percent cover of benthic organisms, particularly coral cover (De’ath et al., 2012; Johansson et al., 2013). During the last 30 years, many benthic monitoring programs have transitioned from in situ measurements of benthic cover to some form of photographic survey, such as photo-transects and video surveys. These approaches not only create a permanent archive suitable for subsequent analysis, but also tend to greatly reduce in-water survey time, which is frequently constraining for underwater visual surveys. In combination with photographic surveys, utilization of towed divers, diver propulsion systems, and autonomous underwater vehicles can facilitate considerable expansion of spatial coverage (Armstrong et al., 2006; Williams et al., 2010; González-Rivero et al., 2014). However, the concomitant post-survey burden associated with extracting data from the acquired imagery is a major drawback of photographic survey approaches. Images gathered from those types of surveys have typically been manually analyzed using point annotation software, such as Coral Point Count with Excel extensions (CPCe), photoQuad, pointCount99, PhotoGrid, or Biigle (Porter et al., 2001; Kohler and Gill, 2006; Trygonis and Sini, 2012; Langenkämper et al., 2017). As manual annotation of imagery is time-consuming and thus expensive, this not only limits the amount of survey data that can feasibly be analyzed, but can also lead to significant lags before survey results become available. Additionally, variability in performance among human analysts, which can be non-trivial for some groups of benthos, is a potential source of bias (Beijbom et al., 2015; González-Rivero et al., 2016).
Recent advances in automated image analysis suggest that there is scope for a substantial portion of the image-analysis workload to be automated using machine-learning tools. During the last decade, several programs have been developed to automate point classification of benthic imagery (Marcos et al., 2005; Stokes and Deane, 2009; Shihavuddin et al., 2013; Beijbom et al., 2015). The most widely used of those, at least for coral reef surveys, is CoralNet1, which includes an online repository, a tool that allows the user to manually-annotate imagery and machine-learning algorithms to fully- or partially-automate classification of benthic imagery once sufficient data are available to train the system (Beijbom et al., 2015).
In the first (alpha) version of CoralNet, image features based on texture and color were extracted from imagery and then classified by a Support Vector Machine (Beijbom et al., 2015). The performance of that version was assessed by comparing automatically generated benthic point data against data generated by a number of human annotators. Compared to human analysts, the accuracy of automatically generated benthic point data varied considerably among different benthic categories – with 62% accuracy for coral and 28–48% for algal groups: macroalgae, turf, and crustose coralline algae (CCA). This was significantly lower than the accuracy of human annotators when compared to the same annotators’ previous annotations, and in comparison to other human annotators analyzing the same sets of imagery. In late 2016, an updated (beta) version of CoralNet was released. This version relies on Deep Learning, which has replaced hand-crafted features for almost all computer vision tasks and revolutionized the field (LeCun et al., 2015). In the beta version of CoralNet, accuracy (i.e., agreement with reference annotations) of the automated classifier “robot” increased to 80% for corals and 48–66% for algal groups, such as macroalgae, turf, and CCA. Those levels of accuracy are comparable to what are typically achieved by different human analysts manually annotating the same points (Beijbom unpubl. data).
However, despite improved classification in the beta version, and widespread usage of CoralNet as an image analysis and archiving tool, few users utilize any level of automation in CoralNet analysis. Specifically, as of July 2018, CoralNet users had uploaded 822 data sets consisting of over 700,000 images to CoralNet, but few users make use of any form of automation, and half of those that do only permit CoralNet to annotate points when the “robot” (i.e., automated-analysis algorithm) is at least 90% certain of a classification.
Here, we aim to build on previous studies of CoralNet by assessing and refining its use in its current (beta) form as an automated analysis tool for a large-scale survey and monitoring program. The data and imagery we use come from NOAA’s Pacific Reef Assessment and Monitoring Program (Pacific RAMP) which has surveyed coral reefs at approximately 40 islands and atolls across the US-affiliated Pacific since the early 2000s. For that program, survey sites are randomly located in diverse hard bottom habitats and water depths around multiple islands in each region and, therefore, span wide ranges of habitat structure, exposure, and light availability – factors which affect benthic assemblage structure as well as color and organism morphology, thus adding complexity to automated classification (Glynn, 1976; Dollar, 1982; Salih et al., 2000). Specifically, we utilize previously human-analyzed imagery from two regions – American Samoa and Hawaii – to train CoralNet systems and test the ability of the resulting trained robots to: (1) fully-automatically generate estimates of benthic cover for different functional groups and coral genera; (2) compare fully-automatically generated site- and island-scale estimates of cover against those generated by human analysts for different habitat types and regions; and (3) assess the impacts of using different benthic classification schemes of varying complexity.
Materials and Methods
Source of Benthic Imagery, Survey Methods and Design
The imagery and benthic data used in this study were gathered by NOAA’s Pacific Islands Ecosystem Sciences Division (ESD) for the Pacific RAMP, which is part of the US National Coral Reef Monitoring Program (NCRMP) (NOAA Coral Program, 2014). In its current form, Pacific RAMP visits and surveys regions and islands once or twice every 3 years. During each survey visit, sites around each island are randomly located within three depth strata comprising all hard bottom habitats in <30 m of water, with primary focus on fore reef habitats. Back reef and lagoon habitats are also surveyed, but much less intensively. Survey sites encompass substantial variability in habitat type (including rock/boulder, and pavement habitats), reef condition, benthic assemblages, and coral cover (ranging from 0 to >70% in each region), as well as in environmental factors that influence image quality, such as water depth and turbidity.
Survey data and imagery used in this study come from two regions: the main Hawaiian Islands (MHI) and American Samoa (Figure 1), those being regions with relatively low and relatively high coral diversity, respectively. MHI imagery was gathered between 2010 and 2015, and American Samoa sites from 2015. The number of sites per island and year are shown in Table 1.
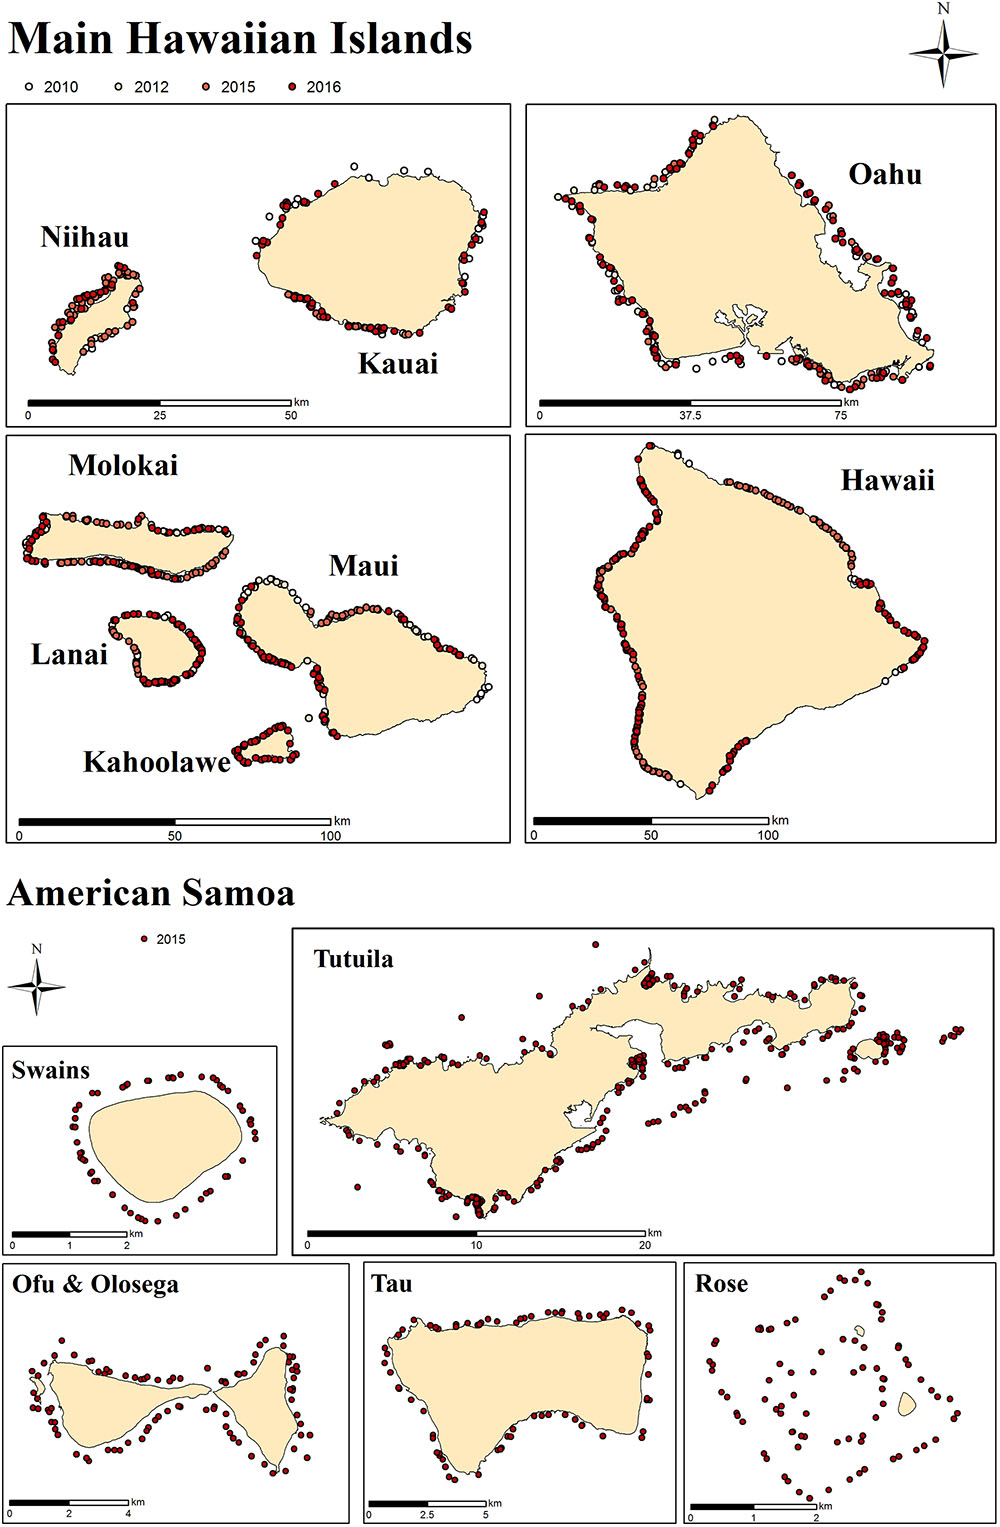
Figure 1. Survey sites in MHI and American Samoa. Each dot represents a survey site. At each site, 30 planar benthic photographs were taken by survey divers from ∼1 m above the substrate.
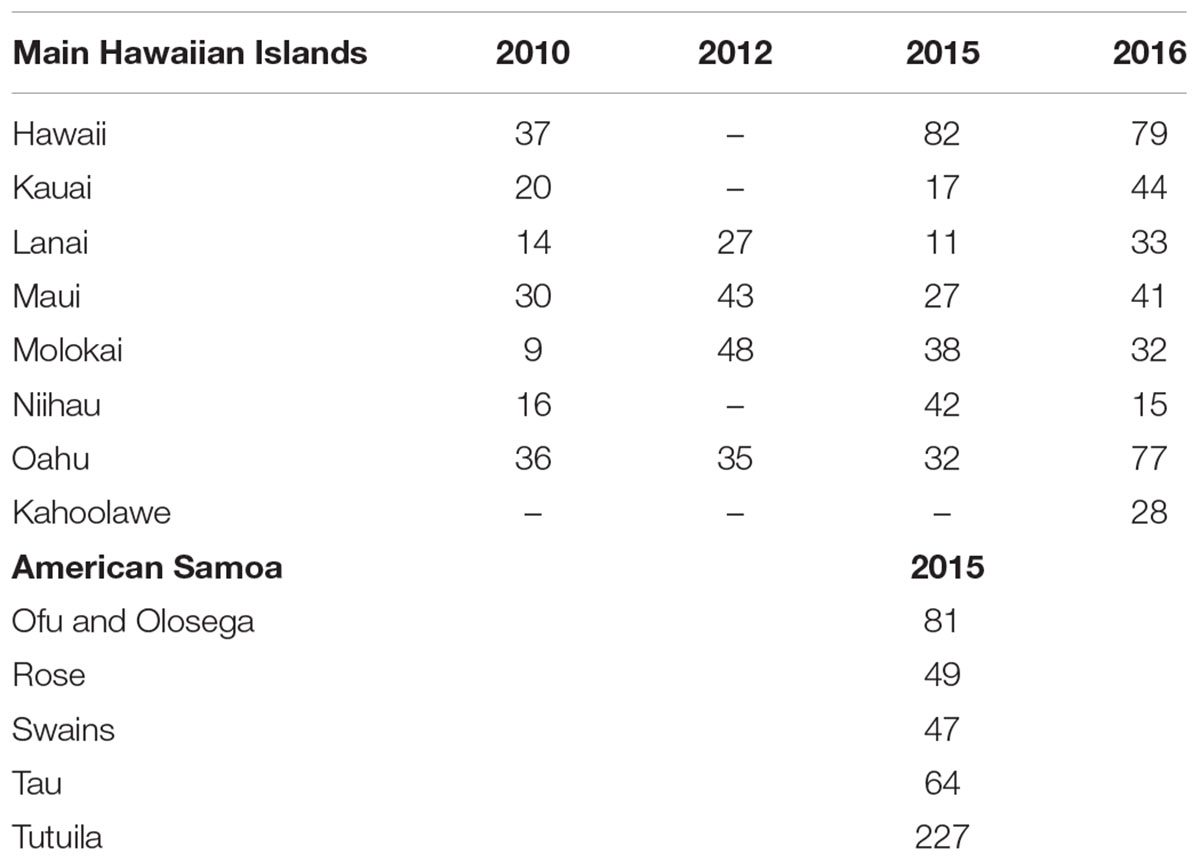
Table 1. Number of survey sites per island per year.
At each site, a total of 30 benthic images were captured along 1 or 2 transect lines with a total combined length of 30 m (1 photograph per meter). Photos were taken with digital cameras, maintained at a standard height above the substrate using a 1-m PVC monopod. No artificial lighting was used; instead cameras were manually white balanced by divers immediately before they began the photo-transect. Details of cameras and settings are provided in Supplementary Table S1. More detail on survey design and methods are available elsewhere (Heenan et al., 2017; Swanson et al., 2018).
Previous Annotation of Imagery by Human Analysts
Benthic images used in this study had been previously annotated by human analysts, all of whom were trained in identification of benthic organisms and had passed a data quality test. Analysts identified benthic organisms under 10 randomly-located points per image (totaling 300 points per site). Coral Point Count with Excel extensions (Kohler and Gill, 2006) (CPCe) was used to analyze MHI imagery from 2010 and 2012, and CoralNet for all other images (Lozada-Misa et al., 2017). Images annotated with CoralNet used the “ORIGINAL” classification scheme (Supplementary Table S2), which required analysts to identify corals to genus or a combination of genus and growth form for select genera (Montipora, Pavona, and Porites), macroalgae to genus, and other benthic features to functional group or higher-level taxonomic grouping (e.g., “sand,” “sponge,” “turf algae”) (Lozada-Misa et al., 2017). Images analyzed with CPCe were analyzed using similar schemes, but with corals only identified to growth-form for 2010 imagery. Imagery was arbitrarily assigned to different human analysts within a pool of trained analysts – 11 for MHI, and 8 for American Samoa.
Training and Testing CoralNet
Although CoralNet can be used solely as a tool for manual annotation imagery, its greater potential comes from its machine-learning capabilities, which allow trained CoralNet systems to automatically annotate additional imagery (Beijbom et al., 2015). For this study, we used data from imagery that had previously been manually-annotated in CoralNet to generate training and test sets in order to assess the ability of CoralNet (beta) to automatically estimate benthic cover.
CoralNet allows users to organize images into “sources” (i.e., a set of images and an associated benthic classification scheme). Sources are defined at the discretion of the user, but would typically be based on geography, habitat, depth zone, or other characteristic that would lead users to group a set of images together and apply a common benthic classification scheme. ESD created region-specific sources – e.g., one for MHI and another for American Samoa. A key consideration when defining a source is that the CoralNet machine-learning algorithm operates within a source. Thus, identification of a point as being of the coral genus Pocillopora in the MHI source would contribute to the training of the MHI “robot,” but it would not at all affect the training of robots in other sources.
We created two sources for this analysis: one for American Samoa, using imagery from 468 sites, and one for MHI, with imagery from 913 sites. All the American Samoa imagery and 598 of the MHI images had been previously manually analyzed in CoralNet (Table 1). Those existing manual annotations formed the basis of our training sets, i.e., they were used to train CoralNet “robots” in our new sources. As noted above, the other MHI images (from 2010 and 2012) had not been analyzed using CoralNet and had used slightly different classification schemes. Therefore, data from those images could not be included in the training sets. We nevertheless included those images in the MHI source so we could compare functional-group cover (e.g., “coral,” “turf”) generated from those images by trained CoralNet systems against values from the earlier manual annotation.
We downloaded and uploaded point annotations to and from CoralNet in “annotation files,” which included the filename, x-y coordinates within image, annotation-value (i.e., classification of each point), and annotator-identifier for each of the 10 points on each image. From the original CoralNet human-analyst annotations, we generated paired training sets, retaining the original annotations for one half of the training imagery, and setting annotations for the other points to blanks. Having paired training sets allowed us to successively train CoralNet on one half of the previously analyzed imagery within a source and then let CoralNet automatically annotate the remaining imagery. As the CoralNet robot was initialized between each run, we were able to combine the automatically-annotated data from the two runs in each pair to generate a complete set of fully-automated annotations for a source. Importantly, this meant that CoralNet robots were never trained on the points that they subsequently automatically annotated. As each training set included half of the suitable images, the full American Samoa training set included annotations from 70,200 points (half of 468 sites × 30 images × 10 points), and each full MHI training set included annotations from 89,700 points.
For each source, we trained and tested CoralNet for three variations of the classification scheme, (Supplementary Table S2): the relatively complex “ORIGINAL” scheme, which has the finest resolution of classification, with 85 distinct benthic classes (65 used for MHI); the SIMPLER scheme, in which corals and macroalgae were pooled to a smaller number of classes (32 in American Samoa, 31 in MHI), based on growth form for corals and division for macroalgae (e.g., red, green, brown algae), but with some common and relatively distinct genera retained (among corals: Porites, Pocillopora, Montipora in MHI; those plus Acropora in Samoa; and, among macroalgae: Halimeda in American Samoa); and “BASE” (14 classes), in which benthos was pooled to functional group – e.g., “all coral”; “all macroalgae.”
As there was great variability among sites in habitat types within our broad survey domains, particularly in MHI, we trained and tested the MHI BASE scheme separately within four habitat types which had been recorded at the time of the surveys, using an explicit classification scheme (Ayotte et al., 2015). Those habitat types were: “aggregate reef,” which are continuous and generally structurally-complex habitats with conspicuous cover of corals; “pavement,” which are relatively flat habitats with low and patchy coral cover; “rock-boulder,” which are complex, frequently basalt habitats with highly variable coral cover, and for all “other” habitats. There were respectively 188, 167, 159, and 84 sites within each of those habitat types that were used for training. The great majority of American Samoa sites were classified as aggregate reef; therefore, there was no clear reason to filter those by habitat. Instead, images from American Samoa were separately trained and tested with the BASE classification for each of the five islands (Table 1).
Data Synthesis and Analysis
Manually-annotated (“human-analyst”) and fully machine-annotated (“CoralNet”) point data were pooled to site-level percent cover estimates. Bland-Altman plots (Bland and Altman, 1986) were used to compare and visualize the human-analyst and CoralNet estimates of benthic cover. Specifically, those show site-level differences between the two estimates plotted against the site-level mean of the two methods. To quantify the performance of different schemes, we calculated the mean and standard deviation of site-level differences in cover between the two types of annotation.
In order to compare human-analyst and CoralNet performance at scales that are likely more relevant to many monitoring programs, site-level data were pooled by island and year (henceforth “island-year”) using a standard approach to generate higher-level data from the stratified-random design, i.e., mean and variance per strata were weighted by the size of the strata to generate island-scale values (Heenan et al., 2017). The extent and significance of the differences in cover for all possible island-year pairs were calculated and compared between the two annotation methods. By doing so, we assessed whether we would draw different conclusions about spatial and temporal patterns among island-years from CoralNet and human-analyst cover estimates. Specifically, for the MHI, we had data from 4 to 8 islands in each of the 4 years (Table 1) – leading to 325 pairwise island-year combinations (e.g., between Oahu 2012 and Oahu 2015; or between Oahu 2012 and Maui 2015). For American Samoa, there were only data from five islands in a single year, and thus 10 possible island-year pairs. For each method, the mean and standard error of difference in cover between all possible island-year pairs were calculated as follows (with “ISL1” and “ISL2” being the two island and year combinations in a pair):
We converted standard error of difference to 95% confidence intervals using the t-distribution for the degrees of freedom of the island-year pair (NISL1 + NISL2 – 2). We considered 95% confidence interval of difference not overlapping zero as evidence of significant difference at alpha of 0.05.
Finally, in order to visualize the impact of training set size on site-level consistency between annotations methods, we calculated the mean difference between human-analyst and CoralNet cover estimates for all test runs and plotted that against the size of the test run training set (i.e., how many annotated points were included in that training set). Human-analyst and CoralNet data used in this study are provided in the Supplementary Materials.
Results
Site-Scale Coral Cover Estimates
For both MHI and American Samoa sites, human-analyst, and CoralNet coral cover estimates were strongly correlated (Pearson’s r > 0.97) for all training schemes However, in both regions, statistical fits were better, i.e., differences between annotation methods were reduced and fit closer to 1:1 line in the more simplified training schemes (Figure 2). For MHI sites, the best fit was for the “BASE-HABITAT” training scheme, i.e., using the BASE classification with sites trained and automatically annotated separately for each habitat type, for which the mean of CoralNet minus human-analyst coral cover estimates was -0.6 ± 3.4% (mean ± standard deviation, Figure 2). Among those MHI habitat types, the fit between human-analyst and CoralNet coral cover estimates was notably better for aggregate reef sites than for sites in other habitat types (Figure 3). For American Samoa sites, the best fit was for the BASE scheme – benthos classified to broad functional groups for which the mean difference between CoralNet and human-analyst site level estimates was 1.0 ± 2.7%. Separately training and automatically analyzing American Samoa sites by island (“BASE-ISLAND” scheme) marginally worsened the fit.
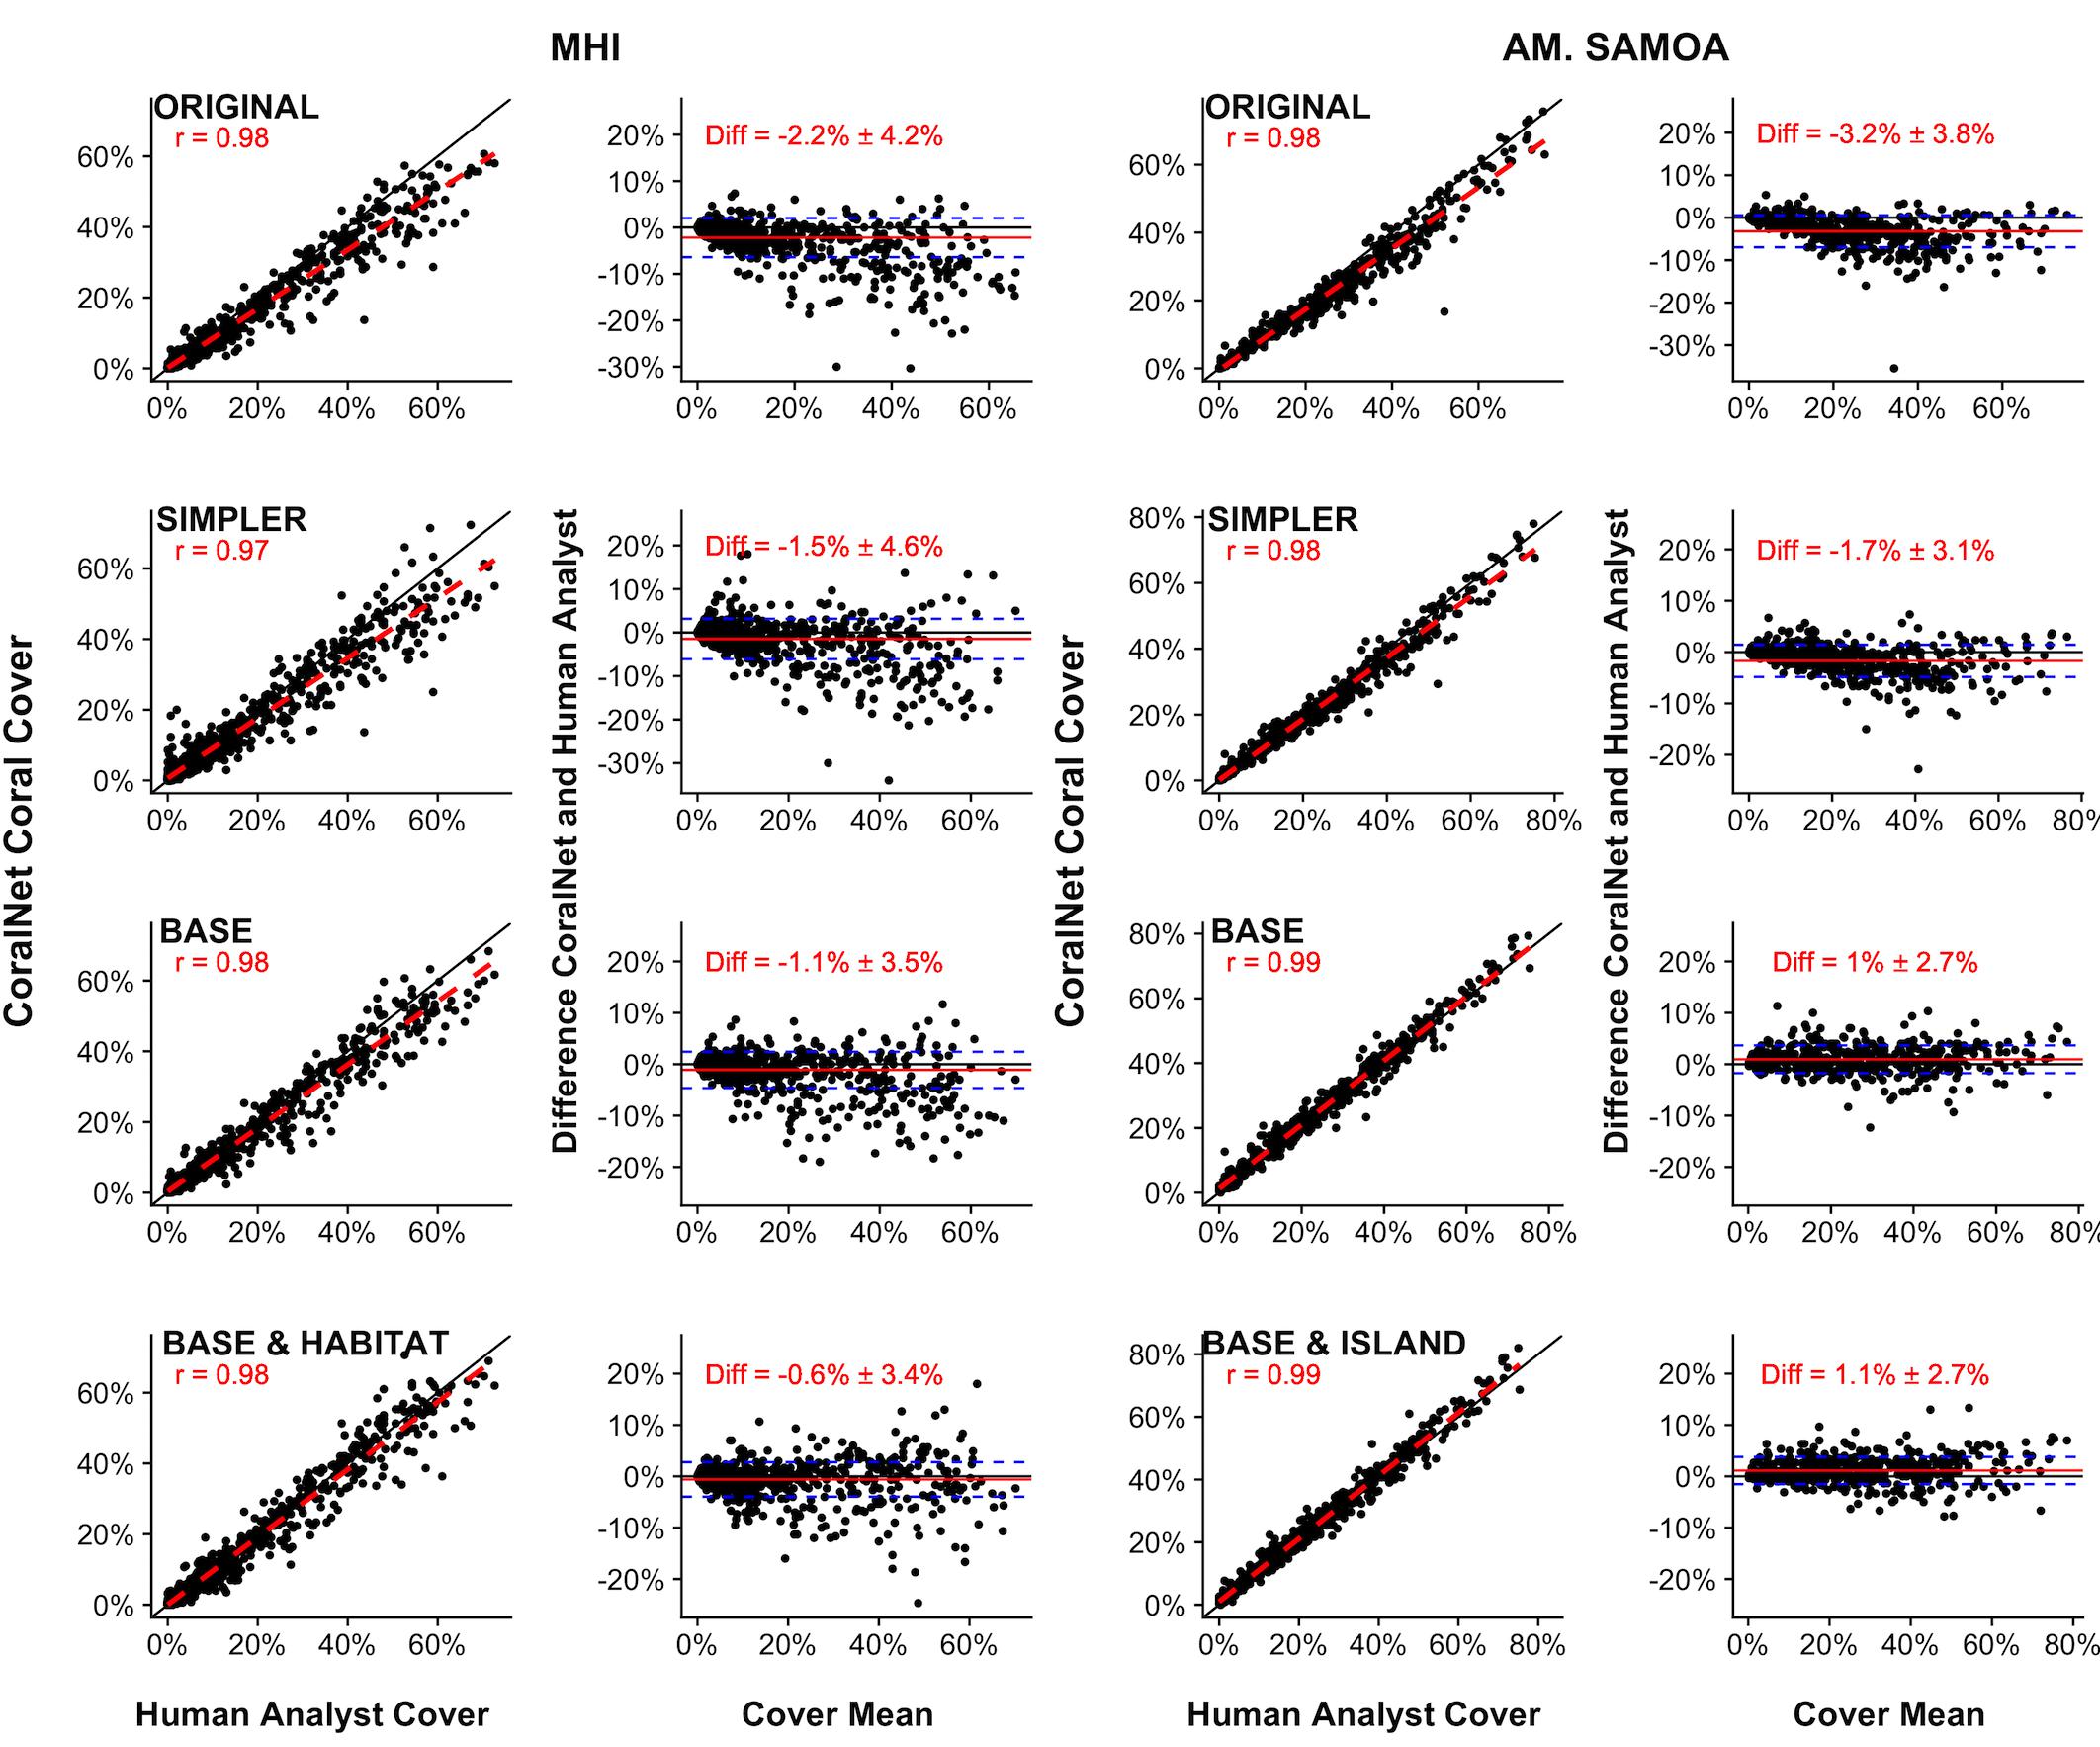
Figure 2. Site-level coral cover by human analysts and CoralNet for different classification and training schemes. For each pair of figures, each point in the left-hand figures is a single site; the solid black line is the 1:1 line, the dashed red line is a linear fit of the point data, and “r” value shown is Pearson’s correlation. Each point in the right-hand figures is the difference between CoralNet and human-analyst cover estimates at a site, plotted against the mean of cover from the two annotation methods. The red horizontal line is the mean of the site-level difference in cover; and the blue dashed lines represent mean ±1 standard deviation (SD). Training schemes are defined in Supplementary Table S2, but go from most complex (“ORIGINAL,” in which corals and macroalgae are generally identified to genus and below) to most simplified (“BASE,” in which benthos is analyzed to functional group only). The bottom row represents schemes in which CoralNet was trained using the BASE classification but with sites filtered by habitat type for MHI (“BASE-HABITAT”) and by island for American Samoa (“BASE-ISLAND”) (Supplementary Table S2). Total number of sites is 598 for MHI, and 468 for American Samoa. Correlations are significant (p < 0.0001) in all cases.
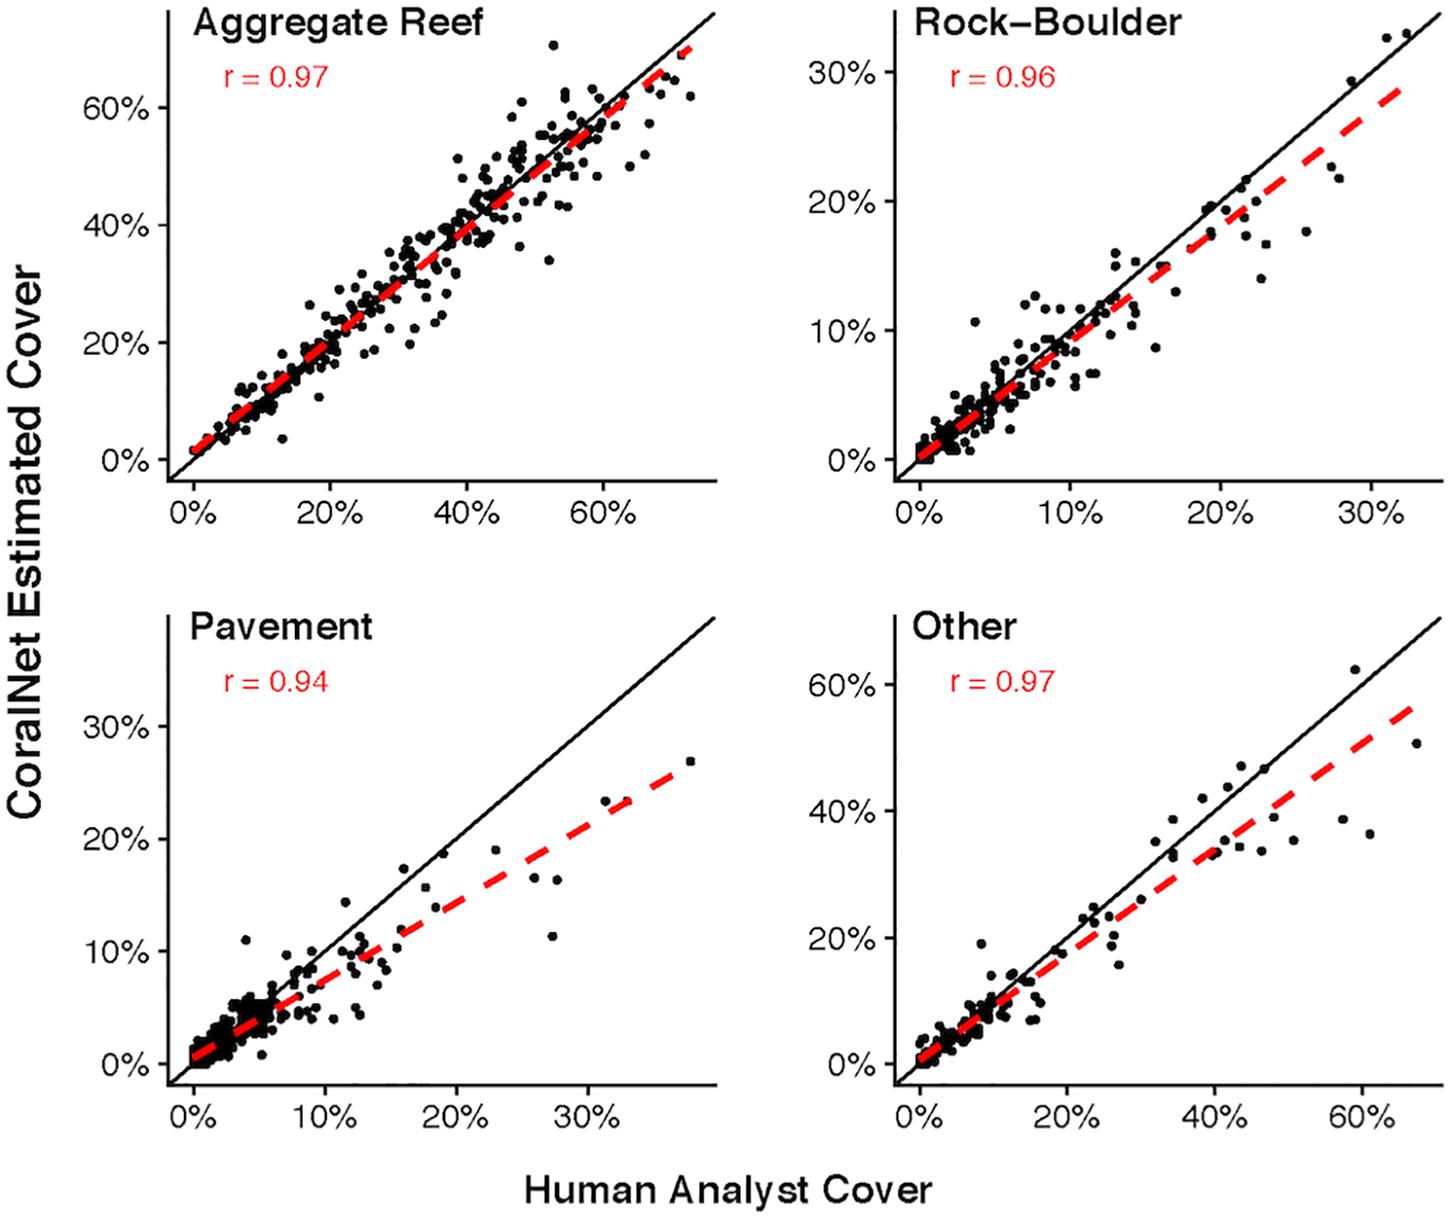
Figure 3. MHI Site-level coral cover by human analysts and CoralNet within different habitat types. Each point represents a single site; the solid black line is the 1:1 line, and the dashed red line is a linear fit of the point data. Results are for CoralNet trained using the “BASE” classification (Supplementary Table S2). “r” values are Pearson’s correlation coefficients. Number of sites per habitat type are: 188 for aggregate reef; 167 for pavement; 159 for rock-boulder; and 84 for other habitats. Correlations are significant (p < 0.0001) in all cases.
The capacity of CoralNet to generate estimates of cover of common coral genera varied between regions and among genera (Figure 4). For MHI sites, relative to human-analysts, CoralNet generated similar estimates of Porites cover (Pearson’s r = 0.98, difference: 0.1 ± 2.2%), tended to underestimate Montipora cover (Pearson’s r = 0.92, difference: -1.7 ± 5.7%), and was least well correlated with Pocillopora (Pearson’s r = 0.81, difference: -0.1 ± 1.1%). In contrast, for the four genera we assessed at American Samoa sites, CoralNet, and human-analyst cover estimates were strongly correlated (Pearson’s r > 0.95) and otherwise in relatively good agreement – the highest difference between CoralNet and human-analyst cover was 1.1 ± 2.7% for Montipora.
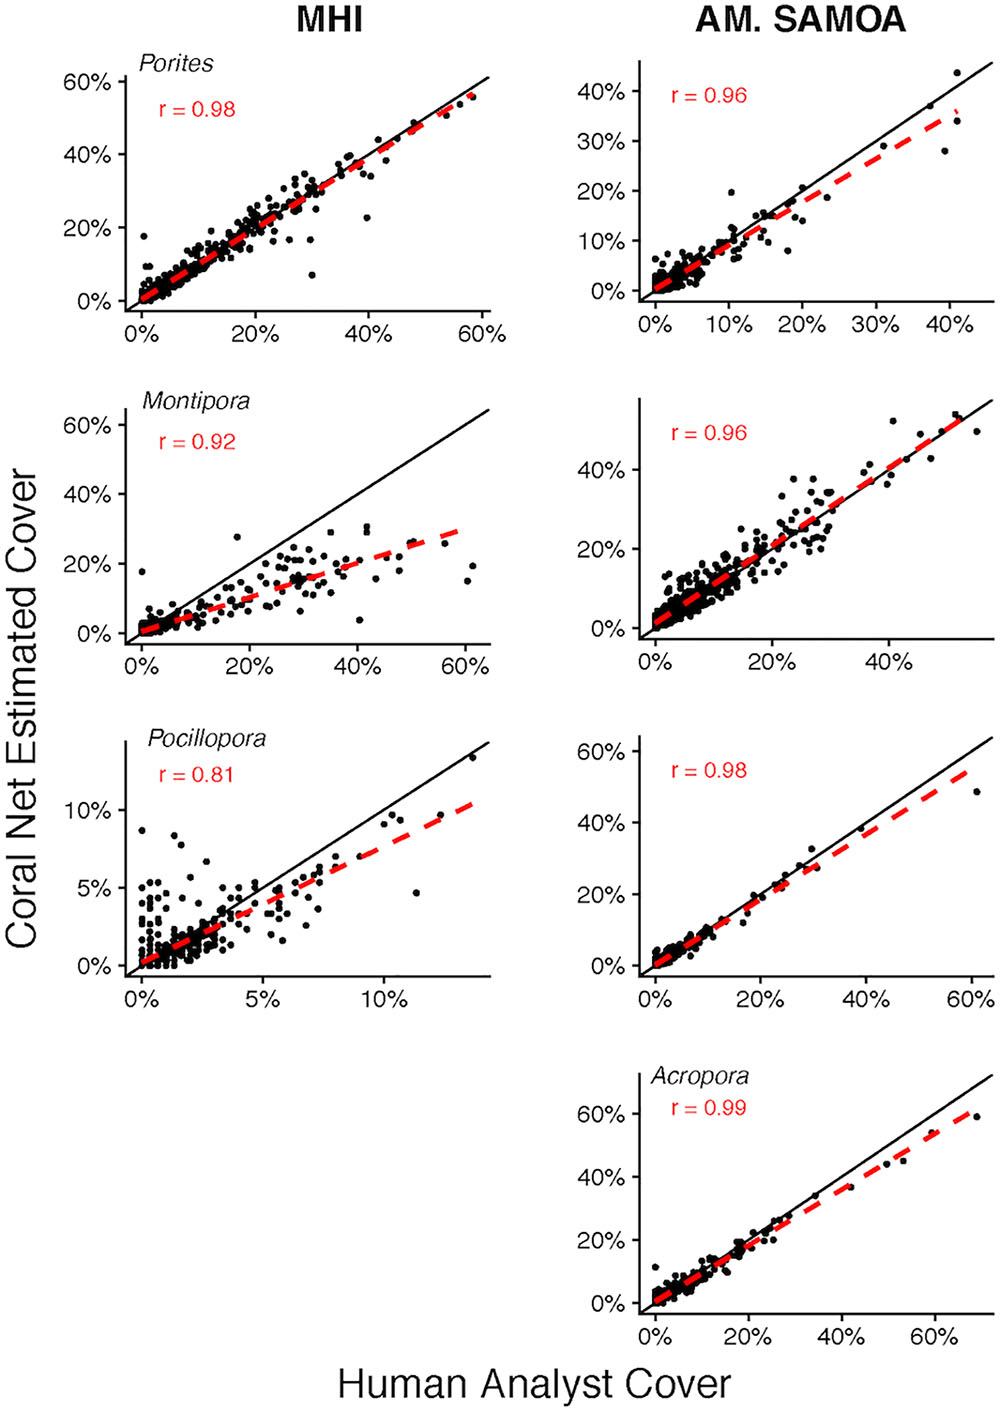
Figure 4. Site-level coral cover of common genera by human analyst and CoralNet. Figures in the left column are for MHI sites, and in the right column for American Samoa. Each point represents a single site; the solid black line is the 1:1 line, and the dashed red line is a linear fit of the point data. Acropora were not recorded at MHI sites. CoralNet was trained using the “SIMPLER” classifications (Supplementary Table S2). “r” values are Pearson’s correlation coefficients. Total number of sites is 598 for MHI, and 468 for American Samoa. Correlations are significant (p < 0.0001) in all cases.
Site-Scale Estimates of Other Benthos
CoralNet performance for other broad benthic categories: macroalgae, CCA, sand/sediment, and turf, varied considerably between regions (Figure 5). For MHI sites, CoralNet tended to substantially overestimate turf cover (difference: 10.9 ± 10.0%), the dominant component of benthos at many MHI sites, and underestimate other categories compared with human analysts (Figure 5). In contrast, CoralNet and human-analyst cover estimates of those groups were fairly consistent for American Samoa sites, particularly for CCA, which was abundant in that region (Figure 5). Relative to human-analysts, CoralNet also tended to overestimate turf cover at American Samoa sites, but to a much lower degree than in the MHI (difference: 6.2 ± 5.7%, Figure 5). At American Samoan sites, CoralNet generated cover estimates for a number of algal sub-groupings that were similar to those generated by human-analysts, including Halimeda, “other green macroalga” (Pearson’s r > 0.96 and relatively unbiased for both, Supplementary Figure S1), and encrusting macroalgae (e.g., Peyssonnelia, and encrusting growth forms of genera, such as Lobophora).
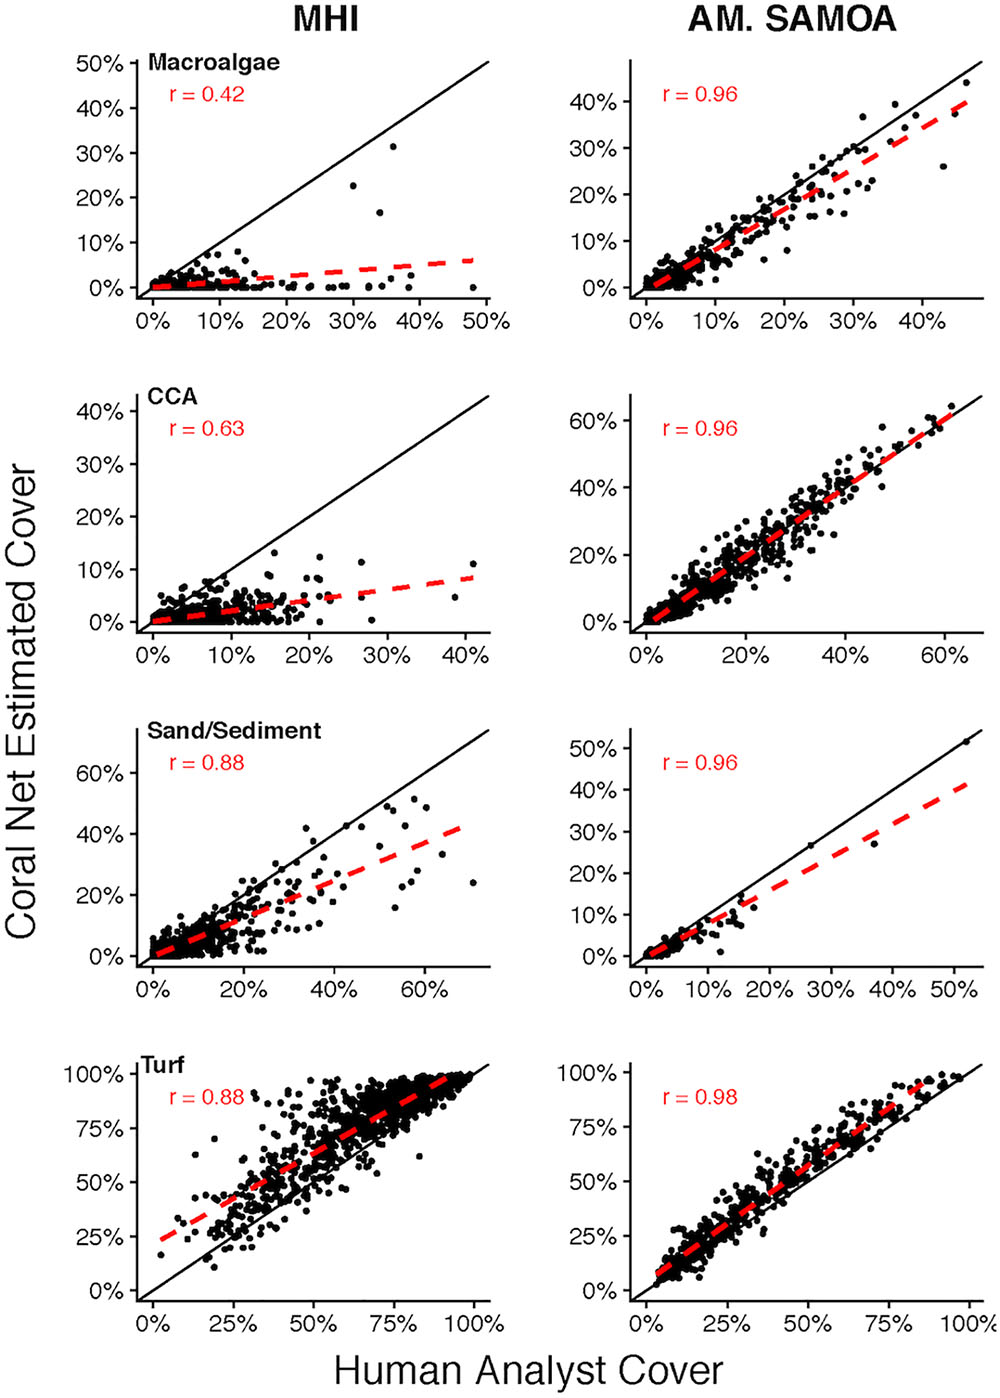
Figure 5. Site-level coral cover of non-coral functional groups by human analyst and CoralNet. Figures on the left-hand side show MHI site data, and those on the right represent American Samoa sites. Each point denotes a single site; the solid black line is the 1:1 line, and the dashed red line is a linear fit of the point data. MHI CoralNet estimates were derived from the “BASE-HABITAT” classification. American Samoa CoralNet estimates were derived from the “BASE” classification (Supplementary Table S2). “r” values are Pearson’s correlation coefficients. Total number of sites is 598 for MHI, and 468 for American Samoa. Correlations are significant (p < 0.0001) in all cases.
Comparisons Between CoralNet and Human-Analyst Pooled Coral Cover Estimates
The high degree of consistency between human-analysts and CoralNet in MHI site level coral cover, resulted in a mean difference between annotation methods of 0.8% (±0.7% SD) when data were pooled by island and year (Figure 6). Of the 26 MHI island-years from which we have data, CoralNet and human-analyst coral cover estimates only twice differed by >2.5% – for Oahu and Lanai, both in 2010. Coral cover estimates were relatively good at Niihau (which had low coral cover) and Hawaii Island, which had had average cover of 14.6%, but for which the difference between annotation methods was <0.3% in all years (Figure 6). Concordance between annotation methods was lower at Oahu and Kauai, both of which had moderate to low coral cover – i.e., means of around 5–7% – but where the difference between annotation methods was consistently ∼2% in each year (Figure 6). Notably, for all island-year combinations, the differences between CoralNet and human-analyst estimates of coral cover (i.e., methodological differences) were relatively small compared to the uncertainty in the island-year estimate per method (i.e., the variability among sites within the island-year). Specifically, there was a substantial degree of overlap between CoralNet and human-analyst error bars for each island-year (Figure 6). Differences in relative performance of CoralNet compared to human-analysts may have been in part due to variation in the dominant coral genera at each island, as CoralNet island-year estimates were clearly better for Porites than for Montipora (Supplementary Figure S2).
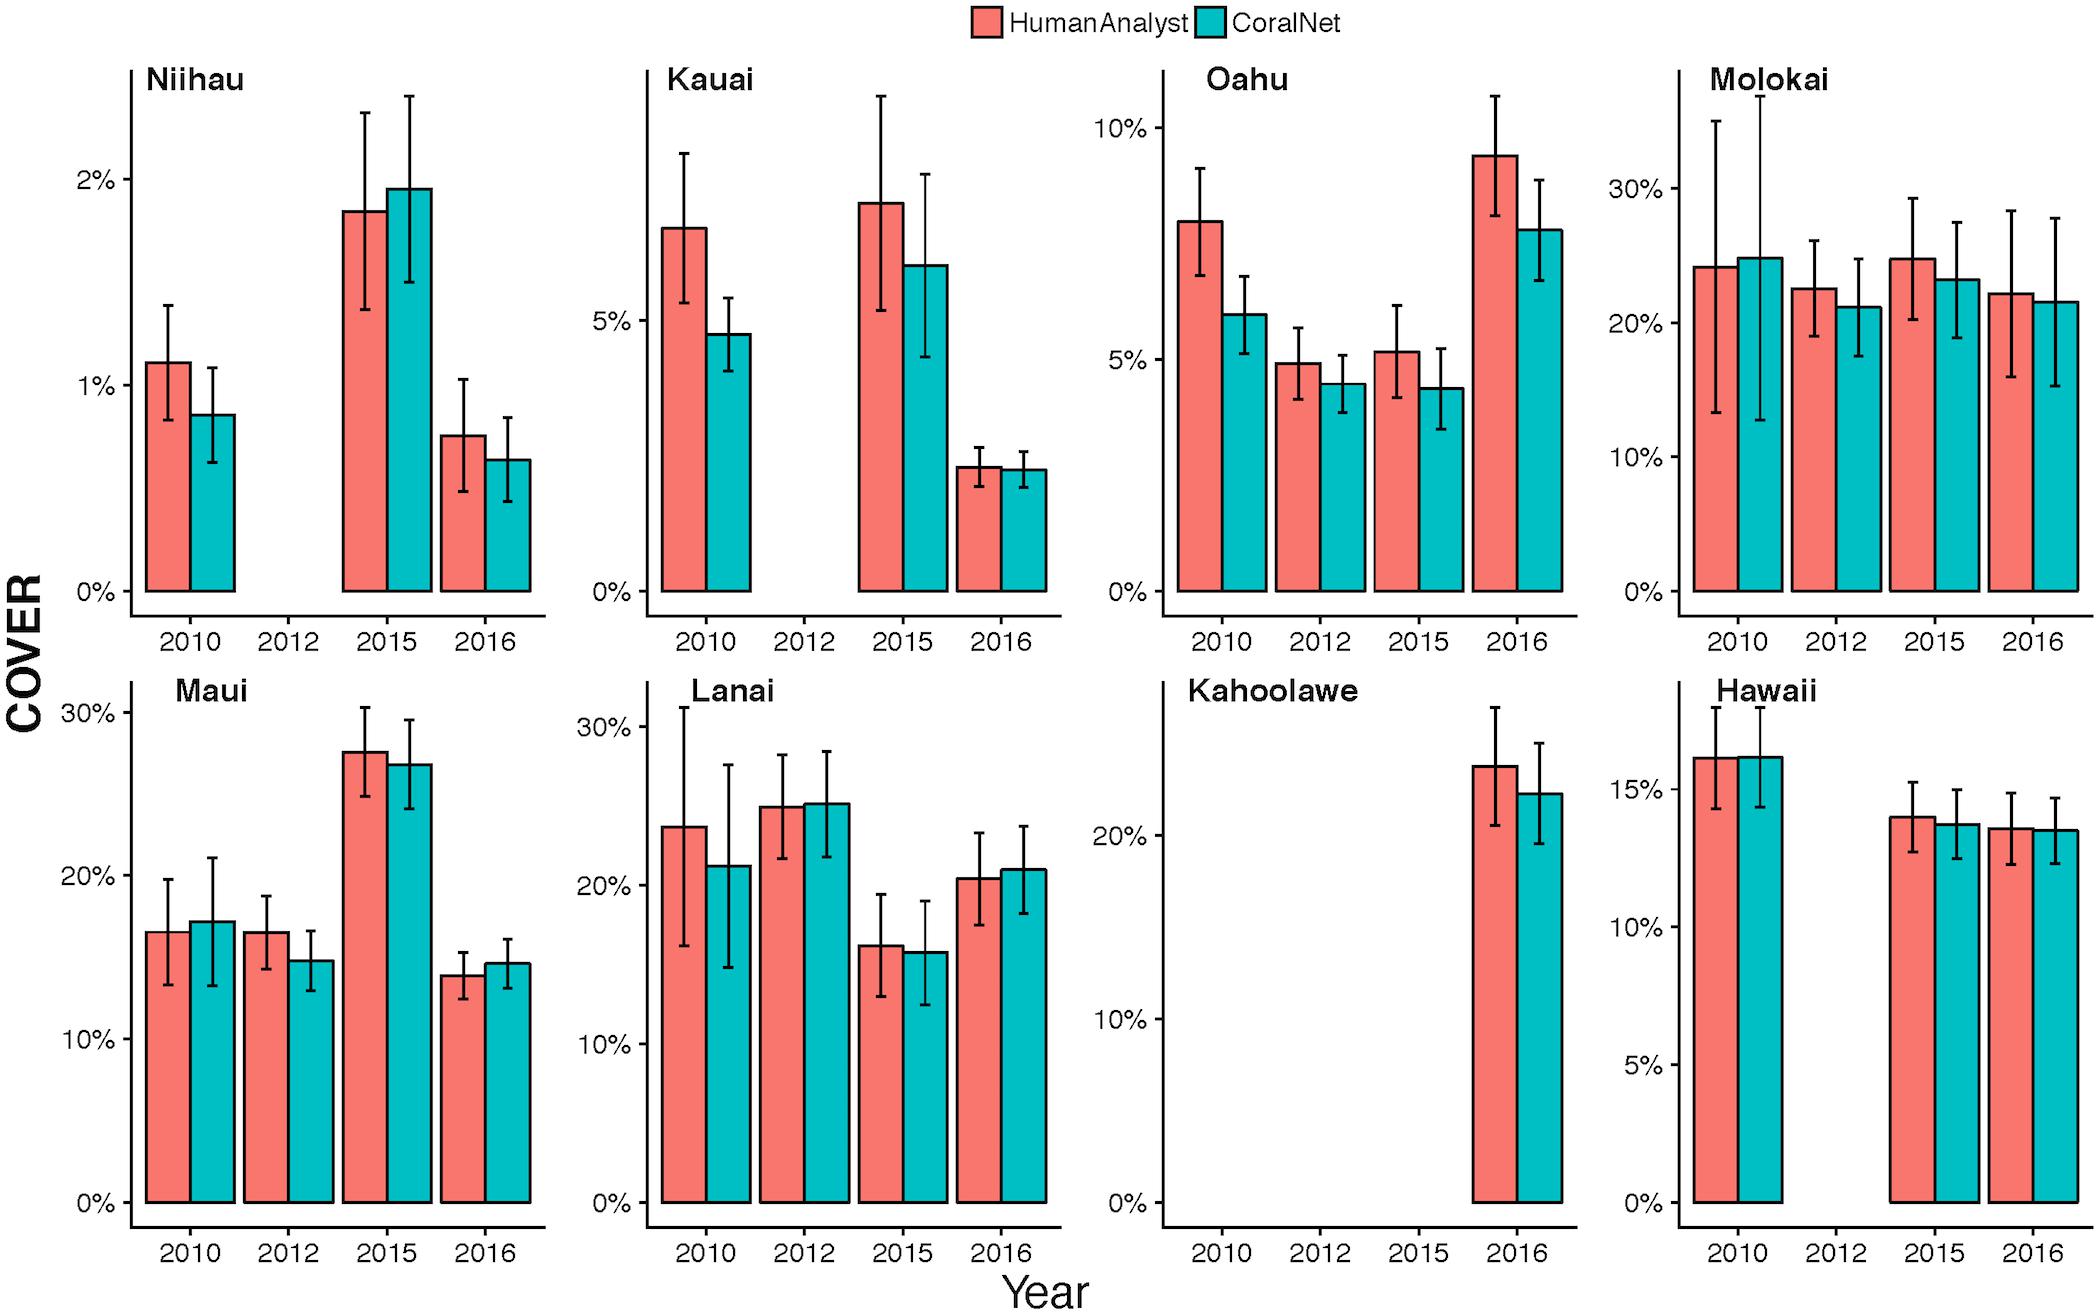
Figure 6. MHI Island-scale coral cover per year from human analysts and CoralNet. Columns represent annual mean and standard error of coral cover by island and year. CoralNet estimates were derived from the “BASE-HABITAT” classification (Supplementary Table S2). Numbers of sites per island and year are shown in Table 1, but vary between 9 and 8 for MHI.
CoralNet estimates of coral cover at American Samoa were higher than human-analyst estimates at all five islands. Differences in island-scale mean were <1% at Ofu and Olosega, Tau, and Tutuila, but 4.1% at Swains (Figure 7). The relatively poor performance of CoralNet at Swains may have been related to CoralNet underestimating both Montipora (the most abundant genus at Swains) and Acropora (Supplementary Figure S3). CoralNet estimates of algal cover at American Samoa were relatively good for data pooled to island-scale, particularly for CCA and Halimeda (Supplementary Figure S4).
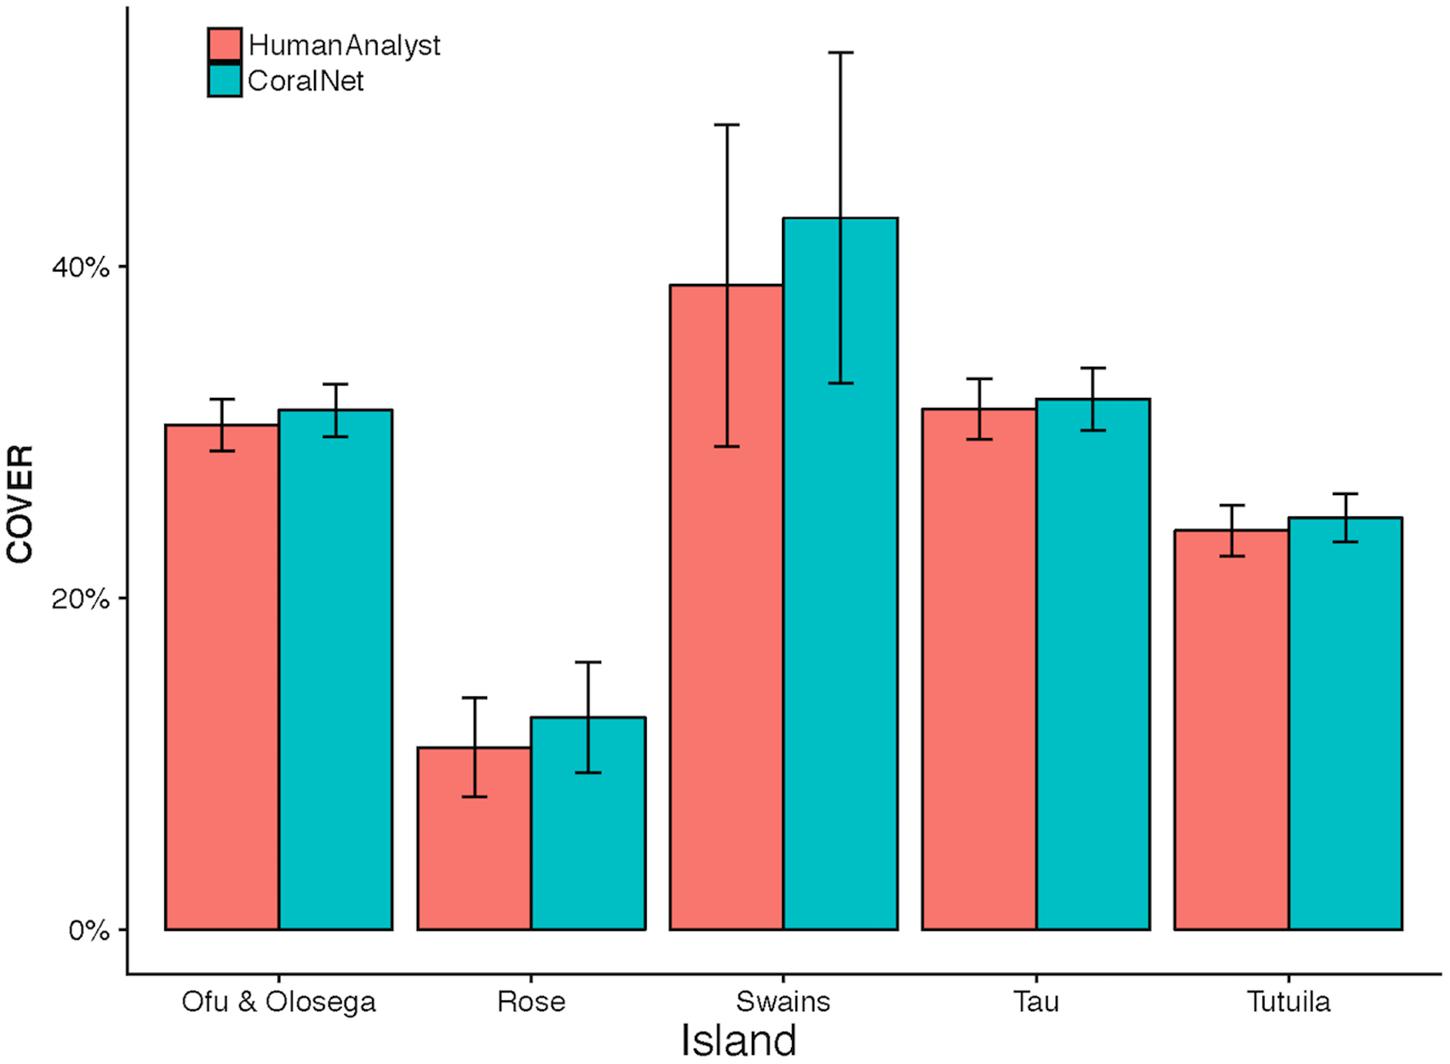
Figure 7. American Samoa island-scale coral cover from human analysts and CoralNet. Coral cover mean and standard error is shown for each island. CoralNet estimates are for the “BASE” classification (Supplementary Table S2). Numbers of sites per island are shown in Table 1, but vary between 47 and 227 for American Samoa.
Relative Performance of CoralNet and Human-Analyst Data at Quantifying Differences Coral Cover in Space and Time
CoralNet performed similarly to human analysts when quantifying the magnitude and statistical significance of differences in coral cover between island-year pairs. For both regions, there was close to 1:1 agreement between CoralNet and human-analyst estimates of difference in coral cover between island-years (Figure 8), indicating that CoralNet estimates were unbiased compared to those derived from human-analyst data. Also, of the 10 possible paired comparisons among islands in American Samoa, the same six pairs were consistently considered significantly different, whether CoralNet or human-analyst cover estimates were used (Figure 8). For the MHI, CoralNet, and human-analyst estimates yielded the same statistical result for 95% (310 of 325) of island-year pairs (Figure 8). In cases where the statistical outcome was different, that result was due to small differences in confidence intervals – e.g., results were marginally significant for human-analysts and marginally non-significant for CoralNet. There was also very little difference in the precision of human-analyst and CoralNet estimates of scales of differences between island-year pairs. Among MHI island-year pairs, CoralNet confidence intervals of difference were on average 95% of human-analyst confidence intervals; and for American Samoa island pairs, CoralNet confidence intervals were 104% of those from human-analyst estimates.
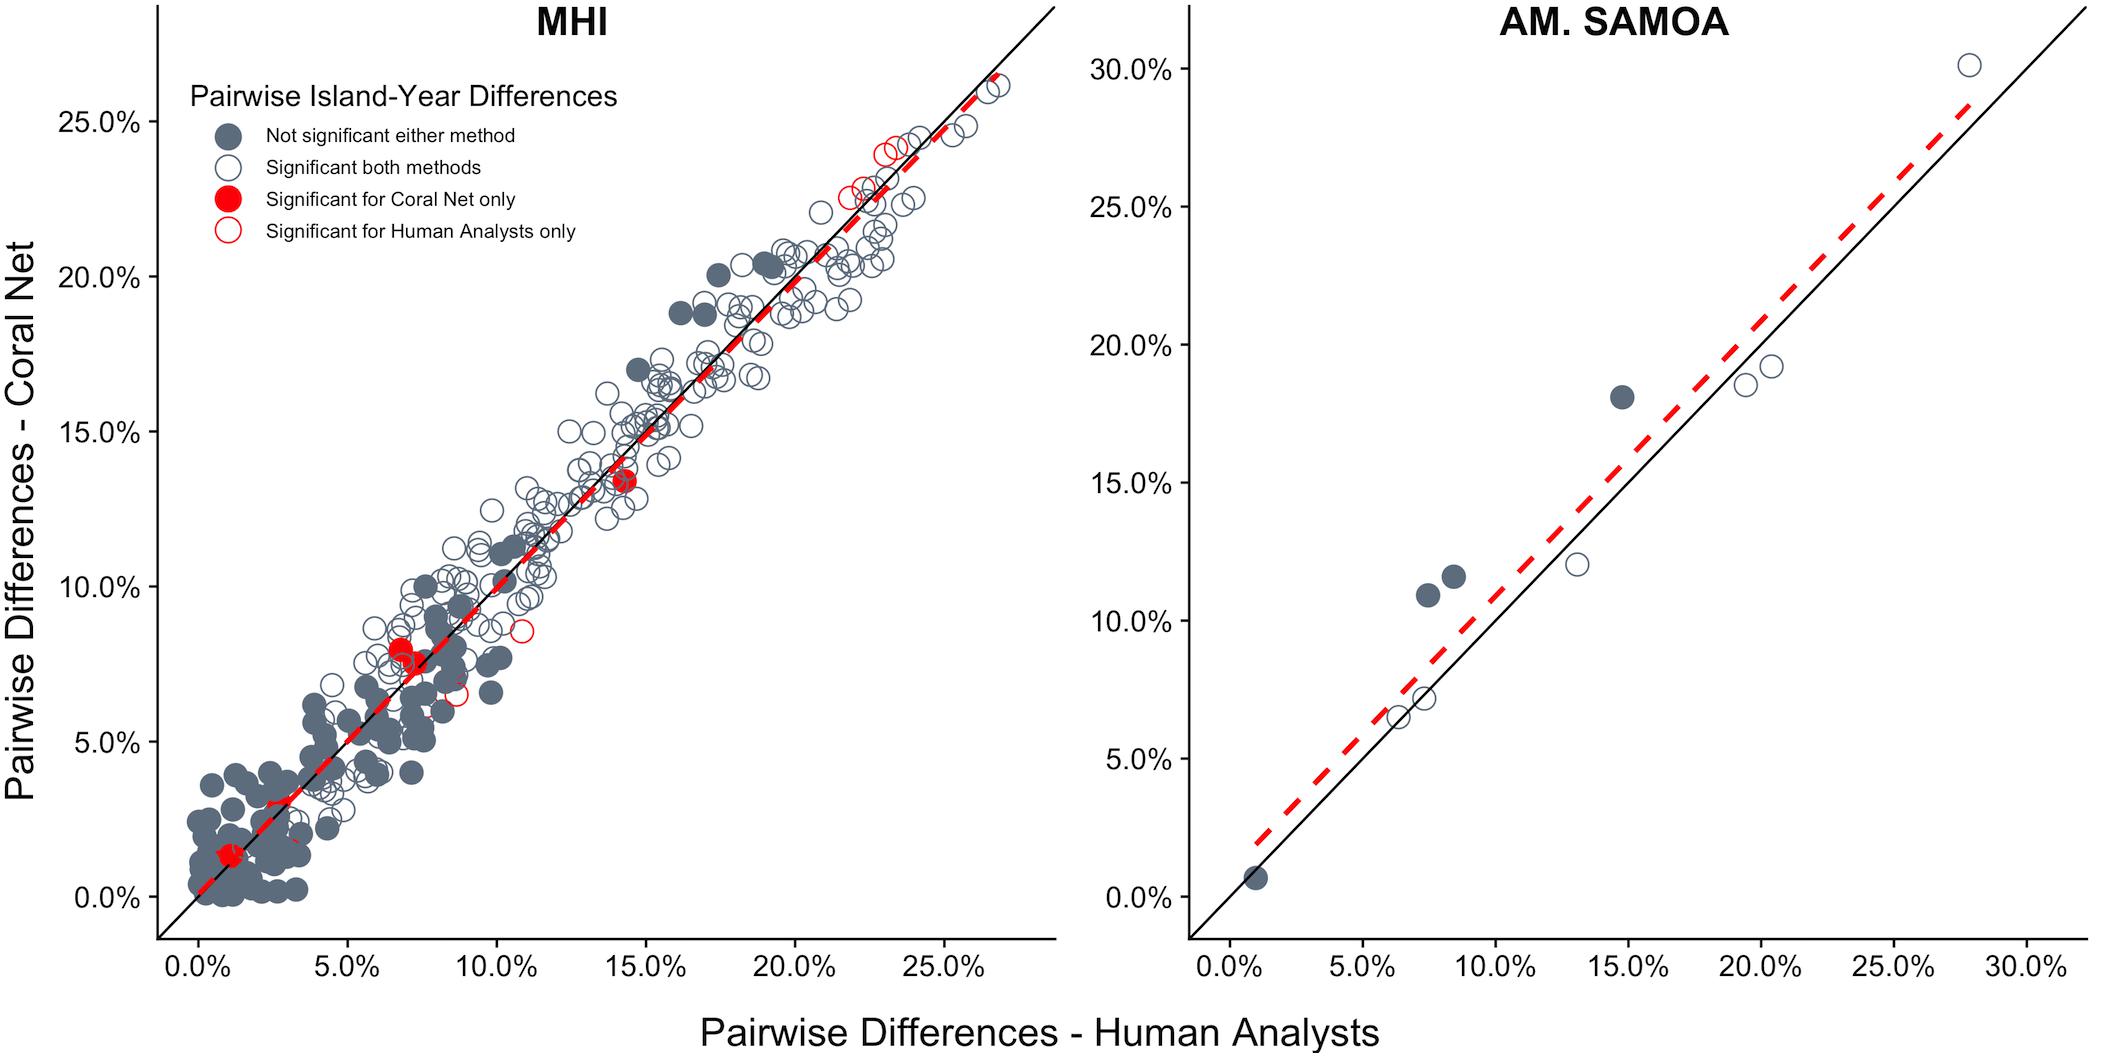
Figure 8. Difference in cover between all island-year pairs for human-analyst and CoralNet. Each point represents one island-year pair (325 pairs in MHI, 10 for American Samoa). The black solid-line represent the 1:1 – i.e., difference in cover between island-years was identical for the two methods. The red hatched line is a linear fit of the points. Points shown in dark gray are cases where human-analyst and CoralNet produced the same statistical result. The 15 red points in MHI are cases where there was a difference in statistical outcome depending on the annotation method used. Solid circles represent island-year pairs for which human-analyst cover estimates did not significantly differ, and empty circles where the difference was significant.
Impact of Training Set Size on Site Level Error
For the MHI BASE-HABITAT and American Samoa BASE-ISLAND training runs, mean site-level coral cover error (i.e., the mean difference between human-analyst and CoralNet site level cover) ranged from 1.1 ± 1.4% (mean ± SD) at MHI rock-boulder sites, to 3.9 ± 2.7% at Swains (Supplementary Figure S5). For those training sets, which were the smallest sets used in each region, there was no evident association between mean error and the size of training set (which ranged from 7,050 previously annotated points at Swains to 34,050 at Tutuila, Supplementary Figure S5).
Discussion
Our results demonstrate the potential to use fully-automated image analysis tools to quantify spatial and temporal differences in coral reef benthic cover. The imagery used in this study came from sites randomly located across all hard-bottom, <30 m fore reef habitats around five islands in American Samoa and eight islands in the MHI. Despite the broad geographic scope of our surveys, which encompass diverse coral communities, habitats, and ambient conditions – including light and turbidity – CoralNet systems were capable of generating estimates of coral cover that were highly comparable to those produced by human analysts. Our results therefore highlight the feasibility of developing a regional-scale automated image-analysis capability for key benthic features that could support multiple research and monitoring needs to increase the amount of data available to inform coral reef management.
An important step to improving comparability of CoralNet and human-analyst benthic cover estimates was to assess a range of classification schemes from relatively simple to relatively complex. CoralNet tended to underestimate coral cover relative to human analysts by an average of approximately 2–3% per site in the more complex classification schemes, but the bias was reduced to around 1% or less for the simplest schemes – in which all corals were grouped into a single category. We also found that training robots with imagery from a single comparable habitat improved performance. Estimates with known and relatively consistent bias can still be useful, as it is possible to adjust for that. Nevertheless, it seems desirable to reduce the scale of those differences where possible. Our study does not prove that simple schemes should generally be expected to improve CoralNet performance, but it does indicate that testing a range of classification schemes is likely necessary to maximize the utility of the CoralNet system for any particular research question and situation.
Although we compare CoralNet data against human-analyst data, we do not intend to imply that human-analyst data perfectly represents benthic cover. In fact, differences in performance among even experienced analysts tend to be of a similar scale to that which we found between CoralNet and overall human-analysts for the best performing classification schemes, i.e., ∼1% difference in coral cover estimates per site and considerably higher for some other benthic groups (Beijbom et al., 2015; González-Rivero et al., 2016). Arguably, as well as reducing the resources required to conduct analysis, one of the key benefits of using automated analysis tools such as CoralNet is that analyst performance will be consistent across the entire image dataset, and thus patterns in space and time do not risk being confounded or obscured by differences in analyst performance. Our study clearly demonstrates the potential to use CoralNet in this way – as CoralNet performed nearly identically to our pool of human analysts when quantifying the scale and statistical significance of differences in coral cover between island-year pairs. Using a large pool of trained and experienced analysts, as we do, is one way to reduce human-analyst bias between survey periods and locations. However, that is not always possible, and automated analysis is likely to be particularly useful for survey programs that rely on a small number of analysts, or where there is high turnover of analysts – as both of those increase scope for inconsistent analyst performance to lead to bias.
Even with the large training sets available to us, automated classification was strongly dissimilar to human-annotations for some common groups, such as most algal categories in MHI. Previous studies using Support Vector Machines have tended to show relatively poor analysis performance, both automated and manual, for algal groups (Beijbom et al., 2015; González-Rivero et al., 2016). Turf is a particularly challenging group (Beijbom et al., 2015; González-Rivero et al., 2016), as there is inherently great variability within that category, from nearly bare and heavily cropped substrate to relatively thick turf mats along with substantial differences in color and texture of different nominally “turf” patches. High variability within and among human analysts leads to a high degree of error in human-analyst estimates, as well as inconsistent training of the automated classifier, both of which likely contributed to the relatively high degree of difference between human-analyst and CoralNet estimates for some of these categories. Notably, for American Samoa, but not MHI, there was strong agreement between CoralNet and human-analysts for CCA. This may partly have been due to much greater abundance of CCA in American Samoa (mean cover ∼18% across all sites) than in MHI (∼4%), but may also have been due to substantial differences in CCA appearance between regions. In American Samoa, CCA forms distinct, conspicuous and often brightly-colored patches, whereas, in the MHI, CCA patches are typically small and less-distinct within a mosaic of other algal and benthic groups.
Certainly, the high degree of variability in algal morphology is likely to present challenges for both human and automated image analysis, which highlights the need for careful consideration of the objectives of automated analysis. Even when it is not possible to adequately train an automated analyst for all categories of interest, there is likely still considerable scope for using automation to reduce human-analyst workload. For example, running CoralNet in alleviation mode involves CoralNet providing classification suggestions together with a measure of confidence allowing human analysts to accept or modify those suggestions (Beijbom et al., 2015).
The ability to train automatic annotators capable of robustly quantifying coral cover from essentially all shallow water reefs within two disparate regions highlights the scope for automated image analysis to greatly increase the quantity of benthic data that can be feasibly and cost-effectively generated by monitoring programs. Even with a human-assisted workflow, the image analysis bottleneck and associated costs could be greatly reduced, thereby allowing for more imagery to be collected from more sites. Such an approach would improve data quality – by increasing representativeness of data or by increasing precision and therefore statistical power. The greatest potential gains might come from fully-automated image analysis combined with use of autonomous platform technologies to increase the amount and scale of image acquisition (Griffin et al., 2017; Manderson et al., 2017).
Given the evident capacity of automated analysis technology to generate high quality benthic data, it may be desirable to develop image-analysis tools suitable for much wider use. For example, citizen scientists could take advantage of trained and proven automated analysis robots from their region. Users of those systems could thereby rapidly convert imagery into data useful for their own purposes and potentially contribute to regional data pools. That would presumably require some degree of standardization – e.g., in image resolution, photograph orientation, and image footprint. Collectively, this could lead to large, highly-comparable datasets suitable for purposes such as landscape ecology, habitat mapping, and marine spatial planning (González-Rivero et al., 2016).
Automated image analysis technology is likely to greatly improve in coming years, perhaps in part through accounting for 3-dimensional structure of benthic features, as can be derived from structure-for-motion photogrammetry (Burns et al., 2015; Edwards et al., 2017). However, it is clear that automated analysis tools, such as CoralNet, are already capable of generating benthic cover estimates comparable to those derived from human analysts, and suitable for many purposes. The capacity to rapidly convert large quantities of geo-referenced imagery into robust cover data has the potential to transform what can be achieved by coral reef monitoring and survey programs, particularly if integrated with advances in automated image acquisition. Fully realizing those benefits will require standardization of analysis methodologies, image acquisition, and classification schemes, and a commitment to increased sharing of data and imagery (Durden et al., 2017). Doing so will greatly increase the utility of resulting data for a wide range of conservation, management, and research purposes.
Author Contributions
IW, CC, BV-A, TO, and BS conceived the research question. IW, CC, and OB analyzed the data. IW and CC wrote the manuscript with considerable help from all the authors. All the authors provided critical feedback and helped with interpreting the results.
Funding
This project was funded by NOAA’s Coral Reef Conservation Program (http://coralreef.noaa.gov), NOAA’s Pacific Islands Fisheries Science Center, and the NMFS Automated Image Analysis Strategic Initiative. The findings and conclusion in this manuscript are those of the authors and do not necessarily represent the views of NOAA. The use of trade, firm, or corporation names in this publication is for the convenience of the reader and does not constitute an official endorsement or approval of any product or service to the exclusion of others that may be suitable.
Conflict of Interest Statement
OB created and continues to maintain and manage the CoralNet system. However, CoralNet is free to use and is in no way a commercial enterprise.
The remaining authors declare that the research was conducted in the absence of any commercial or financial relationships that could be construed as a potential conflict of interest.
Acknowledgments
We thank the members of Ecosystem Science Division’s fish and benthic survey team and partners for their tireless efforts in collecting data around American Samoa and the main Hawaiian Islands, as well as the dedicated officers and crews of the NOAA Ships Hi‘ialakai and Oscar Elton Sette for providing safe and productive platforms for our research teams. We also thank Paula Ayotte for GIS support with this project.
Supplementary Material
The Supplementary Material for this article can be found online at: https://www.frontiersin.org/articles/10.3389/fmars.2019.00222/full#supplementary-material
Footnote
References
Armstrong, R. A., Singh, H., Torres, J., Nemeth, R. S., Can, A., Roman, C., et al. (2006). Characterizing the deep insular shelf coral reef habitat of the hind bank marine conservation district (US Virgin Islands) using the seabed autonomous underwater vehicle. Cont. Shelf Res. 26, 194–205. doi: 10.1016/j.csr.2005.10.004
Ayotte, P., McCoy, K., Heenan, A., Williams, I., and Zamzow, J. (2015). Coral Reef Ecosystem Division Standard Operating Procedures: Data Collection for RAPID Ecological Assessment Fish Surveys. Available at: http://www.pifsc.noaa.gov/library/pubs/admin/PIFSC_Admin_Rep_15-07.pdf. (accessedDecember2011).
Beijbom, O., Edmunds, P. J., Roelfsema, C., Smith, J., Kline, D. I., Neal, B. P., et al. (2015). Towards automated annotation of benthic survey images: variability of human experts and operational modes of automation. PLoS One 10:e0130312. doi: 10.1371/journal.pone.0130312
Bland, J. M., and Altman, D. G. (1986). Statistical methods for assessing agreement between two methods of clinical measurement. Lancet 1, 307–310. doi: 10.1016/s0140-6736(86)90837-8
Burke, L., Reytar, K., Spalding, M., and Perry, A. (2011). Reefs at Risk: Revisted. Washington, DC: World Resources Institute.
Burns, J., Delparte, D., Gates, R., and Takabayashi, M. (2015). Integrating structure-from-motion photogrammetry with geospatial software as a novel technique for quantifying 3D ecological characteristics of coral reefs. PeerJ 3:e1077. doi: 10.7717/peerj.1077
Coral, N. O. A. A., and Program. (2014). NOAA Coral Reef Conservation Program. National Coral Reef Monitoring Program. Silver. Available at: http://docs.lib.noaa.gov/noaa_documents/NOS/CRCP/noaa_crcp_national_coral_reef_monitoring_plan_2014.pdf (accessed March 18, 2015).
Couch, C. S., Burns, J. H. R., Liu, G., Steward, K., Gutlay, T. N., Kenyon, J., et al. (2017). Mass coral bleaching due to unprecedented marine heatwave in papahānaumokuākea marine national monument (Northwestern Hawaiian Islands). PLoS One 12:e0185121. doi: 10.1371/journal.pone.0185121
De’ath, G., Fabricius, K. E., Sweatman, H., and Puotinen, M. (2012). The 27-year decline of coral cover on the great barrier reef and its causes. Proc. Natl. Acad. Sci. U.S.A. 109, 17995–17999. doi: 10.1073/pnas.1208909109
Dollar, S. J. (1982). Wave stress and coral community structure in hawaii. Coral Reefs 1, 71–81. doi: 10.1007/BF00301688
Durden, J. M., Luo, J. Y., Alexander, H., Flanagan, A. M., and Grossmann, L. (2017). Integrating “big data” into aquatic ecology: challenges and opportunities. Limnol. Oceanogr. Bull. 26, 101–108. doi: 10.1002/lob.10213
Edinger, E. N., Jompa, J., Limmon, G. V., Widjatmoko, W., and Risk, M. J. (1998). Reef degradation and coral biodiversity in Indonesia: effects of land-based pollution, destructive fishing practices and changes over time. Mar. Pollut. Bull. 36, 617–630. doi: 10.1016/s0025-326x(98)00047-2
Edwards, C. B., Eynaud, Y., Williams, G. J., Pedersen, N. E., Zgliczynski, B. J., Gleason, A. C. R., et al. (2017). Large-area imaging reveals biologically driven non-random spatial patterns of corals at a remote reef. Coral Reefs 36, 1291–1305. doi: 10.1007/s00338-017-1624-3
Fabricius, K. E. (2005). Effects of terrestrial runoff on the ecology of corals and coral reefs: review and synthesis. Mar. Pollut. Bull. 50, 125–146. doi: 10.1016/j.marpolbul.2004.11.028
Glynn, P. W. (1976). Some physical and biological determinants of coral community structure in the eastern pacific. Ecol. Monogr. 46, 431–456. doi: 10.2307/1942565
González-Rivero, M., Beijbom, O., Rodriguez-Ramirez, A., Holtrop, T., González-Marrero, Y., Ganase, A., et al. (2016). Scaling up ecological measurements of coral reefs using semi-automated field image collection and analysis. Remote Sens. 8:30. doi: 10.3390/rs8010030
González-Rivero, M., Bongaerts, P., Beijbom, O., Pizarro, O., Friedman, A., Rodriguez-Ramirez, A., et al. (2014). The catlin seaview survey - kilometre-scale seascape assessment, and monitoring of coral reef ecosystems. Aquat. Conserv. Mar. Freshw. Ecosyst. 24, 184–198. doi: 10.1002/aqc.2505
Griffin, K. J., Hedge, L. H., González-Rivero, M., Hoegh-Guldberg, O. I., and Johnston, E. L. (2017). An evaluation of semi-automated methods for collecting ecosystem-level data in temperate marine systems. Ecol. Evol. 7, 4640–4650. doi: 10.1002/ece3.3041
Heenan, A., Williams, I. D., Acoba, T., DesRochers, A., Kosaki, R. K., Kanemura, T., et al. (2017). Long-term monitoring of coral reef fish assemblages in the western central pacific. Sci. Data 4:170176. doi: 10.1038/sdata.2017.176
Heron, S. F., Maynard, J. A., van Hooidonk, R., and Eakin, C. M. (2016). Warming trends and bleaching stress of the world’s coral reefs 1985–2012. Sci. Rep. 6:38402. doi: 10.1038/srep38402
Hughes, T. P., Anderson, K. D., Connolly, S. R., Heron, S. F., Kerry, J. T., Lough, J. M., et al. (2018a). Spatial and temporal patterns of mass bleaching of corals in the anthropocene. Science 359, 80–83. doi: 10.1126/science.aan8048
Hughes, T. P., Kerry, J. T., Baird, A. H., Connolly, S. R., Dietzel, A., Eakin, C. M., et al. (2018b). Global warming transforms coral reef assemblages. Nature 556, 492–496. doi: 10.1038/s41586-018-0041-2
Johansson, C. L., van de Leemput, I. A., Depczynski, M., Hoey, A. S., and Bellwood, D. R. (2013). Key herbivores reveal limited functional redundancy on inshore coral reefs. Coral Reefs 32, 963–972. doi: 10.1007/s00338-013-1044-y
Kohler, K. E., and Gill, S. M. (2006). Coral point count with excel extensions (CPCe): a visual basic program for the determination of coral and substrate coverage using random point count methodology. Comput. Geosci. 32, 1259–1269. doi: 10.1016/j.cageo.2005.11.009
Langenkämper, D., Zurowietz, M., Schoening, T., and Nattkemper, T. W. (2017). BIIGLE 2.0 - browsing and annotating large marine image collections. Front. Mar. Sci. 4:83. doi: 10.3389/fmars.2017.00083
LeCun, Y., Bengio, Y., and Hinton, G. (2015). Deep learning. Nature 521, 436–444. doi: 10.1038/nature14539
Lozada-Misa, P., Schumacher, B. D., and Vargas-Angel, B. (2017). Analysis of Benthic Survey Images Via Coralnet: A Summary of Standard Operating Procedures and Guidelines. Administrative Report No. H-17-02. Honolulu, HI: Joint Institute for Marine and Atmospheric Research University.
Manderson, T., Li, J., Dudek, N., Meger, D., and Dudek, G. (2017). Robotic coral reef health assessment using automated image analysis. J. Field Robot. 34, 170–187. doi: 10.1002/rob.21698
Marcos, M. S. A., Soriano, M., and Saloma, C. (2005). Classification of coral reef images from underwater video using neural networks. Opt. Express 13, 8766–8771.
Maynard, J. A., Marshall, P. A., Johnson, J. E., and Harman, S. (2010). Building resilience into practical conservation: identifying local management responses to global climate change in the southern great barrier reef. Coral Reefs 29, 381–391. doi: 10.1007/s00338-010-0603-8
McClanahan, T. R., Donner, S. D., Maynard, J. A., MacNeil, M. A., Graham, N. A. J., Maina, J., et al. (2012). Prioritizing key resilience indicators to support coral reef management in a changing climate. PLoS One 7:e42884. doi: 10.1371/journal.pone.0042884
Miller, J., Muller, E., Rogers, C., Waara, R., Atkinson, A., Whelan, K. R. T., et al. (2009). Coral disease following massive bleaching in 2005 causes 60% decline in coral cover on reefs in the us virgin Islands. Coral Reefs 28, 925–937. doi: 10.1007/s00338-009-0531-7
Porter, J., Kosmynin, V., Patterson, K., Porter, K., Jaap, W., Wheaton, J., et al. (2001). “Detection of coral reef change by the florida keys coral reef monitoring project,” in The Everglades, Florida Bay, and Coral Reefs of the Florida Keys eds J. W. Porter and K. G. Porter (Boca Raton, FL: CRC Press), doi: 10.1201/9781420039412-32
Salih, A., Larkum, A., Cox, G., Kühl, M., and Hoegh-Guldberg, O. (2000). Fluorescent pigments in corals are photoprotective. Nature 408, 850–853. doi: 10.1038/35048564
Shihavuddin, A. S. M., Gracias, N., Garcia, R., Gleason, A., and Gintert, B. (2013). Image-based coral reef classification and thematic mapping. Remote Sens. 5, 1809–1841. doi: 10.3390/rs5041809
Stokes, M. D., and Deane, G. B. (2009). Automated processing of coral reef benthic images. Limnol. Oceanogr. Methods 7, 157–168. doi: 10.4319/lom.2009.7.157
Swanson, D., Bailey, H., Schumacher, B., Ferguson, M., and Vargas-Ángel, B. (2018). Ecosystem Sciences Division Standard Operating Procedures: Data Collection for Rapid Ecological Assessment Benthic Surveys. Honolulu, HI: Pacific Islands Fisheries Science Center.
Trygonis, V., and Sini, M. (2012). Photoquad: a dedicated seabed image processing software, and a comparative error analysis of four photoquadrat methods. J. Exp. Mar. Bio. Ecol. 42, 99–108. doi: 10.1016/j.jembe.2012.04.018
Keywords: coral reef, image analysis, machine learning, CoralNet, Hawaii, American Samoa, benthic monitoring
Citation: Williams ID, Couch CS, Beijbom O, Oliver TA, Vargas-Angel B, Schumacher BD and Brainard RE (2019) Leveraging Automated Image Analysis Tools to Transform Our Capacity to Assess Status and Trends of Coral Reefs. Front. Mar. Sci. 6:222. doi: 10.3389/fmars.2019.00222
Received: 25 August 2018; Accepted: 10 April 2019;
Published: 30 April 2019.
Edited by:
Victor Zykov, Schmidt Ocean Institute, United StatesReviewed by:
Thomas Mock, University of East Anglia, United KingdomGregory P. Asner, Arizona State University, United States
Copyright © 2019 Williams, Couch, Beijbom, Oliver, Vargas-Angel, Schumacher and Brainard. This is an open-access article distributed under the terms of the Creative Commons Attribution License (CC BY). The use, distribution or reproduction in other forums is permitted, provided the original author(s) and the copyright owner(s) are credited and that the original publication in this journal is cited, in accordance with accepted academic practice. No use, distribution or reproduction is permitted which does not comply with these terms.
*Correspondence: Ivor D. Williams, ivor.williams@noaa.gov