Citizen-Science for the Future: Advisory Case Studies From Around the Globe
 Christina Simoniello1*
  Jennifer Jencks2
  Federico M. Lauro3,4,5
  Jon Derek Loftis6
  Jan Marcin Weslawski7 Kajetan Deja7 David R. Forrest6
  Sarah Gossett8 Thomas C. Jeffries3,9 Rachelle M. Jensen3 Shinichi Kobara1 Lindsey Nolan8
  Martin Ostrowski3,10
  Dana Pounds11
  Gabriel Roseman3 Olivia Basco12 Serge Gosselin13
  Adam Reed14 Peter Wills15 David Wyatt16
- 1Department of Geosciences, Texas A&M University, College Station, TX, United States
- 2NOAA’s National Centers for Environmental Information, Boulder, CO, United States
- 3Indigo V Expeditions, Sentosa Cove, Singapore
- 4Singapore Centre for Environmental Life Sciences Engineering, Nanyang Technological University, Singapore, Singapore
- 5Asian School of the Environment, Nanyang Technological University, Singapore, Singapore
- 6College of William and Mary, Virginia Institute of Marine Science, Gloucester Point, VA, United States
- 7Department of Marine Ecology, Institute of Oceanology, Polish Academy of Sciences, Warsaw, Poland
- 8Galveston Bay Foundation, Houston, TX, United States
- 9School of Science and Health, Western Sydney University, Penrith, NSW, Australia
- 10Climate Change Cluster, University of Technology Sydney, Ultimo, NSW, Australia
- 11Nature’s Academy, Bradenton, FL, United States
- 12Hampton Roads Academy, Newport News, VA, United States
- 13Maurice Lamontagne Institute, Canadian Hydrographic Service, Fisheries and Oceans Canada, Mont Joli, QC, Canada
- 14NOAA’s Office of Coast Survey, Silver Spring, MD, United States
- 15Department of Fisheries and Oceans Canada, Canadian Hydrographic Service, Institute of Ocean Sciences, Sidney, BC, Canada
- 16International Hydrographic Organization, Monaco, Monaco
The democratization of ocean observation has the potential to add millions of observations every day. Though not a solution for all ocean monitoring needs, citizen scientists offer compelling examples showcasing their ability to augment and enhance traditional research and monitoring. Information they are providing is increasing the spatial and temporal frequency and duration of sampling, reducing time and labor costs for academic and government monitoring programs, providing hands-on STEM learning related to real-world issues and increasing public awareness and support for the scientific process. Examples provided here demonstrate the wide range of people who are already dramatically reducing gaps in our global observing network while at the same time providing unique opportunities to meaningfully engage in ocean observing and the research and conservation it supports. While there are still challenges to overcome before widespread inclusion in projects requiring scientific rigor, the growing organization of international citizen science associations is helping to reduce barriers. The case studies described support the idea that citizen scientists should be part of an effective global strategy for a sustained, multidisciplinary and integrated observing system.
Introduction
Logistical considerations and the high costs of deploying traditional in situ ocean observing systems limit their density and thus ability to accurately monitor fine-scale environmental conditions. In the coming years, the combination of youth who are increasingly globally connected and a growing population of retired professionals, poses an opportunity to create a “K to gray” network of citizen scientists with capacity that spans multiple cross-cutting and societal themes. Though not a solution for all ocean monitoring needs, citizen scientists can augment and enhance traditional research and monitoring, increase spatial and temporal frequency and duration of sampling, reduce time and labor costs, provide hands-on Science, Technology, Engineering and Mathematics (STEM) learning related to real-world issues and increase public awareness and support for the scientific process. While there are challenges to overcome before wide-scale inclusion in the ocean observing system enterprise, progress in this as yet underutilized resource is encouraging. The following are examples from around the world of how communities are being meaningfully engaged in ocean observing and the research and conservation these efforts support. Table 1 summarizes the five examples provided. Each has an introduction to the project, a description of the approaches used and a summary of the results. The paper concludes with identification of challenges and potential solutions for citizen science efforts in the future.
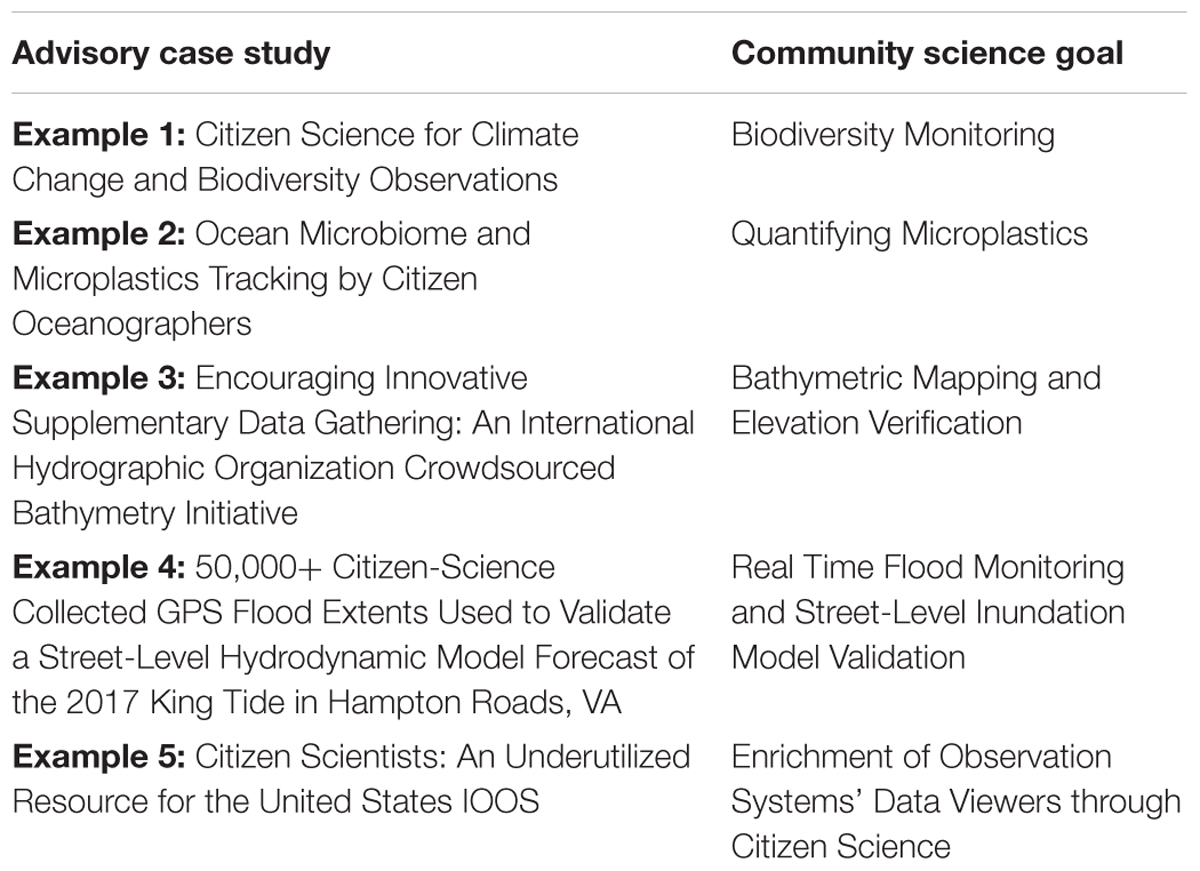
Table 1. Case study examples of citizen science projects.
Example 1: Citizen Science for Climate Change and Biodiversity Observations
Project Introduction
Svalbard is a Norwegian archipelago that is one of the world’s northernmost inhabited areas. Located between mainland Norway and the North Pole, it is a popular destination for tourists and expeditions visiting the area. For years, the Norwegian Polar Research Institute has taken advantage of the opportunity to engage these visitors in monitoring local wildlife. What started as distributing questionnaires to tourists has grown into a community of citizen scientists who contribute information to supplement census data of birds and mammals. The information provided is especially valuable because the volunteers visit places where research projects are seldom conducted. Contributions to monitoring species like polar bears have a high degree of utility because of the accuracy in identification. Including census data from untrained volunteers is more problematic for species of whales and dolphins.
One example of research that volunteers participated in was evaluating the importance of tidewater glaciers to foraging seabirds. Dating back to 1936, there are a number of records in the literature reporting an abundance of seabirds such as foraging kittiwakes, black guillemots, terns and fulmars associated with glaciers. Among the explanations of these records is the idea of “hot spots” whereby some ecological phenomenon accounts for the high concentration of seabirds (Urbanski et al., 2017). Volunteers were recruited to help determine if the reported observations are typical of all glaciers.
Six yacht captains who routinely bring tourists to Svalbard and Greenland were tasked with taking photos along the glacier cliffs. To standardize data processing by the scientists, a pre-determined distance of 200 m from the Svalbard glaciers was established (further in Greenland because of the size and activity of the glaciers). Over the course of three summer seasons, more than 600 georeferenced photos of 35 different glaciers were collected. Scientists analyzed the images, noting the presence of birds and characterizing each glacial bay using information in the literature. In addition to type of glacier, features analyzed included depth, salinity, sill presence, fetch, proximity to open shelf waters, and suspended matter. Statistical analysis was performed comparing the abundance of birds to glacier features. Results indicated that the bird aggregations are randomly distributed across the different types of glaciers and that there were actually no consistent hot spots.
Another example of citizens engaging in the scientific process involves assessing the impacts of climate change on zoogeography. Two species of amphipods, Gammarus setosus and Gammarus oceanicus, occur on Svalbard. The former is a local Arctic species and the latter is a boreal species. Both are found in the littoral zone, are about two to three centimeters in size, and are relatively easy to spot. They dwell in sheltered sites, almost exclusively under flat, loose stones, making specimens readily available to volunteers at low tide. Scientists had previously conducted research demonstrating that the two species compete for space (Weslawski, 1990). However, in that study only a single fjord was investigated. A large scale survey was desired to determine if increasing temperature was resulting in the northward dispersal of the boreal species, G. oceanicus, hence creating more competition with the Arctic species. Tourists visiting remote areas of the Svalbard archipelago were asked to participate in the study, given instructions on how to collect samples, and given small vials with alcohol to preserve samples. Three seasons of collection provided sufficient data for scientists to analyze. Results indicate that the range of G. oceanicus is being extended poleward (Weslawski et al., 2018).
Volunteers in these citizen science initiatives enthusiastically collected data and were recognized for their participation with acknowledgments in research publications and on project web pages. They provide an excellent example of the ability of volunteers to fill important spatial gaps in research and monitoring projects.
Example 2: Ocean Microbiome and Microplastics Tracking by Citizen Oceanographers
Project Introduction
The world’s oceans contain an estimated 1.2 × 1029 microbes (Whitman et al., 1998; Bar-On et al., 2018). These organisms are the key drivers of ocean health and form the foundation of the food web. Because of their sensitivity to climate change, the marine microbiome can be likened to the proverbial canary in a coalmine and act as indicators of environmental change. Despite their important function, our understanding of marine microbes and their dynamic behavior remains rudimentary due to the high cost of sampling using traditional oceanographic vessels. This has limited the acquisition of the high density spatial and temporal data needed to develop dynamic predictive models and ruled out sampling remote habitats which are often necessary for establishing baseline ‘pristine habitat’ data.
To overcome this data gap Indigo V Expeditions (IVE), a non-profit organization created by a consortium of scientists, institutions and research centers, developed cost-effective solutions to the sampling challenge by focusing on the advancement of citizen oceanography. The combination of the team’s sailboat, Indigo V, improvements in sampling technology, and a fleet of volunteer open ocean cruisers are helping researchers understand the world’s oceans in a holistic and comprehensive way.
There are thousands of manned vessels cruising the world’s oceans every day. Most follow long-established routes dictated by predominant weather and global wind patterns (i.e., the trade winds). These routes often cover tracts of ocean undersampled by traditional oceanographic cruises (Jeffries et al., 2015). IVE puts reliable and sustainable data collection tools into the hands of blue water cruisers, transforming ordinary yachts into in situ marine microbe monitoring platforms. Sailors are inherently concerned about the state of the ocean. Equipped with proprietary instrumentation, citizen sailing oceanographers provide the opportunity to collect robust data sets on a scale and under weather conditions never before possible, and in difficult-to-access remote locations (Figure 1). There are also the added advantages of drastically reduced sample collection costs compared to traditional oceanographic sampling and reduced carbon footprint associated with data collection (Lauro et al., 2014; Jeffries et al., 2015). With a coordinated approach, these sailors can contribute to unprecedented advances in the field of ocean health and significantly broaden the scope of existing knowledge.
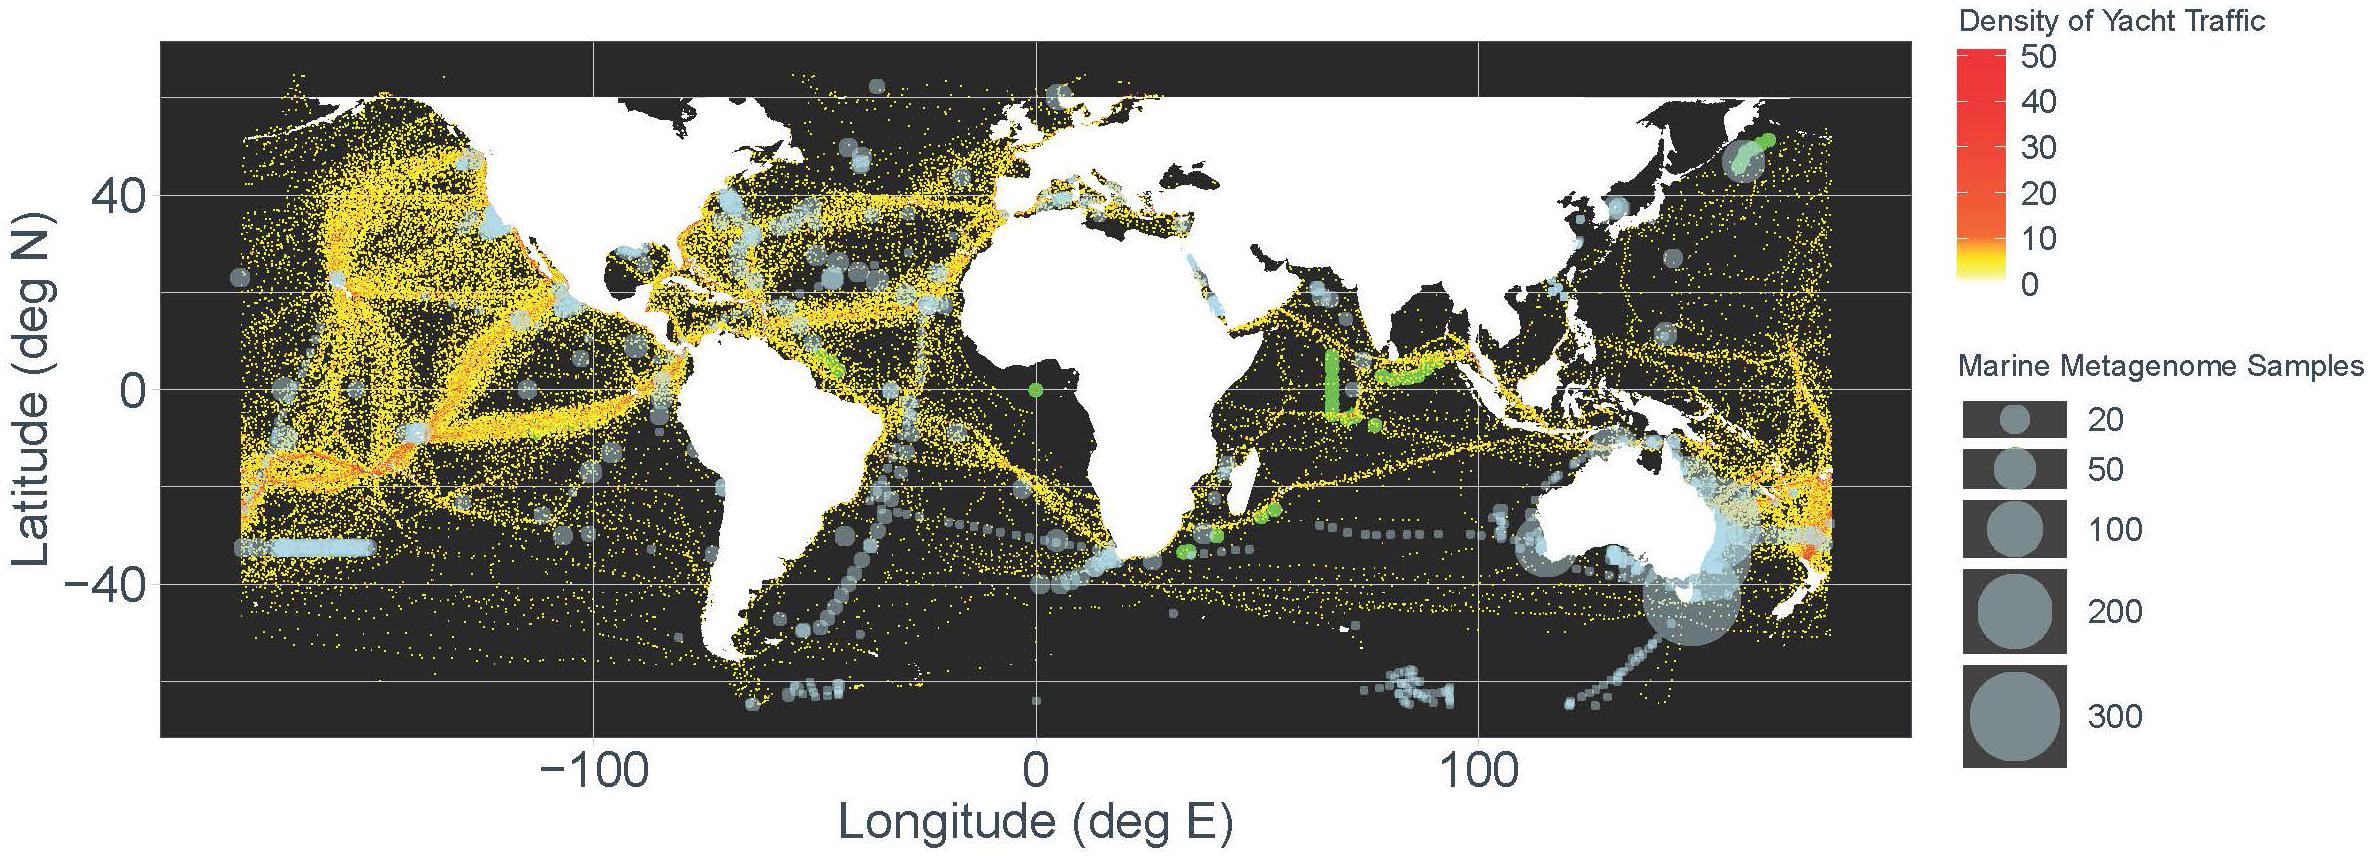
Figure 1. The global map shows the current distribution and sample density of marine metagenomic samples highlighted in light blue (data sourced from the National Center for Biotechnology Information Sequence Read Archive), overlaid by a density plot of waypoints recorded for cruising yachts mapped by YOTREPS during the period 1999–2014. Metagenomics samples gathered by citizen scientists for IVE are highlighted in green.
Technological Advancement of Data Gathering and Sharing Methods
Indigo V Expeditions volunteers take chemical measurements of seawater and physically collect water samples that get sent to a laboratory for metagenomics analysis using DNA sequencing. Metagenomics provides a signature of which species of microorganisms are present and their ecological function. Results of the genomic analysis are added to existing baseline information that is used to monitor change and generate signatures of ecological impact (Figure 2). In particular, network analysis allows the interactions between microorganisms and their environment to be visualized and signatures of ecological resilience generated (Bissett et al., 2013). Also, these analyses are capable of identifying “keystone species”; organisms that are highly connected and central to the network structure (Banerjee et al., 2018). These organisms make ideal targets for microbiome engineering and as tools to rapidly monitor ecosystem health. Most recently, microbes that colonize plastics have been collected and sequenced. The microbiome signature on individual fragments of plastic could provide a novel tool enabling researchers to trace back to the origin of the marine plastic.
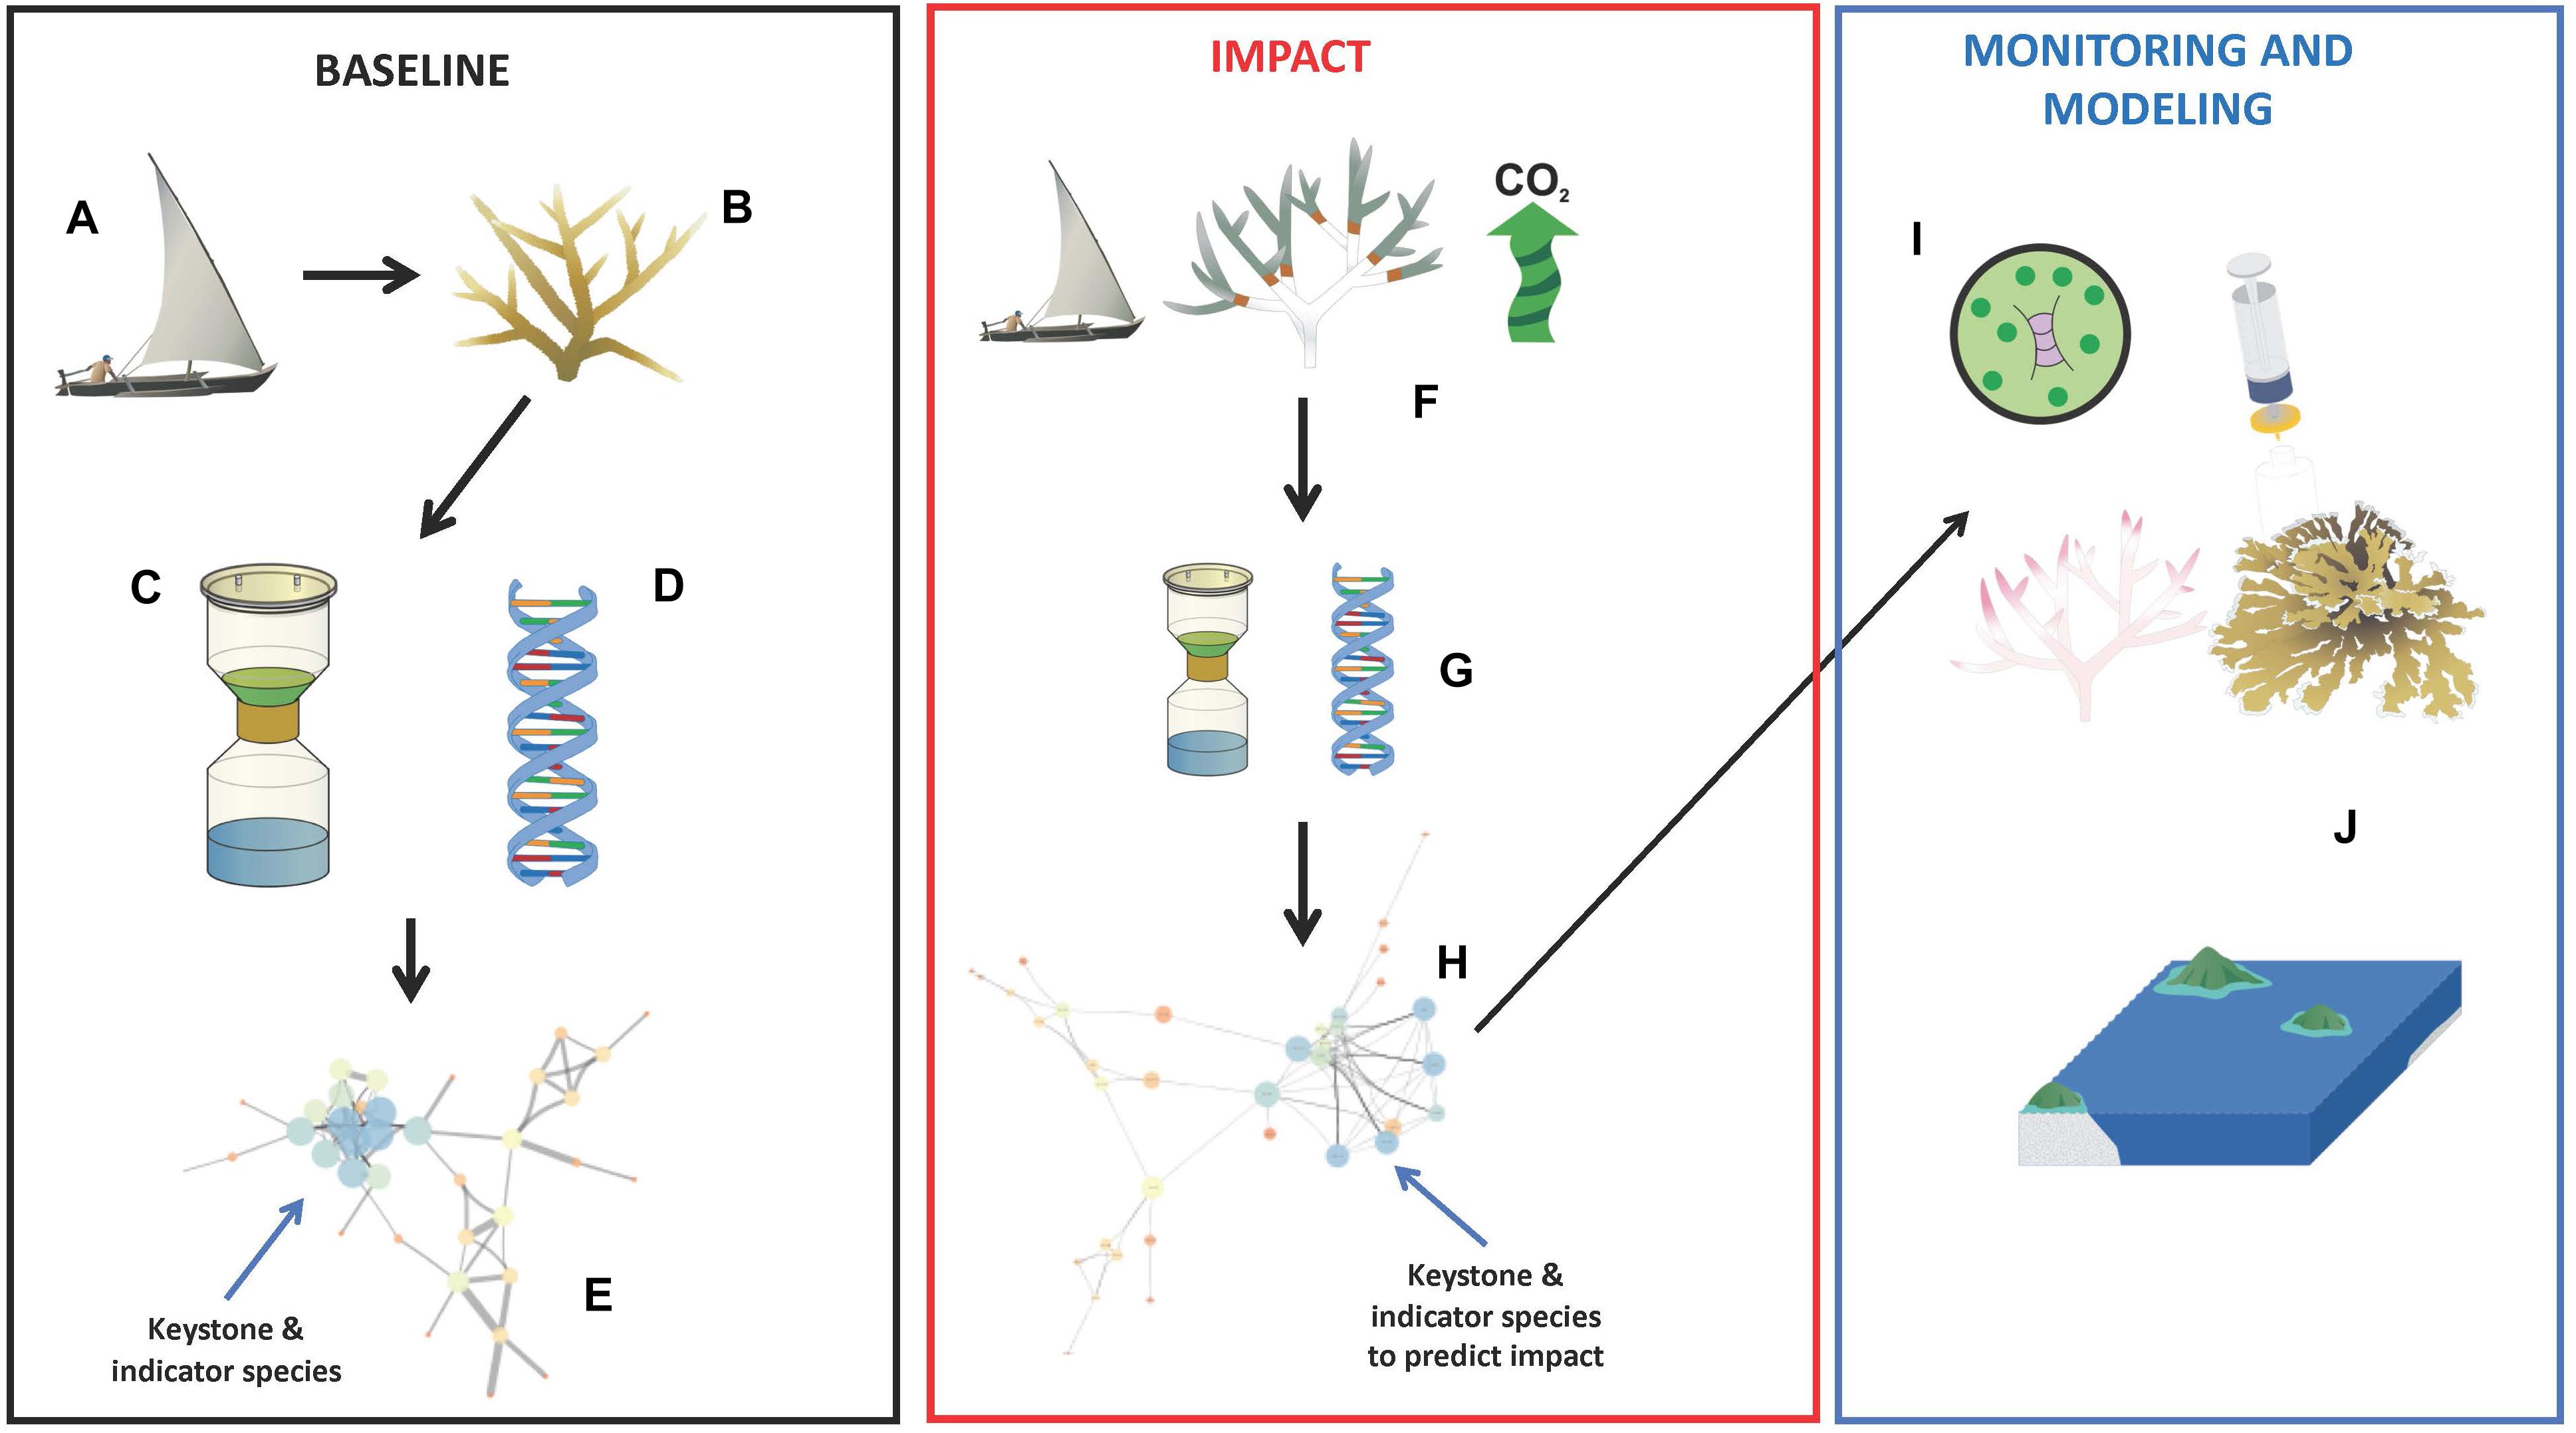
Figure 2. Workflow for citizen science driven monitoring of ocean health using microbes. Citizen oceanographers (A) sample ocean habitats, represented here by a healthy coral (B). Microbes are harvested from seawater on a filter (C) which then undergoes metagenomic sequencing (D) to profile the abundance of microbial species. This data is converted into a network analysis (E) which allows high-resolution metrics of microbial diversity and determines “keystone” species indicative of the baseline habitat at the time of sampling. Further sampling following ecosystem impacts (F) and replicated sample processing (G) allow robust comparison of changing microbiota (H) relative to the baseline. Specific organisms indicative of ecosystem change can then be further monitored using cheaper and simpler tools (I) to model ocean health (J). Images courtesy of the Integration and Application Network, University of Maryland Center for Environmental Science (ian.umces.edu/symbols/).
Volunteer Training and Testing
Citizen sailing volunteers start the process by signing up on the IVE website1. They read through program protocols that provide directions on the parameters to be collected/measured. These include plankton sample collection and preservation, temperature and salinity measurements, making sea state observations, and recording location. Participants are then sent either an automated or handheld water collection device. IVE team members Skype with volunteers before and during their excursions to provide comprehensive support before and during their time sampling. Social media is used to communicate information about the voyages to the wider public.
Results Through Robust Quality Assurance/Quality Control of Volunteer Data
Calibration and Standardization of Equipment
Following each cruise, equipment is sanitized by the volunteers before being sent back with samples to IVE headquarters. Upon arrival, equipment is subjected to thorough decontamination and calibration protocols, and samples are processed and analyzed. The additional decontamination step upon return of the equipment is more thorough than the sanitation performed by citizen scientists and minimizes the risk of cross contamination of invasive species between subsequent uses.
Validation Methods by Expert Marine Scientists
The advisory board of IVE consists of leading experts in the study of the marine microbiome who regularly sail on the organization’s yacht. To date, five coastal passages and three long distance ocean crossings have been completed. Key partnerships with oceangoing organizations around the world (e.g., SeaMester and SeaTrek Bali) provide opportunities for temporally intensive data collection in key areas of the ocean, and independent validation of equipment and protocols. While at sea, the team develops and tests the design of their auto-sampling device to standardize collection techniques and establish protocols aimed at reducing sampling variability. Results will be published in peer-reviewed journals and presented at international science conferences.
Accounting for Random Error and Systematic Bias
Due to the high number of samples collected and multidimensional statistics employed in data analysis, bias and error are incorporated into the core statistical workflows, for example, generating random null data distributions to assess the significance of patterns observed. Additionally, for many habitats, professional scientists collect samples to ground-truth collection methods. IVE has conducted three transects of the Indian Ocean to validate community patterns.
Replication Across Volunteers
To date, more than 1,000 samples have been collected. Because the routes of sailors are generally consistent with predominant winds and currents, many of the samples are replicated by volunteers over the course of their travels (Figure 3). Thus, collectively the information constitutes long-term data series from which baseline conditions can be established and the effects of climate change and anthropogenic disturbances on the marine microbiome measured. Lauro et al. (2014) estimate that these samples were acquired at a cost that is approximately 20 times less expensive than traditional methods using oceanographic vessels. Ocean sailing races (e.g., Clipper Race, Ocean Race, Vendée Globe, and Mini Transat) should also be regarded as unprecedented resources for the future of microbial ocean observations. By equipping each racing yacht with sampling devices, multiple independent replicate samples may be collected across the same transect. An additional benefit is that modern racing yachts travel at speeds in excess of 30 knots. Equivalent to three times the cruising speed of an oceanographic vessel, temporal confounding effects on the analysis of the spatial biogeography of the microbes can be minimized.
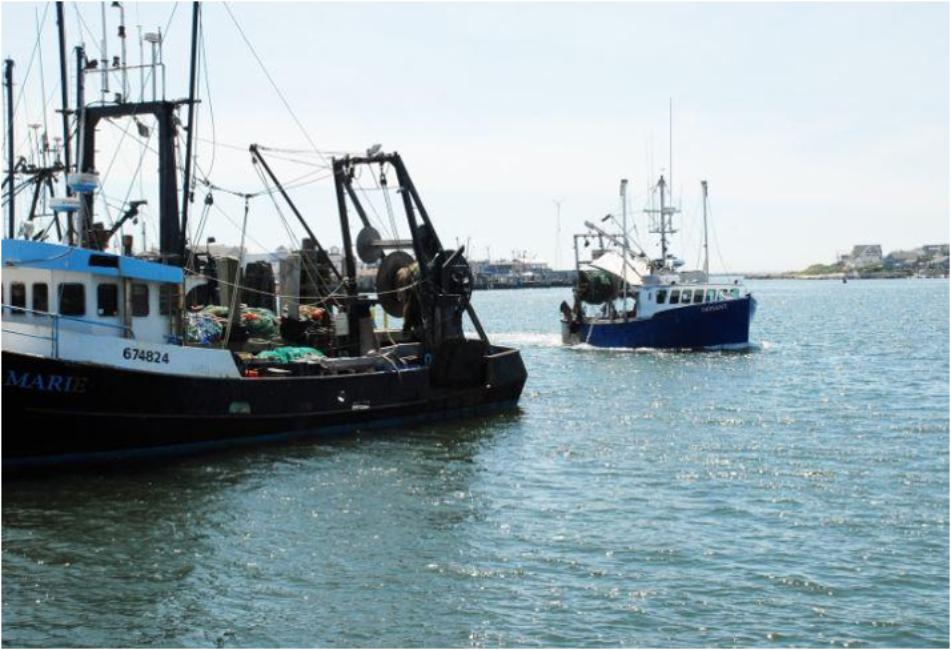
Figure 3. Fishing boats such as these can be used to help map the ocean floor. Image courtesy of NOAA.
Project Summary
Citizen oceanographers are making important contributions to our understanding of the marine microbiome and its relationship with ecosystem health, climate change and food security. Examples from IVE’s approach support the growing need to engage networks of volunteer citizen scientists in research, especially when the topics of interest involve spatial and temporal sampling challenges. Results from this study demonstrate that engaging the public is a win–win for all: positive media attention for sailors; reduced data gaps and access to unique habitats for scientists, and increased awareness about current and emerging ocean threats that are of global significance. The citizen oceanography approach has multiple ramifications. An engaged public focusing on marine microbe data collection will become informed of the environmentally induced changes at the microbiome level and more likely to advocate for changes at the governance level and with their public and private corporate leaders.
Just as the public benefits from increased understanding of the marine microbiome and implications for ocean health, so too will policy and decision makers have to consider allocating resources to mitigate the effects of environmental change. The emergent threats and risks related to maritime security, coastal infrastructure, food supply, and tourism can be identified from ocean and marine microbe analyses. Public projects can then be resourced to address each of these potential risks and help implement solutions. We envision that in the future, other networks of volunteer citizen scientists could be mobilized to focus on solutions for any of these priorities.
Example 3: Encouraging Innovative Supplementary Data Gathering: An International Hydrographic Organization Crowdsourced Bathymetry Initiative
Project Introduction
Bathymetry, defined as the depth and shape of the seafloor, underpins the safe, sustainable, cost effective execution of nearly every human activity at sea. Yet, most of the seafloor remains unmapped and unexplored. Less than 18% of the oceans have been directly measured (Mayer et al., 2018). The vast majority of the data used to compile seafloor maps are estimated depths derived from satellite gravity measurements. These data can miss significant features and provide only course-resolution depictions of the largest seamounts, ridges and canyons. Progress in mapping coastal waters is only marginally better. International Hydrographic Organization (IHO) publication C-55, Status of Surveying and Charting Worldwide, indicates that about 50% of the world’s coastal waters shallower than 200 m have not been surveyed. Ongoing collaborative mapping efforts, both global [e.g., IHO, General Bathymetric Chart of the Ocean (GEBCO), Seabed 2030] and regional [e.g., the Atlantic Ocean through the Atlantic Ocean Research Alliance (AORA) and the Galway Statement] are underway to improve this situation but remain vastly under-resourced.
The IHO has a history of encouraging innovative ways to gather data and data maximizing initiatives so that we can better understand the bathymetry of the seas, oceans and coastal waters. In 2014, the IHO, at its Fifth Extraordinary International Hydrographic Conference, recognized that traditional survey vessels alone could not be relied upon to solve data deficiency issues and agreed there was a need to encourage and support all mariners in an effort to “map the gaps.” One outcome of the conference was an initiative to support and enable mariners and professionally manned vessels to collect crowdsourced bathymetry (CSB). The information would be used to supplement the more rigorous and scientific bathymetric coverage done by hydrographic offices, industry, and researchers around the world.
While CSB data may not meet accuracy requirements for charting areas of critical under-keel clearance, it does hold limitless potential for myriad other uses. If vessels collect and donate depth information while on passage, the data can be used to identify uncharted features, assist in verifying charted information, and to help confirm that existing charts are appropriate for the latest traffic patterns. This is especially relevant considering that many soundings on charting products are pre-1950. In some cases, CSB data can fill gaps where bathymetric data are scarce, such as unexplored areas of polar regions, around developing maritime nations, and the open ocean. CSB also has potential uses along shallow, complex coastlines that are difficult for traditional survey vessels to access. These areas may be more frequently visited by recreational boaters whose data could help illustrate seafloor and shoaling trends from the repeated trips they make along their favorite routes. CSB will also be invaluable in providing ground-truthing data to validate Satellite Derived Bathymetry (SDB). SDB is a necessary technology in the Arctic yet has a serious validation problem irrespective of the model (empirical, semi-empirical, or physics). Finally, crowdsourced bathymetry can provide vital information to support national and regional development activities and scientific studies in areas where little or no other data exists.
Approach/Methods
The key to successful CSB efforts is volunteer observers who operate vessels-of-opportunity in places where charts are poor or where the seafloor is changeable and hydrographic assets are not readily available (Figure 3). The International Convention for the Safety of Life at Sea (SOLAS) 1974 carriage requirements oblige all commercial vessels to be equipped with certified echo-sounders and satellite-based navigation systems. As a result, the world’s commercial fleet represents a significant, untapped source of potential depth measurements. Even most non-commercial ships and boats are equipped to measure and digitally record their depth in coastal waters and an ever-increasing number of vessels can also take measurements in deeper water. The CSB vision is to tap into volunteer enthusiasm for mapping the ocean floor. Enabling trusted mariners to easily contribute data will augment current bathymetric coverage and enhance charting capabilities of the bathymetric initiative.
Technological Advancement of Data Gathering and Sharing Methods
Under the guidance of the IHO Crowdsourced Bathymetry Working Group (CSBWG), the National Oceanic and Atmospheric Administration (NOAA) has been working over the last few years to provide archiving, discovery, display and retrieval of global crowdsourced bathymetry data contributed from mariners around the world. These data reside in the IHO’s Data Centre for Digital Bathymetry (DCDB), hosted by NOAA’s National Centers for Environmental Information (NCEI), which also offers access to archives of oceanic, atmospheric, geophysical, and coastal data (Figure 4).
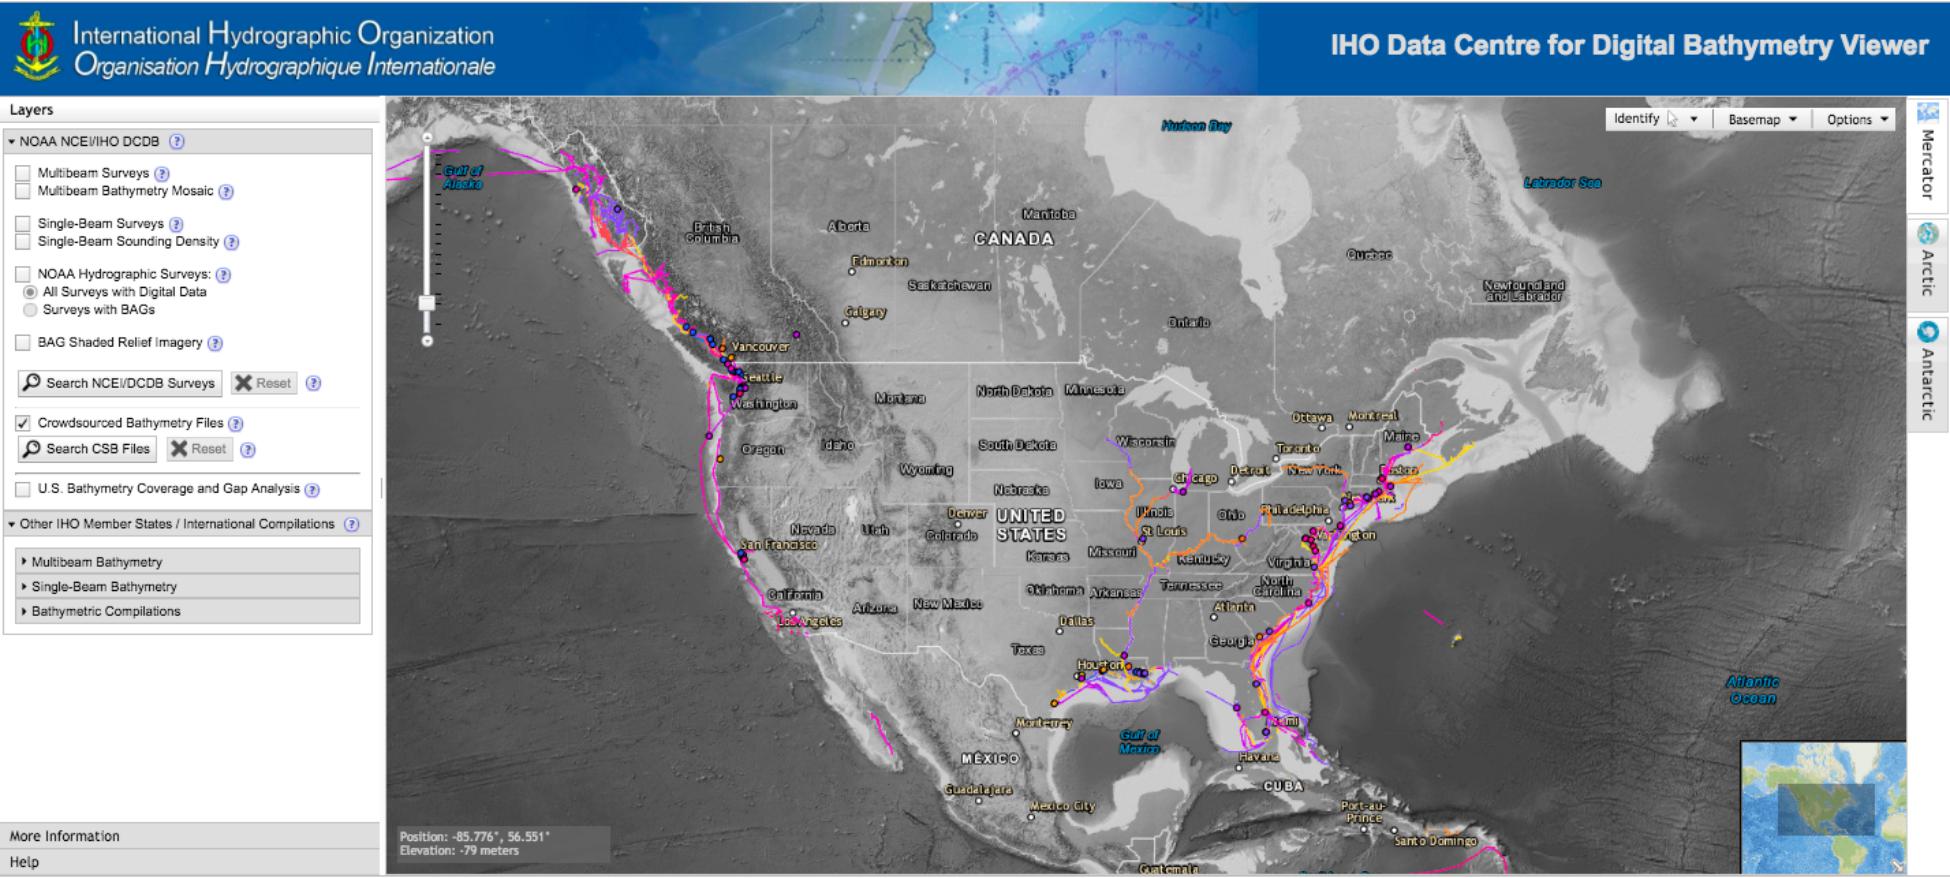
Figure 4. The IHO DCDB Bathymetry viewer displays various bathymetric data holdings (including crowdsourced bathymetry ship track lines, shown here in purple/pink) from NOAA NCEI and other repositories to support international seafloor mapping efforts.
Crowdsourced bathymetry enters the DCDB through a variety of trusted sources or nodes (e.g., partner organizations, companies, and non-profit groups) that enable mariners to voluntarily contribute seafloor depths measured from their vessels. Rose Point Navigation Systems, a provider of marine navigation software, helped kick start the stream of data from a crowd of mariners. Specifically, users of their software were given the option to enable logging of their position, time and depth. Users were then given the choice to submit their data anonymously or provide additional information (vessel or instrument configuration) to enrich their dataset. Rose Point then collates the observations and submits them to the IHO DCDB where anyone can access the data for commercial, scientific, or personal use.
The intent is that these data, like all bathymetric data submitted to the DCDB, would not necessarily be “harmonized” or reviewed but would reside in the DCDB “as is.” It would remain up to the end users to determine their value and utility for their own purpose. In this way, the fundamental data that reside in the DCDB will serve as the world reference raw bathymetric data set which can be used as the basis for refined and processed products.
Volunteer Guidance
The IHO CSBWG, comprised of international scientific, hydrographic and industry experts, was tasked by the IHO to draft a guidance document meant to empower mariners to map the gaps in the bathymetric coverage of the world’s ocean. This document describes what constitutes CSB, the installation and use of data loggers, preferred data formats, and instructions for submitting data to the IHO DCDB. The document also provides information about data uncertainty to help data collectors and data users better understand quality and accuracy issues with crowdsourced bathymetry. The document will become an adopted IHO publication on crowdsourced bathymetry in early 2019. The working group is now focused on developing an outreach plan covering the “why, what, where and how” to encourage all vessels at sea to collect bathymetric data as part of a mariner’s routine operations.
Early Results
The crowdsourced bathymetry database currently contains more than 117 million points of depth data. These have been used by hydrographers and cartographers to improve nautical chart products and our knowledge of the seafloor. Two early testers of the data are the hydrographic offices at NOAA and the Canadian Hydrographic Service.
Case Study #1: NOAA Chart Adequacy Assessment
NOAA, in partnership with George Mason University, is using the crowdsourced depths submitted to the database to assess the adequacy of its nautical chart products. Comparing mariner-supplied crowdsourced bathymetry against existing charted depths and survey data, NOAA can determine when areas require updated survey information and identify chart discrepancies before an incident occurs (Figure 5). The information is particularly important in areas where the bottom shifts frequently. Additionally, crowdsourced bathymetry measurements over well-trafficked or repeated routes can provide a time series to better refine survey planning for different areas and harbors. This information allows NOAA to better prioritize and plan survey operations and maintain nautical charts.
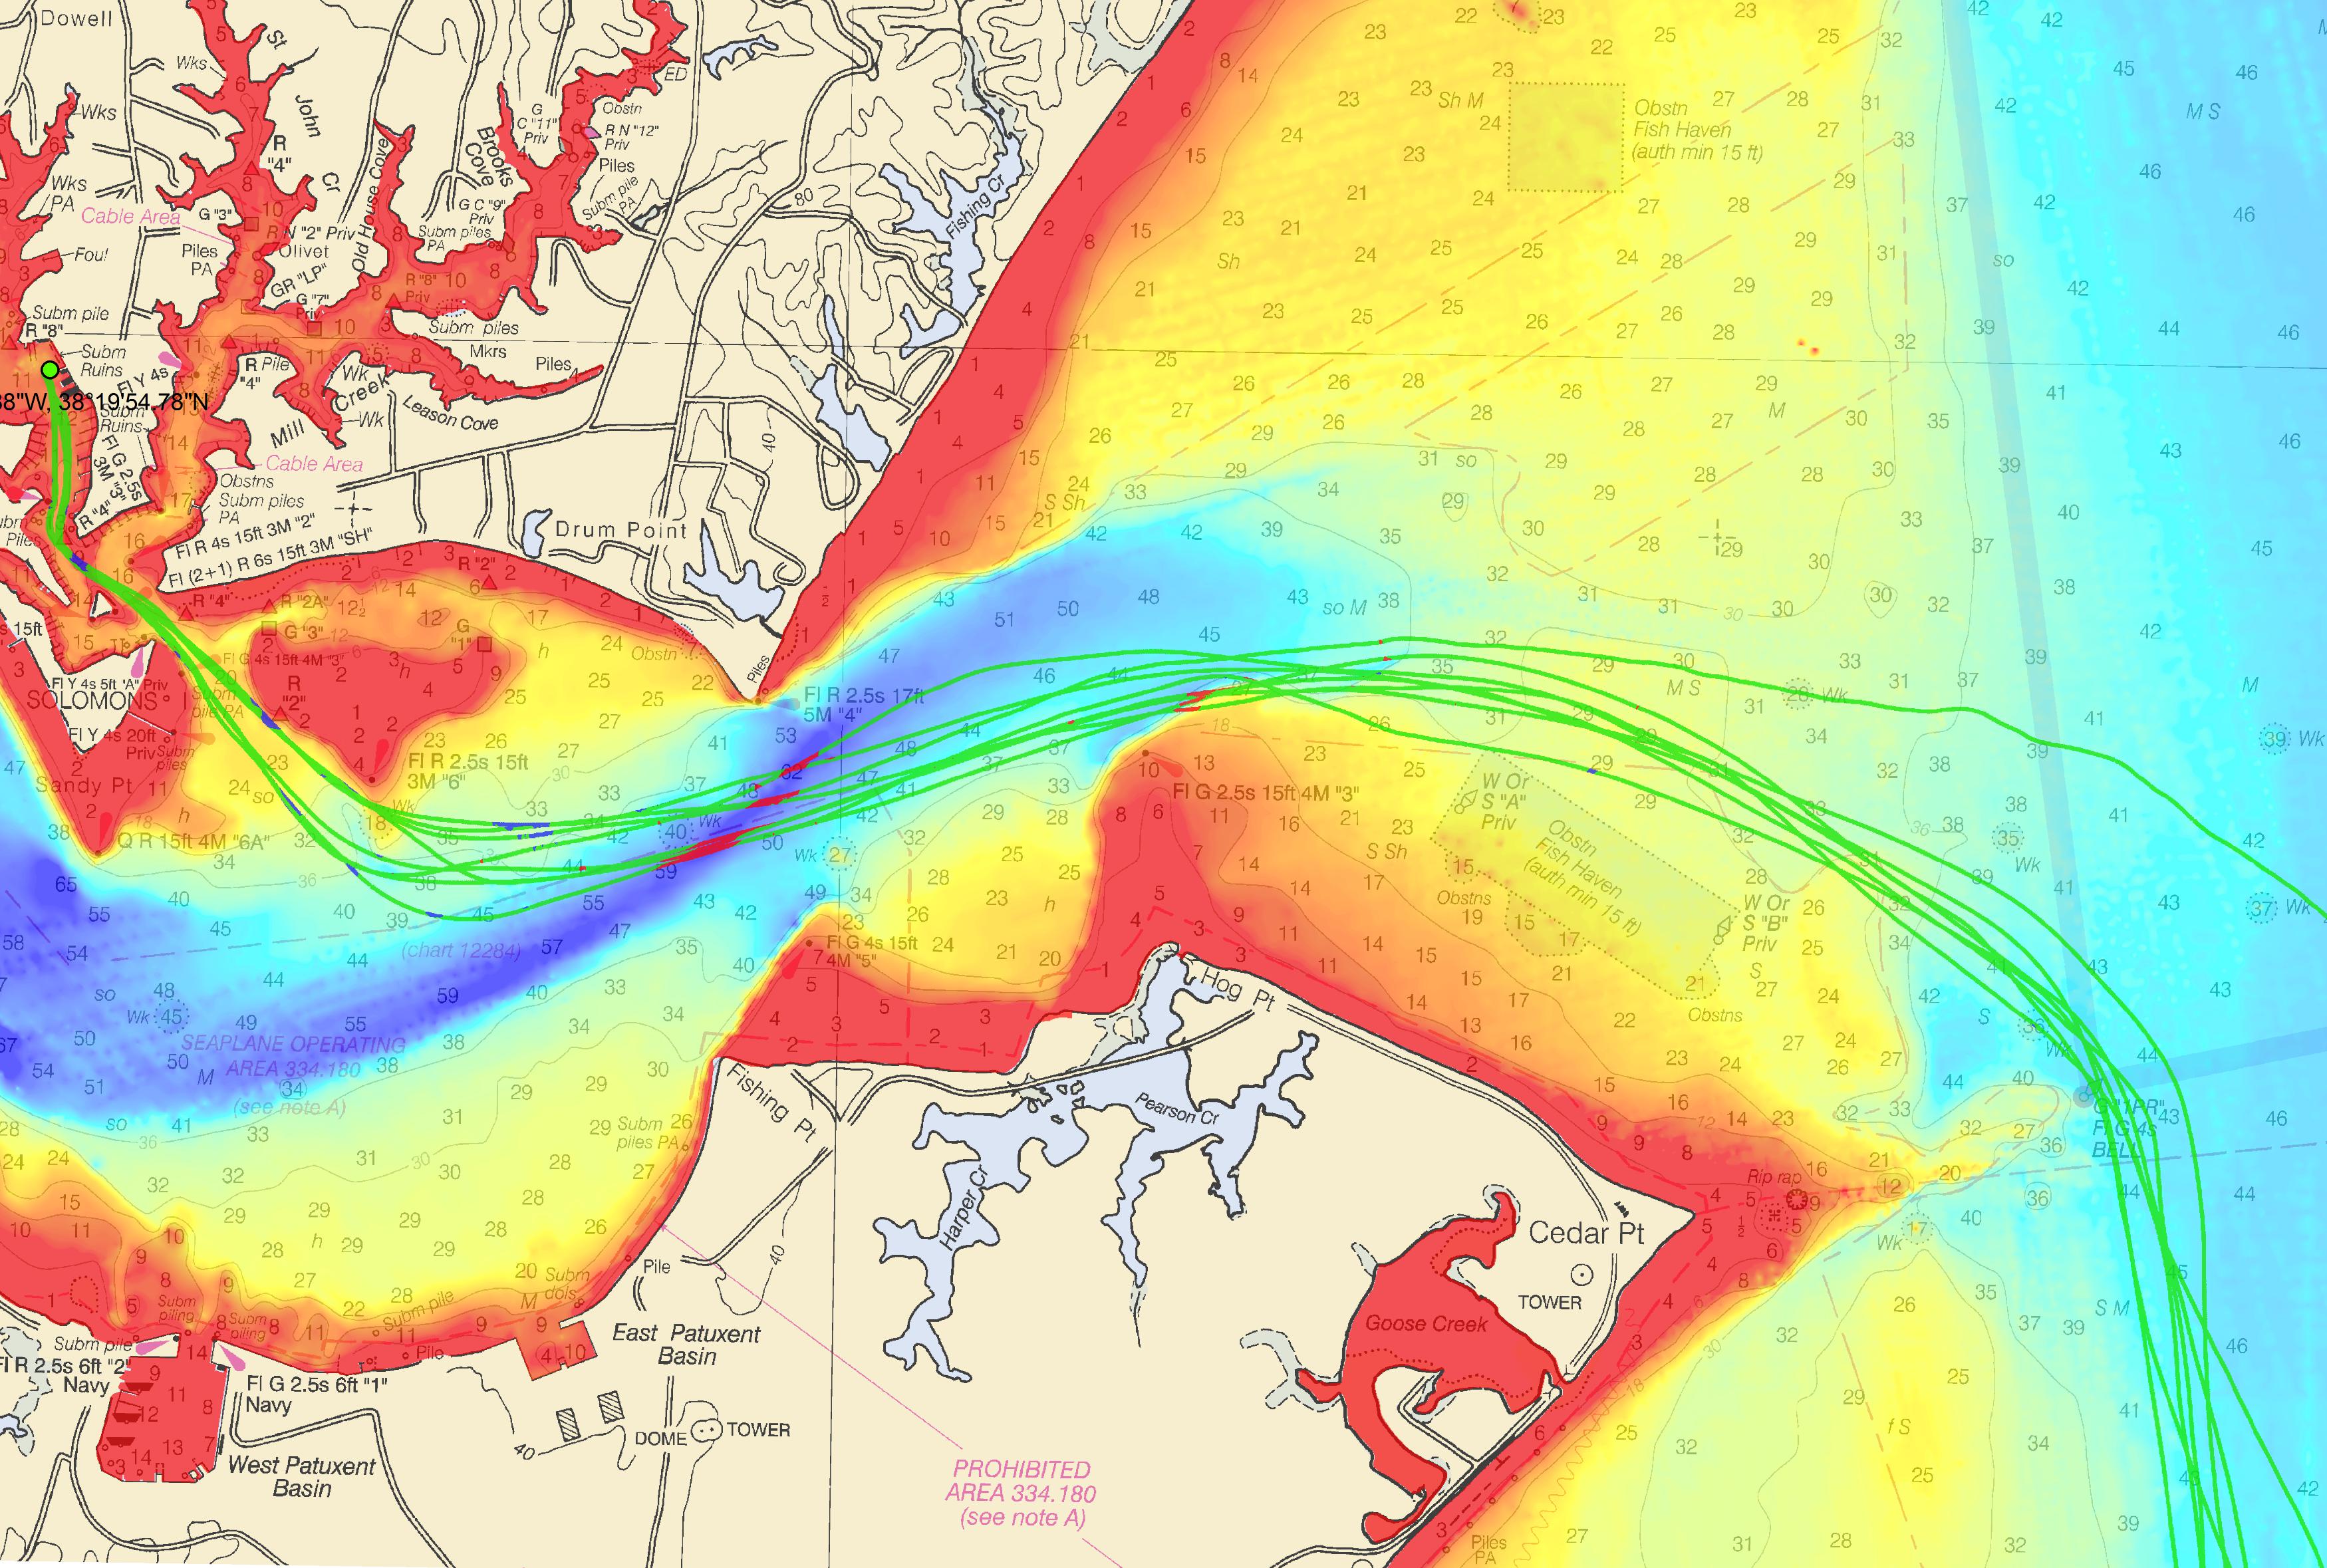
Figure 5. NOAA’s Bay Hydro II crowdsourced bathymetry test tracks in green overlaid on multibeam survey data demonstrates how changes can be detected. Image courtesy of NOAA.
Chart adequacy assessments have proven to be a valuable tool for using similar publicly available data sources such as Satellite Derived Bathymetry to enhance the quality of NOAA’s cartographic products. These assessments can provide valuable and timely information in situations of immediate need, such as disaster response. More information on chart adequacy assessments using non-survey bathymetry data can be found in collaborative publications with both the University of New Hampshire’s Center for Coastal and Ocean Mapping and GEBCO.
Case Study #2: Canadian Hydrographic Service: Inside Passage
The Canadian Hydrographic Service (CHS) has used this dataset to update several Inside Passage charts along the coastal routes stretching from Seattle, Washington, to Juneau, Alaska. The data were downloaded and easily converted into CHS formats. A systematic comparison of charted depths less than 10 m yielded improved charted channel depths, data density and improved chart compilation in areas that were surveyed with singlebeam. CSB helped prioritize survey areas for the following survey season and initiated the publication of Notices to Mariners.
Project Summary
The IHO invites more maritime companies to support crowdsourcing efforts by making it simple for their customers to participate using their navigational systems. For example, Rose Point Navigation Systems further promoted the IHO crowdsourced bathymetry initiative by moving the option to collect and contribute bathymetry data to a more visible section of its program options menu. Crowdsourced efforts and the crowdsourced bathymetry database are poised to become a major source of information. They are not only improving nautical chart coverage and accuracy, but contributing to international mapping efforts such as Seabed 2030. These data have the potential to become critical resources for coastal zone management and environmental and scientific studies, particularly in areas of little perceived commercial or strategic value.
Example 4: 50,000 Citizen-Science Collected GPS Flood Extents Used to Validate a Street-Level Hydrodynamic Model Forecast of the 2017 King Tide in Hampton Roads, VA
Project Introduction
The rate of sea level rise in Hampton Roads, VA, is primarily dictated by polar ice melting, local land subsidence, and the relative strength of the Gulf Stream current. Combined, these interact to influence the extent of inundation under different circumstances. Catch the King Tide was the world’s largest simultaneous citizen-science GPS data collection effort to document the extent of flooding during a king tide. These higher than normal tides typically occur during a new or full moon and when the Moon is at its perigee. More than 700 volunteers mapped the king tide’s maximum flood extent to validate and improve predictive models and future forecasting of increasingly pervasive nuisance flooding. 59,006 high water marks and 1200+ geotagged pictures of inundation were captured using the ‘Sea Level Rise’ mobile app to trace the shape of the floodwaters using GPS location services. Heavily promoted by the local news media, citizen engagement during the inundation event was high, resulting in an average of 572 GPS-reported high water marks per minute during the hour surrounding the king tide’s peak, observed at 9:32 am local time on November 5, 2017, in Hampton Roads, VA.
Tidewatch is a tidal prediction system developed by the Virginia Institute of Marine Science (VIMS) which provides forecasts for 12 sites throughout Chesapeake Bay. Since then, the predictions have expanded to include 18 new sensors installed by the United States Geological Survey (USGS) in 2016 and 28 new stations installed by the StormSense Smart Cities Initiative in 2017–2018 throughout Hampton Roads prior to the 2017 king tide (Rogers et al., 2017). An interactive map of the new gauges was superposed with VIMS’ tidal inundation predictions before the flood event to inform volunteers where flooding was predicted to occur in public spaces, and then the map was populated in near-real time with the GPS-reported high water marks as they were retrieved from the Sea Level Rise App. The map for 2017’s Catch the King tide event can be viewed at: http://bit.ly/2zcS7Ba, and the predictions and data for the 2018 king tide on October 27 are available at: https://bit.ly/2QCLwF0.
Technological Advancement of Data Gathering and Sharing Methods
Each year, prior to the king tide flood event, Dr. Derek Loftis at the VA Commonwealth Center for Recurrent Flooding Resiliency (CCRFR) designs a web map to direct volunteers to public places that are forecasted to flood during the King Tide using VIMS’ hydrodynamic models. An interactive story map with geospatial tidal flood forecasts for the king tide was embedded in digital versions of print media articles of local media groups for 10 weeks leading up to the king tide monitoring event in 2017. This engagement tool was invaluable, and was connected with the Sea Level Rise free-to-use mobile app, and Facebook, which in conjunction with the constant support of the event’s media partners, reached over 10,000 page views before the 2017 King Tide in less than 3 months after launch: http://www.vims.edu/people/loftis_jd/Catch%20the%20King/index.php.
Then, during the king tide, time-stamped GPS data points along the floodwater’s edge were collected by many trained volunteers to effectively breadcrumb/trace the high water line. Subsequently, these points were used to verify the accuracy of the tidal flood predictions from the Tidewatch Coastal Inundation Model. This effort for predicting tidal flooding can be mapped using multiple methods (which were all used in 2017 and 2018):
(A) A simple bathtub model using topographic elevations corresponding to current or forecasted water levels at a nearby water level sensor (Loftis et al., 2013, 2015).
(B) A street-level hydrodynamic model fed atmospheric and open boundary tidal and prevailing ocean current inputs from large scale models translated to the street level via computationally efficient non-linear solvers (Wang et al., 2014) and semi-implicit numerical formulations (Loftis et al., 2016) aided by a sub-grid geometric mesh (Steinhilber et al., 2016) with embedded Lidar data (Boon et al., 2018).
(C) Interpolated measurements from densely-populated mesh networks of water level sensors advised by artificial intelligence and real-time data assimilation, such as StormSense (Loftis et al., 2018).
Volunteer Training and Testing
The volunteer coordination effort involved a hierarchical scheme led by an adept volunteer coordinator from the Chesapeake Bay Foundation. Qaren Jacklich has successfully led the “Clean the Bay Day” litter collection initiative in Chesapeake Bay for several years prior to Catch the King, and without her interaction with each of the hundreds of registered volunteers, there would be far less tidal flooding data. Working below Qaren, the volunteer coordinator, were over 120 volunteer “Tide Captains” who led smaller groups of volunteers in their flood-prone subdivisions, neighborhoods, and communities (Figure 6). In many cases, these tide captains were knowledgeable, trained teachers, and enthusiastic users of the Sea Level Rise mobile app. They trained neighbors, friends and children in their communities at more than 35 separate volunteer training events held all over Hampton Roads’ spanning 12 major cities and counties in 2017. In 2018, 42 training events were offered.
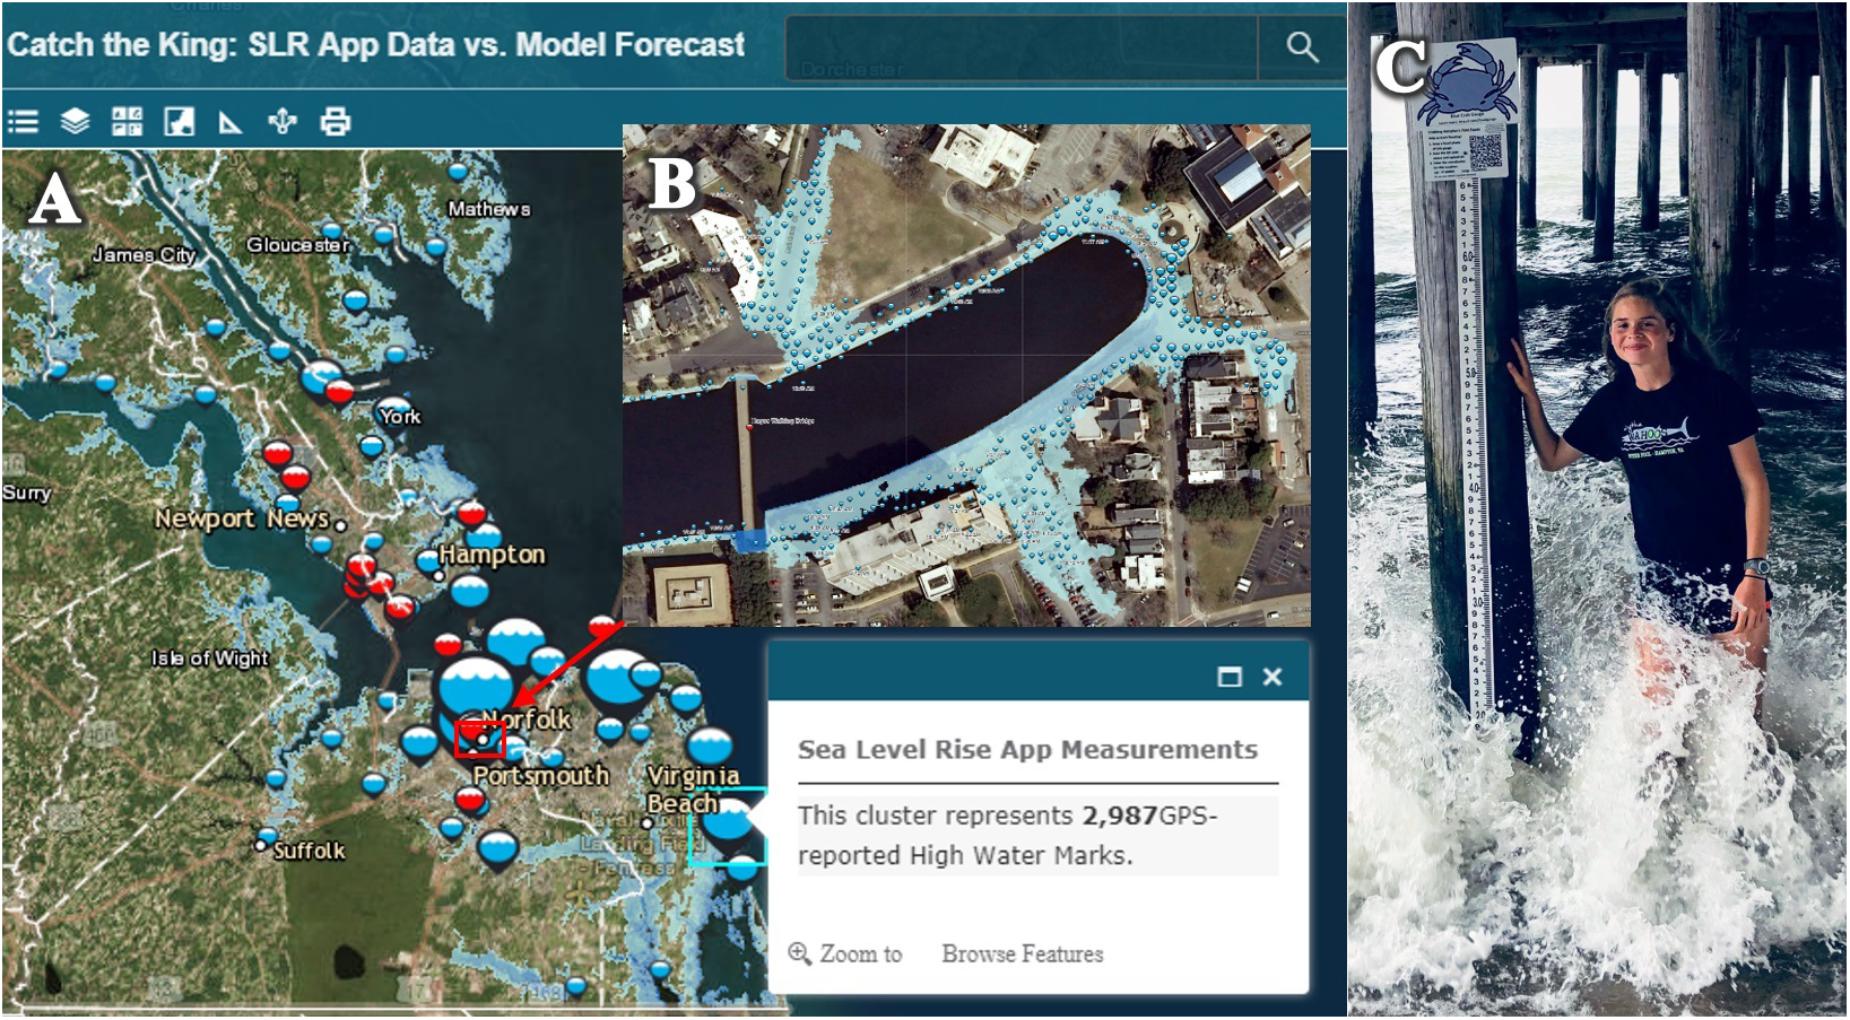
Figure 6. (A) Web map of king tide inundation extent data collection on 11/5/2017. http://arcg.is/1HLOPS. (B) Inset: zoom of Norfolk’s historic Hague depicting a zoomed map of the area with dense patches of volunteer-observed flood extents noted with timestamped blue dots, and model-predicted tidal flood extents in light blue. (C) Student scientists photograph flood gauges during tidal inundation events and scan a QR code to upload their images via a geoform or the Sea Level Rise App to aid in validating flood depths. Photo credit: Derek Loftis.
Approximately 45% of the 722 registered volunteers attended an outdoor formal training session on how to use the Sea Level Rise mobile app to document active flooding. This approach was used in 2017 to map the flooding extents across 12 coastal cities and counties in Virginia by pressing the ‘Save Data’ button in the ‘Sea Level Rise’ App every few steps along the water’s edge during the high tide on the morning of November 5th, 2017, and October 27, 2018 (Figure 6A). The Sea Level Rise mobile app is capable of taking field notes and uploading time-stamped, geotagged pictures and recording accurate location history for mapping tidal flooding. The mobile app is also innovative in that the quality assurance mechanism is inherently hierarchical, allowing the event coordinator to limit participation to certain registered users and filter data permissions such as photo uploads and GPS data collection to only certain trained users. Event managers can download their data as.csv files after the specified time window for their flood monitoring event has closed, and even retroactively remove volunteers that consistently measured erroneous data points. The resulting maps shown in the next section represent dense areas of flood extent data areas surveyed during the event (Figure 6B), followed by lessons learned.
Results Through Robust Quality Assurance/Quality Control of Volunteer Data
Calibration and Standardization of Equipment
People attended a sea level rise app training event in a parking lot near the waterfront. They learned how to make notes, take pictures, and breadcrumb their path along transects. They worked in the parking lot and along the high tide line on a waterfront to calibrate their phones and for the reference of the scientists who can later review their user number to best interpret their results (Figure 7). Inevitably, the app performance and relative GPS accuracy is different across the iOS and Android platforms and is even more dependent upon the hardware of the many different models in the repertoire of each vendor on these platforms. For example, some older phone models don’t use enhanced GPS, location from satellites, nearby cell towers, or nearby WiFi gateways with geolocation while some of the latest models have multiple antennae and can triangulate a user’s phone in the repertoire of each vendor on these platforms.
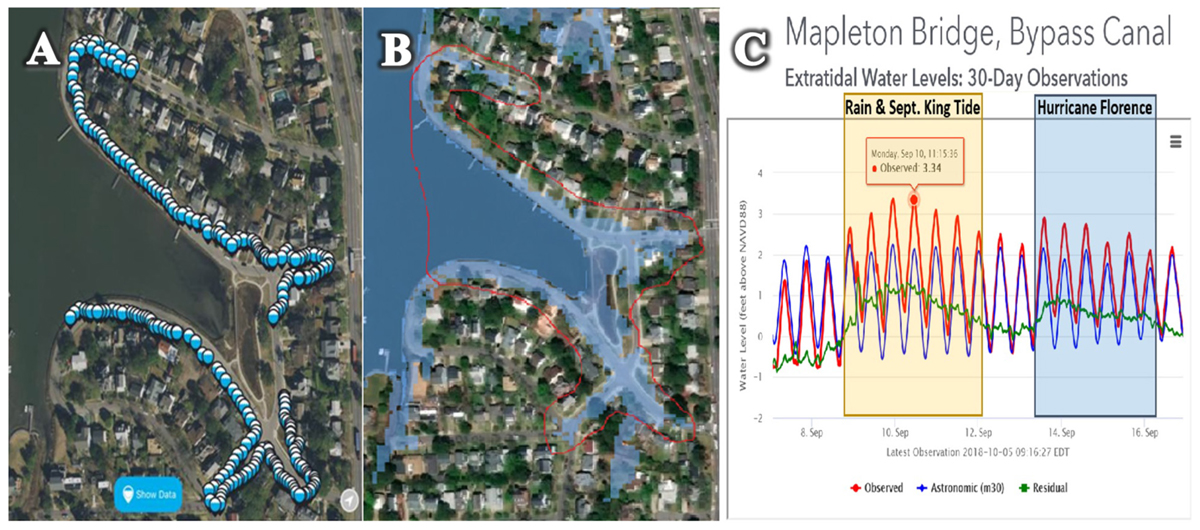
Figure 7. (A) Sea Level Rise Mobile App GPS data compared with (B) Tidewatch geospatial inundation forecast at 11:15 am local time on September 10, 2018, in Larchmont, Norfolk, VA, after (C) 6 inch of rainfall concomitant with the Sept. King Tide was detected at a nearby weather station just 4 days prior to the arrival of 2018 Hurricane Florence.
With such a disparity of technologies across a monitoring group, a radial accuracy error metric (in m) was recorded for each measurement to inform scientists of a circular envelope of possible user locations for each measurement (Loftis et al., 2016). These locational accuracies are the first filtering metric when reviewing data. Anything greater than 5 m error was filtered out for validation. This removed approximately 2.8% of all recorded measurements during the 2017 Catch the King.
Validation Methods by Expert Marine Scientists
Field-collected pictures, notes and flood extents are submitted through the Sea Level Rise Mobile application and are time-stamped and stored digitally at the searisingsolutions.com website. Data and metadata are simultaneously entered into a Microsoft Excel database by the app and interpreted by data scientists and data-certified volunteer coordinators who are registered as managers within each flood mapping region, to check for quality assurance. The GPS data are then filtered into geo-tagged photos and GPS points. The photos are used to reference inundated landmarks with survey monuments nearby to interpret depths against the USGS topobathymetric 1-m resolution Digital Elevation Model for the Chesapeake Bay (Danielson et al., 2016).
The GPS data points without attached photos are used to compare with contour data for the bathtub tidal prediction models and interpret slope of water throughout the river and bay basins. This is especially important if there is significant wind concomitant with a king tide. The GPS data are then enhanced with the Lidar elevations from the USGS DEM and filtered to remove any areas greater than 3 feet above the maximum observed tidal water level at any of the nearby water level sensors (5 feet for storm surge). The true benefits of mapping a king tide are to have a record of highest astronomical tidal extents in a region over time, while simultaneously educating volunteers of their flood risk, and validating and improving flood models. Adding value to this, volunteers now know how to map flooding in their community and can use low-stakes flood events like a king tide as an opportunistic dress rehearsal to learn how to accurately map inundation before more significant events like 2018 Hurricane Florence (Figure 7). In more severe cases, once volunteers are safely comfortable that adverse conditions have passed, inundation markers such as debris lines are recorded similar to USGS file reports (but with less sophisticated surveying equipment) to capture flood features that are likely to be removed before official survey crews come by to document the event more than 24 h later.
In addition to the flood extent monitoring effort through the Sea Level Rise App, some communities have engaged middle school and high school students in characterizing the flood in terms of depths. Since mobile phones currently do not have exceptionally accurate altitude sensors, the GPS breadcrumbs of tidal extents are converted to inundation contours to interpret relative depths from Lidar-derived digital elevation models for vertical comparison with VIMS’ street-level models. While these DEMs are the same as those implemented in the hydrodynamic flood forecast models, recent Lidar elevations are needed to accurately assess depths throughout the region, and most Lidar surveys used in Hampton Roads are nearly 5 years old. As subsidence in the region has been observed to be inhomogeneous (Bekaert et al., 2017), assumptions of these elevations being accurate as appended to the Volunteer data based upon GPS location is questionable. Thus, implementing flood depth gauges in frequently flooded areas that volunteers can photograph near surveyed landmarks has been a key factor in assuring quality citizen-science data through Catch the King. Thus, student projects in the region have recently centered around closing this gap to allow people to learn more about local sea level rise for a relatively low cost. One such project consists of six flood-monitoring gauges around the city at which everyday citizens or “citizen-scientists” input the altitude measurements of flooding. Getting school groups involved in this research has been a central component in making Catch the King a year-round tide mapping and education initiative.
The filtered and vertically validated data are then compared using each citizen-observed point and comparing them to the predicted maximum flood extent raster as a geospatial predictive accuracy metric of mean horizontal distance difference in m, similar to Steinhilber et al. (2016). Water levels were compared with nearby water level gauges to estimate depths relative to a root mean squared error in cm.
Project Summary
The new water level sensor data and the crowd-sourced high water marks from the king tide were initially filtered for relative location accuracy and timing, interpolated with the use of digital elevation models to define estimated flood depths. This was subsequently compared with elevation contours to develop a difference map to identify areas where VIMS’ water level predictions through Tidewatch and via their street-level hydrodynamic model over-predicted and under-predicted flooding during the king tide. A geostatistical comparison between the model’s maximum inundation extents and the volunteers’ GPS observations yielded a mean horizontal distance difference of 19.3 feet (5.9 m). Vertical accuracy of the flood model’s predictions during the king tide were determined via comparison with 42 water level sensors to be within a root mean squared error of 1.4 inch (3.5 cm).
Example 5: Citizen Scientists: An Underutilized Resource for the United States IOOS
Project Introduction
The Gulf of Mexico Coastal Ocean Observing System (GCOOS) is the United States Integrated Ocean Observing System (IOOS) dedicated to the Gulf of Mexico (GoM). Actions of the organization support four focus areas and three cross-cutting themes identified in the Strategic Plan2. Focus areas include Marine Operations, Coastal Hazards, Healthy Ecosystems and Living Resources, and Human Health and Safety. The cross-cutting themes include Outreach and Education, Data Management and Communication, Numerical Modeling and Forecasting and Monitoring Long-term Environmental Change. Historically, as stakeholder products and services have been identified and developed, companion outreach and educational resources have been created (Simoniello et al., 2015).
The Gulf Citizen Science Portal (GCSP) described here has been structured to accommodate data and information acquired by volunteer monitoring networks throughout the GoM region. The information provided is complementary to data being served on the GCOOS Hypoxia Nutrient (H-N) Data Portal. Developed with support from the Gulf of Mexico Alliance, water quality-related information from approximately 80 organizations is aggregated in the H-N portal as a one-stop shop for Gulf resource managers3. The portal supports informed strategies needed to reduce nutrient inputs and hypoxia impacts. Covering the inshore waters of estuaries to the continental shelf break of the five United States Gulf states, users can inspect base maps of observations down to the station level.
The GCSP4 was built as the outreach and education component of the GCOOS H-N Data Portal. Gulf-wide, hundreds of grassroots groups monitor environmental conditions in their local areas. Often that information is not shared with management agencies or organizations that could make real-world use of it. One reason is that few organizations have the capabilities to handle the challenges inherent in integrating diverse datasets collected with different methodologies and instrumentation. GCOOS piloted the portal with two partner organizations as a cost-effective way to support cross-regional water quality collaborations (Figure 8). The goal was to create meaningful educational opportunities while at the same time allowing state, federal and academic programs to supplement datasets with important detail.
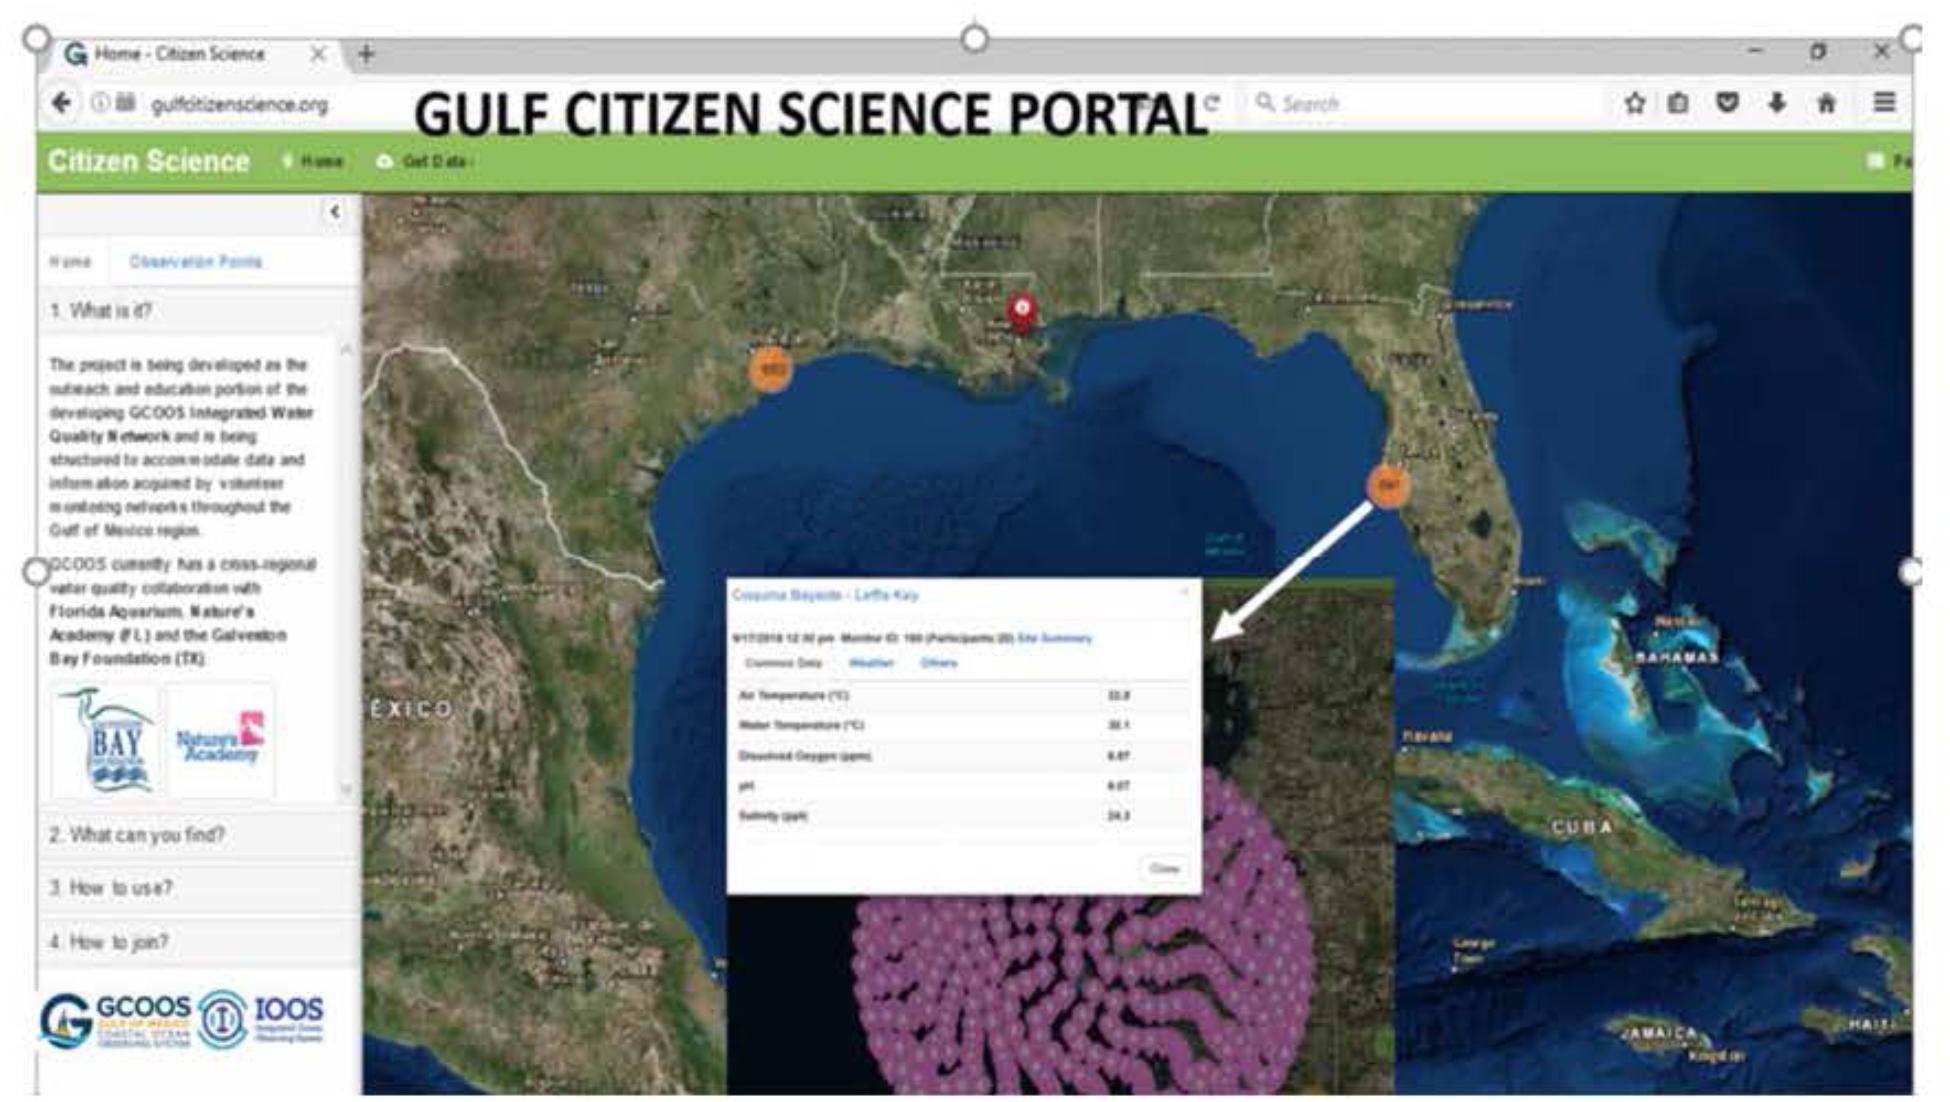
Figure 8. The Gulf Citizen Science Portal, with inset showing expanded view of data—air and water temperature, dissolved oxygen, pH and salinity, available at one station (Leffis Key, FL).
Volunteer Training and Testing
The integration of volunteer-collected metocean, water quality, biodiversity and marine debris data was developed in partnership with the Galveston Bay Foundation, Texas, and Nature’s Academy, Florida. Both non-profit programs were leading ongoing monitoring of a variety of environmental parameters but lacked sufficient data sharing methods. The Galveston Bay Foundation’s Water Monitoring Team (GBFWMT) is a citizen science initiative that trains volunteers to collect monthly water quality data from specific near-shore sites around Galveston Bay (Figure 9). For the past 6 years, 60 trained volunteers have monitored 60 sites around the Bay. Natures Academy offers a variety of STEM-focused and stewardship education programs. Launched in 2007, most of their 65,000 plus participants have engaged in water quality, biodiversity and marine debris-related data collection. Participation in Nature’s Academy programs is diverse and includes local underserved youth and groups from 42 states and five countries (Figure 9).
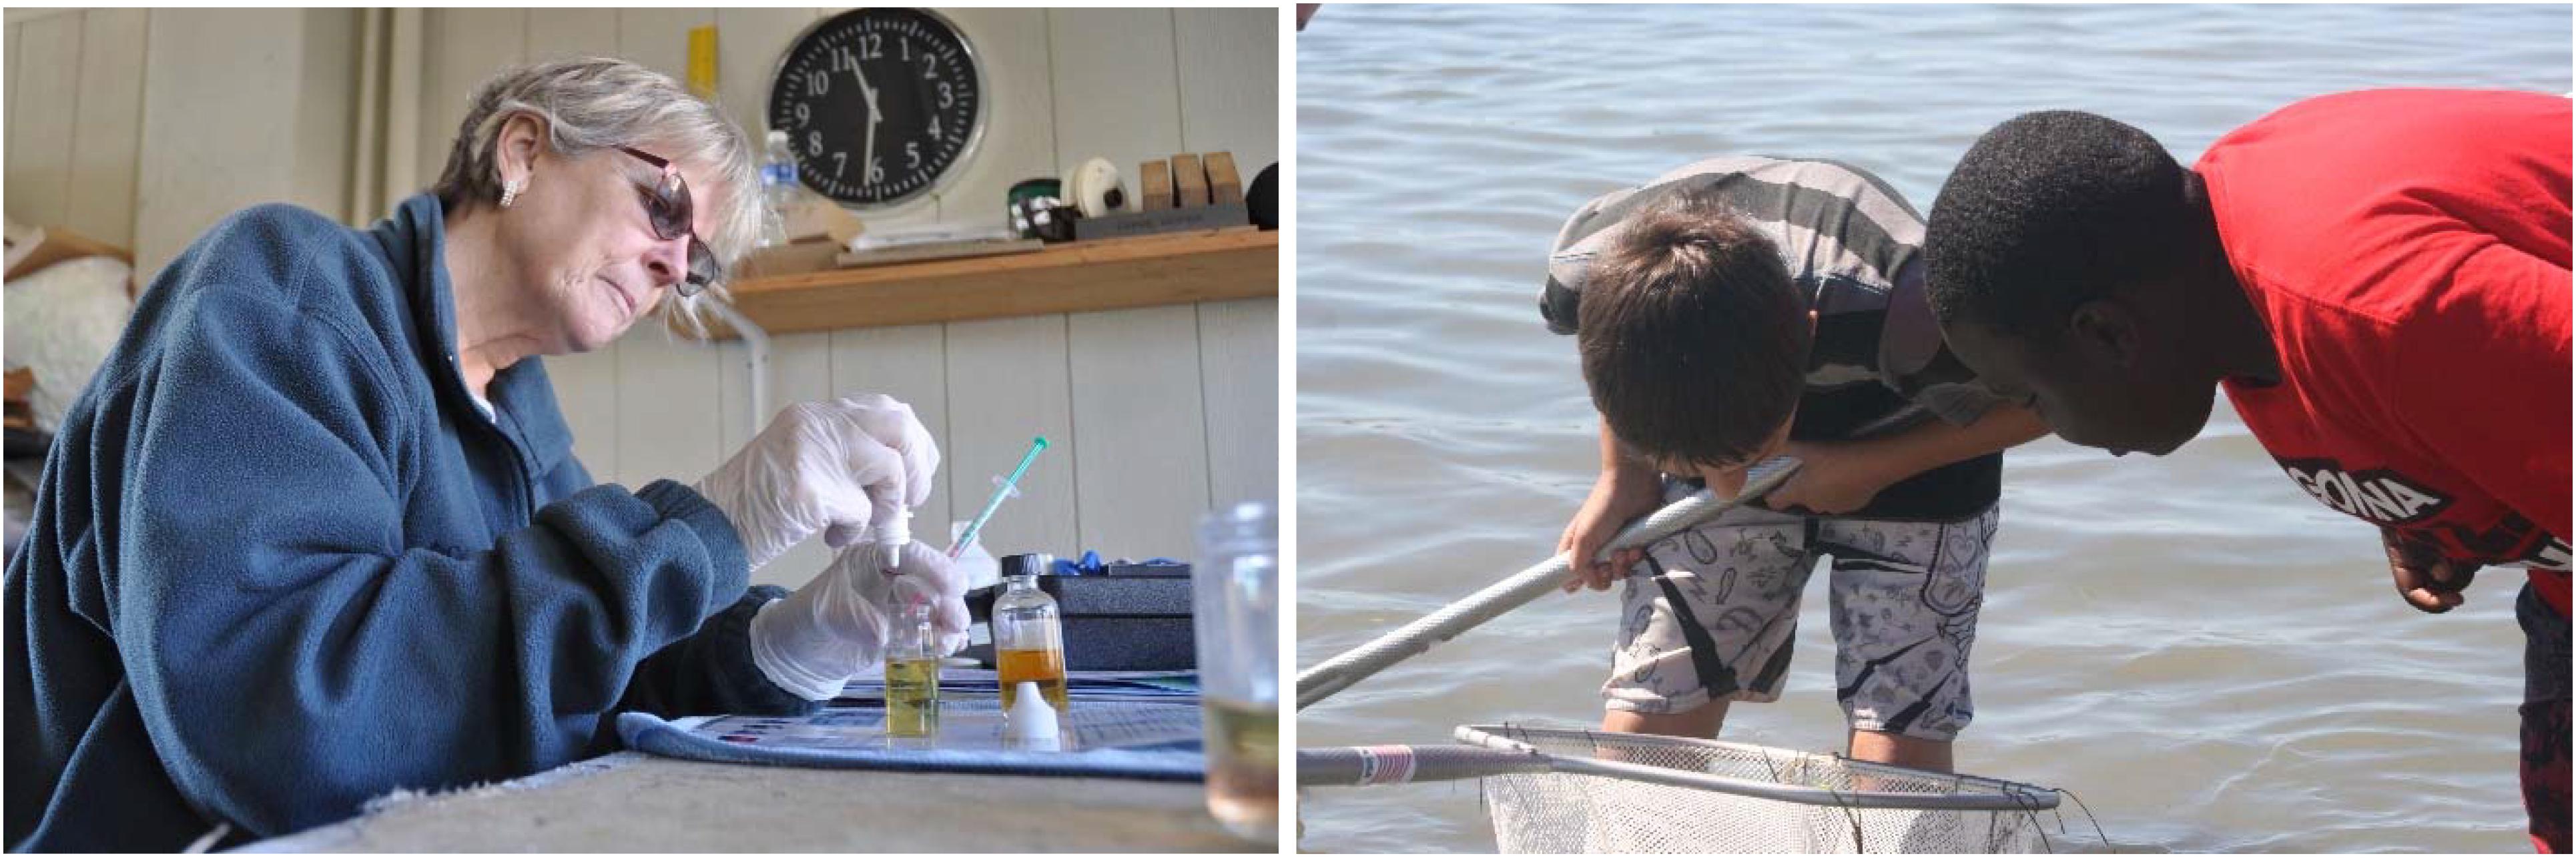
Figure 9. Galveston Bay Foundation’s Water Monitoring Team volunteers collect monthly water quality data from sites around Galveston Bay (Left). Nature’s Academy participants conduct biodiversity assessments as part of their outdoor education curriculum (Right). Photo credits: GBFWMT (Left) and Chris Simoniello (Right).
Each organization collects meteorological and estuarine/coastal ocean data based on their priorities and objectives. Common parameters are air and water temperature, wind speed and direction, barometric pressure, relative humidity, dissolved oxygen, pH, and salinity. Other parameters include nutrients, turbidity, specific gravity, precipitation, surface algae coverage, water color, sea state, and tidal cycle. Nature’s Academy provides data on the abundance and composition of beach litter, and on biodiversity, reporting the number of species collected, including most abundant species.
Approximately 50% of the GBFWMT is certified to collect fecal indicator bacteria data (e.g., Enterococcus). Training includes proper bacteriological sampling, transport and laboratory techniques following protocols established by the Texas Commission on Environmental Quality (TCEQ, 2012). Levels are used to determine if a given site is suitable for recreational use. The information supplements monitoring by local research institutions and state agencies which lack the capacity to regularly monitor both water quality and bacteria throughout the bay. Galveston Bay has a large number of diverse users spread along its shoreline and there is a high demand for localized information. The monitoring team not only helps meet this demand for localized water quality data but empowers residents at these locations by engaging them in the sampling and interpretation processes on a voluntary basis. In addition to training for sampling bacteria, volunteer monitors follow the certification system developed by the Texas Stream Team. The training includes practical experience in field techniques, quality assurance and data management (Texas Stream Team [TST], 2009). Procedures and requirements have also been established to become certified Texas Stream Team trainers and Quality Assurance Officers (Texas Stream Team [TST], 2014).
Technological Advancement of Data Gathering and Sharing Methods
Both the GBFWMT and Nature’s Academy record information in a Microsoft Excel database which gets pushed to the GCSP. Like the H-N portal, users can drill down to inspect base maps of observations at the station level. Work is underway to transition data from the GBFWMT to a relational database in Microsoft Access. The goal is to enhance data extraction and manipulation while better maintaining the integrity of the data and establishing threshold values for each parameter.
Results Through Robust Quality Assurance/Quality Control of Volunteer Data
Calibration and Standardization of Equipment
Nature’s Academy, using Pasco Scientific probe ware, and the Galveston Bay Foundation, using YSI instruments, follow similar equipment standardization and calibration regimes. Both use internal program testing and maintenance requirements in combination with guidelines outlined in the manufacturers’ manuals (YSI, 2009a,b; PASCO PS-2169 Water Quality Multi Measure Sensor User Manual, 2012). Records are kept on all field and laboratory equipment testing, maintenance and repair schedules. Data not meeting post calibration error limit requirements are flagged in the database for further review by the respective project managers/quality assurance officers.
Validation Methods by Expert Marine Scientists
Field-collected data are recorded on data sheets and/or stored digitally. Data and metadata are subsequently entered into a Microsoft Excel data base by certified volunteer coordinators who check for quality assurance. Each organization stores data internally on company servers, maintains the original data forms, and coordinates with GCOOS to upload information to the GCSP. Basic statistical analysis is conducted to determine random error, systematic bias, and replicability across monitoring locations, volunteers and sampling dates. Subsequent to data upload, companion hands-on lessons are developed and implemented by GCOOS. These are aimed at Science, Technology, Engineering, and Mathematics (STEM) literacy targeting underserved students (Simoniello and Watson, 2018) to make STEM curriculum meaningful (Fraser et al., 2013; Levin and Dickerson, 2015; Dickerson et al., 2016).
Project Summary
Though not a solution for all ocean monitoring needs, Gulf citizen scientists offer compelling examples showcasing their ability to augment and enhance traditional research and monitoring. Information they are providing is increasing the spatial and temporal frequency and duration of sampling, reducing time and labor costs for academic and government monitoring programs, providing hands-on STEM learning related to real-world issues and increasing public awareness and support for the scientific process. Currently, GCOOS GSCP efforts are focused on establishing guidelines and machine-to-machine capabilities for the growing number of volunteer data providers interested in contributing information to the portal. The long-term goal is to establish a nested “system of systems” of citizen scientist-collected information across the national IOOS footprint.
Challenges for Citizen Science Efforts of the Future
While there’s a growing body of evidence supporting the contributions of citizen scientists to some of the world’s most pressing issues, challenges remain. Some of the more obvious challenges to overcome before wide-scale inclusion in rigorous monitoring programs include quality assurance and quality control limitations, legal/liability and ethical concerns and cyber infrastructure to support data management, discovery, metadata, and security. Less obvious challenges also exist. For example, in coastal settings, it is not always clear where the demarcation is between public and private beaches (O’Hara et al., 2016). Thus, trespassing issues arise. Another potential complication arises if/when local administrators decide it is more economical to replace professional environmentalists with volunteers. In many instances, the solution to resolving a challenge like this is at the crossroads of science and sociology—overcoming the idea that local traditional environmental knowledge can replace rigorous science rather than complement it. Potential for false alarms also needs to be mitigated. The peer review process for scientists provides a system of checks and balances. If volunteers are convinced they’ve observed something, even if it is an honest error, there could be negative economic or public relations consequences. Numerous bodies like the Open Geospatial Consortium’s Citizen Science Interoperability Experiment and the Wilson Center’s Citizen Science Association are beginning to tackle these issues. Global efforts across Europe, Canada, the United States and Australia are embarking on initiatives to promote successful expansion of the citizen science field through standardization of metadata, post-collection data processing and other aspects of this growing community.
Conclusion
The democratization of ocean observation has the potential to add millions of observations every day. Examples provided here demonstrate the wide range of people who are already dramatically reducing gaps in our global observing network while at the same time providing unique opportunities to meaningfully engage in ocean observing and the research and conservation it supports. Data gaps from the seafloor to the estuaries and from the tropics to the poles are being filled by volunteers who are contributing to safer navigation, community resiliency and understanding of climate impacts on living marine resources. As domestic and international citizen science associations are becoming increasingly organized, the potential for citizen scientists to be part of an effective global strategy for a sustained, multidisciplinary and integrated observing system is closer to being realized.
Author Contributions
All authors listed have made a substantial, direct and intellectual contribution to the work, and approved it for publication.
Funding
Funding for the Gulf Citizen Science Data Portal was from IOOS Award NA16NOS0120018, Continued Development of the Gulf of Mexico Coastal Ocean Observing System. Catch the King’s education initiatives through the Virginia public school system were graciously funded by the Hampton Roads Community Foundation and the Batten Environmental Education Initiative, where WHRO enlisted over 120 schools through modest monetary incentives to join in its resilience education effort.
Conflict of Interest Statement
The authors declare that the research was conducted in the absence of any commercial or financial relationships that could be construed as a potential conflict of interest.
Acknowledgments
The authors thank the capable global citizens who continue to contribute data to better understand our shared environment. Development of the Gulf Citizen Science Data Portal was supported by the GCOOS Outreach and Education Council. Catch the King’s citizen science flood mapping efforts were greatly supported through media outreach, sponsored in Hampton Roads, VA, by: The Virginian-Pilot, WHRO Public Media, the Daily Press, and WVEC-TV. Citizen flood mapping and volunteer training is supported by Karen Jacklich, Catch the King’s volunteer coordinator, the non-profit group Wetlands Watch and Concursive Corp., creators and developers of the citizen-science “Sea Level Rise” mobile application, the Hampton Roads Sanitation District, and the Commonwealth Center for Recurrent Flooding Resiliency, who provides flood forecasts to direct citizens to projected flood locations for inundation mapping and flood extent confirmation.
Footnotes
- ^http://www.indigovexpeditions.org/
- ^https://issuu.com/gcoos-ra/docs/gcoos-stratplan-and-addendum
- ^https://nutrients.gcoos.org/
- ^http://gulfcitizenscience.org/
References
Banerjee, S., Schlaeppi, K., and Heijden, M. G. (2018). Keystone taxa as drivers of microbiome structure and functioning. Nat. Rev. Microbiol. 16, 567–576. doi: 10.1038/s41579-018-0024-1
Bar-On, Y., Phillips, R., and Milo, R. (2018). The biomass distribution on Earth. Proc. Natl. Acad. Sci. U.S.A. 115, 6506–6511. doi: 10.1073/pnas.1711842115
Bekaert, D. P. S., Hamlington, B. D., Buzzanga, B., and Jones, C. E. (2017). Spaceborne synthetic aperture radar survey of subsidence in hampton roads, Virginia (USA). Sci. Rep. 7:14752. doi: 10.1038/s41598-017-15309-5
Bissett, A., Brown, M. V., Siciliano, S. D., and Thrall, P. H. (2013). Microbial community responses to anthropogenically induced environmental change: towards a systems approach. Ecol. Lett. 16, 128–139. doi: 10.1111/ele.12109
Boon, J. D., Mitchell, M., Loftis, J. D., and Malmquist, D. M. (2018). Anthropocene Sea Level Change: A History of Recent Trends Observed in the U.S. East, Gulf, and West Coast Regions. Special Report No. 467. Gloucester Point, VA: Virginia Institute of Marine Science
Danielson, J. J., Poppenga, S. K., Brock, J. C., Evans, G. A., Tyler, D. J., Gesch, D. B., et al. (2016). Topobathymetric elevation model development using a new methodology: coastal national elevation database. J. Coast. Res. 76, 75–89. doi: 10.2112/si76-008
Dickerson, D. L., Cantu, D., Hathcock, S., McConnell, W., and Levin, D. (2016). “Instrumental STEM: development of a STEM instructional model,” in Achieving Science and Technological Literacy Through Engineering Design Practices, eds L. Annetta and J. Minogue (Berlin: Springer).
Fraser, J., Gupta, R., Flinner, K., Rank, S., and Ardalan, N. (2013). Engaging Young People in 21st Century Community Challenges: Linking Environmental Education with Science, Technology, Engineering and Mathematics. New York, NY: New Knowledge Organization Ltd.
Jeffries, T. C., Ostrowski, M., Williams, R. B., Xie, C., Jensen, R. M., Grzymski, J. J., et al. (2015). Spatially extensive microbial biogeography of the Indian Ocean provides insights into the unique community structure of a pristine coral atoll. Sci. Rep. 5:15383. doi: 10.1038/srep15383
Lauro, F. M., Senstius, S. J., Cullen, J., Neches, R., Jensen, R. M., and Brown, M. V. (2014). The common oceanographer: crowdsourcing the collection of oceanographic data. PLoS Biol. 12:e1001947. doi: 10.1371/journal.pbio.1001947
Levin, D., and Dickerson, D. (2015). Making stem reAL: real, experiential active learning; an authentic interdisciplinary connection between the “Schoolshed” and the Watershed. Mar. Technol. Soc. J. 49, 1–14. doi: 10.4135/9781473910508.n1
Loftis, J. D., Forrest, D., Katragadda, K., Spencer, K., Organski, T., Nguyen, C., et al. (2018). Storm sense: a new integrated network of IoT water level sensors in the smart cities of hampton roads, VA. Mar. Technol. Soc. J. 52, 56–67. doi: 10.4031/mtsj.52.2.7
Loftis, J. D., Wang, H., and DeYoung, R. (2013). Storm Surge and Inundation Modeling in the Back River Watershed for NASA Langley Research Center. NASA Technical Report No. NASA/TM-2013-218046. Hampton: Langley Research Center
Loftis, J. D., Wang, H. V., DeYoung, R. J., and Ball, W. B. (2016). “Using lidar elevation data to develop a topobathymetric digital elevation model for sub-grid inundation modeling at langley research center,” in Advances in Topobathymetric Mapping, Models, and Applications, eds J. C. Brock, D. B. Gesch, C. E. Parrish, J. N. Rogers, and C. W. Wright (Coconut Creek, FL: Coastal Education and Research Foundation), 134–148. doi: 10.2112/si76-012
Loftis, J. D., Wang, H. V., and Forrest, D. R. (2015). “Towards predicting street-level inundation: using operational forecast modeling techniques during 2011 hurricane irene,” in Proceedings of the VIMS 75th Anniversary Research Symposium, (Gloucester Point, VA: Virginia Institute of Marine Science).
Mayer, L., Jakobsson, M., Allen, G., Dorschel, B., Falconer, R., Ferrini, V., et al. (2018). The nippon foundation—GEBCO seabed 2030 project: the quest to see the world’s oceans completely mapped by 2030. Geosciences 8:63. doi: 10.3390/geosciences8020063
O’Hara, T., Decker, N., and Schiavinato, L. (2016). Legal Issues in Citizen Science: A Guide for Coastal and Marine Scientists and Their Volunteers in North Carolina. Available at: https://ncseagrant.ncsu.edu/ncseagrant_docs/products/2010s/citsci_white_paper.pdf (accessed April, 201).
PASCO PS-2169 Water Quality Multi Measure Sensor User Manual (2012). Available at: http://www.manualsdir.com/manuals/340533/pasco-ps-2169-water-quality-multimeasure-sensor.html?page=2 (accessed October 10, 2018).
Rogers, L., David, B., John, M., Andrew, M., Jordan, B., Thomas, A., et al. (2017). “NASA’s mid-atlantic communities and areas at intensive risk demonstration: translating compounding hazards to societal risk,” in Proceedings of the Oceans 2018 MTS/IEEE, (Forney, TX: MTS), 1–5.
Simoniello, C., and Watson, S. (2018). Stem education in gulf coast schools: strengths, weaknesses, opportunities, and threats for our culturally, racially, and economically diverse community. Mar. Technol. Soc. J. 52, 54–65. doi: 10.4031/mtsj.52.1.8
Simoniello, C., Watson, S., Kirkpatrick, B., Spranger, M., Jochens, A. E., Kobara, S., et al. (2015). “One System, many societal benefits: building an efficient, cost-effective ocean observing system for the Gulf of Mexico,” in Coastal Ocean Observing System Advances and Syntheses, eds Y. Liu, H. Kerkering, and R. Weisberg (Amsterdam: Elsevier-Academic Press).
Steinhilber, E. E., Boswell, M., Considine, C., and Mast, L. (2016). Hampton Roads Sea Level Rise Preparedness and Resilience Intergovernmental Pilot Project. Available at: https://digitalcommons.odu.edu/cgi/viewcontent.cgi?article=1003&context=hripp_reports (accessed October, 2016).
TCEQ (2012). Surface Water Quality Monitoring Procedures, Volume 1: Physical and Chemical Monitoring Methods for Water, Sediment, and Tissue (RG-415) and ASTM D6503-99. Available at: https://www.tceq.texas.gov/assets/public/comm_exec/pubs/rg/rg415/rg-415_chapter4.pdf (accessed August, 2012).
Texas Stream Team [TST] (2009). Documents: Texas Stream Team Water Quality Monitoring Manual. Available at: https://www.h-gac.com/texas-stream-team/documents/Texas%20Stream%20Team%20Water%20Quality%20Monitoring%20Manual_%202012[1].pdf (accessed October 10, 2018).
Texas Stream Team [TST] (2014). Quality Assurance Officer’s Manual. Available at: https://galvbay.org/wp-content/uploads/2014/03/Texas-Stream-Team-Quality-Assurance-Officer-Manual.pdf.
Urbanski, J. A., Stempniewicz, L., Weslawski, J. M., Dragańska-Deja, K., Wochna, A., Goc, M., et al. (2017). Subglacial discharges create fluctuating foraging hotspots for sea birds in tidewater glacier bays. Sci. Rep. 7:43999. doi: 10.1038/srep43999
Wang, H. V., Loftis, J. D., Liu, Z., Forrest, D., and Zhang, J. (2014). The storm surge and sub-grid inundation modeling in New York City during Hurricane Sandy. J. Mar. Sci. Eng. 2, 226–246. doi: 10.3390/jmse2010226
Weslawski, J. M. (1990). Distribution and ecology of coastal waters amphipods from Southern pitsbergen. Pol. Arch. Hydrobiol. 37, 503–519. doi: 10.1186/s12983-017-0248-3
Weslawski, J. M., Dragańska-Deja, K., Legeżyńska, J., and Walczowski, W. (2018). Range extension of a boreal amphipod Gammarus oceanicus in the warming Arctic. Ecol. Evol. 8, 7624–7632. doi: 10.1002/ece3.4281
Whitman, W. B., Coleman, D. C., and Wiebe, W. J. (1998). Prokaryotes: the unseen majority. Proc. Natl. Acad. Sci. U.S.A. 95, 6578–6583. doi: 10.1073/pnas.95.12.6578
YSI (2009a). Professional Plus User Manual. Available at: https://www.ysi.com/File%20Library/Documents/Manuals/605596-YSI-ProPlus-User-Manual-RevD.pdf. (accessed October 22, 2018).
YSI (2009b). YSI85 User Manual. Available at: https://www.ysi.com/File%20Library/Documents/Manuals%20for%20Discontinued%20Products/038503-YSI-Model-85-Operations-Manual-RevE.pdf. (accessed October 22, 2018).
Keywords: citizen science, ocean observing systems, crowd sourcing, bathymetry, king tide, GCOOS, volunteer-collected data, global ocean observing system
Citation: Simoniello C, Jencks J, Lauro FM, Loftis JD, Weslawski JM, Deja K, Forrest DR, Gossett S, Jeffries TC, Jensen RM, Kobara S, Nolan L, Ostrowski M, Pounds D, Roseman G, Basco O, Gosselin S, Reed A, Wills P and Wyatt D (2019) Citizen-Science for the Future: Advisory Case Studies From Around the Globe. Front. Mar. Sci. 6:225. doi: 10.3389/fmars.2019.00225
Received: 30 October 2018; Accepted: 10 April 2019;
Published: 07 May 2019.
Edited by:
Sanae Chiba, Japan Agency for Marine-Earth Science and Technology, JapanReviewed by:
Teresa Greely, University of South Florida, United StatesGeorge I. Matsumoto, Monterey Bay Aquarium Research Institute (MBARI), United States
Copyright © 2019 Simoniello, Jencks, Lauro, Loftis, Weslawski, Deja, Forrest, Gossett, Jeffries, Jensen, Kobara, Nolan, Ostrowski, Pounds, Roseman, Basco, Gosselin, Reed, Wills and Wyatt. This is an open-access article distributed under the terms of the Creative Commons Attribution License (CC BY). The use, distribution or reproduction in other forums is permitted, provided the original author(s) and the copyright owner(s) are credited and that the original publication in this journal is cited, in accordance with accepted academic practice. No use, distribution or reproduction is permitted which does not comply with these terms.
*Correspondence: Christina Simoniello, chris.simoniello@gcoos.org