Pumped Up by the Cold: Elemental Quotas and Stoichiometry of Cold-Water Diatoms
 Michael W. Lomas
 Steven E. Baer
 Sydney Acton3
  Jeffrey W. Krause
- 1Bigelow Laboratory for Ocean Sciences, East Boothbay, ME, United States
- 2Maine Maritime Academy, Castine, ME, United States
- 3Dauphin Island Sea Lab, Dauphin Island, AL, United States
- 4Department of Marine Sciences, University of South Alabama, Mobile, AL, United States
Phytoplankton cellular elemental quotas are important for evaluating the coupling of nutrient cycles and assessing nutrient limitation in the ocean. While cell element quotas have been shown to vary in response to growth conditions (e.g., light, nutrient supply), an overriding trait is cell size and biovolume. Allometric relationships are lacking data for phytoplankton grown under polar temperature conditions (e.g., <5°C); limited field data using single-cell stoichiometry measurements have shown polar diatoms may have significantly different allometry versus low-latitude counterparts. In this study, 11 strains of diatoms isolated from sub/polar waters (both Arctic and Antarctic) were grown in batch growth mode. Cellular carbon (C), nitrogen (N), phosphorus (P), silica (Si), cell number and biovolume were measured during mid-exponential and early stationary growth phases. An allometric log–log relationship was observed between cell element quotas and biovolume, although the strain Odontella aurita was consistently an outlier. Including O. aurita resulted in regression slopes for C, N, P, and Si that were lower than values from the reviewed literature of temperate diatoms; excluding O. aurita resulted in regression slopes that were more similar to published values for each element. However, the intercepts of the elemental quotas in the allometric relationships ranged from ∼5-fold to ∼100-fold greater than published values depending upon the element and the growth phase, meaning that the elemental density is significantly higher for diatoms grown at cold temperatures, although the physiological mechanism(s) cannot be resolved in this study. Cellular ratios of C, N, and P were consistent with prior research, but clearly showed the importance of taxonomic variability as all strains of the genus Thalassiosira behaved more similarly to each other than to the other diatom strains tested. Si:C ratios, in contrast, for non-Thalassiosira strains were greater and approached values commonly observed for iron-limited cells. These results show that a different set of allometric scaling equations is needed when considering sub/polar diatoms relative to temperate and tropical diatoms, which will impact regional and global model parameterization. In addition, these results highlight the role of phytoplankton diversity on biogeochemistry, even within the closely aligned families of diatoms.
Introduction
The ecological and biogeochemical functions of aquatic systems are intertwined through the traits of the biological organisms that inhabit them (e.g., Margalef, 1978). The most recent generation of carbon-cycle models have evolved to explicitly include plankton diversity within state variables and the interaction among these groups. However, microbial populations are incredibly diverse, even more so when one considers the results of metagenomics studies that suggest there are thousands of species yet to be identified and their biological traits characterized (e.g., Venter et al., 2004). Given the immense and poorly understood repository of species diversity among the plankton, many models simulate diversity by using functional groups as state variables, where groups are differentiated by properties which can be ground truthed with field measurements (e.g., particle size). Such an approach has been useful in global models which differentiate various classes of phytoplankton (Follows et al., 2007). Cell size, long considered a master variable from which other traits would scale (Elton, 1927), can provide a representation of plankton diversity even if it has not been experimentally quantified; this field is called allometry.
A number of reviews, each with a slightly different focus, have been published on allometric scaling of traits in phytoplankton (e.g., Malone, 1980; Chisholm, 1992; Tang, 1995; Tang and Peters, 1995; Edwards et al., 2012). One allometric trait of central importance to models is carbon content. Nitrogen is commonly the element of choice in ocean ecosystem models as it is an important structural element in all planktonic organisms, and therefore a common currency among trophic groups. These allometric relationships are compiled from microscopic estimates of cellular biovolume and empirical measurements of carbon, typically achieved by normalizing bulk carbon content to the number of cells in a known volume of culture. Relationships have been compiled for specific groups such as diatoms (Strathmann, 1967), phototrophic nanoplankton (Verity et al., 1992), various phytoplankton (Montagnes et al., 1994), ciliates (Verity and Langdon, 1984; Putt and Stoecker, 1989), and dinoflagellates (Menden-Deuer and Lessard, 2000). While there are subtle differences in the parameter values between taxonomic groups, Menden-Deuer and Lessard (2000) concluded that only diatoms were significantly different from other major phytoplankton. Thus the allometric parameterizations presented in Menden-Deuer and Lessard (2000) are widely accepted and commonly used in models to predict cellular carbon in phytoplankton groups (e.g., Follows et al., 2007).
The individual datasets going into the allometric parameters presented in Menden-Deuer and Lessard (2000) come from a wide range of phytoplankton species across a wide range of environmental growth temperatures and irradiances. While the representative geographic expansiveness makes this allometric relationship valuable, very few (if any) of the datasets include cells grown at “polar” temperatures (e.g., <5°C) – yet, these are the environmental temperatures covering important regions of the global ocean. Omission of sub/polar representatives from broad allometric or metabolic scaling analyses is common, such that many foundational concepts which are primarily derived from temperate and tropical species may be erroneous for the polar plankton community. For diatoms, polar strains continually appear to be unique from their low-latitude counterpoints in processes like isotopic fractionation (De La Rocha et al., 1997; Sutton et al., 2013), or degree of silicification (Baines et al., 2010); however, there are some relationships that appear to have truly global relevance, e.g., temperature vs. growth relationship (Eppley, 1972; Smith and Sakshaug, 1990). Given that diatoms are important in both the Arctic and Antarctic food webs, particularly fisheries, and are typically modeled as a separate functional phytoplankton group in both regions (Popova et al., 2010; Sailley et al., 2013), we tested whether diatoms grown at representative polar temperatures have the same allometric scaling relationships as diatoms and other species grown at warmer temperatures. In addition, we explored the impact of a low nitrate:phosphate availability ratio, in alignment with the nitrate:phosphate availability ratio in the Bering and Chukchi Seas, and elevated light levels that might be associated with the seasonal stabilization of the water column.
Materials and Methods
Culture Strains and Experimental Treatments
For this study the following diatom strains were provided by the National Center for Marine Algae and Microbiota: Thalassiosira gravida (CCMP986), T. aestivalis (CCMP975), T. antarctica (CCMP982), T. nordenskioeldii (CCMP997), Melosira nummuloides (CCMP1906), Odontella aurita (CCMP145), Attheya septentrionalis (CCMP2084), Skeletonema dohrnii (CCMP1715), Porosira glacialis (CCMP650), Proboscia_cf sp. (CCMP3479), and Rhizosolenia setigera (CCMP1330); isolation location and year are denoted in Table 1. All strains are axenic and were maintained on L1 nutrient media (initial nutrient concentrations: sodium nitrate = 882 μmol L-1; sodium monobasic phosphate = 36.2 μmol L-1; sodium dibasic silicate = 106 μmol L-1) in 1 L polycarbonate bottles at 2°C and ∼20 μmol photons m-2 s-1 on a 13:11 light:dark cycle; this condition is termed the control. It is worth noting that all of these strains were isolated from locations and/or times of year when water temperatures were near 2°C. While we cannot quantify the difference between 2°C and a growth temperature optimum, we believe it to be minimal. Furthermore, all of these strains were brought into the collection (dates provided in Table 1) at 2°C and thus have always been at that growth temperature. In addition to the control, two other growth conditions were tested. The first was a treatment where the nitrogen to phosphorus availability ratio in the media is lower than that in the base L1 media (∼24:1) and more similar to ratios observed in the Bering Sea (e.g., Mordy et al., 2005) and the North American and East Siberian sectors of the Arctic (Popova et al., 2010). This treatment is denoted as “low N” in Tables 1, 3, 4, 5 and Supplementary Table S1, and followed the same temperature and irradiance values as the control, but the L1 N concentration was decreased by half. The second was a high-light treatment that used the same nutrient media, temperature, and light:dark cycle as the control, but the growth irradiance was increased to 100 μmol photons m-2 s-1 (denoted as High Light in Tables 1, 3, 4, 5 and Supplementary Table S1). For each treatment, cultures were grown under the experimental conditions of light and nutrient concentrations for greater than 10 generations prior to conducting the sampling.
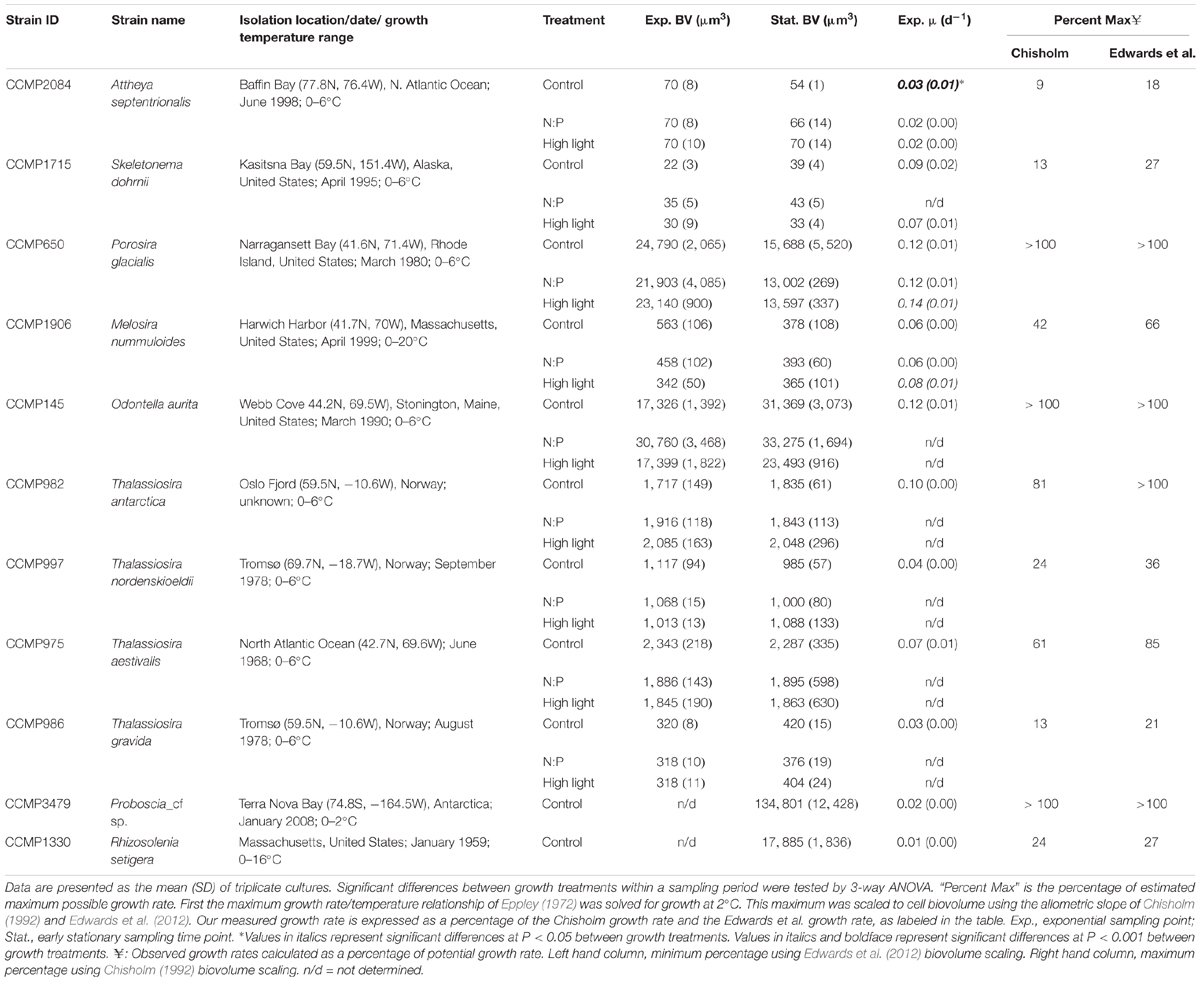
Table 1. Summary of culture strain metadata and biovolumes for the two sampling periods and growth rates in mid-exponential.
Growth curves for each strain were generated by following changes in relative fluorescence units (RFU) from initial dilution through stationary growth (Figure 1). Culture growth rates (Table 1) were calculated from the linear portion of the natural log transformed RFU data plotted against time. Samples for the discrete measurements described in the next two sections were only collected at two time points, mid-exponential and early stationary growth phase based upon RFU. Cultures were grown up in triplicate 1 L bottles with half the volume harvested during mid-exponential growth and the remaining harvested during early stationary growth. At both harvest time points, the volume was divided into samples for cell abundance and biovolume, elemental analysis and chlorophyll as described in the next section. Before and during harvest, all cultures were gently mixed and kept on ice to ensure homogeneity and temperature control.
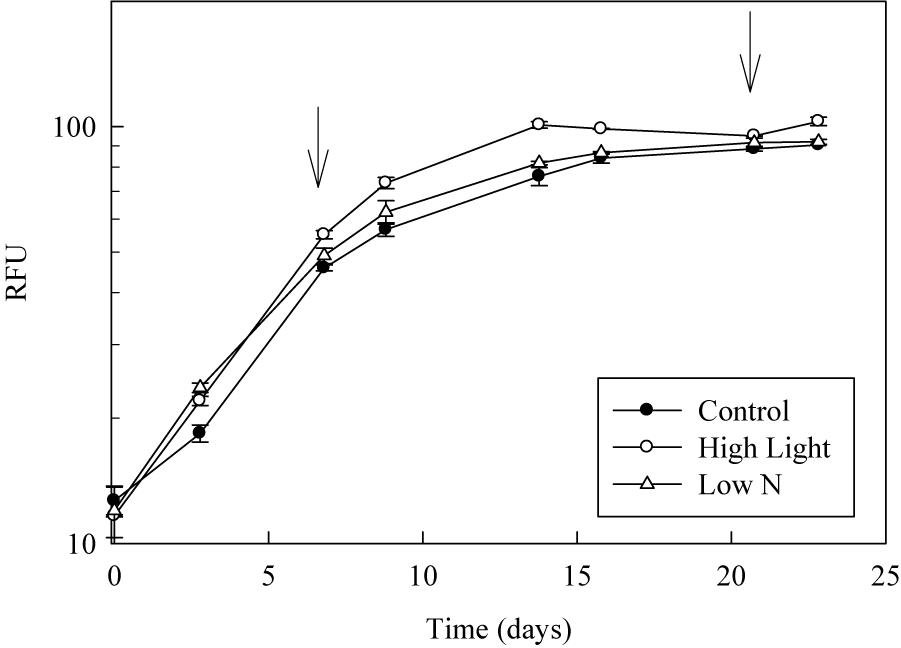
Figure 1. Example growth curves for Porosira glacialis under the three growth conditions. Each point is the mean ± SD of triplicate cultures. Arrows represent the time cultures were sampled in exponential growth and early stationary.
Cell Counts, Biovolume Estimates, and Growth Rate Calculations
Samples (5 mL) were fixed with Bouin’s Fixative and refrigerated (4°C) until analysis within 2 months. Samples were analyzed for cell abundance both manually using a Sedwick Rafter cell, and on a Fluid Imaging Technologies VS Series benchtop FlowCAM using a 10× objective and 200 μm flow cell in autoimage mode (Alvarez et al., 2013). The two smallest clones, S. dohrnii and A. septentrionalis were counted only using manual methods due to issues resolving the number of cells within chains for FlowCAM images. Biovolumes of cells were estimated from manual quantification of microscopy images or from images collected by the FlowCAM using the biovolume estimation function (primarily cylindrical shape) in the VisualSpreadsheet (Scarborough, ME) software provided with the instrument. These estimates compared favorably with manual estimates of biovolume using standardized shapes and appropriate geometric equations (Menden-Deuer and Lessard, 2000). Menden-Deuer and Lessard (2000) also reported that preservation can reduce biovolume even in diatoms but that Lugol’s solution was less prone to this artifact than glutaraldehyde and is a preferable fixative. Additionally, Menden-Deuer and Lessard (2000) observed a decline in biovolume in samples stored 8 months – longer than our storage time. A recent comparative study between our newer FlowCAM model and manual methods (Alvarez et al., 2013) has shown a stronger correspondence among methods despite issues with earlier FlowCAM models (Jakobsen and Carstensen, 2011). The FlowCAM estimates were used in this manuscript, except for the two smallest diatom clones, as the greater number of cells analyzed provided a more robust mean population value.
Particulate Elemental Analysis
Samples for chlorophyll a analysis, 10–50 mL depending upon the abundance of cells, were filtered onto 25 mm Ahlstrom glass fiber filters (nominal pore size 0.7 μm) under low pressure (15 kpa), and frozen immediately at -80°C. Samples were extracted in 90% acetone in the dark for 14–18 h at -20°C. Concentrations were calculated using direct measurement function on the Turner Designs Trilogy (Turner Designs, San Jose, CA, United States) laboratory fluorometer based on the acidification method (Parsons et al., 1984). Daily calibrations were done using a manufacturer-provided solid standard, while the instrument is routinely calibrated with pure chlorophyll from Anacystis nidulans (Sigma–Aldrich, C6144).
Samples for particulate organic carbon (POC), nitrogen (PON), and phosphorus (POP) analysis, 50–100 mL depending upon the abundance of cells, were filtered onto 25 mm precombusted (450°C, 5 h) Ahlstrom glass fiber filters (nominal pore size 0.7 μm) under low pressure (≤15 kpa). POC and PON samples were rinsed with 0.2 μm-filtered artificial seawater, and blanks were created by rinsing a pre-combusted filter with filtered sample media. All samples and blanks were frozen at -20°C immediately after processing. For analysis, samples and blanks were dried at 60°C, fumed in a desiccator containing a petri dish of concentrated hydrochloric acid for 24 h, and re-dried at 60°C prior to analysis. Samples were analyzed on a Costech ECS 4010 CNS analyzer using acetanilide as a standard. Individual sample mass was corrected for the blank, converted to molar units, and concentrations were calculated by dividing by the volume filtered. POP samples were rinsed with filtered media, and then flushed with 5 mL of 0.17 M Na2SO4 solution. Blanks were created by rinsing a pre-combusted filter with a volume of filtered media, similar to the sample, and then flushing with 0.17 M Na2SO4 solution. Samples were analyzed using the ash-hydrolysis method of Solorzano and Sharp (1980) as modified by Lomas et al. (2010). Briefly, sample filters were placed in acid-cleaned (10% HCl) and pre-combusted (450°C for 4 h) glass scintillation vials along with 2 mL of 0.017 M MgSO4, dried at 80–90°C and then combusted at 500°C for 2 h. After cooling to room temperature, 5 mL of 0.25 M HCl was added to each vial, capped to prevent evaporation, and hydrolyzed at 80°C for 30 min. After cooling to room temperature, SRP mixed reagent was added (Parsons et al., 1984), the sample was clarified by centrifugation, and absorbance read at 885 nm. Samples were calculated against a potassium monobasic phosphate standard. Oxidation efficiency and standard recovery was tested with each sample run using an ATP standard solution and a certified phosphate standard (Ocean Scientific International Ltd., Phosphate Nutrient Standard Solution).
Samples for particulate biogenic silica (BSi) analysis, 10–50 mL depending upon the abundance of cells, were filtered onto a 2 μm polycarbonate filter under low pressure (≤15 kpa). Samples were rinsed with filtered media, and blanks were created by rinsing a filter with a volume of filtered media similar to the sample. Samples were folded in quarters, placed in plastic cryogenic vials and immediately frozen (-20°C). For analysis, filters (in vials) were dried in an oven at 60°C. Dried filters were transferred to polymethylpentene (i.e., TPX) tubes for analysis using NaOH digestion with subsequent colorimetric analysis of solubilized silica as silicic acid (Krause et al., 2009). Samples were calibrated against a sodium fluorosilicate standard with a reverse-addition reagent blank and corrected using a tube-blank.
Statistical Analyses
All statistical analyses were done in SigmaStat version 3.5 (Systat Software, San Jose, CA, United States). Comparisons among growth treatments were assessed by one-way ANOVA. When significant differences were observed, all pairwise comparison tests were conducted using Tukey’s test. Comparisons among two groups were conducted using the Student’s t-test. Linear correlations across multiple species were tested with an ordinary least squares Model II linear regression model to the data and the least squares error values reported for the slopes and intercepts.
Results
Cell Growth Rates and Biovolumes
Cell cultures grew at rates ranging from 0.03 to 0.12 d-1 between the various treatments (Table 1). Only strains A. septentrionalis, P. glacialis, and M. nummuloides were grown through a full growth cycle under each of the three experimental conditions. For P. glacialis, and M. nummuloides clones the High Light treatment had significantly faster growth rates than the other treatments (one-way ANOVA, P = 0.001). For A. septentrionalis, growth rates were significantly higher in the control growth condition than the other two conditions (one-way ANOVA, P = 0.001). Macronutrient limitation of growth rate was evaluated based upon the accumulation of particulate nutrients relative to initial dissolved nutrient concentrations. At the mid-exponential sampling point, particulate nitrogen was 5% (1–10%) of initial nitrate, particulate phosphorus was 24% (3–62%) of initial phosphate, and biogenic silica was 53% (19–86%) of initial silicic acid. At the early stationary sampling point, particulate nitrogen was 10% (8–22%) of initial nitrate, particulate phosphorus was 34% (5–71%) of initial phosphate, and biogenic silica was 75% (22–115%) of initial silicic acid.
Among species, biovolume estimates showed a mixed response as a function of growth phase. A. septentrionalis, T. antarctica, T. nordenskioeldii, and T. aestivalis showed little variability (≤10%) in mean biovolumes between exponential and stationary growth phases (Table 1). In contrast, S. dohrnii, T. gravida, and O. aurita showed an increase in mean biovolume from exponential to stationary phase ranging from 10–81%, while P. glacialis and M. nummuloides showed a decrease in mean biovolume from exponential to stationary growth phase of up to 40%. The slope of the relationship between the observed growth rate and biovolume (Table 1) was positive and significant (Model II regression; P = 0.005, Figure 2E) with all species included.
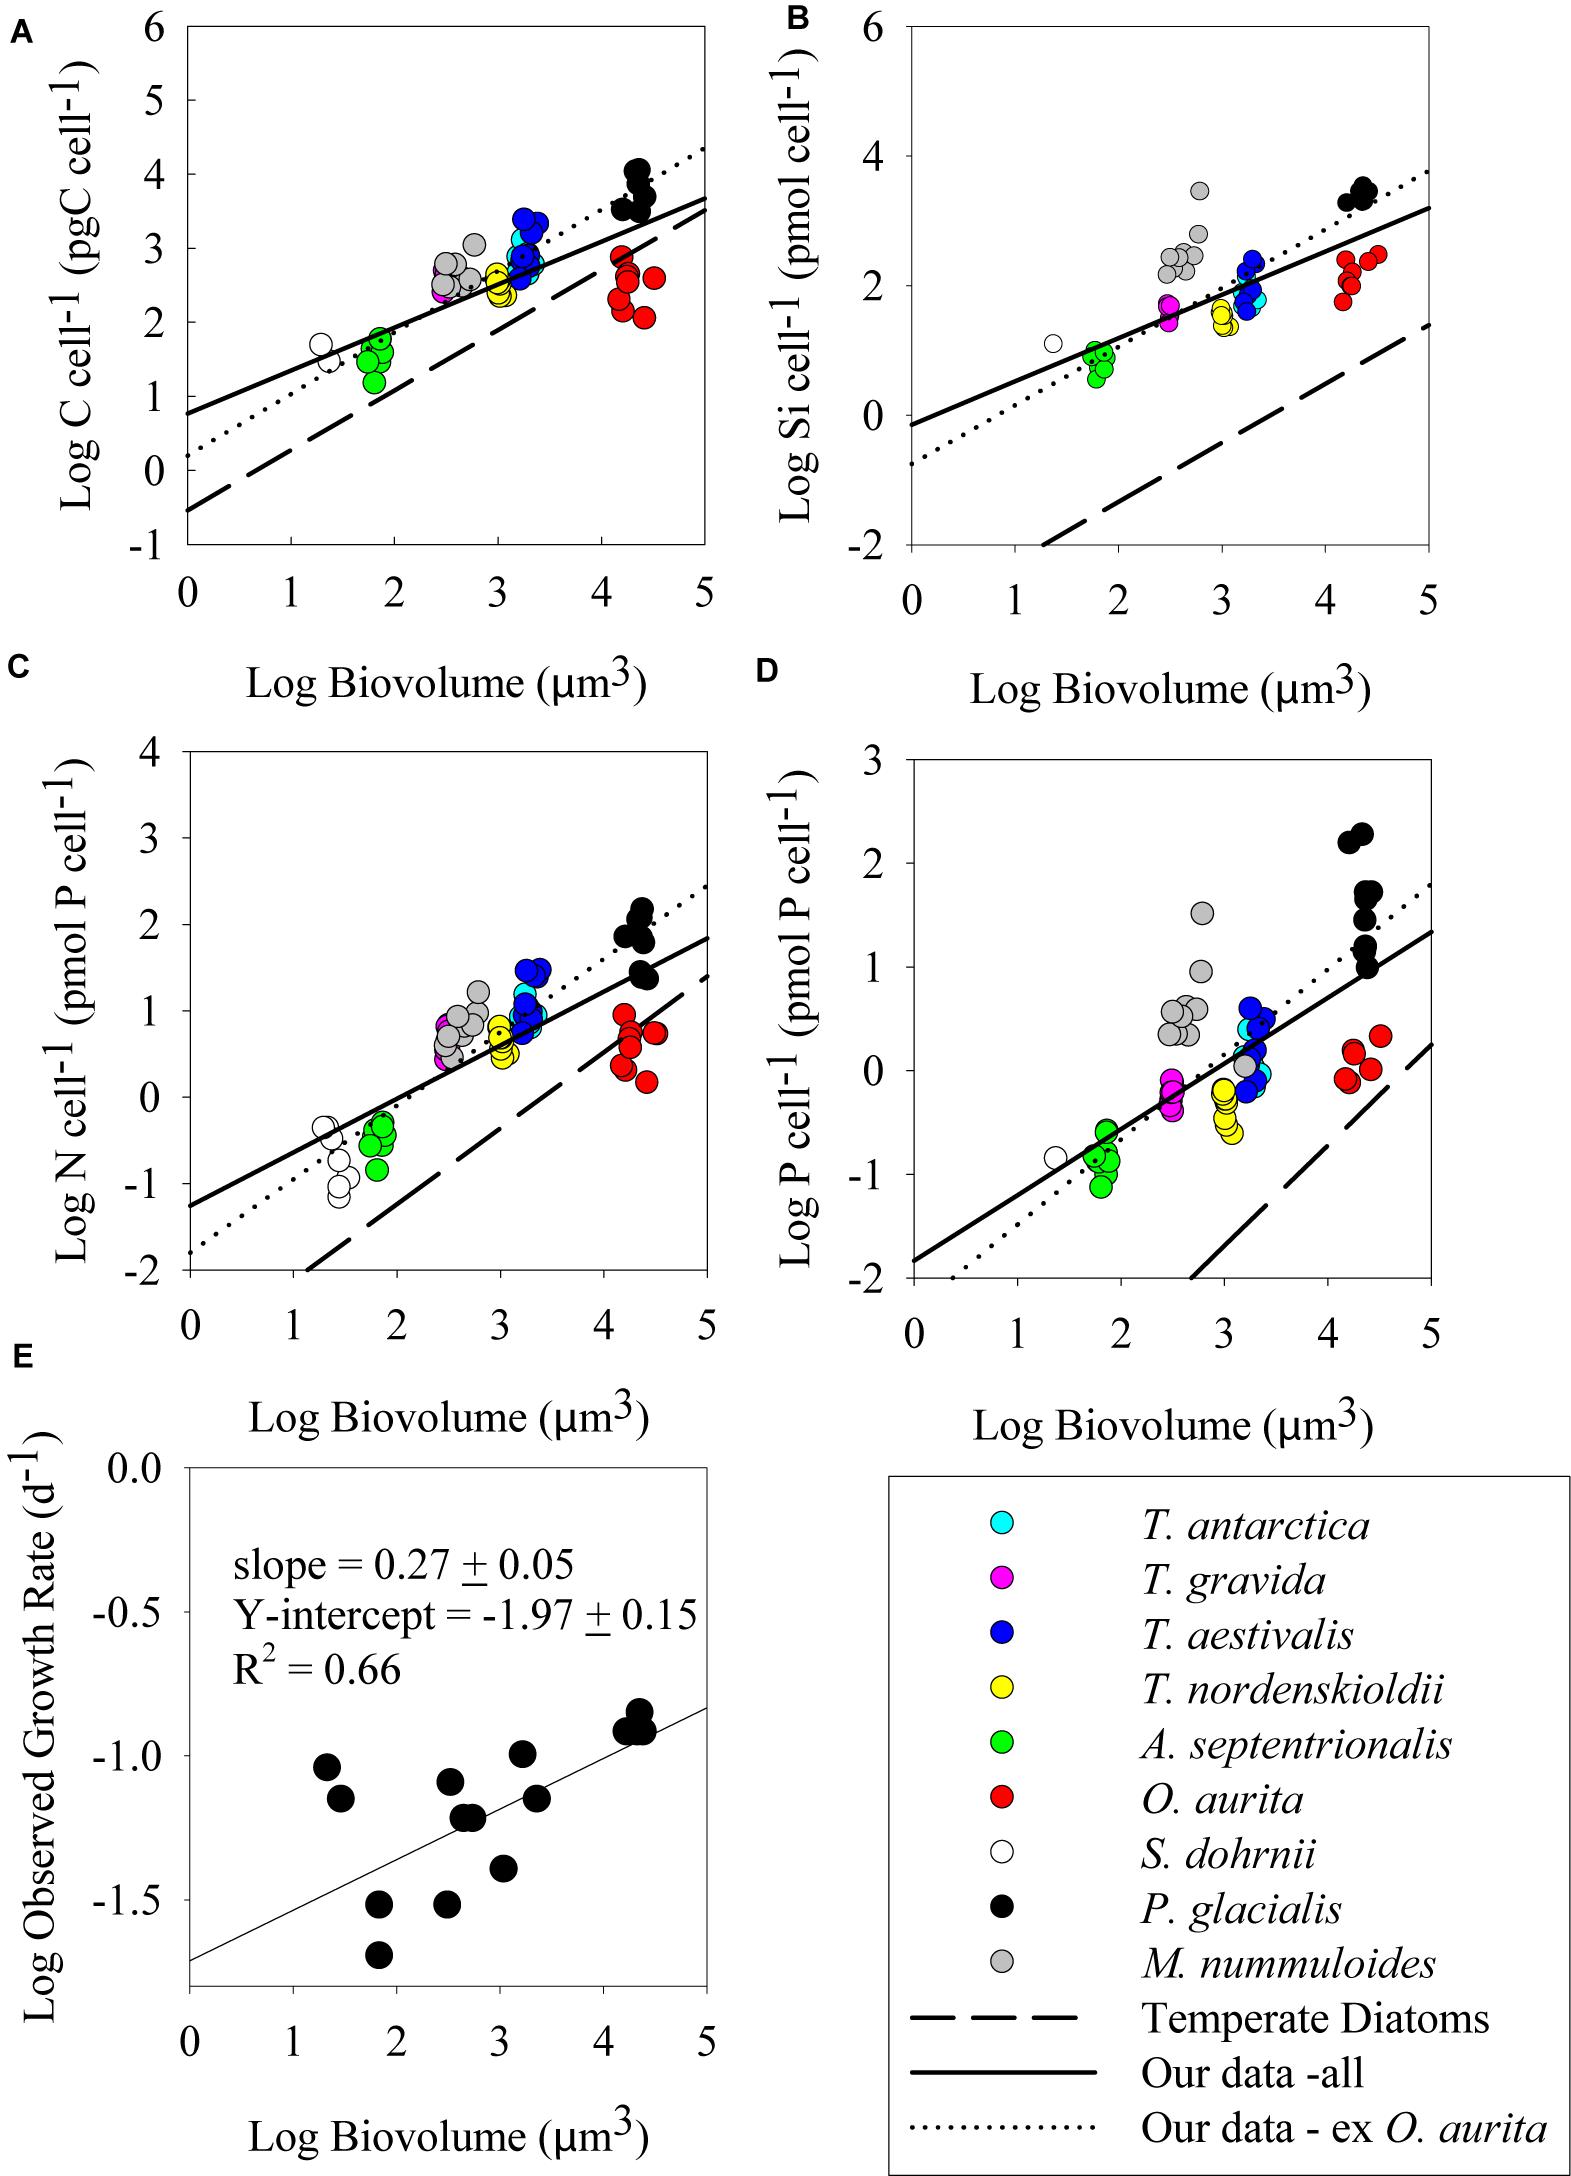
Figure 2. Log–log plots of cell element quotas (pmol cell-1) versus cell biovolume (μm3) at the mid-exponential sampling point; (A) carbon quota, (B) silicon quota, (C) nitrogen quota, and (D) phosphorus quota. All replicates for all treatments are presented. Solid line represents best fit linear regression of all our data, while dotted line represents best fit linear regression of our data excluding O. aurita (see section “Discussion”). Dashed line represents a commonly cited allometric fit for temperate diatoms. C cell-1: Menden-Deuer and Lessard (2000); Si cell-1: Conley et al. (1989); N cell-1 and P cell-1: Edwards et al. (2012). (E) Log observed growth rate versus cell biovolume.
Cell Element Quotas and Ratios
During batch growth, cultures were harvested at two sampling points, mid-exponential growth and early stationary (Figure 1), to determine if growth phase impacted cell nutrient quotas and the relationship to biovolume. Cell element quotas varied between strains, but all macronutrient cell element quotas measured (POC, PON, POP, and BSi) showed a significant positive relationship with cellular biovolume (Figures 2, 3 and Table 2). There was no consistent significant difference in cell nutrient quotas as a function of growth treatment in exponential growth phase for all species except for T. nordenskioeldii (one-way ANOVA, P > 0.05). T. nordenskioeldii exhibited significantly (one-way ANOVA, P < 0.05) higher C, Si, N, and P quotas in both the low N and High Light growth treatments relative to the controls (Supplementary Table S1). Overall, the dataset and variance with a strain across growth treatments is best described by a heteroscedastic trend. Due to a lack of consistent growth treatment effect, data represent the mean of all growth treatments, unless noted otherwise. O. aurita, for the exponential sampling point, appeared as an outlier as the cell element quotas under all growth conditions was lower than what would have been predicted from the other species (Figure 2). The lower values across the board are consistent with the notion that O. aurita has a large internal vacuolar space that does not contain these elements thus lowering the quotas for that biovolume (i.e., element density). This is also supported by the O. aurita Si quota being more similar to other diatoms than its organic content; the former is based on total size opposed to vacuole size. At early stationary growth, cell element quota values of O. aurita had increased and therefore was not as distinct from the other species (Figure 3 and Supplementary Table S1). Overall, the slope of the cell element quota versus biovolume relationship was similar to that presented in other relevant reviews cited, and if O. aurita was excluded the similarity improved (Table 2). The most obvious and striking difference of the relationship between biovolume and cellular element quota was the value of the y-intercept; the elemental density (Table 3). For all macronutrient elements the y-intercept was significantly greater than that presented in other relevant reviews (Model II regression, P < 0.01 for all elements).
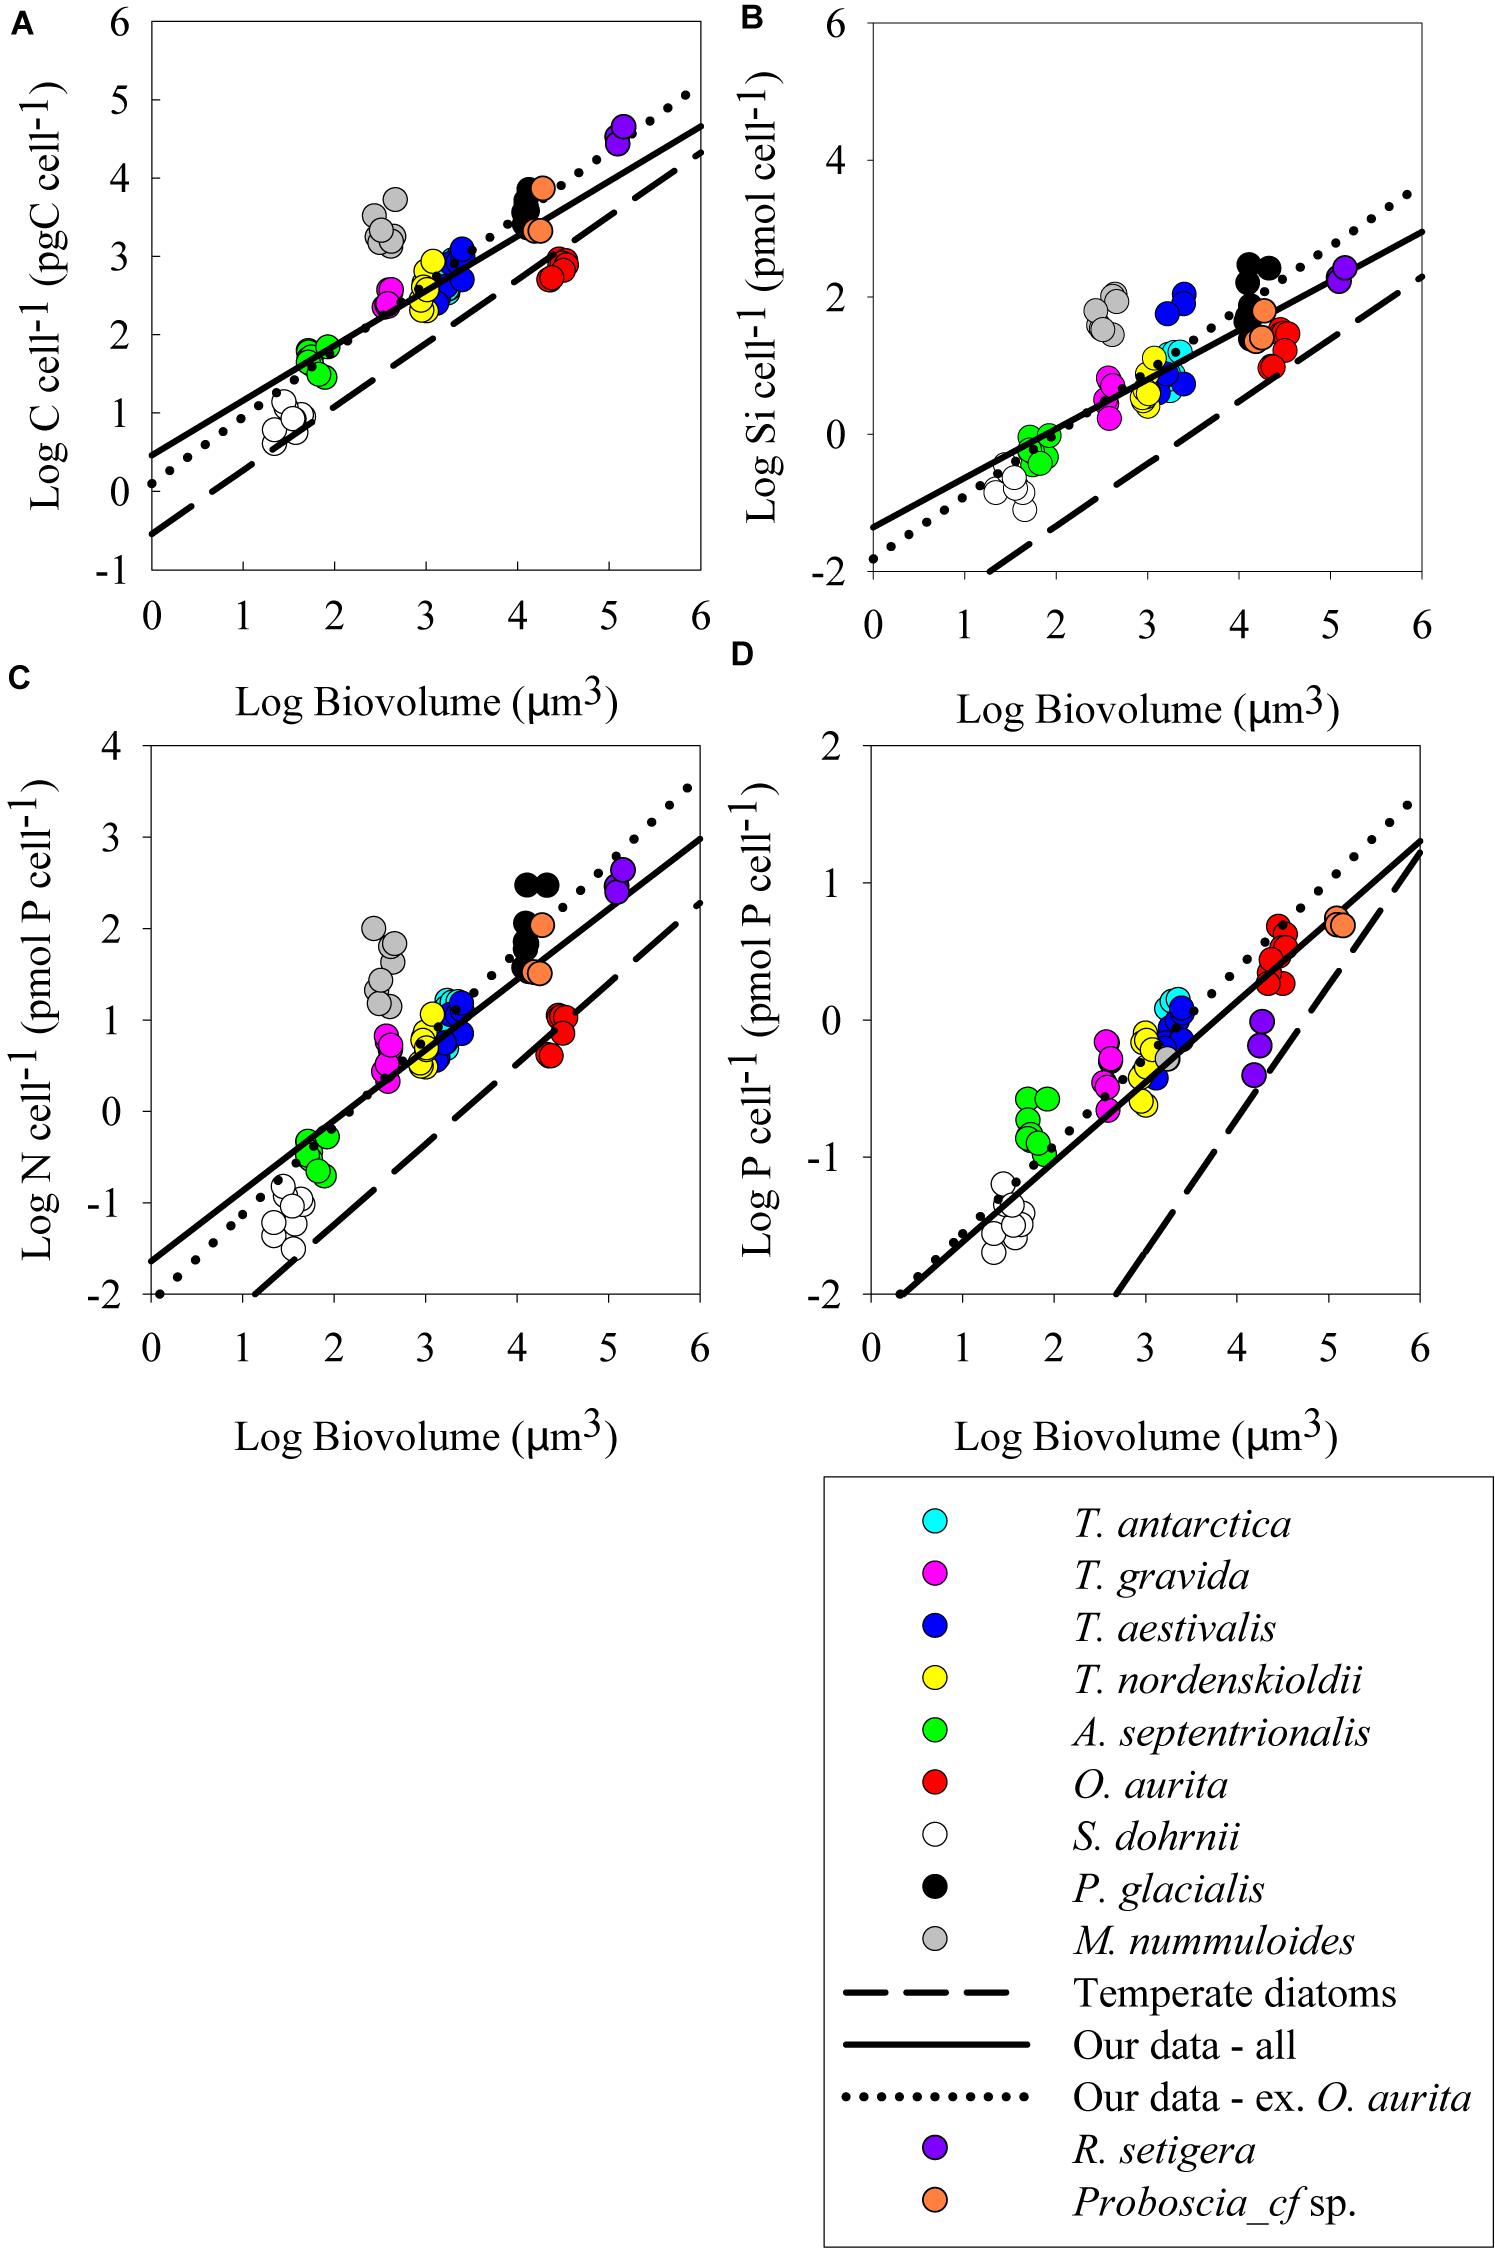
Figure 3. Log–log plots of cell element quotas (pmol cell-1) versus cell biovolume (μm3) at the early-stationary sampling point; (A) carbon quota, (B) silicon quota, (C) nitrogen quota, and (D) phosphorus quota. All else as in Figure 2.
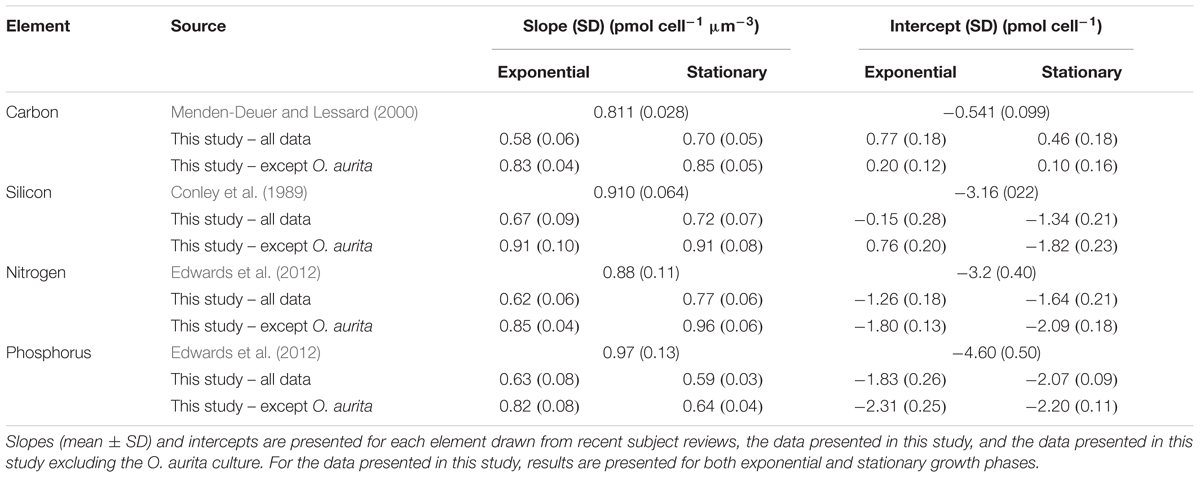
Table 2. Comparison of the log–log relationships of cell element quota versus cell biovolume.
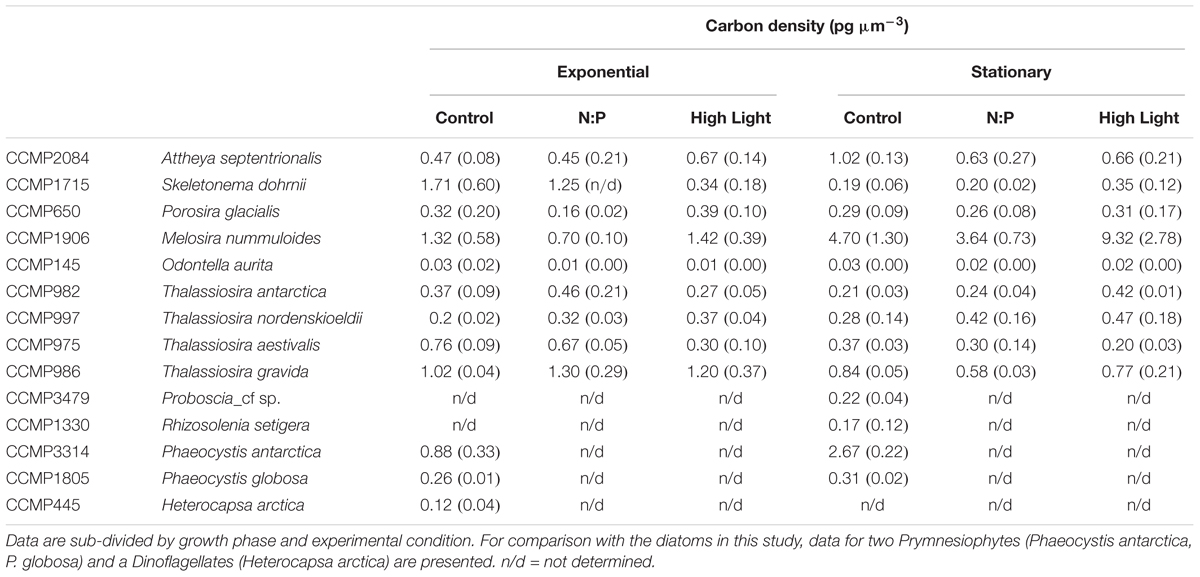
Table 3. Comparison of carbon cell densities (pg C μm-3) for each of the strains used in this study.
Elemental ratios of POC:PON, POC:POP, and PON:POP were not significantly different between growth treatments within each strain (data not shown), due to dissolved inorganic nutrients not being drawn down to limiting concentrations in any treatment, and thus were plotted together (Figure 4). POC:PON ratios for all of the strains in this study (the first four box-whisker plots in Figure 4) were not statistically different than the canonical Redfield Ratio (C:N = 6.6). In contrast, POC:POP and PON:POP ratios differed significantly (Student’s t-test, P < 0.01 in all comparisons) between the Thalassiosira spp. and the other strains during both growth phases, with values for the Thalassiosira spp. being greater for both ratios. Furthermore, POC:POP and PON:POP ratios for both groupings and growth phases were substantially lower than the Redfield Ratio (106 and 16, respectively). In the case of the non-Thalassiosira spp. Group, the average POC:POP ratio was 17.8 ± 6.0 and PON:POP ratio was 2.3 ± 0.9 (Figure 4).
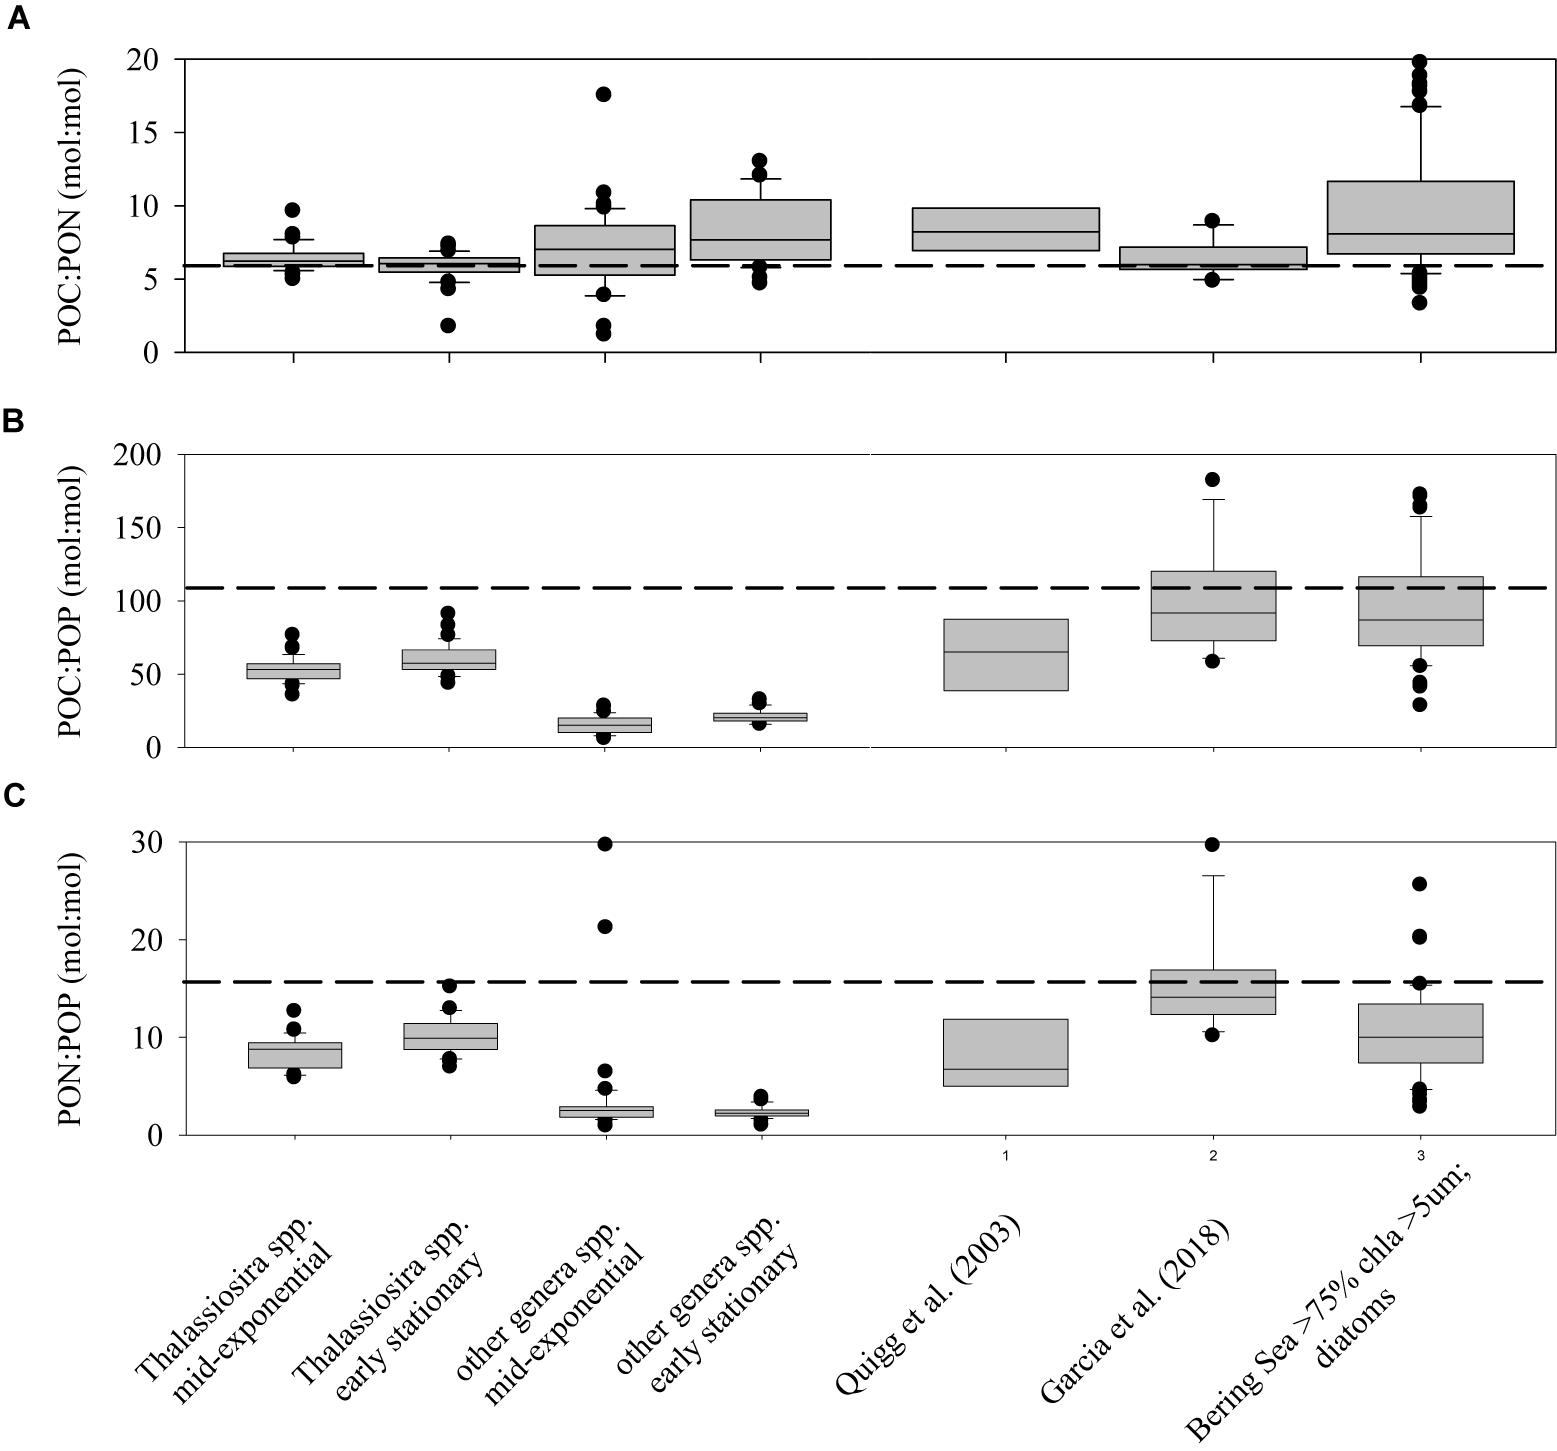
Figure 4. Box-Whisker plots of the ratios of POC:PON (A), POC:POP (B), and PON:POP (C) for cultures of the genus Thalassiosira and the other cultures studied in both exponential and stationary growth. For comparison, the data for diatom cultures presented in Quigg et al. (2003) and Garcia et al. (2018) are plotted, and data from the Bering Sea Shelf where diatoms dominated (>75%) of the total chlorophyll a (Lomas, unpublished data).
BSi:POC ratios also varied with taxonomic groupings, with the Thalassiosira spp. grouping showing consistently lower ratios (0.13 ± 0.03) than the non-Thalassiosira spp. group (0.24 ± 0.11; Table 4). Furthermore, the Thalassiosira spp. group had no significant responses in the BSi:POC ratio as a function of growth treatment, whereas the non-Thalassiosira spp. frequently demonstrated a more consistent decrease (29 ± 9.4%) in BSi:POC ratios from the control to the High Light growth condition.
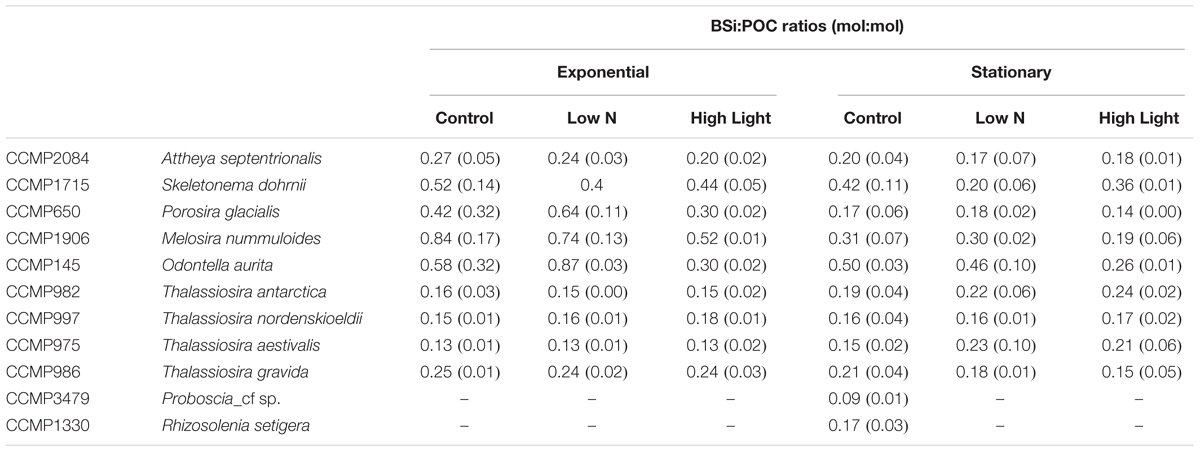
Table 4. Ratios of BSi:POC (mol:mol) for each culture, experimental treatment, and growth phase.
Chlorophyll per cell generally increased with cellular biovolume, however, the relationship showed considerably more variability than the element quotas (Supplementary Table S1). Furthermore, directional changes in chlorophyll content across growth treatments were variable with some strains increasing chlorophyll with the increase in light level, while some decreased chlorophyll content. Carbon to chlorophyll (POC:Chla) ratios, however, remained fairly consistent across conditions, suggesting a coordinated change in cell physiology. POC:Chla ratios were generally constrained to 10–30 with only a few instances of higher values (Table 5). There were no significant differences (one-way ANOVA) between any treatments for any strain. For all but one strain, O. aurita, the mean POC:Chla ratio stayed the same or increased in the High Light treatment, supporting the expectation that increased irradiance leads to lower Chla content to achieve a similar growth rate.
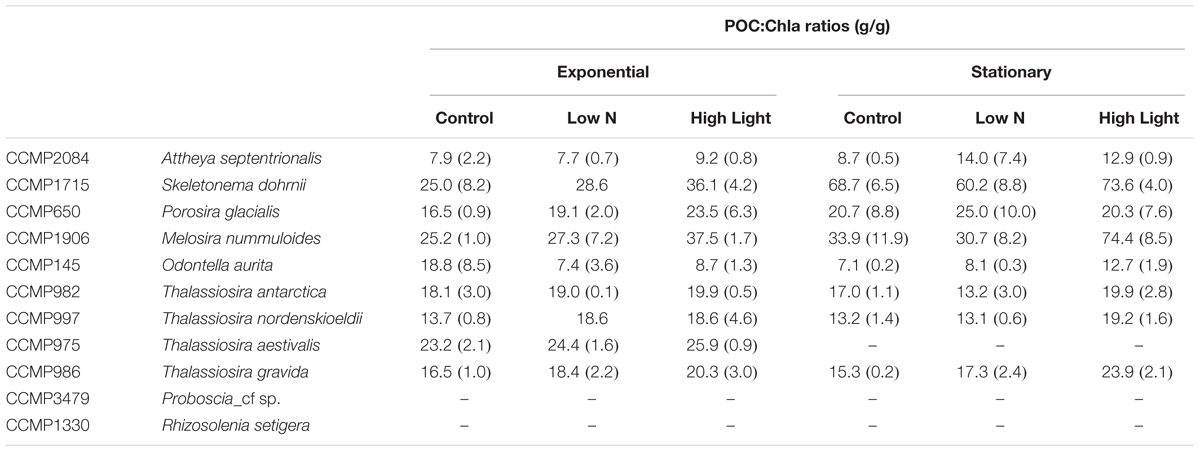
Table 5. Ratios of POC:Chla (g:g) for each culture, experimental treatment, and growth phase.
Discussion
The strains chosen for use in this experiment, as mentioned previously, have all been maintained at 2°C since being brought into the NCMA culture collection. The choice of a 2°C growth temperature was in part practical (only a finite number of growth temperatures) and partly because this is the temperature that most closely matched the actual temperature at the time of isolation. Thus we are confident the observed responses are representative of diatoms grown under cold water conditions, and not a stress response. Admittedly, all but one of these strains were isolated from the northern hemisphere. This is in part the reality of what strains we had available to us, and in part due to choosing strains that were axenic. Thus it is possible that the responses observed herein would only be applicable to northern hemisphere sub/polar diatoms, however, we do not believe this to be likely.
Cell Growth Rates and Biovolumes
Growth rates generally were not different between treatments. This observation suggests that our experimental treatments of increased light and altered nutrient availability ratios were not extreme enough to elicit significant differences in response. Furthermore, based upon the accumulation of particulate nutrients, we conclude that macronutrient limitation was not the explanation for the cessation of growth. Light is the most likely explanation given the low overall light levels used and the high biomass, however, trace metal limitation cannot be ruled out as we did not measure those concentrations. We assessed the observed growth rates relative to an estimated potential maximum growth rate to explore the lack of response. We used the published relationship of temperature versus maximum growth rate in Eppley (1972) to set the maximum value on the growth rate at a temperature of 2°C, and then scaled that maximum growth rate to cell biovolume using the relationship presented by Chisholm (1992) and Edwards et al. (2012). While the Eppley curve does not have many data points representative of polar temperatures, later reviews of the relationship for polar phytoplankton found it to be remarkably robust (Smith and Sakshaug, 1990). The reviews by Edwards et al. (2012) and Chisholm (1992) have slightly different scaling factors and thus are used as minimum and maximum estimates of relative growth rate, respectively. Our observed growth rates varied from a low of 9–18% of the maximum growth rate for A. septentrionalis to a high of 100% of maximum for T. antarctica, P. glacialis, O. aurita, and Proboscia_cf sp., with a mean of 52–62% of maximum (Table 1); thus, our growth conditions appear to have generally supported high relative growth rates. These rates reflect a physiological condition that might be similar to environmental observations, especially given the high likelihood for growth rate to be modulated by interactions between temperature, light availability, and/or suboptimal nutrients as discussed previously (Smith and Sakshaug, 1990; Maranon et al., 2013).
The experimental design appears to have systematically reduced biovolume variability relative to previous studies. Since no active measures were taken to induce synchrony, the diatoms within each batch culture represented a range of “cell division states.” Using T. pseudonana cultures, Claquin et al. (2002) used various limitation factors (light, N, P) to alter the time spent in various phases of the cell cycle as growth slowed, where all limitation treatments significantly increased the duration of the G2+M cell cycle phase when growth rate was <0.2 d-1. The light limitation treatment in the experiments by Claquin et al. (2002) also induced an eightfold decrease in biovolume relative to N and P limited treatments. The absolute range in growth rate among our diatom clones was small (0.02–0.14 d-1, Table 1), and within each clone the relative range was significantly smaller than observed in Claquin et al. (2002). Given that the changes in mean biovolume between growth phase are all less than a factor of 2 (either increased or decreased), and that the variability is large, we conclude that these measurements reflect the natural distributions of population size in an unsynchronized batch culture rather than meaningful changes in cell biovolume associated with nutrient limitation as observed previously (Claquin et al., 2002).
It is generally accepted from the literature that the slope of the log–log relationship between experimentally determined maximum growth rate and biovolume is negative, although the variance is substantial given the wide range of species and growth conditions summarized to generate these general allometric relationships (e.g., Chisholm, 1992; Finkel et al., 2010; Edwards et al., 2012). Interestingly, as more data are generated with time and included in the correlation, the slope of this relationship has decreased from -0.32 observed by Chisholm (1992) to -0.06 observed by Finkel et al. (2010), although this does not appear to be driven solely by inclusion of additional cold water cultures as there are few data points below 5°C. For our observed growth rates, the log-log relationship between growth rate and biovolume changes sign to significantly positive (P = 0.05), with a slope of 0.27 ± 0.05. This relationship is different than what has been previously reported in reviews (Chisholm, 1992; Finkel et al., 2010; Edwards et al., 2012). The difference being that our dataset consists entirely of diatom strains grown at polar temperatures (2°C), whereas prior studies covered a wide diversity of algal strains grown along a broad range of growth temperatures (∼4°C to >30°C); indeed, nearly all our quantified growth rates fall below the range reported by Chisholm (1992). This suggests that fundamental allometric relationships, such as growth rate versus biovolume, may show substantial changes in the magnitude of the quantitative relationship at cold growth temperatures and this should be considered in models. It has already been shown that diatoms are different than other protists (Menden-Deuer and Lessard, 2000), and perhaps the combination of diatoms and cold temperatures creates a unique allometric/environmental niche. Polar environments generally consist of cold water and highly variable light conditions. Diatoms have been observed to be uniquely adapted to sub/polar conditions, in part due to their ability to dissipate excess photosynthetic electron energy at high light and low temperatures (Lomas and Gilbert, 1999; Parker and Armbrust, 2005; Glibert et al., 2015).
Our data also show a fundamentally different relationship among diatom species, specifically the positive correlation between relative growth rate and biovolume (Figure 2E). The negative relationship between maximum specific growth rate and cell size is a long-standing concept in phytoplankton physiology (e.g., Chisholm, 1992; Raven et al., 1992); however, Chisholm (1992) explains that diatoms break this generalization by going “against all allometric reasoning.” Our results expand on this, suggesting that larger diatoms consistently achieve growth rates closer to theoretical maximum than do small diatoms grown at polar temperatures.
Polar environments are regions where large diatoms may have a selective advantage over smaller diatoms in realizing maximum achievable growth rates. Broadly, large vacuous diatoms may have a systematically lower Q10 for growth than their smaller (e.g., pennate) counterparts. Another possibility, which is not mutually exclusive, is that large vacuous centric diatoms may be able to allocate more resources to progeny to sustain high division, as has been observed in temperate diatoms. Laney et al. (2012), using Ditylum brightwellii (vacuole ∼80–90% of cell content; Eppley and Rogers, 1970), observed that daughter cells inheriting the hypotheca valve (i.e., smaller than epitheca) also were more likely to inherit a greater proportion of parent cell material and divide quicker than epitheca progeny. These authors conclude that the bias in cell division may result in higher population growth rates.
Beyond the conditions presented here, large vacuous centric diatoms appear to be primed for bursts of rapid growth (>2 doublings per day), above expectations given temperature relationships. This was observed for our three largest species, as their growth rates exceeded temperature-based expectations (Table 1). This same trend of large diatoms exceeding expected growth rates has been observed during iron-fertilization experiments in the subarctic Pacific (Tsuda et al., 2003), the eastern equatorial Pacific (Brzezinski et al., 2011), and other regions (de Baar et al., 2005 and references therein). Similarly, McNair et al. (2018b) reported that large Chaetoceros (>20 μm) grew at 2.08 d-1 (water temperatures of ∼12°C) in the nearshore upwelled waters of the California Current. It is possible the effect of high growth rates is a wider phenomenon among large diatoms which manifested here due to nutrient-replete conditions. However, in the field, such high growth rates may not always be observed due to suboptimal growth conditions (e.g., light, trace metal, nitrogen, or silicon limitation).
The implications of this relationship between diatom size and relative growth rate differences further highlights the need to quantify phytoplankton diversity (even if only by size) within major lineages to understand ecosystems and their response to changing environmental conditions rather than focusing on which major group (e.g., diatoms versus flagellates) dominates a given ecosystem. Indeed, the latter “group” distinction harbors tremendous diversity on its own, as the genetic similarity of the first two sequenced diatom genomes is similar in molecular divergence as humans and pufferfish (Takifugu rubripes, Bowler et al., 2008), such that functional diversity within major groups may be required.
Cell Element Quotas and Elemental Density
As all species appeared to fall on a single predictive line, we estimated the ordinary least squares Model II linear regression through all the data points for each of the cell element quotas and the two growth phases (Figures 2, 3). In most cases, the slope of the best fit relationship of C quota and biovolume was significantly different from the value given in Menden-Deuer and Lessard (2000) in their compilation of many marine protists including diatoms. When O. aurita was included in the regression, the slopes were significantly lower than that given by Menden-Deuer and Lessard (2000). In contrast, when O. aurita was excluded, the slope of the data from the exponential growth phase treatment was significantly higher (Table 2). Even greater than the difference in slope, the most glaring distinction between this study and Menden-Deuer and Lessard (2000) was in the cell C quota intercept values. Regardless of whether O. aurita was included or not, or the growth phase, the least squares intercept of C quota on biovolume was always significantly greater than that given in Menden-Deuer and Lessard (2000). Hence, while the relationship across the range of biovolumes generally varied as predicted by Menden-Deuer and Lessard (2000), the C quota per unit biovolume (i.e., elemental density) was significantly higher for these cold-water species. Analysis of C quota per unit biovolume for T. pseudonana grown under light and N and P limitation, the trend is opposite, as the intercept (-2.56 ± 0.29) is significantly lower than both our relationship and Menden-Deuer and Lessard (2000), suggesting that at warmer temperatures light and nutrient limitation may reduce elemental density (Claquin et al., 2002). As the slopes/intercepts are from log-log plots, the difference in elemental density is substantial and the sub/polar strains examined here are between 5- and 15-fold higher than previously published C densities (Chisholm, 1992; Menden-Deuer and Lessard, 2000).
The pattern of least square slopes for element quotas on biovolume being equal to or lower than published values from large data compilations held for the other three macronutrients as well (Si, Conley et al., 1989; N and P, Edwards et al., 2012). For N and Si, differences generally ranged from 5- to 15-fold, consistent with C (Table 2). Baines et al. (2010) made a similar observation when comparing the relationship between volumetric BSi and cell biovolume for diatoms collected in the Southern Ocean versus cultured clones. Southern Ocean diatoms were 11.3-fold more silicified per unit volume than culture diatoms grown under nutrient replete conditions (Baines et al., 2010). Instead of iron limitation, these authors attributed this increased elemental density to species diversity, as changes in silicification due to the reduction of growth limitation by iron addition were small compared to species differences in silicification. Our results support that diversity may be an important variable, however, we suggest the differences observed by Baines et al. (2010) could also be explained by temperature effects on diatom elemental density. The results from Takeda (1998), reporting culture data on two Antarctic clones, are typically cited for the observed iron effect, however, reanalysis of these culture data suggest they are more consistent with our results – temperature exerts the dominant effect on quota. Takeda’s (1998) N and Si quota values for both iron-replete and iron-limited cells were 2–10× higher than predicted by standard allometric relationships for each element (Conley et al., 1989; Edwards et al., 2012). Thus, our data along with that of Takeda (1998) suggest that temperature is the dominant variable controlling sub/polar diatoms elemental density, whereas iron-limitation of growth appears to affect stoichiometry. The effect on stoichiometry has been observed in the field (Hutchins and Bruland, 1998; Franck et al., 2000), but to our knowledge, the thermal effect on quota has seldom been discussed.
In contrast to the other elements, intercept differences for P generally were greater, up to 100-fold, in this study versus previous reviews. A possible explanation for this difference lies in the fast growth rates supported by higher P fluxes and thus elevated P quota associated with P-rich ribosomes (Elser et al., 2003) or other P storage pools such as polyphosphate. Baines et al. (2010) also observed that Southern Ocean diatom cells were more enriched in P than those from the equatorial Pacific. While there are very few polar diatoms grown at polar temperatures in these large data review compilations, this pattern is seen in environmental compilations wherein bulk POC:POP ratios decrease at higher latitudes, which also corresponds to a gradient toward diatoms making up a greater proportion of the overall community at higher latitudes (Martiny et al., 2013). As with N and Si, this is also observed in the Takeda (1998) dataset, as the reported P quotas for both iron-replete and iron-limited polar diatoms were 1.5–14× higher than predicted by the Edwards et al. (2012) allometric relationship. Furthermore, the data compiled by Edwards et al. (2012) are actually the minimum estimated cell element quota (i.e., the quota when growth rate equals zero; see Droop, 1973), and so the difference between our dataset and those of community ensembles may be skewed to a greater value because the cultures in this study were not likely to be macronutrient limited. It is possible that other marine protists have a greater capacity for cellular P quota flexibility than diatoms or that sub/polar diatoms have a much higher lipid content to maintain membrane fluidity. In support of this interpretation, the ice algae M. nummuloides has a slightly higher P content than diatoms of similar biovolume (Figures 2, 3).
Ultimately, such increases in elemental density may help to explain why polar secondary production is so high despite relatively low primary production (compared to temperate systems). Specifically, because diatoms have a selective advantage in polar environments, and they have higher elemental density, the yield of organic matter per volume of phytoplankton ingested may be higher than for lower latitudes. Thus, this finding appears not only to affect how we parameterize allometry but how we might model trophic-transfer and food-web efficiency in high-latitude systems fueled primarily by diatoms.
Nutrient Stoichiometric Ratios and Biogeochemical Applications
Knowledge of concentrations and elemental ratios of suspended particles are important for understanding many biogeochemical processes in the ocean. These include patterns of phytoplankton nutrient limitation as well as linkages between the cycles of carbon and nitrogen or phosphorus. Ratios of cellular C:N in this study were on average greater than the canonical Redfield value of 6.6 (Figure 4A). Strains from the genera Thalassiosira were on average lower than the other diatom species tested in this study, but the result was not significant (t-test, P = 0.1). In contrast, ratios of C:P and N:P were significantly higher in Thalassiosira spp. than in the other strains tested (Figures 4B,C, t-test, P < 0.05). This may be important when modeling polar diatom dynamics, as species of Thalassiosira (e.g., T. rotula) are important bloom and export species in many high-latitude environments (e.g., Southern Greenland, Juul-Pedersen et al., 2015; Barents Sea, Wiedmann et al., 2014). There were no significant differences in elemental ratios within these broad diatom groupings between exponential and early-stationary growth phases suggesting that while quotas may change they do so in concert when nutrient limitation is not the reason for reduced growth. This is in contrast to a common explanation of variable cellular stoichiometry called the growth rate hypothesis (Elser et al., 2003; Claquin et al., 2004; Klausmeier et al., 2004), where cells change the allocation of intracellular biochemical resources based upon different growth strategies and/or conditions. Spilling et al. (2015), studying another diatom Chaetoceros wighamii grown at low temperatures, observed elemental stoichiometric ratios similar to those presented here for non-nutrient limited cultures in exponential growth phase, but when nutrients limited growth rate, stoichiometric ratios increased.
Evidence supporting the growth rate hypothesis in marine systems has been difficult to resolve (Martiny et al., 2013). The elemental stoichiometry data collected in this study was compared to two other studies that also explored elemental ratios in multiple diatoms strains (Quigg et al., 2003; Garcia et al., 2018). Just as the result reported here for all strains, these prior studies found C:N ratios that were not statistically different (Figure 4). In contrast, the C:P and N:P ratios in these prior studies were not statistically different from the Thalassiosira strains observed in this study, but were greater than the other diatom strains we examined. Our data was also compared to field data collected by Lomas’ lab on the Bering Sea Shelf during spring and summer of 2008–2010, specifically the subset of Bering Sea data where diatoms dominated the total chlorophyll (i.e., >5 μm chlorophyll a was >75% of the total chlorophyll). While large dinoflagellates, both autotrophic and heterotrophic were present, particularly in summer, they were not a significant fraction of the >5 μm chlorophyll (Moran et al., 2012) and thus likely had a minimal impact on the overall stoichiometry. The elemental stoichiometry of this “bulk diatom” material had statistically similar C:N, C:P, and N:P ratios to the Thalassiosira strains in this study, which is consistent with the taxonomic analysis (Lomas, unpublished data). It has been suggested in field samples that the accumulation of detrital particulate matter may influence elemental stoichiometric ratios (e.g., Krause et al., 2010), but our understanding of detritus concentrations, elemental composition and cycling are inadequate to evaluate this hypothesis. However, the similarity between field and culture data suggest that the impact of detritus might be low during periods of net diatom growth (e.g., bloom development). Overall, these results reinforce the importance of taxonomy, even within an algal lineage (Garcia et al., 2018), as a variable controlling the observed elemental stoichiometry in the field, suggesting it is important to understand algal taxonomy when interpreting field elemental data.
The POC:Chla ratio is central to estimates of net primary production, either in ecosystem models or remote sensing applications, as it is used to convert the commonly used metric of chlorophyll to phytoplankton biomass in carbon units. When multiplied by some measure of physiological turnover rates the product is net primary production. The POC:Chla ratio is known to vary primarily as a function of mean cell size, light history, and nutrient status (e.g., Malone, 1980; Geider, 1987), and can range from 10 to >160 (Taylor et al., 1997; Spilling et al., 2015). Despite this wide range, consistent patterns have been observed. For example, in the Bering Sea during the spring and summer POC:Chla ratios using phytoplankton biovolume to carbon conversions ranged from 36–57 (Lomas et al., 2012). Slightly lower ratios ranging from 20–30 were observed in the Chukchi Sea during the spring productive period (Sherr et al., 2003; Campbell et al., 2009). More recently, Burt et al. (2018) used autonomous shipboard sensors and estimated POC:Chla ratios to be 10–20 in the highly productive waters around Vancouver Island (Northeast Pacific) dominated by diatoms. The ratios observed in this study (Table 5) are consistent with these observations from the field, but as for the element stoichiometric ratios, they highlight the importance of taxonomy as another important variable controlling the magnitude of the ratio.
Of specific importance to diatoms and their biogeochemical role in high-latitude environments is BSi:POC. This ratio has been used to estimate diatom-specific productivity from 14C measured primary production, diatom contribution to particulate biomass from total suspended biogenic silica, and diatom contribution to particulate matter export in many systems (e.g., Nelson and Brzezinski, 1997; Leynaert et al., 2001), including high latitude regions (Krause et al., 2018). In an extensive culture experiment using temperate diatom clones, Brzezinski (1985) found that the average BSi:POC for 27 species of nutrient-replete diatoms was 0.13. Brzezinski also found that the BSi:POC ratio was insensitive to growth on an 18:6 L:D cycle or continuous light. The strains used in this study did not show a consistent response to growth at High Light relative to the control (Table 4). Several species, M. nummuloides, P. glacialis, and O. aurita showed statistically lower BSi:POC ratios when grown at High Light, while the other species did not show a significant treatment effect. A significant difference was observed by Brzezinski based on cell size; cells <20 μm had a BSi:POC ratio of 0.15 ± 0.04, while cells >20 μm had a BSi:POC ratio of 0.09 ± 0.03. In contrast to the findings of Brzezinski (1985), there was no inverse relationship between BSi:POC ratios and cell size. The four highest ratios belonged to strains that spanned a biovolume range of ∼20 μm3 to ∼24,000 μm3. It cannot be determined if this is a random effect or a temperature effect as there are so few data of stoichiometric ratios for diatoms grown at 2°C.
A variable that has been shown to dramatically impact the BSi:POC ratio in diatoms is iron. Iron-limited growth is thought to restrict carbon acquisition while allowing Si uptake to continue at high rates (due to high silicic acid concentration, e.g., Southern Ocean) for longer periods (due to slower growth) leading to the accumulation of BSi and a thicker frustule (Leynaert et al., 2004). The magnitude of this response varies across cultures. For example, iron-limited T. oceanica exhibit a BSi:POC range of 0.10–0.15, while D. brightwellii in the same study show a range of iron-limited BSi:POC ratios of 0.2–0.5 (Bucciarelli et al., 2010). C. dichaeta and Nitzschia sp. were found to have iron-limited BSi:POC ratios of 0.27–0.30 (Takeda, 1998). Similar ranges of BSi:POC have been observed in field studies and support the interpretation of iron-limited growth (Hutchins and Bruland, 1998; Assmy et al., 2013; Lasbleiz et al., 2014). The results of the current study suggest that some diatoms, both large and small, can have BSi:POC ratios >0.25 despite being grown under iron-replete culture conditions. This is not consistently associated with slow growth rates in these cultures. For example, the measured growth rates for O. aurita and P. glacialis are estimated to be at their maximum growth rates (Table 1), yet they have BSi:POC ratios of 0.21–0.61, and 0.18–0.28, respectively. Conversely, S. dohrnii and M. nummuloides were growing at rates about half of the estimated maximum, or less, and had BSi:POC ratios of 0.28–0.46, and 0.27–0.40, respectively (Table 4). It is possible that the cold temperature restricts growth rates and yield a response similar to that of iron-limitation. Indeed much of the culture work demonstrating the iron-limitation effect has been done under more dynamic ranges in growth rate (e.g., ∼0.4–1.4 d-1, Leynaert et al., 2004) than considered here.
Given the average ratio among all diatom clones and treatments (0.28), applying the standard Brzezinski BSi:POC ratio (0.13) to polar diatoms for estimation of their contribution to primary production may result in a twofold overestimate of the actual diatom quantity. However, recent analysis has demonstrated strong kinetic limitation of diatom Si uptake in the European sector of the Arctic (Krause et al., 2018), such that most assemblages are taking up Si below their half-saturation concentrations. Recently, McNair et al. (2018a) demonstrated directly, and for the first time, that field diatoms thin their frustule in response to suboptimal silicic acid to avoid slowing growth – an idea first inferred in the 1970s based on culture work. Under conditions in certain sectors of the Arctic (Krause et al., 2018), if diatoms reduced their BSi per cell by 50% to compensate for uptake rates operating below 50% of maximum (i.e., which would allow for replete Si per cell), this could result in the polar diatom BSi:POC ratio being reduced by half, thereby converging with the standard Brzezinski ratio. Thus, proper inference of diatom contribution to primary production, using BSi:POC ratios, also requires understanding of how diatom Si-uptake capacity may be compromised by available silicic acid.
Summary
The results from this study show that diatoms grown at polar temperatures (2°C) follow an allometric relationship similar to that of warmer water diatoms, however, they differ substantially in their elemental density, resulting in a significant relationship offset for each of the macronutrient elements. The lack of understanding regarding sub/polar-diatom elemental density is a critical omission when modeling biogeochemical processes. Biogeochemical models commonly use fixed stoichiometry to convert from a measured property to the model-currency unit (e.g., C, N) for diatoms (Chai et al., 2002) which can propagate error if diatom C or N is determined using standard allometry. Our data support using a flexible stoichiometric method (e.g., Mongin et al., 2006; Popova et al., 2010) for modeling diatom dynamics in higher latitudes. While these approaches better account for natural stoichiometric variability, they still rely on minimum cell element quotas to drive their models and most are derived from culture work using temperate clones (Mongin et al., 2006 and references therein). Alternatively, these studies may also assume diatom biomass is only in one size fraction (e.g., large phytoplankton, Popova et al., 2010) then model diatom biomass driven by absolute chlorophyll concentration converted to model units (e.g., C, N). Both model approaches make a homogenizing assumption by considering diatoms as functionally singular, disregarding diversity observed in previous studies. Omitting diversity is understandable, as computing power and a lack of observational data for ground truthing both have hindered robust analyses. However, our data set is one of many which confirms the importance of diatom diversity (e.g., Assmy et al., 2013; Lasbleiz et al., 2014) in understanding system biogeochemistry and ecology. This result, along with recent findings that small diatoms (<5 μm, e.g., Minidiscus spp.) may be significant contributors to both POC and BSi (Leblanc et al., 2018), suggests that splitting diatoms into multiple functional compartments (e.g., based on size) may be a strategy future models need to employ. The relationships defined here provide a more realistic way to parameterize diatom biomass and stoichiometry in polar systems and, upon reanalysis, is consistent with results which were present in smaller datasets 21 years ago (e.g., Takeda, 1998) but not emphasized.
Author Contributions
ML, JK, and SB designed the experiments. SB and SA grew the cultures and conducted the analyses. ML and JK wrote the manuscript with feedback from the other authors.
Funding
We acknowledge funding support for this research through National Science Foundation Office of Polar Programs award numbers OCE-1603460 (ML) and OCE-1603605 (JK).
Conflict of Interest Statement
The authors declare that the research was conducted in the absence of any commercial or financial relationships that could be construed as a potential conflict of interest.
Acknowledgments
We thank the National Center for Marine Algae and Microbiota curators for guidance on growing these sub/polar strains. Data are publicly available at the National Science Foundation Arctic Data Center (http://arcticdata.io, doi: 10.18739/A2D79596Q).
Supplementary Material
The Supplementary Material for this article can be found online at: https://www.frontiersin.org/articles/10.3389/fmars.2019.00286/full#supplementary-material
References
Alvarez, E., Moyano, M., Lopez-Urrutia, A., Nogueira, E., and Scharek, R. (2013). Routine determination of plankton community composition and size structure: a comparison between flowcam and light microscopy. J. Plankton Res. 36, 170–184. doi: 10.1093/plankt/fbt069
Assmy, P., Smetacek, V., Montresor, M., Klaas, C., Henjes, J., Strass, V., et al. (2013). Thick-shelled, grazer-protected diatosm decouple ocean carbon and silicon cycles in the iron-limited antarctic circumpolar current. Proc. Acad. Nat. Sci. Phila. 110, 20633–20638. doi: 10.1073/pnas.1309345110
Baines, S., Twining, B., Brzezinski, M. A., Nelson, D. M., and Fisher, N. S. (2010). Causes and biogeochemical implications of regional differences in silicification of marine diatoms. Glob. Biogeochem. Cycle 24:GB4031
Bowler, C., Allen, A., Badger, J., Grimwood, J., Jabbari, K., Kuo, A., et al. (2008). The phaeodactylum genome reveals the evolutionary history of diatom genomes. Nature 456, 239–244. doi: 10.1038/nature07410
Brzezinski, M. A. (1985). The SI:C:N ratio of marine diatoms: interspecific variability and the effect of some environmental variables. J. Phycol. 21, 347–357. doi: 10.1111/j.0022-3646.1985.00347.x
Brzezinski, M. A., Baines, S., Balch, W. M., Beucher, C., Chai, F., Dugdale, R. C., et al. (2011). Co-limitation of diatoms by iron and silicic acid in the equatorial Pacific. Deep Sea Res. 2 58, 493–511. doi: 10.1016/j.dsr2.2010.08.005
Bucciarelli, E., Pondaven, P., and Sarthou, G. (2010). Effects of and iron-light co-limitation on the elemental composition (Si, C, N) of the marine diatoms thalassiosira oceanica and ditylum brightwellii. Biogeosciences 7, 657–669. doi: 10.5194/bg-7-657-2010
Burt, W., Westberry, T. K., Behrenfeld, M. J., Zeng, C., Izett, R., and Tortell, P. D. (2018). Carbon:chlorophyll ratios and net primary productivity of subarctic Pacific surface waters derived from autonomous shipboard sensors. Glob. Biogeochem. Cycle 32, 267–288. doi: 10.1002/2017gb005783
Campbell, R., Sherr, E., Ashjian, C., Plourde, S., Sherr, B., Hill, V., et al. (2009). Mesozooplankton prey preference and grazing impact in the western arctic ocean. Deep Sea Res. 2 56, 1275–1289.
Chai, F., Dugdale, R., Peng, T., Wilkerson, F., and Barber, R. T. (2002). One dimensional ecosystem model of the equatorial Pacific upwelling system. Part I: Model development and silicon and nitrogen cycles. Deep-Sea Research II 49, 2713–2745. doi: 10.1016/s0967-0645(02)00055-3
Chisholm, S. W. (1992). “Phytoplankton size,” in Primary Productivity and Biogeochemical Cycles in the Sea, eds P. G. Falkowski and A. V. Woodhead (New York: Plenum Press), 213–237. doi: 10.1007/978-1-4899-0762-2_12
Claquin, P., Kromkamp, J. C., and Martin-Jezequel, V. (2004). Relationship between photosynthetic metabolism and cell cycle in a synchronixzed culture of the marine alga cylindrotheca fusiformis (Bacillariophyceae). Eur. J. Phycol. 39, 33–41. doi: 10.1080/0967026032000157165
Claquin, P., Martin-Jezequel, V., Kromkamp, J. C., Veldhuis, M. J., and Kraay, G. W. (2002). Uncoupling of silicon compared with carbon and nitrogen metabolisms and the role of hte cell cycle in continuous cultures of Thalassiosira pseudonana (Bacillariophyceae) under light, nitrogne and phosphorus control. J. Phycol. 38, 922–930. doi: 10.1046/j.1529-8817.2002.t01-1-01220.x
Conley, D. J., Kilham, S. S., and Theriot, E. (1989). Differences in silica content between marine and freshwater diatoms. Limnol. Oceanogr. 34, 205–213.
de Baar, H. J. W., Boyd, P. W., Coale, K. H., Landry, M. R., Tsuda, A., Assmy, P., et al. (2005). Synthesis of iron fertilization experiments: from the iron age in the age of enlightenment. J. Geophys. Res. Oceans 110 C09S16
De La Rocha, C., Brzezinski, M., and DeNiro, M. (1997). Fractionation of silicon isotopes by marine diatoms during biogenic silica formation. Geochim. Cosmochim. Acta 61, 5051–5056. doi: 10.1016/s0016-7037(97)00300-1
Droop, M. R. (1973). Some thoughts on nutrient limitation in algae. J. Phycol. 9, 264–272. doi: 10.1111/j.1529-8817.1973.tb04092.x
Edwards, K. F., Thomas, M. K., Klausmeier, C. A., and Litchman, E. (2012). Allometric scalling and taxonomic variation in nutrient utilization traits and maximum growth rate of phytoplankton. Limnol. Oceanogr. 57, 554–566. doi: 10.4319/lo.2012.57.2.0554
Elser, J., Acharya, K., Kyle, M., Cotner, J. B., Makino, W., Markow, T., et al. (2003). Growth rate-stoichiometry couplings in diverse biota. Ecol. Lett. 6, 936–943. doi: 10.1046/j.1461-0248.2003.00518.x
Eppley, R., and Rogers, J. (1970). Inorganic nitrogen assimilation of Ditylum brightwellii a marine plankton diatom. J. Phycol. 6, 344–351. doi: 10.1111/j.1529-8817.1970.tb02405.x
Finkel, Z., Beardall, J., Flynn, K. J., Quigg, A., Rees, T. A., and Raven, J. A. (2010). Phytoplankton in a changing world: cell size and elemental stochiometry. J. Plankton Res. 32, 119–137. doi: 10.1093/plankt/fbp098
Follows, M. J., Dutkiewicz, S., Grant, S., and Chisholm, S. W. (2007). Emergent biogeography of microbial communities in a model ocean. Science 315, 1843–1846. doi: 10.1126/science.1138544
Franck, V. M., Brzezinski, M. A., Coale, K. H., and Nelson, D. M. (2000). Iron and silicic acid concentrations regulate Si uptake north and south of he Polar Frontal Zone in the Pacific Sector of the southern ocean. Deep Sea Res. 2 47, 3315–3338. doi: 10.1016/s0967-0645(00)00070-9
Garcia, N., Sexton, J., Riggins, T., Brown, J., Lomas, M., and Martiny, A. C. (2018). High variability in cellular stoichiometry of carbon, nitrogen, and phosphorus within classes of marine eukaryotic phytoplankton under sufficient nutrient conditions. Front. Microbiol. 9:543. doi: 10.3389/fmicb.2018.00543
Geider, R. J. (1987). Light and temperature dependence of the carbon to chlorophyll a ratio in microalgae and cyanobacteria: implications for physiology and growth of phytoplankton. New Phytol. 106, 1–34. doi: 10.1111/j.1469-8137.1987.tb04788.x
Glibert, P., Wilkerson, F., Dugdale, R. C., Raven, J. A., Dupont, C. L., Leavitt, P. R., et al. (2015). Pluses and minuses of ammonium and nitrate uptake and assimilation by phytoplankton and implications for productivity and community composition, with emphasis on nitrogen-enriched conditions. Limnol. Oceanogr. 61, 165–197 doi: 10.1002/lno.10203
Hutchins, D. A., and Bruland, K. W. (1998). Iron-limited diatom growth and Si:N uptake ratios in a coastal upwelling regime. Nature 393, 561–563.
Jakobsen, H. H., and Carstensen, J. (2011). FlowCAM: sizing cells and understanding the impact of size distributions on biovolume of planktonic community structure. Aquat. Microb. Ecol. 65, 75–87. doi: 10.3354/ame01539
Juul-Pedersen, T., Arendt, K. E., Mortensen, J., Blicher, M. E., Sogaard, D. H., and Rysgaard, S. (2015). Seasonal and interannual phytoplankton production in a sub-Arctic tidewater outlet glacier fjord. SW Greenland. Mar. Ecol. Prog. Ser. 524, 27–38. doi: 10.3354/meps11174
Klausmeier, C. A., Litchman, E., and Levin, S. A. (2004). Phytoplankton growth and stoichiometry under multiple nutrient limitation. Limnol. Oceanogr. 49, 1463–1470. doi: 10.1007/s11120-018-00612-7
Krause, J., Brzezinski, M. A., Landry, M. R., Baines, S., Nelson, D. M., Selph, K. E., et al. (2010). The effects of biogenic silica detritus, zooplankton grazing, and diatom size structure on silicon cycling in the euphotic zone of the eastern equatorial Pacific. Limnol. Oceanogr. 55, 2608–2622. doi: 10.4319/lo.2010.55.6.2608
Krause, J., Duarte, C. M., Marquez, I. A., Assmy, P., Fernandez-Mendez, M., Wiedmann, I., et al. (2018). Biogenic silica production and diatom dynamics in the Svalbard region during spring. Biogeosci. Discuss. 15, 6503–6517. doi: 10.5194/bg-2018-2226
Krause, J. W., Nelson, D. M., and Lomas, M. W. (2009). Biogeochemical responses to late-winter storms in the Sargasso Sea, II: increased rates of biogenic silica production and export deep sea research part I. Oceanogr. Res. Pap. 56, 861–874. doi: 10.1016/j.dsr.2009.01.002
Laney, S. R., Olson, R. J., and Sosik, H. M. (2012). Diatoms favor their younger daughters. Limnol. Oceanogr. 57, 1572–1578. doi: 10.4319/lo.2012.57.5.1572
Lasbleiz, M., Leblanc, K., Blain, S., Ras, J., Cornet-Barthaux, V., Helias Nunige, S., et al. (2014). Pigments, elemental composition (C, N, P, and Si), and stoichiometry of particulate matter in the naturally iron fertlized region of kerguelen in the southern ocean. Biogeosciences 11, 5931–5955. doi: 10.5194/bg-11-5931-2014
Leblanc, K., Queguiner, B., Diaz, F., Cornet, V., Michel-Rodriquez, M., Durriew de Madron, X., et al. (2018). Nanoplanktonic diatoms are globally overlooked but play a role in spring blooms and carbon export. Nat. Commun. 9:953. doi: 10.1038/s41467-018-03376-9
Leynaert, A., Bucciarelli, E., Claquin, P., Dugdale, R. C., Martin-Jezequel, V., Pondaven, P., et al. (2004). Effect of iron deficiency on diatom cell size and silicic acid uptake kinetics. Limnol. Oceanogr. 49, 1134–1143. doi: 10.4319/lo.2004.49.4.1134
Leynaert, A., Treguer, P., Lancelot, C., and Rodier, M. (2001). Silicon limitation of biogenic silica production in the Equatorial Pacific. Deep Sea Res. 1 48, 639–660. doi: 10.1016/s0967-0637(00)00044-3
Lomas, M., and Gilbert, P. (1999). Temperature regulation of nitrate uptake: a novel hypothesis about nitrate uptake and reduction in cool-water diatoms. Limnol. Oceanogr. 44, 556–572. doi: 10.4319/lo.1999.44.3.0556
Lomas, M. W., Burke, A., Lomas, D., Shen, C., Bell, D., Dyhrman, S. T., et al. (2010). Sargasso Sea phosphorus biogeochemistry: an important role for dissolved organic phosphorus (DOP). Biogeosciences 7, 695–710. doi: 10.5194/bg-7-695-2010
Lomas, M. W., Moran, S. B., Casey, J. R., Bell, D. W., Tiahlo, M., Whitefield, J., et al. (2012). Spatial and seasonal variability of primary production on the eastern bering sea shelf. Deep Sea Res. 2 6, 126–140. doi: 10.1016/j.dsr2.2012.02.010
Malone, T. C. (1980). “Algal Size,” in The Physiological Ecology of Phytoplankton, ed. I. Morris (Oxford: Blackwell Scientific), 433–463.
Maranon, E., Cermeno, P., Lopez-Sanoval, D., Rodriquez-Ramos, T., Sobrino, C., Huete-Ortega, M., et al. (2013). Unimodal size scaling of phytoplankton growth and the size dependence of nutrient uptake and use. Ecol. Lett. 16, 371–379. doi: 10.1111/ele.12052
Margalef, R. (1978). Life-forms of phytoplankton as survival alternatives in an unstable environment. Oceaologica Acta 1, 493–509.
Martiny, A. C., Pham, C. T. A., Primeau, F., Vrugt, J. A., Moore, J., Levin, S. A., et al. (2013). Strong latitudinal patterns in the elemental ratios of marine plankton and organic matter. Nat. Geosci. 6, 279–283. doi: 10.1038/ngeo1757
McNair, H. M., Brzezinski, M. A., and Krause, J. W. (2018a). Diatom populations in an upwelling environment decrease silica content to avoid growth limitation. Environ. Microbiol. 20, 4184–4193. doi: 10.1111/1462-2920.14431
McNair, H. M., Brzezinski, M. A., Till, C. P., and Krause, J. (2018b). Taxon-specific contributions to silica production in natural diatom assemblages. Limnol. Oceanogr. 63, 1056–1075. doi: 10.1002/lno.10754
Menden-Deuer, S., and Lessard, E. J. (2000). Carbon to volume relationships for dinoflagellates, diatoms, and other protist plankton. Limnol. Oceanogr. 45, 569–579. doi: 10.4319/lo.2000.45.3.0569
Mongin, M., Nelson, D. M., Pondaven, P., and Treguer, P. (2006). Simulation of upper-ocean biogeochemistry with a flexible-composition phytoplankton model: C, N, and Si cycling and Fe limitation in the Southern Ocean. Deep Sea Res. 2 53, 601–619. doi: 10.1016/j.dsr2.2006.01.021
Montagnes, D. J. S., Berges, J. A., Harrison, P. J., and Taylor, F. J. R. (1994). Estimating carbon, nitrogen, protein and chlorophyll from volume in marine phytoplankton. Limnol. Oceanogr. 39, 1044–1060. doi: 10.4319/lo.1994.39.5.1044
Moran, S. B., Lomas, M. W., Kelly, R. P., Prokopenko, M., Granger, J., Gradinger, R., et al. (2012). Seasonal succession of net primary productivity, particulate organic carbon export, and autotrophic community composition in the eastern Bering Sea. Deep Sea Res. 2 6, 84–97. doi: 10.1016/j.dsr2.2012.02.011
Mordy, C. W., Stabeno, P. J., Ladd, C., Zeeman, S., Wisegarver, D. P., Salo, S. A., et al. (2005). Nutrients and primary production along the eastern aleutian island archipelago. Fish. Oceanogr. 14, 55–76. doi: 10.1111/j.1365-2419.2005.00364.x
Nelson, D., and Brzezinski, M. (1997). Diatom growth and productivity in an oligotrophic midocean gyre: a 3-yr record from the sargasso sea near bermuda. Limnol. Oceanogr. 43, 473–486. doi: 10.4319/lo.1997.42.3.0473
Parker, M. S., and Armbrust, E. V. (2005). Synergistic effects of light, temperature, and nitrogen source on transcirption of genes for carbon and nitrogen metabolism in the centric diatom Thalassiosira pseudonana (Bacillariophyceae). J. Phycol. 41, 1142–1153. doi: 10.1111/j.1529-8817.2005.00139.x
Parsons, T. R., Maita, Y., and Lalli, C. M. (1984). A Manual of Chemical and Biological Methods for Seawater Analysis. New York, NY: Pergamon Press.
Popova, E., Yool, A., Coward, A. C., Aksenov, Y. K., Alderson, S. G., De Cuevas, B. A., et al. (2010). Control of primary production in the arctic by nutrients and light: insights from a high resolution ocean general circulation model. Biogeosciences 7, 3569–3591. doi: 10.5194/bg-7-3569-2010
Putt, M., and Stoecker, D. K. (1989). An experimentally determined carbon:volume ratio for marine oligotrichous ciliates from estuarine and coastal waters. Limnol. Oceanogr. 34, 1097–1103. doi: 10.4319/lo.1989.34.6.1097
Quigg, A., Finkel, Z., Irwin, A., Rosenthal, Y., Ho, T., Reinfelder, J., et al. (2003). The evolutionary inheritence of elemental stoichiometry in marine phytoplankton. Nature 425, 291–294. doi: 10.1038/nature01953
Raven, J., Wollenweber, B., and Handley, L. (1992). A comparison of ammonium and nitrate as nitrogen sources for photolithotrophs. New Phytol. 121, 19–32. doi: 10.1111/j.1469-8137.1992.tb01088.x
Sailley, S., Ducklow, H. W., Moeller, H. V., Fraser, W. R., Schofield, O. M. E., Steinberg, D. K., et al. (2013). Carbon fluxes and pelagic ecosystem dynamics near two western antarctic peninsula Adelie penquin colonies: an inverse model approach. Mar. Ecol. Prog. Ser. 492, 253–272. doi: 10.3354/meps10534
Sherr, E., Sherr, B., Wheeler, P., and Thompson, K. (2003). Temporal and spatial variation in stocks of autotrophic and heterotrophic microbes in the upper water column of the central arctic ocean. Deep Sea Res. 1 50, 557–571. doi: 10.1016/s0967-0637(03)00031-1
Smith, W. O., and Sakshaug, E. (1990). “Polar phytoplankton,” in Polar Oceanography, ed. W. O. Smith (Cambridge, MA: Academic Press).
Solorzano, L., and Sharp, J. H. (1980). Determination of total dissolved phosphorus and particulate phosphorus in natural waters. Limnol. Oceanogr. 25, 754–758. doi: 10.4319/lo.1980.25.4.0754
Spilling, K., Ylostalo, P., Simis, S., and Seppala, J. (2015). Interaction effects of light, temperature, and nutrient limitations (N, P, and Si) on growth, stoichiometry and photosynthetic parameters of the cold-water diatom Chaetoceros wighamii. PLoS One 10:e0126308. doi: 10.1371/journal.pone.0126308
Strathmann, R. R. (1967). Estimating the organic carbon content of phytoplankton from cell volume or plasma volume. Limnol. Oceanogr. 12, 411–418. doi: 10.4319/lo.1967.12.3.0411
Sutton, J., Varela, D. E., Brzezinski, M. A., and Beucher, C. (2013). Species-dependent silica isotope fractionation by marine diatoms. Geochem. Cosmochem. Acta 104, 300–309. doi: 10.1016/j.gca.2012.10.057
Takeda, S. (1998). Influence of iron availability on nutrient consumption ratio of diatoms in oceanic waters. Nature 393, 774–776.
Tang, E. P. Y. (1995). The allometry of algal growth rates. J. Plankton Res. 17, 1325–1335. doi: 10.1111/gcb.13019
Tang, E. P. Y., and Peters, R. (1995). The allometry of algal respiration. J. Plankton Res. 17, 303–315. doi: 10.1093/plankt/17.2.303
Taylor, A. H., Geider, R. J., and Gilbert, F. J. H. (1997). Seasonal and latitudinal dependencies of phytoplankton carbon to chlorophyll a ratios: results of a modelling study. Mar. Ecol. Prog. Ser. 152, 51–66. doi: 10.3354/meps152051
Tsuda, A., Takeda, S., Saito, H., Nishioka, J., Nojiri, Y., Kudo, I., et al. (2003). A mesoscale iron enrichment in the western subarctic Pacific induces a large centric diatom bloom. Science 300, 958–961. doi: 10.1126/science.1082000
Venter, J. C., Remington, K., Heidelberg, J. F., Halpern, A. L., Rusch, D., Eisen, J. A., et al. (2004). Environmental genome shotgun sequencing of the sargasso sea. Science 304, 66–74. doi: 10.1126/science.1093857
Verity, P. G., and Langdon, C. (1984). Relationships between lorica volume, carbon, nitrogen and ATP content of tintinnids in narragansett bay. J. Plankton Res. 66, 859–868. doi: 10.1093/plankt/6.5.859
Verity, P. G., Robertson, C. Y., Tronzo, C. R., Andrews, M. G., Nelson, J. R., and Sieracki, M. E. (1992). Relationship between cell volume and carbon and nitrogen content of marine photosynthetic nanoplankton. Limnol. Oceanogr. 37, 1434–1446. doi: 10.4319/lo.1992.37.7.1434
Keywords: diatoms, elemental quota, carbon, nitrogen, phosphorus, silica, elemental stoichiometry
Citation: Lomas MW, Baer SE, Acton S and Krause JW (2019) Pumped Up by the Cold: Elemental Quotas and Stoichiometry of Cold-Water Diatoms. Front. Mar. Sci. 6:286. doi: 10.3389/fmars.2019.00286
Received: 06 September 2018; Accepted: 17 May 2019;
Published: 04 June 2019.
Edited by:
Hongbin Liu, The Hong Kong University of Science and Technology, Hong KongReviewed by:
Bingzhang Chen, University of Strathclyde, United KingdomMark Moore, University of Southampton, United Kingdom
Copyright © 2019 Lomas, Baer, Acton and Krause. This is an open-access article distributed under the terms of the Creative Commons Attribution License (CC BY). The use, distribution or reproduction in other forums is permitted, provided the original author(s) and the copyright owner(s) are credited and that the original publication in this journal is cited, in accordance with accepted academic practice. No use, distribution or reproduction is permitted which does not comply with these terms.
*Correspondence: Michael W. Lomas, mlomas@bigelow.org