Meeting Regional, Coastal and Ocean User Needs With Tailored Data Products: A Stakeholder-Driven Process
 Melissa M. Iwamoto1*
  Jennifer Dorton2
  Jan Newton3
  Moirah Yerta4
  James Gibeaut5
  Tom Shyka6
  Barbara Kirkpatrick7
  Robert Currier7
- 1Pacific Islands Ocean Observing System, School of Ocean and Earth Science and Technology, University of Hawai‘i at Mānoa, Honolulu, HI, United States
- 2Southeast Coastal Ocean Observing Regional Association, Charleston, SC, United States
- 3Northwest Association of Networked Ocean Observing Systems, University of Washington, Seattle, WA, United States
- 4Vanuatu Meteorology and Geo-hazards Department, Port Vila, Vanuatu
- 5Harte Research Institute for Gulf of Mexico Studies, Texas A&M University–Corpus Christi, Corpus Christi, TX, United States
- 6Northeastern Regional Association of Coastal Ocean Observing Systems, Portsmouth, NH, United States
- 7Gulf of Mexico Coastal Ocean Observing System Regional Association, Texas A&M University, College Station, TX, United States
New coastal and ocean observing stations and instruments deployed across the globe are providing increasing amounts of meteorological, biological, and oceanographic data. While these developments are essential for the development of various data products to inform decision-making among coastal communities, more data does not automatically translate into more benefits to society. Rather, decision-makers and other potential end-users must be included in an ongoing stakeholder-driven process to determine what information to collect and how to best streamline access to information. We present a three-step approach to develop effective tailored data products: (1) tailor stakeholder engagement to identify specific user needs; (2) design and refine data products to meet specific requirements and styles of interaction; and (3) iterate engagement with users to ensure data products remain relevant. Any of the three steps could be implemented alone or with more emphasis than others, but in order to successfully address stakeholders’ needs, they should be viewed as a continuum—as steps in a process to arrive at effective translation of coastal and ocean data to those who need it. Examples from the Regional Associations of the U.S. Integrated Ocean Observing System (IOOS®), the Texas General Land Office, and the Vanuatu Meteorology and Geo-hazards Department (VMGD) are woven throughout the discussion. These vignettes illustrate the value of this stakeholder-driven approach and provide a sample of the breadth of flexibility and customizability it affords. We hope this community white paper inspires others to evaluate how they connect their stakeholders to coastal and ocean observing data and provides managers of observing systems with a guide on how to evolve in a manner that addresses societal needs.
Introduction
Coastal communities have unique challenges and needs. Safe navigation, storm surge, shoreline run-up and erosion, extra-tropical systems, sea level rise, water quality, oil spills, marine debris, harmful algal blooms, and general ocean safety are concerns for those who live and work in close proximity to the ocean. Over the last decade, there has been an increase in the number of observing stations worldwide as part of the Global Ocean Observing System (GOOS) and other national and local programs (Liu et al., 2015; Willis, 2015), creating an opportunity to address the information needs of coastal communities. While this results in more data to monitor changing coastal and ocean conditions, more data does not automatically translate into more value for users. In other words, the data need to be accessible and in formats that are useful for end users. Indeed, many users need the data transformed to information that is clearly relevant to their professional or personal needs. Stakeholders differ in many ways, including level of ocean data knowledge and rate of data consumption (Iwamoto et al., 2016), cultural contexts, access to Internet and sufficient bandwidth, and more. Therefore, meeting user needs requires a tailored, iterative approach that connects users with data through value-added tools and data products that are both efficient and effective within their stakeholder context.
As a baseline, observing systems are typically a complex array of environmental sensors (e.g., physical oceanographic, meteorological, biogeochemical, biological) that are deployed from ships, integrated on buoys, moorings, platforms, autonomous vehicles, aircraft, and satellites. The data from these sensors help agencies (e.g., weather service agencies, tsunami warning agencies, public health agencies) to better understand our coastal and marine environments and provide data to their constituents. Further, people, including members of the public, may directly access these data for uses such as maritime operations, recreation, fishing, etc. These constituents, or stakeholders/users, are best defined as individuals, groups, or organizations who have an interest in a project or product, or who have a question or need that may be addressed by coastal and ocean data and information. These stakeholders can be within or outside the organization (Project Manager, 2019).
Based on over 142 years of accumulated experience in coastal ocean observing and working with stakeholders and users, we offer successful strategies to link society with coastal ocean data effectively. Herein, we promote the philosophy that well-designed observing systems address stakeholder-driven needs by design, explain why being stakeholder-driven is important, and describe a three-step process employed to develop products based on stakeholder needs.
The first step is to tailor stakeholder engagement to identify specific user needs. Unique cultures, environmental conditions, sectors, and politics, mean that a standard method (e.g., an electronic survey) to learn about a group’s needs might not be sufficient to learn about or understand all groups’ needs. Place-based, situational knowledge (i.e., the unique history, environment, culture, economy, politics, etc. of a particular community) all feed into how a particular stakeholder group views an issue, engages with partners, and expresses its needs (Bourne, 2016).
The second step is to design and refine data products to meet specific requirements and styles of interaction. There is a continuum of potential complexity among data products, and what works well for one audience might not work for another (e.g., a desktop data portal may work well for scientists needing to access many data layers at once, but is too complicated for a local fisher that needs to know if the ocean conditions are safe for a small boat on the other side of the island). Working iteratively with the users during the development process helps ensure optimal design.
The third step in this process is the exchange of knowledge for using the data. Understanding how a target audience uses a particular data product helps to ensure that the tool provides the intended utility, identifies where improvements might be necessary, and highlights the iterative nature of product development.
Overall, the creation of products and services is not “one size fits all.” Unique geographies, differing levels of data management capability and Internet infrastructure, and regional or international differences in audiences require product development to be tailored to specific needs. Any of the three steps identified in this paper could be implemented alone, but in order to address stakeholders’ needs most effectively, we strongly recommend viewing the approach as a continuum, as steps in a process to arrive at effective translation of coastal ocean data to those who need it. Figure 1 illustrates the steps and components of this process, which are elaborated in the discussion below. Depending on the specific situation, certain approaches may have more emphasis than others. Examples woven throughout the discussion (Table 1) illustrate the value of this stakeholder-driven approach and the breadth of flexibility and customizability it affords.
Table 1. List of organizations and web addresses for the data products described within this paper.
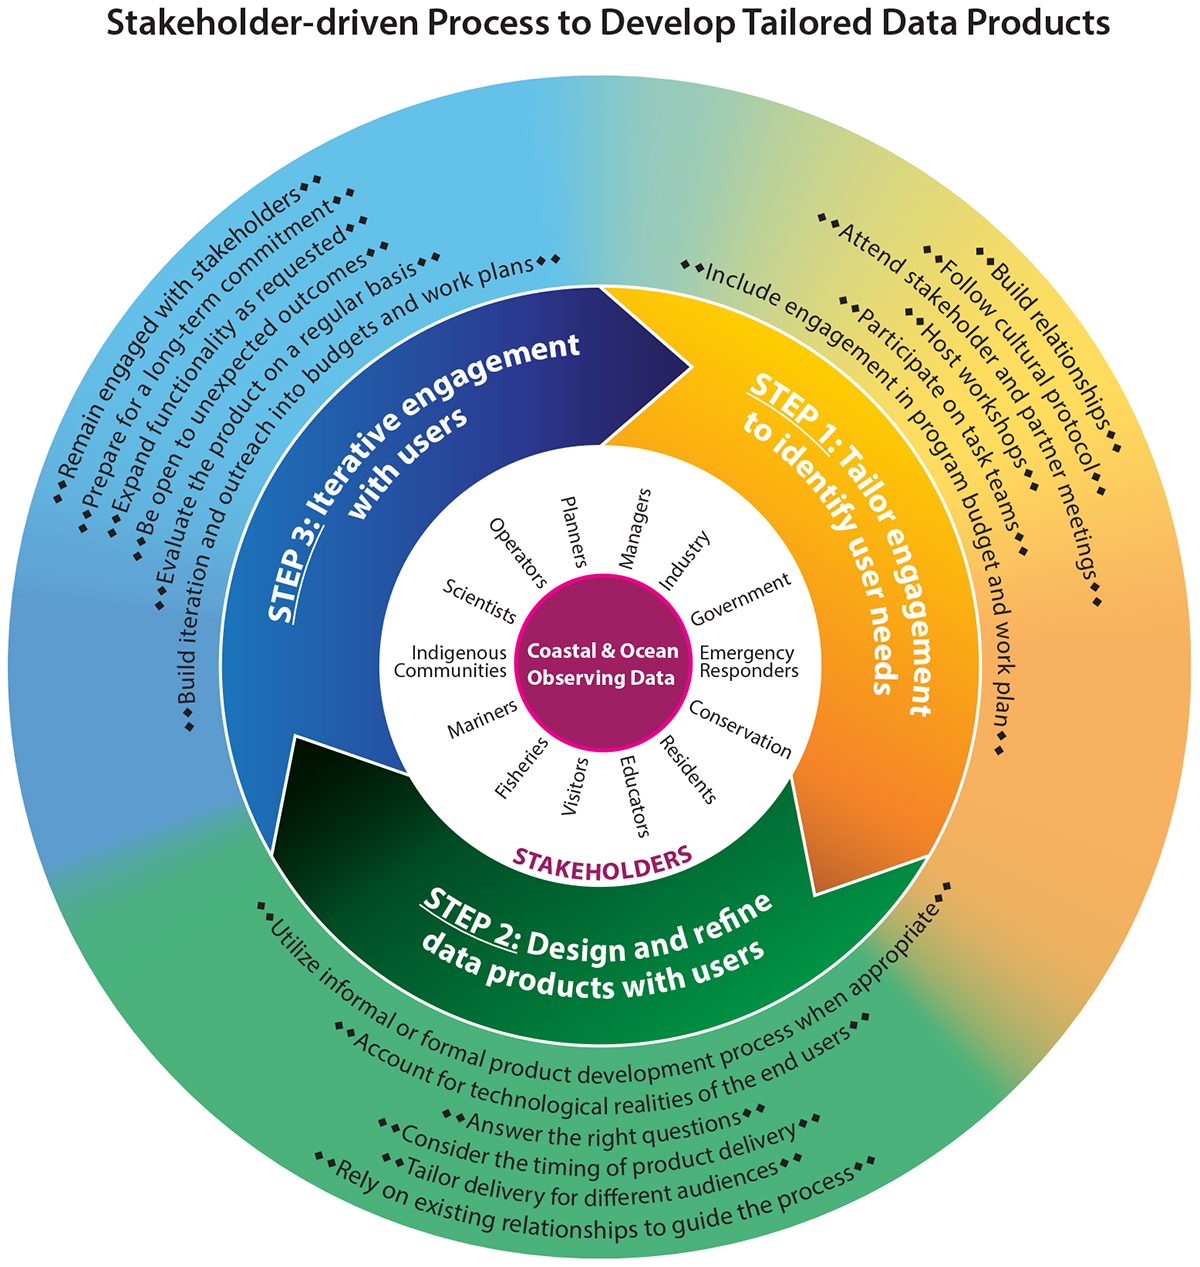
Figure 1. This figure illustrates the stakeholder-driven process to develop tailored data products presented in this paper. The process starts in the center, with various stakeholders and their interactions and needs related to coastal and ocean observing data. Starting here is a reminder to first set the intention to operate a stakeholder-driven process. The three steps in the next rung of the image represent the three steps of this iterative, non-linear process—a continuum in which the three steps overlap and blend into each other as well as repeat. The outer rung includes the various elements or best practices to draw from when working through the various stages of this process.
This community white paper is offered as a resource in advance of the 2019 event for the decadal OceanObs conference series. The authors are committed to the notion that coastal and ocean observing systems need to benefit the stakeholders they serve and offer this paper as a guide to achieve this worthwhile mission. The steps delineated herein are based on the cumulative experience of the authors and ongoing community discussions. Examples from the Regional Associations of the U.S. Integrated Ocean Observing System (IOOS®), the Texas General Land Office, and the Vanuatu Meteorology and Geo-Hazards Department (VMGD) are provided. We hope to inspire others to evaluate how they connect their stakeholders to coastal and ocean observing data and to provide managers of observing systems with a guide on how to evolve in a manner that addresses societal needs.
Three Steps to a Successful Stakeholder-Driven Process
Step 1: Tailor Engagement to Identify Specific User Needs
The first step in the stakeholder-driven process is to identify what people need. While this seems intuited and stakeholder needs may seem obvious, no one should assume that they inherently know the priorities or details of their users’ needs. Programs must engage with their stakeholders in order to learn about the questions that need answered, the decisions that must be made, and the challenges to overcome. As stated by Worsley (2016, p. 16), “all projects will benefit from…stakeholder engagement, but the form of that engagement will vary with the nature of the project”. Furthermore, unique cultures, environmental conditions, sectors, and politics, mean that the method to learning about one group’s needs might not be sufficient to learn about or understand another group’s. Indeed, the place-based, contextualized experiences of stakeholders play a significant role in how a particular stakeholder experiences and expresses a need (Bourne, 2016). This localized and contextualized background knowledge is vital, as are strong relationships built upon trust and mutual understanding.
Structured, formal mechanisms of stakeholder engagement include hosting workshops and forums specific to areas of concern, participating on task teams, ratifying Memorandums of Agreement, and having a board of stakeholders that advise strategic directions. Even these efforts, though, are fostered first through informal relationship-building. For example, the U.S. IOOS Regional Associations are unlikely to sign contracts or Memoranda of Agreement without a foundation of trust and collaboration upon which they can base the agreement.
Build Relationships
Relationship-building can be fostered over time through both informal, unstructured (e.g., e-mails, meetings, conversations) and formal, structured (e.g., project management plans, presentations, contracts) mechanisms, although the informal often precedes the formal efforts (Mulcahy, 2013). Although communication technologies can help build bridges, face-to-face interactions are an important investment in relationships. In addition, some remote communities, such as in Alaska and in part of the Pacific Islands, have limited access to communication technologies (e.g., webinar, Skype) or the necessary bandwidth making that in-person connection even more necessary. In any of these contexts, listening, asking questions, and helping make connections all should occur before providing updates on one’s own activities and capabilities. Examples of informal relationship building include participating in partner and community events and meetings, conducting site visits, and having one-on-one meetings.
Though essential, building relationships is not always easy. The geographic expanse of a particular observing system or organization, for example, can present a significant challenge to meaningful relationship-building. More remote locations require additional time and fiscal resources to be able to reach stakeholder communities, often either by plane or boat. In addition, the local cultures of some of these remote locations are also built upon oral traditions and are reliant on face-to-face personal interactions over a period of time to develop trust (Bishop and Glynn, 1992; Smith, 2004). This “showing face” can mean attending community events, following protocols, seeking out community elders—overall, becoming known to a community (Smith, 2004). Some common solutions employed across observing systems with very remote communities include supporting community-based liaisons, convening annual stakeholder meetings, and understanding that such efforts cannot be rushed. The timescale that these programs need to operate within is frequently much slower-paced than those in more connected (and typically developed) locations.
Vanuatu, for example, is a country with 83 islands, many of which are remote and difficult to access, requiring many days of travel to reach a particular village community. It can also be rather expensive to connect with these villages by small outboard motorboats. Telecommunications networks can be unreliable. However, Vanuatu has a hierarchical tier of engagement, from the national government to the grassroots level that is used to liaise with communities across the country. The national government offices work closely with the village chiefs accordingly through the local government or provincial council. The provincial council informs the area councils within the island, who then relay the message to the Community Disaster Committee & Community Climate Change Committee. These groups help communities to understand information that is made available for their use, and it is easy for the locals to convey their needs to these groups. Village meetings and church programs are also used to reach the community at large.
Through its Climate Services, the VMGD hosts the annual National Climate Outlook Forum to engage the community and specific sectors. This platform is used to share experiences and connections with the ocean and coasts. It is a way of engaging with community members at a grassroots level to learn about their needs and to work with them to determine how to best customize the department’s products to suit stakeholder needs.
Many islands in the region of the Pacific Islands Ocean Observing System (PacIOOS) are also extremely remote and expensive for the Honolulu-based staff to visit in person. Like Vanuatu, many of the islands in the PacIOOS region are not accessible by plane and are only intermittently serviced by ships. In order to build a stronger connection with the community, PacIOOS supports partial salaries of on-site community liaisons that are either from the island they inhabit or are intimately integrated into the society, with long-term bonds and relationships. The liaisons are also well-versed in PacIOOS efforts and capabilities. Through these liaisons (in the Marshall Islands, Federated States of Micronesia, American Samoa, and Guam), PacIOOS can have face-to-face meetings, attend local community and agency meetings, and ultimately, build the trust that is so essential for successful engagement in the Pacific Islands. Once trust and mutual understanding are well-established, opportunities organically arise to showcase and highlight one’s unique qualifications to help address stakeholder needs. The natural flow, then, is for communities to seek the observing system out to help achieve their respective missions and address their changing needs.
This was the case in American Samoa. After PacIOOS deployed a new wave buoy1 in collaboration with the local maritime and ocean safety community, coral ecologists and natural resource managers reached out to the local PacIOOS liaison with a new need. It was apparent that it was going to be an El Niño year, and they were interested in using the data from the temperature sensor on the wave buoy (see footnote 1) to inform their field efforts to monitor coral bleaching. Moreover, they asked for a customized presentation of the data to meet their unique technological challenges and acute need. The established trust of the local liaison and by extension, the program, facilitated this request reaching PacIOOS in a timely manner. The resource managers work with the liaison frequently and were already familiar with the data management capabilities of the PacIOOS team. Therefore, they were confident that their request would be heard and addressed. Understanding the situation and need on the ground, the liaison advocated on behalf of the stakeholders. This example highlights how trust built overtime between an organization (i.e., PacIOOS) and the stakeholder community can lead to the users approaching the organization with their specific need.
Follow Cultural Protocol
One potential exception to employing informal means of building relationships before formal mechanisms is when engaging with indigenous communities. Such stakeholders often have formal structures and protocols in place to build relationships, garner input, and request permission and participation. This may entail local or regional indigenous governance bodies, councils of chiefs, village mayors, etc.
Sometimes informal cold calls can create frustration among groups that have this type of social infrastructure in place, which can inhibit trust-building and potentially derail a well-intended process. It is essential to follow the cultural protocols of a particular place. If the partners of a program do not know the protocols to follow, advice and counsel should be sought early in the process. Overall, sincere respect and a principle of reciprocity (i.e., equal exchange for mutual benefit) and feedback can go a long way toward building mutually beneficial partnerships (Smith, 2004) to ensure that the process and resulting data product truly meets the needs of stakeholders.
Attend Stakeholder and Partner Meetings
In other situations, it is possible to benefit from proximity and the efforts of other organizations or programs to gather their members at regularly scheduled meetings. A stakeholder need can surface through discussions, forums, and similar venues—either at one meeting or during successive meetings of a stakeholder group. Indeed, when participating in such meetings, members of an ocean observing system can both learn about the issues, questions, and needs that are being asked by that particular group and provide updates and inform the group of their capabilities.
Many ocean observing programs refer to this as “having a seat at the table” to learn about needs and opportunities. For example, staff members from the Northeastern Regional Association of Coastal Ocean Observing Systems (NERACOOS) regularly attend the state fisheries forums such as the Maine Fishermen’s Forum and the Massachusetts Lobstermen’s Annual Weekend and Tradeshow for these purposes. It was at such meetings that a common question kept surfacing among the fishermen and fisheries resource managers: “How do water temperature conditions in the Gulf of Maine this year compare with last year, previous years, or average conditions?” The overarching goal was for the fishermen and resource managers to better understand why their catch may have been different during the same months over the years. NERACOOS personnel realized they could help answer this question with data from their ocean sensors deployed on buoys offshore of New England. NERACOOS worked with the end users to develop requirements for the climatological data visualization tool that was launched in 20112.
The resulting tool (Figure 2) delivers information about the average meteorological and ocean conditions between 2001, and the most recent completed calendar year (currently 2018). The display also includes daily oceanographic and meteorological observations from each year so that users can compare them to the average conditions from the past 17 years. Fishermen, fisheries managers, fisheries scientists, and others have used this climate tool for over 7 years (Carla Guenther, personnel communication, November 13, 2017; Kathleen Reardon, personnel communication, July 17, 2018). These stakeholders regularly use the tool to monitor and investigate how present day ocean conditions compare to historical and average conditions. In addition, this early success by NERACOOS inspired several other regional associations of U.S. IOOS to work with their interested stakeholders to develop similar climatology tools.
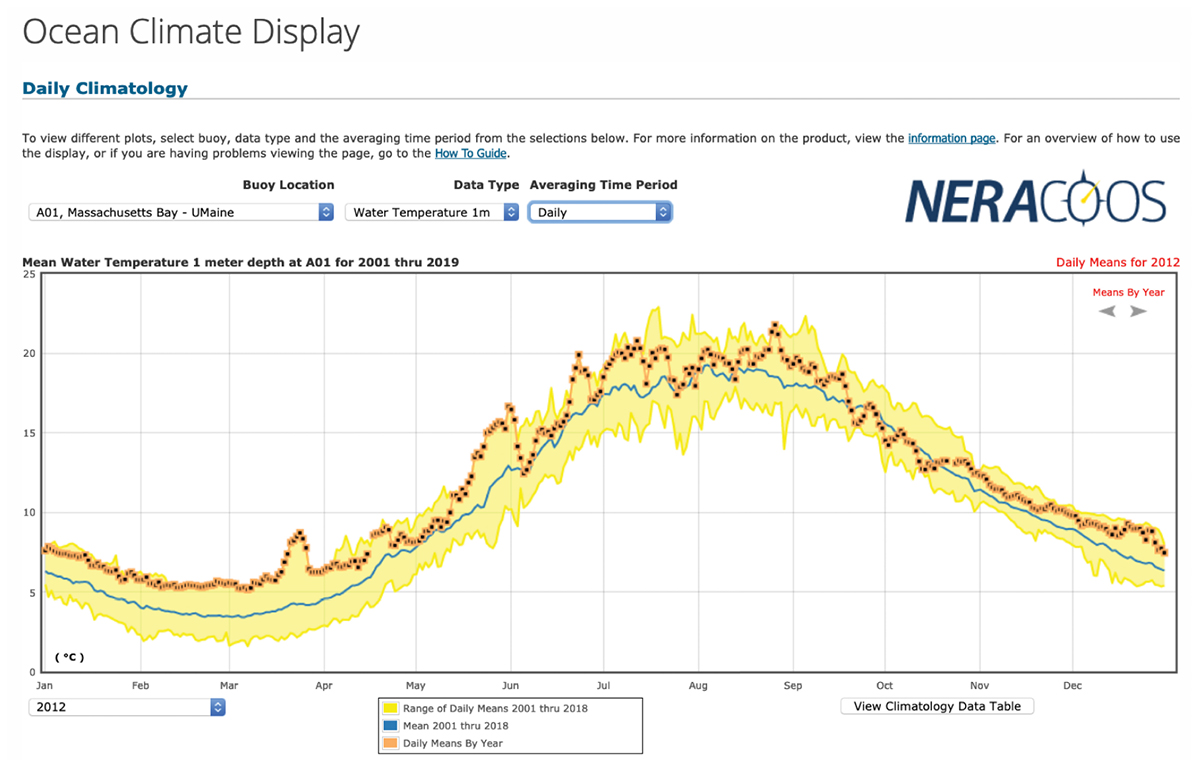
Figure 2. The NERACOOS Ocean Climate Tool displays the daily average (blue line) and range (yellow area) of surface water temperatures at a buoy in the Gulf of Maine from 2001 to 2017. The 2012 daily mean water temperatures (black squares) demonstrate the “ocean heatwave” of 2012 when daily average surface water temperatures in the Gulf of Maine were consistently near or above the maximums measured in the previous decade. Image courtesy of NERACOOS.
Host Workshops
Hosting successful workshops is another mechanism to elicit stakeholder needs, and one that requires a considerable amount of staff, stakeholder, and fiscal resources to plan, execute, and participate in the workshop. Logistics planning, reaching out to stakeholders, process planning, travel and workshop costs, and more must all be addressed in order to ensure that the workshop objectives are met. In addition, the workshop outcomes, such as workshop reports or next steps must be managed. But, there is also much to be gained in a workshop setting. Workshops provide a venue to learn about the opportunities or challenges of a specific topic, to be inclusive of particular communities or locales, to ensure that many voices are heard, to have the participants (as well as the sponsors) intermingle and learn more about each other, and to encourage synergistic ideas to surface.
In 2015, the Alaska Ocean Observing System (AOOS) hosted a coastal hazards workshop to identify priority data needs in response to increased coastal flooding, storm surge, and erosion across the region. This workshop provided a venue to bring together stakeholders from across Alaska to discuss priority regions needing water level information and potential alternatives to the National Oceanic and Atmospheric Administration (NOAA) Center for Operational Oceanographic Products’ National Water Level Observing Network (NWLON) installations to deliver that information. In this way, local tribes and community members from remote Alaska, and especially in western and northern Alaska, were able to share their needs and learn about opportunities to work with AOOS and other partners to help fill their data gaps. NWLON technologies primarily consist of in-water sensors in stilling wells or down-looking microwave systems, and station siting is heavily reliant on ice-free conditions and local infrastructure, making annual operations and maintenance of a more widespread series of NWLONs cost prohibitive for most of the low infrastructure coastline in Alaska. Currently, the entire west and north coasts of Alaska have only five NWLON tide gauges. Though NWLON installations are always desirable for all water level data applications, a tiered water level data policy within NOAA allows for observations with lesser accuracies (Edwing, 2015). The policy stipulates water level data quality tiers A (e.g., NWLON, <10 cm), B (<30 cm), and C (>30 cm), matching data accuracy to specific applications. Tier B data can be used for hydrographic survey, shoreline mapping, marsh restoration, storm surge, exceedance, and inundation applications. Tier C data satisfy research and tsunami applications. To illustrate, tidal harmonic predictions and datums are easily derived from Tier B data; however, these outputs can only be used for Tier B applications and are not used in official NOAA National Ocean Service products. To this end, Tier B (and C) data satisfy a level of data accuracy that is necessary for many of the Alaska stakeholders’ immediate safety and planning needs.
Since the workshop, AOOS and various partners across the region have implemented several resulting recommendations, including experimenting with and installing alternative water level technologies discussed in the report3. AOOS hosted a follow-up workshop in 2018 to bring together key water level technology experts, project leads, data end users, and other stakeholders to discuss progress made since 2016 and to develop a Water Level Build-out Plan for Alaska4. The plan (in review) will highlight priority water level observing gaps, as well as recommend which water level observing technologies are best suited for the specific water level application needs at each site within the scope of the tiered water level data policy. Another major outcome of this workshop was the establishment of the Alaska Water Level Watch (AWLW) working group. The group represents a full-range of stakeholder sectors, including federal, state, local municipality, communities, tribes, university, and industry members that are interested in improving the quality, coverage, and accessibility to water level observations in Alaska’s coastal zone. This group meets annually, and is connected by the AWLW website hosted by AOOS5, which also serves as a means for AOOS to receive outside input from all partners and users in need of water level information. The website will serve as a gateway to the AWLW Data Portal currently under development. The AWLW has a FaceBook page, and hosts individual community groups within the AWLW umbrella6. This allows communities to communicate internally on water level issues directly affecting them.
Participate on Task Teams
Another formal mechanism useful for certain situations or types of stakeholders is to participate on existing task teams or to build a new task team. This allows for the coordination among specific subsets of stakeholders to determine requirements and optimal options for addressing those requirements. Thanks to their manageable size, these teams can help streamline complicated processes and avoid frustration. The next two examples illustrate the various benefits of having formalized task teams in place.
Operators of ocean observing systems are comprised of experts in many related fields (e.g., physical oceanography, ocean chemistry, marine biology, etc.). As a result, they are often consulted as experts for specific questions or projects to address complex issues, such as the management of the Areas of Special Biological Significance (ASBS) designated by the California State Water Resources Control Board. As known experts in the field, and in the particular geography of interest, the Southern California Coastal and Ocean Observing System (SCCOOS) was asked to join a task team of partners to develop an online data explorer to manage urban runoff and protect the health of the two adjacent designated ASBS in La Jolla by ensuring compliance with the California Ocean Plan. Critical assessment questions that the partner coastal zone managers face include: (1) how to link trends and changes in the monitoring data to the management decisions made within the ASBS; and (2) whether the observed changes are a result of climate/natural variability, or if external, anthropogenic influences are impacting the ASBS. By joining this task team, SCCOOS was able to gain a comprehensive understanding of the partners’ needs as well as contribute physical oceanography expertise and answer data management questions related to the online data explorer7 as the project progressed.
In the Texas coastal zone, everything from surfing to oil and gas development occurs. The Texas General Land Office is charged with reducing conflicts among users and the natural environment while generating revenue and promoting economic development through the leasing of state submerged lands. Those seeking to lease submerged lands for activities, such as installing oil and gas infrastructure or dredging a private boat channel, needed a way to know what environmental sensitivities and restrictions may exist. In 2001, state and federal resource agencies developed a task team to address this need—resulting in what would be called the Resource Management Code (RMC) system. The RMC system assigns all state submerged lands tracts two-letter codes that alert potential users to possible restrictions of certain activities (e.g., dredging), the presence of sensitive environments and species, or conflicting activities in a specific tract. After the initial implementation of the system, this coordinated effort continues to bring together state and federal managers and experts who oversee different issues of the coast (from archeological resources to endangered species). The team framework facilitates collaboration between agencies with coastal management responsibilities and helps to identify common information needs. While users greatly benefit from the readily available information in the RMC, the task team and the associated RMC system help to protect natural resources and make the permitting process more efficient and transparent.
Include Engagement in Program Budget and Work Plan
Whether hosting a workshop or traveling to remote locations for face-to-face meetings to build relationships, tailoring engagement requires considerable resources, both financially and in terms of personnel time. Even those mechanisms that might be financially cheaper (e.g., attending partner and stakeholder meetings or coordinating task teams) still require staff resources to be successful. Therefore, no matter how an observing system tailors their stakeholder engagement, it is crucial to budget for the resources necessary. Simply, stakeholder engagement must be written into the program budget and annual work plans. The size of the budget and staff time necessary may vary greatly depending on the observing system (e.g., the geography of the region), the stakeholders (e.g., how they prefer to be engaged), the data (e.g., how often a new data layer is available or needs to be manually created), and the tool (e.g., maintenance, iteration).
Overall, once strong communication bonds and trust are established, both parties are invested in the process and the outcome. This makes it more likely that they will see a project through to the end (and beyond). The following sections continue with some of the examples introduced above to illustrate the next steps in the stakeholder-driven approach to data product development. Additional examples are also brought into the discussion to highlight specific aspects of the subsequent steps.
Step 2: Design and Refine Data Products With Stakeholders for Specific End User Requirements and Styles of Interaction and Delivery
Successful data products are based on a comprehensive understanding of user needs. Sometimes a sophisticated data portal that allows for complex data integration across disciplines (e.g., oceanography, biology) is required, while at other times, stakeholders prefer a simple email alert system. Communication with stakeholders prior to and during the development of products helps project team members identify all of the relevant stakeholder communities, determine product requirements, and design products based on identified requirements and user limitations.
Utilize Informal Product Development When Appropriate
When the user community is small and has very specialized needs, iterative product development can happen informally. For example, the Gulf of Mexico Coastal Ocean Observing System (GCOOS) developed the tool Gulf Autonomous underwater vehicle Network and Data Archiving Long-term storage Facility (GANDALF), the Gulf autonomous underwater vehicle (AUV) Network and Data Archiving Long-term storage Facility8, specifically for their AUV (Figure 3) operators. The tool (Figure 4) assists AUV pilots operating in the Gulf of Mexico by providing real-time vehicle positioning information via a map-based interface. Users have access to a dashboard display, plots of flight and science sensors, Google Earth KMZ file generation, and processed data files. GANDALF is equipped with numerous data layers that can be individually displayed on the base map. The layers were added per individual requests from different glider pilots. Each layer’s transparency can be individually adjusted allowing for ‘mash-ups’ of layers. Provided layers include NWS NEXRAD (radar), GOES visible and GOES infrared satellite images, sea surface temperature (SST) and chlorophyll images from the University of South Florida, sea surface heights from the Colorado Center for Astrodynamics Research, and NOAA raster navigational charts. In addition to the observational layers, several model outputs are available on GANDALF, such as the Office of Naval Research’s ensemble of sea surface velocity, SST, and sea surface elevation. Operators of AUVs find these parameters helpful in navigational planning, as surface wave action, subsurface currents and temperature changes heavily influence the flight path.
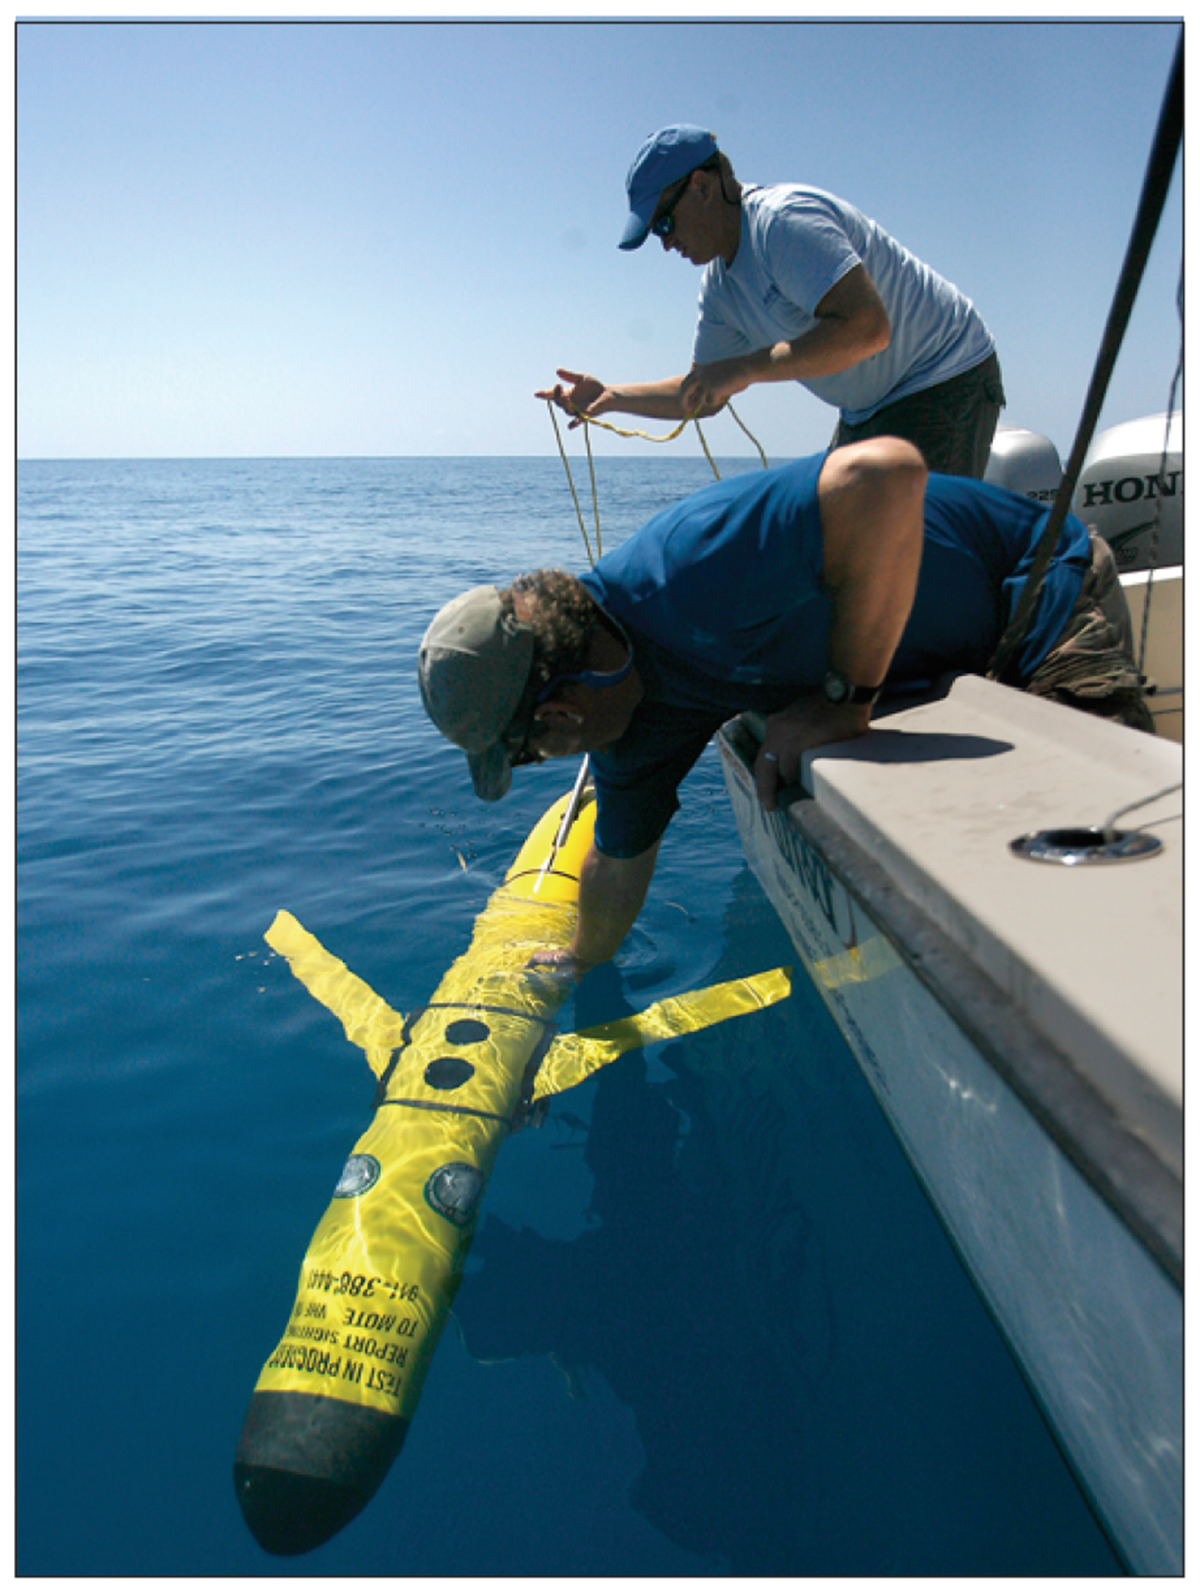
Figure 3. Mote Marine Laboratory scientists deploy a Slocum glider, an autonomous underwater vehicle (AUV), for harmful algal bloom research on the West Florida Shelf. Photo courtesy of Mote Marine Lab.
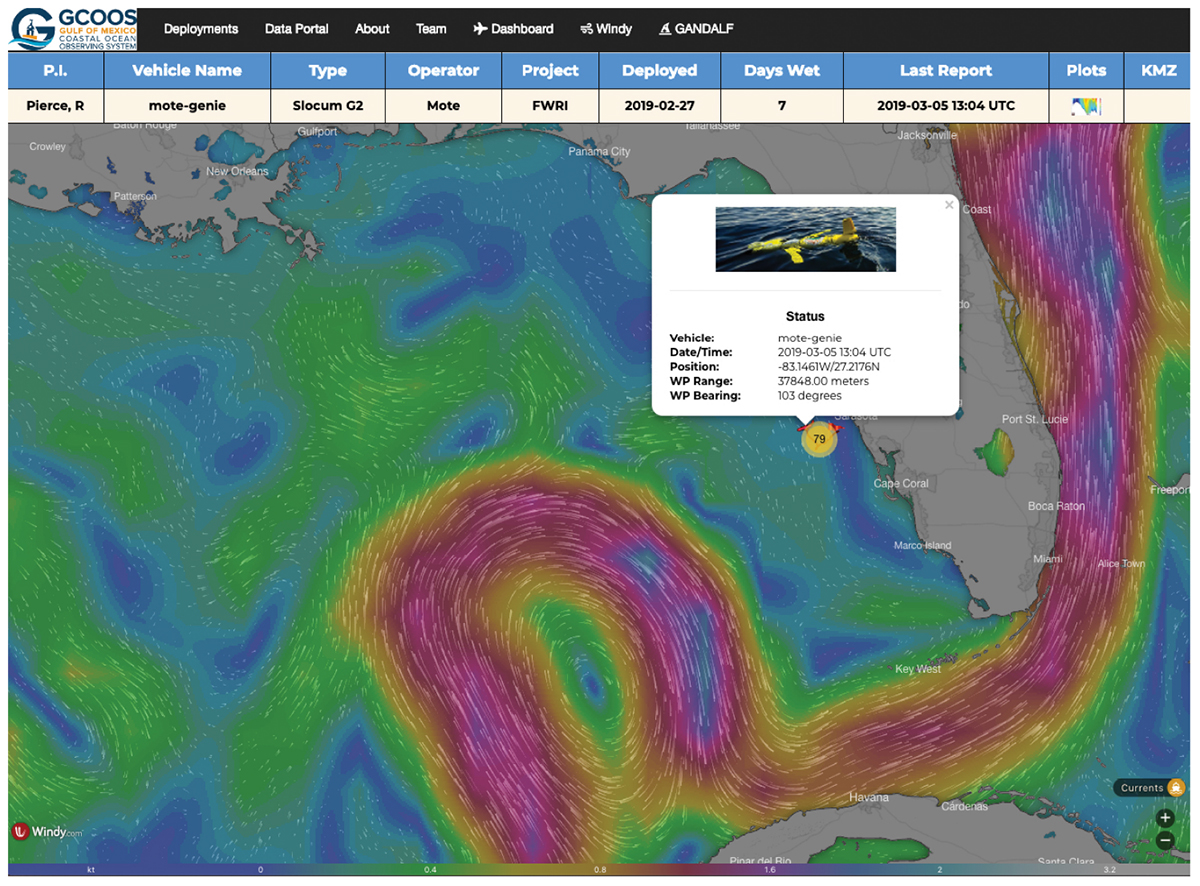
Figure 4. GANDALF AUV piloting portal showing deployed vehicles and waypoints. Vehicles that have recently reported their positions are shown as green, vehicles that have not reported in 48 h are shown in red. Lack of communication can be caused by many factors but is typically a sign of rough seas and bad weather conditions. Image courtesy of GCOOS.
During a glider deployment, NetCDF9 files are created from uploaded glider data files and uploaded to a federal data repository, specifically the NOAA IOOS Glider Data Assembly Center, where others can access the data. GANDALF also provides post-processing of mission data for AUV operators. Binary data files and text log files are downloaded from operators’ servers, and publication quality plots are generated. Mission files are permanently archived on the GANDALF server. GANDALF provides valuable services for AUV operators and is particularly useful to operators who have little or no IT support.
The resulting data platform is a collaborative product that is enhanced on an as-needed basis, as glider operators identify a new layer or functionality that they would like included. GANDALF services are provided at no cost to users: all that is needed is access to glider data files. This product has been so well received from the glider operators that GCOOS has extended the use of the tool to the Southeast Coastal Ocean Observing Regional Association (SECOORA). As further testament to its success, Jordon Beckler from Florida Atlantic University/Harbor Branch Oceanographic Institute states:
GANDALF has absolutely revolutionized our glider deployments, from preparation, to piloting, to recovery…Beyond just the drastically increased efficiency, however, GANDALF also provided ancillary data useful for decision making during piloting. We were attempting to locate harmful algal blooms based on elevated chlorophyll signatures, and the contour plots really allowed us to discern subtle patterns, while the chlorophyll surface maps allowed us to compare what was happening at depth to the surface. The detailed NOAA bathymetry charts are critical when flying gliders in shallow water regions when chasing a harmful algae bloom toward shore and wondering if your glider is going to crash into the seafloor. Finally, the…seawater velocity overlays are really useful in understanding glider drift from in a synoptic sense, which is both useful for pinpointing algae bloom dynamics, but also in careful flying to ensure you will not drift into shipping lanes – which I may add, are also [available] on GANDALF!
Employ a Formal Product Development Process When Appropriate
In other cases, such as the NERACOOS climatology tool mentioned in Step 1 (see Section “Attend Stakeholder and Partner Meetings”), it is advantageous to set up a formal product development process. Since a wide range of users needed the product, NERACOOS’ product team developed and implemented an end-to-end product development process. The first phase of the process included a review of current relevant climatological products. The team then conducted a survey among potential end users to better understand their information needs and how they preferred to view and access that information. A subset of the potential end users were interviewed to help refine the product requirements. Using information from the review, survey, and interviews, a suite of functional and technical requirements were developed. The product developers and designers created a draft product that was tested by potential users. Feedback from the testing informed updates to the product. The product team also worked with an expert group to develop and test the process for climatology calculations. After a series of testing and refinement cycles, the product was officially launched on the NERACOOS website. The launch included a marketing campaign aimed at key stakeholders including commercial fishermen, fisheries managers, and fisheries scientists. The campaign included social media posts, a website story, an e-newsletter story, announcements in stakeholder newsletters, and a series of demonstrations at various stakeholder meetings.
As another example, the Texas RMC system described in Step 1 had become important information for the Texas state submerged lands oil and gas lease sale process by 2013, but it needed to be updated to keep it current and to provide consistent coverage. Prior to 2013, state and federal agencies would separately mark codes on maps for each track they knew had potential environmental restrictions, then the Texas General Land Office would compile the information and make it available to the public through a static map on a website (that is no longer available). Furthermore, issues of concern had changed since 2001, and a thorough revisiting of the definitions of the codes was needed. To accomplish this, a Data Standards Committee (DSC) comprised of about 45 state and federal coastal managers and information science experts from 12 different agencies was formed. Over a year’s time, the DSC developed a data-driven process for updating the RMC.
The Texas General Land Office and the Harte Research Institute at Texas A&M University – Corpus Christi conducted 12 workshops during 2014 to formally elicit expert opinion and knowledge from the DSC. The RMC update process had three major steps: (1) updates to the RMC code definitions; (2) identification, compilation, and when needed, development of data layers to determine the codes; and (3) development of an online tool for viewing the RMC. The intensive meetings were 2- to 4-h long and required active participation by the experts representing their agencies and contributing their personal knowledge. Because the work proceeded sequentially and consistent input was needed, it was also important that the same experts attended most or all of the 12 meetings. This required a commitment from the agencies and dedication of individuals and only succeeded because of the common purpose of improving the efficiency and effectiveness of environmental management where economic development is occurring. Laying out the work plan in advance so that participants could see the level of effort that would be required and plan accordingly was also important to achieving success. The result was the compilation of a geodatabase in a web viewer10 with over 30 geospatial layers identified by the DSC for assigning RMCs to more than 6,400 lease tracts in Texas coastal waters (Figure 5). The layers include data on sensitive areas, such as seagrass, flats, and marshes, bathymetry, protected areas, dredged channels, and endangered species distributions to name a few. An online map viewer allows the public to select a lease tract and get a listing of the RMCs as well as links to the definitions of the codes and how they are derived from the geospatial layers.
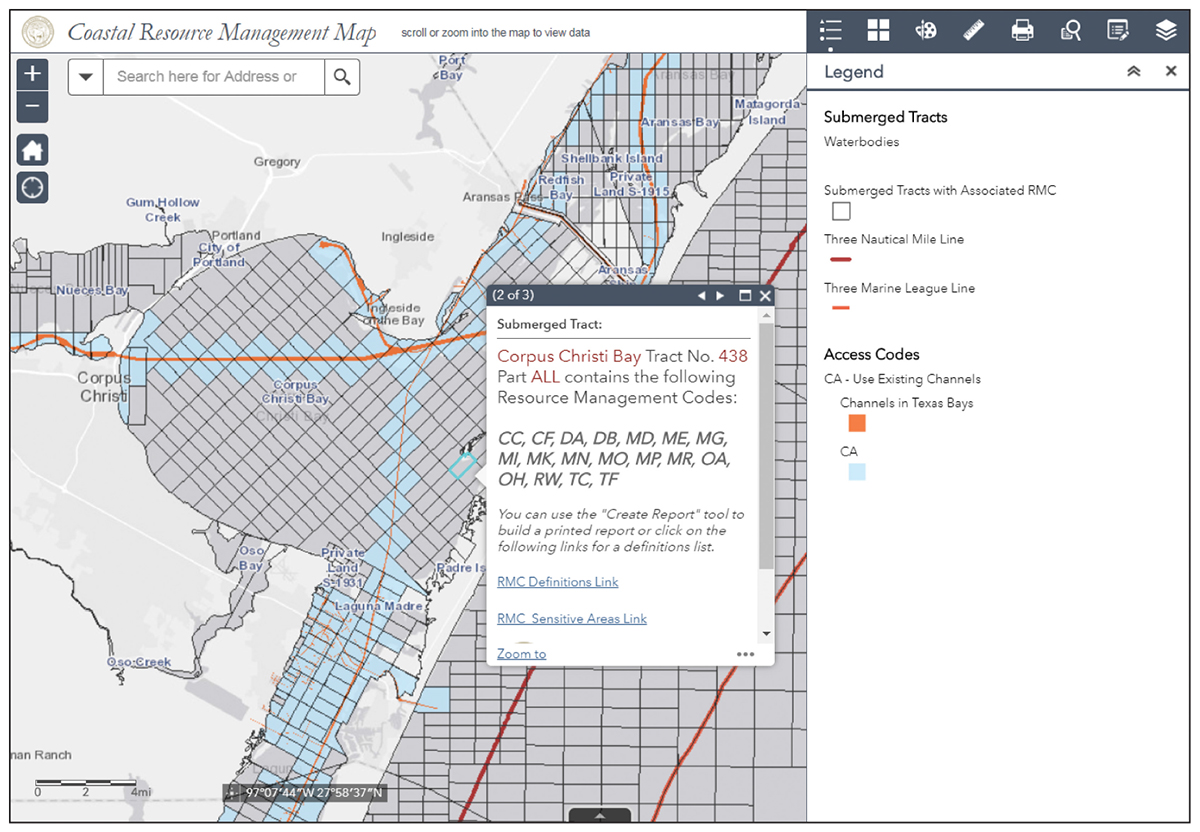
Figure 5. Resource Management Code (RMC) web viewer featuring lease sale nominations and RMC pertaining to type of access limitations. Image courtesy of Texas General Land Office.
Account for Technological Realities of the End Users
There can be a tendency in data product development to include the latest and greatest functionality or tool because it is flashy, and it seems like many potential users and developers are talking about it. However, if the technological capacity and challenges of the users are not considered, the resulting tool could easily end up being essentially worthless to the target end user. How the stakeholder will access the information must be taken into account. Sometimes the simplest solution is the best for a particular user or stakeholder group, with complexity added as needed or requested by users.
The VMGD issues a bulletin called the Vanuatu Ocean’s Outlook Bulletin (Figure 6) that is tailored to help stakeholders within specific sectors, such as fisheries and sea/lagoon farming, to inform planning and security. As not everyone has access to email or the Internet in Vanuatu, sometimes the information included in these bulletins is relayed by telephone. Community outreach personnel, in turn, then spread the information through community meetings and church gatherings. In addition, Vanuatu is a bilingual country, with about 138 different native dialects and three official languages—English, French, and Bishlama. This presents a challenge to accurately communicate climate science messages. It is not easy to simultaneously craft a message that the citizens can understand and that remains true to the scientific facts in such a way that the key messages are not lost or toned down in the process. It is a team effort to go through the products and to make sure that the translations to the three languages keep their meaning and remain consistent throughout. Vanuatu Language Services assists with translating to all three languages. In addition, a vocabulary page explains more scientific and technical terms. The team also receives feedback on Bishlama translations from stakeholders proofreading the climate products before publishing, as it is absolutely vital that their needs are accounted for in the product(s).
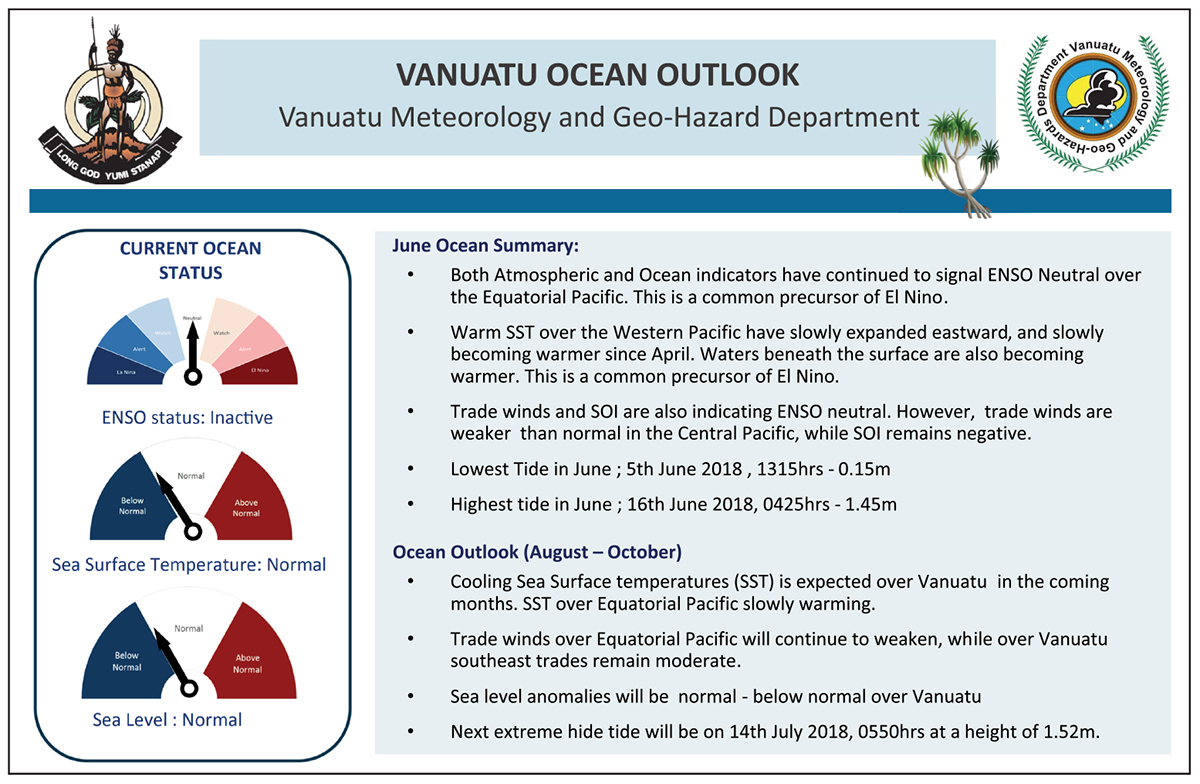
Figure 6. Excerpt from the English language version of the Vanuatu Ocean Outlook Bulletin. Developed by the Vanuatu Meteorology and Geo-Hazards Department, this document provides the community with information helpful for planning efforts in various sectors, such as fisheries. Image courtesy of Vanuatu Meteorology and Geo-Hazards Department.
Even for those connected to the Internet, the speed of connection and the actual infrastructure are important considerations. This was the case for the resource managers in American Samoa mentioned in Step 1 (see Section “Build Relationships”) that were interested in the temperature data from a new PacIOOS wave buoy to help them track and monitor potential coral bleaching events. American Samoa has limited bandwidth, making it hard for residents to check some websites, let alone use a bandwidth-hungry data portal or animated tool. In this case, working with the end users was essential to ensure that they were able to access the resulting product. The local liaison helped PacIOOS determine that the best way to accommodate for low-bandwidth was an automated daily email to a listserv. The PacIOOS data management team wrote a script to feed wave buoy data into a simple daily email that is sent out at the same time every day, near midnight. The liaison checked back with the managers and scientists to verify what to include in the email, and she asked who would like to be added to the listserv. The users noted that even a small thumbnail in the email message would often slow things down or not display correctly, so the content determined to be the easiest to receive and use was text lines of the data collected, with each row of text indicating a separate temperature reading.
These examples highlight the need to take technology needs and limitations into account when developing a new tool and how tailoring products to user needs and requirements does not necessarily mean being overly complex. Sometimes a simple solution is the most impactful. In addition, serving stakeholder needs does not always have to be a long, time-consuming process, especially when the relationships are already well-established. Indeed, the amount of time from the first request from stakeholders in American Samoa to the first daily email to the listserv was under 1 month.
Answer the Right Questions
Working directly with the end users helps to ensure that the right questions are being answered, and that the information provided, as well as the manner in which it is provided, will add value and truly inform user decision-making.
This is illustrated in the La Jolla Cove ASBS Explorer developed by the SCCOOS (Figure 7). As described in Step 1 (see Section “Participate on Task Teams”), SCCOOS developers worked hand-in-hand with the core partners comprising the La Jolla Shores Coastal Watershed Management Group, which includes the City of San Diego, the University of California San Diego Scripps Institution of Oceanography, the Department of Environmental Health and Safety, San Diego Coastkeeper, and the California State Water Resources Control Boards. Each designated ASBS along the California coast exists in a complex coastal regime subject to ever-changing land-sea-atmospheric interactions. When the partners approached SCCOOS to develop a tool, it was important to learn what questions needed to be answered in order to determine what data was needed. It became clear that they needed to understand the physical environment within and surrounding the La Jolla ASBS to address management questions such as whether changes observed were due to natural variability or anthropogenic impacts.
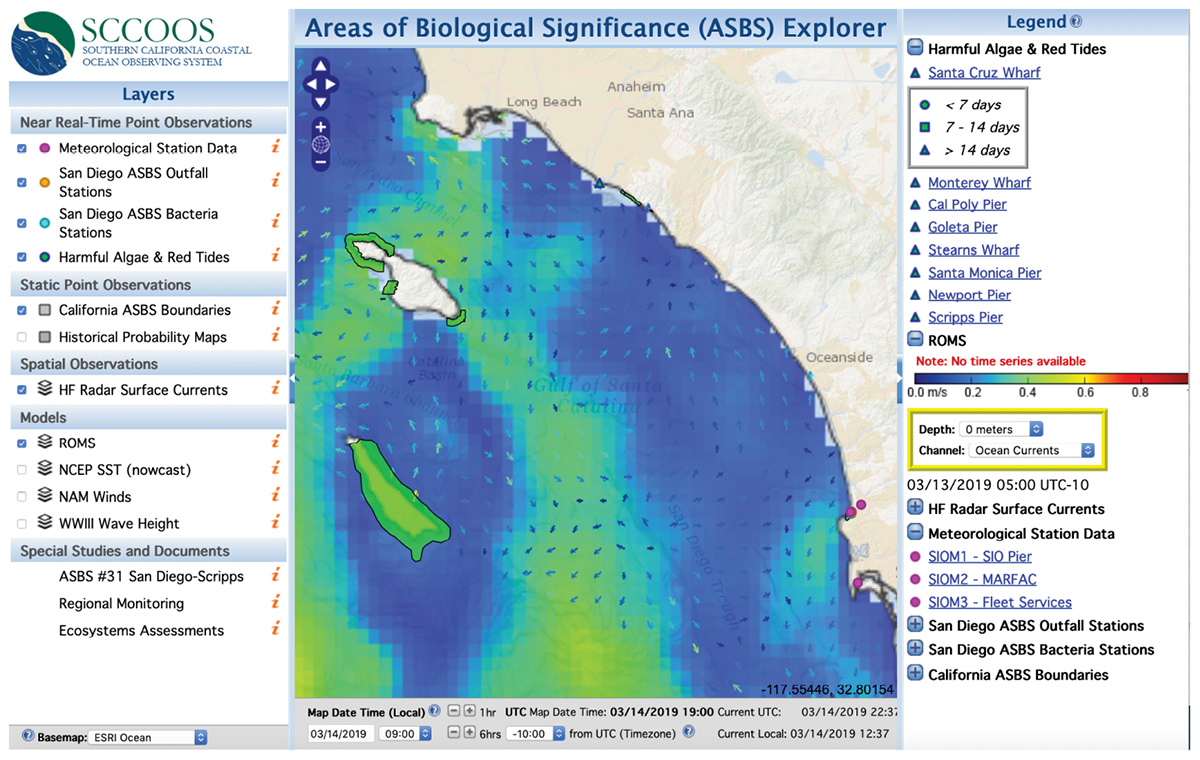
Figure 7. SCCOOS Areas of Biological Significance (ASBS) Explorer tool provides users with a comprehensive interactive map showing critical coastal areas in California along with ocean observations. Image capture from March 14, 2019, is layered with the Regional Ocean Model System that shows ocean currents at 20 m depth, High Frequency Radar surface currents, harmful algae and red tides from harmful algal bloom monitoring stations, and the California ASBS boundaries. Meteorological station (pink circle), piers (blue triangles), and outfall stations can also be accessed through the tool. The ASBS Explorer is intended to help managers and the public monitor impacts on ASBS locations in California, specifically the San Diego metropolitan region. Image courtesy of SCCOOS.
The SCCOOS team worked with the core end users to design a modular, problem-driven application that builds upon different standards and protocols. Emulating existing ocean observing system web portals for ease of navigation and familiarity, the design team used open source formats and protocols to enable access to varying structures and distributed data sources. Since some of the data shown on the website are derived from sources other than SCCOOS, the goal was to access services or data directly instead of hosting copies. This format allowed for varying data types enabling a customized portal. The ASBS Explorer was designed to establish the infrastructure needs and generate a conceptual design that is required for long-term assessment of ASBS performance and related management decisions. The end product is an award-winning, usable, online information system for a range of users. In 2014, the California Assembly Speaker Toni Atkins, the County of San Diego, and San Diego Coastkeeper honored SCCOOS with World Oceans Day and Coastal Champion Awards for their commitment to ensuring the partners have a “top-notch technology” for the ASBS. Designated by the State of California Water Board, ASBS are areas that host aquatic communities that require protection from alteration of the natural water quality. In order to protect these biological communities, sampling of water quality measurements have been regulated to determine alterations in the environment. One of the primary questions for an ASBS is what waters, and from where, may be impacting the ASBS causing any fluctuations in the water quality. The ASBS Explorer enables stakeholders to answer these questions for proper management of these special areas.
Consider the Timing of Product Delivery
Knowing your stakeholders and their specific delivery needs, including the timing of delivery, can help ensure product utility. For example, SECOORA’s How’s the Beach tool (Figure 8) delivers a beach water quality forecast in time to inform daily public health advisories. The South Carolina Department of Health and Environmental Control monitors bacteria levels in nearshore swimming beach waters with water samples analyzed by an approved laboratory. On average, 24 h pass from sample collection to the time the results are received by the responsible agency. The agency issues public health advisories if bacterial levels exceed legal limits (defined by the U.S. Environmental Protection Agency, EPA). However, due to the testing time lag, advisories are issued well after the problem occurred (i.e., beach swimming advisories for a given day were based on the previous day’s water quality tests).
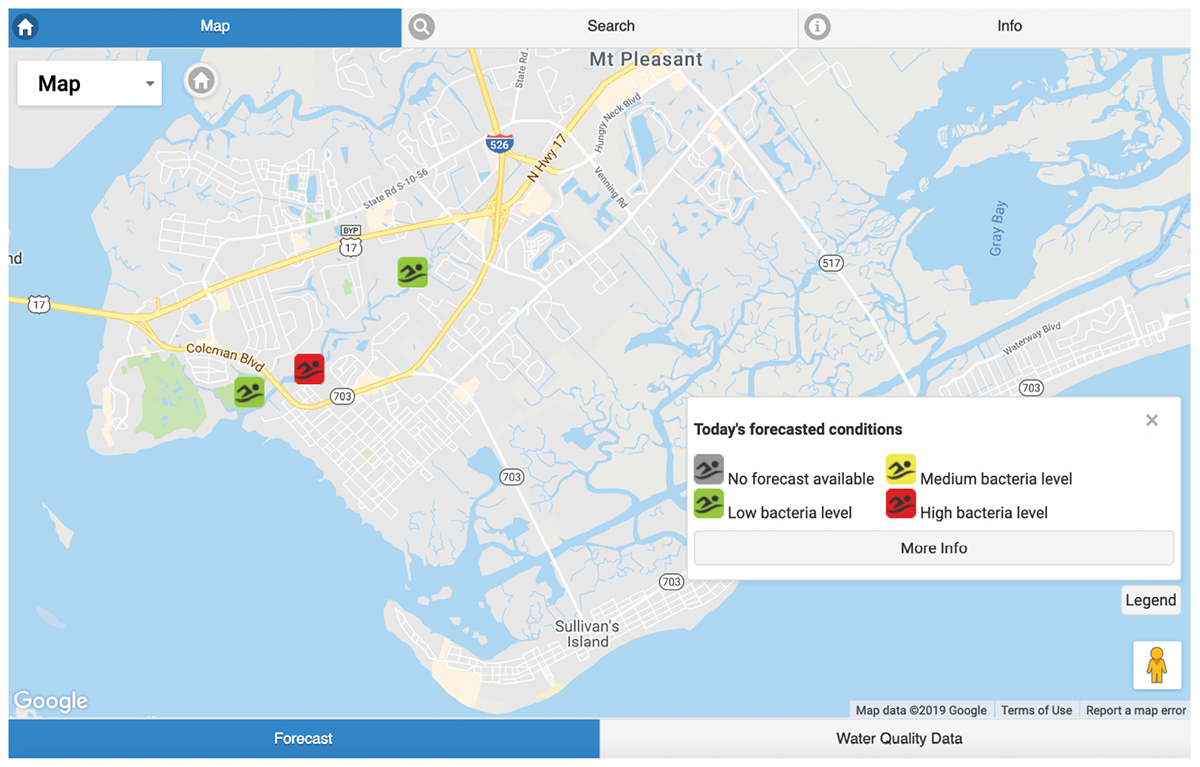
Figure 8. Example display of How’s the Beach daily forecast of Enterococci bacteria levels for Shem Creek, SC. From here, users can view forecasts and access current and historical sampling data and high-resolution aerial imagery of specific sampling locations. Image courtesy of SECOORA.
South Carolina beach managers realized the need for a preemptive forecasting tool to issue public health advisories. Managers also felt that the general public should be informed to make decisions about going to the beach versus other activities (e.g., swimming pool, miniature golf, other entertainment options). In an effort to better inform local beach managers and public health officials, tourism officials, and the public about potential health risks, researchers and developers at the University of South Carolina and University of Maryland created the How’s the Beach forecasting tool11. This tool incorporates land use practices, meteorological and oceanographic data, along with National Weather Service (NWS) products to forecast bacterial concentrations at area swimming beaches. Due to the support and enthusiasm from federal, state and local agencies for the response to the timely information, the forecasting efforts have expanded beyond the original scope to become a SECOORA product development initiative. Advisory agencies in North Carolina and Florida requested that the modeling effort and associated tools be developed for target areas in their states so that timely notices can also be provided.
Tailor Delivery for Different Audiences
Often, in order to make the ocean observing or forecast data relevant and useful for different types of stakeholders, the same information just needs to be presented in slightly different ways. With three levels of products, the How’s the Beach tool is tailored to inform state agencies, the general public, and shellfish managers. The first product is for state agencies responsible for issuing beach advisories. Forecasts are run daily, coordinated with availability of NOAA NWS NEXRAD precipitation data. A report is emailed to beach managers at 9:03 AM daily.
The second product is for the general public (see footnote 11). This product is delivered via web interface or a phone app, and it was developed at the behest of the beach managers who wanted an easy way for the public to view the alerts. While the primary stakeholder is state agencies responsible for environmental quality monitoring, the project team hosted a public stakeholder workshop in Sarasota, FL to solicit feedback so they could tailor the app to meet broader needs.
The third product consists of scripts written to support shellfish managers who close harvest areas in South Carolina based on threshold rainfall values. For example, some managed areas are closed to shellfish harvest when more than 4 inches of rain falls within a 24-h period. State-level shellfish managers contacted the project team to request a data analysis report for the NEXRAD precipitation data. Shellfish managers provided geographical areas of interest, depicted as polygons, where they need rainfall amounts and the associated thresholds. These polygons are used to clip out relevant NEXRAD data and summarize rainfall for areas within the polygon. A summary report of the previous 24 h of precipitation for each shellfish harvesting area is provided to shellfish managers each morning.
Rely on Existing Relationships to Guide the Process
In the Pacific Northwest U.S., the Northwest Association of Networked Ocean Observing Systems (NANOOS) was approached by the Padilla Bay National Estuarine Research Reserve to collaborate on an application (app) that would serve water quality data of interest to shellfish growers. In 2004, the resulting site was based on input from the growers about how to best present the data, such as temperature in degrees Fahrenheit and different temporal views (e.g., 24 h, 3 days, 14 days) to visualize features or trends. Subsequently, to address industry requests, these features were incorporated into NANOOS’ own data portal, the NANOOS Visualization System12, as options.
As NANOOS transitioned the Shellfish Growers’ App (Figure 9) to their Visualization System, a meeting was held with a small focus group of growers (∼6–8) hosted at one of the growers facility, where the NANOOS software engineer, outreach staff, and director met with the growers to try out options, and hear what features and information the growers wanted. This resulted in NANOOS staff learning new things that they did not anticipate. For instance, regional airport rainfall data is important because closures are called when non-point storm water runoff potentially carries bacteria to shorelines. Also, technology had advanced such that mobile phone apps were now common and offered a better way of data delivery, due to the ability to check data while in the field. The focus group was consulted, and then presentations and one-on-one demos and feedback at grower conferences allowed for more feedback. Being flexible, willing to change original designs, and listening has resulted in a new and improved app. Pacific Coast Shellfish Growers Association Executive Director Margaret P. Barrette explains, “This current generation of shellfish farmer is reliant upon data and services from NANOOS. Checking the NANOOS app before seeding a beach or filling a settling tank has become standard practice.”
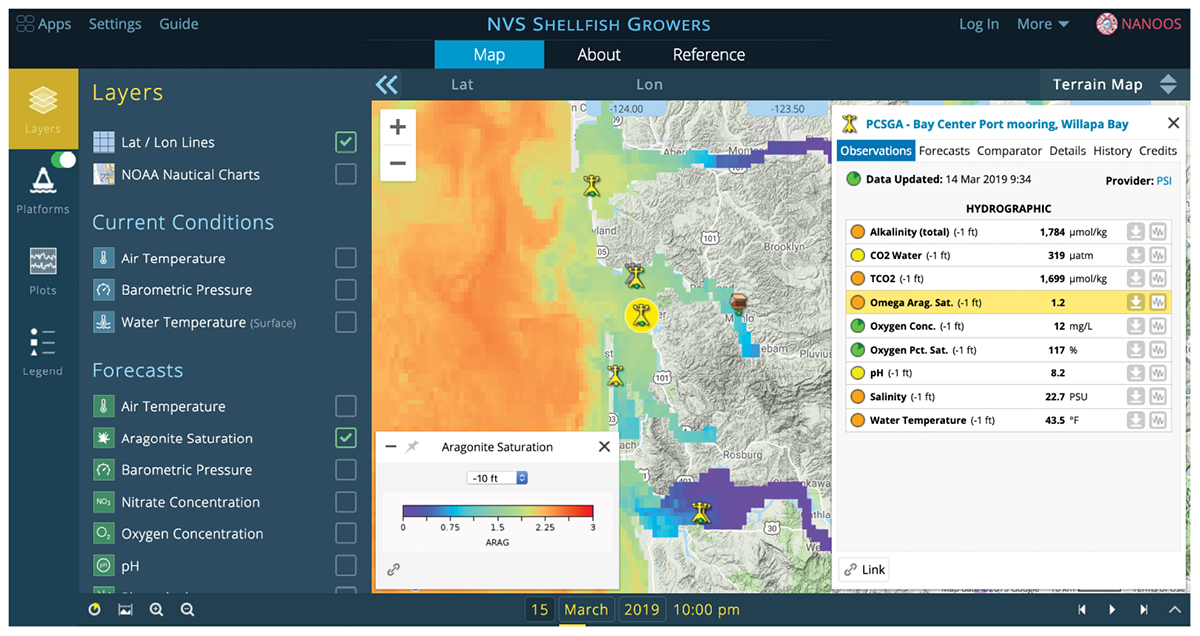
Figure 9. Screenshot of the NANOOS Visualization System “Shellfish Growers” web app. From this page, users can view both forecast model output and near real-time observations. Also added was the ability to view different timescales of the measurements (e.g., oxygen, pH, and salinity) to see how these may co-vary with time. The user selects the units, timescale, and other variables. Other user-selected tabs provide additional details, history, credits, and links to the data provider. Image courtesy of NANOOS; background color image is from a LiveOcean forecast of aragonite saturation state.
The relationship of trust (Step 1) was critical in the development of the NANOOS app—to know each others’ needs and capabilities, and to have the long view on how to keep needs met. With the advent of ocean acidification awareness and impacts to shellfish growing, now both real-time data from buoys and moorings from a host of partners and 3D modeling forecasts from a new LiveOcean model13 were incorporated. With this added forecast feature to the desktop version of the Shellfish Growers app14, also came additional complexity. Growers requested guidance on features they may not have discovered on their own. This resulted in a slideshow guide that pops up on first use of the app and then can be consulted thereafter or turned off.
Clearly, while the mechanisms described above for Step 2 translate across various situations, a program is not going to employ all of them during the development of any one product. The context of the data product, in particular the stakeholder group(s) and their need(s), should help determine how to approach product development. For example, NANOOS has followed a similar process to the one described above for shellfish growers with other stakeholder groups, such as maritime operators, recreational boaters, tuna fishers, surfers, and beach users. But other groups that NANOOS serves, such as managers and agencies responsible for harmful algal bloom and tsunami responses, needed a somewhat different process for product development. As NANOOS has developed relationships with these stakeholders, they use the knowledge gleaned during their tailored engagement to determine the most effective and efficient steps to utilize for successful product development.
Overall, the creation of data products, tools, and services requires end user engagement from product initiation. Developing with end user input ensures the efficient and effective use of resources (in time, effort, and funding).
Step 3: Iterative Engagement With Users to Assure Data Products Remain Relevant
Stakeholder-driven projects require iterative stakeholder engagement and feedback in order to remain relevant and useful to the target audience. When feasible, it is helpful for the stakeholder community to become enmeshed with the organization leading the effort so that the user needs also become the needs of the product team. This fosters long-term commitment to the project, and the stakeholders can even become advocates for the tool and the organization.
Remain Engaged With Stakeholders
As the overall intent of the products being produced is to help inform decision-making, it is important to tell stories about how people use the information to expand their knowledge and make decisions. For many data products, it is useful for first-time users to be provided with concrete examples of how to use the information so they understand the benefits and limitations of the product.
In Vanuatu, VMGD hosts an annual National Climate Outlook Forum to engage sector-specific stakeholders and the Pacific Climate Outlook Forum for all climate seasonal forecasters. These venues provide space for stakeholders to share their experiences, share ideas, and improve their processes for information dissemination and understanding. These meetings are also venues to continue to engage users, update efforts, and ensure that data products remain relevant.
Prepare for a Long-Term Commitment
Organizations that create data products should enter the process with an understanding that they are making a long-term commitment to stakeholders. Product development and stakeholder engagement does not end when the product is made available or implemented. For a project to remain relevant, users have to remain engaged, and tools and applications often need to be updated to take advantage of technological advances. Stakeholders should review updated websites, tools, and applications before changes are released. It should be clear who has the responsibility for supporting these efforts, especially with regards to funding.
One long-term example is the SECOORA Marine Weather Portal (Figure 10). The development of regional coastal ocean observing systems in the early 2000s, as part of the U.S. IOOS initiative, provided increased meteorological and oceanographic data over and beyond the data that NOAA and other federal agencies provided. One of the challenges faced by IOOS-funded organizations was how to aggregate data from multiple sources in a meaningful way for stakeholders. An early data aggregation project was a small-scale web design initiative titled the “Carolinas Coast.” The Carolinas Coast tool launched in February 2005, and was a collaborative effort between the NWS Weather Forecast Office in Wilmington, NC, the University of North Carolina Wilmington, and the University of South Carolina. The team re-engineered the Wilmington and Charleston Weather Forecast Offices’ marine observations and forecast web pages. The new site incorporated data from moorings off North Carolina and South Carolina and displayed NWS marine weather and forecast data in a consolidated format across multiple NWS coastal coverage areas.
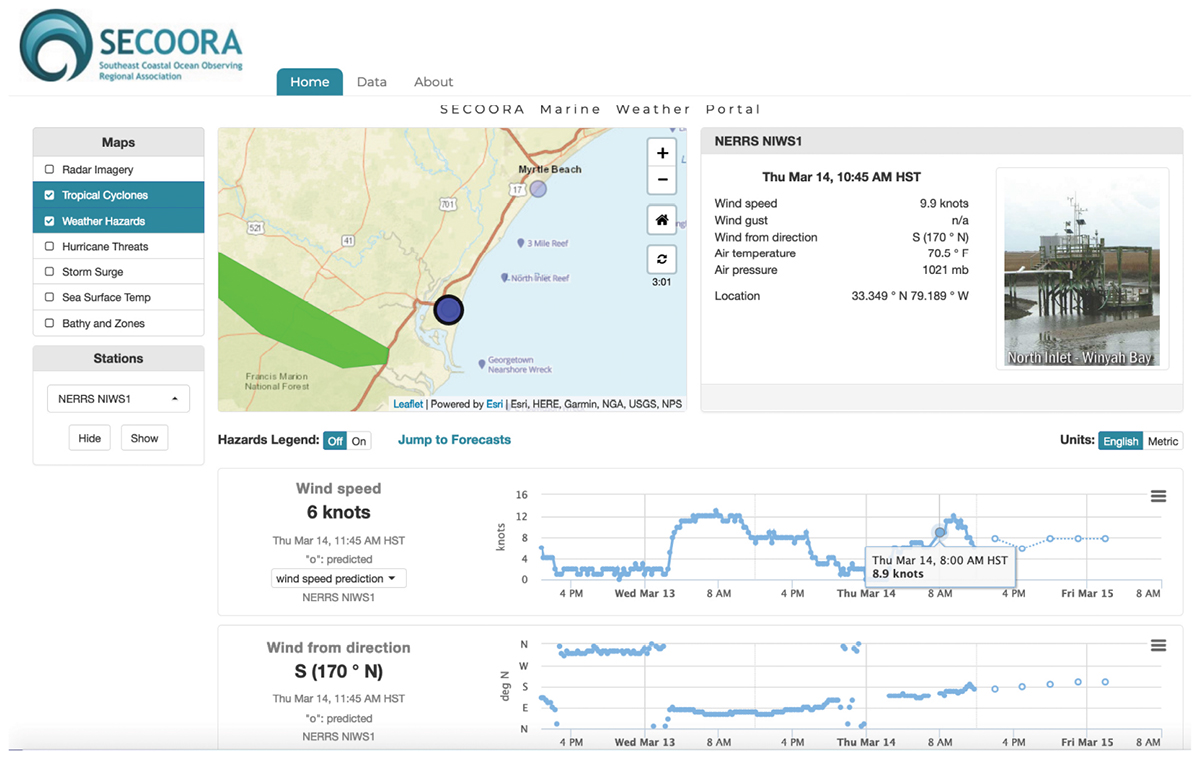
Figure 10. The SECOORA Marine Weather Portal map interface allows users to toggle on/off layers (e.g., weather hazards, sea surface temperatures, and hurricane threats). The dots on the map represent real-time stations (e.g., buoys, water level stations) that users can click on to see recent observations and forecasts for that location. Individual station pages, such as shown in this figure, allow users to graph the most recent data and observe trends in the weather and sea state data. Image courtesy of SECOORA.
Based on the success of the Carolinas Coast website, in 2007, the team expanded their coverage area throughout the Southeast U.S. and the Gulf of Mexico and rebranded as the Marine Weather Portal (MWP; Dorton et al., 2009), a site for mariners (from the casual boater to the commercial fisherman). In 2016, the MWP15 was further improved. The map interface was upgraded, and a mobile version was developed for those who connect via cell phone. Additionally, NWS offices across the southeast provided the development team with new products to incorporate (e.g., probable storm surge impacts, public health advisories, and adding forecasted data to graphs along with observed data so that users can identify trends) and ideas for future enhancements (e.g., adding virtual buoys, other product delivery methods) (Dorton et al., 2018).
Stakeholders have been engaged throughout the site development since the early 2000s in numerous ways, including: focus group meetings; questionnaires distributed to focus groups; NWS surveys located on the NWS websites; and presentations at marine community meetings and boat shows. One of the keys to the success of the MWP is how it is user-driven and built upon the success and lessons learned from the localized Carolinas Coast initiative and early versions of the MWP. The MWP outreach and data management personnel actively engage the stakeholders to get comments and feedback on the product and address end user needs in collaboration with the NWS. The MWP is an example of how product development does not stop with the launch of a website or creation of a new product. The MWP project team has invested in information technology and data management structures that allow for enhanced product robustness and reliability.
Expand Functionality as Requested
As questions, stakeholders, and technologies evolve, so too may the needs and requests from end users. Once a data product is integrated into the decision-making of end users, they can start to imagine the potential for new data and functionalities.
The NERACOOS climatology tool (as described in Steps 1 and 2, specifically Section “Attend Stakeholder and Partner Meetings” and Section “Employ a Formal Product Development Process When Appropriate”) has been so well received by fishermen and fisheries resource managers since it was initially launched in 2011, that these groups have asked for expanded functionality on the site. New functionality requests included the ability for the following: to define the time period(s) to calculate the climatology statistics; to plot multiple water depths and locations at the same time; and to include other historical climatology data. The ability to define date ranges and include other data types, such as satellite data, is helping with decision-making for multiple user groups. For example, fishermen can better plan when to fish or lobster based on ocean temperature; lobster processing facilities can plan for fluctuations in catch, resulting in better use of personnel hours; and, resource managers are able to monitor catch data and also identify changes in catch (both abundance and species). These examples also highlight how tools developed for stakeholders can have an impact not only on individual decision-making processes but also on local economies.
Be Open to Unexpected Outcomes
Iterative engagement with the users can also lead to new insights and products, often unexpected. In American Samoa, users have found the daily email product (described in Step 2, Section “Account for Technological Realities of the End Users”) with the PacIOOS wave buoy SST data to be extremely helpful for the intended design: to easily monitor the ocean conditions for corals, especially during El Niño years. With this information, managers and scientists are able to better plan their monitoring operations. Hideyo Hattori, NOAA Coral and Coastal Zone Management Liaison in American Samoa explained, “Coral bleaching has significantly increased in recent years, becoming more frequent and more intense. Receiving daily SST data from PacIOOS provides us with a snapshot of the actual conditions and serves as an effective indicator to anticipate bleaching events.” When the SST values increase, NOAA and partners increase their surveying efforts to track and monitor coral health around the islands.
An unexpected outcome of this collaborative effort and resulting product, which had many people pay so close attention to the SST data, was a discovery of what appears to be warm plumes of water recorded by the buoy. After watching the data for some time, managers and scientists agree that it is likely not due to an increase in the thermal energy of the buoy from absorbing solar radiation. In May 2017, once the El Niño conditions ended, and the imminent threat of coral bleaching passed, stakeholders in American Samoa asked (again through the local liaison) if PacIOOS could keep sending the daily emails, but also create an alert system that notified those interested when the SST reaches a specific threshold (i.e., more than a 1.5 degree Fahrenheit increase over the course of a day) in order to help track the occurrence of the warm plumes. After a few iterations with stakeholders, PacIOOS developed this additional tool, which is also distributed via email listserv. This is another quick, simple solution that helps resource managers do their job more efficiently. Developed after a couple of years of the initial tool, this new tool includes all the important information (i.e., the degree increase over the past date) in the subject line. Users do not even have to open the email to glean the information desired.
Late in 2017, partners were able to use the information and knowledge gathered through these simple tools to secure external funding from the American Samoa Power Authority and the American Samoa Renewable Energy Committee to purchase and attach temperature loggers along the wave buoy mooring line. The PacIOOS liaison worked with a student from Pacific Horizons High School and Crux Diving to attach the sensors to collect temperature data at different depths. Researchers suspect hydrothermal fluid may be venting from the fracture zone at the seafloor. If geothermal venting is confirmed, further studies are planned to determine whether this is a potential source of geothermal energy for American Samoa.
Evaluate the Product on a Regular Basis
Even once a product is developed, the work is never complete. In addition to ongoing maintenance, engagement, and outreach, it is important to evaluate the product on a regular basis. Depending on the product and the objectives associated with it, there are various metrics that can be employed to evaluate a tool. User metrics, such as the number of users or sessions per tool can be obtained with various platforms (e.g., Google Analytics), but as utility for a specific user group is often the objective for a tool, such quantitative metrics do not always tell the whole story. Take the American Samoa listserv as an example. If PacIOOS were to evaluate the effectiveness of this tool based solely on the number of people signed up for the listserv, the program would quite possibly see a relatively low number and determine it was not worth maintaining. However, as the objective of the listserv was to help the local resource managers monitor the SST to guide their monitoring plans and decision-making, a different, more qualitative measure is used: namely, is the target audience using the tool and satisfied with its performance?
Similarly, the resources required to develop and maintain the product should be assessed regularly. Spending a significant amount of resources on a single user, for example, might not be the best use of a program’s resources. However, if the single user is a federal agency that saves lives with the information or product provided (e.g., U.S. Coast Guard), a different metric (e.g., need expressed by an operational partner) may be necessary.
Ideally, the scale and the utility of a product should be taken into account before the product is developed, but these considerations also need to be revisited during product evaluation. Evaluation should also include scope management, ensuring that a program stays true to the stakeholder-driven philosophy—staying focused on the original purpose and audience and not getting caught up in the trap of thinking, “If we build it, they will come.” If one stakeholder group asks for a product, it is important not to make the assumption that everyone needs it. Furthermore, if a product does not successfully address stakeholder needs, or is replaced by other developments, the program should not continue sinking resources into it. Rather, it benefits the program to view this as an opportunity to free up resources to take on new efforts to make new and better products for stakeholders.
There are numerous ways to evaluate a product. The objectives of a particular product should guide which type of evaluation process to use. For example, since the How’s the Beach tool has several related products to serve a varied set of stakeholders, SECOORA has taken a more formal approach by forming technical working groups to evaluate the products, to refine the products as needed, and to continue stakeholder engagement. The EPA Virtual Beach Advisory Committee, including representation from the SECOORA region, uses federally published reports to help them determine potential future public health forecasting efforts. A second regional working group under SECOORA is responsible for iterative engagement and data product review. This group is hosting a workshop in late-2018 to discuss needs and next steps with users such as U.S. Geological Survey, state agencies with beach management and shellfish management responsibility, EPA Virtual Beach modeling group, project partners from the University of South Carolina, the University of Maryland Center for Environmental Science, SECOORA, the National Estuarine Research Reserves, and local Waterkeepers. Both working groups are tasked with reviewing the model (inputs and outputs) and products for each audience, providing feedback to SECOORA, and guiding product and tool refinement as well as methods of delivery.
Build Iteration and Outreach Into Budgets and Work Plans
Iteration—remaining engaged with stakeholders, adding functionalities, committing long-term, and evaluation—all require resources of an observing program. Similar to the best practice of including tailored stakeholder engagement (Step 1) into the project or program budgets and work plans, the resources required for successful outreach as well as iterative engagement and product refinement also need to be taken into account at the outset. In order to help assure a program’s ability to implement this process, it is advisable to include the recurring costs for a particular data product into project budgets as much as possible. Furthermore, once a particular project budget is closed out, the program needs to have a plan for how it will absorb the recurring costs.
For example, Hawai‘i Sea Grant and the State of Hawai‘i Office for Conservation and Coastal Lands asked PacIOOS to be a partner on a proposal that included funding for PacIOOS to develop the Hawai‘i Sea Level Rise Viewer16 (Figure 11). The resulting viewer is based on partner and user input and requirements for both usability and to meet the needs of the state agencies fulfilling a mandate from the State Legislature. Project funding also included several months for partners to provide trainings and presentations on the viewer and to collect additional feedback for PacIOOS to maintain, update, and refine the tool. Since December 2017, when the tool was released in concert with the State Sea Level Rise Vulnerability Report to the State Legislature, the project partners have been presenting and conducting outreach to numerous groups, agencies, and government councils on the Statewide report and the associated viewer developed by PacIOOS.
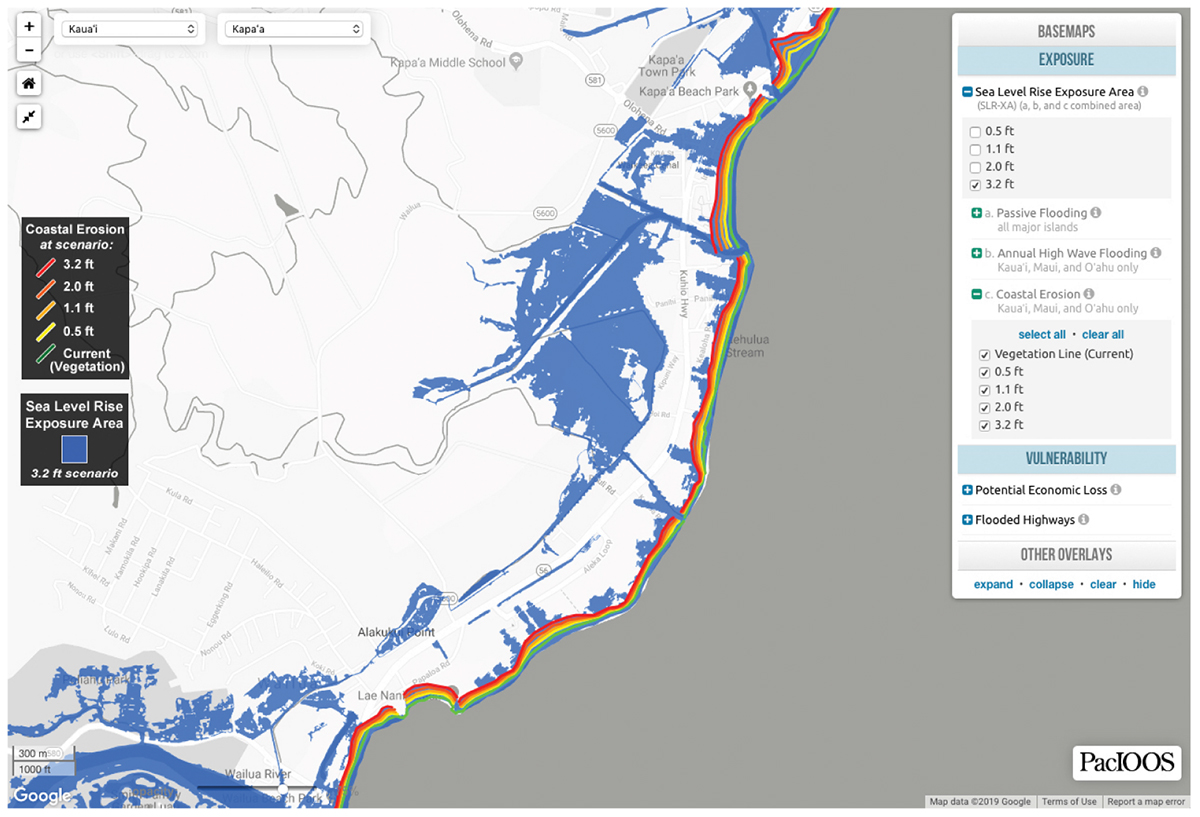
Figure 11. The Hawai‘i Sea Level Rise Viewer that PacIOOS developed is a companion tool to support the State of Hawai‘i Sea Level Rise Vulnerability and Adaptation Report. Policy-makers, planners, homeowners, and the public can explore exposure and vulnerability layers of four sea level rise scenarios. Users can view the geographic extent of three chronic flooding hazards (i.e., passive flooding, annual high wave flooding, and coastal erosion) separately or as an overlay. The image shows the overlay sea level rise exposure layer (dark blue) for the 3.2 ft. sea level rise scenario, and the reach of coastal erosion for each sea level rise scenario (red, orange, yellow, and green lines). Image courtesy of PacIOOS.
Strong, long-term relationships (Step 1, Section “Build Relationships”) between the project partners enabled PacIOOS to reinforce the need for funding support to collect iterative stakeholder input, to continue to refine and update the viewer, and to have the lead partners carry out the trainings and presentations. In this way, the product’s continued relevance and utility are built into the overall project objectives, activities, and budget. To date, the viewer has been well received by the target audiences (including the State Climate Commission, other policymakers, and county planners) as well as the interested public. Partners continue to receive numerous requests to demonstrate the viewer, and they are receiving positive feedback and learning about more stakeholders that are utilizing the tool for their work. Funding in the project budget is enabling this essential iterative process.
Summary
Let Stakeholders Drive the Process
Successfully and efficiently addressing the unique challenges of coastal communities through observing systems necessitates a process that accounts for the diversity among users and iteratively integrates that understanding throughout the product development life cycle. Promoting a stakeholder-driven philosophy, the three-step process described in this paper emphasizes engagement with the end users before any product development begins. It is imperative to continue engagement through product development, iteratively assess the product with stakeholders, and respond to their feedback as they use a new tool. While the content herein may seem obvious or simplistic to some, the reality is that far too many data products are still developed without going through most, or even any, of the essential steps described above. To be truly effective in delivering value to coastal communities, observing systems must evaluate how they connect their stakeholders to coastal and ocean observing data.
Although “steps” imply a linear process, the approach we describe is best imagined as an iterative, non-linear process. Indeed, the approach described in this paper is a continuum in which the three steps overlap and blend into each other as well as iteratively repeat (Figure 1). Even before the first step, though, it is important to set or affirm the intention to operate a stakeholder-driven process. Within this paradigm, the approach described in this paper takes hold. In addition, we recognize that this approach sits within a larger context of well designed coastal and ocean observing systems that are science-based and policy neutral. While it is beyond the scope of this community white paper, it is worth noting that the placement of observing assets must take into account both societal needs as well as scientific design and environmental processes. The process to develop tailored products that utilize the data collected from such assets in order to address stakeholder needs is the focus of this paper.
As the resources available to support observing systems and related programs are not sufficient to address all the societal needs, it is essential to be efficient with the use of the resources available. Engaging with stakeholders throughout the conceptual, design, implementation, and evaluation phases of data product development helps to ensure that resources are efficiently managed and utilized. Indeed, the entire process needs to be carefully considered at the outset of product development. It is vital, for example, for organizations to ensure that they have a plan to sustain and refine the product, should it be successful in the eyes of the stakeholders.
The diverse examples peppered throughout this paper highlight how various coastal and ocean observing programs implement the stakeholder-driven process to develop tailored data products. Table 2 shows the strategies employed for each step of the process during the product development life cycle for each of the examples discussed. Each data product used specific (and not all) of the strategies discussed; however, each example employed strategies from each of the three steps of the overall process. The programs tailor user engagement to learn about stakeholder needs. This engagement helps define and refine data products based on end user requirements, and iteratively engaging with stakeholders ensures that products remain relevant. While there are countless more examples that could demonstrate the concepts included herein, those included also feature the breadth of geographic, conceptual, and stakeholder reach of data products built upon coastal and ocean observations. We hope the best practices and successes described in this community white paper inspire others to enhance their engagement with stakeholders at every stage of product development.
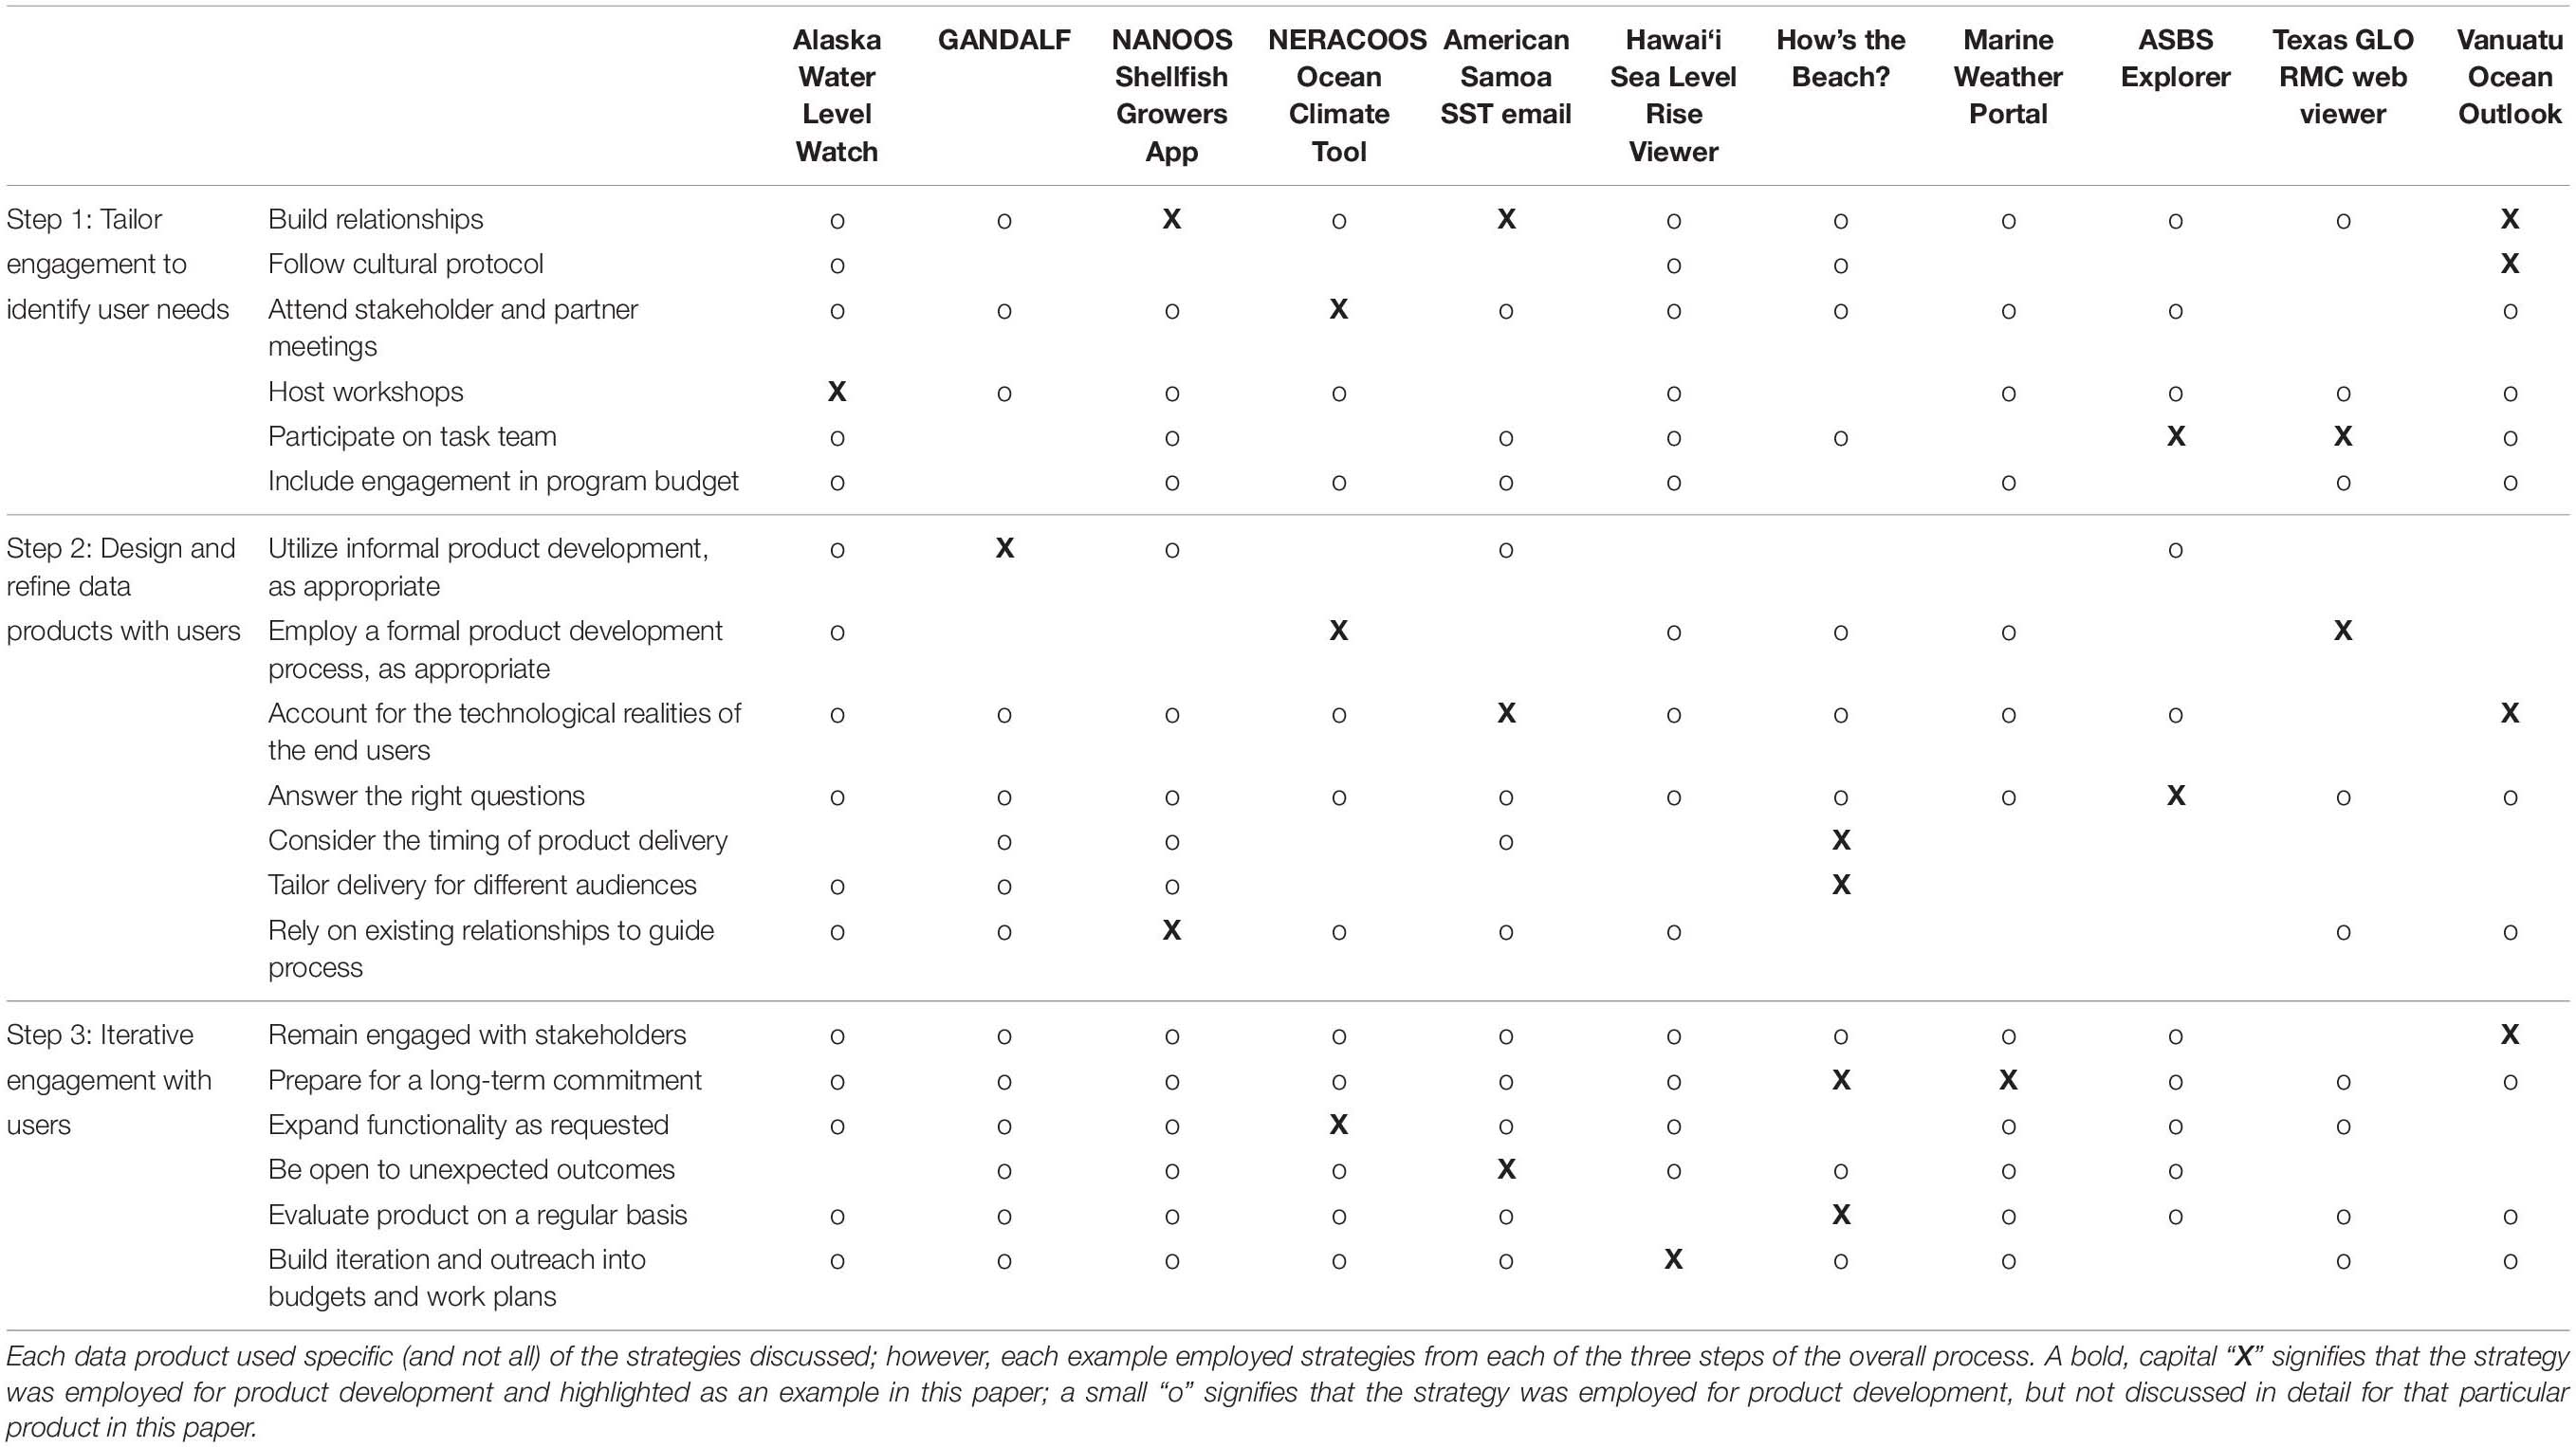
Table 2. A matrix of the strategies discussed in this paper for each of the three-step process against the data product examples discussed in this paper.
Looking Forward: Aspirations for the Coastal and Ocean Observing Community for the Next 10 Years
While each coastal and ocean observing system or program may have slightly different missions, the overarching goal is to address societal needs: to improve the lives and livelihoods of stakeholders. As the number and types of observations continue to increase across the globe, we aspire for stakeholder-driven products to be the norm, rather than the exception. Funding should no longer support the development of tools without a demonstrated stakeholder need. Developing a tool, and then seeking stakeholders that “need” it is simply no longer acceptable. Resources, both fiscal and personnel, are too limited to spend on such efforts. The costs of such actions are too great, especially when the potential rewards of stakeholder-driven efforts are so high.
We envision a future in which data sets are increasingly interoperable, allowing for more integration and comparison among existing and new datasets. This will create new opportunities for stakeholder-driven data products. Ensuring that the resulting data products, as well as the observing system designs, are stakeholder-driven will greatly enhance societal benefit. Furthermore, we advocate for data products to be built on open source platforms that are freely available—placing collaboration and mission-driven activities before profit and competition. Open source applications enable programs to stretch resources and cross-pollinate, rather than duplicate, ideas and efforts, which in turn enables observing systems to increase the reach and benefit to their stakeholders.
While not explicitly discussed in this paper, the issue of increasing capacity in areas with less coastal and ocean observing assets, data, and community experience is an important theme globally. With the understanding that resources are limited, we encourage the broader community to use the next decade to innovate, collaborate, and stretch the boundaries of observing to identify and address stakeholder needs. Those with fewer observing assets still have much to offer in terms of willing partners, coastal and ocean access, connections with communities, ideas to address needs, fiscal resources, and more. Technical training opportunities, internships, collaborative workshops, and listening sessions are some ideas that come to mind, but there are certainly others that can help bridge and fill the observing gaps across the globe.
There is an opportunity to fill observational gaps by linking an enthusiastic citizen base with technological advancements. The potential to fill or augment data gaps with information collected by stakeholders and citizens has only recently begun to take shape. There is also great potential for stakeholders to help direct the data collection to address specific needs under a set of predefined standards and protocols. We envision a future where interested and informed participants have access to the tools and expertise necessary to rapidly analyze and synthesize data and data products that integrate data from multiple sources. Global awareness of the vital importance of coastal and ocean information is growing, and communities at all levels are increasingly interested in getting involved. If these stakeholders can see that they truly have a voice and are the drivers behind the design and implementation of observing systems, their support and participation in the process will continue to flourish. It is up to all of us in the global coastal and ocean observing community to ensure that this is the reality that stakeholders experience.
Author Contributions
MI, JD, JN, MY, and JG contributed to the conception and design of the manuscript and provided the language that served as the foundation for the manuscript development. MI led the review, the design, and the development of the manuscript, with much assistance from JD. MI and JD gathered and incorporated larger community input for the manuscript. TS, BK, and RC helped fine-tune and craft the messages within the manuscript and wrote specific sections based on their experiences. All authors contributed to manuscript revision and have read and approved the submitted version.
Funding
Funding for the development of the NERACOOS ocean climate tool was provided by NOAA IOOS award NA11NOS0120034. Alaska Water Level Watch facilitated by AOOS is provided by NOAA IOOS award NA16NOS0120027. GCOOS glider piloting tool, GANDALF, was provided by the NOAA IOOS award NA11NOS0120024. Texas RMC system was provided by NOAA awards NA12NOS4190264 and NA15NOS4190162. How’s the Beach tool was provided by the SECOORA with NOAA award NA16NOS1846140 (2016-2021), an EPA supplement to the NOAA award via NOAA/EPA MOA-2011-005/8213, and the NOAA Office for Coastal Management (NA17NOS422104 and NA16NOS4200125). NANOOS data products, outreach, and NANOOS Visualization System has been through NOAA IOOS awards NA10NOS4730018, NA11NOS0120036, and NA16NOS0120019. Partial funding for the LiveOcean forecast model was provided through these grants; the addition of ocean acidification variables was funded by the Washington Ocean Acidification Center. The Marine Weather Portal was provided by the SECOORA with NOAA award NA16NOS0120028 (2016-221), NOAA IOOS NA07NOS4730220 (2007-2010), and South Carolina Sea Grant for funding the original Carolinas Coast project (2005). Vanuatu Ocean Outlook training on Capacity is funded by the Australian Government through VMGD and Climate and Ocean Support Program for the Pacific Project. Funding for sustained distribution and maintenance of the SCCOOS ASBS explorer is provided by NOAA IOOS award NA16NOS0120022. Funding for the development and maintenance of the Hawai‘i Sea Level Rise Viewer was provided by NOAA Office for Coastal Management, NA16NOS4730016. PacIOOS and its data management efforts are funded in part by NOAA IOOS award NA16NOS0120024.
Conflict of Interest Statement
The authors declare that the research was conducted in the absence of any commercial or financial relationships that could be construed as a potential conflict of interest.
Acknowledgments
BK, JN, and MI acknowledge Carl Gouldman (IOOS), Josie Quintrell (IOOS Association), and their fellow Regional Association directors (Clarissa Anderson, Debra Hernandez, Gerhard Kuska, Molly McCammon, Julio Morell, Ru Morrison, Kelli Paige, and Henry Ruhl), who embody the work described above every day as they operate under core tenants of IOOS: science-based, stakeholder-driven, and policy-neutral. We acknowledge Megan Hepner (SCCOOS) and Chris Ostrander (University of Utah) for their thorough reviews, proofreading, and suggestions; Fiona Langenberger (PacIOOS) for her comprehensive review and ability to make a crayon sketch into a professional image; and Abbey Wakley (SECOORA) for her efforts to present our screen grabs as described by the Frontiers editors. BK and RC would like to thank the glider pilots of the Gulf who provided critical feedback to make GANDALF the premier piloting tool and Gary Kirkpatrick who took Bob on in August 2005, and asked for glider management support. JD acknowledges SECOORA and the How’s the Beach product development team, specifically Dwayne Porter, University of South Carolina, Arnold School of Public Health, for his authorship of the How’s the Beach sections for this manuscript. JD acknowledges SECOORA, who would like to thank NOAA NWS for their feedback and support of the SECOORA Marine Weather Portal; specifically Weather Forecast Offices in Newport/Morehead City, NC, Wilmington, NC, Charleston, SC, Key West, FL, Tampa, FL, Mobile, AL, Corpus Christi, TX, and Brownsville, TX. JG acknowledges Kate Saul and Elizabeth Vargas of the Texas General Land Office for their persistence in forming the Texas Data Standards Committee and helping to guide the development of the modern Texas RMC system. JN acknowledges NANOOS, who would like to thank the core partners of the User Product team of NANOOS hailing from the University of Washington, Oregon Department of Geology and Mineral Industries, Oregon State University, and Oregon Health and Science University. NANOOS also thanks their many stakeholder partners, including Padilla Bay National Estuarine Research Reserve, Pacific Coast Shellfish Growers Association, Surfrider, and many tribes, agencies, non-governmental organizations and industry representatives who help to define, review, and improve NANOOS products. MI acknowledges PacIOOS, who would like to thank the partners at the Hawai‘i Sea Grant College Program and the State of Hawai‘i, Department of Land and Natural Resources Office for Conservation and Coastal Lands and the Office of Planning for including PacIOOS on the important work to help build resilience to coastal hazards and climate change in Hawai‘i. Hawai‘i Sea Grant’s extension agents are also a key piece of PacIOOS’ stakeholder engagement beyond Hawai‘i, including in American Samoa. Fa’afetai tele lava, Kelley Anderson Tagarino. PacIOOS values this collaborative relationship greatly and looks forward to continuing the partnership. MY would like to acknowledge South Pacific Community (SPC) and Vanuatu Government for facilitating her training on the Ocean Portal through Climate and Ocean Support Program for the Pacific (COSPPac). TS acknowledges NERACOOS, who would like to thank the many stakeholders including Northeast fishermen, fisheries managers, coastal resource managers and the NERACOOS Strategic and Planning and Implementation team who participated in surveys, user testing and reviews of the of the NERACOOS Ocean Climate tool. We would also like to thank Claire Eaton of the University of New Hampshire for her input on tailoring stakeholder engagement. We acknowledge SCCOOS, who is grateful for the foresight of Dr. Eric Terrill, Lisa Hazard, and the rest of the high frequency radar team at the Coastal Observing Research and Development Center for initiating development of the ASBS product with funding from the La Jolla Shores Coastal Watershed Management Group, the City of San Diego, the University of California San Diego Scripps Institution of Oceanography, Department of Environmental Health and Safety, San Diego Coastkeeper, and the California State Water Resources Control Board. Sarah Heim has also played a key role in product development and visualization. We also acknowledge Molly McCammon and Carol Janzen at AOOS, who would like to thank their partnership with the Alaska Department of Natural Resources (Jacquelyn Overbeck), NOAA’s Alaska Region NWS (Carven Scott), NOAA’s Alaska Regional Collaboration Team coordinator Amy Holman, NOAA’s National Geodetic Survey (Nicole Kinsman), NOAA CO-OPS (Laura Rear McLaughlin), and ASTRA LLC (Geoff Crowley). Finally, we are grateful to all our partners, stakeholders, users, and collaborators who inspire, teach, and improve the collective effort to build better coastal and ocean observing systems, tools, and services to increase the benefits to society.
Abbreviations
AOOS, Alaska Ocean Observing System; ASBS, Areas of Special Biological Significance; AUV, autonomous underwater vehicle; DSC, Data Standards Committee; GANDALF, Gulf Autonomous underwater vehicle Network and Data Archiving Long-term storage Facility; GCOOS, Gulf of Mexico Coastal Ocean Observing System; GOOS, Global Ocean Observing System; IOOS, Integrated Ocean Observing System; NANOOS, Northwest Association of Networked Ocean Observing Systems; NOAA, National Oceanic and Atmospheric Administration; NERACOOS, Northeastern Regional Association of Coastal Ocean Observing Systems; NWLON, National Water Level Observing Network; NWS, National Weather Service; PacIOOS, Pacific Islands Ocean Observing System; RMC, Resource Management Code; SCCOOS, Southern California Coastal and Ocean Observing System; SECOORA, Southeast Coastal and Ocean Regional Associated; SST, sea surface temperature; VMGD, Vanuatu Meteorology and Geo-Hazards Department.
Footnotes
- ^ http://www.pacioos.hawaii.edu/water/buoy-aunuu/
- ^ http://www.neracoos.org/datatools/climatologies
- ^ http://aoos.org/wp-content/uploads/2011/05/2016_Alaska_Water_Level_Observations_v1-0.pdf
- ^ https://aoos.org/alaska-water-level-watch/alaska-water-level-meeting-2018/
- ^ https://www.aoos.org/alaska-water-level-watch/
- ^ https://www.facebook.com/AlaskaWaterLevelWatch/
- ^ http://sccoos.org/data/asbs/?p=20
- ^ http://gandalf.gcoos.org
- ^ NetCDF files are a common data format used for storing, retrieving, and sharing data (NetCDF 4.6.2, 2019).
- ^ https://cgis.glo.texas.gov/rmc/index.html
- ^ http://howsthebeach.org/
- ^ http://nvs.nanoos.org/Apps
- ^ http://nvs.nanoos.org/ShellfishGrowers?action=overlay:liveocean_ph
- ^ http://nvs.nanoos.org/ShellfishGrowers
- ^ https://mwp.secoora.org
- ^ http://www.pacioos.hawaii.edu/shoreline/slr-hawaii/
References
Bishop, R., and Glynn, T. (1992). He kanohi kitea: conducting and evaluating educational research. N. Zeal. J. Educ. Stud. 27, 125–135.
Bourne, L. (2016). Targeted communication: the key to effective stakeholder engagement. Proc. Soc. Behav. Sci. 226, 431–438. doi: 10.1016/j.sbspro.2016.06.208
Dorton, J., Galvarino, C., Porter, D. E., and Hernandez, D. (2018). “Integrating marine weather data, forecasts, and user assessments to upgrade the Marine Weather Portal,” in Proceedings of the MTS/IEEE OCEANS 18 Conference, Charleston, SC.
Dorton, J., Subramanian, V., Galvarino, C., and Porter, D. E. (2009). “Ocean observing: linking observations to the NWS and marine community,” in Proceedings of the MTS/IEEE Oceans 09 Conference, Biloxi, MS.
Edwing, R. (2015). Approval of Revised Policy for Management and Dissemination of External Source Water Level Data, Memorandum. Silver Spring: NOAA.
Iwamoto, M. M., Langenberger, F., and Ostrander, C. E. (2016). Ocean observing: serving stakeholders in the Pacific Islands. Mar. Technol. Soc. J. 50:3. doi: 10.4031/MTSJ.50.3.2
Liu, Y., Kerkering, H., and Weisberg, R. H. (eds) (2015). Coastal Ocean Observing Systems. Amsterdam: Elsevier.
NetCDF 4.6.2 (2019). The netCDF Interface. Available at: https://www.unidata.ucar.edu/software/netcdf/docs/netcdf_introduction.html (accessed February 28, 2019).
Project Manager (2019). What is a Stakeholder? Available at: https://www.projectmanager.com/blog/what-is-a-stakeholder (accessed February 28, 2019).
Smith, L. T. (2004). Decolonizing Methodologies: Research and Indigenous Peoples. 7th Impression. New York, NY: Zed Books Ltd.
Willis, Z. (2015). “National Ocean Observing Systems in a Global Context,” in Coastal Ocean Observing Systems, eds L. Yonggang, K. Heather, and R. H. Weisberg (Amsterdam: Elsevier Science & Technology), 11–25. doi: 10.1016/b978-0-12-802022-7.00002-x
Keywords: coastal, ocean, observations, product development, stakeholder engagement, data products, stakeholder-driven
Citation: Iwamoto MM, Dorton J, Newton J, Yerta M, Gibeaut J, Shyka T, Kirkpatrick B and Currier R (2019) Meeting Regional, Coastal and Ocean User Needs With Tailored Data Products: A Stakeholder-Driven Process. Front. Mar. Sci. 6:290. doi: 10.3389/fmars.2019.00290
Received: 30 October 2018; Accepted: 17 May 2019;
Published: 07 June 2019.
Edited by:
Sabrina Speich, École Normale Supérieure, FranceReviewed by:
Jérôme Paillet, Institut Français de Recherche pour l’Exploitation de la Mer (IFREMER), FranceChristophe Delacourt, Université de Bretagne Occidentale, France
Michael Paul Hemming, University of New South Wales, Australia
Copyright © 2019 Iwamoto, Dorton, Newton, Yerta, Gibeaut, Shyka, Kirkpatrick and Currier. This is an open-access article distributed under the terms of the Creative Commons Attribution License (CC BY). The use, distribution or reproduction in other forums is permitted, provided the original author(s) and the copyright owner(s) are credited and that the original publication in this journal is cited, in accordance with accepted academic practice. No use, distribution or reproduction is permitted which does not comply with these terms.
*Correspondence: Melissa M. Iwamoto, melissa.iwamoto@hawaii.edu