Potential Benefits of Vessel Slowdowns on Endangered Southern Resident Killer Whales
 Ruth Joy1,2*
  Dominic Tollit1
  Jason Wood1 Alexander MacGillivray3 Zizheng Li3 Krista Trounce4 Orla Robinson4
- 1SMRU Consulting, Vancouver, BC, Canada
- 2Department of Statistics and Actuarial Science, Simon Fraser University, Burnaby, BC, Canada
- 3JASCO Applied Sciences, Victoria, BC, Canada
- 4Vancouver Fraser Port Authority, Enhancing Cetacean Habitat and Observation (ECHO) Program, Vancouver, BC, Canada
A voluntary commercial vessel slowdown trial was conducted through 16 nm of shipping lanes overlapping critical habitat of at-risk southern resident killer whales (SRKW) in the Salish Sea. From August 7 to October 6, 2017, the trial requested piloted vessels to slow to 11 knots speed-through-water. Analysis of AIS vessel tracking data showed that 350 of 951 (37%) piloted transits achieved this target speed, 421 of 951 (44%) transits achieved speeds within one knot of this target (i.e., ≤12 knots), and 55% achieved speeds ≤ 13 knots. Slowdown results were compared to ‘Baseline’ noise of the same region, matched across lunar months. A local hydrophone listening station in Lime Kiln State Park, 2.3 km from the shipping lane, recorded 1.2 dB reductions in median broadband noise (10–100,000 Hz, rms) compared to the Baseline period, despite longer transit. The median reduction was 2.5 dB when filtering only for periods when commercial vessels were within 6 km radius of Lime Kiln. The reductions were highest in the 1st decade band (-3.1 dB, 10–100 Hz) and lowest in the 4th decade band (-0.3 dB reduction, 10–100 kHz). A regional vessel noise model predicted noise for a range of traffic volume and vessel speed scenarios for a 1133 km2 ‘Slowdown region’ containing the 16 nm of shipping lanes. A temporally and spatially explicit simulation model evaluated the changes in traffic volume and speed on SRKW in their foraging habitat within this Slowdown region. The model tracked the number and magnitude of noise-exposure events that impacted each of 78 (simulated) SRKW across different traffic scenarios. These disturbance metrics were simplified to a cumulative effect termed ‘potential lost foraging time’ that corresponded to the sum of disturbance events described by assumptions of time that whales could not forage due to noise disturbance. The model predicted that the voluntary Slowdown trial achieved 22% reduction in ‘potential lost foraging time’ for SRKW, with 40% reductions under 100% 11-knot participation. Slower vessel speeds reduced underwater noise in the Slowdown area despite longer passage times and therefore suggest this is an effective way to benefit SRKW habitat function in the vicinity of shipping lanes.
Introduction
A number of at-risk species of cetaceans (whales, dolphins, and porpoises) inhabit the straits between southern British Columbia and northern Washington State often referred to as the Salish Sea. Key among these species is the endangered southern resident killer whale (SRKW), with a population of only 78 individuals at the time of this 2017 study. This population was designated as endangered under Canada’s Species at Risk Act in 2001, which initiated the development of a recovery strategy (Heise, 2008; Department of Fisheries and Oceans Canada [DFO], 2011, 2018) and an Action Plan (Department of Fisheries and Oceans Canada [DFO], 2017) to address the current threats to the SRKW in Canadian waters). The Canadian federal recovery strategy designates much of the Salish Sea as SRKW critical habitat, where critical habitat is defined as the habitat necessary for the survival or recovery of the species. Under the United States Endangered Species Act, critical habitat has also been designated in much of the Washington State waters of the Salish Sea. These designations offer the species legal protection in both the inbound and outbound shipping lanes because they overlap with critical habitat.
Killer whales use sound to navigate, communicate and locate prey via echolocation (Ford, 1989; Au et al., 2004), and underwater noise can impede these functions (Holt et al., 2009). Southern resident killer whale critical habitat in the Salish Sea includes inbound and outbound commercial shipping lanes, as well as traffic from many whale watching boats and recreational vessels. In close proximity of boat traffic (<400 m), studies of both northern and southern resident killer whales behavior have shown whales reduce time spent foraging and increase time spent transiting (Williams et al., 2006; Lusseau et al., 2009). Vessel proximity has been shown to induce changes in SRKW surface-active behaviors (Noren et al., 2009), respiration rate, swim speed, and path directedness (Williams et al., 2009). Elevated noise levels from vessel traffic can hinder the opportunities for killer whales to echolocate and find food, as well as limit opportunities to share information and maintain group cohesion within a foraging group. The result is a reduction in the whale’s acoustic space and foraging efficiency, making it harder for whales to find their prey. The SRKW population is believed to be undergoing nutritional stress due to ongoing changes in both the number and size of returning Chinook salmon (Ford et al., 2009; Ward et al., 2009; Department of Fisheries and Oceans Canada [DFO], 2011; Williams et al., 2011), and exposure to low-frequency ship noise may be associated with chronic stress in whales (Rolland et al., 2012). Therefore, increased underwater noise in key foraging habitat areas could have important implications to this endangered population.
Conservation of the SRKW population is challenged by increases in international trade, for which 90% is facilitated through marine shipping (United Nations Conference on Trade and Development [UNCTAD], 2018). Over the last century, there have been substantial increases in shipping worldwide and future projections indicate that this trend will continue. Marine traffic generates low frequency, high-energy noise in the ocean and can propagate across hundreds of kilometers, and even whole ocean basins (National Research Council of the U. S. National Academies [NRC], 2003). Recent evidence has documented commercial vessel noise in the Salish Sea has raised the background broadband noise levels significantly, including noise in the frequency range that SRKW use for communication and echolocation (10–40 kHz band, Veirs et al., 2016). With noise projected to continue increasing (Hildebrand, 2009), there comes an increasing potential for adverse effects on the underwater noise field of the Salish Sea (Veirs et al., 2016). The potential implications are lower survival rates and lower reproductive success of individuals that could, in the long term, have population level consequences for the SRKW. Indeed Lacy et al. (2017) identified acoustic disturbance from ships and small boats as a threat to SRKW recovery in the Pacific Northwest.
The Enhancing Cetacean Habitat and Observation (ECHO) Program, led by the Vancouver Fraser Port Authority, aims to better understand and mitigate the effects of shipping activities on at-risk whales in the Salish Sea. The ECHO Program is guided by the advice and input of an advisory working group that brings together a broad spectrum of relevant backgrounds, perspectives and interests from both Canada and the United States. The advisory working group consists of members from the marine transportation industry, environmental conservation, First Nations, government, and academia. This group identified acoustic disturbance to the endangered SRKW from vessel noise as a top priority for program research and mitigation1. Ultimately the advisory working group identified that slowing vessels down in a geographic area of importance to SRKW should be the priority mitigation measure to trial. Thus, during the summer of 2017, a multi-stakeholder voluntary commercial vessel Slowdown trial was conducted within 16 nm of the international shipping lanes for vessels calling into Canadian and United States ports in the Salish Sea. This 16 nm Slowdown region is a key summer foraging habitat for SRKW in the Salish Sea. Commercial vessels were requested to slow to a target speed-through-water of 11 knots across the 16 nm section to quantify underwater noise reduction and evaluate potential benefits to SRKW. The trial was designed to answer the following three key questions: (1) How does reduced vessel speed change the underwater noise generated by a specific vessel (vessel source level) and by type of vessel? (2) How does reduced vessel speed change the total underwater ambient noise received at a specific location of importance to the SRKW? (3) What are the predicted resultant effects on SRKW behavior and foraging given the changes in noise as answered by questions (1) and (2)?
Materials and Methods
Trial Location
Southern resident killer whales are present year-round in the Salish Sea, but are concentrated off the west coast of San Juan Island in the core of their critical habitat in Haro Strait (Seely et al., 2017; Olson et al., 2018). This SRKW hotspot region intersects with the major international shipping lanes between the Pacific Ocean and ports of call in southern British Columbia, the largest being the Port of Vancouver, as well as the Washington State Ferries route from Anacortes, Washington to Sidney, British Columbia (Figure 1). The boundaries of the Slowdown region constituted an approximately 16 nm distance of shipping lanes through Haro Strait that overlaps with the core of SRKW critical habitat (Figure 1 inset).
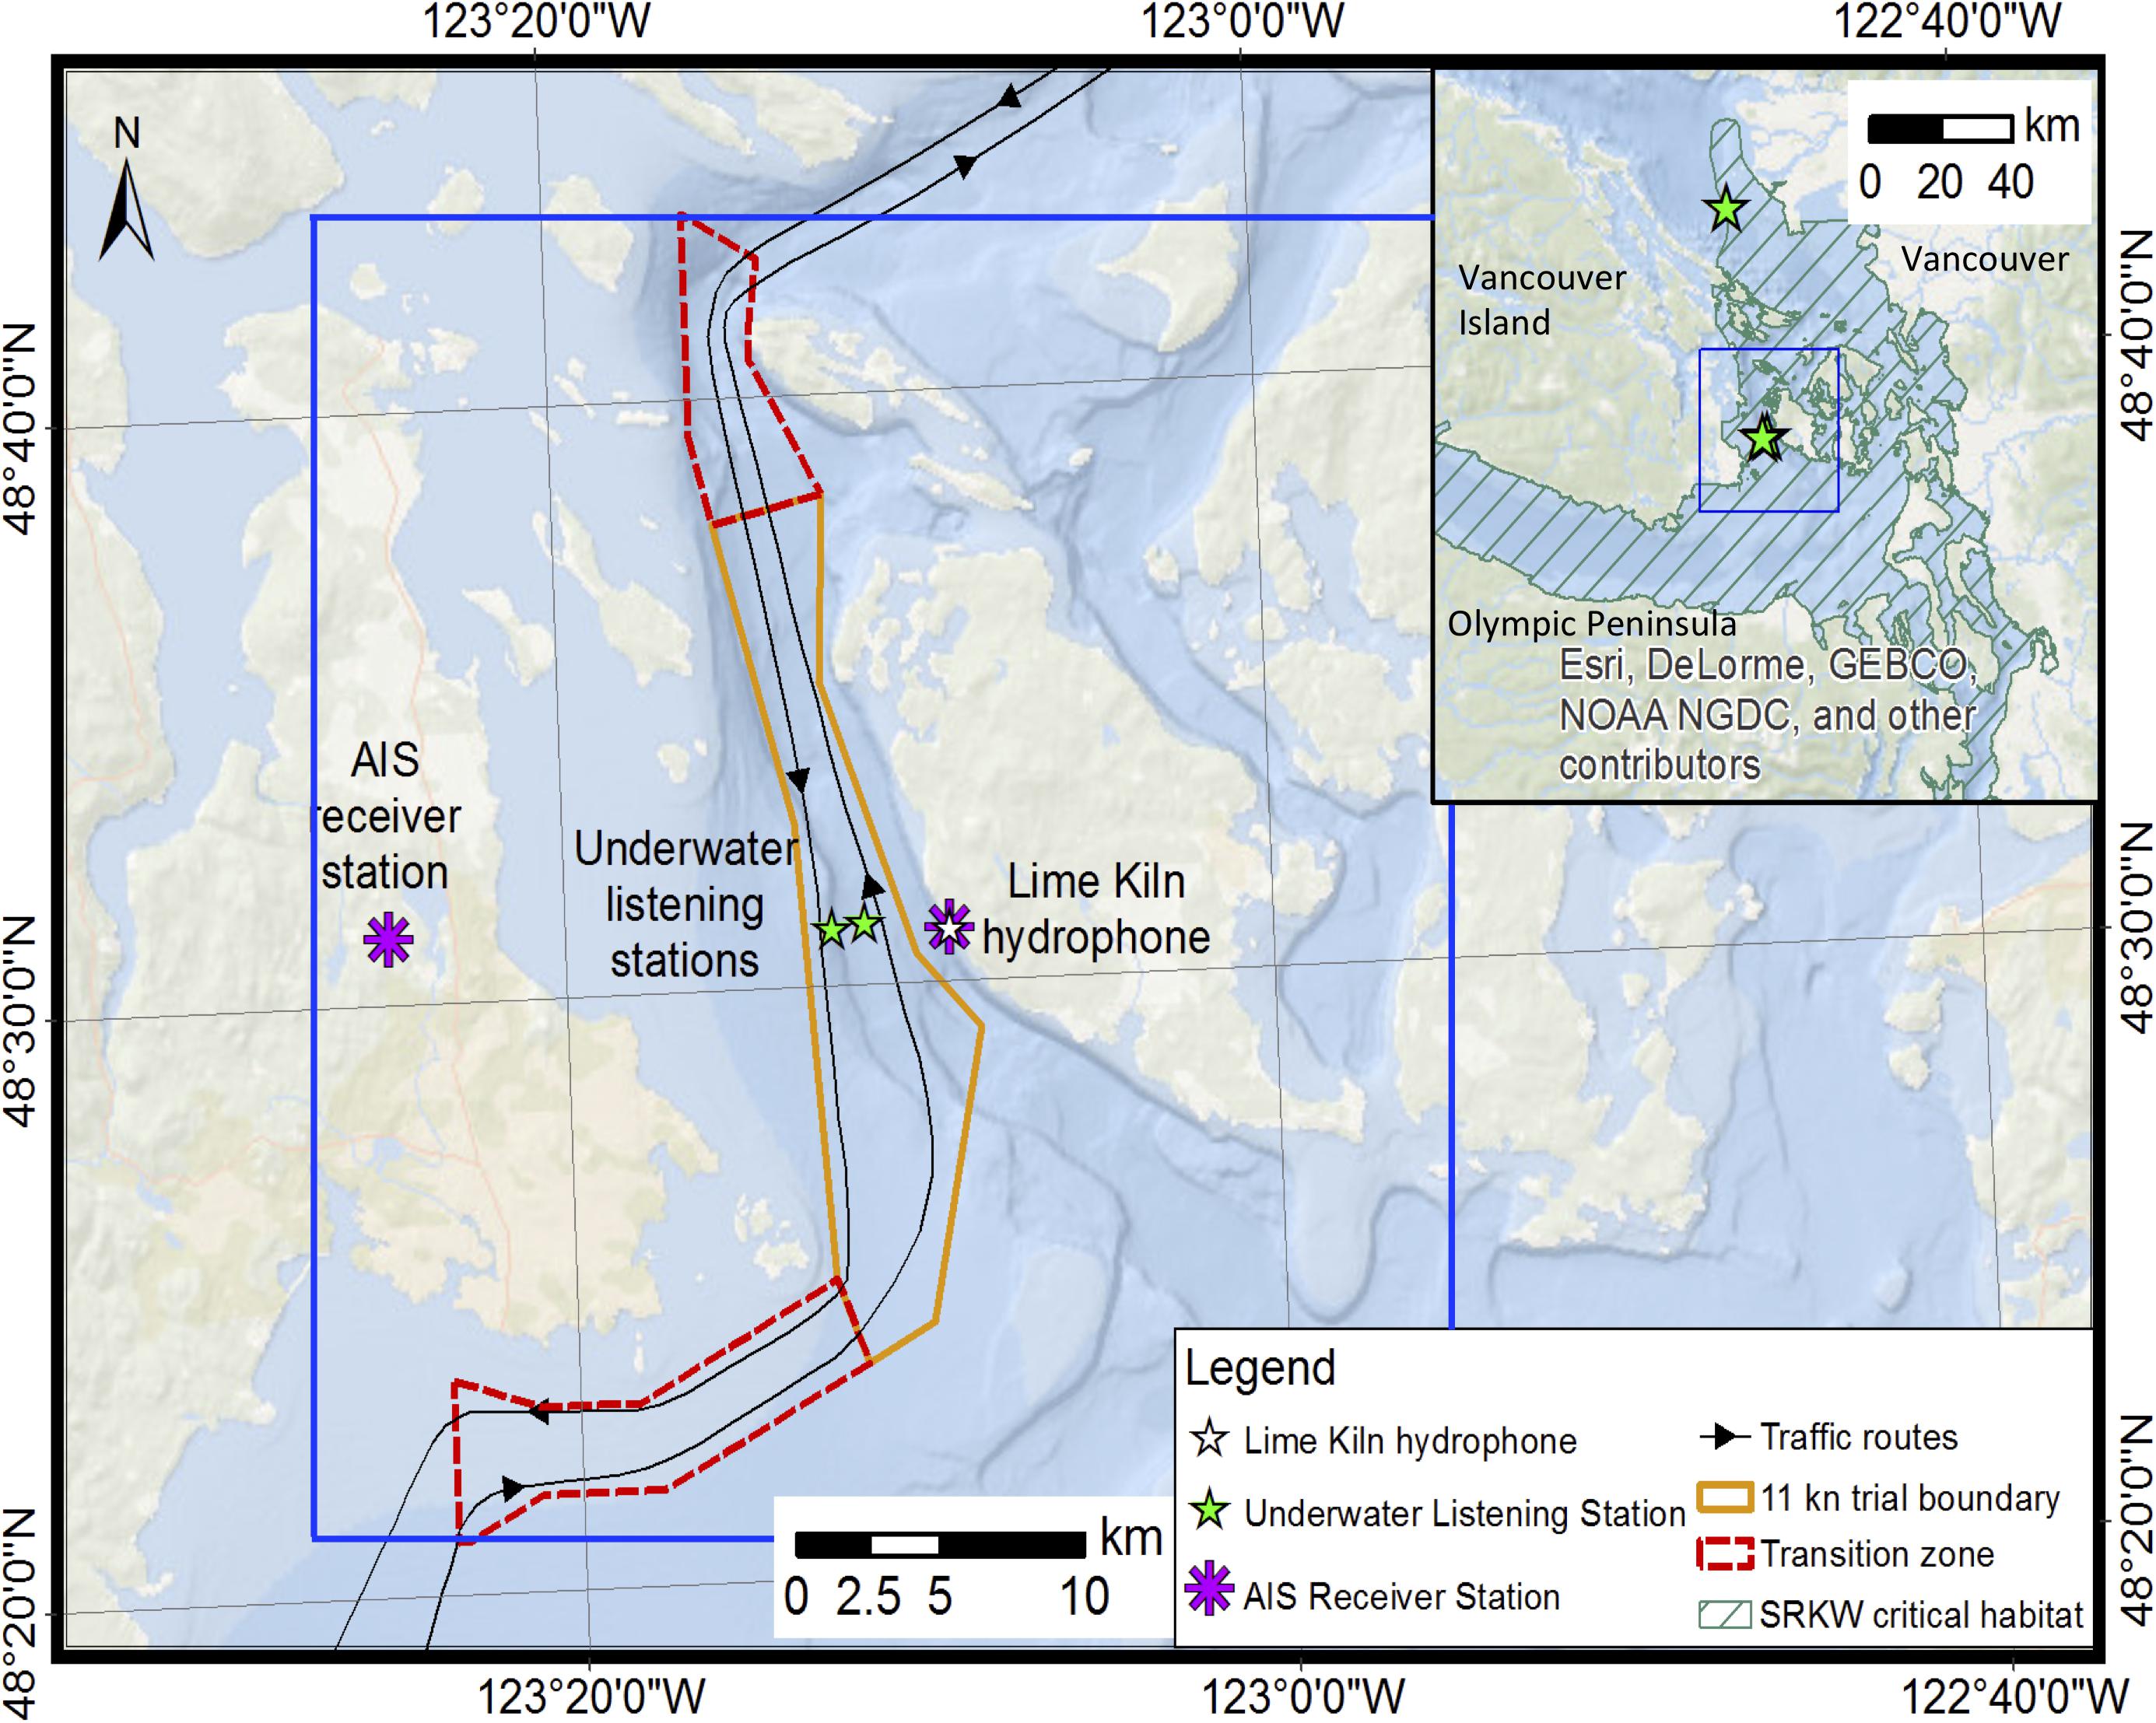
Figure 1. Map of the Slowdown region. The two AIS receiver stations are shown as purple stars. The orange polygon depicts the 16 nm section of shipping lanes through which vessels were requested to slow to 11-knots speed-through-water. There are 4 underwater listening stations (ULS) as part of this study, three are within Haro Strait, two of which are located under the shipping lanes, and the third is cabled to shore and located at Lime Kiln Point on San Juan Island. The fourth ULS is in Georgia Strait, 30 km south of Vancouver, and shown only in the small map panel. The extent of the ‘regional vessel noise model’ for the ‘Slowdown region’ is depicted by the blue box, and includes cross-boundary waters of British Columbia, Canada and Washington State, United States.
Trial Timing
The trial took place during two lunar months (61 days) between August 7 and October 6, 2017. The trial encompassed the period of the year when SRKW are typically at their highest presence in Haro Strait coinciding with increased availability of Chinook salmon (Ford and Ellis, 2006). Lunar months (as opposed to calendar months) were selected to evaluate total ambient noise in the region while accounting for the low frequency flow noise that is typically associated with tidal cycles (Lee et al., 2011). The ECHO Program has been collecting and analyzing ambient noise on a lunar month cycle in Haro Strait since 2016, thus a comparative evaluation of the potential reduction in ambient noise resulting from the Slowdown trial could be more effectively assessed using the same timeframe.
Determining Trial Speed and Length
In evaluating what may be an appropriate speed for conducting the Slowdown trial, several factors were considered. These included an evaluation of the potential benefits of noise reduction to SRKW, potential economic impacts to industry from reduced speed, lessons learned from other jurisdictions (Parrott et al., 2016), and most importantly, navigational safety.
An evaluation of what would be considered a safe speed for navigation of deep-sea vessels in Haro Strait was conducted in consultation with the ECHO Program’s advisory working group and vessel operators committee, which includes the BC Coast Pilots, Pacific Pilotage Authority and Canadian Coast Guard. Given the constrained waters of Haro Strait, combined with the high currents frequently encountered in this area, a target speed of 11 knots (measured as speed through water) was requested to achieve maximum potential benefit to underwater noise reduction, without compromising navigational safety.
The trial Slowdown region is located within an established Compulsory Pilotage Area as defined by the Pacific Pilotage Authority Regulations (Pilotage Act, 1985). These regulations require that every commercial vessel that is over 350 gross tons, and every pleasure craft over 500 gross tons requires pilotage while in Compulsory Pilotage Areas. The BC Coast Pilots guide ships coming in or out of ports that traverse Canadian waters to ensure safety, efficiency and environmental protection. In this report, we refer to these deep-sea commercial or larger pleasure crafts as “piloted vessels.” Based on historic vessel traffic data, at least 400 piloted vessels a month would be expected to transit Haro Strait. As we didn’t know ahead of time how many pilots would participate in the slowdown, we estimated that a 2-month trial period would provide an adequate number of vessel transits to allow statistical analysis of the effects of the slowdown on vessel noise emissions and total ambient noise, while also balancing the likely impact to industry and the potential benefit to SRKW at a time of year when whales are historically present (Olson et al., 2018).
Verification of Vessel Speeds
The equipment used to monitor vessel speed during the trial included two Automated Identification System (AIS) receivers to provide information such as vessel type, speed and draft on each AIS-enabled vessel transiting Haro Strait. One AIS receiver was positioned atop Observatory Hill, approximately 17 km to the west of the Haro Strait hydrophone deployments and one in Lime Kiln State Park on San Juan Island. These data were used to monitor piloted vessel tracks and were used to assess vessel speed and participation within the 16 nm Slowdown region during both the Baseline and Slowdown trial periods.
The international shipping industry AIS data records only speed over ground, thus vessel transit data was adjusted for tidal current to yield speed through water. Using the two AIS receiver stations (Figure 1) and a NOAA reference site at Kellet Bluff (48.588 N, -123.237 W) at the north east end of Haro Strait contributing modeled tidal current, we adjusted average vessel speed over ground to vessel speed through the water by incorporating vectors of tidal current over the designated trial area.
Acoustic Monitoring of Slowdown Trial
Four fully calibrated hydrophone stations collected acoustic data during the study. Two underwater listening stations (ULS) were equipped with JASCO Autonomous Multichannel Acoustic Recorders (AMARs) and placed directly adjacent to the inbound (northbound) and outbound (southbound) shipping lanes in Haro Strait at water depths of 203 m, and 248 m (Figure 1). A third cabled hydrophone was installed in 23 m water in front of the Lime Kiln State Park lighthouse, a point on the western side of San Juan Island, Washington State (48.51° N, -123.15°W, Figure 1). This cabled hydrophone recorded ambient noise levels at the core of SRKW summer foraging area. The Strait of Georgia Underwater Listening Station, a fourth ULS, was used in the evaluation of the Slowdown trial. This station was situated outside of the Slowdown region on the seabed at approximately 170 m water depth, in the northbound traffic lane, approximately 30 km southwest of Vancouver in the Strait of Georgia (49.04° N, 123.32°W; Figure 1 inset), and 30 km past the Slowdown trial region. Noise data from all four stations were digitized and post-processed in a similar manner following methods described in Merchant et al. (2013) to allow for comparison across sites and time.
Vessel Source Level Methodology
Underwater source levels of marine vessels generally increase with speed due to associated increases in machinery vibration and propeller-induced cavitation (Ross, 1976; Arveson and Vendittis, 2000; McKenna et al., 2013). The most widely applied formula for scaling source levels with vessel speed is Ross’s power-law model (Ross, 1976), which relates changes in source level (SL) to relative changes in speed (v) according to the following formula:
In this equation, ‘SL’ is the source level at ‘ν’ speed through water, ‘SLref’ is the source level at ‘vref’ some reference speed, and ‘Cv’ is a scaling coefficient corresponding to the slope of the curve. Different trends of source level versus speed (including negative trends) may be accommodated by adjusting the value of the scaling coefficient, Cv. Scaling coefficients for different categories of vessels were collected during the Slowdown trial. A power law relationship between source level and vessel speed was strongly supported by vessel noise measurements collected on the two AMARs situated adjacent to the northbound and southbound vessel traffic lanes (MacGillivray and Li, 2018a).
Vessel source levels were calculated before, during, and after the trial on three of the ULS hydrophones to determine the effect of slowdowns on noise emissions for five vessel categories (Bulker/General Cargo, Containership, Car Carrier, Tanker, and Cruise). Source levels were calculated using an automated system that tracked vessels on AIS as they passed the ULS hydrophones. The system analyzed 1/3-octave band SPL from each vessel, inside a data window encompassing ±30° of its closest point of approach to the hydrophone, according to the methods specified in the ANSI ship noise measurement standard American National Standards Institute [ANSI] (2009). A monopole SL was calculated for each vessel measurement by adjusting the received SPL for the propagation loss, using a hybrid propagation model from 10 Hz to 64 kHz. The hybrid model computed transmission loss in 1/3-octave bands, using the parabolic equation method, wavenumber integration method, or image ray method (Jensen et al., 2011), depending on the frequency and distance of the vessel from the hydrophones. Additional details regarding the automated source level measurement system are given in Hannay et al. (2016).
To ensure high data quality, only source level measurements with closest points of approach of less than 1,000 m from the hydrophones were accepted for analysis. In addition, an experienced acoustic analyst performed a manual quality review of every source level measurement. Source level measurements that contained interference from other vessels, had high levels of background noise, or traveled at irregular speeds on indirect (not straight) tracks were rejected.
Analysis of 1317 source level measurements from the Haro Strait ULS hydrophones provided the estimates of sound level reductions for five categories of piloted vessels transiting the Slowdown region (Table 1, MacGillivray and Li, 2018a). The source level reductions for the piloted vessel categories were calculated by comparing measurements of vessels traveling at normal speed before and after the trial (i.e., the Baseline group) with measurements of vessels traveling reduced speed during the trial (i.e., the Slowdown group). The estimated reductions were also crosschecked against measurements of piloted vessels outside of the Slowdown region at normal speeds on the Georgia Strait ULS hydrophones and found to be consistent. Frequency-dependent speed-scaling coefficients were calculated from the estimated reductions for each vessel category (Table 1). These frequency ranges were based on the three frequency bands that were identified by the Coastal Ocean Research Initiative working group as relevant to the acoustic quality of SRKW habitat (details in Heise et al., 2017):
1. Broadband (10–100,000 Hz), for evaluating behavioral or physiological effects.
2. Communication masking (500–15,000 Hz), for evaluating effects of noise on communication space.
3. Echolocation masking (15,000–100,000 Hz).
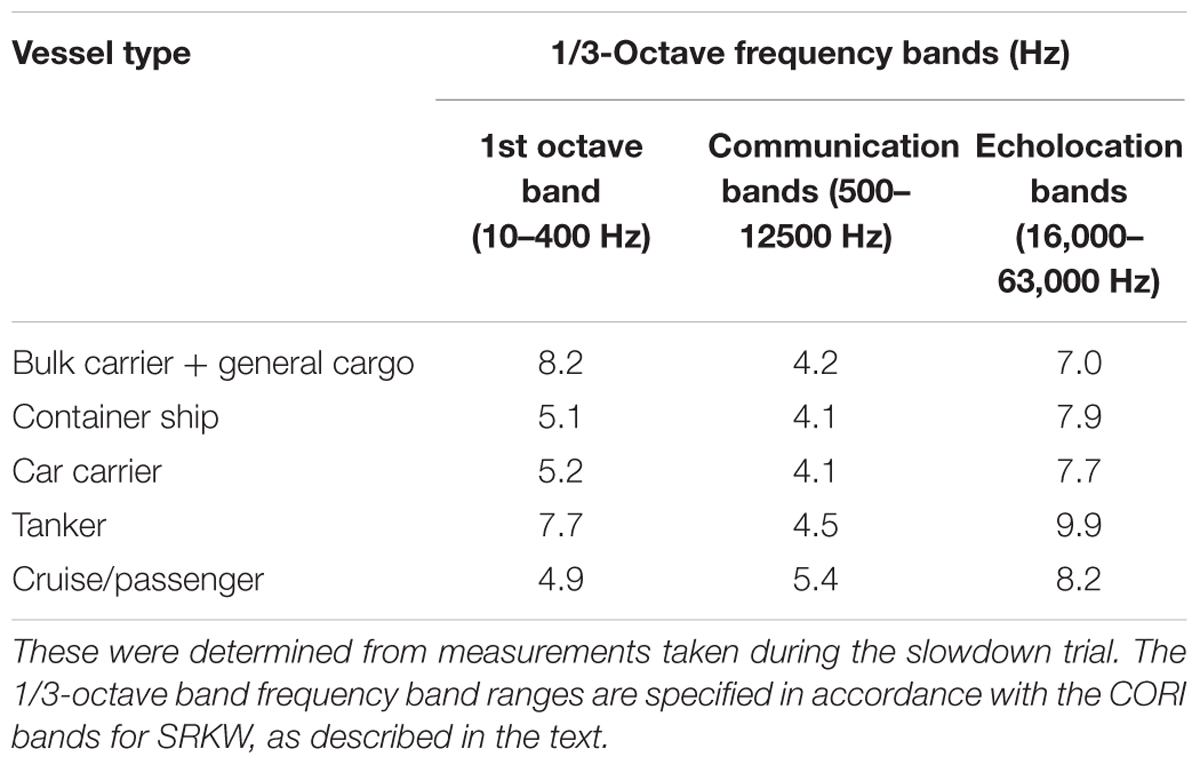
Table 1. Power-law scaling coefficients of monopole source level (SL) versus speed (Cv) for the bulk carrier and general cargo, container ship, car carrier, tanker, and cruise/passenger vessel categories.
The frequency divisions between these three bands do not line up exactly with the divisions between the standard 1/3-octave bands used in the regional vessel noise model, thus scaling coefficients from the trial were assigned to the closest matching frequency bands (Table 1). Scaling coefficients in the 10–400 Hz bands approximately correspond to the broadband value since overall vessel source levels are dominated by noise below 500 Hz. These frequency-dependent scaling coefficients were used to model the effect of speed reductions on vessel source levels and used as input to the regional vessel noise model (MacGillivray and Li, 2018b).
Average frequency-dependent source levels were calculated for 14 different vessel categories (including the 5 Slowdown trial categories, described above), based on a database of 2,705 source level measurements collected by the ECHO program during 2015–2017 (MacGillivray et al., 2018), supplemented with additional source level measurements for small passenger and recreational vessels (Erbe, 2002; Veirs et al., 2016). The limited number of vessel categories applied in this study could not, of course, completely capture the large variety of different ship classes and designs in the study area (a full list of vessel types can be found in Supplementary Material). Nonetheless, we expect these source levels model to accurately represent average noise emissions of the different vessel categories in the study area.
Regional Vessel Noise Model
The regional vessel noise model combines vessel tracking data, vessel sound emission data, ambient noise levels (without vessels present), and environmental data describing how sound attenuates through the water column for the study area, to predict the vessel noise on a computational grid. Vessel sound emissions are determined by referencing a database of source levels (according to vessel type and speed), and the transmission of the sound from each AIS-enabled vessel according to a database of pre-computed propagation loss curves for the Slowdown region. Both the time of departure and the choice of inbound or outbound route were randomly selected for each simulated vessel movement. Each trip was displaced slightly from the center of the route in a randomized fashion, to represent the observed distribution of traffic along the shipping routes (rms width of the vessel traffic varied from 440 m at the north end of the 11-knot Slowdown boundary to 600 m at the south end). Other vessel traffic, which included non-piloted vessels and piloted vessels bound to and from the United States, were simulated based on actual historical AIS vessel tracks for a representative day in summer. AIS data were obtained from the community-based MarineTraffic ship tracking service2. Vessel tracks from the AIS data were assigned to one of 14 different source level categories, based on their vessel type classification from MarineTraffic (Supplementary Material). Movements of other vessels were held constant between the Baseline and Slowdown model scenarios except for the ferries sailing between Sidney and San Juan Island that participated in the Slowdown trial. This ensured that the contributions of those vessels to the soundscape were constant and did not affect the relative metrics of the trial results.
We applied the cumulative vessel noise model developed by JASCO (described in MacGillivray et al., 2014) to develop time-dependent noise maps from merged vessel tracking data, piloted vessel sound emission estimates, vessel speed-scaling data for this region, ambient noise levels (without vessels present), and environmental data. These inputs describe how sound attenuates through the water column for the study region. The noise model does not account for non-AIS enabled vessels (primarily small boats under 350 gross tons), since insufficient information on the movements of these types of vessels was available for the study area.
Simulation scenarios of movements of piloted vessels through Haro Strait were designed to help inform management of realistic operational scenarios under “average” (14 vessel transits/day) and “high” (21 vessel transits/day) traffic volumes at a range of transiting speeds (Table 2). The “Baseline” vessel speed categories describe piloted vessels under normal operating conditions without slowdown restrictions. The “11-knot” vessel speed scenarios assume all piloted vessels observed the 11-knot slowdown speed. The “trial mean speeds and participation percentages” was matched to the same vessels moving at the participation rates and associated transit speeds recorded during the Slowdown trial. The number of piloted vessel transits for each vessel category on an “average” and “high” volume day were derived from ship traffic data provided by the Pacific Pilotage Authority. The regional vessel noise model used a 24-h time period to describe vessel transits, thus the participation rates used for modeling vary slightly from the average reported participation of the 61-day Slowdown trial. For example, if an average traffic day has eight bulker transits, and trial participation rate over all trial days for bulkers was 55%, this translates to 4.4 bulkers per day participating. As a portion of a vessel cannot be described in the regional vessel noise model, instead the closest integer number would represent the “participation percentage” in the model (i.e., 4 of the 8 bulkers in this example, or 50% participation rate, Table 3).
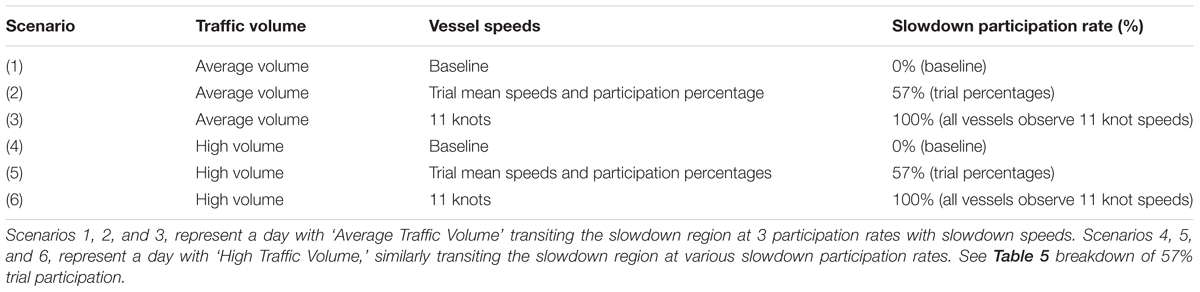
Table 2. Six Modeling Scenarios described by the regional vessel noise models.
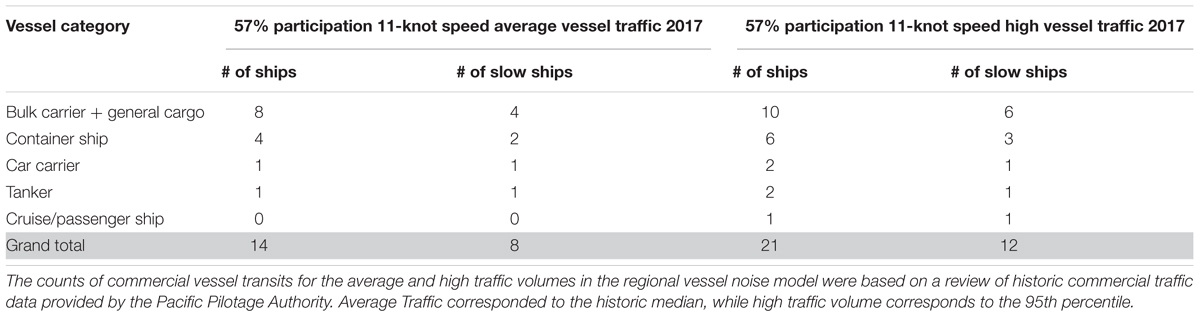
Table 3. A comparison of average observed number of piloted commercial vessels per day during the 61 days slowdown period, and the assumed transit numbers for average and high traffic volume scenarios.
Time-snapshots of underwater noise levels were then simulated to generate sequences of two-dimensional maps, or “snapshots,” of the dynamic sound field, providing sound pressure level as a function of easting, northing, frequency, and time of day. These time snapshots of simulated underwater noise levels provide broadband (9 Hz to 78,000 Hz) sound pressure level (SPL, dB re 1 μPa) and 1/3 octave band SPL centered on (high frequency) 50 kHz (PSD, dB re 1 μPa2/Hz) for vessels transiting the Slowdown region. We refer to these time snapshots as the Broadband and the 50 kHz noise distribution maps. The temporal resolution of these noise distribution map files was 1-min duration covering all 1,440 min in a 24-h period. The 1-min map files were then processed into 288 5-min summaries using the 5-min maximum for each time interval for each of the Broadband and 50 kHz maps. As killer whales are moving in three dimensions, and the propagation of noise necessarily involves inherent uncertainties due to imprecise environmental data (Weilgart, 2007), this was considered a conservative approach to account for variability and errors over a 200 m grid region occupied by a foraging SRKW. The spatial resolution of both broadband and 50 kHz noise distribution map files was matched to the 200 m by 200 m spatial resolution of the SRKW density surface.
Lime Kiln Listening Station, and Ambient Noise Assessment
At the Lime Kiln listening station, received SPLs and PSD were calculated for each 1-min period across two Baseline lunar months (9 July to 8 August 2017 and 18 August to 16 September 2016) and two Slowdown trial lunar months and then linked to 1-min AIS vessel transit information. Lunar month broadband SPLs were compared using all recorded 1-min noise data, but this perspective does not take into account differences in the number of vessel transits, the speed compliance level observed, nor the effect of weather, tidal currents or the influence of small boat presence.
We therefore undertook a fine-scale comparison focusing on periods when piloted vessel were within a 6 km detection zone around the Lime Kiln listening station. The effects of key confounding covariates were minimized by excluding times when (a) small boats were detected by the acoustic detector, (b) current speed was high (values above 25 cm/s), and (c) wind speed was high (values above 5 m/s). Rainfall for both time periods was found to be infrequent and not considered confounding, with just a handful of days of precipitation in both periods (all <6.5 mm). Cumulative distribution functions (CDFs) were plotted for each month and mean differences and differences in 5th, 50th, and 95th percentiles of SPL dB were determined.
Southern Resident Killer Whale Noise-Exposure Model
To evaluate the effect of the commercial vessel Slowdown trial, we built a simulation model based on empirical results from species-specific studies in the region. These studies describe the behavioral and masking effects of noise-exposure from passing vessels on SRKWs. Across each day of the Slowdown trial, the noise-exposure model accumulated the number of occasions each (simulated) whale received noise at levels that were assumed to temporarily inhibit or disrupt its ability to forage, either from an associated change in behavioral state (i.e., from foraging to traveling, e.g., Lusseau et al., 2009; Goldbogen et al., 2013), or alternatively via masking of echolocation clicks (Au et al., 2004). Simple assumptions around the ‘dose’ (received level) then inform the severity of the whale’s response which relates directly to the decrease in SRKW foraging opportunities (time).
The model requires fine-scale information on SRKW habitat use and monthly presence for the model region. A relative SRKW spatial density surface at 200 m grid resolution was estimated from an 11-year synthesis (2001–2011) of effort-corrected sightings within the Salish Sea (methods follow those in Olson et al., 2018). Members of the SRKW population belong to one of three socially distinct units (i.e., J, K, or L pods). For each of the three SRKW pods, we summarized their occurrence according to the pod’s presence in August, September and October within the Slowdown region.
We developed two SRKW-specific sigmoidal dose-response functions (Figure 2; US Navy, 2008, 2012; Finneran and Jenkins, 2012) using empirical studies collected in the coastal waters of the Salish Sea, and/or Johnstone Strait just north of the Salish Sea. The functions were based on ‘low’ (Low) and ‘moderate’ (Mod) severity responses (Southall et al., 2007) to ambient noise levels observed on 45 occasions corresponding to three regional resident killer whale datasets (surface observations via theodolite, movement and vocal behavior using suction tags and vocal compensatory behavior based on hydrophone data) (Supplementary Material).
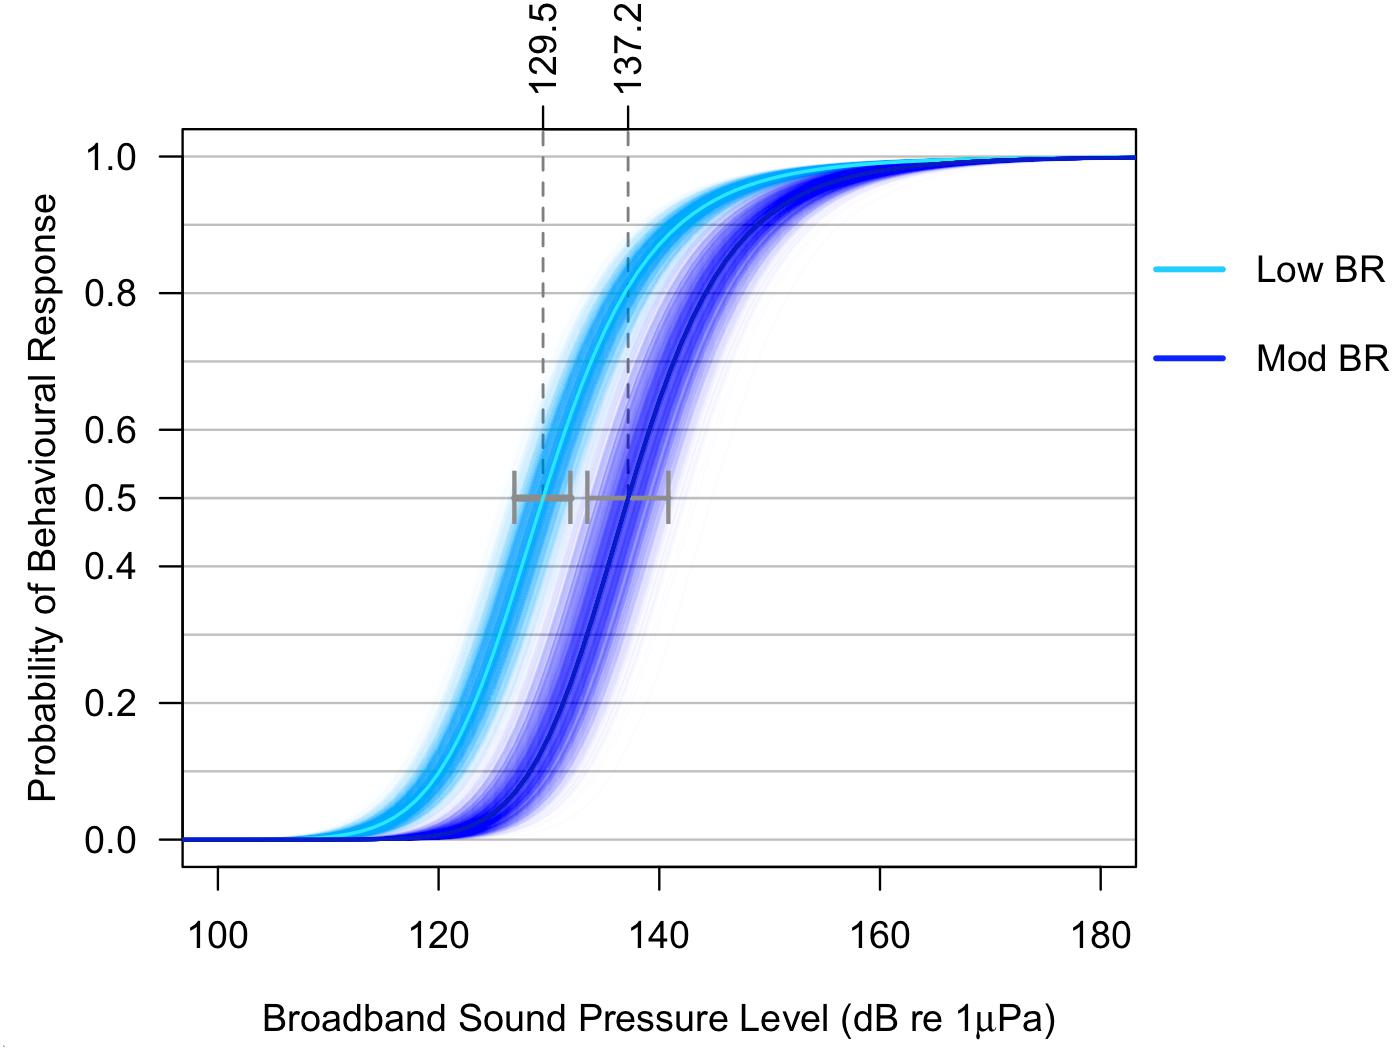
Figure 2. Simulated dose-response curves for low and moderate severity responses. Variability in the dose-response relationship was included in the noise-exposure model as seen in this figure. The 95% CI are shown as gray horizontal error bars at 50% probability of a Low and Moderate (Mod) behavioral response (BR), and are derived from a regression equation of northern and southern resident killer whales responding to commercial vessel noise (see Supplementary Figures and Supplementary Methods for more details on approach).
Using a theodolite, the swim speed, dive time, and surface-active behaviors including respiration rates of the closely related northern resident killer whales were measured when tugs, cargo vessels and cruise ships transited past the whales (Williams et al., 2014). Changes in observed behavior were scored based on Southall’s severity scale (Southall et al., 2007) and related to the noise level during the passing vessel. In a second study, Wright et al. (2017) used digital acoustic recording tags (DTAGs) in conjunction with GPS field measurements to record dive depths, whale movement and respiration rates of northern resident killer whales. These data were similarly analyzed for behavioral response to tugs, cruise ships and commercial fish transport vessels and similarly scored based on Southall’s severity scale. In the final study, data from a 2009 passive acoustic monitoring study at Lime Kiln listening station measured changes in frequency and amplitude of SRKW calls in response to passing commercial ship traffic. These amplitude changes were also scored using an adaptation of Southall’s severity scale. (Further details of the data and approach can be found in the Supplementary Material).
Underlying the dual dose-response relationship is the concept that at higher received noise levels, there is a higher probability of a disruption in behavior and that this disruption has the potential to last longer than the time period of the dose (e.g., through a switch in behavior). In other words, the nearer an SRKW is located to a noise source the louder the whale’s received level, and the higher the likelihood a behavioral response occurs. A “Moderate” severity behavioral response (Mod BR) is defined as a moderate to extensive change in locomotion speed, direction and/or dive profile, moderate or prolonged cessation of vocal activity, and/or potential avoidance of area (Southall et al., 2007). Re-analysis of the DTAG data described in Wright et al. (2017) indicated that these effects have an average duration of ∼25 min (SMRU, 2015). At lower received levels (decreased vessel-whale proximity) the probability of a behavioral response declines to zero. If no moderate severity behavioral response is predicted to occur, the model assesses if noise levels are sufficient to trigger a “Low” severity behavioral response (Low BR). A Low BR is defined in the literature as minor changes in respiration rates, locomotion speed, direction or deviation by Southall et al. (2007), but can encompass lost foraging opportunities. The duration of these low severity behavioral responses (BRs) were considered short-term (5 min, or the time it takes a commercial vessel traveling at 18 knots to transit through a 1.4 km radius circle around a SRKW).
The SRKW-specific dose-response relationships had broadband received noise level median threshold values of 129.5 and 137.2 dB re 1 μPa for low severity and moderate severity BRs, respectively (Figure 2). Low and moderate severity BRs had a 1% probability at received noise levels of 111 and 120 dB re 1 μPa, respectively, resulting in approximate response zones of up to 3.8 and 1.4 km from a 320 m container ship traveling at 18 knots. Uncertainty around these dual dose-response relationships was derived from the combined results of the three data input studies (Williams et al., 2014, DTAG, SMRU, 2014; Figure in Supplementary Material), and contributed to the parameter uncertainty in the inputs of the dose response function (Figure 2).
‘Acoustic masking’ is defined as an interference with an individual’s ability to detect, recognize, and/or discriminate sounds such as echolocation clicks. Masking of echolocation clicks can occur even at low broadband noise levels if noise levels in high frequency critical bands are exceeded. The SRKW noise-exposure model aimed to capture this possibility by calculating the degree of additional or residual high frequency masking when no ‘Mod’ or ‘Low’ BRs were predicted. Foraging related echolocation clicks have a peak intensity centered at 50 kHz (Au et al., 2004) and this frequency band from the regional vessel noise model was selected to assess the degree of click detection range reduction due to masking. We followed the Au et al. (2004) approach to modeling echolocation click masking and assumed a maximum click detection range of 250 m based on estimates made from acoustic data collected at Lime Kiln. Modeled click detection ranges were then converted to a proportion of the 250 m maximum click detection range.
The SRKW noise-exposure model methodology is summarized in Figure 3, with expanded details in the Supplementary Material. In summary, the dose-response function is what probabilistically determines whether a Low or Mod BR occurs when the whale is exposed to noise from a passing commercial vessel (e.g., Lusseau et al., 2009). The severity of a single BR (i.e., low vs. moderate) determines the length of time the individual whale is disrupted from foraging. The intensity of the high-frequency (50 kHz PSD) sound levels determines the degree of residual high-frequency masking implied by a proportional reduction in the distance that echolocation is fully inhibited, i.e., complete masking of echolocation clicks (Au et al., 2004). These BRs and residual masking minutes are subsequently converted into a metric termed ‘potential lost foraging time,’ meant to represent the time a whale is potentially inhibited or disrupted from its ability to forage due to excessive received noise levels (with 95% confidence intervals derived using simulation re-sampling). The simulation model acts on individual whales at 5-min resolution, but can be integrated over time, over space or across whales into pod or all-SRKW summaries. In this manuscript, we report the all-SRKW summaries.
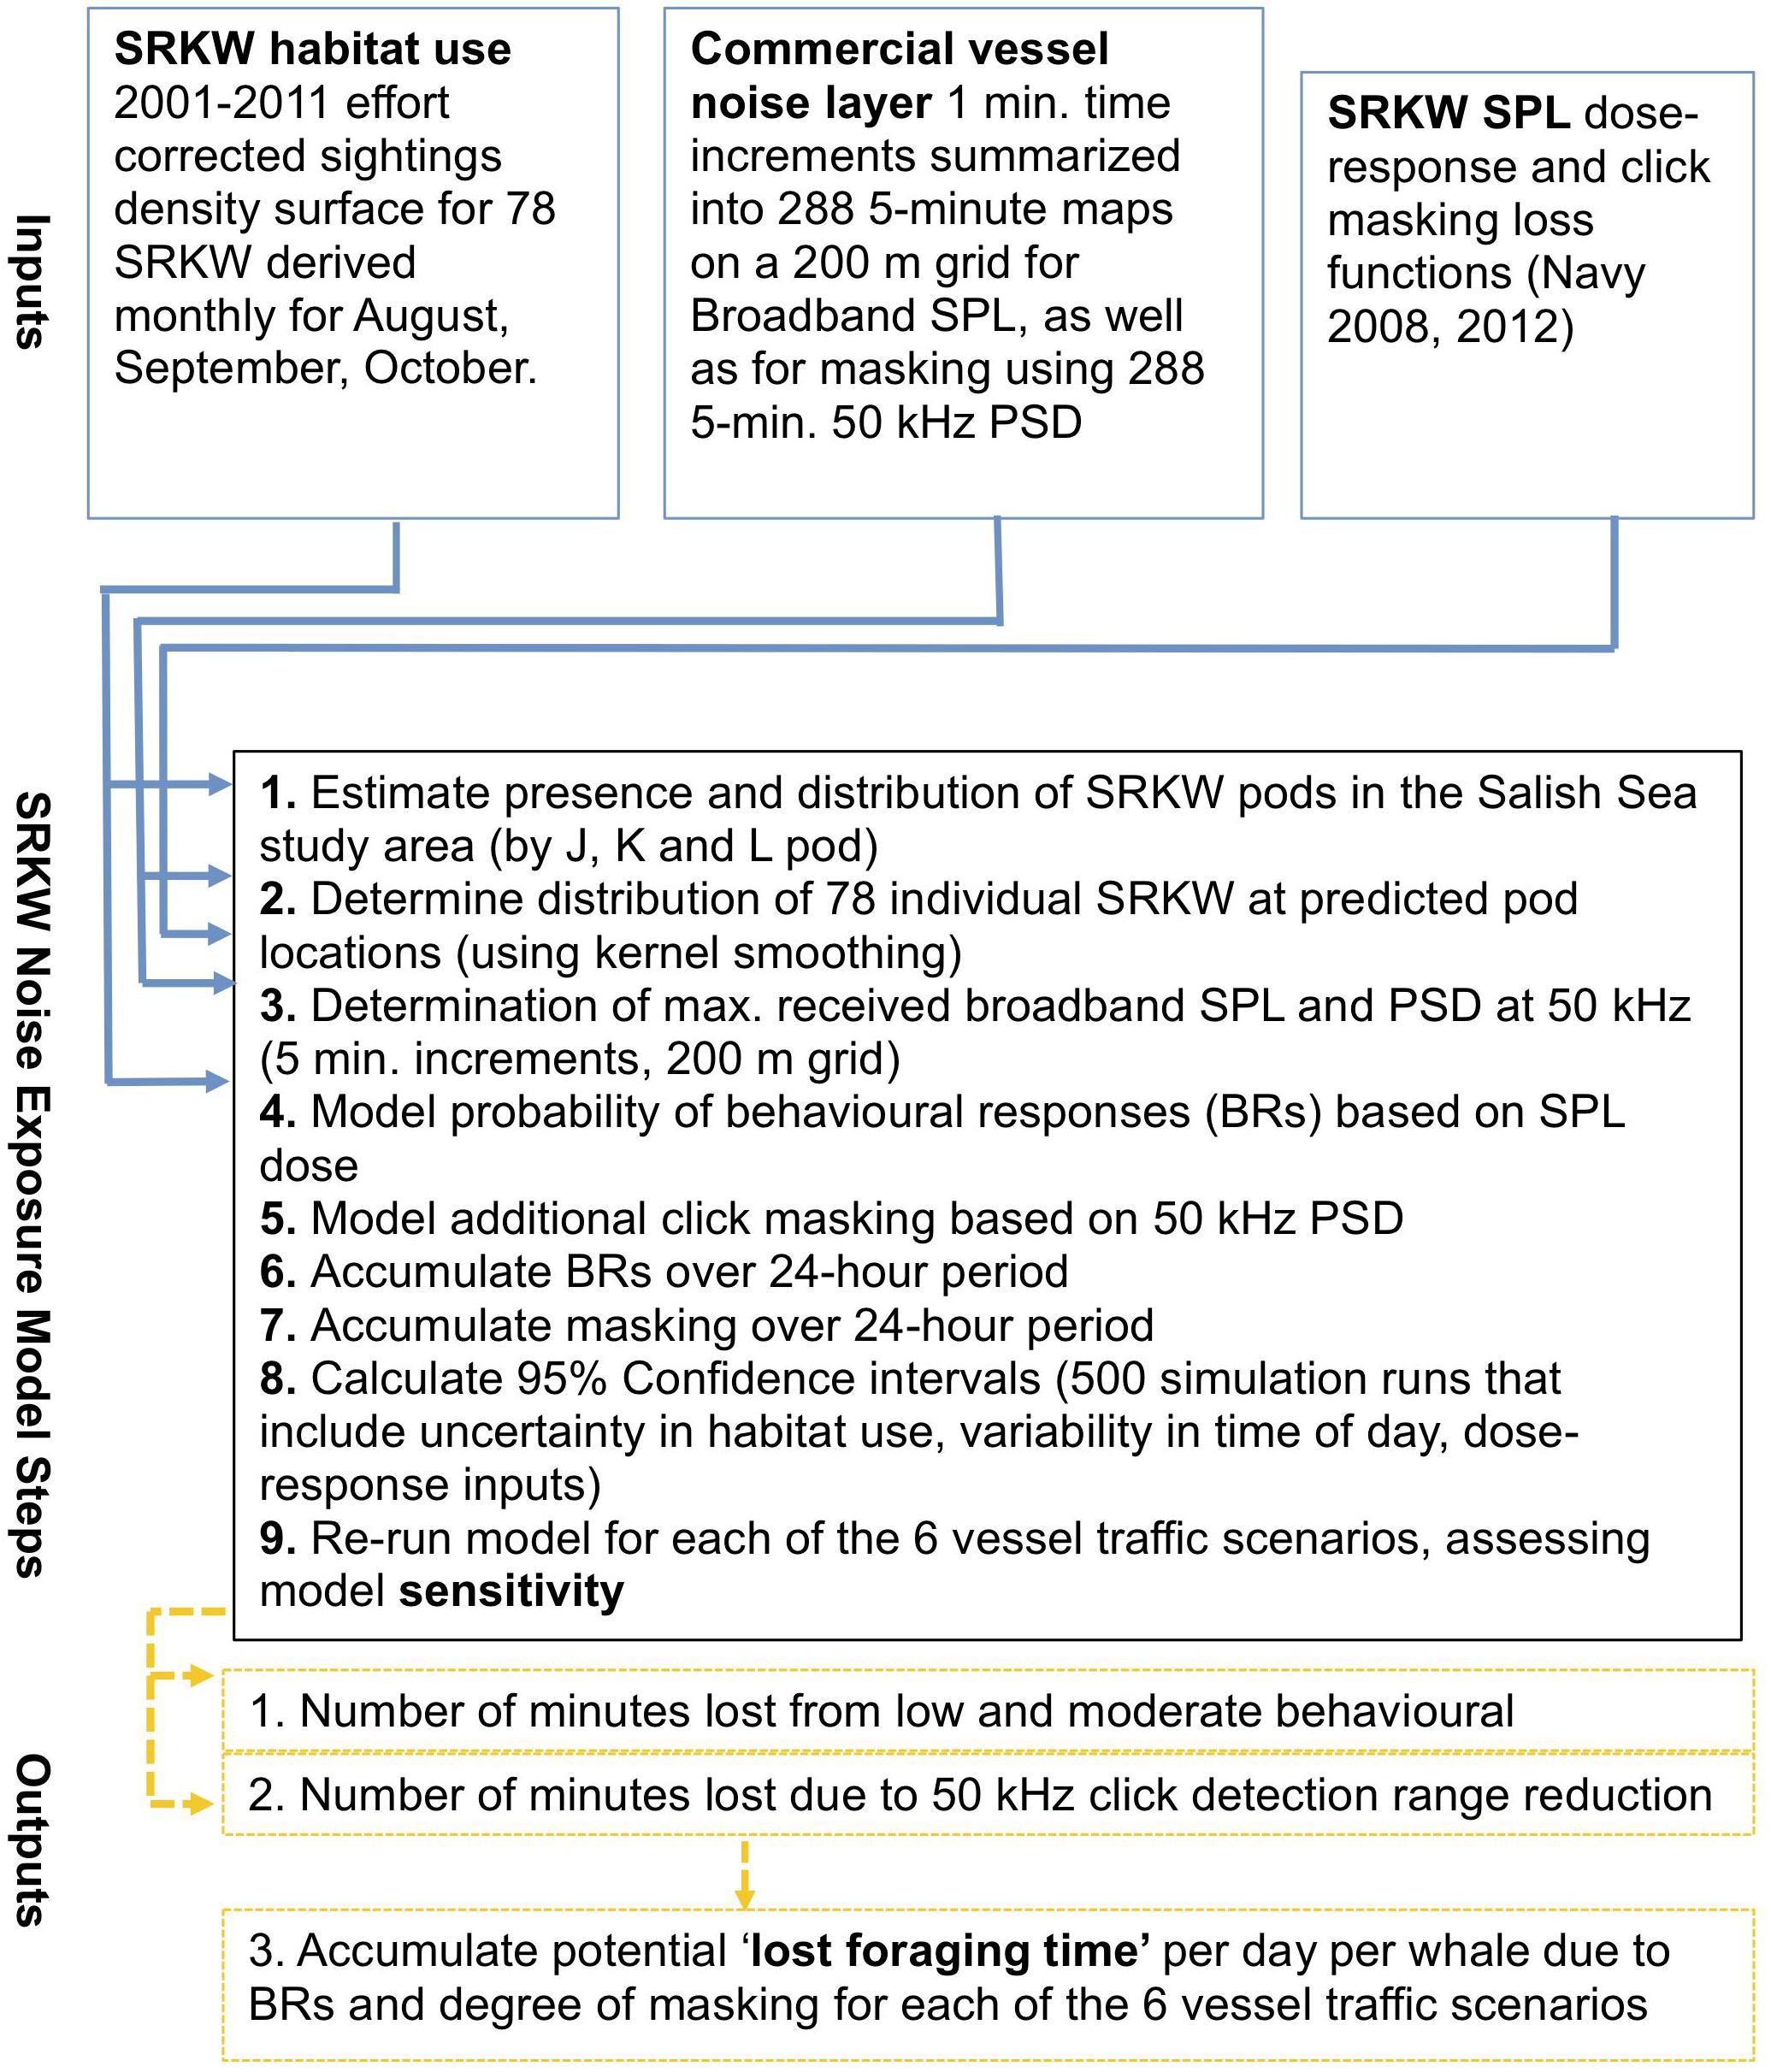
Figure 3. Explanation and pseudocode of noise-exposure simulation model. More details for each of the 9 steps can be found in the Supplementary Material.
The assessment of whether slower vessels had a positive effect on the behavior and foraging of killer whales was determined by comparing ‘potential lost foraging time’ as the output metric from the SRKW noise-exposure model. This lost-time metric was calculated for each of the six traffic scenarios (Table 2), and allowed a comparative exploration of the relative value of various noise mitigation and slowdown participation rates. This delta approach minimizes the effect of the assumptions made as they are applied equally across scenarios.
Results
Trial Vessel Speed (AIS) and Participation
The Pacific Pilotage Authority reported 951 piloted transits of commercial vessels through Haro Strait during the 61-day trial period, from August 7 to October 6 (Table 4). The most common piloted vessel type was bulk or general cargo ships (51.6%), followed by container ships (27.3%), car carriers (9.0%), tankers (7.8%), and cruise ships (3.2%). There were fewer transits during the 2-month Baseline period with 863 piloted transits. The ordering of vessel types is the same for the Baseline as it was for the Slowdown period with most common to least as follows: general cargo ships (53.8%), container (28.2%), car carriers (8.5%), tankers (7.1%), and cruise ships (0.9%).
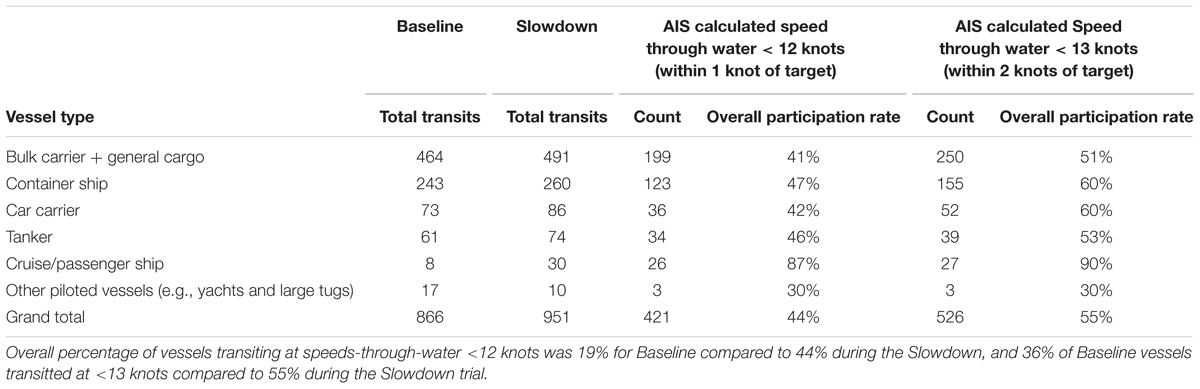
Table 4. Baseline transits, and slowdown participation counts and rates of participation by vessel category.
Vessel speed and participation was monitored using Automated Identification System (AIS) receivers to identify vessel names, vessel type, speed, and location. Median speed reductions varied by vessel type from a 1.8 knot reduction in speed for bulk/general cargo ships and as high as a 7.2 knot reduction in speed for container ships (Table 5 and Figure 4). Speed reductions were paired with increased time to transit the 16 nm of shipping lanes through the Slowdown region, and this ranged from 10.8 to 32.6 extra minutes for bulk/general cargo ships and container ships, respectively, (Table 5). Source level reductions resulting from Slowdown trial participation significantly reduced underwater noise emissions for vessels transiting the Slowdown region (Table 5).
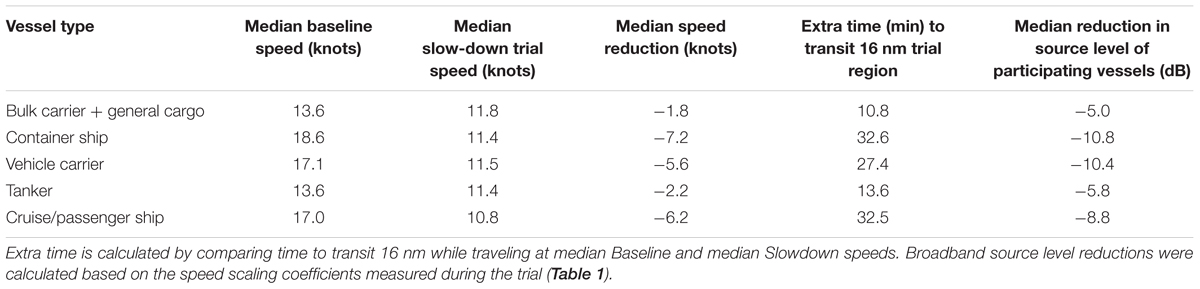
Table 5. Median reductions in vessel speed and source level by vessel category during the Slowdown trial period, based on median measured speeds of participating vessels inside the 11-knot Slowdown boundary.
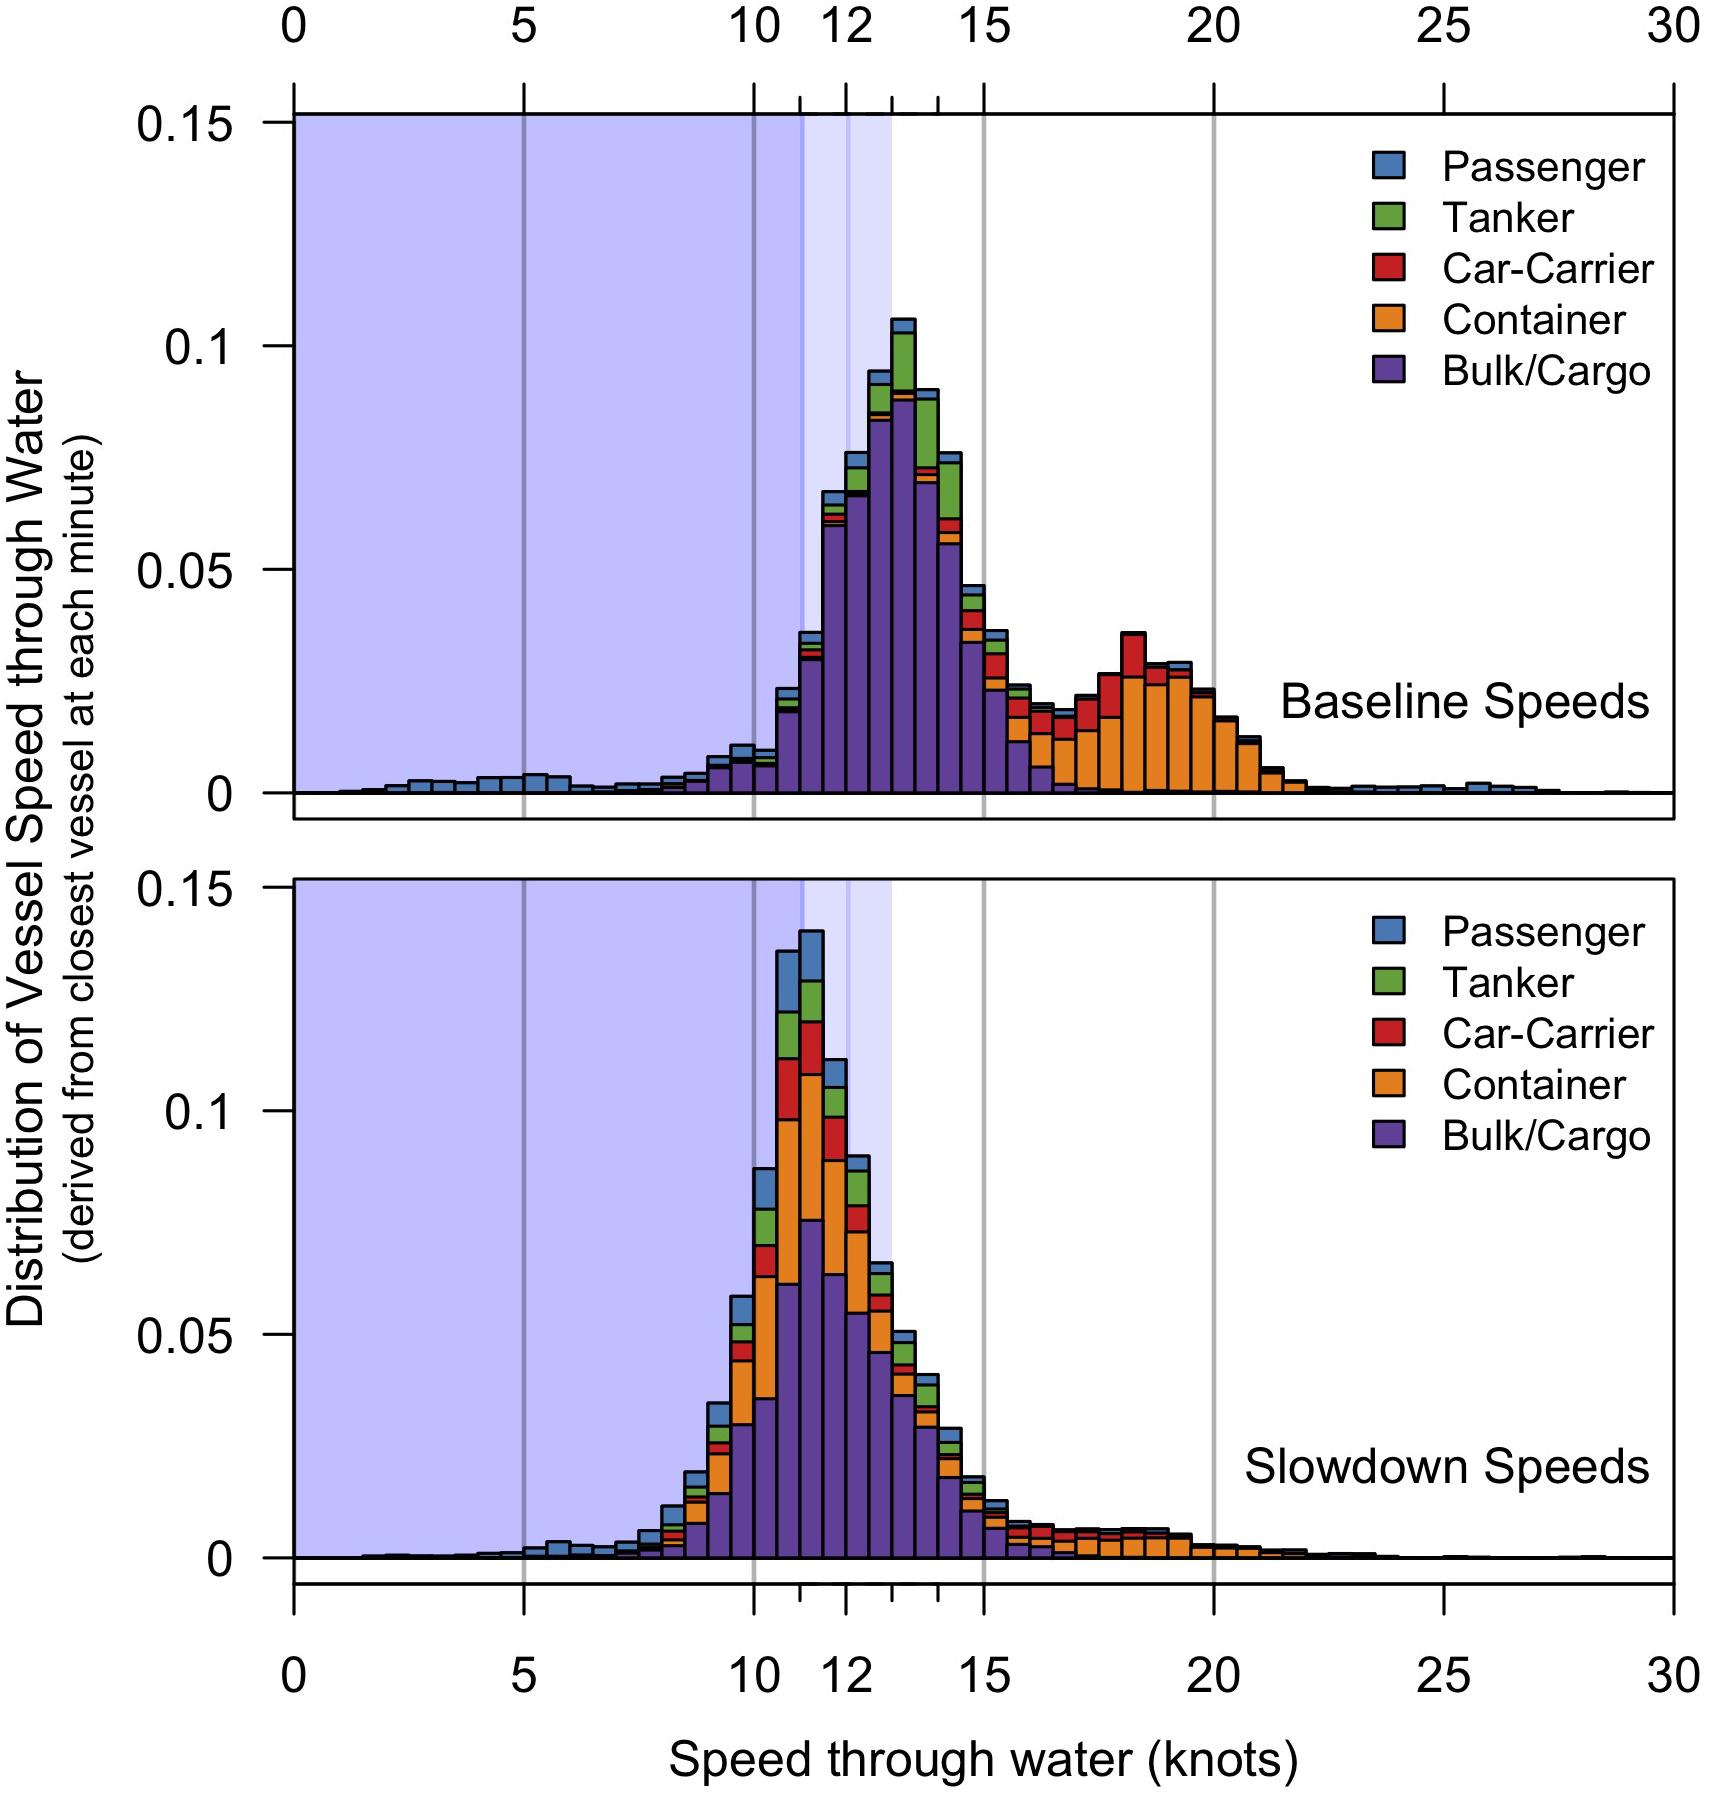
Figure 4. Stacked plot of commercial vessel speeds through water at baseline (Top), and during the slowdown trial period (Lower), by vessel type. For the slowdown participation levels, the target vessel speed through water was set at 11 knots, and AIS-calculated speeds within 1 knot and 2 knots are assessed in the panels relative to x-axis ticks at 12 and 13 knots.
‘Participation’ in the Slowdown trial meant aiming for a speed-through-water of 11 knots and AIS vessel tracking data showed that 37% (350 of 951) piloted transits achieved this slowdown speed-through-water. If we relax the participation cutoff to include any vessel able to maintain speed-through-water of <12 knots, this resulted in an overall vessel participation of 44% (421 of 951 piloted transits; Table 4). Giving leeway for the uncertainty of real-time speed-through-water measurement on ships and post hoc single location current speed estimates used for validation, we considered an additional category for vessel participation that included vessels transiting the region at speeds-through-water of <13 knots. By using this criterion, 55% of vessel transits through the Slowdown region participated in the Slowdown trial (526 of 951 piloted transits; Table 4). The comparative Baseline period logged fewer (866) vessel transits through the study region, and of these 9% transited at <11 knots speed-through water, 19% at <12 knots, and 36% at <13 knots.
For the purpose of modeling ‘observed’ participation in Traffic Scenarios 2 and 5 in the regional vessel noise model (Table 2), the overall observed participation rate of 55% was adjusted upward by 2% to be 57% vessel participation. This was necessary as commercial vessels were broken down by vessel type, and only integer values (counts of whole vessels transiting) were possible as inputs to the regional vessel noise model (Table 3).
Ambient Noise Measurements at Lime Kiln Listening Station
Ambient noise levels were lower during the Slowdown trial compared to Baseline despite the longer transit times past the hydrophone during the Slowdown trial (Table 6). We found reductions in broadband RL when commercial vessels were transiting within 6 km of Lime Kiln (and filtered to exclude confounding noise effects, n = 76,608 min) as well as when comparing all unfiltered data (n = 165,182 min). This is indicated by the divergent cumulative distribution functions of broadband noise (CDFs; Figure 5). The median broadband noise reduction at Lime Kiln for the Slowdown period when large vessels were within 6 km of the site (and filtered to remove heavy wind/current periods and periods of small boat noise) was 2.5 dB (from 116.9 dB re 1 μPa to 114.4), with a corresponding mean (or Leq) reduction of 2.0 dB (from 116.6 dB re 1 μPa to 114.6; Table 6). To put these results into perspective, a noise reduction of 2.5 dB is the equivalent of a 44% reduction in acoustic intensity. At the higher amplitude levels of the broadband noise distribution, noise levels were shifted by 1.4 dB, or a 28% reduction in acoustic intensity (i.e., p95% -1.4 dB).
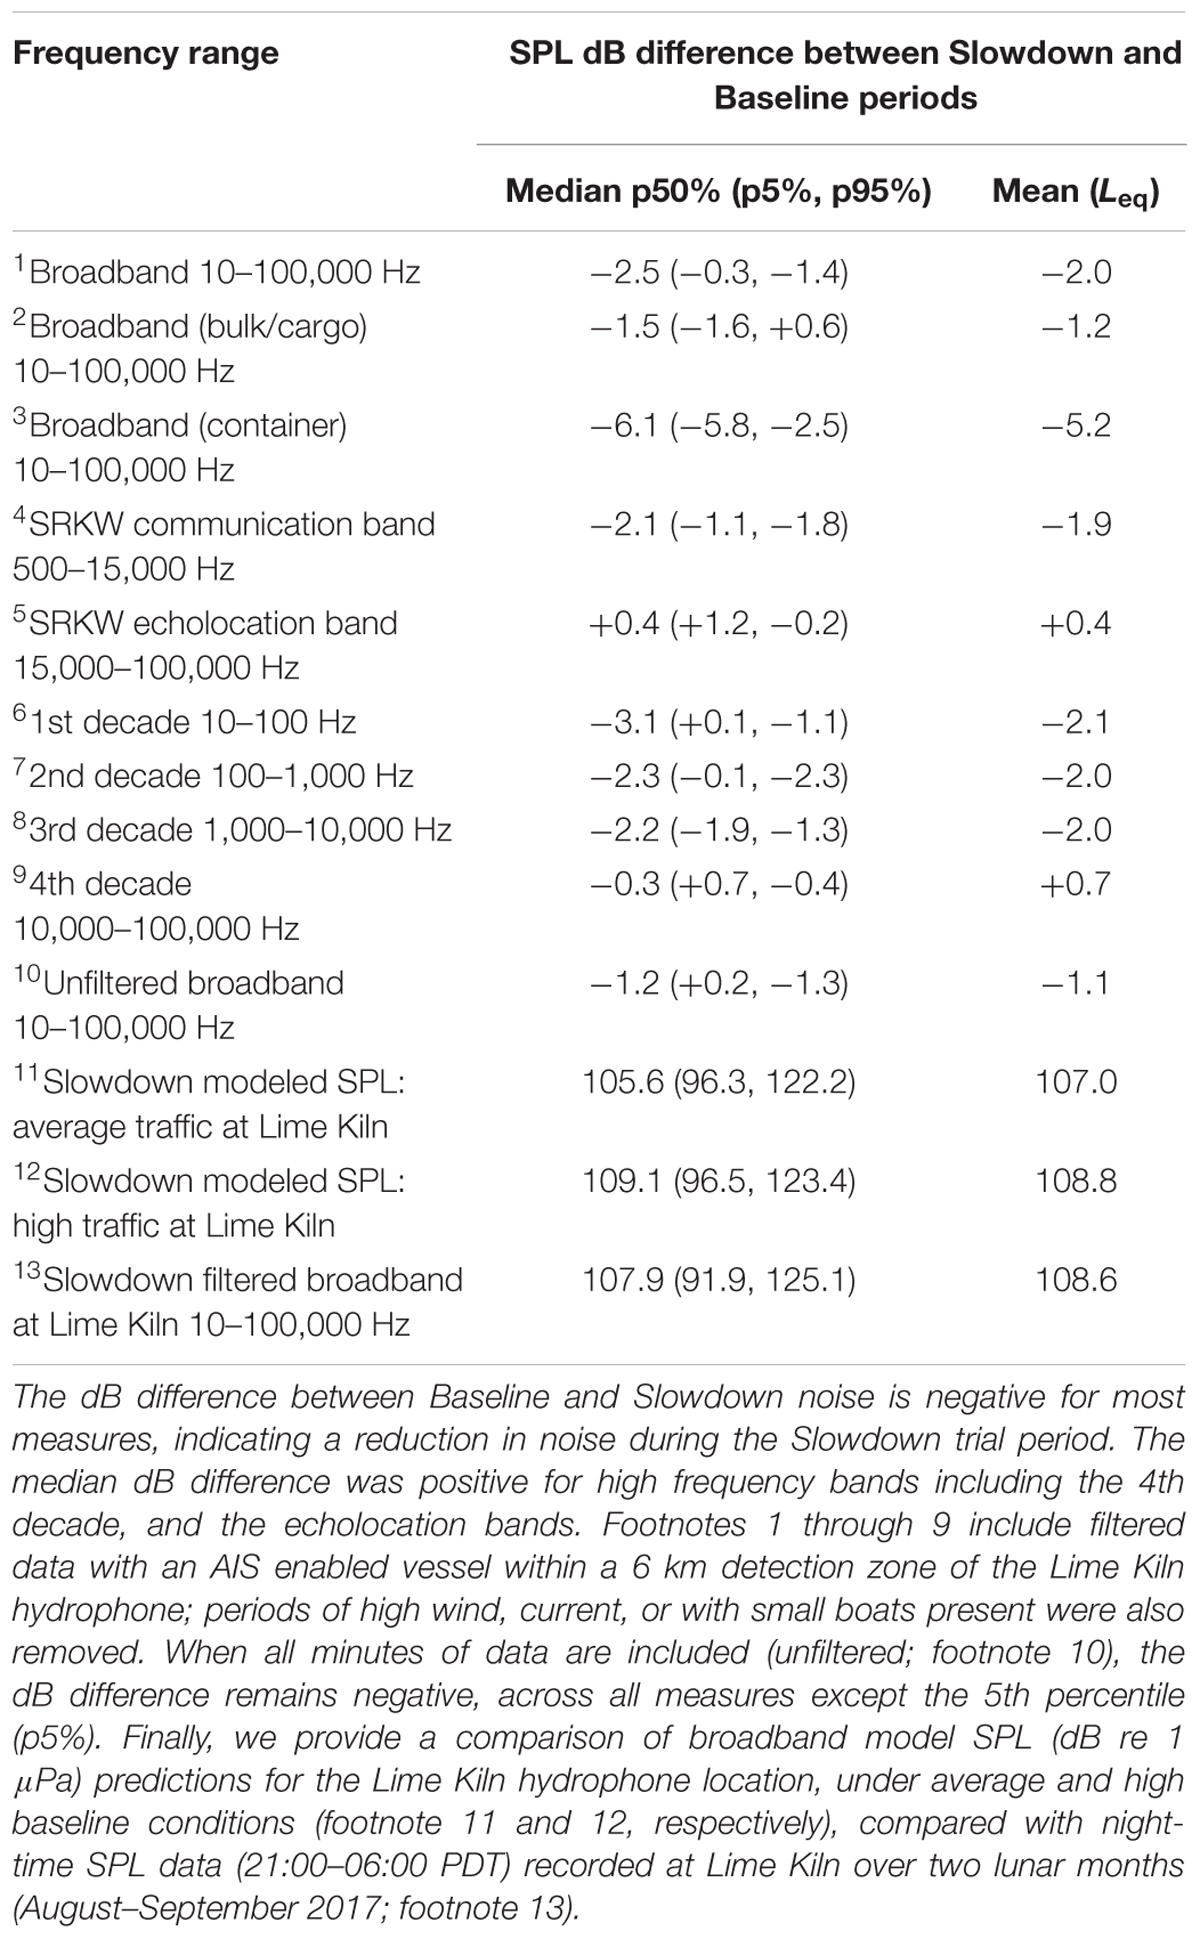
Table 6. Quantiles of the broadband ambient SPL (10 Hz to 100 kHz dB re 1 μPa) for two Baseline months and the 61-day Slowdown trial measured on Lime Kiln hydrophone.
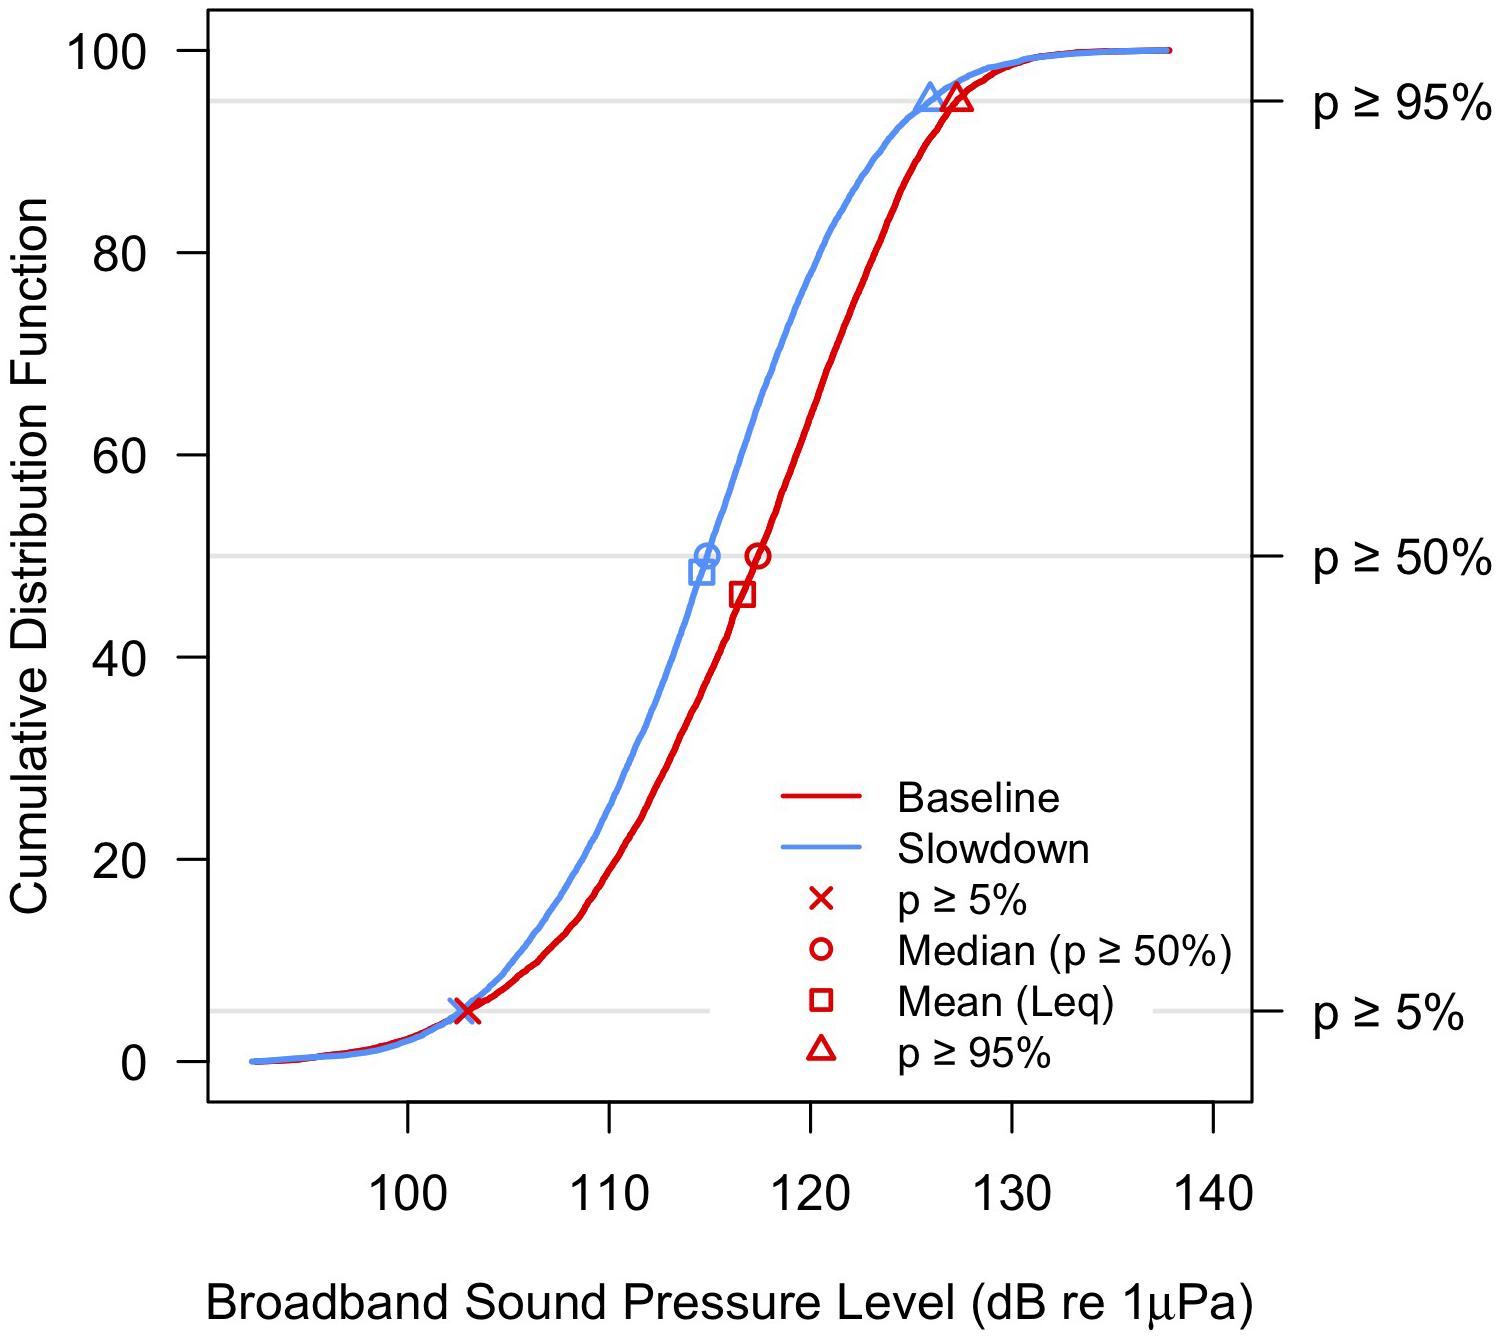
Figure 5. Cumulative Probability Distribution Function integrates the area under the cumulative distribution of 1-min broadband SPL measures (10 Hz to 100 kHz dB re 1 μPa) at the Lime Kiln Hydrophone. Red line and symbols represent data collected during the Baseline period; blue line and symbols corresponds to the 61 days Slowdown period. Only minutes with an AIS-enabled vessel within a 6 km detection zone were included. Times with high wind, current, or with small boat noise present were removed. The dB difference at the 5%, 50th%, and 95th percentile of the CDF (p5%, p50%, and p95%) between Baseline and Slowdown periods is provided in Table 6.
There were sufficient numbers of transiting vessels to allow for Slowdown-Baseline comparisons by vessel type for bulk and general cargo carriers (bulk/cargo combined) as well as container vessels. Median noise levels at Lime Kiln during the Slowdown period were 1.5 dB lower for bulk and general cargo carriers, and 6.1 dB lower for container vessels during the Slowdown period. This reflects the larger (7.7 knots) reduction in average speed for container vessels compared to bulkers and cargo carriers (2.1 knots; Figure 4).
Analysis of the frequency bands that SRKW use for communication (500–15000 Hz; Heise et al., 2017) showed a clear benefit from the Slowdown trial (median reductions of 2.1 dB). However, at the frequencies used by SRKW for echolocation (echolocation masking bands 15–100 kHz; Heise et al., 2017), the noise distribution had shifted upward with a median peak +0.4 dB higher during the Slowdown, but with smaller variance as noise increased at the lower dB levels (p5% +1.2 dB), and decreased at the upper dB range (p95% -0.2 dB; Table 6).
Decade band analysis showed that median Slowdown noise reduction was highest in the 1st decade band (3.1 dB reduction in 10–100 Hz band; Table 6), and lowest in the 4th decade band (10 kHz to 100 kHz band; -0.3 dB). Reductions were 2.3 dB in the 2nd decade band (100–1,000 Hz) and 2.2 dB in the 3rd decade band (1–10 kHz).
Predictions of the noise model were validated by comparing against ambient noise data from the Lime Kiln hydrophone, pooled across the lunar months of August and September 2016 (61 days). In recognition that noise predictions from the model cannot replicate the number and frequency of small, non-AIS boats transits at Lime Kiln during the day, we performed the comparison using night-time Lime Kiln data only, between 21:00 and 06:00 PDT (Table 6). The mean and median model predictions were found to be in good agreement with the data recorded at Lime Kiln, although the overall spread of the model (i.e., difference between 95th and 5th percentiles) was smaller than that of the data. The greater spread of the data was expected since actual range of vessel traffic conditions in the data was greater than the two conditions considered in the model. Furthermore, ambient noise recordings at Lime Kiln will be affected to some extent by flow noise and variations in wind and wave noise that were not included in the noise models. Thus, we consider the SPL predictions as a good representation of noise conditions at Lime Kiln, especially when comparing the night-time period, in which the effects of small boat noise is considerably reduced.
Noise reduction results inferred from comparing Baseline to Slowdown speeds at the Lime Kiln listening station helped parameterize the regional vessel noise model. Compared to Baseline, the regional noise model indicated that the speeds and participation rates achieved during the trial resulted in noise reduction at Lime Kiln of 0.6 dB on an “average” traffic day (14 piloted vessel transits), and 1.5 dB on a “high” traffic day (21 piloted vessel transits). These values fall on either side of a median reduction of 1.2 dB reported at the Lime Kiln listening station (unfiltered data; Table 6), suggesting that for this one location the measured vessel noise reduction was between the average and high vessel traffic day of the equivalent grid output from the regional vessel noise model output.
SRKW Noise-Exposure Model (Behavioral Response Model)
The analysis of potential effects of slower vessels on the behavior and foraging of killer whales was undertaken using the SRKW noise-exposure simulation model. For a piloted vessel to have an effect on a killer whale, the whale must occur in the Slowdown region at the same time a vessel is in transit. The spatial depictions of the median (top panels) and loudest 95th percent noise exposure maps are shown in Figure 6. These panels show, under the assumption of uniform distribution of SRKW, the likelihood for a low behavioral response to occur under different regional vessel noise model scenarios (left to right). The striking difference in probability of observing a behavioral response between the top and bottom panels reflect that the region is without a commercial vessel for >50% of the day and the median response to transiting vessels is similarly low. When a vessel is transiting the region (lower panels D, E, F), the potential for a Low behavioral response is at least 30% across a large spatial region adjacent to the shipping lanes, with important reductions in that footprint as the participation in the 11 knot Slowdown is increased (i.e., less likely in right panels of Figure 6), particularly off of Lime Kiln Point.
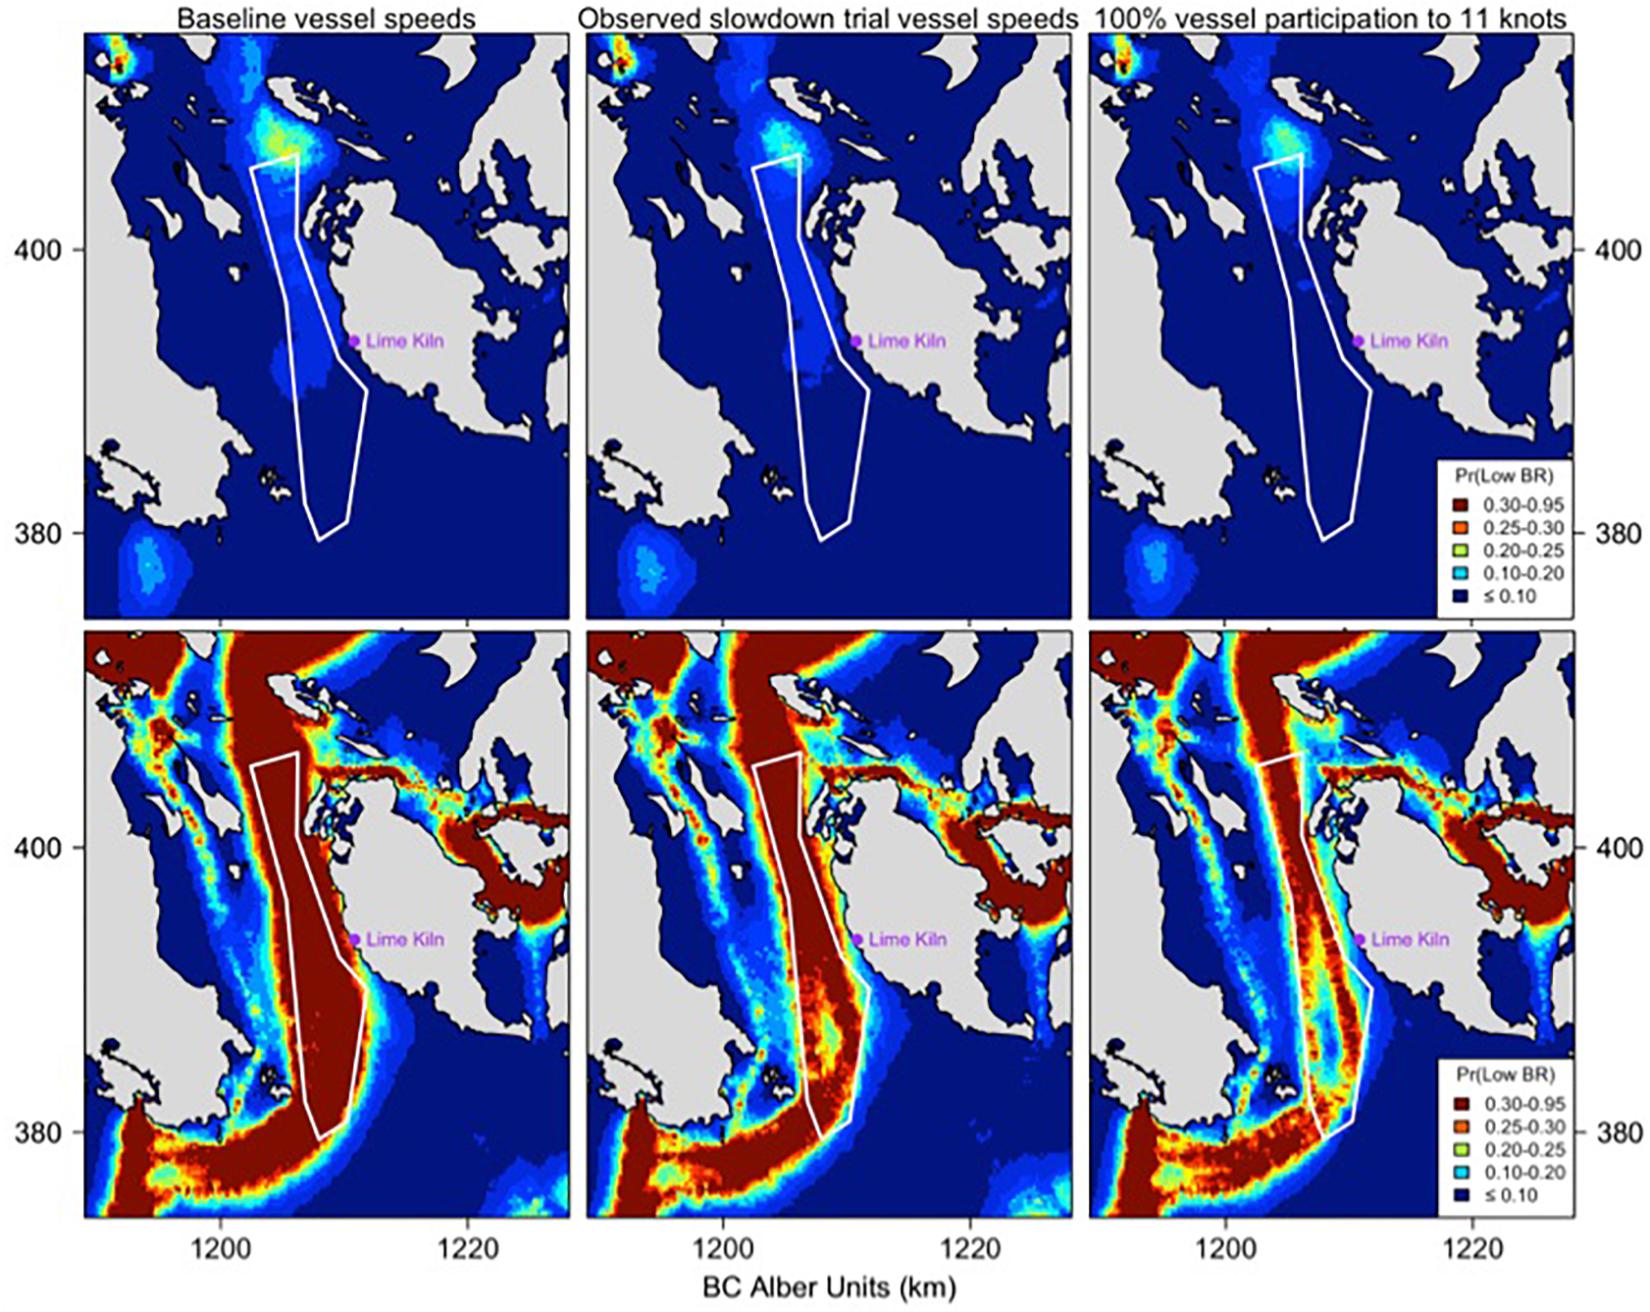
Figure 6. The top panels are the spatially indexed probability of observing a low behavioral response, or Pr(Low BR), by applying the dose-response function to the ‘median’ (p50%) broadband noise level for an average day, under scenarios 1, 2, and 3. The bottom panels are the spatially indexed probability of observing a Low BR given the noisiest 95th percentile (p95%) of the daily broadband noise-exposure under the same three scenarios (1, 2, and 3). If SRKW were uniformly distributed across the region, we would expect the Pr(Low BR) to be related to the color scale of these maps. The three panels represent the different speed scenarios within the slowdown region with Baseline speeds on the left, observed participation in the center, and 100% participation to 11 knots depicted on the right panel. Note that the same color scale is used for all map panels, and the Slowdown trial boundary is represented by the white polygon boundary.
The SRKW noise-exposure model stochastically includes SRKW occurrence according to the spatial model of habitat use (2001–2011 data). As SRKW predominately occur in the Slowdown region in the waters off Lime Kiln Point in Haro Strait, the region of maximum effects on SRKW behavior occurs here (Figure 7). Similarly, by slowing ships transiting past this hotspot of SRKW occurrence, the reductions in the effects of commercial vessel traffic is highlighted by the reductions in the numbers of Low BRs over Baseline scenarios (Figure 7, compare left panels to middle and right panels).
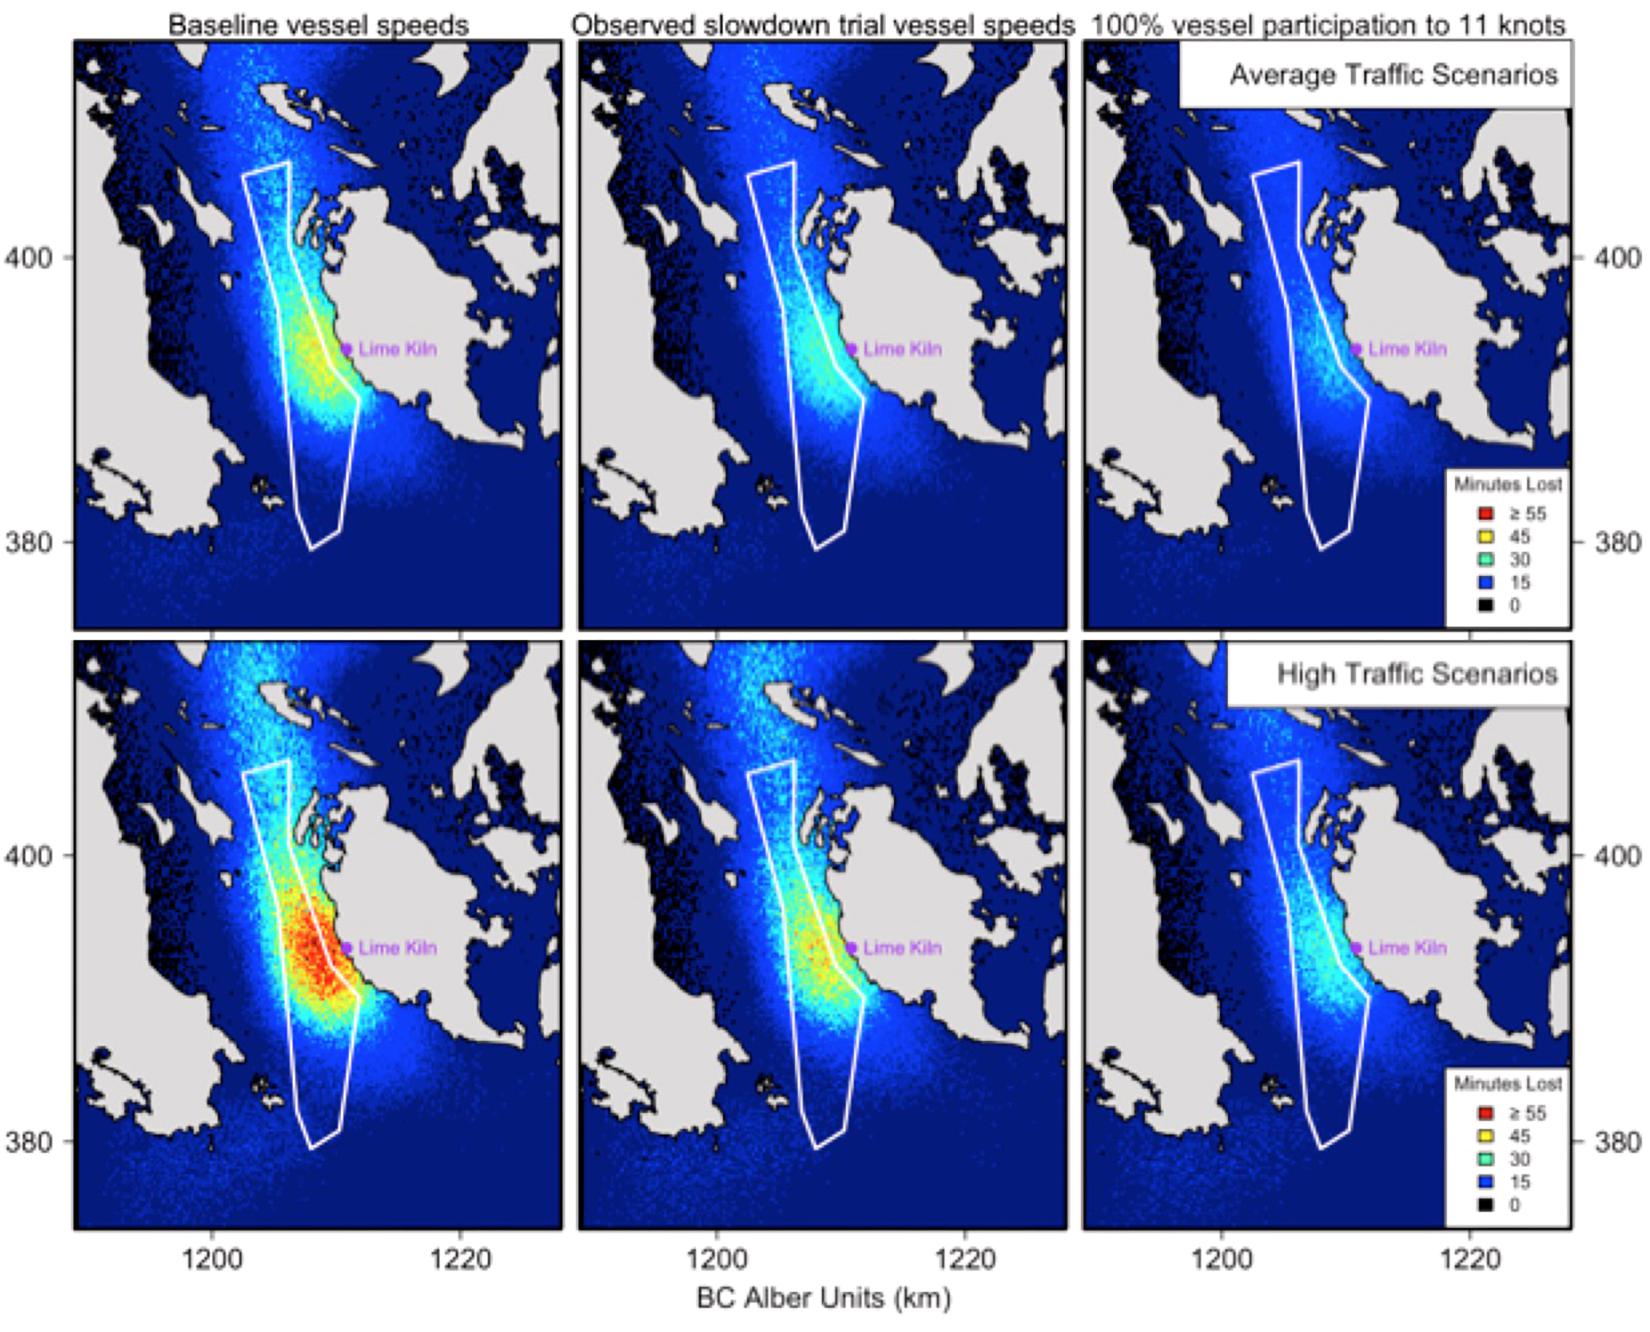
Figure 7. Results of the SRKW noise-exposure model for the Slowdown region accumulated over each of the 288 regional acoustic maps that depict commercial vessel broadband noise over an average traffic day (top three panels, scenarios 1, 2, 3) and high traffic day (bottom three panels, scenarios 4, 5, 6). For a Low BR to occur in the Slowdown region, a SRKW must be present and a commercial vessel must be transiting close enough to the SRKW to elicit a behavioral response. The six panels show the spatially indexed number of minutes of ‘potential lost foraging time’ from a Low severity behavioral responses by a southern resident killer whale. The 11-knot slowdown trial boundary is shown in white.
Collectively, results of the SRKW noise-exposure model indicated that the number of behavioral disturbances from commercial vessel noise declined when vessel speeds were reduced (Figures 8, 9). The median ‘potential lost foraging time’ from low-severity BRs (5-min disruptions) and moderate severity BRs (25-min disruptions) decreased by 29 and 20% per day per whale for the modeled trial (i.e., under 57% participation) compared to Baseline conditions with average traffic volume and speeds. This ‘potential lost foraging time’ was particularly reduced in moderate BRs declining by >50% for a model scenario when all vessels observe speeds of 11 knots (compared to Baseline; Figures 8, 9). There were negligible changes in residual click masking across scenarios reflective of the smaller shifts in SPL in the 4th decade band (Table 6).
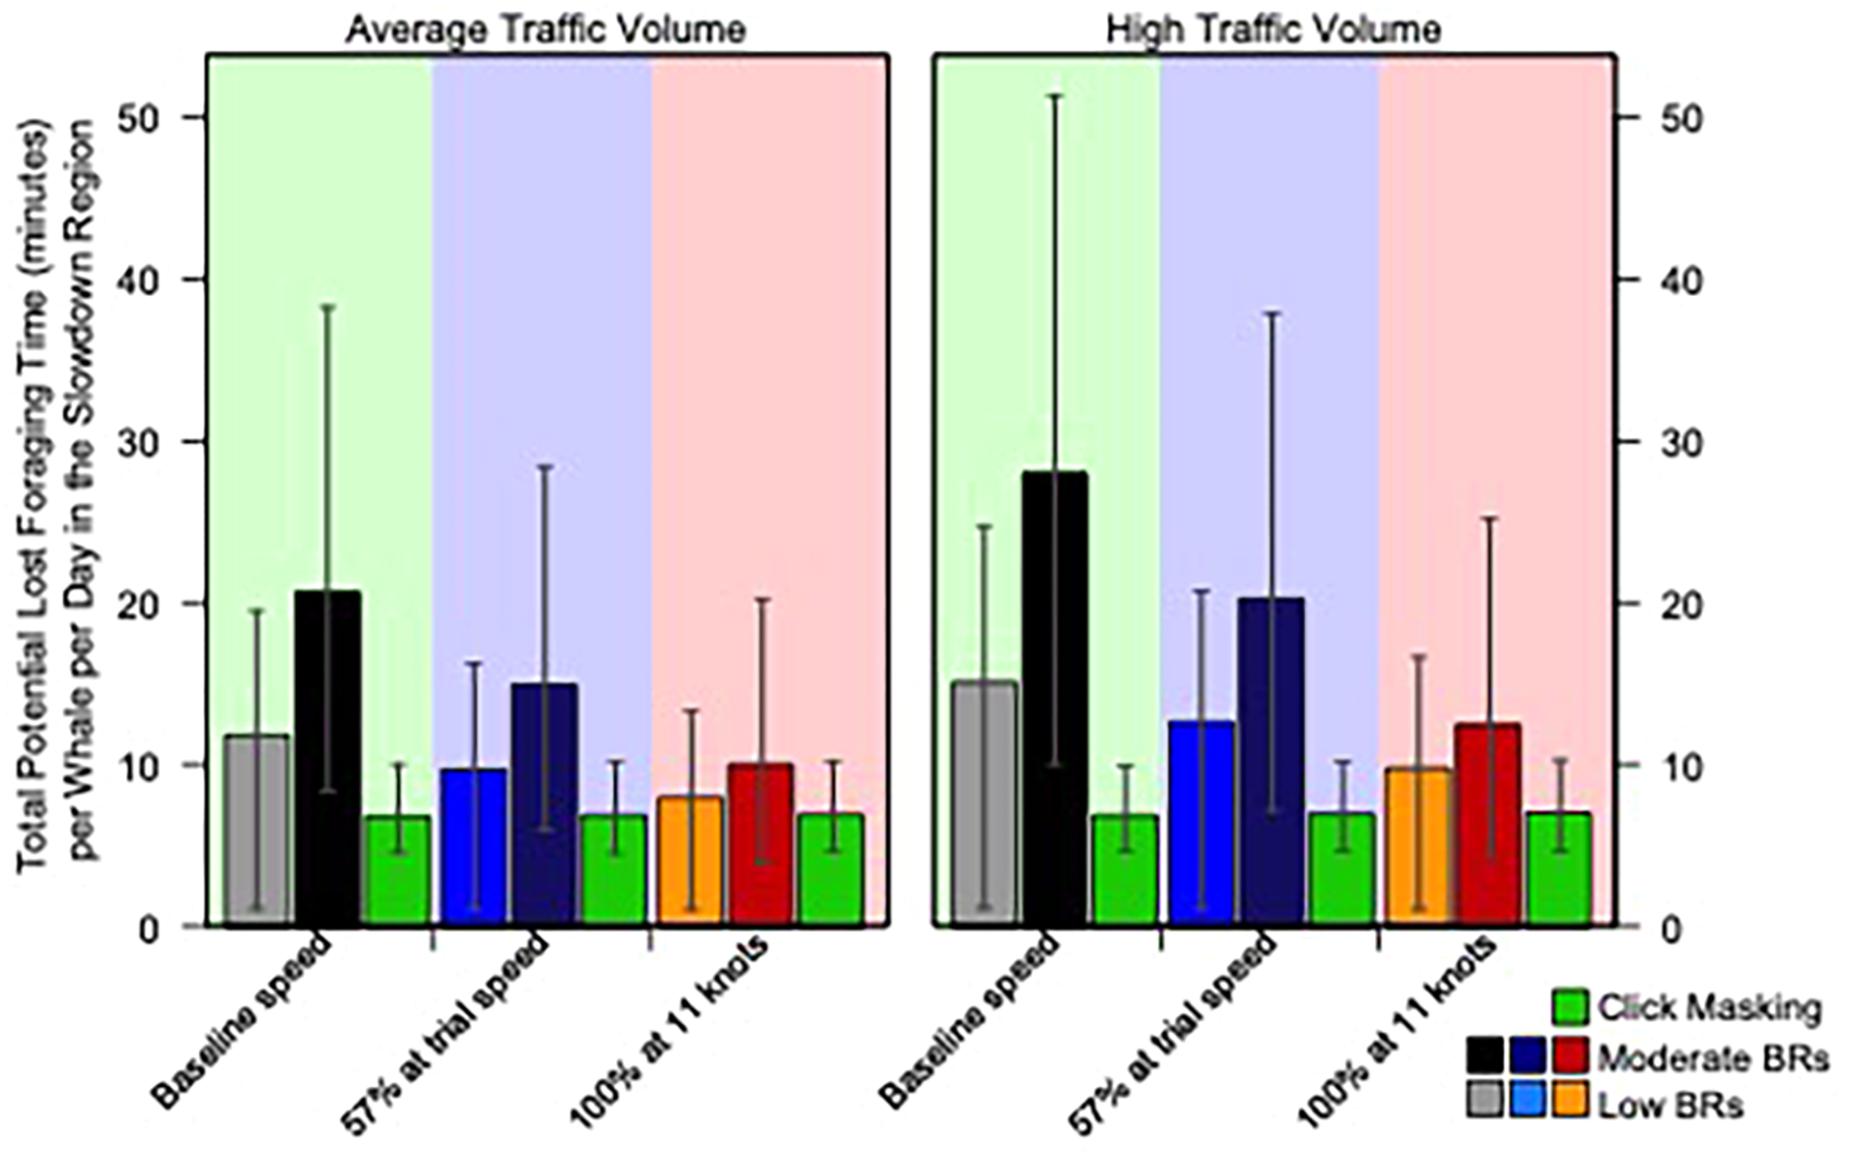
Figure 8. Modeled SRKW ‘Potential Lost Foraging Time’ for each of the six Vessel Speed and Traffic Scenarios (Scenarios 1 through 6, Table 2). Bars show ‘Potential Lost Foraging Time’ for each of Low BR, Mod BR, and Click Masking as determined by the SRKW noise-exposure simulation model. Average and High Traffic Volume Scenarios corresponds to the descriptions in Table 2. The reduction in ‘potential lost foraging time’ attributable to moderate BRs declined by >50% in model scenario when all vessels observe speeds of 11 knots (compared to Baseline; i.e., by comparing heights of black to red bars).
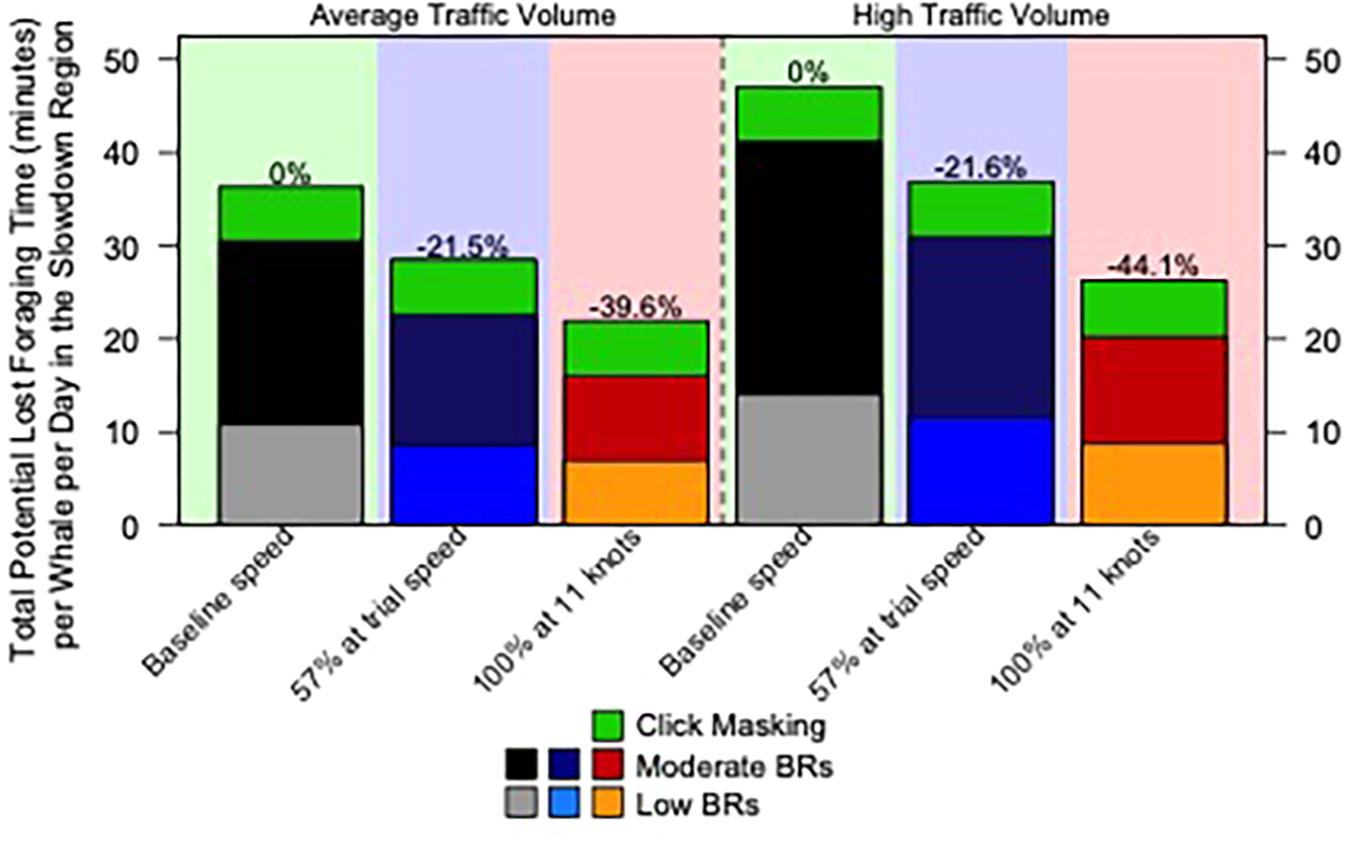
Figure 9. Cumulative ‘Potential Lost Foraging Time’ for each of the six Vessel Speed and Traffic Scenarios (Scenarios 1 through 6, Table 2). Bars are stacked by the number of lost minutes for each of Low BR, Mod BR, and Click Masking. ‘Potential Lost Foraging Time’ is determined using the SRKW noise-exposure simulation model. Average and High Traffic Volume Scenarios corresponds to descriptions in Table 2.
Overall, the expected consequence of moderate severity BRs had the greatest influence on the total ‘potential lost foraging time,’ particularly under baseline conditions, and had the greatest benefit from slower vessels (compare black to red bars in Figures 8, 9). Moderate BRs accounted for 41–58% of the potential time lost whereas low severity responses accounted for 12–27% of the loss. This is a consequence of assuming low severity BRs of SRKW had an effect-duration of 5 min in the noise-exposure model, while moderate severity BRs were assumed to have an effect duration of 25 min. Despite requiring a higher received noise level for a moderate response to occur, the fivefold impact of moderate relative to one low severity BR translates to the biggest hindrance in potential foraging time in our model. Thus, noise reductions from any vessel that no longer results in a moderate severity behavioral response will translate into increased potential benefits to SRKWs.
The uncertainty in model outputs was high (i.e., note 95% confidence intervals in Figure 8). This variability in outcomes corresponded to wide 95% confidence intervals (95-C.I.) around model estimates ‘potential lost foraging time’ of 36.8 h (95-C.I. 16.5, 64.9) for Baseline, 29.5 h (95-C.I. 13.1, 51.6) under 57% participation, and 22.0 h (95-C.I. 10.1, 41.5) with all vessels transiting at <11 knots (Figure 9, left 3 bars, average traffic volume). Similarly, under high traffic volume, estimated ‘potential lost foraging time’ of 49.0 h (95-C.I. 20.6, 84.4), 37.4 h (95-C.I. 15.9, 65.5), and 26.7 h (95-C.I. 11.7, 49.8) for Baseline, under 57% participation, and 100% participation at <11-knot speeds (Figure 9, right 3 bars, high traffic volume). The wide confidence intervals around model outputs reflect the uncertainty around the inputs to the noise-exposure model. Model inputs included the spatial variability of habitat use across the study area by months August, September, October, the uncertainty in the probability of eliciting a behavioral response from the received level of noise at the whale’s location, the parameter uncertainties in the dose-response function (reflecting that of the data sources from which it was derived), and the stochasticity of both ships and whales moving in time and space.
Despite these sources of input variability, the results of the noise-exposure model collectively suggest important benefits to SRKW through reductions in ‘potential lost foraging time’ at the core of their foraging habitat in Haro Strait (Figure 7). For an average traffic volume day at the participation rates observed in this trial, ‘lost foraging time’ would be decreased by 21.5% and decreased by 39.6% if full participation of 11 knots for all commercial vessels was achieved (Figure 9). For high traffic volume days, these reductions are increased to 21.6% for the observed participation rates, and 44.1% for 100% vessel participation.
Discussion
Trial Vessel Speed (AIS), Reported Participation
Low-frequency energy from commercial ships is the principal source of ambient noise below 1 kHz within the deep ocean (Wenz, 1962; Urick, 1984; National Research Council of the U. S. National Academies [NRC], 2003), and noise in the low frequency bands dominates the broadband spectrum of ambient noise in the Salish Sea (Bassett et al., 2012; Cominelli et al., 2018). Motivated by an interest in better understanding and reducing the effects of commercial vessel traffic in SRKW critical habitat, this study was proposed by an industry-led multi-stakeholder initiative of the ECHO program of the Vancouver Fraser Port Authority. Participation by vessel owners and operators was voluntary throughout the 2017 Slowdown trial, facilitated by the BC Coast Pilots. During the trial, 44% of 951 piloted transits achieved a speed of less than 12 knots, and 55% achieved a speed of less than 13 knots. Given this rate of trans-boundary participation for transits through the international shipping lanes of Haro Strait, this study highlights the benefits of voluntary (non-regulatory) vessel Slowdowns as a meaningful noise reduction measure.
Vessel Source Level Reductions
Marine traffic generates high-energy noise in the ocean that can propagate across considerable distances underwater. A positive relation between source level reductions with decreased speed was assumed, prior to the Slowdown trial, based on intuition and documented elsewhere (e.g., McKenna et al., 2012; Houghton et al., 2015; Frankel and Gabriele, 2017), but the relation was not well understood. Particularly, there was a lack of speed scaling data for the Salish Sea shipping lanes, and the relations available were based on a limited number of historic post-World War II commercial vessels (Ross, 1976). Extensive source level reduction data collected during the trial demonstrated that the biggest reductions in source levels were for container ships that reduced their speed by 7.2 knots, corresponding to a 10.8 dB reduction in median source levels (MacGillivray and Li, 2018b). This vessel type made up 27.7% of transits, compared to 51.6% of transits attributed to bulk/general cargo vessels, that move slower and have more modest median source level reductions (5.0 dB). The greater reduction in noise from container vessels reflects the larger speed and source level reduction of faster-moving container vessels. However, due to the larger speed scaling coefficient of bulk/cargo vessels, the mean per-knot reductions are greater for this class of vessels (2.8 dB per knot) compared to container vessels (1.5 dB per knot). As bulk/cargo ships comprise >50% of the commercial fleet, the biggest reduction in ambient noise would be to reduce speeds of this vessel class.
Ambient Noise Measurements at Lime Kiln Listening Station
Ambient noise in the ocean is the sound field against which signals must be detected. As southern resident killer whales must send and receive sound waves in order to navigate, communicate and forage successfully, the level of ambient noise can have important effects on the function of their habitat Department of Fisheries and Oceans Canada [DFO] (2018). With a growing global shipping industry and with the rate of noise continuing to rise (Hildebrand, 2009), there is an increasing potential for adverse effects on the underwater noise field of the Salish Sea (Veirs et al., 2016). Additionally, multiple proposed fossil fuel-related and port development projects in the Salish Sea have the potential to further increase marine vessel traffic and negatively effect ambient noise levels (Gaydos et al., 2015). Recent work has shown that commercial vessel noise in the Salish Sea significantly increases not only the ambient broadband noise levels, but also includes significant acoustic energy in high frequency bands used for echolocating and finding prey (Veirs et al., 2016). A population viability analysis explored the relative importance of the primary anthropogenic threats to southern resident killer whale survival, and after Chinook prey availability (their primary threat), commercial vessel noise and disturbance was identified to be of sufficient magnitude to shift SRKW population trajectories from slow positive growth into decline (Lacy et al., 2017). Given this context, it is therefore important that we found that slowing piloted vessels reduced ambient broadband sound pressure levels at the core of SRKW summer foraging habitat. Using unfiltered data, the median broadband reduction of 1.2 dB corresponds to a 24% reduction in sound intensity, despite the Slowdown period having 8.7% more piloted vessel transits than the baseline period and slower vessels taking longer to transit the 16 nm section. Large commercial vessels generate noise with most energy being emitted at frequencies below 1,000 Hz, with substantial tonal contributions as low as 10 Hz (Ross, 1976; Arveson and Vendittis, 2000; McKenna et al., 2012). When isolating noise comparisons of Baseline to Slowdown to periods when piloted vessels were within 6 km of the listening station and removing key confounding influences such as boat noise and wind, the result of slowing commercial vessels was a reduction in vessel noise emissions and lower received SPL over the entire frequency range (broadband), with the greatest relative reductions observed below 100 Hz at frequencies that commercial vessels are typically loudest. Therefore, despite slower vessels taking longer to transit the 16 nm section of the shipping lanes, the net result was lower vessel noise footprints particularly at low frequency bands.
Comparison of SRKW echolocation-related frequency bands at Lime Kiln (15,000–100,000 Hz, Heise et al., 2017) showed an increase of 0.4 dB re 1 μPa in the median noise level during the trial period compared to the Baseline period. However, the distribution was narrower (had a smaller variance), with the upper tail of the distribution having a lower SPL during the trial compared to Baseline (i.e., the quietest periods were louder, but the loudest periods were quieter during the Slowdown compared to Baseline). Due to the ∼4 km distance between passing ships and the hydrophone, much of the high frequency sound coming from vessels is attenuated below background and internal hydrophone system noise by the time it reaches the Lime Kiln listening station. Similarly, Veirs et al. (2016) found commercial ship noise in bands used by SRKW for communicating and foraging (echolocation bands) could be detected at ranges of at least 3 km, however, the limitations of the hydrophone to accurately measure high frequency sounds at such low intensity (<85 dB mean value) is questionable. Nonetheless, as an important SRKW foraging hotspot is located near the shipping lanes (Olson et al., 2018) offshore from Lime Kiln Point, and with many gaps still in our understanding of echolocation click making (Erbe, 2002), or to what degree SRKW can compensate for high noise levels (and when they can no longer) (Holt et al., 2009; Zollinger and Brumm, 2011), more targeted studies than the one we describe here are required to understand the effect of the slowdown on these high frequency bands.
SRKW Noise-Exposure Model (Behavioral Response Model)
Studying whale behavior in the presence of vessels is challenging. The SRKW noise-exposure model is a temporal and spatially explicit approach designed to evaluate the potential effects on SRKW of multiple moving noise sources within their preferred summer foraging habitat off Lime Kiln Point. The noise-exposure approach used in this study, uses a 2-d surface density of SRKW habitat use coupled to the probability of a change in behavior by the whale (e.g., stops foraging) for a combined broadband received level and high frequency echolocation click masking. Underlying the dose-response relationship is the concept that at higher received noise levels (i.e., a high noise dose), there is a higher probability of a behavioral response or disruption, and that this disruption has the potential to last longer than the time period of the dose (e.g., through a switch in behavior). The scientific procedure for estimating and predicting biological impacts from noise exposure has been based traditionally on the dose-response paradigm (see, for example, Southall et al., 2007; Finneran and Jenkins, 2012). This paradigm assumes that the extent of the biological impact or consequence can be predicted by the noise received level at the animal. Our joint analysis of resident killer whale noise-exposure datasets supported the hypothesis of an increase in severity of behavioral response in response to increasing SPL, albeit with large variance associated with the relationship. There are other studies with additional supporting evidence that this relation does persist for this and other species in other areas. For example, sperm whales exposed to low frequency active sonar (LFAS, 1–2 kHz) changed from foraging to non-foraging behavior (Isojunno et al., 2016), and killer whales, sperm whales and Blainsville beaked whales have all been shown to respond to sonar noise with increasing severity of response (e.g., Miller et al., 2012, 2014; Harris et al., 2015). Additionally, we derived the dose–response functions in our study from local killer whales exposed to vessel noise, and included the uncertainty in the observational input data as recommended by Miller et al. (2014). This was to acknowledge the variability in individual responses to different noise levels and sources. Others have found behavioral responses can depend on a number of covariates including an individual’s prior experience to noise (Constantine et al., 2015), the habitat quality (Robertson et al., 2013), the distance from the sound source (Madsen et al., 2006; deRuiter et al., 2013; Dunlop et al., 2017), and perhaps by such factors as age, sexual condition, and gender (female killer whales seemed to be more likely than males to respond to the passage of a ship; Williams et al., 2014; Gomez et al., 2016). Context-specific dose-response functions with separate functions for different behavioral states (e.g., Ellison et al., 2012), could reduce uncertainty in the predicted behavioral effects, but such an approach would require increased understanding of these contexts (Harris et al., 2018). By taking a conservative approach and assuming that any behavioral response results in a change from foraging to a non-foraging behavior, our average traffic volume results suggest that the voluntary slowdown resulted in median gains of 21.5% over Baseline losses, whereas a fully participating (to 11 knots) commercial fleet might be expected to have median gains of 39.6% or more against Baseline ‘potential lost foraging time.’ It is notable that during high traffic volumes (an increase of 50% in vessel transit number) and participation rates of 57%, the ‘potential lost foraging time’ is similar to the time lost during an average traffic volume and baseline vessel speeds although we add a precaution that there is uncertainty associated with the range of expected results.
The reductions in noise levels during the Slowdown trial at Lime Kiln, and also more widely in the Salish Sea based on modeled predictions is not simply due to changes in the long-term ambient noise levels, but rather a result of short-term reductions in high levels of noise. For this reason, the simulation design evaluated the maxima over each 5-min time increment and observed the changes in risk of a short-term low or moderate severity behavioral response. Veirs et al. (2018) estimated that half of the ship noise in the Salish Sea comes from just 15% of the commercial vessel fleet, and since the results of the noise-exposure model found reducing the loudest sounds, or those most likely to induce a moderate behavioral response, conferred the greatest benefit to SRKW, emphasis should be placed on design modifications of these ships (Leaper and Renilson, 2012; Merchant, 2019). There remain, however, many gaps still in our knowledge of how ship design modifications might stack up relative to other potential mitigations such as shipping lane alterations, and commercial vessel convoys, and how these potential modifications would interact with commercial vessel slowdowns.
In this simulation study of vessel slowdowns, short-term reductions in high source levels translated to the least lost foraging time. Short-term noise reductions result in lower associated received levels by whales in the vicinity, and since the probability of a behavioral response decreases in a non-linear way according to the dose-response function, there are disproportionate benefits at particular noise levels. For example, slowing a bulk/cargo vessel past a SRKW that otherwise would receive a 130 dB re 1 μPa noise level, and assuming the speed reduction causes a 2.8 dB reduction in noise received by the whale, this will reduce the whale’s probability of a Low BR by 14.5% (from 52.7 to 38.2%). Likewise, a 2.8 dB reduction in received noise levels when ambient noise levels are 117.4 dB, (i.e., the median ambient noise level when a commercial vessel is within 6 km of Lime Kiln), would result in only a 4.9% reduction in SRKW probability of experiencing a Low BR. As SRKW are typically 100–300 m offshore of Lime Kiln toward the shipping lanes (Veirs et al., 2016), the median ambient noise level for a transiting commercial vessel would be louder, and expected to have a greater benefit (than -4.9%) for SRKW.
In evaluating benefits of slower vessels to SRKW, commercial vessels transiting at the 11-knot slowdown speed pass through the study area more slowly. Therefore, despite lower instantaneous sound intensity and probabilities of BRs, the net benefit must consider that the exposure duration will be longer. As a vessel moves through an area, there is a moving acoustic footprint around the vessel. Low and moderate severity behavioral responses can occur within these acoustic footprints. As the vessels decrease speed, this footprint decreases in area and therefore, at locations more distant from the shipping lane the exposure duration for a given exposure level decreases. For example, a whale located within the Lime Kiln grid square for a 24-h day during average traffic conditions (normal speed, average number of vessels), would be exposed to noise levels of at least 121 dB re 1 μPa for fourteen, 5-min time windows (of 288 possible daily windows). If 100% of the same number of vessels participated in an 11-knot slowdown, there would be only four, 5-min time windows at 121 dB re 1 μPa despite the longer passage times. Therefore, the additional 3.3 min it takes for a container vessel to transit a 1.4 km radius circle around a SRKW at 11 knots (compared to time at 18 knots), is offset by the reduction in the probability of an adverse reaction to the vessel. As the dose-response function is affected by the maximum noise-exposure during the passage time period and not by the median value of that interval, the longer passage time does not result in more time periods of risk for a whale as the lower source levels are less likely to lead to functional disturbance of SRKW. When viewing results spatially, slowing vessels down reduces the relative risk of excessive noise exposure such that when vessels transit at 11-knot slowdown speeds, the width of the ‘red’ footprint with expected probability of a low BR ≥ 0.30 (Figure 6) dropped by half in the SRKW hotspot area adjacent to Lime Kiln Point. Therefore, slower vessels have smaller footprints and lower risk of eliciting behavioral responses, implying an important improvement in the function of that habitat. As SRKW are predominately found in this region off Lime Kiln Point, the 61-day Slowdown trial demonstrated important relative improvements to their summer foraging habitat in this region.
An alternate approach to converting changes in behavior to ‘potential lost foraging time’ is one that takes into account the context of the interruption. There are many studies that demonstrate the importance of ecological context when assessing noise induced behavioral responses (for a review see Gomez et al., 2016). One approach to better understanding the importance of these behavioral responses may be to view them in the context of a biologically meaningful currency such as an energy budget (Harris et al., 2018). Such changes in energy budgets can then be used in models that extrapolate short-term effects to long-term effects (Christiansen et al., 2013). For example, for seasonal feeders such as blue whales that rely on dense prey aggregations, the energetic consequences of foraging disruption during periods of high prey availability can be significant (Goldbogen et al., 2013). Or equivalently, a disruption of a SRKW in its summer foraging grounds may have a higher energetic cost due to a lost prey capture, than a disruption in an area where active foraging is not common. A study of juvenile European eels showed experimentally that the effects of (playback) noise from passing coastal ships were condition-dependent, with individuals in worse condition most affected (Purser et al., 2016). Due to recent evident of multiple individuals showing signs of nutritional stress, or ‘peanut head’ syndrome (Durban et al., 2009), there is considerable variation in SRKW body condition. If animals are already in poor body condition as a consequence of poor Chinook salmon availability (Lacy et al., 2017), additional lost foraging opportunities could have both direct nutritional (energy) cost as well as indirectly through increased risk of parasite infection and disease, and/or reproductive performance. It is therefore worth designing field studies to collect the data to better understand these individual context-specific details, and thereby facilitate its inclusion into any model. Unfortunately, the energetic cost of any kind of behavioral response in marine mammals is not well quantified (Harris et al., 2018). Thus, there remain many uncertainties as to how a behavioral response to noise exposure could be translated into energy loss and then applied to real-world scenarios, and how these responses could be quantified into long-term individual and/or population-level effects remains an open question. By focusing our results from the simulation model on the percent reduction rather than the absolute reduction in ‘potential time foraging lost’ and applying these assumptions equally across scenarios, we have shown that the overall risk of behavioral responses was lower during the Slowdown trial compared to comparable baseline periods.
Understanding both the response and the variation in the response to commercial vessel disturbance is important both for assessing population consequences for SRKW and in management decisions. There are other examples of how consensus decision-making and sound science can be used to reduce the effect of marine shipping on whales in Canada (e.g., St. Lawrence estuary, the Bay of Fundy; Laist et al., 2014; Parrott et al., 2016), and internationally (e.g., Hauraki Gulf, New Zealand; Constantine et al., 2015). In this study, the use of spatially explicit models based on local data sources with transparent assumptions provided significant advantages over unsubstantiated opinion to the decision-making process by providing quantitative support in the form of maps and outputs (with both temporal and spatial variability) assessing the ‘potential lost foraging time’ in response to management decisions.
Conclusion
The speed reductions achieved by commercial vessel pilots participating in this study resulted in significant reductions in broadband noise exposure from all commercial vessel types, as well as noise reductions across most frequency bands. These reduced vessel speeds translated to important reductions to noise exposure risk for whales in an area of importance for foraging whales. By assuming that fewer negative behavioral responses to noise exposure from SRKW translates to fewer lost foraging opportunities and better foraging success, the results of this voluntary trial showed that reducing vessel speeds is likely to improve the habitat quality of a summer foraging hotspot in a region that overlaps with commercial shipping lanes.
This study was motivated by the aim to better understand, quantify, and manage shipping impacts on marine fauna. This work contributes to our understanding of how noise from commercial vessel traffic affects an important region of summer foraging habitat for SRKW, and how slowdown mitigations may benefit SRKW at frequencies important to this population. Taken together, the transparent assumptions behind a regional vessel noise model combined with a dose-response noise-exposure model allows a comparative exploration of the relative value of various noise mitigation options. This approach has provided a framework for making decisions about how to reduce the effect of vessel noise on these endangered whales. However, there remain many gaps still in our knowledge of how SRKW are affected by commercial ships and how speed reductions stack up relative to other potential mitigations such as shipping lane alterations, commercial vessel convoys, and ship design modifications. The advantage of this approach may be in allowing a comparative exploration of the relative value of various noise mitigation options. As noise-producing activities in the ocean are likely to continue to increase, there is a pressing need for better understanding and mitigation of sound-producing activities. In the future, we recommend efforts be put into doing a simultaneous observational study on SRKW to quantify effects of habitat displacement, and/or duration of behavioral responses to commercial vessels. This will ensure there is data to support the assumptions of any future simulation model of noise effects on this population.
Data Availability
All datasets generated for this study are included in the manuscript and/or the Supplementary Files.
Author Contributions
OR, DT, and KT designed and directed the project. ZL, AM, and JW performed all AIS, acoustic measures, and models. RJ and JW developed the theoretical framework for the noise-exposure simulation model. All authors equally wrote the article.
Funding
Funding to undertake this work was provided by the Vancouver Fraser Port Authority, Enhancing Cetacean Habitat and Observation (ECHO) Program, and supported by the Government of Canada.
Conflict of Interest Statement
RJ, DT, and JW work for SMRU Consulting Ltd. AM and ZL work for JASCO Applied Sciences. KT and OR work as consultants with the Vancouver Port Authority Enhancing Cetacean Habitat and Observation (ECHO) Program. All authors of this manuscript received payment through subconsultant contracts to the ECHO Program.
Acknowledgments
We acknowledge the support of the ECHO Program Advisory Working Group and Vessel Operators Committee, and especially the Pacific Pilotage Authority, BC Coast Pilots, Canadian Coast Guard and members of the Chamber of Shipping, Shipping Federation of Canada and Cruise Line International Association Northwest and Canada, whose support and participation made this trial a success. Dr. Stephanie King and Dr. John Harwood (University of St Andrews) provided early advice for the theoretical framework for the noise-exposure model.
Supplementary Material
The Supplementary Material for this article can be found online at: https://www.frontiersin.org/articles/10.3389/fmars.2019.00344/full#supplementary-material
Footnotes
References
American National Standards Institute [ANSI] (2009). Quantities and Procedures for Description and Measurement of Underwater Sound from Ships–Part 1: General Requirements. Washington, DC: American National Standards Institute.
Arveson, P. T., and Vendittis, D. J. (2000). Radiated noise characteristics of a modern cargo ship. J. Acoust. Soc. Am. 107, 118–129. doi: 10.1121/1.428344
Au, W. W., Ford, J. K., Horne, J. K., and Allman, K. A. (2004). Echolocation signals of free-ranging killer whales (Orcinus orca) and modeling of foraging for chinook salmon (Oncorhynchus tshawytscha). J. Acoust. Soc. Am. 115, 901–909. doi: 10.1121/1.1642628
Bassett, C., Polagye, B., Holt, M., and Thomson, J. (2012). A vessel noise budget for Admiralty Inlet, Puget Sound, Washington (USA). J. Acoust. Soc. Am. 132, 3706–3719. doi: 10.1121/1.4763548
Christiansen, F., Rasmussen, M. H., and Lusseau, D. (2013). Inferring activity budgets in wild animals to estimate the consequences of disturbances. Behav. Ecol. 24, 1415–1425. doi: 10.1093/beheco/art086
Cominelli, S., Devillers, R., Yurk, H., MacGillivray, A., McWhinnie, L., and Canessa, R. (2018). Noise exposure from commercial shipping for the southern resident killer whale population. Mar. Pollut. Bull. 136, 177–200. doi: 10.1016/j.marpolbul.2018.08.050
Constantine, R., Johnson, M., Riekkola, L., Jervis, S., Kozmian-Ledward, L., Dennis, T., et al. (2015). Mitigation of vessel-strike mortality of endangered Bryde’s whales in the Hauraki Gulf. N. Z. Biol. Conserv. 186, 149–157. doi: 10.1016/j.biocon.2015.03.008
Department of Fisheries and Oceans Canada [DFO] (2011). Recovery Strategy for the Northern and Southern Resident Killer Whales (Orcinus orca) in Canada. Species at Risk Act Recovery Strategy Series, Fisheries & Oceans Canada, Ottawa, ix + 80 pp. Agassiz, BC: Department of Fisheries and Oceans Canada.
Department of Fisheries and Oceans Canada [DFO] (2017). Action Plan for the Northern and Southern Resident Killer Whales (Orcinus orca) in Canada. Species at Risk Act Action Plan Series. Fisheries and Oceans Canada, Ottawa. iii + 32 pp. Agassiz, BC: Department of Fisheries and Oceans Canada.
Department of Fisheries and Oceans Canada [DFO] (2018). Recovery Strategy for the Northern and Southern Resident Killer Whales (Orcinus orca) in Canada. Species at Risk Act Recovery Strategy Series, Fisheries & Oceans Canada, Ottawa, x + 84 pp. Agassiz, BC: Department of Fisheries and Oceans Canada.
deRuiter, S. L., Southall, B. L., Calambokidis, J., Zimmer, W. M., Sadykova, D., Falcone, E. A., et al. (2013). First direct measurements of behavioural responses by Cuvier’s beaked whales to mid-frequency active sonar. Biol. Lett. 9:20130223. doi: 10.1098/rsbl.2013.0223
Dunlop, R. A., Noad, M. J., McCauley, R. D., Scott-Hayward, L., Kniest, E., Slade, R., et al. (2017). Determining the behavioural dose–response relationship of marine mammals to air gun noise and source proximity. J. Exp. Biol. 220, 2878–2886. doi: 10.1242/jeb.160192
Durban, J., Fearnbach, H., Ellifrit, D., and Balcomb, K. (2009). Size and Body Condition of Southern Resident Killer Whales. Seattle, WA: Contract report to National Marine Fisheries Service.
Ellison, W. T., Southall, B. L., Clark, C. W., and Frankel, A. S. (2012). A new context-based approach to assess marine mammal behavioural responses to anthropogenic sound. Conserv. Biol. 26, 21–28. doi: 10.1111/j.1523-1739.2011.01803.x
Erbe, C. (2002). Underwater noise of whale-watching boats and potential effects on killer whales (Orcinus orca), based on an acoustic impact model. Mar. Mamm. Sci. 18, 394–418. doi: 10.1111/j.1748-7692.2002.tb01045.x
Finneran, J. J., and Jenkins, A. K. (2012). Criteria and Thresholds for U.S. Navy Acoustic and Explosives Effects Analysis. San Diego, CA: Department of Navy.
Ford, J. K. (1989). Acoustic behaviour of resident killer whales (Orcinus orca) off Vancouver Island, British Columbia. Can. J. Zool. 67, 727–745. doi: 10.1139/z89-105
Ford, J. K., and Ellis, G. M. (2006). Selective foraging by fish-eating killer whales Orcinus orca in British Columbia. Mar. Ecol. Prog. Ser. 316, 185–199. doi: 10.3354/meps316185
Ford, J. K., Ellis, G. M., Olesiuk, P. F., and Balcomb, K. C. (2009). Linking killer whale survival and prey abundance: food limitation in the oceans’ apex predator? Biol. Lett. 6, 139–142. doi: 10.1098/rsbl.2009.0468
Frankel, A. S., and Gabriele, C. M. (2017). Predicting the acoustic exposure of humpback whales from cruise and tour vessel noise in Glacier Bay, Alaska, under different management strategies. Endanger. Species Res. 34, 397–415. doi: 10.3354/esr00857
Gaydos, J. K., Thixton, S., and Donatuto, J. (2015). Evaluating threats in multinational marine ecosystems: a coast salish first nations and tribal perspective. PLoS One 10:e0144861. doi: 10.1371/journal.pone.0144861
Goldbogen, J. A., Southall, B. L., DeRuiter, S. L., Calambokidis, J., Friedlaender, A. S., Hazen, E. L., et al. (2013). Blue whales respond to simulated mid-frequency military sonar. Proc. R. Soc. B 280:20130657. doi: 10.1098/rspb.2013.0657
Gomez, C., Lawson, J. W., Wright, A. J., Buren, A. D., Tollit, D., and Lesage, V. (2016). A systematic review on the behavioural responses of wild marine mammals to noise: the disparity between science and policy. Can. J. Zool. 94, 801–819. doi: 10.1139/cjz-2016-0098
Hannay, D. E., Mouy, X., and Li, Z. (2016). An automated real-time vessel sound measurement system for calculating monopole source levels using a modified version of ANSI/ASA S12.64-2009. Can. Acoust. 44, 166–167. Available at: https://jcaa.caa-aca.ca/index.php/jcaa/article/view/3002/2703
Harris, C. M., Sadykova, D., DeRuiter, S. L., Tyack, P. L., Miller, P. J. O., Kvadsheim, P. H., et al. (2015). Dose response severity functions for acoustic disturbance in cetaceans using recurrent event survival analysis. Ecosphere 6:236.
Harris, C. M., Thomas, L., Falcone, E., Hildebrand, J., Houser, D., Kvadsheim, P., et al. (2018). ‘Marine mammals and sonar: dose-response studies, the risk-disturbance hypothesis and the role of exposure context’. J. Appl. Ecol. 55, 396–404. doi: 10.1111/1365-2664.12955
Heise, K. A. (2008). Recovery Strategy for the Northern and Southern Resident Killer Whales (Orcinus orca) in Canada. Agassiz, BC: Department of Fisheries and Oceans Canada.
Heise, K. A., Barrett-Lennard, L. G., Chapman, N. R., Dakin, D. T., Erbe, C., Hannay, D. E., et al. (2017). Proposed Metrics for the Management of Underwater Noise for Southern Resident Killer Whales Coastal Ocean Report Series (2). Vancouver: Ocean Wise, 31.
Hildebrand, J. (2009). Anthropogenic and natural sources of ambient noise in the ocean. Mar. Ecol. Prog. Ser. 395, 5–20. doi: 10.1146/annurev-marine-121211-172423
Holt, M. M., Noren, D. P., Veirs, V., Emmons, C. K., and Veirs, S. (2009). Speaking up: killer whales (Orcinus orca) increase their call amplitude in response to vessel noise. J. Acoust. Soc. Am. 125, EL27–EL32. doi: 10.1121/1.3040028
Houghton, J., Holt, M. M., Giles, D. A., Hanson, M. B., Emmons, C. K., Hogan, J. T., et al. (2015). The relationship between vessel traffic and noise levels received by killer whales (Orcinus orca). PLoS One 10:e0140119. doi: 10.1371/journal.pone.0140119
Isojunno, S., Curé, C., Kvadsheim, P. H., Lam, F. P. A., Tyack, P. L., Wensveen, P. J., et al. (2016). Sperm whales reduce foraging effort during exposure to 1- 2 kHz sonar and killer whale sounds. Ecol. Appl. 26, 77–93. doi: 10.1890/15-0040
Jensen, F., Kuperman, W., Porter, M., and Schmidt, H. (2011). Computational Ocean Acoustics. New York, NY: Springer, 794.
Lacy, R. C., Williams, R., Ashe, E., Balcomb, K. C. III, Brent, L. J., Clark, C. W., et al. (2017). Evaluating anthropogenic threats to endangered killer whales to inform effective recovery plans. Sci. Rep. 7:14119. doi: 10.1038/s41598-017-14471-0
Laist, D. W., Knowlton, A. R., and Pendleton, D. (2014). Effectiveness of mandatory vessel speed limits for protecting North Atlantic right whales. Endanger. Species Res. 23, 133–147. doi: 10.3354/esr00586
Leaper, R. C., and Renilson, M. R. (2012). A review of practical methods for reducing underwater noise pollution from large commercial vessels. Int. J. Maritime Eng. 154, A79–A88.
Lee, S., Kim, S., Lee, Y., Yoon, J., and Lee, P. (2011). Experiment on effect of screening hydrophone for reduction of flow-induced ambient noise in ocean. Jpn. J. Appl. Phys. 50, 1–2.
Lusseau, D., Bain, D. E., Williams, R., and Smith, J. C. (2009). Vessel traffic disrupts the foraging behaviour of southern resident killer whales Orcinus orca. Endanger. Species Res. 6, 211–221. doi: 10.3354/esr006211
MacGillivray, A., and Li, Z. (2018a). Vessel Noise Measurements from the ECHO Slowdown Trial: Final Report. Document 01518, Version 3.0. Technical report by JASCO Applied Sciences for Vancouver Fraser Port Authority ECHO Program. Victoria, BC: JASCO Applied Sciences.
MacGillivray, A., McPherson, C., McPherson, G., Izett, J., Gosselin, J., Li, Z., et al. (2014). “Modelling underwater shipping noise in the Great Barrier Reef Marine Park using AIS vessel track data,” in Proceedings of the 43rd International Conference inter.noise 2014, Melbourne, VIC.
MacGillivray, A. O., and Li, Z. (2018b). ‘Reductions in underwater radiated noise from shipping during the 2017 Haro Strait vessel slowdown trial’. J. Acoust. Soc. Am. 144, 1731–1731. doi: 10.1121/1.5067678
MacGillivray, A. O., Li, Z., and Yurk, H. (2018). Modelling of Cumulative Vessel Noise for Haro Strait Slowdown Trial: Final Report. in, ECHO Program: Voluntary Vessel Slowdown Trial Summary Findings. Appendix A. Vancouver Fraser Port Authority. Victoria, BC: JASCO Applied Sciences.
Madsen, P. T., Wahlberg, M., Tougaard, J., Lucke, K., and Tyack, P. (2006). Wind turbine underwater noise and marine mammals: implications of current knowledge and data needs. Mar. Ecol. Prog. Ser. 309, 279–295. doi: 10.3354/meps309279
McKenna, M. F., Ross, D., Wiggins, S. M., and Hildebrand, J. A. (2012). Underwater radiated noise from modern commercial ships. J. Acoust. Soc. Am. 131, 92–103. doi: 10.1121/1.3664100
McKenna, M. F., Wiggins, S. M., and Hildebrand, J. A. (2013). Relationship between container ship underwater noise levels and ship design, operational and oceanographic conditions. Sci. Rep. 3:1760. doi: 10.1038/srep01760
Merchant, N. D. (2019). Underwater noise abatement: economic factors and policy options. Environ. Sci. Policy 92, 116–123. doi: 10.1016/j.envsci.2018.11.014
Merchant, N. D., Barton, T. R., Thompson, P. M., Pirotta, E., Dakin, D. T., and Dorocicz, J. (2013). Spectral probability density as a tool for ambient noise analysis. J. Acoust. Soc. Am. 133, EL262–EL267. doi: 10.1121/1.4794934
Miller, P., Antunes, R. N., Wensveen, P. J., Samarra, F. I. P., Alves, A. C. D. C., Tyack, P. L., et al. (2014). ‘Dose-response relationships for the onset of avoidance of sonar by free-ranging killer whales’. J. Acoust. Soc. Am. 135, 975–993. doi: 10.1121/1.4861346
Miller, P. J. O., Kvadsheim, P. H., Lam, F.-P. A., Wensveen, P. J., Antunes, R., Alves, A. C., et al. (2012). The severity of behavioural changes observed during experimental exposures of killer (Orcinus orca), long-finned pilot (Globicephala melas), and sperm (Physeter macrocephalus) whales to naval sonar. Aquat. Mamm. 38, 362–401. doi: 10.1578/am.38.4.2012.362
National Research Council of the U. S. National Academies [NRC] (2003). Ocean Noise and Marine Mammals. Washington, DC: National Academy Press, 6, 65–67, 89, 93, 128.
Noren, D. P., Johnson, A. H., Rehder, D., and Larson, A. (2009). Close approaches by vessels elicit surface active behaviours by southern resident killer whales. Endanger. Species Res. 8, 179–192. doi: 10.3354/esr00205
Olson, J. K., Wood, J., Osborne, R. W., Barrett-Lennard, L., and Larson, S. (2018). Sightings of southern resident killer whales in the Salish Sea 1976–2014: the importance of a long-term opportunistic dataset. Endanger. Species Res. 37, 105–118. doi: 10.3354/esr00918
Parrott, L., Chion, C., Turgeon, S., Ménard, N., Cantin, G., and Michaud, R. (2016). Slow down and save the whales. Solutions 6, 40–47.
Pilotage Act (1985). (R.S.C, c. P-14). Available at: https://laws-lois.justice.gc.ca/eng/acts/P-14/ (accessed June, 2017).
Purser, J., Bruintjes, R., Simpson, S. D., and Radford, A. N. (2016). Condition-dependent physiological and behavioural responses to anthropogenic noise. Physiol. Behav. 155, 157–161. doi: 10.1016/j.physbeh.2015.12.010
Robertson, F. C., Koski, W. R., Thomas, T. A., Richardson, W. J., Würsig, B., and Trites, A. W. (2013). Seismic operations have variable effects on dive-cycle behaviour of bowhead whales in the Beaufort Sea. Endanger. Species Res. 21, 143–160. doi: 10.3354/esr00515
Rolland, R. M., Parks, S. E., Hunt, K. E., Castellote, M., Corkeron, P. J., Nowacek, D. P., et al. (2012). Evidence that ship noise increases stress in right whales. Proc. R. Soc. B Biol. Sci. 279, 2363–2368. doi: 10.1098/rspb.2011.2429
Seely, E., Osborne, R. W., Koski, K., and Larson, S. (2017). Soundwatch: eighteen years of monitoring whale watch vessel activities in the Salish Sea. PLoS One 12:e0189764. doi: 10.1371/journal.pone.0189764
SMRU (2014). Proposed Roberts Bank Terminal 2 technical report: Southern Resident killer whale Underwater Noise Exposure and Acoustic Masking Study. Prepared for Port Metro Vancouver, B.C. in Port Metro Vancouver (PMV). Roberts Bank Terminal 2 Environmental Impact Statement: Volume 3. Appendix 14-C. Environmental Assessment by Review Panel. Ottawa, ON: Canadian Environmental Assessment Agency.
SMRU (2015). Proposed Roberts Bank Terminal 2 technical report: Southern Resident killer whale population consequences of disturbance. Prepared for Port Metro Vancouver, B.C. in Port Metro Vancouver (PMV). Roberts Bank Terminal 2 Environmental Impact Statement: Volume 3. Appendix 14-C. Environmental Assessment by Review Panel. Ottawa, ON: Canadian Environmental Assessment Agency.
Southall, B. L., Bowles, A. E., Ellison, W. T., Finneran, J. J., Gentry, R. G., Greene, C. H., et al. (2007). Marine mammal noise exposure criteria: initial scientific recommendations. Aquat. Mamm. 33, 411–521.
United Nations Conference on Trade and Development [UNCTAD] (2018). Review of Maritime Transport. New York, NY: United Nations Conference of Trade and Development.
US Navy (2008). Southern California Range Complex Environmental Impact Statement/Overseas Environmental Impact Statetment. Washington, DC: United States Department of the Navy.
US Navy (2012). Atlantic Fleet Training and Testing EIR/OEIS: Draft Version. Washington, DC: United States Department of the Navy.
Veirs, S., Veirs, V., Williams, R., Jasny, M., and Wood, J. (2018). A key to quieter seas: half of ship noise comes from 15% of the fleet. PeerJ Preprints 6:e26525v1.
Veirs, S., Veirs, V., and Wood, J. D. (2016). Ship noise extends to frequencies used for echolocation by endangered killer whales. PeerJ. 4, e1657. doi: 10.7717/peerj.1657
Ward, E. J., Holmes, E. E., and Balcomb, K. C. (2009). Quantifying the effects of prey abundance on killer whale reproduction. J. Appl. Ecol. 46, 632–640. doi: 10.1111/j.1365-2664.2009.01647.x
Weilgart, L. S. (2007). The impacts of anthropogenic ocean noise on cetaceans and implications for management. Can. J. Zool. 85, 1091–1116. doi: 10.1016/j.marpolbul.2018.01.014
Wenz, G. M. (1962). Acoustic ambient noise in the ocean: spectra and sources. J. Acoust. Soc. Am. 34, 1936–1956. doi: 10.1121/1.1909155
Williams, R., Bain, D. E., Smith, J. C., and Lusseau, D. (2009). Effects of vessels on behaviour patterns of individual southern resident killer whales Orcinus orca. Endanger. Species Res. 6, 199–209. doi: 10.3354/esr00150
Williams, R., Erbe, C., Ashe, E., Beerman, A., and Smith, J. (2014). Severity of killer whale behavioural responses to ship noise: a dose-response study. Mar. Pollut. Bull. 79, 254–260. doi: 10.1016/j.marpolbul.2013.12.004
Williams, R., Krkošek, M., Ashe, E., Branch, T. A., Clark, S., Hammond, P. S., et al. (2011). Competing conservation objectives for predators and prey: estimating killer whale prey requirements for Chinook salmon. PLoS One 6:e26738. doi: 10.1371/journal.pone.0026738
Williams, R., Lusseau, D., and Hammond, P. S. (2006). Estimating relative energetic costs of human disturbance to killer whales (Orcinus orca). Biol. Conserv. 133, 301–311. doi: 10.1016/j.biocon.2006.06.010
Wright, B. M., Ford, J. K., Ellis, G. M., Deecke, V. B., Shapiro, A. D., Battaile, B. C., et al. (2017). Fine-scale foraging movements by fish-eating killer whales (Orcinus orca) relate to the vertical distributions and escape responses of salmonid prey (Oncorhynchus spp.). Movement Ecol. 5:3. doi: 10.1186/s40462-017-0094-0
Keywords: southern resident killer whales, voluntary slowdown, commercial vessel, underwater noise, acoustic disturbance, Salish Sea
Citation: Joy R, Tollit D, Wood J, MacGillivray A, Li Z, Trounce K and Robinson O (2019) Potential Benefits of Vessel Slowdowns on Endangered Southern Resident Killer Whales. Front. Mar. Sci. 6:344. doi: 10.3389/fmars.2019.00344
Received: 03 March 2019; Accepted: 04 June 2019;
Published: 26 June 2019.
Edited by:
Christine Erbe, Curtin University, AustraliaReviewed by:
Nathan D. Merchant, Centre for Environment, Fisheries and Aquaculture Science (CEFAS), United KingdomDanielle Kreb, Conservation Foundation for Rare Aquatic Species of Indonesia, Indonesia
Copyright © 2019 Joy, Tollit, Wood, MacGillivray, Li, Trounce and Robinson. This is an open-access article distributed under the terms of the Creative Commons Attribution License (CC BY). The use, distribution or reproduction in other forums is permitted, provided the original author(s) and the copyright owner(s) are credited and that the original publication in this journal is cited, in accordance with accepted academic practice. No use, distribution or reproduction is permitted which does not comply with these terms.
*Correspondence: Ruth Joy, rjoy@sfu.ca