A Trait-Based Framework for Explaining Non-additive Effects of Multiple Stressors on Plankton Communities
 Niousha Taherzadeh
 Michael Bengfort
 Kai W. Wirtz
- Ecosystem Modeling, Institute of Coastal Research, Helmholtz-Zentrum Geesthacht, Geesthacht, Germany
Phytoplankton communities are increasingly subject to multiple stressors of natural or anthropogenic origin. The cumulative effect of these stressors, however, may vary considerably from the sum of impacts from individual stressors. Nonlinear effects, such as changes in community traits can either boost up (synergistic) or weaken (antagonistic) single stressors. Despite previous empirical studies and meta analyses on the interaction types of various multiple stressors, a more fundamental understanding of cumulative effects is lacking. To fill this gap, we here propose a new theoretical framework that is centered on the concept of interaction traits and their trade-offs. The framework is applied to a novel size-based plankton model resolving multi-species phytoplankton-nutrients-detritus-zooplankton dynamics within the upper mixed layer. The model is validated using data from a series of outdoor mesocosm experiments. In the direct aftermath of single perturbations that increase net growth rate, here nutrient enrichment and grazer removal, the simulated phytoplankton community undergoes structural changes as visible in altered community traits. These temporal variations explain why the multiple stressor interaction switches from antagonistic to synergistic as compensatory trait variations reduce over time of the experiment. This finding can be generalized within our trait-based explanatory framework to mechanistically assess and predict effects of other stressor combinations and for other organism groups.
1. Introduction
Phytoplankton communities are responsible for half of the primary production on earth (Field et al., 1998) and form the base of aquatic food-webs, but are also subject to accelerated shifts in their growth environment. These shifts add to natural variations and derive from a suite of processes starting from many aspects of climatic change and comprising direct anthropogenic interventions, such as fertilizing the global ocean with inorganic carbon and the coastal ocean with nutrients. It is thus rather the norm than the exception that phytoplankton communities undergo a broad combination of environmental perturbations in parallel (Todgham and Stillman, 2013). If any of those alterations in a growth factor induces a decrease in fitness, it is called a “stressor” (Folt et al., 1999). In the following, this popular definition is here extended to alterations with positive growth effects: arbitrary but simultaneously changing growth factors are in the following termed “multiple stressors.” According to this neutral definition, for example, a (beneficial) temperature rise together with nutrient enrichment act as “multiple stressors” (Cairns, 2013). Experimental studies of plankton eco-physiology in general investigate the effects of a single stressor at a time. However, multiple stressors may have an impact that differs from the sum of effects of each stressor in isolation. If the impact exceeds the sum of individual effects, the stressors are called synergistic, while in the case of a lower total impact these are termed antagonistic (Crain et al., 2008). Non-additive impacts represent “ecological surprises” that can counteract our (linear) understanding of ecosystem functioning. For example, experimental studies of Klug et al. (2000) and Vinebrooke et al. (2003) suggest that acidification shifts freshwater phytoplankton communities toward larger dinoflagellates, filamentous green algae, and larger eukaryotic phytoplankton that all grow slower under higher temperature (Agawin et al., 2000), which indicate a synergistic (negative) effect of acidification and environmental warming.
How phytoplankton communities change their structure under environmental perturbations depends on their flexibility in eco-physiological traits (Litchman et al., 2007; Finkel et al., 2010). Major traits, such as maximum growth rate or minimum nutrient demand determine competitive processes and interaction with the biotic and abiotic environment (e.g., grazing susceptibility or nutrient acquisition capacity). Most of these traits are correlated through trade-offs due to which an adaptation in one trait results in shifts of other traits (Wirtz and Eckhardt, 1996; Litchman et al., 2007), with direct and indirect consequences on resource usage strategies (Wirtz and Kerimoglu, 2016). Species that have an advantage under one stressor (e.g., elevated temperature) may not perform well when a second stressor (e.g., elevated CO2) is acting simultaneously (Litchman et al., 2012). Hence, the specific response of characteristic traits to both single and combined stressors makes a central part of the overall growth and structural response of phytoplankton communities to concurrently changing growth factors. These specific trait shifts are in turn rooted in eco-physiological trade-offs, an idea that provides the starting point of the work presented here. Previously, impacts of multiple stressors on phytoplankton have been investigated by empirical works (e.g., Vinebrooke et al., 2003; Flöder and Hillebrand, 2012; Segner et al., 2014) and meta-analysis of experimental studies (e.g., Folt et al., 1999; Cairns, 2013). Multiple stressors were in particular not systematically connected to phytoplankton traits and trade-offs. To fill this gap, we introduce a new theoretical framework which aims to explain the community response to multiple stressors taking into account structural, trait-related changes. For doing so, we define (1) a response specific effect size to quantitatively link main features of the community, such as total net growth rate to alteration in environmental conditions, and (2) trait-mediated adaptive growth response quantifying the contribution of structural changes to the overall community response. A major goal of our study is to unravel the relation between this adaptive capacity and the cumulative effect size. We will address this challenge by building and validating a fully trait-based plankton model that resolves flexibility and adaptive responses. The model will enable systematic stressor experiments to investigate how trait shifts buffer or amplify the impacts of multiple perturbations.
2. Materials and Methods
2.1. Model Definition
Almost all eco-physiological traits in unicellular autotrophs are linked to cell size (Litchman et al., 2007; Finkel et al., 2010; Wirtz, 2013). To represent a major share of the adaptive capacity in phytoplankton, we therefore adopt a previously developed size-based model, which is extended to a simple ecosystem model by supplementing dynamic equations for zooplankton, detritus and two nutrients. The model is based on the multi-species model presented by Taherzadeh et al. (2017), and adds more physiological detail, such as CO2 sensitivity and, most of all, ecological detail by incorporating size-based trophic relations derived by Wirtz (2013) and tested by Wirtz and Sommer (2013). The model describes ecosystem dynamics within a zero-dimensional box representing the surface layer of a water column and resolves a full ensemble of phytoplankton species or groups, resp. (Phyi with i = 1, …, n), and their internal nutrient quotas (QN, i, QP, i), three zooplankton groups (Zj with j = 1, 2, 3), two nutrients (nitrogen and phosphorous) (NutN, NutP) and detritus (DetN, DetP) (see Table S1, Equation 1−9) (Figure 1). Each phytoplankton group (Phyi) is characterized by its fixed cell size, which in turn determines the growth-nutrient uptake parameters (see Table S7), primary production, mixotrophy and loss terms (see Tables S2-S4). Zooplankton is divided into small and large ciliates, and copepods. A comprehensive model description is given in the Supplementary Material.
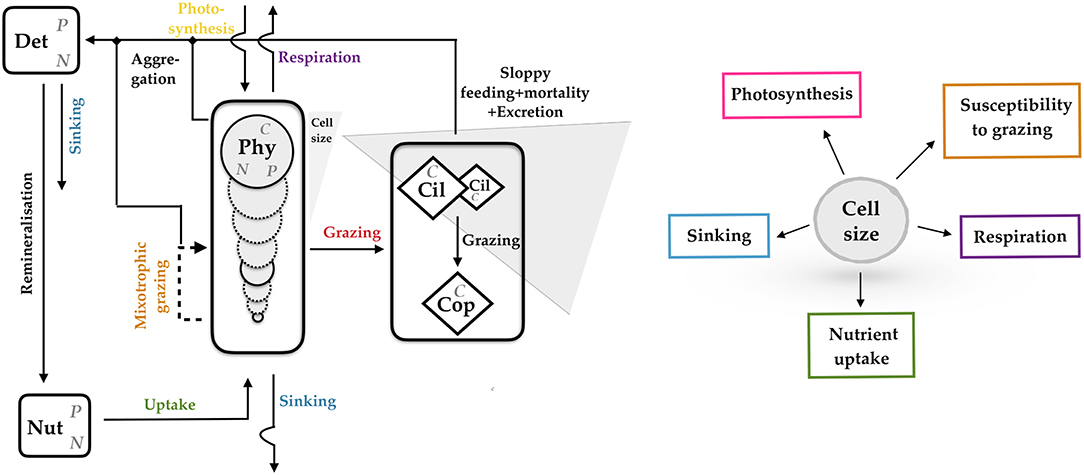
Figure 1. Schematic representation of the size-based multi-species model resolving biomass of phytoplankton species (Phyi with i = 1, …, n), their internal nutrient quotas, ambient nutrient concentration (Nut), detritus (Det), and zooplankton, further subdivided into small and large ciliates (Cil-S, Cil-L) and copepods (Cop). Mass flows between compartments or exchanged with the environment are given as arrows. Most of these flows depend on cell size as conceptualized in the right inlay graph. N, Nitrogen; P, Phosphorous; C, Carbon.
2.2. Multi-Stressor Effects
Our study seeks to develop a more general and mechanistic approach to study, quantify and predict multi-stressor effects on functional groups in ecosystems. The generic formalism should describe arbitrary stressor effects in complex systems, such as phytoplankton communities or marine food-webs. Let En and Em denote two external variables or stressors, such as nutrient input and grazing pressure. For relating (known) effects of perturbing En and Em to (unknown) multi-stressor effects, we pinpoint possible determinants of the non-linear interaction between stressor reactions. A special focus is laid on internal re-organization of biological agents, termed trait dynamics, and the trade-offs ruling that dynamics. We define as the first determinant the specific multi-stressor sensitivity (SMS) being the sensitivity of the community growth rate μ to parallel changes in En and Em:
This combined sensitivity to both stressors n and m can be shown to approach a function of observed single stressor shifts ΔEn and ΔEm, their growth effects Δμn and Δμm, and the observed multi-stressor effect Δμnm (see Equation S5 in Supplementary Material)
When the SMS is zero, the single stressor effects sum up to the multi-stressor effect (Δμnm=Δμn+Δμm), which reflects additive effects. Analogously, the SMS is positive for synergistic and negative for antagonistic effects.
Similar to the definition of the specific multi-stressor sensitivity, we introduce the interaction trait xn with respect to stressor n as the marginal dependency of the growth rate on the (perturbed) environmental variable En:
and analogously xm for stressor m. xm and xn denote biomass weighted community traits that best characterize the response of the community to stressors m and n, such as susceptibility to grazing in case of trophic control or nutrient usage ability for limitations in nutrient supply (see Supplementary Material). In the frequent case of a linear dependency of μ on En, the interaction trait is equivalent to the specific proportionality factor. The interaction trait 'usage ability for limiting nutrients' equals uptake affinity at very low nutrient concentration and vanishes for high nutrient availability. Usually, the community averaged value of xn changes upon alteration in En owing to, e.g., phenotypic plasticity or species resorting. For the same reasons, interaction traits may also change under application of other stressors (e.g., Em), such as susceptibility to grazing can alter due to nutrient stress. We hence introduce the cross-trait variation (CTV) that describes how the effective interaction traits are modified by other stressors.
where ΔEn and ΔEm again denote the magnitude in each perturbation, and xm,n the interaction trait xm under combined application of stressor n and m (xn,m the interaction trait xn in the same case). The cross-trait variation quantifies the extent of how effective interaction traits are modified by other stressors, such as alteration in susceptibility to grazing due to nutrient stress and the alteration in nutrient usage ability due to grazing. Inherent to these changes are trade-offs, thus morphological or physiological relations between different traits. If these trade-offs are absent and other stressors do not affect the dynamics in each specific trait (xn,m = xn, xm,n = xm), the CTV is zero.
2.3. Model Initialization and Parameterization
2.3.1. Initial Conditions
Phytoplankton cell sizes in the model range from 0.1 to 107 μm3 (0.6−500 μm ESD) corresponding to −0.5 to 6.2 loge ESD (μm) (ESD: Equivalent Spherical Diameter), which provides a representative size spectrum of phytoplankton observed in nature (Finkel et al., 2010). The number of virtual phytoplankton species is set to n = 17, which has been tested to leave qualitative results unchanged compared to higher resolutions in size classes. The initial distribution of phytoplankton biomass over cell size equals a Gaussian function with mean at 2.8 logeESD(μm), standard deviation at 2 logeESD(μm) and a constant offset of 1 mmol-Cm-3 for each size bin. Initial intracellular nutrient quotas for both nitrogen and phosphorous are at their maximum. The initial ambient dissolved nitrogen (N) and phosphorous (P) concentration are set to 7 mmol-Nm-3 and 0.8 mmol-Pm-3, respectively. Both small and large ciliates are assumed to have equal initial values (0.25 mmol-Cm-3), while the biomass concentration of copepods start at 5 mmol-Cm-3, detritus N and P at 1.8 mmol-Nm-3 and 0.005 mmol-Pm-3. All model parameters used in the reference run are summarized in Tables S5, S6.
2.3.2. Physiological Parameters
As explained in more detail by Taherzadeh et al. (2017), phytoplankton growth and nutrient uptake parameters are linked to cell size (master trait) through the power law function (y = βVα). These size allometries result in group specific values for maximum uptake rate (vmax), maximum growth rate (μmax), nutrient affinity (A), minimum and maximum cell quotas (Qmin and Qmax). The employed allometric scaling relationships are drawn from recently published studies and are summarized in Table S7.
2.4. Validation Data and Environmental Forcings
To test the model skill, we compiled and used data from the Kristineberg mesocosm experiments, conducted in the Gullmar Fjord (Kristineberg, Sweden) between March and July 2013 (113 days) as part of the BIOACID (Biological Impacts of Ocean ACIDification) project phase II. The ten mesocosm bags of 55.5 m3 volume contained the natural plankton spectrum after passing a 1 mm mesh. Five control treatments were hold at present day CO2 conditions (~380 μatm pCO2, here termed LpCO2), whereas the other five were enriched with CO2-saturated water to emulate the expected end-of-the-century carbonate chemistry conditions (~760 μatm pCO2, HpCO2). A comprehensive description of the experimental design and technical details are given by Bach et al. (2016). For the validation runs, time-series of pCO2, temperature, mixed layer depth (MLD), PAR, and measured zooplankton data were used as forcing. We converted copepod abundance data to biomass by multiplying with a constant factor of 4 × 10⁻⁴ mmol-C/Ind.
We averaged the data of the LpCO2 and HpCO2 replicates to yield time-series in chlorophyll a (Chla), dissolved inorganic nitrogen (DIN), and dissolved inorganic phosphorous (DIP) concentrations as reference for calibration. All model parameters were identical in the two scenarios.
2.5. Numerical Stressor Experiments and Interaction Traits
Numerical stressor experiments were run at low pCO2 and low grazing pressure on the community structure. The relatively strong size selective grazing pressure in the validation runs owing to (artificially) elevated copepod abundance was lowered by reducing the prey affinity of copepods to allow for moderate co-existence of all phytoplankton size classes. This implies that in the experiments zooplankton was dynamically resolved as state variable.
We considered two perturbations (here termed stressors) prevalent in pelagic ecosystems: nutrient enrichment (+Nut) (0.2–5 mmol-N m−3) and zooplankton removal (−Zoo) (0.4–2.5 mmol-C m−3). Variations in nutrient levels and zooplankton grazing are commonly perceived as most important for phytoplankton dynamics (Duffy, 2003; Kneitel and Chase, 2004; Gruner et al., 2008). Nutrient enrichment (+Nut) may originate, e.g., from mixing events while zooplankton removal (−Zoo) follows, e.g., from the passage of a swarm of small fish, the major predator of mesozooplankton. Both stressors can be thought to indirectly reflect anthropogenic and climatic changes, such as increased storm frequency or the down-harvesting of large pelagic fish and concomitant rise in small fish. The respective states (N and Z) were perturbed at day 57, when nutrients were limited and also the fluctuation in total phytoplankton biomass was negligible for a short time. These shifts were applied individually and also simultaneously at distinct intensities.
All experiments were repeated using a single phytoplankton size class only, with cell size of 3.5 log(ESD), which corresponds to a time- and community-average in most of our multi-species simulations. This setting emulates simple NPZD models neglecting trait dynamics and adaptive capacity. Using both the multi- and mono-species configuration, the response of total net growth rate of the community to both single and combined stressors were traced over time and averaged for distinct periods depending on the nutrient state.
From the definition of the two stressors, we deduced the relevant interaction traits following the rationale given in the Supplementary Material and summarized in Equation (3). Each interaction trait represents the growth dependency on a specific ambient factor (stressor). In case of nutrient limitation, the interaction trait quantifies the nutrient uptake affinity of species. Species that are most sensitive to limiting nutrients are characterized by low nutrient uptake affinity. These weakest competitors benefit most from the nutrient addition. In case of losses due to copepod grazing, the interaction trait of species can be interpreted as the susceptibility to grazing. The most edible species gain most from zooplankton removal. The community mean of both traits, are inherently related due to their dependencies on the size distribution, which is an example for a size–related trade-off.
3. Results
3.1. Model Validation
The reference simulation features a pronounced bloom in Chla parallel to a complete drawdown in DIN and DIP, followed by a second bloom at deplete nutrient conditions (Figure 2). This dynamics corresponds to the (average) time evolution of Chla, DIN and DIP concentration observed in the outdoor mesocosms. Using measured zooplankton as external forcing leads to a nearly precise reconstruction of the second phytoplankton bloom, including the differences between control and treated pCO2 environments (Figure 2), which approves a high skill in particular of the phytoplankton model.
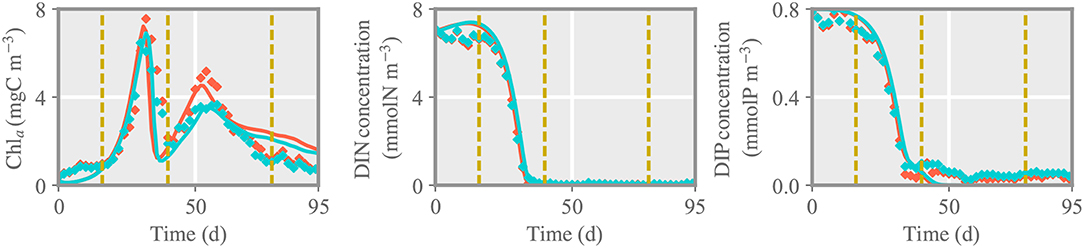
Figure 2. Comparison between chlorophyll a (chla), dissolved inorganic nitrogen and phosphorous concentration (DIN, DIP) of the reference run and measured data for the control (LpCO2, blue) and treated (HpCO2, red) mesocosms. Solid lines and diamonds represent model results and measured data, respectively. Dashed lines separate different phases of the experiment: initial, first and second spring bloom, and post-bloom phase.
The variations in individual process rates shown in Figure 3 disclose possible mechanisms underlying the observed phytoplankton dynamics and how their relevance is changing through the different growth phases. During the initial phase of the simulation, phytoplankton biomass decreases slightly due to aggregation until day ~10 for both pCO2 scenarios. Later around day 30, with gradual drawdown of nutrients (Figure 2), phytoplankton pigment and biomass concentration peaks and abruptly declines upon depletion of nutrients around day 40, because of aggregation together with ongoing grazing (Figure 3A). This reduction appears earlier in the simulation than the data suggest. At this time, strong copepod grazing pressure on intermediate size phytoplankton (~3 logeESD) creates a bimodal size distribution with two distinct size groups of small (2–15μm ESD) and large model species (150-500μm ESD) (Figure 3B). Following the collapse of the first bloom, remineralized nutrients and direct excretion of nutrients by zooplankton enable the formation of a second bloom. Respiratory carbon losses prevail over grazing losses in the first half of the simulation, thus until the second bloom. The effect of high and low pCO2 becomes visible during the second bloom, under elevated pCO2 mainly due to higher copepod biomass and thus faster nutrient regeneration in that treatment, which leads to higher phytoplankton biomass especially in the size class representing large and nearly inedible Coscinodiscus sp. (Figure 3B). Toward the end of simulation, ongoing grazing pressure together with mixotrophic grazing and sinking determine the collapse of the second bloom.
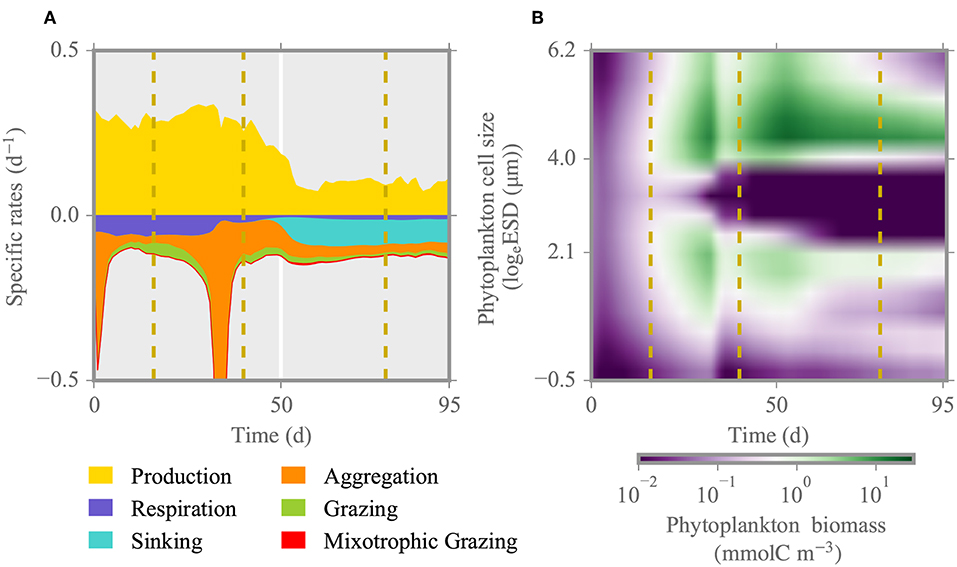
Figure 3. Specific rates and phytoplankton biomass distribution for the reference run under high pCO2 condition (HpCO2). (A) Total phytoplankton production and loss rates over the time of experiment. (B) Individual phytoplankton biomass distribution. Dashed lines denote different phases of the experiment: initial, first and second spring bloom, and post-bloom. The size range corresponds to 0.6–500 μm ESD.
3.2. Stressor Effects
3.2.1. Nutrient Enrichment
Directly after injection of nitrogen at day 57, total net growth rate of the model community increases, resulting in higher phytoplankton biomass production (Figures 4I, 5I). After a short delay, also simulated zooplankton starts to grow. The higher biomass level of copepods translate to increased top-down control of both ciliates and phytoplankton. Biomass of small and large ciliates does not change pronouncedly as being already at a very low level. When the injected nitrogen pulse diminishes around days 60–70, aggregation and grazing turn the total net growth rate negative, lowering community biomass production. Owing to the increased copepod biomass, size separation at phytoplankton species with cell size of ~3 logeESD intensifies around day 65 (Figure 5I). A greater copepod stock also favors small species, which make the optimal prey for ciliates. After total drawdown of the injected nitrogen, excretion of nutrients by the decreasing copepod stock and nutrient remineralization fuel the production of mostly small species with cell size ~2–3logeESD.
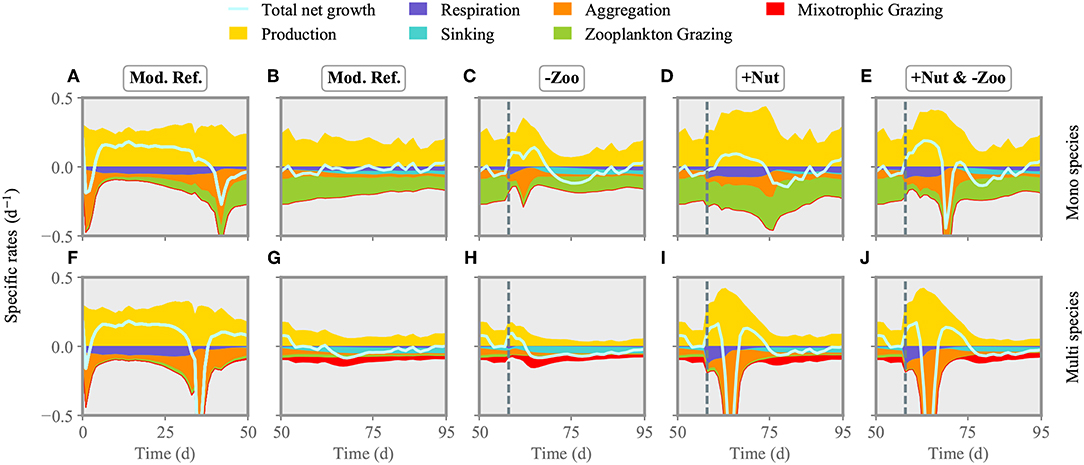
Figure 4. Comparison of phytoplankton production and loss terms between the mono species model (A–E) and the one with multi species (F–J). The reference run is shown for the first (A,F) and second half of the experiment (B,G). The two single/multiple stressors grazer removal (-Zoo, C,I) and nutrient enrichment (+Nut, D,H) are combined in the multiple stressor experiment (E,J). The solid line shows relative growth rate (production-losses) of the entire community. The dashed line indicates the time of stressor application.
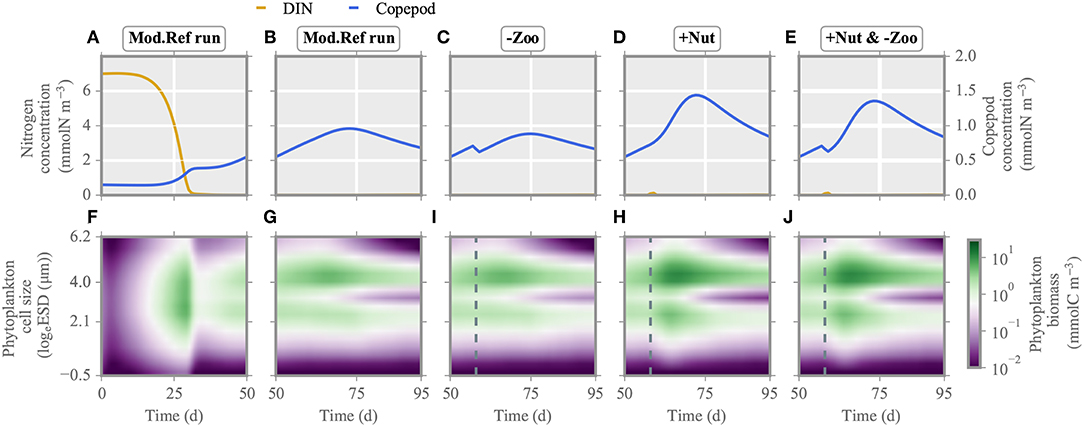
Figure 5. Multi-species model: nitrogen concentration, copepod biomass (A–E) and phytoplankton biomass distribution (F–J) under single/multiple stressors. Analogous to Figure 4, the reference run is shown for the first (A,F) and second half of the experiment (B,G). The two single/multiple stressors grazer removal (-Zoo, C,I) and nutrient enrichment (+Nut, D,H) are combined in the multiple stressor experiment (E,J). Again, the dashed line indicates the time of stressor application. See Figure S2 for the mono-species model.
3.2.2. Grazer Removal
Removal of much of the zooplankton standing stock (Figure 5C) results in a transient increase, followed by a transient decrease, of total net growth rate (Figure 4H). However, the gain in primary production is lower compared to the one in the nutrient enrichment scenario, as during the time of relieved grazing pressure, phytoplankton remains much limited by nutrients. The removal of grazers slightly favors intermediate size classes, so that these smoothly recover from very low biomass levels (Figure 5H), while larger species outside the size grazing kernel of copepods remain unaffected. However, removal of copepods relieves the ciliates. Their growth slightly reduces the biomass of small species until copepods start to recover shortly after application of the stressor. At that point, total phytoplankton biomass declines. Further mixotrophic grazing, sinking and aggregation also contribute to the decrease of total net growth rate enduring from approximately day 60 toward the end of simulation.
3.2.3. Nutrient Injection and Grazer Removal
Both nitrogen injection and zooplankton removal, when acting as single stressors, increase the phytoplankton standing stock directly after exposure as explained above. Also when both are applied at the same time, net growth rates increases (Figure 5E). The first 20 days after exposure, changes in the phytoplankton community dynamics are similar to the ones in the nutrient enrichment scenario (Figures 4, 5J). Thereafter, as nutrients are again depleted and zooplankton biomass stays relatively constant but lower compared to the nutrient injection scenario, the phytoplankton community reacts similar to the scenario of (only) zooplankton removal. Hence, although both stressors are applied at the same time, their dominant impact is organized sequentially, here first similar to nutrient enrichment then to zooplankton removal.
3.3. Switching Off Adaptive Responses
We compared the results of the multi species model with a mono species scenario to highlight the importance of species sorting and structural changes. In the reference run and all scenarios, the mono-species (fixed cell-size) phytoplankton community reaches in average higher primary production rates and is much more top-down controlled compared to the multi-species community (Figure 4). There, mixotrophic grazing and occasionally aggregation make the major loss processes. The mono species phytoplankton compartment experiences a positive net growth rate until day 45, when both aggregation and copepod grazing terminate the bloom and turn the net growth rate negative (Figures 4A,B). The mono-species phytoplankton community responds to nutrient enrichment more moderately compared to the multi-species community. This pattern is mostly due to limited aggregation losses in the aftermath of the nutrient injection (Figure 4D). The lack of inter-specific competition in the mono-species community, and thus the lack of ecological selection and dominance of the most competitive species for nutrient uptake, extend the period of nutrient replete conditions. This situation further leads to higher copepod biomass. Removal of the copepods increases both production and aggregation of mono-species phytoplankton community, but the relieve from the major loss factor stimulates a stronger biomass gain in relation to the adaptive case (Figure S2). Subsequently, copepods start to recover and graze down the phytoplankton (Figure 4C). Simultaneously injecting nutrients and removing copepods (Figure 4E) strongly enhance positive growth rates until day ~65, where a short phase of intense aggregation terminates the bloom. This pattern is qualitatively similar to the multi-species case, but differs from the non-adaptive response to single stressors.
3.4. Effect Size Dependent on Adaptive Capacity
Changes in the phytoplankton community composition as induced by single and multiple stressors are displayed in Figure 6. Size dependent alterations are shown for two characteristic periods after exerting the stressors, i.e., under nitrogen replete (day 59) and deplete (day 75) conditions. In the nutrient replete phase, stressor induced changes in (biomass weighed) net growth rate are maximal at small and large cell sizes (around 2 and 4 logeESD), thus creating a bimodal size distribution as also evident in Figure 6.
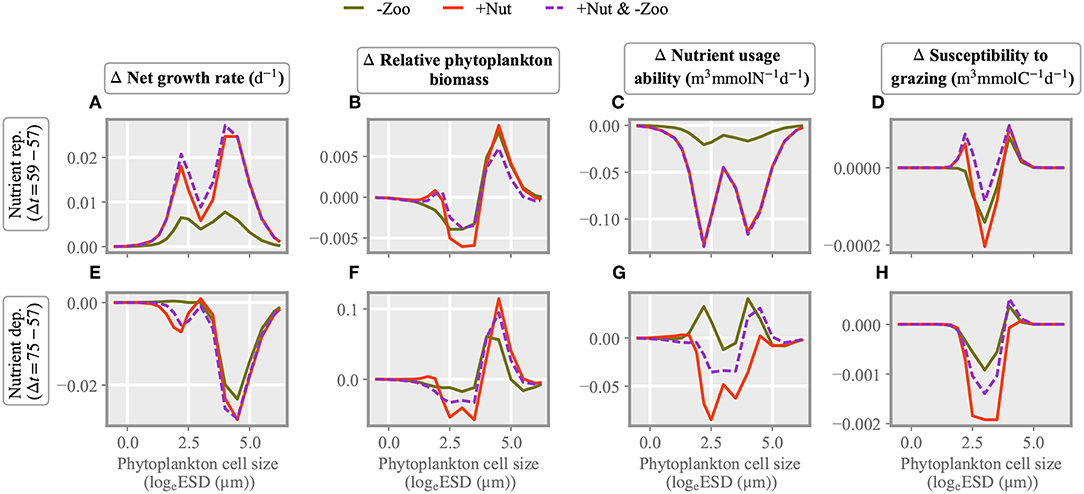
Figure 6. Changes in size dependent characteristics from the state before stressor application: in the contribution of each size class to total net growth rate (A,E), in the phytoplankton density distribution (B,F), and in interaction traits, the relative nutrient usage ability (C,G) and susceptibility to copepod grazing (D,H). The difference is taken either 2 (A–D) or 18 days (E,F) after stressor exertion.
The community composition under combined perturbation in nutrient and grazing levels is similar to the one under nutrient injection, which reflects stronger growth stimuli compared to the zooplankton removal scenario. This pattern reappears in the modification of the biomass size spectrum (Figure 6B) as well as of the nutrient usage ability (Figure 6C). The latter increases for small model species because of their higher nutrient affinity and for very large size classes because of their lower subsistence demand. Nutrient usage ability declines for intermediate size phytoplankton but, averaged over the entire community, increases in the “−Zoo” and the combined stressor scenario due to the increasing dominance of larger cells with lower subsistence demand and thus elevated nutrient usage ability. In the intermediate size range, the susceptibility to copepod grazing slightly decreases under all three stressor scenarios (Figure 6D). In the subsequent nutrient deplete phase, most effects on growth rate and interaction traits are roughly reverted with respect to the initial nutrient replete phase, which indicates a relaxation of the community structure to the original state. Average community growth rates are close to zero after the multiple stressor application and negative in the single stressor experiments, and so are biomass changes. Nutrient usage ability has increased under the “−Zoo” perturbation, while becoming negative for the “+Nut” and the combined scenario. Also susceptibility to grazing has increased in the “−Zoo” case, whereas in the other cases it approaches zero. To sum up, changes in the two interaction traits are in general negatively correlated immediately after stressor application while positively correlated around 2 weeks thereafter. Trait and growth effects after the onset of a combined stressor with few exceptions resemble the ones in the “+Nut” case.
3.5. Changes in Multi-Stressor Sensitivity Over Cross-Trait Variations
When the numerical stressor experiments are run with distinct intensities of nutrient pulses and copepod removals, we obtain a striking pattern in the relation between the cross-trait variation (CTV) and the specific multi-stressor sensitivity (SMS) (Figure 7). First, both the SMS and CTV increase over time and the SMS switches from antagonistic to synergistic few days after parallel application of the two stressors. Our results reveal a relatively uniform relationship between CTV and SMS throughout time, independently whether nutrient or grazing stress has been varied. Synergistic effects exclusively occur at positive cross-variations in traits, thus when effective traits shift to higher values under application of complementary stressors, which here means increased nutrient usage ability under grazing removal and increased grazing susceptibility under nutrient pulses.
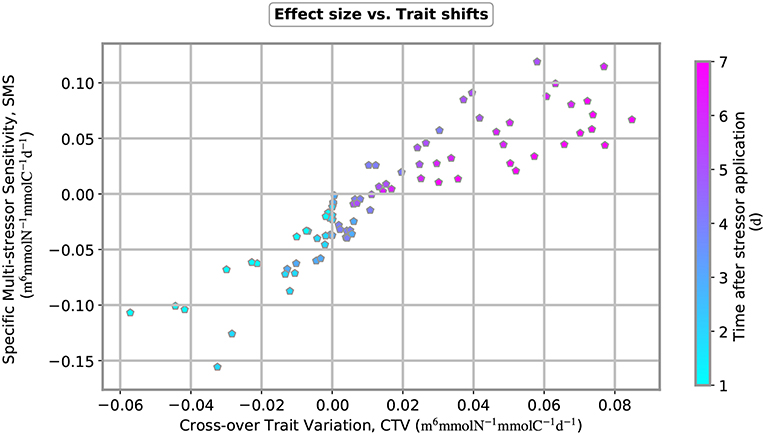
Figure 7. Specific multi-stressor sensitivity (SMS) plotted over cross-trait variation (CTV) for 12 multi-stressor experiments. Nutrient input was varied from 0.2, 0.4, 0.8 to 1.6 mmol-N m−3 and copepod removal from 0.4, 1.3 to 2.5 mmol-C m−3. Both measures, SMS and CTV, change over time after stressor application, as indicated by the color coding of the plot symbols.
4. Discussion
4.1. Model Performance
Our size-based model demonstrates high skills in reproducing average trajectories of Chla, DIN and DIP observed during the Kristineberg mecososm experiments. This is remarkable since model equations and parameters including allometric scalings were chosen in accordance with mechanistic theories of phytoplankton growth (Morel, 1987; Wirtz, 2013). However, some model coefficients describing relevant processes, such as aggregation or the fraction of dissolved nutrients released by mesozooplankton could not be constrained by theory or data and thus had to be calibrated. As a result, the model well-captures the first and second Chla bloom including their decay and the speed of the nutrient drawdown. Furthermore, it also reproduces the observed bi-modal size structure of the phytoplankton community. As described by Bach et al. (2016), the most important species contributing to the Chla build-up were the small (2–5 μm) silicifying species Arcocellulus sp., Minidiscus sp. (both diatoms), and Tetraparma sp. (Chrysophyte) as well as the very large (>200 μm) diatom Coscinodiscus sp. In addition, the main taxa contributing to the second bloom were small (2–5 μm) diatoms (Minidiscus sp., Arcocellulus sp.), a large variety of small green flagellates (0.8–5 μm) and Coscinodiscus sp. Initial (<day 20) moderate mismatches between observed and simulated states may reflect weaknesses in our assumptions on nutrient uptake. Another small discrepancy between data and model appears in the collapse of the first bloom. The function describing phytoplankton TEP production and concomitant particle aggregation has been tested within the model calibration phase to emulate a necessary strong amplification of aggregation at the onset of nutrient limitation. However, it may still neglect dynamic aspects including delays in aggregate formation. And despite the physiological and ecological detail rarely considered en suite in state-of-the-art models, not all processes relevant to achieve full consistency between observations and simulations, are taken into account. For example, viral infection may influence phytoplankton mortality rate (Brussaard, 2004; Mateus, 2017) and variable sinking velocity (Wirtz, 2013) can lead to a different reduction of Chla.
4.2. Processes Shaping Community Dynamics
The phytoplankton dynamics in the model turns out rather robust against ±20% variations in the most relevant parameters; large alterations were only found for the simulated second bloom, which in particular is most sensitive against changes in allometric coefficients of physiological traits (Figure S2). The importance of such size scaling relationships on shaping the phytoplankton community structure and dynamics was previously investigated by Taherzadeh et al. (2017) using a predecessor model variant. Taherzadeh et al. also demonstrated that physiological size constraints alone cannot provide realistic simulations of phytoplankton size structure, which implies a high relevance of other mechanisms, such as selective grazing, aggregation and sinking. The extended model presented here confirms this finding and emphasizes the role of such processes for shaping ecosystem dynamics especially after the first spring bloom peak, which agrees with previous studies (Armstrong, 1994; Poulin and Franks, 2010; Wirtz and Sommer, 2013; Ward et al., 2014). Selective grazing can reduce the ability of the strongest competitors to dominate the community (Thingstad, 2000). Ongoing grazing of intermediate size species by copepods and of small ones by ciliates allows larger phytoplankton species to grow despite their inferior uptake and growth capabilities. The balance between many size dependent growth and loss factors, most of all nutrient uptake, growth and grazing, has led to coexistence of most size classes in nearly all simulations.
4.3. Perturbations in Nutrient and Grazing Levels
In the global ocean, intermittent enrichment of surface water by deep water nutrients is one of the major natural perturbations affecting phytoplankton growth and community composition. Such nutrient additions are generated by various physical processes like internal waves, mesoscale eddies and vertical convective mixing (McGillicuddy et al., 2003). The injections can vary in their duration from hours to few days in coastal waters, and to monthly or even longer periods in the open ocean (Gargett, 1991). Our nutrient injection experiments emphasize the role of grazing in nutrient rich waters as major process buffering the effect of nutrient addition and hence, keeping the size structure of the community within an observed typical range (Finkel et al., 2010). Thus, although larger species gain an advantage under nutrient additions, mesozooplankton limits their excessive growth. Conversely, small species with high area-to-volume ratios and high nutrient affinity are in general favored in oligotrophic oceans (Moore et al., 2013).
Copepod mortality through consumption by higher trophic levels, such as jellyfish and fish larvae or juveniles often makes the second most important natural stressor influencing the lower marine food-web (Gruner et al., 2008). The results of our individual stressor studies suggest that both, nitrogen enrichment and copepod removal enhance the total net growth rate and biomass production for all phytoplankton size classes, even though not with equal share. Concurrent application of these two stressors indeed leads to higher positive net growth rate directly after exertion. The growth stimulus is not additive, thus smaller than the sum of the effect of the single stressors. It also triggers a major loss event by amplified aggregation about ten days after the perturbation, and buffers a part of the environmental improvement to the subsequent period.
4.4. Role of Trait Responses
Buffered responses are different to the picture produced by the mono-species model, which subsequently buffers a part of the environmental improvements. Without the capacity for trait shifts, the multiple stressors application does not lead to sustained positive growth effects. Persistent exploitation of growth stimuli even during the nutrient deplete phase therefore seems to require re-organization of structure in the multi-species community, which is most pronounced under multiple stressors application. This finding emphasizes the usefulness of our size-based modeling approach when assessing impacts of multiple stressors on the phytoplankton community. The lack of response buffering through re-organization of the size structure in the mono species community results in excessive primary production, which subsequently is strongly counteracted by zooplankton grazing mostly because the susceptibility of phytoplankton remains constantly high over time. As a consequence, the mono-species phytoplankton community is much more top-down controlled compared to the multi-species scenario. Removing internal degrees of freedom for size structure fails to track observed community size distribution in nature and also leads to the inability of the simulated community biomass to respond realistically to sudden shifts in environmental conditions.
When applied simultaneously, the two stressors act as a single intense perturbation event on the multi-species community that was expected to result in a synergistic community response (Gunderson et al., 2016). However, our results show the opposite. The model outcomes demonstrate that, during the initial phase the overall net effect of combined stressors on the community is similar to the one of nutrient enrichment in isolation. Therefore, based on the additive model proposed by Crain et al. (2008), the combined stressor interact antagonistically because their impact cancels single nutrient enrichment stressor effects, resulting in a combined net effect smaller than the sum of individual stressors. About a week after exertion of stressors, the net effect of multiple stressors on the total net growth rate and phytoplankton biomass becomes larger than the sum of two single stressors, hence, combined stressors interact synergistically on the response variables (Figure 6, bottom panel).
Our finding on the combined effect of two major environmental stressors for phytoplankton growth points to a possibly more general temporal sequence of accompanying changes at the community and ecosystem level. Over time, the response to nitrogen injection and copepod removal switches from antagonistic to synergistic community as traits change along a trade-off, here induced by shifts in the size distribution that in turn affect nutrient usage ability and susceptibility to copepod grazing. After a delay, the nutrient usage ability is higher under the “removal” scenarios compared to the “pulse only” scenario. Likewise, edibility becomes lower under the “pulse” scenarios compared to the “removal only” case. This positive cross-variation in the major interaction traits mediates a temporal change in the interaction type.
4.5. From Antagonism to Synergy
This change from an antagonistic to a synergistic response is also in agreement with previous studies. For example, the meta analysis of Darling and Côté (2008) indicated that experimental duration might be associated with the interaction type, or Reich et al. (2006) suggested that the net effect is shifted from antagonistic to synergistic over the course of a 6-years experiment when analyzing the interaction between effects of nitrogen availability and CO2 addition on total plant biomass. In general, directly after exertion of any multiple stressor, new environmental conditions can restructure a community constrained by trade-offs. However, over time competitive exclusion following resource depletion reduces the number of species such that only a few (superior) species will manage to survive (Reynolds et al., 1993; Sommer, 1995; Collins and Glenn, 1997; Lindenschmidt and Chorus, 1998). Therefore, we observe a synergistic interaction between multiple stressors resulting in a detrimental impact on the diversity in the community.
4.6. Multi-Stressor Sensitivity Explained by Cross-Over Trait Variation
A first major finding of this study is the emergent proportionality between specific multi-stressor sensitivity and cross-over variations in effective traits:
This relation can be theoretically justified using linear perturbation theory within the new formalism introduced in this work. Despite the scatter, the relation shown in Figure 7 demonstrates an unexpected relatedness between the two independent measures. This framework thus proved ability to link single stressor effects and trait dynamics to multi-stressor effects. It allows to identify possible determinants of the non-linear interaction between stressor reactions with special focus on internal re-organization of biological agents. The requirement of functional knowledge about trade-offs that reflect bio–mechanic constraints related to morphology or bioenergetics can be increasingly met for plankton and presumably also for other organism groups due to current advances in trait-based ecology. Trade-offs are inherent to variations to interaction traits, which in turn incorporate the response specific stressors, such as the nutrient usage ability (w.r.t. nutrient limitation) or the susceptibility to grazing. The two new measures SMS and CTV may serve as powerful tools when understanding or even predicting often diverging responses of complex systems under multiple stressors.
5. Conclusion
Phytoplankton communities are increasingly subject to natural or anthropogenic stressors. As effects of each stressor may vary due to the current state of eco-physiological traits and also due to properties of the stressor itself (intensity and duration), it remains one of the most challenging problems to determine the impacts of combined stressors on marine ecosystems. The approach proposed in this study proved its ability to explain when impacts become additive or non-additive. One pre-requisite was a new size-based plankton model resolving major dependencies of plankton growth and interaction rates. We specifically illustrated that a mono-species model without size dependencies in eco-physiological traits does not have the ability to track realistic responses of planktonic ecosystems to environmental changes. A second pre-requisite is our new formalism that features two measures of often puzzling multi-stressor responses in complex systems: specific multi-stressor sensitivity and cross-trait variation. The novel formalism helped to reveal that those two measures are closely correlated as apparent from a systematic investigation of the influence of multiple stressors on a model plankton community. The approach thus offers a way to mechanistically explain the variety of responses and interaction types observed in natural systems with special consideration of community re-organization.
Trade-offs between interaction traits, defined by phytoplankton allometric scalings and size-based grazing, can infer positive cross-variations over time such that the impact of multiple stressors switches from antagonistic to synergistic. Our work highlights role of the duration of experiments for the occurrence of synergistic responses. Thus, to be more general, directly after exertion of any (positive) stressors, the newly created environment can favor various groups of species leading to coexistence of different size classes. Later, as conditions becomes severe only superior species are able to withstand and survive. Hence, we observe a switch from antagonistic and synergistic interaction over time.
These results highlight the potential of our size-based model in combination with our new trait-based formalism to relate community responses with trait shifts under imposed stressors, and thus to help develop future research on the impacts of various multiple stressors on marine ecosystems.
Author Contributions
All authors listed have made a substantial, direct and intellectual contribution to the work, and approved it for publication.
Funding
This work was supported by the Helmholtz Society via the program PACES, by the German Research Foundation (DFG) within the Priority Program DYNATRAIT, by the German Federal Ministry of Research and Education in the framework projects MOSSCO and BIOACID.
Conflict of Interest Statement
The authors declare that the research was conducted in the absence of any commercial or financial relationships that could be construed as a potential conflict of interest.
Acknowledgments
We thank Lennart T. Bach, Tim Boxhammer, Henriette Horn, Onur Kerimoglu, Carsten Lemmen, Maria Moreno de Castro, Markus Schartau, Ulrich Sommer, and Jan Taucher for fruitful discussions.
Supplementary Material
The Supplementary Material for this article can be found online at: https://www.frontiersin.org/articles/10.3389/fmars.2019.00351/full#supplementary-material
References
Agawin, N. S. R., Duarte, C. M., and Agustí, S. (2000). Nutrient and temperature control of the contribution of picoplankton to phytoplankton biomass and production. Limnol. Oceanogr. 45, 1891–1891. doi: 10.4319/lo.2000.45.8.1891a
Armstrong, R. A. (1994). Grazing limitation and nutrient limitation in marine ecosystems: steady state solutions of an ecosystem model with multiple food chains. Limnol. Oceanogr. 39, 597–608.
Bach, L. T., Taucher, J., Boxhammer, T., Ludwig, A., Consortium, T. K. K., Achterberg, E. P., et al. (2016). Influence of ocean acidification on a natural winter-to-summer plankton succession: first insights from a long-term mesocosm study draw attention to periods of low nutrient concentrations. PLoS ONE 11, 1–33. doi: 10.4319/lo.1994.39.3.0597
Brussaard, C. P. (2004). Viral control of phytoplankton populations–a review. J. Eukaryotic Microbiol. 51, 125–138. doi: 10.1371/journal.pone.0159068
Cairns, J. (2013). “Stress, environmental,” in Encyclopedia of Biodiversity, Vol. 7, ed S. A. Levin (Waltham, MA: Academic Press; Elsevier), 39–44.
Collins, S. L., and Glenn, S. M. (1997). Intermediate disturbance and its relationship to within-and between-patch dynamics. N. Zeal. J. Ecol. 21, 103–110.
Crain, C. M., Kroeker, K., and Halpern, B. S. (2008). Interactive and cumulative effects of multiple human stressors in marine systems. Ecol. Lett. 11, 1304–1315. doi: 10.1111/j.1461-0248.2008.01253.x
Darling, E. S., and Côté, I. M. (2008). Quantifying the evidence for ecological synergies. Ecol. Lett. 11, 1278–1286. doi: 10.1111/j.1461-0248.2008.01243.x
Duffy, J. E. (2003). Biodiversity loss, trophic skew and ecosystem functioning. Ecol. Lett. 6, 680–687. doi: 10.1046/j.1461-0248.2003.00494.x
Field, C. B., Behrenfeld, M. J., Randerson, J. T., and Falkowski, P. (1998). Primary production of the biosphere: integrating terrestrial and oceanic components. Science 281, 237–240.
Finkel, Z. V., Beardall, J., Flynn, K. J., Quigg, A., Rees, T. A. V., and Raven, J. A. (2010). Phytoplankton in a changing world: cell size and elemental stoichiometry. J. Plankton Res. 32, 119–137. doi: 10.1093/plankt/fbp098
Flöder, S., and Hillebrand, H. (2012). Species traits and species diversity affect community stability in a multiple stressor framework. Aquat. Biol. 17, 197–209. doi: 10.3354/ab00479
Folt, C., Chen, C., Moore, M., and Burnaford, J. (1999). Synergism and antagonism among multiple stressors. Limnol. Oceanogr. 44, 864–877.
Gargett, A. E. (1991). Physical processes and the maintenance of nutrient-rich euphotic zones. Limnol. Oceanogr. 36, 1527–1545.
Gruner, D. S., Smith, J. E., Seabloom, E. W., Sandin, S. A., Ngai, J. T., Hillebrand, H., et al. (2008). A cross-system synthesis of consumer and nutrient resource control on producer biomass. Ecol. Lett. 11, 740–755. doi: 10.1111/j.1461-0248.2008.01192.x
Gunderson, A. R., Armstrong, E. J., and Stillman, J. H. (2016). Multiple stressors in a changing world: the need for an improved perspective on physiological responses to the dynamic marine environment. Annu. Rev. Mar. Sci. 8, 357–378. doi: 10.1146/annurev-marine-122414-033953
Klug, J. L., Fischer, J. M., Ives, A. R., and Dennis, B. (2000). Compensatory dynamics in planktonic community responses to ph perturbations. Ecology 81, 387–398. doi: 10.1890/0012-9658(2000)081[0387:CDIPCR]2.0.CO;2
Kneitel, J. M., and Chase, J. M. (2004). Disturbance, predator, and resource interactions alter container community composition. Ecology 85, 2088–2093. doi: 10.1890/03-3172
Lindenschmidt, K.-E., and Chorus, I. (1998). The effect of water column mixing on phytoplankton succession, diversity and similarity. J. Plankton Res. 20:1927.
Litchman, E., Edwards, K. F., Klausmeier, C. A., and Thomas, M. K. (2012). Phytoplankton niches, traits and eco-evolutionary responses to global environmental change. Mar. Ecol. Prog. Series 470, 235–248. doi: 10.3354/meps09912
Litchman, E., Klausmeier, C. A., Schofield, O. M., and Falkowski, P. G. (2007). The role of functional traits and trade-offs in structuring phytoplankton communities: scaling from cellular to ecosystem level. Ecol. Lett. 10, 1170–1181. doi: 10.1111/j.1461-0248.2007.01117.x
Mateus, M. D. (2017). Bridging the gap between knowing and modeling viruses in marine systems–an upcoming frontier. Front. Mar. Sci. 3:284. doi: 10.3389/fmars.2016.00284
McGillicuddy, D. J., Anderson, L. A., Doney, S. C., and Maltrud, M. E. (2003). Eddy-driven sources and sinks of nutrients in the upper ocean: results from a 0.1° resolution model of the North Atlantic. Glob. Biogeochem. Cycles 17:1035. doi: 10.1029/2002GB001987
Moore, C., Mills, M., Arrigo, K., Berman-Frank, I., Bopp, L., Boyd, P., et al. (2013). Processes and patterns of oceanic nutrient limitation. Nat. Geosci. 6:701. doi: 10.1038/ngeo1765
Morel, F. M. M. (1987). Kinetics of nutrient uptake and growth in phytoplankton. J. Phycol. 23, 137–150.
Poulin, F. J., and Franks, P. J. (2010). Size-structured planktonic ecosystems: constraints, controls and assembly instructions. J. Plankton Res. 32, 1121–1130. doi: 10.1093/plankt/fbp145
Reich, P. B., Hobbie, S. E., Lee, T., Ellsworth, D. S., West, J. B., Tilman, D., et al. (2006). Nitrogen limitation constrains sustainability of ecosystem response to CO2. Nature 440, 922–925. doi: 10.1038/nature04486
Reynolds, C. S., Padisák, J., and Sommer, U. (1993). Intermediate disturbance in the ecology of phytoplankton and the maintenance of species diversity: a synthesis. Hydrobiologia 249, 183–188.
Segner, H., Schmitt, M., and Sabater, S. (2014). Assessing the impact of multiple stressors on aquatic biota: the receptor's side matters. Environ. Sci. Technol. 48, 7690–7696. doi: 10.1021/es405082t
Sommer, U. (1995). An experimental test of the intermediate disturbance hypothesis using cultures of marine phytoplankton. Limnol. Oceanogr. 40, 1271–1277.
Taherzadeh, N., Kerimoglu, O., and Wirtz, K. W. (2017). Can we predict phytoplankton community size structure using size scalings of eco-physiological traits? Ecol. Modell. 360, 279–289. doi: 10.1016/j.ecolmodel.2017.07.008
Thingstad, T. F. (2000). Elements of a theory for the mechanisms controlling abundance, diversity, and biogeochemical role of lytic bacterial viruses in aquatic systems. Limnol. Oceanogr. 45, 1320–1328. doi: 10.4319/lo.2000.45.6.1320
Todgham, A. E., and Stillman, J. H. (2013). Physiological responses to shifts in multiple environmental stressors: relevance in a changing world. Integr. Compar. Biol. 53, 539–544. doi: 10.1093/icb/ict086
Vinebrooke, R. D., Schindler, D. W., Findlay, D. L., Turner, M. A., Paterson, M., and Mills, K. H. (2003). Trophic dependence of ecosystem resistance and species compensation in experimentally acidified lake 302s (Canada). Ecosystems 6, 0101–0113. doi: 10.1007/s10021-002-0102-z
Ward, B. A., Dutkiewicz, S., and Follows, M. J. (2014). Modelling spatial and temporal patterns in size-structured marine plankton communities: top-down and bottom-up controls. J. Plankton Res. 36:31. doi: 10.1093/plankt/fbt097
Wirtz, K. W. (2013). Mechanistic origins of variability in phytoplankton dynamics: part I: niche formation revealed by a size-based model. Mar. Biol. 160, 2319–2335. doi: 10.1007/s00227-012-2163-7
Wirtz, K. W., and Eckhardt, B. (1996). Effective variables in ecosystem models with an application to phytoplankton succession. Ecol. Modell. 92, 33–53.
Wirtz, K. W., and Kerimoglu, O. (2016). Autotrophic stoichiometry emerging from optimality and variable co-limitation. Front. Ecol. Evol. 4:131. doi: 10.3389/fevo.2016.00131
Keywords: phytoplankton, multiple stressors, grazing, nutrient enrichment, antagonistic, synergistic, trade-offs
Citation: Taherzadeh N, Bengfort M and Wirtz KW (2019) A Trait-Based Framework for Explaining Non-additive Effects of Multiple Stressors on Plankton Communities. Front. Mar. Sci. 6:351. doi: 10.3389/fmars.2019.00351
Received: 17 September 2018; Accepted: 06 June 2019;
Published: 26 June 2019.
Edited by:
Cosimo Solidoro, Istituto Nazionale di Oceanografia e di Geofisica Sperimentale (OGS), ItalyReviewed by:
Hoa Thi Thai Nguyen, University of Strathclyde, United KingdomSergio M. Vallina, Instituto Español de Oceanografía (IEO), Spain
Copyright © 2019 Taherzadeh, Bengfort and Wirtz. This is an open-access article distributed under the terms of the Creative Commons Attribution License (CC BY). The use, distribution or reproduction in other forums is permitted, provided the original author(s) and the copyright owner(s) are credited and that the original publication in this journal is cited, in accordance with accepted academic practice. No use, distribution or reproduction is permitted which does not comply with these terms.
*Correspondence: Kai W. Wirtz, kai.wirtz@hzg.de