Observing System Evaluation Based on Ocean Data Assimilation and Prediction Systems: On-Going Challenges and a Future Vision for Designing and Supporting Ocean Observational Networks
 Yosuke Fujii1*
  Elisabeth Rémy2
  Hao Zuo3
  Peter Oke4
  George Halliwell5
  Florent Gasparin2 Mounir Benkiran2
  Nora Loose6,7
  James Cummings8
  Jiping Xie9
  Yan Xue10
  Shuhei Masuda11
  Gregory C. Smith12
  Magdalena Balmaseda3
  Cyril Germineaud5,13
  Daniel J. Lea14 Gilles Larnicol15
  Laurent Bertino9
  Antonio Bonaduce16
  Pierre Brasseur17
  Craig Donlon18
  Patrick Heimbach6
  YoungHo Kim19
  Villy Kourafalou20
  Pierre-Yves Le Traon2
  Matthew Martin14
  Shastri Paturi8
  Benoit Tranchant15
  Norihisa Usui1
- 1Meteorological Research Institute, Japan Meteorological Agency (JMA), Tsukuba, Japan
- 2Mercator Ocean International, Ramonville-Saint-Agne, France
- 3European Centre for Medium-Range Weather Forecasts (ECMWF), Reading, United Kingdom
- 4Commonwealth Scientific and Industrial Research Organisation Oceans and Atmosphere, Hobart, TAS, Australia
- 5National Oceanic and Atmospheric Administration, Atlantic Oceanographic and Meteorological Laboratory, Physical Oceanography Division, Miami, FL, United States
- 6Oden Institute for Computational Engineering and Sciences, Jackson School of Geosciences, The University of Texas at Austin, Austin, TX, United States
- 7Department of Earth Science, University of Bergen, Bergen, Norway
- 8I.M Systems Group, NCEP Environmental Modeling Center, College Park, MD, United States
- 9Nansen Environmental and Remote Sensing Center (NERSC), Bergen, Norway
- 10Climate Prediction Center, National Oceanic and Atmospheric Administration, National Weather Service, National Centers for Environmental Prediction, College Park, MD, United States
- 11Research Institute for Global Change, Japan Agency for Marine-Earth Science and Technology (JAMSTEC), Yokosuka, Japan
- 12Environmental Numerical Prediction Research Section, Meteorological Research Division, Environment and Climate Change Canada, Dorval, QC, Canada
- 13Cooperative Institute for Marine and Atmospheric Studies, University of Miami, Miami, FL, United States
- 14Met Office, Exeter, United Kingdom
- 15Collecte Localisation Satellites (CLS), Ramonville-St-Agne, France
- 16Helmholtz-Zentrum Geesthacht (HZG), Centre for Materials and Coastal Research, Geesthacht, Germany
- 17Université Grenoble Alpes, CNRS, IRD, Grenoble INP, IGE, Grenoble, France
- 18European Space Agency (ESA), European Space Research and Technology Centre, Noordwijk, Netherlands
- 19Ocean Circulation and Climate Research Center, Korea Institute of Ocean Science and Technology, Busan, South Korea
- 20Department of Ocean Sciences, University of Miami, Miami, FL, United States
This paper summarizes recent efforts on Observing System Evaluation (OS-Eval) by the Ocean Data Assimilation and Prediction (ODAP) communities such as GODAE OceanView and CLIVAR-GSOP. It provides some examples of existing OS-Eval methodologies, and attempts to discuss the potential and limitation of the existing approaches. Observing System Experiment (OSE) studies illustrate the impacts of the severe decrease in the number of TAO buoys during 2012–2014 and TRITON buoys since 2013 on ODAP system performance. Multi-system evaluation of the impacts of assimilating satellite sea surface salinity data based on OSEs has been performed to demonstrate the need to continue and enhance satellite salinity missions. Impacts of underwater gliders have been assessed using Observing System Simulation Experiments (OSSEs) to provide guidance on the effective coordination of the western North Atlantic observing system elements. OSSEs are also being performed under H2020 AtlantOS project with the goal to enhance and optimize the Atlantic in-situ networks. Potential of future satellite missions of wide-swath altimetry and surface ocean currents monitoring is explored through OSSEs and evaluation of Degrees of Freedom for Signal (DFS). Forecast Sensitivity Observation Impacts (FSOI) are routinely evaluated for monitoring the ocean observation impacts in the US Navy's ODAP system. Perspectives on the extension of OS-Eval to coastal regions, the deep ocean, polar regions, coupled data assimilation, and biogeochemical applications are also presented. Based on the examples above, we identify the limitations of OS-Eval, indicating that the most significant limitation is reduction of robustness and reliability of the results due to their system-dependency. The difficulty of performing evaluation in near real time is also critical. A strategy to mitigate the limitation and to strengthen the impact of evaluations is discussed. In particular, we emphasize the importance of collaboration within the ODAP community for multi-system evaluation and of communication with ocean observational communities on the design of OS-Eval, required resources, and effective distribution of the results. Finally, we recommend further developing OS-Eval activities at international level with the support of the international ODAP (e.g., OceanPredict and CLIVAR-GSOP) and observational communities.
Introduction
Ocean Data Assimilation and Prediction (ODAP; see Table 1 for summary of essential acronyms) systems, which include ocean reanalysis systems for seasonal forecasting and long-term ocean state estimation systems, are used in a large range of oceanic applications and weather and climate forecasting services as an essential tool for integrating ocean observations and numerical forecasting models (e.g., Davidson et al., 2009; Brassington et al., 2015; Le Traon et al., 2017). The Global Ocean Observing System (GOOS) and Regional Ocean Observing Systems (ROOS) largely depend on ODAP systems for delivering analysis products used to promote safety (e.g., search and rescue or identifying periods of high risk to oil and gas operators) and efficiency (e.g., seasonal prediction to support agriculture or optimal ship-routing) at sea, and societal well-being (e.g., monitoring of our changing climate and protection of marine resources). Therefore, evaluating impacts of ocean observation networks on ODAP products in a scientific way provides important feedback to agencies responsible for maintaining and enhancing the GOOS/ROOS. Observing System Evaluation (OS-Eval) is invaluable to assess the effectiveness in ODAP systems of a novel observation type and to determine optimal network design when planning a new observing system or reorganizing existing observing networks (e.g., Fujii et al., 2015a; Oke et al., 2015a,b). In this context, several efforts of evaluating the GOOS/ROOS using ODAP systems have been made and some are ongoing under the support of ODAP communities such as GODAE OceanView (GOV; Bell et al., 2015) and CLIVAR Global Synthesis and Observations Panel (CLIVAR-GSOP, Caltabiano et al., 2015). In particular, GOV formed the OS-Eval Task Team (TT) in order to promote international collaboration and information sharing on these efforts.
Table 1. Essential acronyms used in this article.
There are several methods of OS-Eval based on ODAP systems that are proposed or have been used before. In the Observing System Simulation Experiment (OSSE) framework, synthetic observation data, intended to mimic observations from the proposed observing system, are generated from a free-running simulation run of an ocean model that is intended to represent the “true” ocean (and is thus called the “Nature Run”), with observation errors added based on information from the observing community (e.g., Hoffman and Atlas, 2015). The synthetic data are assimilated into a different data-assimilative simulation run, called an OSSE, in which different initial/forcing conditions are used. It is also preferable to change the model sufficiently from the Nature Run, either due to reduced resolution or differences in physical parameterizations. The impact of the synthetic data on forecast improvement is assessed from the error reduction in OSSEs when assimilating the new data. In this framework, the errors on the full model space can be directly estimated by taking difference of variables between the Nature Run and OSSE fields. An important aspect of OSSEs is that they can be used for evaluating both existing and future observation data types (e.g., Halliwell et al., 2017).
To evaluate existing observations, Observing System Experiments (OSEs) may be performed. An OSE is a data assimilative run in which a certain observation-type is withheld from, or added to, the regularly assimilated data. The impact of these withheld/added data are assessed by comparing the OSE with the control simulation in which only the regular data are assimilated. Although the methodology of OSEs is simple, it is widely applied due to its applicability to any ODAP system including highly non-linear or stochastic systems, and ability to directly give the differences caused by assimilation of targeted data (e.g., Oke and Schiller, 2007; Turpin et al., 2016; Xue et al., 2017b). In the OSE framework, reduction of errors cannot be estimated accurately because the true state is unknown. Instead, errors are evaluated using reference data, which are preferably independent from the data assimilation process performed in advance in the OSEs in order to perform fair evaluation (Fujii et al., 2015b).
Adjoint based sensitivity methods are also very applicable for OS-Eval. In particular, Langland and Baker (2004) proposed a technique to compute the variation in forecast error due to the assimilated data using an adjoint model, which is often called Forecast Sensitivity Observation Impact (FSOI) and widely used for monitoring observation impacts in weather centers. Meanwhile, Degrees of Freedom for Signal (DFS) are used to indicate how effectively signals which can potentially improve analysis accuracy are observed (e.g., Cardinali et al., 2004). In an Ensemble Kalman Filter (EnKF) system, FSOI, and DFS are evaluated based on statistical information of ensemble members. In addition, the analysis uncertainty (i.e., error variance) in an ODAP system can also be exploited for OS-Eval because the impact of assimilating specific observations can be measured by the uncertainty reduction. The uncertainty is estimated from the inverse Hessian matrix of the cost function in a 4-dimensional Variational (4DVAR) system (Thacker, 1989), while it is approximated by the variance among ensemble members in an EnKF system (Evensen, 2003). These methods are very powerful and allow the impact of all observations to be assessed at once. The main downside of the methods is that make the assumption of linearity. Effective application of these methodologies to oceanic OS-Eval is one of the on-going challenges in ODAP communities.
This paper introduces recent OS-Eval results shared in GOV OS-Eval TT and CLIVAR-GSOP. We then discuss the value of current OS-Eval methods and the future strategy toward more comprehensive and reliable evaluation. The effective use of OS-Eval in support of observing system review and design is also discussed.
Observing System Experiments (OSEs)
In OSEs the impact of an existing observing system or observations is tested by adding or removing it from a data assimilating system. See section Introduction for more details.
OSE Studies for Evaluation of TAO/TRITON Array
The TAO/TRITON array provides subsurface temperature and salinity data in the equatorial Pacific, which was vital for an ocean data assimilation system to provide oceanic initial condition for coupled atmosphere-ocean models in ENSO forecasts before the Argo era (McPhaden et al., 1998). However, the rapid increase in the number of Argo floats in 2000s was presumed to reduce the importance of the TAO/TRITON array as the primary provider of tropical Pacific subsurface data, which in view of the costs of maintaining the array make it crucial to reassess the importance of TAO/TRITON data in seasonal predictions.
ECMWF1 evaluated the impacts of TAO/TRITON, as well as Argo and satellite altimetry data, in their operational seasonal forecasting system through OSEs, and find complementarity among those data in late 2000s (Balmaseda et al., 2007; Balmaseda and Anderson, 2009). Fujii et al. (2011) carried out a similar OSE study to evaluate the impacts of TAO/TRITON data on the ENSO forecasts using the JMA2's seasonal forecasting system at the request of JAMSTEC3, the agency deploying TRITON buoys as a part of the array west of 165°E. These results were shared in the GOV OS-Eval TT (Oke et al., 2009), and presented in OceanObs'09 (Balmaseda et al., 2010).
In spite of these efforts, the data received from the TAO buoys deployed by NOAA4 as a part of the TAO/TRITON array east of 165°E was severely reduced in the period of 2012–2014 (Tollefson, 2014). In addition, the number of the TRITON buoys has also started to reduce since 2013. The influence of the reduction of subsurface temperature and salinity data in the equatorial Pacific was discussed in the Tropical Pacific Observing System (TPOS) workshop in 2014 [hereafter TPOS2014 workshop; Ocean Observations Panel for Climate (OOPC) (2014)]. OSE studies in ECMWF and JMA introduced above and new OSE studies in NCEP5 (Xue et al., 2017b) were summarized in order to highlight the importance of the array for seasonal forecasting (Fujii et al., 2015a). Consequently, the workshop recommended the scientists to make a proposal of reorganizing the TPOS, which includes buoys, Argo, other in-situ measurements and satellite data, in a more efficient and sustainable way by launching the TPOS2020 project (Smith G. C. et al., 2019).
During the TPOS2014 workshop, inconsistency among the impacts of the subsurface data was recognized in OSE results. For example, the results in JMA (Figure 1) indicates that removal of only near-equatorial buoys causes larger decrease of Anomaly Correlation Coefficients (ACCs) compared to the removal of all TAO/TRITON buoys in the forecast Sea Surface Temperature (SST) averaged in the NINO3 region for 9–12 months lead-time and in the NINO4 region for 5–12 months lead-time although Argo and TAO/TRITON data have positive impacts in all cases. The participants considered that these inconsistencies were mostly caused by large systematic errors, or biases, of coupled models, which prevented the systems from extracting the full potential impact of the observation data. The dependency on systematic errors is recognized as a general limitation of OSE studies.
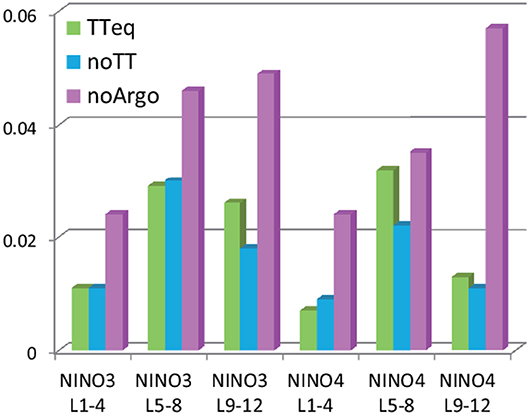
Figure 1. Result of an OSE study evaluating the impacts of TAO/TRITON and Argo data in a seasonal forecasting system in JMA (Fujii et al., 2015a). Compared to a control run this shows a decrease of the ACCs of SST averaged in the NINO3 (5°S-5°N, 90–150°W) and NINO4 (5°S-5°N, 150°W-160°E) regions in the hindcasts from OSEs with removal of TAO/TRITON data only within 2.5°S-2.5°N (TTeq), all TAO/TRITON data (noTT), and all Argo data (noArgo) for the lead-times of 1–4, 5–8, and 9–12 months (L1-4, L5-8, and L9-12, respectively). Hindcasts are started from the end of January, April, July, and October in 2004–2011 with 11 ensemble members. Forecast biases are estimated for each lead month and for each OSE separately, and removed from the forecasted values.
Another problem found in the workshop was that OSEs do not fully evaluate the value of all observation data. It cannot evaluate the value of data which are not assimilated in the system. Therefore, near-surface atmospheric data observed by moorings are not evaluated although they are vital for an ODAP system for seasonal predictions because those data can effectively constrain the atmospheric forcing which is crucial to determine the oceanic interior state. Even the value of temperature and salinity data are not fully evaluated because these data are not only assimilated, but also used for the determination of prescribed error statistics and biases which are indispensable for data assimilation.
In addition, our inability to evaluate the impacts of temporal changes of the observing system in a timely way was also revealed in the workshop (see section Near-Real-Time Evaluation). This motivates work to start routine near real time intercomparison of operational ODAP products (section Use of Multi-system Ensemble Spread).
OSEs for Evaluating Satellite SSS Data Impacts During the El Nino 2015 Event
Monitoring Sea Surface Salinity (SSS) is crucial for understanding and forecasting the ocean circulation, water cycle and the changing of the climate. The recent satellite missions of ESA6's SMOS, NASA7's Aquarius, and SMAP missions have made it possible for the first time to measure SSS from space, and it is important to assess the impact of these measurements in order to justify follow-on missions. However, the assimilation of satellite SSS observations is still challenging because of the various and complex biases that affect them. The difference between the forecast and the satellite SSS can be 5 times larger than the misfit between the forecast and near surface Argo salinity. Nevertheless, several studies (Lee et al., 2012; Reul et al., 2013; Toyoda et al., 2015) show that SSS measured from space can bring new information.
In the framework of the SMOS-Nino15 ESA project8, OSEs were designed to explore the potential impact of SMOS, Aquarius and SMAP SSS data assimilation using the ODAP systems of UKMO9 and Mercator Ocean. The project was expected to produce an Observation Impact Statement (OIS; see section Community Collaborations) based on the OSE activities for the GOV OS-Eval TT. The 2015/16 ENSO event has been chosen as a case study for this project. The ODAP systems are based on the same Ocean General Circulation Model (OGCM) (NEMO; Madec, 2016) but with different settings and atmospheric forcing fields. The data assimilation techniques are also quite different; Mercator Ocean uses a reduced order, localized Kalman Filter approach with a 1-week assimilation window and UKMO uses a 3-dimensional Variational (3DVAR) approach with a 1-day assimilation window. Assimilated data sets in the control simulation are along-track satellite Sea Surface Height (SSH), SST, and in-situ temperature and salinity profiles. The SSS data assimilation is restricted to the 40°S-40°N area, due to increasing uncertainty in the salinity observations at higher latitudes. For both systems, specific bias correction schemes have been adapted to estimate the bias for the different SSS datasets. Performing OSEs with different ODAP systems and data sources allow for more robust conclusions to be made on the sensitivity of ocean estimates to SSS data assimilation.
The success of assimilating SSS data was confirmed by the reduction seen of the Root Mean Square (RMS) differences between SSS observations and model forecast (Figure 2). In both systems, the differences are around or >0.2 PSU when assimilating SSS data (Martin et al., 2018; Tranchant et al., 2019). Changes due to SSS data assimilation are mainly confined to the first 50 m of the water column. Other variables, such as the temperature, velocity and sea level fields are also modified. Looking at the innovation (observation-minus-background differences) statistics for in-situ and altimetry confirms that information brought by the assimilation of SSS data is consistent with that from already assimilated data sets.
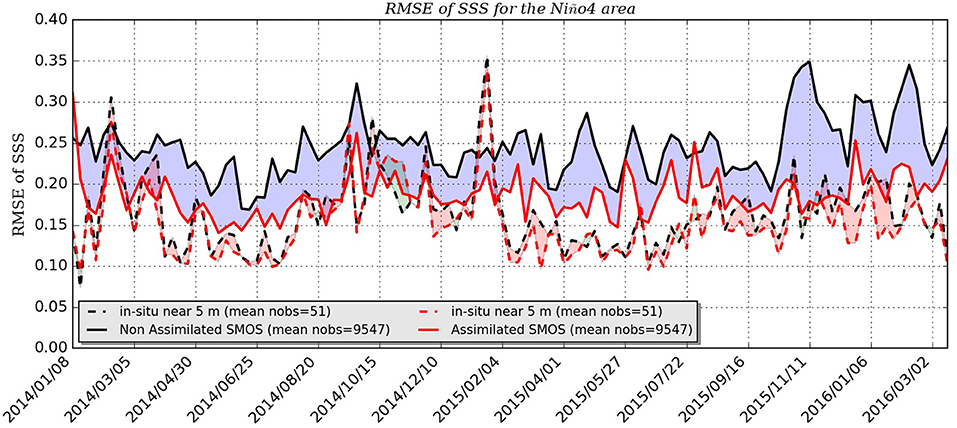
Figure 2. RMS of innovation for SMOS (thick lines) and near surface (5 m depth) in-situ salinity observations (dashed lines) averaged over the NINO4 region: in black the control experiment, in red the OSE with assimilating SMOS data by the Mercator Ocean ODAP system.
These results demonstrate that the ocean forecasting systems are ready to assimilate SSS data, without introducing incoherent information compared to the other assimilated observations. Note to achieve this result an observation bias correction scheme is still needed within the assimilation process, even if a “debiased” SSS data product is used. The RMS differences between model forecasts and observations are, in the Tropical Pacific region, around 0.2 PSU, which gives a quite stringent request on the accuracy of any new measurements.
OSE Studies for Ocean Reanalysis and Seasonal Forecasting
Adding new observation data in an ocean reanalysis should in principle never degrade the quality of analysis or forecast, assuming that the data are assimilated in a consistent way. However, in practice the exploitation of observations is challenging in ocean reanalysis and seasonal forecasts. The forecasts need balanced initial conditions consistent with the model dynamics and physics, so they are able to retain the observational information for longer than the typical assimilation window. In reanalysis, because it is important to retain temporal consistency, systems should be stable to changes in the observing system. OSEs are a practical way to validate consistency of a data assimilation system as well as a method for evaluating impacts of observation data.
For this reason, OSEs are routinely conducted at ECMWF. For example, Balmaseda et al. (2007) reported the impact of the Argo data in the climate of the ocean reanalysis simulated by a previous operational ocean reanalysis system (Balmaseda et al., 2008), showing the large impact in the estimation of salinity, especially in the Southern Ocean. An ensemble of OSEs withholding Argo data was exploited to verify that the increased heat uptake during the recent warming hiatus found in ocean reanalysis was robust to the changes in the observing system (Balmaseda et al., 2013b). OSEs were also conducted to assess the impact of XBT bias corrections and different SST products on the climate variability (Balmaseda et al., 2013a). Assessment of ocean observation impacts on seasonal forecasts is firstly conducted by Alves et al. (2004), which showed that assimilating observations improved the skill of the first operational seasonal forecasting system in ECMWF. Balmaseda and Anderson (2009) reported the impact of different observing systems in a later seasonal forecasting system. They reported that the individual observing systems were shown to improve the seasonal forecasts in most ocean basins, except in the tropical Atlantic, probably because of problems with the data assimilation system in that area.
A series of OSEs has been carried out using a low-resolution version of the latest ECMWF operational ocean reanalysis system OCEAN5 (Zuo et al., 2018). Since sea-level anomaly data were also assimilated in these OSEs, they are different from the OSEs carried out by Zuo et al. (2019). Maps of temperature RMS difference for the upper 700 m between the OSEs and the control experiment (Figure 3) suggest that removal of mooring data from TAO/TRITON, PIRATA, and RAMA arrays (NoMooring) mostly affects the tropical regions alone. Ship-based observations (XBT/MBT and CTD) show important contributions especially in the high-latitude where Argo floats are not often available (e.g., in the Arctic basin). Removal of Argo floats (NoArgo) degrades the ocean state almost everywhere except for the tropical Pacific and Indian Oceans, where the ocean state is well constrained by the assimilation of satellite SSH data (Zuo et al., 2017). Removal of all ocean in-situ observations (NoInsitu) gives an estimation about the total impact of the global in-situ data, which is not a simple linear combination of individual observation types. Note that in the Southern Ocean the RMS difference is sometimes larger in NoArgo than in NoInsitu, which indicates some inadequacy of the data assimilation process. Overall, the weak impact of removal of observations in the Indian Ocean is possibly related to the comparatively sparse observing system in that region. And the tropical Atlantic seems to be generally more sensitive to the removal of in-situ observations than the other tropical ocean basins. It would be useful to assess the robustness of these results by doing the same experiment with different ODAP systems in a multi-system approach (see section Multi-system Evaluation).
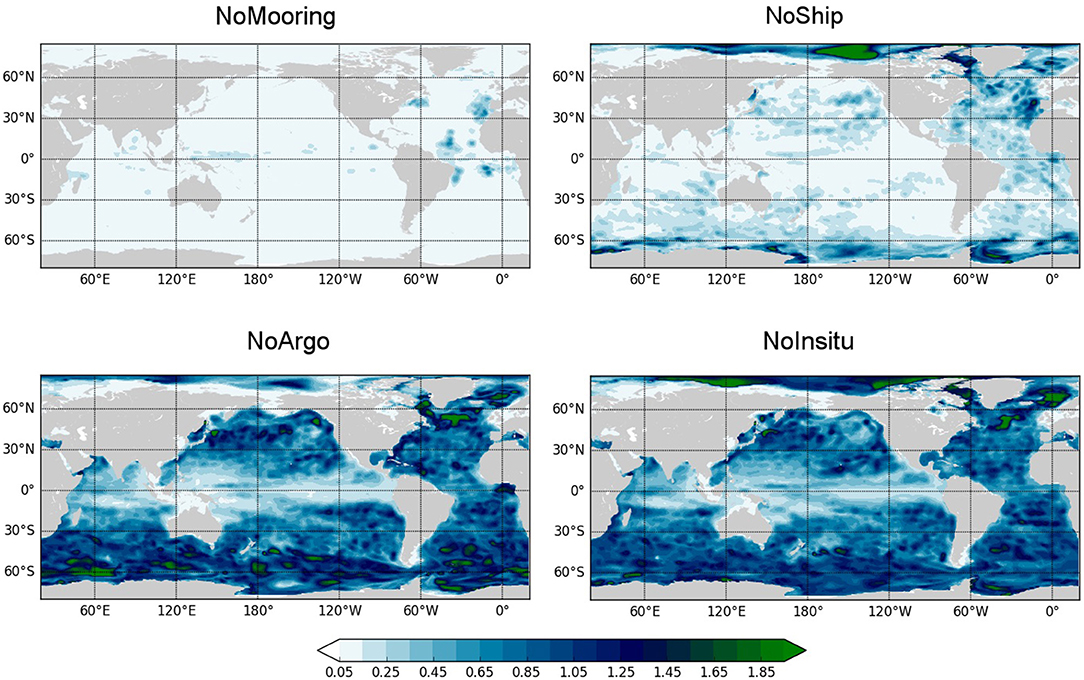
Figure 3. Impacts of ocean observation data evaluated by OSE studies using the latest operational ocean reanalysis system in ECMWF. Plots of normalized RMS differences of upper 700-m column-averaged temperature between the control experiment, in which all in-situ observations are assimilated, and OSEs with removal of mooring data (NoMooring), XBT, MBT, and CTD data (NoShip), Argo data (NoArgo), and all in-situ observations (NoInsitu). Statistics are computed using monthly-mean anomaly data over the 2008–2014 period after removal of the seasonal cycle information, then normalized against the temporal standard deviation of temperature over the same period in the control experiment.
OSEs for assessing ocean observation impacts in seasonal forecasts are now being carried out with the current operational ocean reanalysis and coupled prediction systems in ECMWF. This time, the OSEs are planned to be also used for assessing impacts in sub-seasonal predictions (see section Medium-Range and S2S Coupled Prediction and Coupled Data Assimilation).
OSE Study for Evaluation of Coastal Gliders in a High-Resolution Coastal Model
OSEs are also used to evaluate impacts of coastal observation data/platforms on a high-resolution ocean model (e.g., Oke and Schiller, 2007; Aydogdu et al., 2016). An example of the impact of the assimilation of ocean glider data is presented in Figure 4. The ocean model used is configured based on the Sparse Hydrodynamic Ocean Code (Herzfeld, 2006) for south-eastern Tasmania (Figures 4D,E), and run for a period during April 2009. The model grid spacing ranges from 250 m in the estuary to 2.5 km near the open boundaries (Figure 4F). In the control run without data assimilation, the model mis-represents both the potential temperature (Figures 4A,B,G) and salinity (not shown) fields with temperature errors in excess of 2°C at depth and over 1.4°C at the surface. This error is mostly due to uncertainty in fluxes from the nearby rivers. Then, in the OSE run in this study, glider data are assimilated once a day using the ensemble optimal interpolation (Oke et al., 2002, 2010), with a 91-member ensemble of weekly anomalies. For a full description of the model, assimilation, and experiments performed, the reader is referred to Jones et al. (2012). For this example, the model-observation misfit is reduced by up to 90% with the OSE run reproducing mixing (e.g., 10 April) and re-stratification (e.g., 15 April) events.
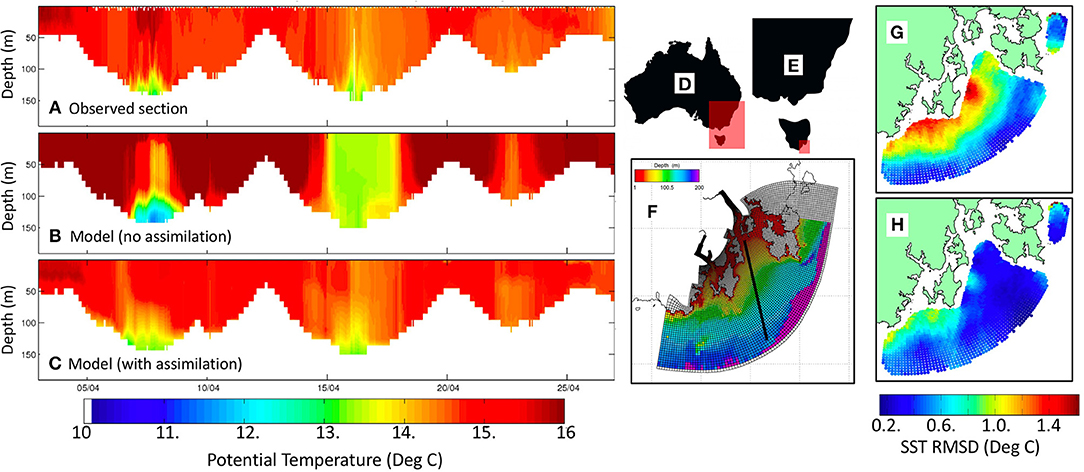
Figure 4. Evaluation of gliders in the coastal sea south-eastern Tasmania using the Sparse Hydrodynamic Ocean Code and Ensemble OI (EnOI) data assimilation. Showing time series of potential temperature from (A) observations, and from the model with (B) no data assimilation (the control run) and (C) with data assimilation (the OSE run). The Model grid is shown in (F), along with the model topography; with the grid location denoted by the red rectangles in (D,E). A map of the RMS difference between the simulated and observed SST (G) without assimilation (the control run), and (H) with assimilation (the OSE run) are also shown. Adjusted from Jones et al. (2012).
The impact of glider data on this high-resolution coastal model is further demonstrated by comparison with unassimilated SST data (Figures 4G,H). The differences between simulated and observed SST are reduced from 0.4-1.4°C (Figure 4G) when the model is run with no data assimilation (the control run) to >0.3°C in the OSE run with data assimilation (Figure 4H). For this example, Jones et al. (2012) report that assimilation of glider data not only helped reproduce the realistic variability of the properties in the coastal ocean, but it also reduced the bias of temperature from 1 to >0.2°C.
Observing System Simulation Experiments (OSSEs)
In OSSEs potential new observations or observing systems are tested by assimilating synthetic observations. See section Introduction for more details.
OSSEs for Evaluating an Underwater Glider Array in Western North Atlantic
A research ocean OSSE system has been developed through collaboration between the NOAA/AOML10 and the University of Miami. The system uses two substantially different configurations of the HYbrid Coordinate Ocean Model (HYCOM) for the free-running Nature Run and the data-assimilative OSSEs. The design and evaluation procedures follow strict guidelines developed for atmospheric OSSE systems to ensure that credible impact assessments are obtained (Atlas, 1997; Hoffman and Atlas, 2015). The system was initially set up and evaluated in the Gulf of Mexico (Halliwell et al., 2014), and then was expanded into a larger Atlantic domain (5°S to 45° N, extending east to 20°W). Rigorous validation of the Atlantic system is presented in Kourafalou et al. (2016), Androulidakis et al. (2016), and Halliwell et al. (2017).
OS-Eval with this OSSE system is used to assess the impact of deploying arrays of underwater gliders on initialization errors in ocean prediction models. Particular focus was given to document the additional positive impact that is realized by using moving platforms, such as gliders, compared to using stationary platforms, such as moorings. Maps of RMS errors with respect to the truth represented by the Nature Run calculated over the time interval July to October 2014 are presented for dynamic height at the surface relative to 1,000 m (D1000, Figure 5). For profiles collected from stationary platforms, large error reduction is concentrated around each measurement location. Observations collected at fixed locations therefore have a limited radius of influence. By contrast, the ability of each moving glider to map a sub-region of the analysis domain extends the radius of influence and roughly equalizes error reduction across the domain.
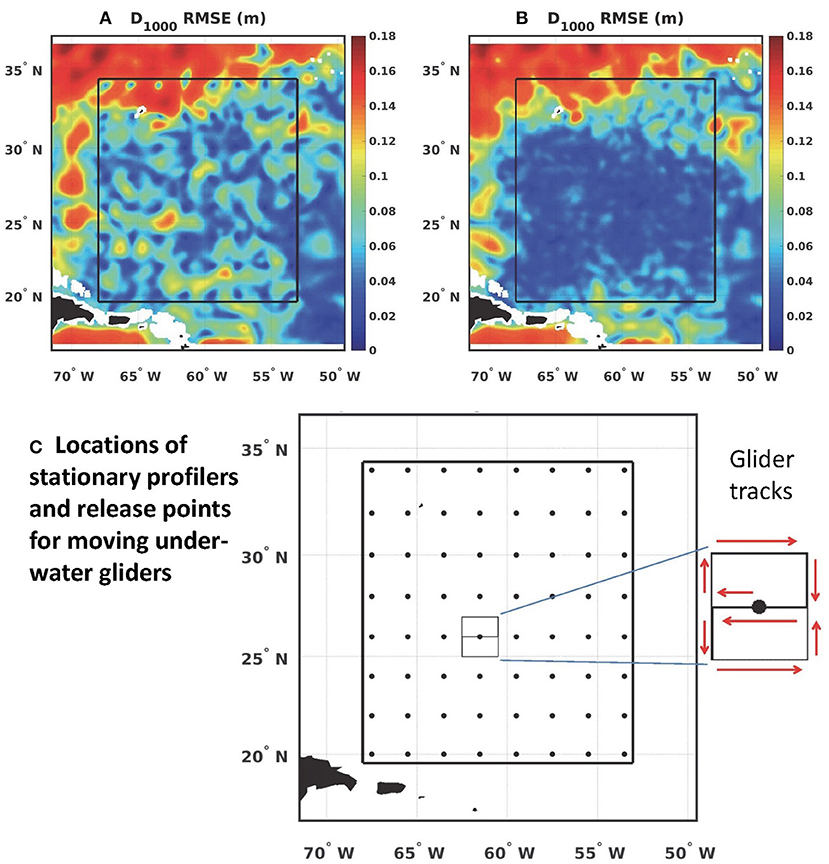
Figure 5. Maps of RMS error in dynamic height at the surface relative to 1,000 m for (A) the stationary profiler experiment, and (B) the moving glider experiment, calculated over the time interval from July to October 2014. Stationary profilers and gliders were released at longitude-latitude grid points shown in (C) with separation distances of 2.0°. All gliders released at these same points executed a reverse figure eight pattern over a track spanning 2° longitude and latitude while traveling at a speed of 0.25 ms−2. Both stationary and moving platforms sample temperature and salinity profiles to 1,000 m depth. The experiments are conducted with the research ocean OSSE system developed by the NOAA/AOML and the University of Miami.
Evaluation of the Observing System Network in the Atlantic
The H2020 AtlantOS project aims at building a multinational framework for a better-coordinated ocean observing system for the Atlantic by involving the main stakeholders from science and society (Visbeck et al., 2015), and leads coordinated efforts by European forecasting centers to provide quantitative information of potential impacts of further evolution of the in-situ networks on global ODAP systems. The main objectives are (i) to help defining and testing future observing systems from an integrated system perspective involving satellite and in-situ observations and numerical models, and (ii) to optimize the use of observation information in the analysis step and to improve the assimilation component. This initiative includes a set of physical OSSEs, using four global eddy-permitting (1/4°) systems, i.e., three ODAP systems (Mercator Ocean, CMCC11, UKMO) and one model-independent analysis system (CLS12). It is important to note that these experiments take fully into account the complementarity between satellite and in-situ observations. Impact of a given in-situ network is not analyzed in isolation and its value is assessed taking into account the information already provided by satellites.
The originality of this study lies in the assimilation in the four global systems of exactly the same synthetic data sets, which are derived from the Nature Run produced with the Mercator Ocean global 1/12° unconstrained model (Gasparin et al., 2018). Potential future evolutions of the in-situ observing system, including Argo floats, drifting buoys, and mooring arrays, are defined based on strong interactions between observation agencies and forecasting centers. To our knowledge, this is the first time that such a coordinated effort is made using OSSEs. The multi-model and multi-approach feature is a critical point to ensure the robustness of the results (see section Multi-System Evaluation).
OSSEs are conducted for five potential future observing system designs as well as for the reference design which includes the satellite component (three altimeters and SST), moorings, XBT, and Argo floats (1 float in every 3° × 3° square). For each design, at least two groups conducted OSSEs and assessed the impacts of the integrated observing system. The doubling of Argo floats in the western boundary current regions and along the equator demonstrates an improvement of both temperature and salinity representation for the entire Atlantic of 5–10% compared with the reference design. Stronger improvements are found in the western boundary current regions and along the equator. These results are consistent with Oke et al. (2015b) and Turpin et al. (2016), who have investigated the impacts of removing half of the existing Argo floats. The implementation of a deep Argo array (1 float in every 5° × 5° square, monthly), which samples to 4,000 m or to the bottom, shows a significant impact in reducing the bias in the temperature and salinity fields in the deep ocean. The ensemble mean of the four systems shows large error reduction of temperature and salinity up to 40%, but the associated standard deviation indicates that there is quantitative difference among the systems (Figure 6). The implementation of a global drifter array equipped with a thermistor chain to 150 m, which is an optimistic perspective on future evolution of the observing system, shows significant improvement of the temperature and salinity representation in the surface layer (10–20% of error reduction). The impact of removing the current mooring array is localized near the moorings, and does not affect significantly the large-scale structures, consistent with the findings of Fujii et al. (2015a).
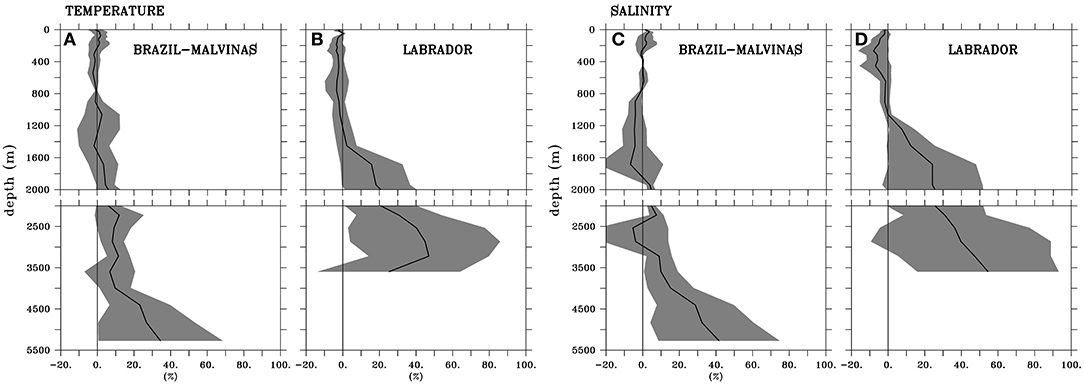
Figure 6. Evaluation of the deep Argo array which samples to the 6,000 m in H2020 AtlantOS. Showing RMS error reduction of temperature and salinity in 0–6,000 m in the OSSE for the design of the deep Argo array, as compared with the OSSE for the reference design, area-averaged in the Brazil-Malvinas confluence (30–51°S, 15–70°W) (A,C) and in the Labrador Sea (B,D). The black line is the ensemble mean. Gray indicates the standard deviation of the four members (CMCC, CLS, Mercator Ocean, and UKMO). Unit is percent of error reduction, compared to the OSSE for the reference design.
Overall, this original study has demonstrated a positive impact of the different simulated observation networks, and is further detailed in a synthesis publication (Gasparin et al., 2019a).
Evaluation of Impact of Wide-Swath Altimetry Missions
The impact of forthcoming wide-swath altimetry missions was investigated at Mercator Ocean with OSSEs using a 1/12°-resolution regional ODAP system of the Iberian-Biscay-Ireland (IBI) region (Lellouche et al., 2013). The synthetic observations are derived from the Nature Run simulated by the same OGCM at 1/36° resolution over the same region (Bonaduce et al., 2018). All the experiments assimilated the same synthetic observations of SST and temperature and salinity profiles. The synthetic data for conventional altimeters were derived from the sampling of the Nature Run over the theoretical tracks of the satellite missions Jason2, Jason1 on a geodetic orbit (Jason1g), and Envisat, with a sampling frequency of 1 Hz (~7 km). An observational white noise of 1 cm RMS was added to these pseudo-observations. The JPL simulator (Gaultier et al., 2016) was used to produce synthetic SWOT data. The wide-swath data were derived considering a 20.9-day repeat orbit at a spatial resolution of 7 km along and across the swath. Figure 7A shows examples of SSH fields in the Nature Run and the spatial coverage of simulated satellite altimetry data for conventional nadir and SWOT altimeter missions. Only the Ka-Band Radar Interferometer (Karin) noise in accordance with the error budget of SWOT mission concept (e.g., Durand et al., 2010; Rodriguez and Esteban-Fernandez, 2010). With 7 × 7 km spatial resolution, the noise ranges from 0.2 cm RMS in the inner part of the swath to about 0.35 cm on the outer edges of the swath.
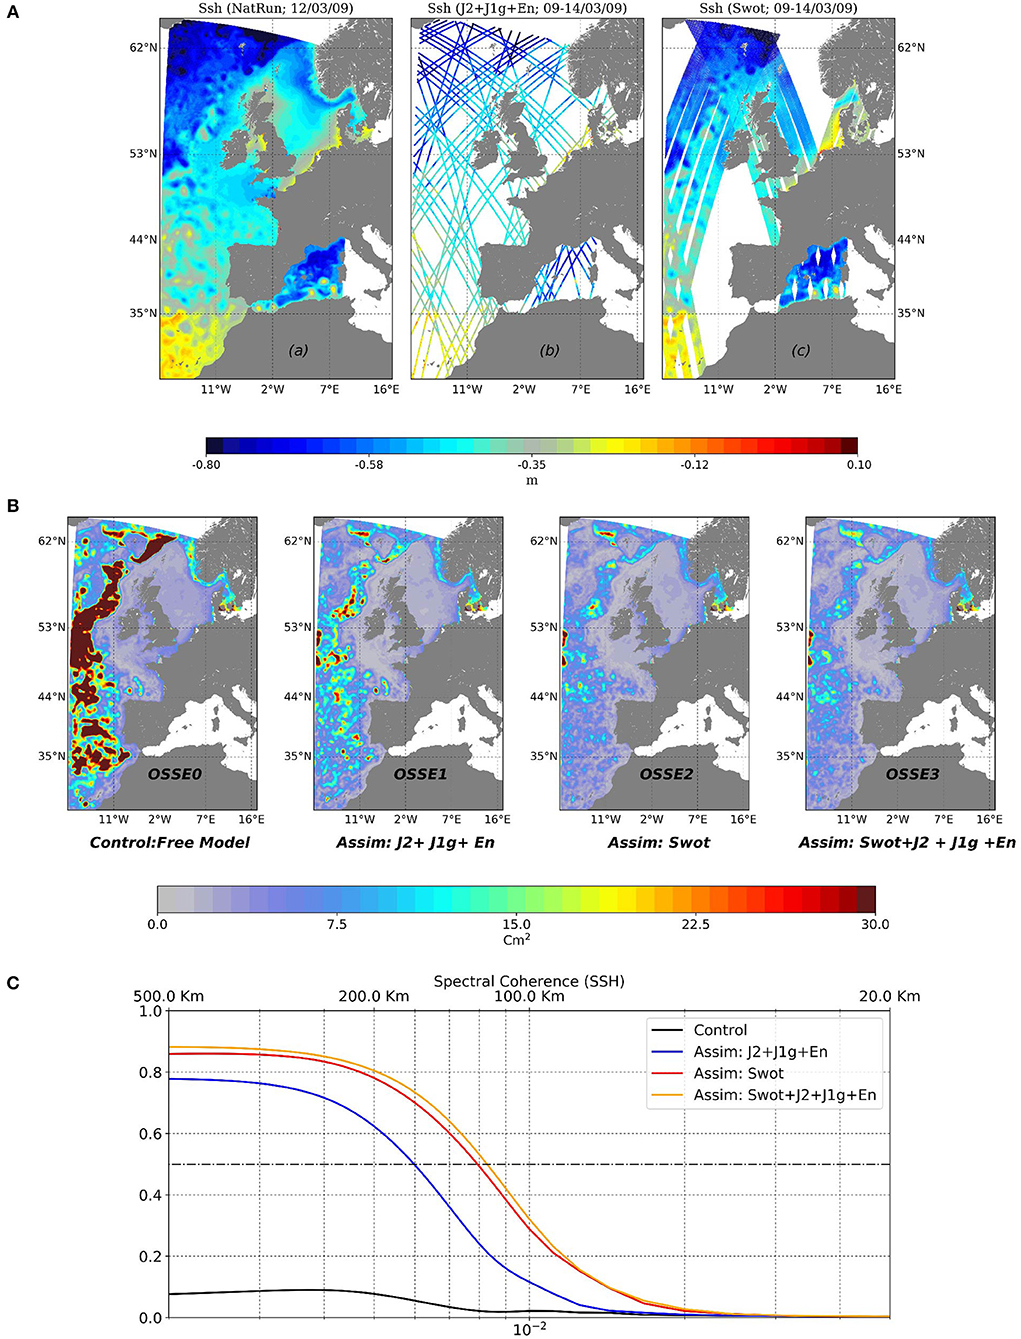
Figure 7. Evaluation of a constellation of nadir and wide-swath altimeters in Mercator. (A) SSH field simulated in the Nature Run on March 12 2009 (left), and synthetic SSH data for Jason2, Jason1g and ENVISAT (middle), and SWOT synthetic data (right) in a 5-day assimilation cycle from March 12 2009. (B) Maps of the variance of SSH errors in the ocean analysis of OSSE0, OSSE1, OSSE2, and OSSE3 (from the left to right) over the IBI domain during 2009. Units in cm2. (C) Spectral coherence in OSSE0 (black line), OSSE1 (blue line), OSSE2 (red lines), OSSE3 (orange lines) with respect to the Nature Run.
Four experiments were run OSSE0, OSSE1, OSSE2, and OSSE3. A free run experiment without assimilation (OSSE0) is used as a reference to quantify the contribution of the various data sets. SST and in-situ profiles are assimilated in all other experiments. In addition, synthetic SSH data along the tracks of conventional altimeters were assimilated in OSSE1. Only the synthetic data of SWOT were assimilated in OSSE2. Note that they include the nadir altimeter in the middle of the swaths of the SWOT satellite. Synthetic SSH data of both the nadir altimeters and SWOT were assimilated in OSSE3. All experiments are performed with the same initial conditions and forcing for 1 year January to December 2009.
Figure 7B shows the impact of assimilating synthetic SSH data evaluated by comparing the SSH errors in each OSSE. OSSE1 shows a clear reduction of the error by the assimilation of the nadir altimeter data compared to the free model (OSSE0). The best solution is the OSSE3 with assimilating SWOT and nadir altimeter data together. A constellation of SWOT and nadir altimeters shows a significant reduction of the error over the entire domain. The error variance does not exceed 9 cm2 except at the North Atlantic drift (between 50°N and 53°N) and close to the open boundaries which are unchanged in these experiments. A coherency analysis (Thomson and Emery, 2014) was done to investigate the reliability of the SSH signal in the OSSEs at the different spatial scales (Figure 7C). If 0.6 is chosen as a threshold for reasonable performance, the figure implies that assimilation of nadir and SWOT altimeter data performs well for wavelengths down to 110 km in OSSE3, while OSSE1 performs well-down to 180 km. This indicates that smaller scale features in the SSH fields are better captured when assimilating wide-swath altimeter data compared to nadir altimeter data.
Adjoint and Ensemble-Based Approaches
Use of Adjoint Models and Uncertainty Quantification
An ODAP system based on a 4DVAR method employs the adjoint of a forecast model in order to minimize the cost function which, in part, represents the model-data misfit. An adjoint model calculates the sensitivity of a scalar function based on the model state at any time during a model integration (not limited to the 4DVAR cost function) to model state variables, boundary conditions, and parameters applied at previous times. Adjoint sensitivity experiments are, thus, applicable for OS-Eval studies. For example, an adjoint sensitivity study by Masuda et al. (2010) indicated that the temperature of the bottom water in the North Pacific is sensitive to the air-sea heat flux and temperature of the whole water column off the Adélie Coast of Antarctica multiple decades back in time. This result highlights the importance of temperature observations in that area, and motivated JAMSTEC to enhance ocean observation in that area through deep Argo floats. Meanwhile, singular vector analysis (e.g., Fujii et al., 2008; Zanna et al., 2011) and its non-linear extension, conditional non-linear optimal perturbation analysis (e.g., Wang et al., 2013) also employ adjoint models and provide insight into where observations are needed. Fujii et al. (2008) identified the rapidly developing perturbation which affects the Kuroshio large meandering, and indicated the importance of observations southeast of Kyushu in Japan where the perturbation is originated.
Hessian-based uncertainty quantification is an extension of adjoint sensitivity studies, and is performed within the framework of ocean state and parameter estimation. This framework uses the 4DVAR method, where the assimilation window is chosen equal to the entire estimation period, covering multiple years to decades. The long assimilation window guarantees a data-constrained solution for the time-evolving ocean state that is entirely dynamically and kinematically consistent, a desirable property for studying the ocean's climate and variability (e.g., Wunsch and Heimbach, 2013; Stammer et al., 2016). Uncertainty quantification is an appropriate tool to evaluate and design observing systems that are targeted at climate monitoring.
An example is measuring ocean connectivity via the mooring array deployed by the Overturning in the Subpolar North Atlantic Program (OSNAP; Lozier et al., 2016). The eigenvectors of the local Hessian of the cost function represent the state directions that are informed by the observations. They can be interpreted as prior-weighted adjoint sensitivities of the observed quantities to all control variables, as highlighted by Loose (2019). For instance, Figure 8A shows the state direction (truncated to the control variable meridional wind stress) that is informed by heat transport measurements across the OSNAP-East leg (MHT-OSNAPe), computed within the Estimating the Circulation and Climate of the Ocean (ECCO) framework. It is given by the prior-weighted adjoint sensitivity of MHT-OSNAPe to meridional wind stress. Figure 8B shows the prior-weighted meridional wind stress sensitivity of an unobserved quantity, namely subsurface temperature close to the Southeast Greenlandic coast (T-EG). Strong projection of the two patterns in Figure 8 reflects a high potential for the observed quantity MHT-OSNAPe to inform the unobserved quantity T-EG. How much of this information potential can actually be extracted is determined by a signal-to-noise ratio, which incorporates magnitudes of prior and observation uncertainties.
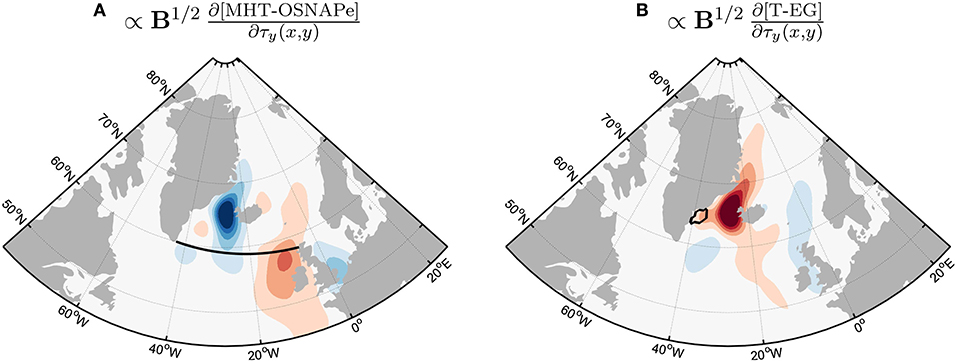
Figure 8. Linear sensitivity of (A) meridional heat transport across the OSNAP-East section (MHT-OSNAPe) and (B) subsurface ocean temperature (150–550 m) close to the Southeast Greenlandic coast (T-EG) to meridional wind stress τy, derived with the ECCO adjoint model, weighted by the square root of the prior error covariance matrix B, and normalized. The solid black contour delineates the (A) OSNAP-East transect and (B) horizontal area for the respective calculations of (A) heat transport and (B) mean temperature. Sensitivities are accumulated over 5 years. Red (blue) colors indicate that an increase in the northward wind stress would lead to a subsequent increase (decrease) in (A) MHT-OSNAPe and (B) T-EG on a 5 year timescale. (A) An observed state direction (truncated to the control τy), informed by MHT-OSNAPe measurements. (B) The target direction (truncated to the control τy) for the unobserved quantity T-EG. The good projection of (A,B) reflects a high potential for the observed quantity MHT-OSNAPe to inform the unobserved quantity T-EG.
Extracting the leading eigenvectors of the Hessian for large observing systems replaces performing thousands to millions of adjoint sensitivity experiments (where each observed quantity would be the objective function of a new experiment). Importantly, uncertainty quantification evaluates observation uncertainties and prior information. Moreover, the orthogonal Hessian eigenvectors represent data-informed state directions with data redundancy removed. Unlike conventional adjoint sensitivities, they inform about data redundancy and complementarity of new observing systems in the context of existing observations, e.g., Argo profiling floats. Although full Hessian-based uncertainty quantification has not yet been realized for global state estimation, substantial progress has been made within ECCO (Kalmikov and Heimbach, 2014, 2018). The coming decade will bring to bear the full potential of uncertainty quantification and optimal design of observing systems.
Use of FSOI for Monitoring Ocean Observation Impacts in an ODAP System
FSOI measures the variation in forecast error due to the assimilated data, and its evaluation is another promising application of an adjoint model for OS-Eval. Evaluation of FSOI has recently been applied to the ODAP system in operation at the US Navy and NOAA centers (Cummings and Smedstad, 2014). The system uses the global HYCOM and 3DVAR schemes, and measures the impact of all observations assimilated on reducing 48-h forecast temperature and salinity forecast error every day. Calculation of FSOI is formulated such that a negative value indicates a beneficial observation in that assimilation of that observation reduced forecast error. A positive value indicates a non-beneficial observation in that forecast error actually increased from assimilation of the observation. Non-beneficial impacts are not expected but if they occur, and they are persistent, then that may indicate problems with data quality or model performance. Thus, FSOI can be used as an effective observation monitoring tool with feedback to data providers on potential issues with their data.
To illustrate the routine application of FSOI, Figure 9A shows the geographic variation of the impacts of assimilating Argo temperature and salinity profiles from July 30 through August 18, 2018 in the Atlantic basin. In general, assimilating Argo data has beneficial impacts on reducing forecast error across the basin, although slightly non-beneficial impacts can be seen in some Argo temperature profiles. FSOI can also be partitioned by observing system. Figure 9B shows histograms of FSOI averaged within observing system in the Atlantic basin for the same time period. Here, impacts are normalized by the number of observations in an observing system such that the results are presented on a per observation basis. The results show that the most important temperature observing system is animal borne sensors, while for salinity the most important observing system is fixed moorings. When the per observation impacts are calculated without normalization, satellite altimeters, and satellite SST have the greatest impacts simply from the overwhelming number of observations generated by those observing systems. It is important to note that all ocean observing systems assimilated have beneficial impacts on reducing forecast error.
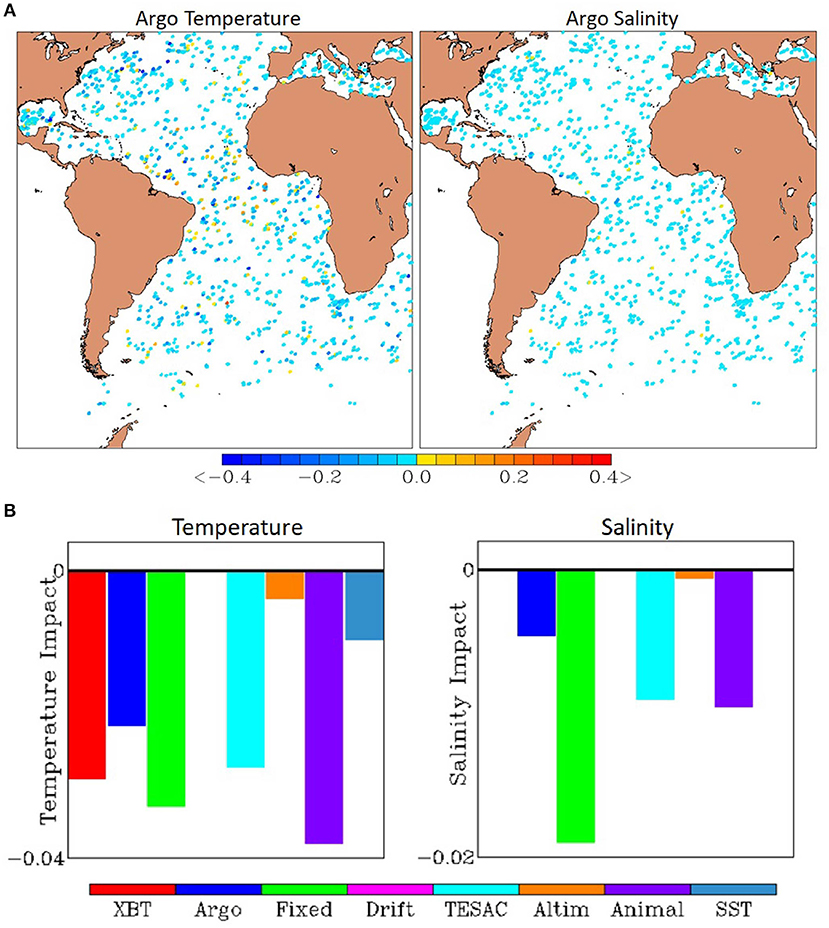
Figure 9. FSOI evaluated for the ODAP system based on the global HYCOM. (A) Impacts of Argo profiles on reducing 48-h forecast error in the Atlantic basin from 30 July through 18 August 2018. Cool colors indicate beneficial impacts; warm colors indicate non-beneficial impacts. (B) Per observation impacts for temperature (left) and salinity (right) observing systems in the Atlantic for 30 July through 18 August, 2018. Temperature units are °C and salinity units are PSU.
Evaluation of FSOI provides an all at once approach to estimating observation impacts. The method automatically adjusts to changes in the observation suite assimilated as new observing systems are introduced and to changes in the forecast model as model resolution increases or new physics are introduced. It is now possible to efficiently and routinely evaluate the entire global set of oceanographic observations assimilated in the HYCOM system, determining which data are most valuable and which data are redundant or do not add significant value. Like other OS-Eval methods, FSOI strongly depends on the ODAP system. Thus, the data impact results thorough evaluation of FSOI cannot be generalized to all ODAP systems.
Use of DFS for Evaluating the Impact of the SKIM Mission
In contrast to FSOI, DFS represent impacts of observations on the analysis fields. The DFS can be conveniently computed in an EnKF setting as a by-product of the calculation of the Kalman Gain without additional computing costs (Sakov et al., 2012). It is particularly relevant in the planning phase of a new observing system when the actual data are not yet available, but some knowledge of the locations of observations and their uncertainties are sufficient to measure their potential impact on a given modeling system assimilating observations from a pre-existing network.
An initial evaluation of the impact of surface current data from ESA Earth Explorer 9 candidate mission SKIM13 (Ardhuin et al., 2018) has been performed using the TOPAZ ODAP system (Sakov et al., 2012) based on DFS. SKIM is designed with rotating altimeter and SAR Doppler technology at two incidence angles (6° and 12°). SKIM is the first satellite mission designed to measure the ocean surface current directly, and also designed to measure wave spectral parameters and sea ice drift.
In this study, the surface currents from both the 6° and 12° beam angles have been considered with observation errors of 0.23 and 0.19 ms−1, respectively (Lucile Gaultier, personal communication). Considering that the TOPAZ system is only eddy-permitting and the SKIM currents are likely sensitive to submesoscale processes, high representativeness errors have been accounted, although very crudely, by applying a factor of 5 on the above standard deviations. Since the absolute values of DFS have little physical meaning on their own, the relative fraction of each observation type to the total DFS are presented.
The restart files from a TOPAZ ensemble have been extracted in the end of a 25-years reanalysis (Xie et al., 2017) in May 2017 which assimilated SST, along-track SSH, sea ice concentrations, in-situ temperature and salinity profiles. We compare the relative impact of SKIM surface currents to that from the along-track SSH which also informs surface currents (Figure 10). In view of the above simplifying assumptions on the observation errors and the fact that the simulated SKIM data does not cover the TOPAZ area completely, the quantitative share of DFS (22.6% for SSH against 10.2% for SKIM) are only indications that the SKIM dataset is potentially valuable even in the presence of a good observing network as of May 2017. The patterns of the relative impacts in Figure 10 show strong benefits in the equatorial band where the SSH data has no information content and the area close to the ice edge. These improvements are likely to carry over to other ODAP systems. The high impacts seen in the Gulf Stream area may on the contrary be system-dependent and may diminish if the observation representativeness errors are increased to account for the intensity of ocean submesoscale activity.
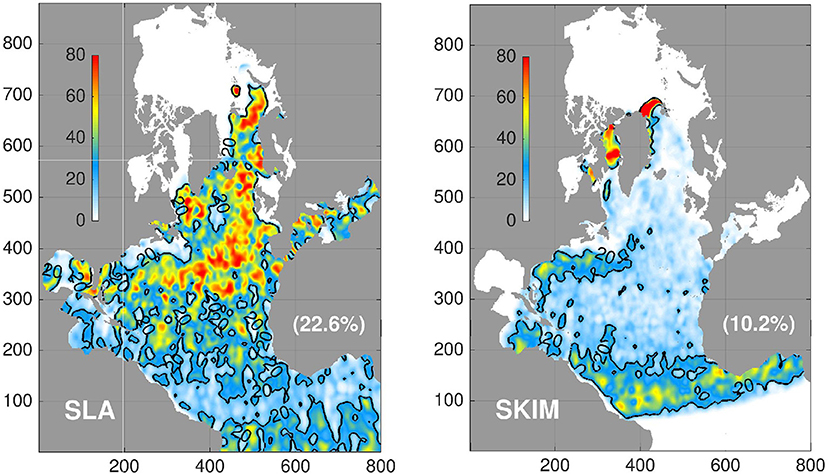
Figure 10. Relative DFS impact factor projected in model coordinates in the TOPAZ system. The area-averaged impact fraction is indicated in parenthesis. The chart is presented in model native coordinates and shows the whole model domain.
Use of Multi-System Ensemble Spread
The spread of a multi-system ensemble can be used for evaluating the uncertainty of ODAP products. The International Real-Time Ocean Reanalysis Intercomparison project (Xue et al., 2017a), provides beneficial information for OS-Eval as the ensemble spread can be monitored as the observing network changes in time. The project was started in 2014 following to the recommendation of the TPOS2014 workshop (see section OSE Studies for Evaluation of TAO/TRITON Array). In the project an ensemble of nine ODAP products has been routinely collected at NCEP, and the temporal and spatial variations of the ensemble spread of total temperature and anomalous temperature have been monitored and used to discern the influences of the TPOS data on the uncertainty of the ODAP products in near real time.
Figure 11 shows the temporal variations of the number of daily temperature profiles and the ensemble spread of temperature in the upper 300 m for the TAO and TRITON regions, respectively. For the TAO array region, the number of temperature profiles dropped rapidly in early 2012 and then recovered to the historical level after 2015. In responding to the TAO decline in 2012–2013, the international Argo community significantly increased the deployment of Argo floats in the equatorial Pacific in early 2014. The ensemble spread of total and anomalous temperature is closely related to the number of temperature profiles: it had decreased gradually since early 2000s due to the increase of the Argo data, increased rapidly in 2012–2013 due to the TAO decline, and then decreased in 2014–2015 due to the increase of temperature profiles. This clearly demonstrated that ocean observations played a critical role in reducing the uncertainties among the ODAP products.
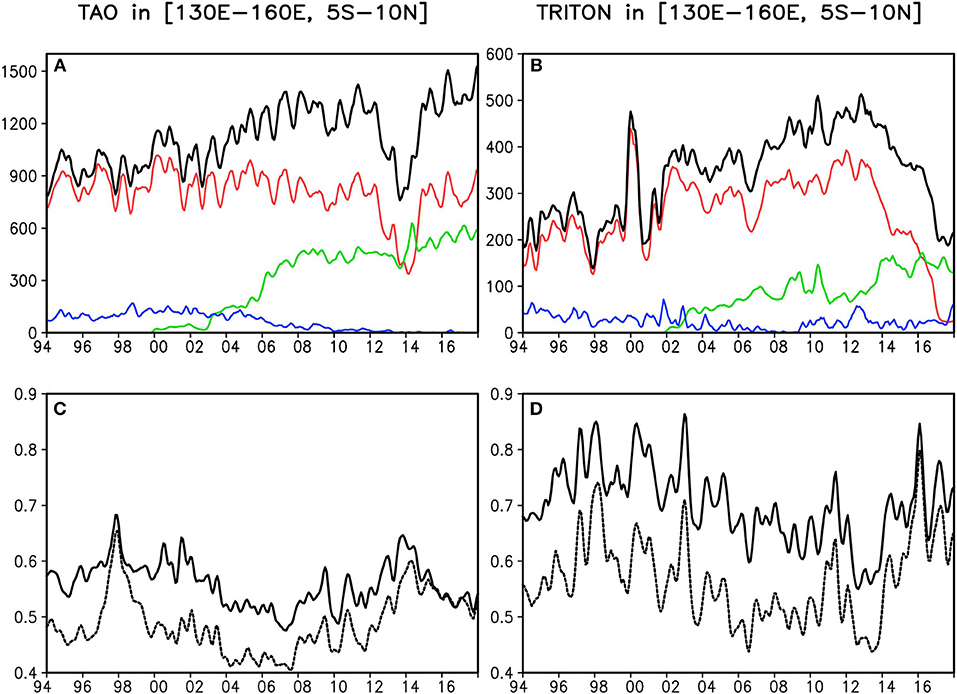
Figure 11. Time variations of the number of daily temperature profiles per month accumulated in the (A) TAO and (C) TRITON array region from the moorings (red line), Argo (green line), XBT (blue line), and all together (black line) from January 1994 to 2018. Time evolution of the multi-system ensemble spread of total temperature (solid lines) and anomalous temperature (dash lines) calculated in the upper 300 m for the (B) TAO and (D) TRITON array region from January 1994 to 2018, evaluated in the Real-Time Ocean Ranalysis Intercomparison Project.
Another urgent issue is the decline of the TRITON array since 2013. Figure 11C shows that the spread of both total and temperature anomaly increased rapidly since 2014 due to the TRITON decline. The spread of total and anomalous temperature became comparable after 2016. Therefore, we need to address the data decline in the region, and also be aware of the influences of the time evolution of ocean observations on model climatology and anomalies.
New Challenges Following Evolution of ODAP Systems
Coastal Regions
Many coastal applications based on ODAP systems have been developed, and are being used as essential tools for improving coastal predictions. Coastal observation data are indispensable to improve the performance of the systems and to ensure that socioeconomic benefits can be obtained. Therefore, needs of OS-Eval studies for designing, developing, and sustaining coastal observing systems are now increasing. Relevant OSE and OSSE studies have been conducted as introduced in sections OSE Study for Evaluation of Coastal Gliders in a High-Resolution Coastal Model, and OSSEs for Evaluating an Underwater Glider Array in Western North Atlantic. Adjoint-based evaluations have also been applied for coastal regions (e.g., Moore et al., 2011). These studies have showcased the importance of various observation platforms in different coastal regions (e.g., HF radar, ocean gliders, etc.). Coastal regions have diverse characteristics and it is challenging to conduct OS-Eval studies that can be compared and contrasted. Due to the unique nature of the coastal regions a coordinated effort is needed from the international community of coastal ODAP systems.
Deep Ocean
The deep ocean, in particular below 2,000 m depth, is a new frontier for ocean observations in contrast to the upper ocean which is now well-sampled by standard Argo floats. Several deep cast cruises have explored the changes in the deep ocean (e.g., Johnson et al., 2008; Purkey and Johnson, 2010; Kouketsu et al., 2011; Desbruyères et al., 2016) following Fukasawa et al. (2004)'s finding of bottom-water warming in the abyssal North Pacific Ocean. Due to the huge volume of ocean involved, subtle thermal changes in the deep ocean are known to be an important signal for the trends of world climate (e.g., Severinghaus et al., 1998; IPCC, 2014). Recently, the success of the monitoring network of Argo for the upper ocean (e.g., Riser et al., 2016) motivates the construction of a similar global monitoring network for the deep ocean (e.g., Roemmich et al., 2019). Within this background, a deep ocean state estimation and prediction is greatly anticipated. Studies on deep ocean state estimation is, however, at an early stage. Some examples of work on this are found in Kouketsu et al. (2011), Balmaseda et al. (2013b), and Osafune et al. (2015).
As mentioned in section Use of Adjoint Models and Uncertainty Quantification, the adjoint sensitivity experiments by Masuda et al. (2010) motivate deployment of deep floats. Masuda et al. (2018) try examine the impact of available deep float data on deep ocean state estimation by comparing two data sets from a set of comparative experiments with and without the deep-float data. The results demonstrate that the available float data enables corrections of the modeled ocean state locally for each float. The impact of the deep float data on a small basin (50° latitude and 10° longitude) deep ocean state estimation is quantitatively estimated to show its dependence on the float density. In addition, the H2020 AtlantOS project (section Evaluation of the Observing System Network in the Atlantic) and other recent studies (e.g., Chang et al., 2018; Gasparin et al., 2019b) have investigated the impact on assimilating a deep Argo array. However, the limited number of studies does not allow for firm statements to be made about the optimal spatial and temporal resolution of the deep Argo array. Further investigation is required to better understand the impact of the deep Argo array in the assimilation systems at long time scale.
Arctic Ocean
The relative remoteness and harsh environmental conditions over polar regions hinder efforts to provide adequate observations for ODAP systems. Improvements in observing technology and capabilities provide new avenues for sustained observations in polar regions suitable for ODAP systems (Smith N. et al., 2019). While these technologies make a more comprehensive polar ocean observing system, including sea-ice observations, feasible, the question remains, is it worth the cost?
A partial answer to the cost-benefit question may come from an ongoing international activity led by the World Weather Research Programme's Polar Prediction Project (PPP Steering Group, 2013, 2014). In particular, a Year of Polar Prediction (YOPP) for 2017–2019 aims to help address this question by coordinating international observing activities and fostering efforts to assess the impact of additional observations on environmental prediction skill, including impacts on downstream users and products (Jung et al., 2016). This effort will include OSEs to assess the benefit to forecast skill and product quality afforded by the additional observations, and evaluation of sea-ice observations will be an important target. The YOPP core period will be followed by a consolidation phase during which these experiments will be performed and results synthesized. This effort culminates in a YOPP summit, planned for 2022, which should provide an ideal opportunity for funding and implementation agencies to benefit from this community effort.
Medium-Range and S2S Coupled Prediction and Coupled Data Assimilation
The evaluation of the ocean observing system is gaining increasing importance in the context of medium-range and Subseasonal-to-Seasonal (S2S) coupled prediction and coupled data assimilation. Coupled atmosphere-ocean-land-sea-ice models are adopted in current operational medium-range weather forecasts at ECMWF (Buizza et al., 2018) and the CCMEP14 (Smith et al., 2018), and other several operational weather centers developed their systems in this direction. Operational centers also examine feasibility of sub-seasonal predictions with a coupled model, and started development of coupled data assimilation for further improvement of prediction skills (e.g., Lea et al., 2015; Laloyaux et al., 2016).
Although the impact of the ocean in medium-range and sub-seasonal predictions is not as dominant as in seasonal, those predictions are still sensitive to air-sea interaction in the tropics, mixed layer physics, and sharp SST fronts. For example, the impact of ocean heat content on tropical cyclones is well-demonstrated in previous studies (e.g., Mogensen et al., 2017). The idea that ocean fields affect Madden-Julian Oscillation (MJO) is also widely accepted. Therefore, ocean observations are considered to have potential to increase the skill of those predictions. Thus, it is expected we now assess what is an effective ocean observing network for coupled predictions. In particular, the assessment of the adequacy of the current ocean observing system for the sub-seasonal range will be a focus activity of the WWRP/WCRP S2S prediction project [World Weather Research Program (WWRP) (2017)] in the next few years. An example of such work is that of Subramanian et al. (2019) who found that prediction skill of tropical cyclones, in the operational coupled prediction system at ECMWF, is increased with the assimilation of SSH satellite data.
A coupled data assimilation system can propagate impact of observation data across the sea surface and thus exploit the data more effectively. In addition, it enables us to assimilate new-types of observation data around the sea surface in a more physically consistent manner. For example, Laloyaux et al. (2017) showed that satellite scatterometer sea surface wind data are more effectively assimilated giving improved oceanic mixed layer temperature in a coupled data assimilation system. Akella et al. (2017) reported on effective assimilation of satellite skin SST data in an atmospheric data assimilation system coupled with a skin SST model.
Applying regular OS-Eval techniques to a coupled data assimilation system usually requires some new developments. OSSEs with a coupled model requires a Nature Run based on a simulation of a coupled model (see section Nature Run and Calibration of OSSEs). Adjoint codes of a coupled model are required for calculating the FSOI of a coupled data assimilation system.
Evaluation of BGC Argos
Observing and forecasting systems for ocean biogeochemistry are not yet as mature as for the physical systems considered in the previous sections. Ocean color satellites routinely provide global observations of optical properties and chlorophyll concentration for over two decades. This has proved an invaluable tool for reanalysis and forecasting (Gehlen et al., 2015), but the coverage is restricted to the near-surface and cloud-free conditions, and limited information can be obtained about other variables such as nutrient concentrations. The in-situ observing network should develop significantly over the next few years with increase in the Biogeochemical (BGC) Argo network (Biogeochemical-Argo Planning Group, 2016). The deployment of a sustained global array of ~1,000 BGC Argo floats is foreseen, with a capacity to measure a variety of new variables (e.g., oxygen concentration, nitrate concentration, pH, etc.).
In addition to OSSE experiments reported in section Evaluation of the Observing System Network in the Atlantic, H2020 AtlantOS have conducted observation impact studies to help in the design of the future BGC Argo network in the Atlantic basin, and assess the complementarity with existing satellite ocean color observations. For monitoring and forecasting purposes, the effect of uncertainties due to various BGC model imperfections (e.g., simplified biology, unresolved biological diversity, and unresolved scales) has to be properly simulated as it should play a key role in estimating the dynamical behavior of ocean ecosystems. To better represent model uncertainties, Brankart et al. (2015) and Garnier et al. (2016) investigated the use of an ensemble Monte Carlo approach based on the inclusion of stochastic processes in the NEMO-PISCES modeling framework. This study showed the potential of such an approach by explicitly simulating the joint effects of uncertain biological parameters and unresolved scales using a stochastic model to simulate an ensemble of 60 members in a 1/4° resolution North Atlantic configuration.
Verification tools used in conventional OSSEs, such as RMS error metrics, need to be adapted for evaluating ensemble-based experiments, requiring a probabilistic approach. Thus, this BGC Argo OSSE study set up an integrated ensemble-based probability score methodology based on a set of probabilistic verification tools which have been mostly developed within the numerical weather prediction community to assess ensemble forecasts, and include a modified version of the entropy skill score introduced by Roulston and Smith (2002). For the sake of brevity, only the results associated with entropy are shown here.
This new methodology was applied to a single date, 15/04/2005 to compare four basic deployment scenarios while keeping numerical costs tractable. In the scenarios of BGC-Argo array deployment without satellite ocean color data (Figures 12A,B), the entropy of the updated ensemble related to chlorophyll distributions at 24 m depth shows a significant gain of information at the positions of the assimilated BGC floats, meaning that the prior uncertainty is only reduced locally. In the other two scenarios in which both BGC-Argo arrays and ocean color data are included (Figures 12C,D), the prior uncertainty is mostly reduced within a zonal band across the North Atlantic Basin at around 30°N, matching with the best coverage of satellite ocean color tracks assimilated at the surface, while BGC-Argo data (especially on nominal array) adds significant information gain in the equatorial region and at high latitudes in the northern basin. Thus, inclusion of BGC sensors on roughly one quarter of the current Argo array (around 1,000 floats) is expected to provide major improvements. There is also some evidence that a higher density network of BGC floats would add further value.
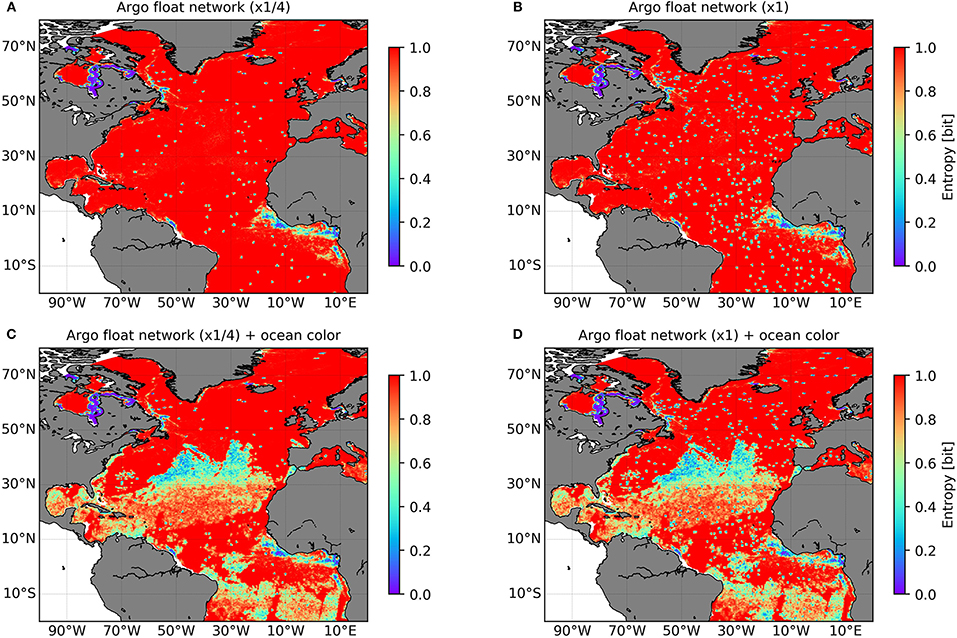
Figure 12. Result of the OSSE studies for the future deployment scenarios of BGC Argo floats in H2020 AtlantOS. Showing entropy skill score related to the chlorophyll distribution at 24 m in the scenarios of (A) BGC-Argo sensors on 1/4 of the nominal Argo array, (B) BGC-Argo sensors on the full nominal Argo array, (C) daily satellite ocean color data and BGC-Argo on 1/4 of the nominal array, and (D) daily satellite ocean color data and BGC-Argo on nominal array. Note that reducing prior uncertainty of the system is having entropy values lower than 1 (red) and >0 (blue), with respect to a set of probabilistic events that are relevant to compare the different scenarios.
Limitations and Efforts Toward Improved Observing System Evaluation
Limitations of OS-Eval and System Dependency
Although OS-Eval gives practical feedback to observation communities, it has several limitations which should be noted in interpreting the results. In order to use the OS-Eval results effectively, we should recognize the limitations, and interpret the results appropriately based on this knowledge. Here, the limitations are summarized as follows:
(i) OS-Eval results inevitably depend on the properties of the ODAP system employed for the evaluation, including systematic errors, or biases, of the forecast model, and the characteristics of the data assimilation scheme. They are thus “system dependent.”
(ii) OS-Eval also depends on the forecast/monitoring target (e.g., ENSO, variation of the Kuroshio axis, coastal phenomena, rapid tides, etc.), forecast lead-time, and the period for the evaluation. They are thus “question dependent.”
(iii) OS-Eval generally evaluates only the value of observation data as those to be assimilated, and the value for other purposes (e.g., as forcing data, as reference data in system validation or for the determination of prescribed error statistics and biases) is not accounted for.
(iv) OS-Eval is usually unable to evaluate impacts of changes within observing networks in near real time.
(v) OS-Eval often requires heavy computer and human resources.
Among the limitation above, the most influential one is probably (i) the system dependency. In particular, this limitation was regarded as the main reason of the inconsistency among evaluations in the TPOS2014 workshop (section OSE Studies for Evaluation of TAO/TRITON Array). In this workshop it was concluded that large systematic errors of coupled atmosphere-ocean models severely reduce the reliability of the OS-Evals. Similarly, reasonable evaluation of coastal observing systems may be limited by insufficient representation of small-scale coastal features by the current generation of ocean models. An essential way to mitigate this limitation is by reducing the systematic errors by improving the forecast model.
The effectiveness of a data assimilation scheme in using observation information can vary which will affect OS-Eval results. Figure 13 clearly demonstrates this. This figure depicts impacts of in-situ temperature and salinity profiles, mainly profiles of Argo floats, on 100-m-depth temperature fields produced by 3DVAR and 4DVAR versions of the same ODAP system in JMA (Usui et al., 2015). Although a common large impact can be seen in the subarctic region and inside of the subtropical gyre, the large impacts around the Kuroshio Extension found in the evaluation with the 3DVAR system disappears in the 4DVAR evaluation due to high ability of 4DVAR to reproduce the thermal front from satellite altimetry data alone.
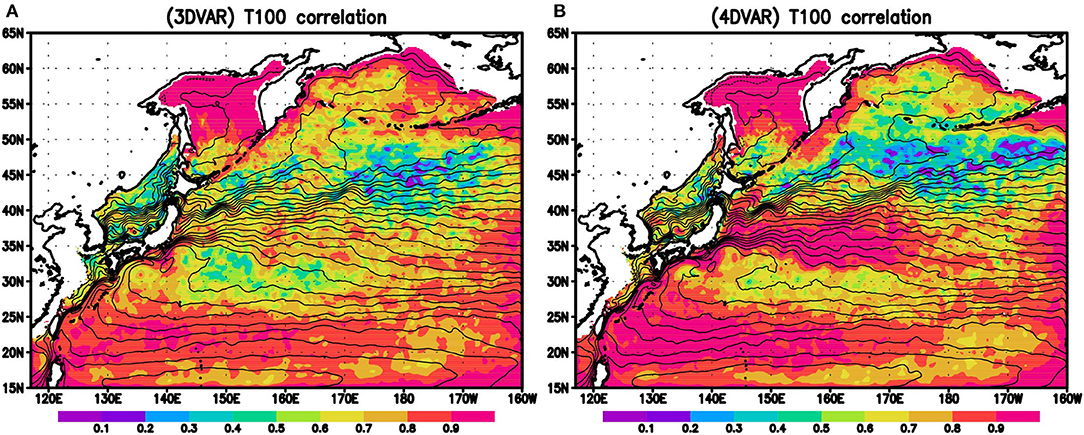
Figure 13. Impacts of in-situ temperature and salinity profiles in (A) 3DVAR and (B) 4DVAR versions of JMA's operational western North Pacific ODAP system. Panels show correlation coefficients of 100-m-depth temperature anomaly with respect to the monthly climatology between assimilation runs with and without assimilating in-situ temperature and salinity profiles. The correlation is calculated for 2005–2011. Low correlation indicates high impact.
Because of the system-dependency, the impacts of observing systems in practical operation continuously change following to evolution of prediction models and data assimilation technologies. Meanwhile, we can only perform OS-Eval based on current ODAP systems. We thus need to consider future evolution of models and data assimilation in order to assess the true potential of an observing system. OS-Eval results also depend on how the system used for the evaluation is tuned. ODAP systems are usually tuned for the currently existing observation network. An OS-Eval study may, therefore, underestimate the impact of a future observing network as the system may need to be retuned to obtain the full benefit of it.
Multi-System Evaluation
In spite of continuous progress of model and data assimilation technologies, it is not likely to be feasible to reduce the influence of the system-dependency to a negligible level. But using multiple systems in OS-Eval is a potential way to reduce influence of dependency on a single system because the systematic errors of each system may be independent, and will be canceled out, to some extent, when the results from several systems are averaged or summarized. An ideal way to use multiple systems for evaluation is to conduct OSEs/OSSEs simultaneously using several different systems based on a common protocol. However, this requires coordinating the common protocol among operational/research centers. In addition, OSE/OSSE requires large computer resources as pointed out above. A single-system OSE/OSSE study typically requires one OSE/OSSE by each observation type to be evaluated and one control run. The period of the OSEs/OSSEs must be sufficiently long in order to obtain statistically robust results. Forecasts from the results of OSEs/OSSEs and control experiments for sufficient cases are also required if impacts on the forecast skill are evaluated. Ensemble forecasts are required if the system is highly stochastic. Furthermore, single-OSEs/OSSEs must be conducted simultaneously in several centers for a multi-system OSE.
Actually, the GOV OS-Eval TT has investigated the possibility of conducting multi-system OSEs in order to assess the tropical arrays, and the TPOS2014 workshop recommended the proposal. Although it has not been fully implemented yet an initial intercomparison of OSE results is presented in Fujii et al. (2015a). A main reason of the effort did not fully succeed is probably the lack of financial support, needed to perform such a resource-consuming experiment at the same time in different groups. Nevertheless, multi-system OSEs for the evaluation of satellite salinity data have been successfully conducted using the UKMO and Mercator Ocean ODAP systems with financial support from ESA for the SMOS-Nino15 project (section OSEs for Evaluating Satellite SSS Data Impacts During the El Nino 2015 Event). In addition, a multi-system OSSEs are also conducted for evaluation and design of the Atlantic in-situ observation network within the H2020 AtlantOS project (section Evaluation of the Observing System Network in the Atlantic). This activity is feasible due to the close relationship among European countries and financial support from the European Union.
Although some European centers do successfully conduct multi-system activities, the number of the participating systems is still not sufficiently large (two for SMOS-Nino15, and four for H2020 AtlantOS). In order to perform more significant and more robust evaluation, it is desirable to conduct multi-system OSEs/OSSEs in a broader community. The growing understanding of the benefits of this work and the increasing requests to assess the merits of observing systems improves the chance of obtaining effective support for multi-system OS-Eval from operational and research centers and/or observational agencies. In fact, a common protocol on the method of OS-Eval may not be needed. It would still be beneficial to compare various evaluations of a specific observation types. This is more feasible, and may indeed offer more reliable and useful results because they do not depend on a single evaluation method. This type of collaboration is also ongoing in the community (see section Community Collaborations).
Nature Run and Calibration of OSSEs
OSSEs are widely used for the evaluation of future observing systems and network designs as introduced in section OSSEs. A clear advantage of OSSEs is that wide range of observation data, even data that do not exist in reality, can be evaluated by synthesizing the data from a simulated true state. Another advantage of OSSEs is that estimation errors in each experiment are easily calculated using the Nature Run as the true state. However, several limitations are identified through the H2020 AtlantOS project (see section Evaluation of the Observing System Network in the Atlantic). In particular, it should be noted that OSSEs operate under the following two limitations: the dependency on the performance of the Nature Run, and the difficulty in synthesizing observation data with realistic error properties.
In preliminary OSSE studies, the model used in the data assimilative experiment is also used as is, or with some changes of settings to generate the true state. However, the adequacy of OSSEs strongly depends on how appropriately the true state is simulated. The true state should favorably include a wide-range of phenomena that exist in the real world and are considered to affect the quality of data assimilation. Therefore, the true state is preferably simulated by a state-of-the-art model with an especially high resolution and no data assimilation. Such a very high performance free-running simulation generated for OSSE studies is often called the “Nature Run.” The community often collaborate to generate a Nature Run because it requires very large computer resources (e.g., Gasparin et al., 2018).
For an OSSE to give a realistic real world idea of the impact of the tested observing system the Nature Run needs to be sufficiently different from the forecast model (which is known to have systematic errors). Ideally the Nature run would be as close as possible to the real world. The OSSE studies introduced in section OSSEs all give special attention to the generation of good quality Nature Run. Thorough validation of the Nature Run is a critical part of this work (Kourafalou et al., 2016). Even so the Nature Run will still inevitably have systematic errors and will lack some real world physics processes which can degrade the applicability of the OSSEs.
It is also not straightforward to generate synthesis observations from the Nature Run because adequate observation errors must be added to the model equivalent values calculated from the Nature Run. Observation errors include measurement and representativeness errors, and the errors due to inaccuracies of the observation operator. It is quite difficult to estimate those errors appropriately. Thus, modern OSSEs require the calibration of the error setting such that the OSSEs can provide impact assessments similar to OSEs with the same ODAP systems, as for example conducted in Halliwell et al. (2014), in order to guarantee that a similar result will be obtained even if the real observations are assimilated. The requirements of modern OSSEs are summarized in Hoffman and Atlas (2015).
Evolution of observation technology and ODAP systems makes further requirements for OSSE preparation. For example, some new-type observations may reflect both the ocean and atmospheric state. In order to evaluate the impacts of assimilating those data in a coupled data assimilation system, the true state must include both the atmosphere and ocean fields, and therefore the Nature Run must be generated by a coupled model. Considering the fact that state-of-the-art coupled models still have significant systematic errors, this may still be a big challenge. In addition, we need to design a new observation operator and its systematic errors carefully for the new-type observations, as well as its measurement and representativeness errors.
Near-Real-Time Evaluation
One of major limitation of current OS-Eval is inability to assess the effectiveness of the current observing network in near real time because the status of observing systems continuously change due to a break of an instrument for example. GOV OS-Eval TT recognized this limitation since the TT was formed, and had recommended to conduct routine OSEs in near real time in order to overcome this limitation.
According to the recommendation, a series of the Near-Real-Time OSEs (NRT-OSEs) with a period of a month were performed with FOAM, the UKMO operational ODAP system, in 2011 (Lea et al., 2014). The method was to run a parallel version of the operational system identical to it except that a particular observation type is excluded. The results of the NRT-OSEs demonstrated the importance of all the observation types excluded and showed a good amount of complementarity between observations. Particularly notable is that excluding Argo data results in an increase in surface height errors as well as temperature and salinity. Even though all the altimeter data were assimilated it is necessary to have a good T-S structure in the model in order to obtain the full benefit of altimeter data assimilation.
The trial in UKMO, thus, demonstrated the potential of NRT-OSEs to evaluate observing systems in near real time. However, it is important to note that these results may not be robust due to the system-dependency as discussed in section Limitations of OS-Eval and System Dependency. The hope was that NRT-OSEs would become routine and would be run by other operational centers which would have given a better picture of the benefits of the components of the observing system in near real time. As of yet this has not happened and this remains the only example of NRT-OSEs in the ocean. The main barrier to wider implementation is the expense in terms of computer and human resources of running an additional version of the operational suite.
The importance of near real time evaluation was also highlighted in the TPOS2014 preliminary workshop. Although the influence of the reduction of the number of TAO data on seasonal predictions and other operational ocean services had to be evaluated promptly, there were few ways to examine the impacts at that time. Finally, the spread of the equatorial Pacific temperature anomaly fields among ocean reanalyses of operational centers are examined (Fujii et al., 2015a). The spread increased after the reduction of TAO data, implying it caused the increased uncertainty. This experience demonstrates that near-real-time intercomparison of ODAP products has a potential value for real time assessment of observing system status. Thus, the Real-Time Ocean Reanalysis Intercomparison project (Xue et al., 2017a) started after the workshop (section Use of Multi-system Ensemble Spread). We can quickly see the impact of changes in the observing system status by monitoring the spread among ocean reanalysis fields. For example, sudden break of observations by a specific platform may be identified from a spread increase in near real time. In contrast to the NRT-OSEs this uses existing runs and so does not require large computer resources in addition to operational calculation of ODAP systems. Thus, this strategy is very efficient and effective for monitoring observing system impacts.
The FSOI and DFS methods are also suitable for examining the impacts of observation data in near real time because these methods made evaluation in each analysis-prediction cycle, and are, therefore, widely used in operational weather forcasting systems. FSOI and DFS are also used in the US Navy's ODAP system (section Use of FSOI for Monitoring Ocean Observation Impacts in an ODAP System), and the TOPAZ ODAP system (section Use of DFS for Evaluating the Impact of the SKIM Mission). Since evaluation at each analysis-prediction cycle is not robust, averaging for a sufficiently long period is necessary to obtain a reliable conclusion. Additional developments are required to calculate FSOI and DFS. For example, FSOI requires an adjoint model or results of ensemble predictions. But computational cost is relatively small as these methods simultaneously estimate impacts of all observation data assimilated on a particular metric. The results can be partitioned for any subset of the observations (e.g., instrument type, geographic region, etc.). Therefore, use of these methods for routine evaluation of observing systems in operational centers is expected to be increased in the future. There is still a role for NRT-OSEs as although they requires more computational resources. They can provide fully non-linear sensitivity, which can be used for calibration of FSOI and DFS which relies on the linear assumption.
Community Collaborations
Close community collaboration within the ODAP community is indispensable to integrate OS-Eval results in order to mitigate influence of dependency on the systems and methodology and to increase the reliability as discussed in section Multi-system Evaluation. This collaboration can also provide a forum for the exchange of ideas on OS-Eval studies and to review the latest achievements and ongoing activities. Such forum is essential to share our experience with newcomers. Awareness of the importance of this collaboration, GOV established the OS-Eval TT, which is continued in its follow-on program, “OceanPredict.” CLIVAR-GSOP has also made significant support to OS-Eval efforts. Effective collaboration with the ocean modeling community will also be essential to increase the reliability of OS-Eval by reducing the model systematic errors.
We also emphasize the importance of communication between the ODAP and the ocean observational communities. While ocean observations provide indispensable information for ODAP systems, OS-Eval results can give valuable feedback to the observation community by providing scientific information on the value of ocean observations and their effective design, which supports development, maintenance, and improvement of the ocean observing system. For example, OS-Eval activities in near real time may help to target areas where Argo and drifting buoys need to be deployed for effective sampling at any given time. This is extremely useful for organizations such as the JCOMM Drifting Buoy Cooperation Panel tasked with overseeing the drifting buoy array. In order to perform a meaningful OS-Eval, requests of observational agencies/groups on the future observing networks and potential of emerging observation technologies should be considered in designing OS-Eval studies. The communication is necessary to build up the understanding on the potential of ODAP systems in the observational community to help in securing financial and human resources and to set up an adequate infrastructure in operational/research centers for OS-Eval activities. As a tool of the communication, the GOV/OceanPredict OS-Eval TT now plans to publish the Observing Impacts Statement (OIS; Lea, 2012) ideally once a year for a specific observing platform based on integration of OS-Eval results within the TT. The SMOS-Nino15 work (section OSEs for Evaluating Satellite SSS Data Impacts During the El Nino 2015 Event) highlights the interest of space agencies in developing OIS to justify follow-on missions for SSS. OISs, thus, support observational agencies to secure resources for sustaining and improving ocean observing systems.
The evolving nature of the ocean observing system (emerging technologies, possible obsolescence of existing approaches), as well as the ever changing societal needs (new applications and services, new science questions), implies that assessment of how fit-for-purpose of the ocean observing system requires continuous evaluation. Thus, the initiative on the OS-Eval by the GOV/OceanPredict OS-Eval TT and CLIVAR-GSOP should continue in the future. They are essential as an objective and authoritative source of advice on the relevance of the observing system design.
Conclusion
We have reviewed the methodologies of OS-Eval based on the ODAP systems, highlighting recent achievements and on-going challenges in the evaluation of various ocean observation systems. We discussed the need to, and the strategy to, increase robustness and reliability of OS-Eval results. We showed the future vision of increasing the value of this work for designing and supporting ocean observing networks. Consequently, we make the following recommendations:
• Improvement of data assimilation methods in ODAP systems is required.
• Increased sophistication of OS-Eval methodology is needed.
• There should be clearer interpretation of the results, considering OS-Eval limitations to help the observational community.
• We should work toward performing OS-Eval in near real time.
• We should continue the efforts toward new frontiers of the ODAP systems, such as coastal regions, the deep ocean, polar regions, coupled data assimilation, and BGC applications, and to contribute the observing systems that underpin those frontiers.
• There should be closer collaboration between the ODAP and ocean modeling communities to reduce model systematic errors.
• Multi-system evaluation is needed under international coordination to improve the robustness of the results with moderating system-dependency.
• Enhanced communication is required between the ODAP and observational communities to better understand the respective needs and issues of each group. Specifically, the ODAP community must understand the key needs, opportunities, and issues of those managing the observing system; and the observational community should understand the potential of ODAP systems, as well as their strengths and weaknesses.
• Provision of human and financial resources and infrastructure is required for the OS-Eval activities under the collaboration between the ODAP and observational communities.
• Implementation of standard reporting in the form of OISs is needed to support decision-making and to provide quantitative demonstrations of data impacts that may strengthen the case for funding and improvements to ocean observing systems.
Finally, we recommend the continued development of OS-Eval activities at international level with the support of the international ODAP (e.g., OceanPredict and CLIVAR-GSOP) and observational communities. This is mandatory to guide the development of the observing system and to monitor its impact.
Author Contributions
YF: decided the structure of the manuscript and coordinated the writing team. Each subsection is mainly contributed by following people: YF and PO: Introduction. YF: OSE studies for evaluation of TAO/TRITON array. ER, BT, MM, and CD: OSEs for evaluating satellite SSS data impacts during the El Nino 2015 event. HZ and MBa: OSE studies for ocean reanalysis and seasonal forecasting. PO: OSE study for evaluation of coastal gliders in a high-resolution coastal model. GH and VK: OSSEs for evaluating an underwater glider array in Western North Atlantic. FG, P-YL, and ER: Evaluation of the observing system network in the Atlantic. MBe, AB, and ER: Evaluation of impact of wide-swath altimetry missions. NL, PH, YF, and SM: Use of adjoint models and uncertainty quantification. JC: Use of FSOI for monitoring ocean observation impacts in an ODAP system. JX and LB: Use of DFS for evaluating the impact of the SKIM mission. YX: Use of multi-system ensemble spread. YF and VK: Coastal regions. SM and FG: Deep ocean. GS: Arctic ocean. MBa and YF: Medium-range and S2S coupled prediction and coupled data assimilation. CG and PB: Evaluation of BGC Argos. YF and NU: Limitations of OS-eval and system dependency. YF and ER: Multi-system evaluation. YF: Nature run and calibration of OSSEs. DL and YF: Near-real-time evaluation. GL, YF, and CD: Community collaborations. YF, P-YL, and PO: Conclusion. The manuscript is edited by YF with the support of YK, SP, CD, VK, MM, ER, PO, and DL.
Funding
SSS OSE studies at CLS, Mercator Ocean, and UKMO were funded through the ESA SMOS-Nino15 project. OSE studies in ECMWF have been partially funded by the EU-H2020 program through the AtlantOS project (633211). OSSE studies on in-situ observations in Mercator Ocean and CNRS/IGE have been funded by the EU-H2020 program through the AtlantOS project (633211). YF and SM are supported by JSPS KAKENHI Grant Number JP15H03727. YF is also supported by JPS KAKENHI grant Number JP17H00728. GH and VK are supported by the NOAA Hurricane Sandy Disaster Relief Act [OAR-M8R2WHSP01 and NA13OAR4830224] and from the NOAA Quantitative Observing System Assessment Program [QOSAP; OARP8R2W02PQF and NA15OAR4320064]. The publication fee is provided by JMA/MRI.
Conflict of Interest Statement
JC and SP were employed by company I.M Systems Group (IMSG). GL and BT were employed by company Collecte Localisation Satellites (CLS).
The remaining authors declare that the research was conducted in the absence of any commercial or financial relationships that could be construed as a potential conflict of interest.
Acknowledgments
This synthesis work was conducted as a part of the OS-Eval TT activity and underpinned by a number of studies within GOV/OceanPredict. CLIVAR-GSOP also supports this work.
Footnotes
1. ^European Centre for Medium-Range Weather Forecasts.
2. ^Japan Meteorological Agency.
3. ^Japan Agency for Marine-Earth Science and Technology.
4. ^National Oceanic and Atmospheric Administration.
5. ^National Centers for Environmental Prediction.
6. ^European Space Agency.
7. ^National Aeronautics and Space Administration.
8. ^See https://www.godae-oceanview.org/projects/smos-nino15
9. ^UK Met Office.
10. ^NOAA Atlantic Oceanographic and Meteorological Laboratory.
11. ^Centro Euro-Mediterraneo per i Cambiamenti Climatici.
12. ^Collecte Localisation Satellites.
13. ^Sea surface KInematic Multiscale monitoring.
14. ^Canadian Centre for Meteorological and Environmental Prediction.
References
Akella, S., Todling, R., and Suarez, M. (2017). Assimilation for skin SST in the NASA GEOS atmospheric data assimilation system. Q. J. R. Meteorol. Soc. 143, 1032–1046. doi: 10.1002/qj.2988
Alves, O., Balmaseda, M., Anderson, D., and Stockdale, T. (2004). Sensitivity of dynamical seasonal forecasts to ocean initial conditions. Q. J. R. Meteorol. Soc. 130, 647–668. doi: 10.1256/qj.03.25
Androulidakis, Y., Kourafalou, V., Halliwell, G., Le Hénaff, M., Kang, H., Mehari, M., et al. (2016). Hurricane interaction with the upper ocean in the Amazon-Orinoco plum region. Ocean Dyn. 66, 1559–1588. doi: 10.1007/s10236-016-0997-0
Ardhuin, F., Aksenov, Y., Benetazzo, A., Bertino, L., Brandt, P., Caubet, E., et al. (2018). Measuring currents, ice drift, and waves from space: the Sea surface KInematics Multiscale monitoring (SKIM) concept. Ocean Sci. 14, 337–354. doi: 10.5194/os-14-337-2018
Atlas, R. (1997). Atmospheric observations and experiments to assess their usefulness in data assimilation. J. Meteor. Soc. Jap. 75, 111–130. doi: 10.2151/jmsj1965.75.1B_111
Aydogdu, A., Pinardi, N., Pistoi, J., Martinelli, M., Belardinelli, A., and Sparnocchia, S. (2016). Assimilation experiments for the Fishery Observing System in the Adriatic Sea. J. Mar. Syst 162, 126–136. doi: 10.1016/j.jmarsys.2016.03.002
Balmaseda, M., and Anderson, D. (2009). Impact of initialization strategies and observations on seasonal forecast skill. Geophys. Res. Lett. 36:L01701. doi: 10.1029/2008GL035561
Balmaseda, M. A., Anderson, D., and Vidard, A. (2007). Impact of Argo on analyses of the global ocean. Geophys. Res. Lett. 34, L16605. doi: 10.1029/2007GL030452
Balmaseda, M. A., Fujii, Y., Alves, O., Awaji, T., Behringer, D., Ferry, N., et al. (2010). “Initialization for seasonal and decadal forecasts,” in Proceedings of OceanObs'09: Sustained Ocean Observations and Information for Society, Vol. 2, eds J. Hall, D. E. Harrison and D. Stammer (Venice: ESA Publication WPP-306), 19–26. doi: 10.5270/OceanObs09.cwp.02
Balmaseda, M. A., Mogensen, K., and Weaver, A. T. (2013a). Evaluation of the ECMWF ocean reanalysis system ORAS4. Q. J. R. Meteorol. Soc. 139, 1132–1161. doi: 10.1002/qj.2063
Balmaseda, M. A., Trenberth, K. E., and Källén, E. (2013b). Distinctive climate signals in reanalysis of global ocean heat content, Geophys. Res. Lett. 40, 1754–1759. doi: 10.1002/grl.50382
Balmaseda, M. A., Vidard, A., and Anderson, D. L. T. (2008). The ECMWF ocean analysis system: ORA-S3. Mon. Wea. Rev. 136, 3018–3034. doi: 10.1175/2008MWR2433.1
Bell, M., Schiller, A., Le Traon, P. Y., Smith, N., Dombrowsky, E., and Wilmer-Becker, K. (2015). An introduction to GODAE OCEANVIEW. J. Oper. Oceanogr. 8, s2–s11. doi: 10.1080/1755876X.2015.1022041
Biogeochemical-Argo Planning Group (2016). The Scientific Rationale, Design, and Implementation Plan for a Biogeochemical-Argo Float Array. Biogeochemical-Argo Planning Group, 58.
Bonaduce, A., Benkiran, M., Rémy, E., Le Traon, P. Y., and Garric, G. (2018). Contribution of future wide swath altimetry missions to ocean analysis and forecasting. Ocean Sci. 14, 1405–1421. doi: 10.5194/os-14-1405-2018
Brankart, J. M., Candille, G., Garnier, F., Calone, C., Melet, A., Bouttier, P. A., et al. (2015). A generic approach to explicit simulation of uncertainty in the NEMO ocean model. Geosci. Model Develop. 8, 1285–1297. doi: 10.5194/gmd-8-1285-2015
Brassington, G. B., Martin, M. J., Tolman, H. L., Akella, S., Balmeseda, M., Chambers, C. R. S., et al. (2015). Progress and challenges in short- to medium-range coupled prediction. J. Oper. Oceanogr. 8, s239–s258. doi: 10.1080/1755876X.2015.1049875
Buizza, R., Balsamo, G., and Haiden, T. (2018). IFS Upgrade Brings More Seamless Coupled Forecasts. ECMWF Newsletter 156, 18–22. Available online at: https://www.ecmwf.int/en/newsletter/156/meteorology/ifs-upgrade-brings-more-seamless-coupled-forecasts (accessed July 9, 2019).
Caltabiano, N., Lee, T., Haines, K., and Palmer, M. D. (2015). The CLIVAR Global Synthesis and Observations Panel (GSOP): Coordination Partnerships on Ocean Observations and Synthesis. CLIVAR Exchanges, 19, 52–54. Available online at: http://www.clivar.org/sites/default/files/documents/Exchanges_OceanObs_No67_0.pdf
Cardinali, C., Pezzulli, S., and Andersson, E. (2004). Influence-matrix diagnostic of a data assimilation system. Q. J. R. Meteorol. Soc. 130, 2767–2786. doi: 10.1256/qj.03.205
Chang, Y. S., Zhang, S., Rosati, A., Vecchi, G. A., and Yang, X. (2018). An OSSE study for deep argo array using the GFDL ensemble coupled data assimilation system. Ocean Sci. J. 53, 179–189. doi: 10.1007/s12601-018-0007-1
Cummings, J. A., and Smedstad, O. M. (2014). Ocean data impacts in global HYCOM. J. Atmos. Ocean. Technol 31, 1771–1791. doi: 10.1175/JTECH-D-14-00011.1
Davidson, F. J. M., Allen, A., Brassington, G. B., Breivik, Ø., Daniel, P., Kamachi, M., et al. (2009). Applications of GODAE ocean current forecasts to search and rescue and ship routing. Oceanography. 22, 176–181. doi: 10.5670/oceanog.2009.76
Desbruyères, D. G., Purkey, S. G., McDonagh, E. L., Johnson, G. C., and King, B. A. (2016). Deep and abyssal ocean warming from 35 years of repeat hydrography. Geophys. Res. Lett. 43, 10356–10365. doi: 10.1002/2016GL070413
Durand, M., Fu, L. L., Lettenmaier, D. P., Alsdorf, D. E., Rodriguez, E., and Esteban-Fernandez, D. (2010). The surface water and ocean topography mission: observing terrestrial surface water and oceanic submesoscale eddies. Proc. IEEE 98, 766–779. doi: 10.1109/JPROC.2010.2043031
Evensen, G. (2003). The Ensemble Kalman Filter: theoretical formulation and practical implementation. Ocean Dyn. 53, 343–367. doi: 10.1007/s10236-003-0036-9
Fujii, Y., Cummings, J., Xue, Y., Schiller, A., Lee, T., Balmaseda, M. A., et al. (2015a). Evaluation of the tropical pacific observing system from the ocean data assimilation perspective. Q. J. R. Meteorol. Soc. 141, 2481–2496. doi: 10.1002/qj.2579
Fujii, Y., Kamachi, M., Nakaegawa, T., Yasuda, T., Yamanaka, G., Toyoda, T., et al. (2011). “Assimilating ocean observation data for ENSO monitoring and forecasting,” in Climate Variability - Some Aspects, Challenges and Prospects, ed A. Hannachi (Rijeka: InTech Open), 75–98. doi: 10.5772/30330
Fujii, Y., Ogawa, K., Brassington, G. B., Ando, K., Yasuda, T., and Kuragano, T. (2015b). Evaluating the impacts of the tropical Pacific observing system on the ocean analysis fields in the global ocean data assimilation system for operational seasonal forecasts in JMA. J. Oper. Oceanogr. 8, 25–39. doi: 10.1080/1755876X.2015.1014640
Fujii, Y., Tsujino, H., Usui, N., Nakano, H., and Kamachi, M. (2008). Application of singular vector analysis to the Kuroshio large meander. J. Geophys. Res. 113:C07026. doi: 10.1029/2007JC004476
Fukasawa, M., Freeland, H., Perkin, R., Watanabe, T., Uchida, H., and Nishina, A. (2004). Bottom water warming in the North Pacific Ocean. Nature 427, 825–827. doi: 10.1038/nature02337
Garnier, F., Brankart, J.-M., Brasseur, P., and Cosme, E. (2016). Stochastic parameterizations of biogeochemical uncertainties in a 1/4° NEMO/PISCES model for probabilistic comparisons with ocean color data. J. Mar. Syst. 155(Suppl. C), 59–72. doi: 10.1016/j.jmarsys.2015.10.012
Gasparin, F., Greiner, E., Lellouche, J. M., Legalloudec, O., Garric, G., Drillet, Y., et al. (2018). A large-scale view of oceanic variability from 2007 to 2015 in the global high resolution monitoring and forecasting system at Mercator Océan. J. Mar. Syst. 187, 260–276. doi: 10.1016/j.jmarsys.2018.06.015
Gasparin, F., Guinehut, S., Mao, C., Mirouze, I., Remy, E., King, R., et al. (2019a). Requirements for an integrated in situ atlantic ocean observing system from coordinated observing system simulation experiments. Front. Mar. Sci. 6:83. doi: 10.3389/fmars.2019.00083
Gasparin, F., Hamon, M., Remy, E., and Le Traon, P. Y. (2019b). How deep Argo will improve the deep ocean in an ocean reanalysis. J. Clim. [Epub ahead of print].
Gaultier, L., Ubelmann, C., and Fu, L. L. (2016). The challenge of using future SWOT data for oceanic field reconstruction. J. Atmos. Ocean. Technol. 33, 119–126. doi: 10.1175/JTECH-D-15-0160.1
Gehlen, M., Barciela, R., Bertino, L., Brasseur, P., Butenschön, M., Chai, F., et al. (2015). Building the capacity for forecasting marine biogeochemistry and ecosystems: recent advances and future developments. J. Oper. Oceanogr. 8, s168–s187. doi: 10.1080/1755876X.2015.1022350
Halliwell, G. R., Mehari, M. F., Le Henaff, M., Kourafalou, V. H., Androulidakis, I. S., Kang, H. S., et al. (2017). North Atlantic ocean OSSE system: evaluation of operational ocean observing system components and supplemental seasonal observations for potentially improving tropical cyclone prediction in coupled systems. J. Oper. Oceanogr. 10, 154–175. doi: 10.1080/1755876X.2017.1322770
Halliwell, G. R. Jr., Srinivasan, A., Kourafalou, V., Yang, H., Willey, D., and Atlas, R. (2014). Rigorous evaluation of a fraternal twin ocean OSSE system for the open Gulf of Mexico. J. Atmos. Oceanic Technol. 31, 105–130. doi: 10.1175/JTECH-D-13-00011.1
Herzfeld, M. (2006). An alternative coordinate system for solving finite difference ocean models. Ocean Model. 14, 174–196. doi: 10.1016/j.ocemod.2006.04.002
Hoffman, R. N., and Atlas, R. (2015). Future observing system simulation experiments. Bull. Amer. Meteorol. Soc. 96, 1601–1616. doi: 10.1175/BAMS-D-15-00200.1
IPCC (2014). "Climate change 2014: synthesis report,” in Contribution of Working Groups I, II and III to the Fifth Assessment Report of the Intergovernmental Panel on Climate Change, eds Core Writing Team, R.K. Pachauri and L.A. Meyer (Geneva: IPCC), 151.
Johnson, G. C., Purkey, S. G., and Bullister, J. L. (2008). Warming and freshening in the abyssal southeastern Indian Ocean. J. Clim. 21, 5351–5363. doi: 10.1175/2008JCLI2384.1
Jones, E. M., Oke, P. R., Rizwi, F., and Murray, L. (2012). Assimilation of glider and mooring data into a coastal ocean model. Ocean Model. 47, 1–13. doi: 10.1016/j.ocemod.2011.12.009
Jung, T., Gordon, N. D., Bauer, P., Bromwich, D. H., Chevallier, M., Day, J., et al. (2016). Advancing polar prediction capabilities on daily to seasonal time scales, Bull. Amer. Meteorol. Soc 97, 1631–1647. doi: 10.1175/BAMS-D-14-00246.1
Kalmikov, A. G., and Heimbach, P. (2014). A hessian-based method for uncertainty quantification in global ocean state estimation. SIAM J. Sci. Comput. 36, S267–S295. doi: 10.1137/130925311
Kalmikov, A. G., and Heimbach, P. (2018). On barotropic mechanisms of uncertainty propagation in estimation of drake passage transport. Eprint arXiv:1804.06033v2. Available online at: https://arxiv.org/abs/1804.06033v2 (accessed July 11, 2019).
Kouketsu, S., Doi, T., Kawano, T., Masuda, S., Sugiura, N., Toyoda, T., et al. (2011). Deep ocean heat content changes estimated from observation and reanalysis product and their influence on sea level change. J. Geophys. Res. 116:C03012. doi: 10.1029/2010JC006464
Kourafalou, V., Androulikakis, Y., Halliwell, G. R. Jr., Kang, H., Mehari, M., et al. (2016). North Atlantic Ocean OSSE system development: nature run evaluation and application to hurricane interaction within the Gulf Stream. Prog. Oceanogr. 148, 1–25. doi: 10.1016/j.pocean.2016.09.001
Laloyaux, P., Balmaseda, M., Dee, D., Mogensen, K., and Janssen, P. (2016). A coupled data assimilation system for climate reanalysis. Q. J. R. Meteorol. Soc. 142, 65–78. doi: 10.1002/qj.2629
Laloyaux, P., Thépaut, J. N., and Dee, D. (2017). Impact of scatterometer surface wind data in the ECMWF coupled assimilation system. Mon. Wea. Rev 144, 1203–1217. doi: 10.1175/MWR-D-15-0084.1
Langland, R. H., and Baker, N. L. (2004). Estimation of observation impact using the NRL atmospheric variational data assimilation adjoint system. Tellus 56A, 189–201. doi: 10.1111/j.1600-0870.2004.00056.x
Le Traon, P. Y., Dibarboure, G., Jacobs, G., Martin, G., Remy, E., and Schiller, A. (2017). “Use of satellite altimetry for operational oceanography,” in Satellite Altimetry Over Oceans and Land Surfaces, eds D. Stammer and A. Cazenave, (Boca Raton: CRC Press). doi: 10.1201/9781315151779-18
Lea, D. J. (2012). Observation Impact Statements for Operational Ocean Forecasting. Weather Science Technical Report, 568, Exeter: Met Office. Available online at: https://digital.nmla.metoffice.gov.uk/download/file/digitalFile_a747fc88-0535-495c-885b-66855fd67766 (accessed July 9, 2017).
Lea, D. J., Martin, M. J., and Oke, P. R. (2014). Demonstrating the complementarity of observations in an operational ocean forecasting system. Q. J. R. Meteorol. Soc. 140, 2037–2049. doi: 10.1002/qj.2281
Lea, D. J., Mirouze, I., Martin, M. J., King, R. R., Hines, A., Walters, D., et al. (2015). Assessing a new coupled data assimilation system based on the Met Office Coupled Atmosphere–Land–Ocean–Sea ice model. Mon. Wea. Rev. 143, 4678–4694. doi: 10.1175/MWR-D-15-0174.1
Lee, T., Lagerloef, G., Gierach, M. M., Kao, H.-Y., Yueh, S., and Dohan, K. (2012). Tropical instability waves linked to sea surface salinity anomalies. Geophys. Res. Lett. 39:L12610. doi: 10.1029/2012GL052232
Lellouche, J. M., Le Galloudec, O., Drévillon, M., Régnier, C., Greiner, E., Garric, G., et al. (2013). Evaluation of global monitoring and forecasting systems at Mercator Océan. Ocean Sci. 9, 57–81. doi: 10.5194/os-9-57-2013
Loose, N. (2019). Adjoint modeling and observing system design in the subpolar North Atlantic (Ph.D dissertation). University of Bergen, Bergen, Norway.
Lozier, M. S., Bacon, S., Bower, A. S., Cunningham, S. A., de Jong, M. F., de Steur, L., et al. (2016). Overturning in the subpolar North Atlantic program: a new international ocean observing system. Bull. Amer. Meteorol. Soc. 98, 737–752. doi: 10.1175/BAMS-D-16-0057.1
Madec, G. (2016). NEMO Ocean Engine. Available online at: http://www.nemo-ocean.eu/About-NEMO/Reference-manuals/NEMO_book_3.6_STABLE (accessed March 15, 2018).
Martin, M. J., King, R. R., While, J., and Martin, A. A. (2018). Assimilating satellite sea surface salinity data from SMOS, Aquarius and SMAP into a global ocean forecasting system. Q. J. R. Meteorol. Soc. 145, 705–726. doi: 10.1002/qj.3461
Masuda, S., Awaji, T., Sugiura, N., Matthews, J. P., Toyoda, T., Kawai, Y., et al. (2010). Simulated rapid warming of abyssal north Pacific waters. Science 329, 319–322. doi: 10.1126/science.1188703
Masuda, S., Osafune, S., and Hemmi, T. (2018). Deep-float salinity data synthesis for deep ocean state estimation: method and impact. Progr. Earth Planet. Sci. 5:89. doi: 10.1186/s40645-018-0247-9
McPhaden, M. J., Busalacchi, A. J., Cheney, R., Donguy, J., Gage, K. S., Halpern, D., et al. (1998). The tropical Ocean-Global Atmosphere observing system, a decade of progress. J. Geophys. Res. 103, 14169–14240. doi: 10.1029/97JC02906
Mogensen, K. S., Magnusson, L., and Bidlot, J. R. (2017). Tropical cyclone sensitivity to ocean coupling in the ECMWF coupled model. Q. J. R. Meteorol. Soc. 122, 4392–4412. doi: 10.1002/2017JC012753
Moore, A. M., Arango, H. G., Broquet, G., Edwards, C., Veneziani, M., Powell, B., et al. (2011). The Regional Ocean Modeling System (ROMS) 4-dimensional variational data assimilation systems: part III – Observation impact and observation sensitivity in the California Current System. Prog. Oceangr. 91, 74–94. doi: 10.1016/j.pocean.2011.05.005
Ocean Observations Panel for Climate (OOPC), (2014). “Tropical Pacific observing system,” in 2020 Workshop (TPOS 2020) Vol. 1: Workshop Report and Recommendations GCOS-184/GOOS-205/WCRP-6/2014, 66. Available online at: http://tpos2020.org/wp-content/uploads/TPOS-2020-Workshop-Report-FINAL-300114.pdf
Oke, P. R., Allen, J. S., Miller, R. N., Egbert, G. D., and Kosro, P. M. (2002). Assimilation of surface velocity data into a primitive equation coastal ocean model. J. Geophys. Res. 107, 3122–3147. doi: 10.1029/2000JC000511
Oke, P. R., Balmaseda, M. A., Benkiran, M., Cummings, J. A., Dombrowsky, E., Fujii, Y., et al. (2009). Observing system evaluations using GODAE systems. Oceanography 22, 144–153. doi: 10.5670/oceanog.2009.72
Oke, P. R., Brassington, G. B., Griffin, D. A., and Schiller, A. (2010). Ocean data assimilation: a case for ensemble optimal interpolation. Aust. Meteorol. Oceanogr. J. 59, 67–76. doi: 10.22499/2.5901.008
Oke, P. R., Larnicol, G., Fujii, Y., Smith, G. C., Lea, D. J., Guinehut, S., et al. (2015a). Assessing the impact of observations on ocean forecasts and reanalyses: part 1, Global studies. J. Oper. Oceanogr. 8, s49–s62. doi: 10.1080/1755876X.2015.1022067
Oke, P. R., Larnicol, G., Jones, E. M., Kourafalou, V. H., Sperrevik, A. K., Carse, F., et al. (2015b). Assessing the impact of observations on ocean forecasts and reanalyses: part 2: regional applications. J. Oper. Oceanogr. 8, S63–S79. doi: 10.1080/1755876X.2015.1022080
Oke, P. R., and Schiller, A. (2007). Impact of Argo, SST, and altimeter data on an eddy-resolving ocean reanalysis. Geophys. Res. Lett. 34:L19601. doi: 10.1029/2007GL031549
Osafune, S., Masuda, S., Sugiura, N., and Doi, T. (2015). Evaluation of the applicability of the Estimated Ocean State for Climate Research (ESTOC) dataset. Geophys. Res. Lett. 42, 4903–4911. doi: 10.1002/2015GL064538
PPP Steering Group (2013). WWRP Polar Prediction Project Implementation Plan. WMO Report. WWRP/PPP 2-2013, 72. Available at: https://www.polarprediction.net/fileadmin/user_upload/www.polarprediction.net/Home/Documents/WWRP-PPP_IP_Final_12Jan2013_v1_2.pdf (accessed October 29, 2018).
PPP Steering Group (2014). WWRP Polar Prediction Project Implementation Plan for the Year of Polar Prediction (YOPP). WMO Report. WWRP/PPP 3-2014, 53. Available at: https://www.polarprediction.net/fileadmin/user_upload/www.polarprediction.net/Home/Documents/WWRP-PPP_YOPP_Plan_2014_v1_1.pdf (accessed October 29, 2018)
Purkey, S. G., and Johnson, G. C. (2010). Warming of global abyssal and deep Southern Ocean waters between the 1990s and the 2000s: contributions to global heat and sea level rise budgets. J. Clim. 23, 6336–6351. doi: 10.1175/2010JCLI3682.1
Reul, N., Fournier, S., Boutin, J., Hernandez, O., Maes, C., Chapron, B., et al. (2013). Sea surface salinity observations from space with the SMOS Satellite: a new means to monitor the marine branch of the water cycle. Surv. Geophys. 35, 681–772. doi: 10.1007/s10712-013-9244-0
Riser, S. C., Freeland, H. J., Roemmich, D., Wijffels, S., Troisi, A., Belbéoch, M., et al. (2016). Fifteen years of ocean observations with the global Argo array. Nat. Clim. Change 6, 145–153. doi: 10.1038/nclimate2872
Rodriguez, E., and Esteban-Fernandez, D. (2010). “The Surface Water and Ocean Topography Mission (SWOT): the Ka-band Radar Interferometer (KaRIn) for water level measurements at all scales.” in Proceedings of the SPIE Remote Sensing Conference, Vol. 7826, Sensors, Systems, and Next-Generation Satellites XIV, eds R. Meynart, S. P. Neeck, and H. Shimoda (Toulouse), 782614. doi: 10.1117/12.868525
Roemmich, D., Alford, M.H., Claustre, H., Johnson, K., King, B., Moum, J., et al. (2019). On the future of Argo: an enhanced global array of physical and biogeochemical sensing floats. Front. Mar. Sci.
Roulston, M. S., and Smith, L. A. (2002). Evaluating probabilistic forecasts using information theory. Mon. Wea. Rev. 130, 1653–1660. doi: 10.1175/1520-0493(2002)130<1653:EPFUIT>2.0.CO;2
Sakov, P., Counillon, F., Bertino, L., Lisæter, K. A., Oke, P. R., and Korablev, A. (2012). TOPAZ4: an ocean-sea ice data assimilation system for the North Atlantic and Arctic. Ocean Sci. 8, 633–656. doi: 10.5194/os-8-633-2012
Severinghaus, J. P., Sowers, T., Brook, E. J., Alley, R. B., and Bender, M. L. (1998). Timing of abrupt climate change at the end of the Younger Dryas interval from thermally fractionated gases in polar ice. Nature 391, 141–146. doi: 10.1038/34346
Smith, G. C., Allard, R., Babin, M., Bertino, L., Chevallier, M., Corlett, G. K., et al. (2019). Polar ocean observations: a critical gap in the observing system and its role in affecting polar environmental prediction. Front. Mar. Sci.
Smith, G. C., Bélanger, J. M., Roy, F., Pellerin, P., Ritchie, H., and Onu, K. (2018). Impact of Coupling with an ice–ocean model on global medium-range NWP forecast skill. Mon. Wea. Rev. 146, 1157–1180. doi: 10.1175/MWR-D-17-0157.1
Smith, N., Kessler, W. S., Cravatte, S., Sprintall, J., Wijffels, S., Cronin, M. F., et al. (2019). Tropical Pacific observing system. Front. Mar. Sci. 6:31. doi: 10.3389/fmars.2019.00031
Stammer, D., Balmaseda, M., Heimbach, P., Köhl, A., and Weaver, A. (2016). Ocean data assimilation in support of climate applications: status and perspectives. Ann. Rev. Mar. Sci 8, 491–518. doi: 10.1146/annurev-marine-122414-034113
Subramanian, A., Balmaseda, M. A., Chattopadhyay, R., Centurioni, L. C., Cornuelle, B. C., DeMott, C. A., et al. (2019). Ocean observations to improve our understanding, modeling, and forecasting of subseasonal-to-seasonal variability. Front. Mar. Sci.
Thacker, W. C. (1989). The role of the Hessian matrix in fitting models to measurements. J. Geophys. Res. 94, 6177–6196. doi: 10.1029/JC094iC05p06177
Thomson, R. E., and Emery, W. J. (2014). “Chapter 5: time series analysis methods,” in Data Analysis Methods in Physical Oceanography, 3rd Edn, eds R. E. Thomson and W. J. Emery (Boston, MA: Elsevier), 425–591. doi: 10.1016/B978-0-12-387782-6.00005-3
Toyoda, T., Fujii, Y., Kuragano, T., Matthews, J. P., Abe, H., Ebuchi, N., et al. (2015). Improvements to a global ocean data assimilation system through the incorporation of Aquarius surface salinity data. Q. J. R. Meteorol. Soc. 141, 2750–2759. doi: 10.1002/qj.2561
Tranchant, B., Remy, E., Greiner, E., and Legalloudec, O. (2019). Data assimilation of Soil Moisture and Ocean Salinity (SMOS) observations into the Mercator Ocean operational system: focus on the EL Nino 2015 event. Ocean Sci. 15, 543–563. doi: 10.5194/os-15-543-2019
Turpin, V., Rémy, E., and Le Traon, P. Y. (2016). How essential are Argo observations to constrain a global ocean data assimilation system. Ocean Sci. 12, 257–274. doi: 10.5194/os-12-257-2016
Usui, N., Fujii, Y., Sakamoto, K., and Kamachi, M. (2015). Development of a four-dimensional variational assimilation system toward coastal data assimilation around Japan. Mon. Wea. Rev. 143, 3874–3892. doi: 10.1175/MWR-D-14-00326.1
Visbeck, M., Araujo, M., Boetius, A., Buch, E., Claustre, H., Dabrowski, T., et al. (2015). More Integrated and More Sustainable Atlantic Ocean Observing System (AtlantOS). CLIVAR Exchanges 67, 18–20.
Wang, Q., Mu, M., and Dijkstra, H. A. (2013). Effects of nonlinear physical processes on optimal error growth in predictability experiments of the Kuroshio Large Meander. J. Geophys. Res. 118, 6425–6438. doi: 10.1002/2013JC009276
World Weather Research Program (WWRP) (2017). Subseasonal-to-Seasonal Prediction Project. Driving Innovation Together; The World Weather Research Program. WMO-No. 1191, 13–16. Available online at: http://s2sprediction.net/file/documents_reports/1191_WWRP_Driving_Innovation_JN17380(2).pdf
Wunsch, C., and Heimbach, P. (2013). “Dynamically and kinematically consistent global ocean circulation and ice state estimates,” in Ocean Circulation and Climate: A 21st Century Perspective, 2nd Edn, Vol. 103 (Amsterdam: Elsevier Ltd.), 553–579. doi: 10.1016/B978-0-12-391851-2.00021-0
Xie, J., Bertino, L., Counillon, F., Lisæter, K. A., and Sakov, P. (2017). Quality assessment of the TOPAZ4 reanalysis in the Arctic over the period 1991–2013. Ocean Sci. 13, 123–144. doi: 10.5194/os-13-123-2017
Xue, Y., Wen, C., Kumar, A., Balmaseda, M., Fujii, Y., Alves, O., et al. (2017a). A real-time ocean reanalyses intercomparison project in the context of tropical Pacific observing system and ENSO monitoring. Clim. Dyn. 49, 3647–3672. doi: 10.1007/s00382-017-3535-y
Xue, Y., Wen, C., Yang, X., Behringer, D., Kumar, A., Vecchi, G., et al. (2017b). Evaluation of tropical Pacific observing system using NCEP and GFDL ocean data assimilation systems. Clim. Dyn. 49, 843–868. doi: 10.1007/s00382-015-2743-6
Zanna, L., Heimbach, P., Moore, A. M., and Tziperman, E. (2011). Optimal excitation of interannual Atlantic meridional overturning circulation variability. J. Clim. 24, 413–427. doi: 10.1175/2010JCLI3610.1
Zuo, H., Balmaseda, M. A., and Mogensen, K. (2017). The new eddy-permitting ORAP5 ocean reanalysis: description, evaluation and uncertainties in climate signals. Clim. Dyn. 49, 791–811. doi: 10.1007/s00382-015-2675-1
Zuo, H., Balmaseda, M. A., Mogensen, K., and Tietsche, S. (2018). OCEAN5: The ECMWF Ocean Reanalysis System and Its Real-Time Analysis Component. ECMWF Technical Memo 823, 44.
Keywords: observing system evaluation, ocean data assimilation, ocean prediction, OSSE (observing system simulation experiment), OSE (observing system experiment), GODAE OceanView, OceanPredict, CLIVAR-GSOP
Citation: Fujii Y, Rémy E, Zuo H, Oke P, Halliwell G, Gasparin F, Benkiran M, Loose N, Cummings J, Xie J, Xue Y, Masuda S, Smith GC, Balmaseda M, Germineaud C, Lea DJ, Larnicol G, Bertino L, Bonaduce A, Brasseur P, Donlon C, Heimbach P, Kim Y, Kourafalou V, Le Traon P-Y, Martin M, Paturi S, Tranchant B and Usui N (2019) Observing System Evaluation Based on Ocean Data Assimilation and Prediction Systems: On-Going Challenges and a Future Vision for Designing and Supporting Ocean Observational Networks. Front. Mar. Sci. 6:417. doi: 10.3389/fmars.2019.00417
Received: 09 November 2018; Accepted: 05 July 2019;
Published: 29 July 2019.
Edited by:
Laura Lorenzoni, University of South Florida, United StatesReviewed by:
Zhijin Li, NASA Jet Propulsion Laboratory (JPL), United StatesNadya Vinogradova Shiffer, National Aeronautics and Space Administration (NASA), United States
Copyright © 2019 Fujii, Rémy, Zuo, Oke, Halliwell, Gasparin, Benkiran, Loose, Cummings, Xie, Xue, Masuda, Smith, Balmaseda, Germineaud, Lea, Larnicol, Bertino, Bonaduce, Brasseur, Donlon, Heimbach, Kim, Kourafalou, Le Traon, Martin, Paturi, Tranchant and Usui. This is an open-access article distributed under the terms of the Creative Commons Attribution License (CC BY). The use, distribution or reproduction in other forums is permitted, provided the original author(s) and the copyright owner(s) are credited and that the original publication in this journal is cited, in accordance with accepted academic practice. No use, distribution or reproduction is permitted which does not comply with these terms.
*Correspondence: Yosuke Fujii, yfujii@mri-jma.go.jp