Global in situ Observations of Essential Climate and Ocean Variables at the Air–Sea Interface
 Luca R. Centurioni1*
  Jon Turton2
  Rick Lumpkin3
  Lancelot Braasch1
  Gary Brassington4
  Yi Chao5
  Etienne Charpentier6
  Zhaohui Chen7
  Gary Corlett8 Kathleen Dohan9
  Craig Donlon10
  Champika Gallage6
  Verena Hormann1
  Alexander Ignatov11 Bruce Ingleby12
  Robert Jensen13
  Boris A. Kelly-Gerreyn4
  Inga M. Koszalka14
  Xiaopei Lin7
  Eric Lindstrom15
  Nikolai Maximenko16
  Christopher J. Merchant17
  Peter Minnett18
  Anne O’Carroll19
  Theresa Paluszkiewicz20†
  Paul Poli21
  Pierre-Marie Poulain22
  Gilles Reverdin23
  Xiujun Sun7
  Val Swail24
  Sidney Thurston25 Lixin Wu7
  Lisan Yu26
  Bin Wang27
  Dongxiao Zhang28
- 1Scripps Institution of Oceanography, University of California, San Diego, San Diego, CA, United States
- 2Met Office, Exeter, United Kingdom
- 3NOAA’s Atlantic Oceanographic and Meteorological Laboratory, Miami, FL, United States
- 4Bureau of Meteorology, Melbourne, VIC, Australia
- 5Remote Sensing Solutions, Barnstable, MA, United States
- 6World Meteorological Organization, Geneva, Switzerland
- 7Ocean University of China, Qingdao, China
- 8EUMETSAT, Darmstadt, Germany
- 9Earth and Space Research, Seattle, WA, United States
- 10European Space Agency, Paris, France
- 11Center for Satellite Applications and Research (STAR), NOAA, College Park, MD, United States
- 12European Centre for Medium-Range Weather Forecasts, Reading, United Kingdom
- 13Engineer Research and Development Center, Vicksburg, MS, United States
- 14Department of Meteorology, Stockholm University (MISU), Stockholm University Baltic Sea Centre, Stockholm, Sweden
- 15National Aeronautics and Space Administration, Washington, DC, United States
- 16International Pacific Research Center, School of Ocean and Earth Science and Technology, University of Hawai’i, Honolulu, HI, United States
- 17Department of Meteorology, University of Reading, Reading, United Kingdom
- 18Rosenstiel School of Marine and Atmospheric Science, University of Miami, Miami, FL, United States
- 19European Organization for the Exploitation of Meteorological Satellites, Darmstadt, Germany
- 20Office of Naval Research, Arlington, VA, United States
- 21Météo-France, Toulouse, France
- 22Istituto Nazionale di Oceanografia e di Geofisica Sperimentale, Trieste, Italy
- 23UMR 7159 Laboratoire d’Océanographie et du Climat: Expérimentations et Approches Numériques, Paris, France
- 24Environment and Climate Change Canada, Gatineau, QC, Canada
- 25National Oceanic and Atmospheric Administration, Washington, DC, United States
- 26Woods Hole Oceanographic Institution, Woods Hole, MA, United States
- 27National Marine Technology Center, Tianjin, China
- 28Pacific Marine Environmental Laboratory (NOAA), Seattle, WA, United States
The air–sea interface is a key gateway in the Earth system. It is where the atmosphere sets the ocean in motion, climate/weather-relevant air–sea processes occur, and pollutants (i.e., plastic, anthropogenic carbon dioxide, radioactive/chemical waste) enter the sea. Hence, accurate estimates and forecasts of physical and biogeochemical processes at this interface are critical for sustainable blue economy planning, growth, and disaster mitigation. Such estimates and forecasts rely on accurate and integrated in situ and satellite surface observations. High-impact uses of ocean surface observations of essential ocean/climate variables (EOVs/ECVs) include (1) assimilation into/validation of weather, ocean, and climate forecast models to improve their skill, impact, and value; (2) ocean physics studies (i.e., heat, momentum, freshwater, and biogeochemical air–sea fluxes) to further our understanding and parameterization of air–sea processes; and (3) calibration and validation of satellite ocean products (i.e., currents, temperature, salinity, sea level, ocean color, wind, and waves). We review strengths and limitations, impacts, and sustainability of in situ ocean surface observations of several ECVs and EOVs. We draw a 10-year vision of the global ocean surface observing network for improved synergy and integration with other observing systems (e.g., satellites), for modeling/forecast efforts, and for a better ocean observing governance. The context is both the applications listed above and the guidelines of frameworks such as the Global Ocean Observing System (GOOS) and Global Climate Observing System (GCOS) (both co-sponsored by the Intergovernmental Oceanographic Commission of UNESCO, IOC–UNESCO; the World Meteorological Organization, WMO; the United Nations Environment Programme, UNEP; and the International Science Council, ISC). Networks of multiparametric platforms, such as the global drifter array, offer opportunities for new and improved in situ observations. Advances in sensor technology (e.g., low-cost wave sensors), high-throughput communications, evolving cyberinfrastructures, and data information systems with potential to improve the scope, efficiency, integration, and sustainability of the ocean surface observing system are explored.
Introduction
The air–sea interface is a key gateway in the Earth system. It is where the atmosphere sets the ocean in motion, climate and weather-relevant air–sea forcing and feedback processes occur, and pollutants such as plastic, anthropogenic carbon dioxide, and some radioactive and chemical waste enter the sea. Hence, improving the accuracy of estimates and forecasts of physical and biogeochemical processes at this interface has direct impacts on society and is essential for a sustainable blue economy planning, growth, and disaster mitigation. Such estimates and forecasts rely on accurate and integrated in situ and satellite surface observations of essential climate and ocean variables (ECVs and EOVs) at the ocean–atmosphere interface and in the respective boundary layers.
Satellite observations offer near-global coverage at useful spatial and temporal resolution that make them well suited for assimilation, alongside in situ observations, into forecasting models and for estimating the state of the ocean/atmosphere system. Both active and passive remote sensing techniques are used in a wide spectral interval spanning visible, infrared, and microwave parts of the spectrum, to measure many of the ECVs and EOVs also sampled by the in situ network. In situ sensors also provide the data against which satellite retrievals are calibrated, for example, ocean color, and validated, for example, ocean color, sea surface temperature (SST), and surface winds (Kilpatrick et al., 2001, 2015; Xu and Ignatov, 2010; Xu and Ignatov, 2014; Ignatov et al., 2016; Loew et al., 2017). However, some variables such as sea level pressure (SLP) cannot be determined from space with current technology, and thus, their acquisition relies solely on in situ platforms. A comprehensive description of the satellite systems used for remote sensing of the air–sea interface is beyond the scope of this review but can be found in Ardhuin et al. (2019a, b), Bourassa et al. (2019), Cronin et al. (2019), Gommenginger et al. (2019), Kent et al. (2019), O’Carroll et al. (2019), Smith et al. (2019), Swart et al. (2019), Villas Bôas et al. (2019), Wanninkhof et al. (2019), and Weller et al. (2019).
In situ observations at the air–sea interface are currently obtained from several programs such as the global surface drifter array (GSDA), the Voluntary Observing Ship (VOS) scheme, the tropical moored buoy array (TMBA), OceanSITES, and various national moored buoy networks. The Argo program, mainly aimed at studying the depth of the ocean from the surface to 2 km with profiling floats (Roemmich et al., 2009; Riser et al., 2016), also contributes, although to a lesser extent, to characterizing the air–sea interface.
The focus of many of the sustained observational programs operating at the interface between the ocean and the atmosphere is to measure key ECVs that are defined under the global climate observing system (GCOS) framework. Established in 1992 and co-sponsored by the World Meteorological Organization (WMO), the Intergovernmental Oceanographic Commission (IOC) of the United Nations Educational, Scientific and Cultural Organization (UNESCO), the United Nations Environment Program (UNEP), and the International Science Council (ISC), GCOS provides a list of 54 ECVs (including near-surface currents, SST, and SLP) needed to support intergovernmental and national oceanographic, climate, and weather services. The WMO Integrated Global Observing System (WIGOS) provides an overarching framework for integrating the various sources of observations, including the networks mentioned above, contributing to WMO applications. The framework includes relevant tools, standards, guidance, and WMO regulatory material. WIGOS also provisions for observing network design and observing system evolution through the WMO’s Rolling Review of Requirements (RRR), where observational user requirements are compared with observing systems capabilities1 together with impact studies for the identification of observational gaps, leading to prioritization for the evolution of global observing systems and key recommended actions to WMO members and other significant programs to address such gaps. One component of WIGOS, the Global Observing System (GOS), provides for national meteorological services (NMSs) and other partners’ contributions to the Global Ocean Observing System (GOOS) and GCOS (meteorological satellites, drifters, moored buoys, and VOS). See Moltmann et al. (2019) for more details on WIGOS.
Many of these global observing networks are made of collections of national scientific and operational programs designed and implemented in support of a wide range of multidisciplinary scientific research and operational applications. Often, data from multiple programs and networks are consolidated to facilitate their accessibility and use. One example is the International Comprehensive Ocean–Atmosphere Data Set (ICOADS) project, which attempts to bring together all available data of the ocean–atmosphere interface (Freeman et al., 2016). Likewise, satellite communities, including the Group for High-Resolution SST (GHRSST; Donlon et al., 2009), consolidate and uniformly quality control the in situ data for the satellite era for use in their calibration and validation systems, standardize the matchup criteria, and unify and consolidate the comparison metrics (O’Carroll et al., 2019). The European Copernicus Marine Environment Monitoring Service (CMEMS) also relies on data from in situ monitoring networks to provide robust integrated information and to calibrate and validate the data from satellites.
The purpose of this article is to review strengths, weaknesses, impacts, and sustainability of in situ global observing networks measuring target ECVs and EOVs at the air–sea interface and to provide a 10-year vision for improved synergy and integration with other observing systems (e.g., satellites), for modeling/forecast efforts, and for a better ocean observing governance. We review new emerging technologies, sensors, newly developed platforms, as well as information technology advances that have the potential to improve the impact and efficiency of the existing ocean surface observing networks or the creation of new ones. The context is both the applications listed above and the guidelines of frameworks such as IOC–WMO–UNEP, WMO–IOC Joint Technical Commission for Oceanography and Marine Meteorology (JCOMM), ISC, GCOS, GOOS, and WIGOS (Moltmann et al., 2019).
State of the Art: Existing Global Networks for Observations at the Air–Sea Interface. Configuration and Impacts
The Global Surface Drifter Array
Background and Objectives
The large-scale deployment of Lagrangian (i.e., water following) surface drifters drogued at a depth of 15 m and designed according to the specifications of the Surface Velocity Program (SVP; Niiler et al., 1995; Niiler, 2001; Centurioni, 2018; see also Figure 3 for schematics of several SVP drifter configurations) began in the tropical Pacific Ocean in 1988 (Hansen and Poulain, 1996). The World Ocean Circulation Experiment (WOCE) requirements were instrumental in laying the foundations of the United States NOAA (National Oceanic and Atmospheric Administration)-funded Global Drifter Program (GDP; Niiler, 2001; Maximenko et al., 2013), which represents along with the SVP the basis of the GSDA. Sustained deployments of drifters quickly grew into a global array with contributions from over 25 countries (see Figure 1) delivering primarily near real-time observations of SST and geolocation. The collaboration between the GSDA and NMSs in the 1990s facilitated the development, testing, and adoption of the barometer drifter (SVP-B; see Figure 3) as a reliable source of SLP data to support weather forecasting with the deployment of such SVP-B drifters in large numbers since then. The GSDA reached its full implementation when drifter number 1,250 was deployed off Halifax, Nova Scotia, Canada, on September 12, 2005, by Distinguished Professor Dr. Peter Niiler of the Scripps Institution of Oceanography (SIO) and Dr. Michael Johnson of NOAA, becoming the first fully implemented component of GOOS. The GDP, a branch of NOAA’s GOOS, is a scientific program that also has substantial impacts on operational activities, including satellite SST validation and numerical weather prediction (NWP) and constitutes the principal component of the GSDA. The GSDA is coordinated internationally through the Data Buoy Cooperation Panel (DBCP), an international body coordinating the use of both drifting and moored data buoys to observe atmospheric and oceanographic conditions over the ocean, including regions where few other measurements are taken, such as the Southern Ocean. The DBCP was created in 1985 as a joint body of WMO and UNESCO’s IOC. The DBCP constitutes the data buoy component of WMO–IOC JCOMM (Pinardi et al., 2019).
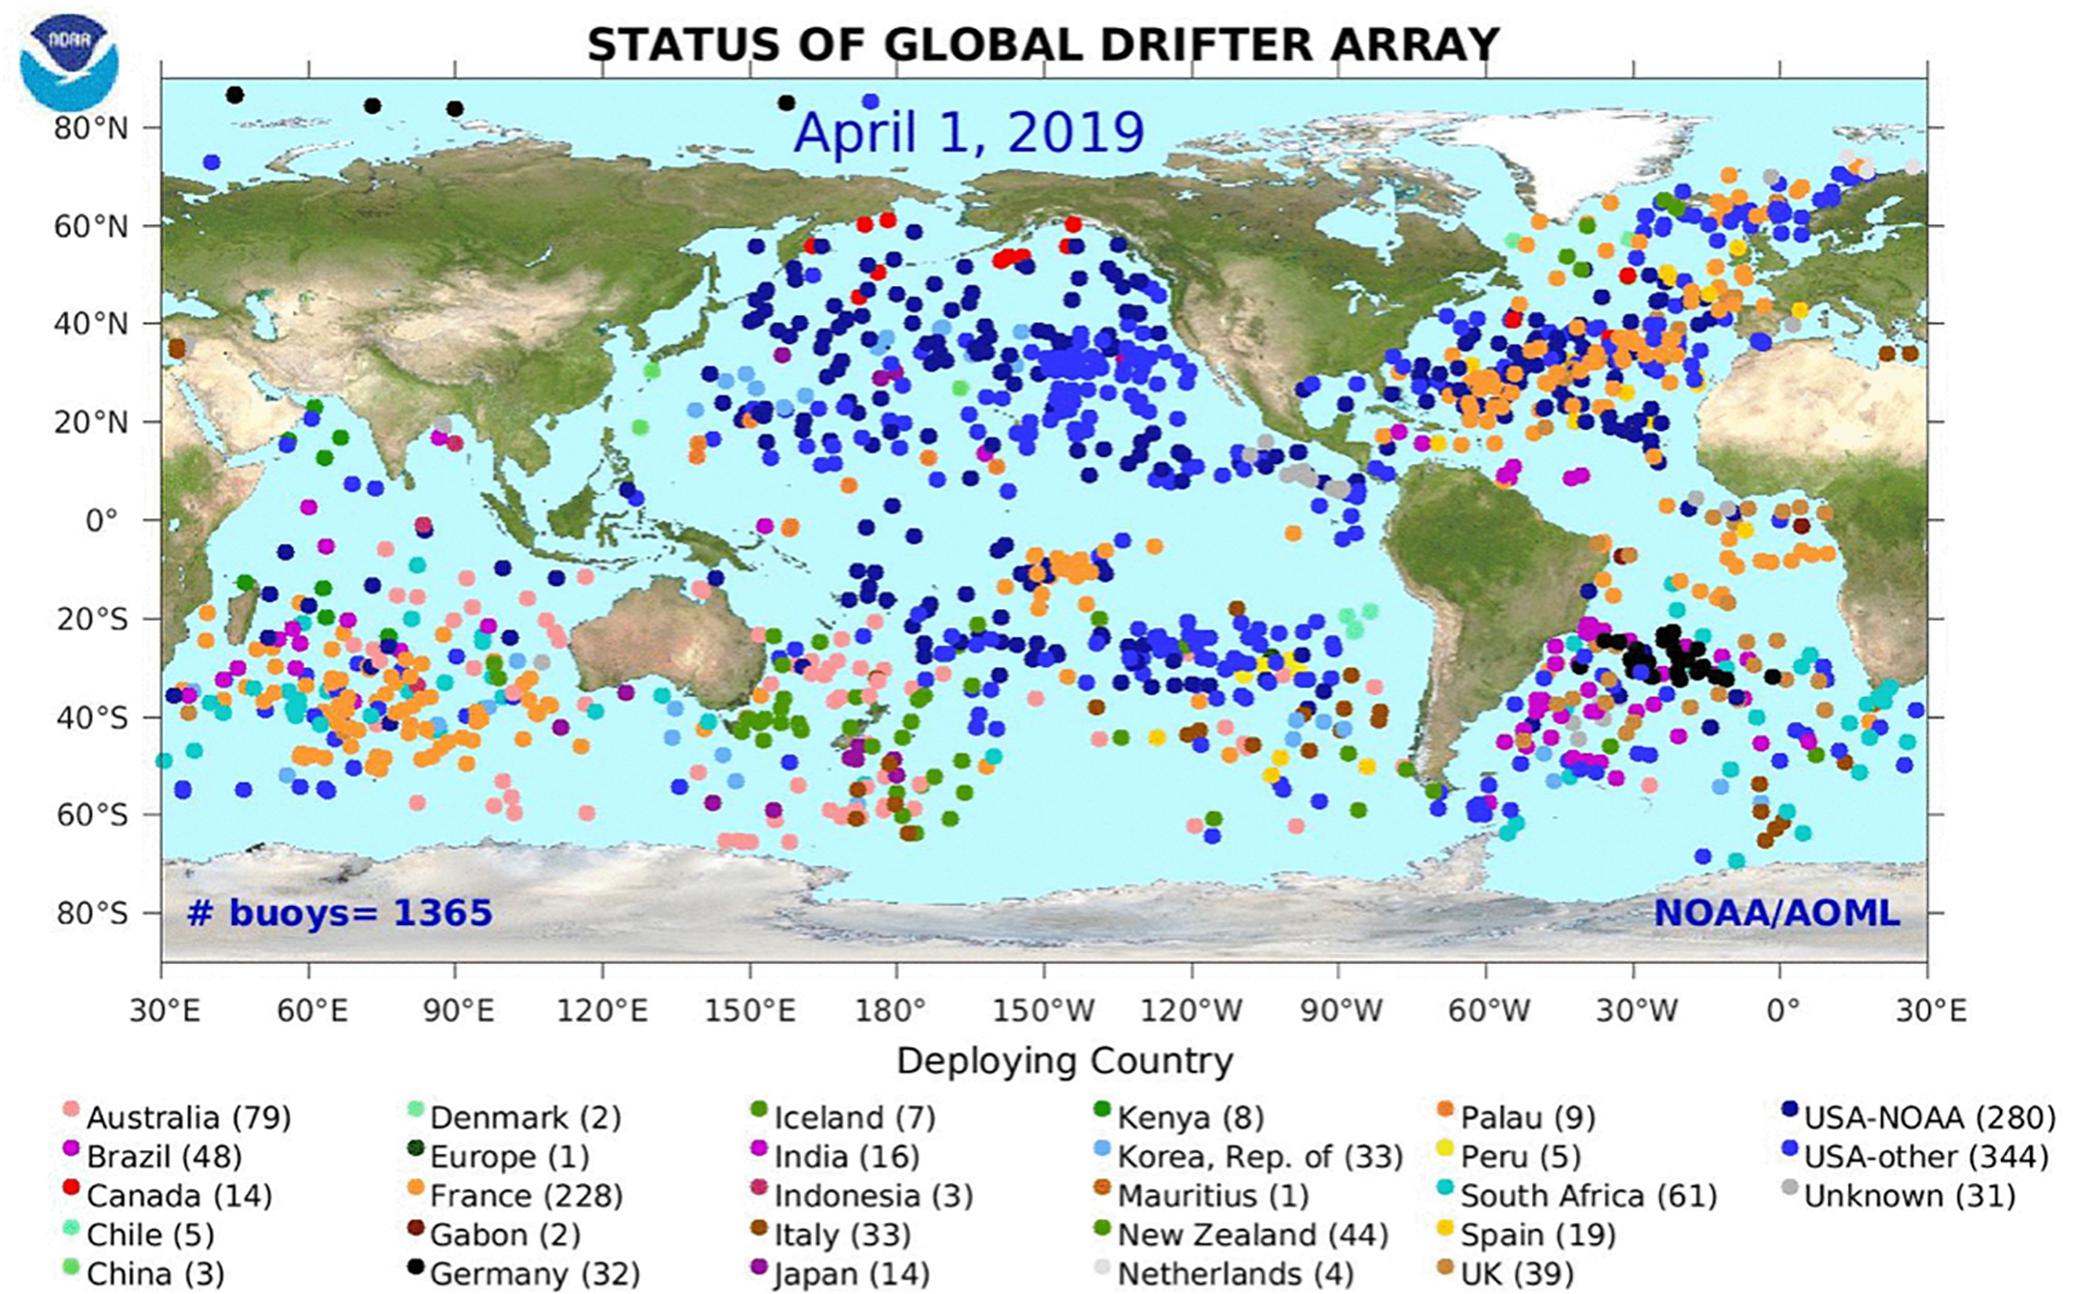
Figure 1. Location of SVP drifters forming the GSDA array, color coded by deploying country.
The main objectives of the GDP and GSDA are very closely aligned and can be summarized as follows:
• Maintain a global 5°× 5° array of satellite-tracked SVP drifters (excluding marginal seas and latitudes higher than 60°N/S) to meet the need for an accurate and globally dense set of in situ observations of near-surface currents, SST, and SLP.
• Provide a data processing system to deliver the data to operational and research users via the WMO Global Telecommunication System (GTS) and via quality-controlled (QC), delayed mode products. The release of QC data products is led by the United States GDP component at the Atlantic Oceanographic and Meteorological Laboratory (AOML) of NOAA.
• Under the lead of the United States GDP component at SIO, the Lagrangian Drifter Laboratory (LDL), to innovate the drifter technology and expand the scope of the international program by transitioning new technologies and sensors into operation. Examples of recently developed technologies include water-following drifters measuring wind, solar radiation, and directional wave spectra (see section “Emerging Technologies”).
The GCOS and GOOS guidelines specify an array of at least 1,250 Lagrangian SVP drifting buoys, as needed to achieve a 5° × 5° global coverage. More details on this can be found in Lumpkin et al. (2016), who also discuss the modern implementation strategy of the GDP and GSDA. A crucial aspect of the data delivery is that the time interval between data collection and delivery to the GTS needs to be as short as possible, typically 15 min or less, in order to meet operational forecasting needs. The Iridium satellite system currently satisfies this requirement, and, at the time of writing, around 80% of the GSDA now transmits its data via Iridium telemetry. It is anticipated that by the end of 2019, all drifters in the GSDA will be using Iridium modems.
Horizontal Near-Surface Current Observations From SVP Drifters
The historical drifter data archive maintained and served by the GDP’s Data Assembly Center (DAC) at NOAA/AOML dates back to 1979 and consists of observations from more than 22,000 Lagrangian SVP drifters. Near-surface, 15-m deep, ocean currents from SVP drifters are computed from satellite-derived time series of geolocation obtained with the Argos satellite system for older drifters and now with Global Positioning System (GPS) satellites. The accuracy of GPS geolocation is one to two orders of magnitude better than Argos. Consequently, GPS drifters provide more accurate ocean current data. Standardized QC techniques and interpolating procedures (Hansen and Poulain, 1996) onto regularly spaced 6-h time series are described, for example, in Niiler (2001) and Maximenko et al. (2013). QC and interpolation of recent data to hourly intervals are described in Elipot et al. (2016). The temporal extension of the GSDA dataset testifies to its value as a reference series relevant for climate studies and supports a detailed description of most oceanic mesoscale and submesoscale features and the major persistent current systems of the World Ocean.
The NOAA-funded GDP releases QC ocean current data that have supported more than 1,000 peer-reviewed scientific publications (see http://www.aoml.noaa.gov/phod/dac/gdp_biblio.php for a partial list). The quality of the data collected with Lagrangian SVP drifters is discussed, for example, in Niiler (2001), Pazan and Niiler (2001), Lumpkin and Pazos (2007), and Maximenko et al. (2013). Ocean current data are available in delayed-time mode because the strain gauge sensor used to detect the drogue presence requires extensive operator interpretation (Lumpkin et al., 2012), historically with a 3-month delay; automatic drogue loss detection using strain gauge and GPS “time-to-first-fix,” implemented in 2018 by AOML’s DAC, has decreased this delay by a factor of three.
Surface current velocity observations derived from SVP drifters are directly used to validate the ocean velocity products of global monitoring and forecasting systems at Mercator Ocean (Lellouche et al., 2013, 2018), including the state-of-the-art Global Ocean 1/12° Physics Analysis and Forecast. Surface velocities are also assimilated into regional ocean model forecast systems, leading to substantial improvement in the mesoscale Eulerian and Lagrangian forecast skills (e.g., Muscarella et al., 2015; Carrier et al., 2016; Phillipson and Toumi, 2017).
A good synopsis of recent surface ocean circulation studies based on drifter observations can be found in Maximenko et al. (2013), and state-of-the-art climatologies produced at AOML/GDP are discussed by Lumpkin and Johnson (2013) as well as Laurindo et al. (2017). These climatologies are used as benchmarks to validate the mean surface currents in the monitoring and forecasting systems at Mercator Ocean (Gasparin et al., 2018). Regional-scale SVP drifter climatologies have been used to study the seasonal and interannual variabilities of the ocean circulation where the data coverage is sufficient (e.g., Andersson et al., 2011; Poulain et al., 2013; Peng et al., 2015). Methods to remove the biases resulting from the irregular spatial and temporal sampling of the GSDA and to reconstruct the time-dependent geostrophic and Ekman velocities (Gill, 1982) consist in combining satellite altimetry, wind reanalysis products, and, sometimes, the large-scale geoid (Centurioni et al., 2008, 2009; Maximenko et al., 2009; Niiler et al., 2003a, b) (see Figure 2b as an example of such a synthesis). The GDP surface drifter dataset also enabled global mapping of the mean circulation (Figure 2a) and of characteristics such as cyclonic and anticyclonic motions from global SVP drifter observations for scales from large eddies to submesoscales (Griffa et al., 2008). Further, high-frequency (super-inertial) drifter velocity observations have been used to map the amplitude and phase of the baroclinic and barotropic tidal currents (Poulain and Centurioni, 2015). Since 2005, multisatellite processing of drifters transmitting through the Argos satellite system and the increasing use of GPS on some Argos and all Iridium drifters have allowed interpolation down to hourly intervals (Elipot et al., 2016) to support not only studies of global tidal currents but also of near- and super-inertial motions. When a wind stress is applied to the ocean surface, such as by strong storms or tropical cyclones, the transient ocean response in the mixed layer consists in the generation of cyclonically rotating near-surface currents that arise due to the Coriolis effect. These are commonly referred to as (near-)inertial oscillations, and their frequency is given by the Coriolis parameter. The overall current experienced by a Lagrangian SVP drifter results from the superposition of geostrophic currents and preexisting and wind-generated inertial currents, which often manifest in cycloidal drifter trajectories; analysis of drifter observations demonstrates that the period of these oscillations is also modified by the vorticity of the background eddy field and has been used to quantify the decay time scales of the oscillations (Elipot et al., 2010; Sykulski et al., 2016) in agreement with theory (e.g., Kunze, 1985). These inertial oscillations are believed to decay by propagating to greater depth as internal waves and typically subside over a few days to several weeks (e.g., Pollard and Millard, 1970; Price, 1983; D’Asaro et al., 1995; Hormann et al., 2014).
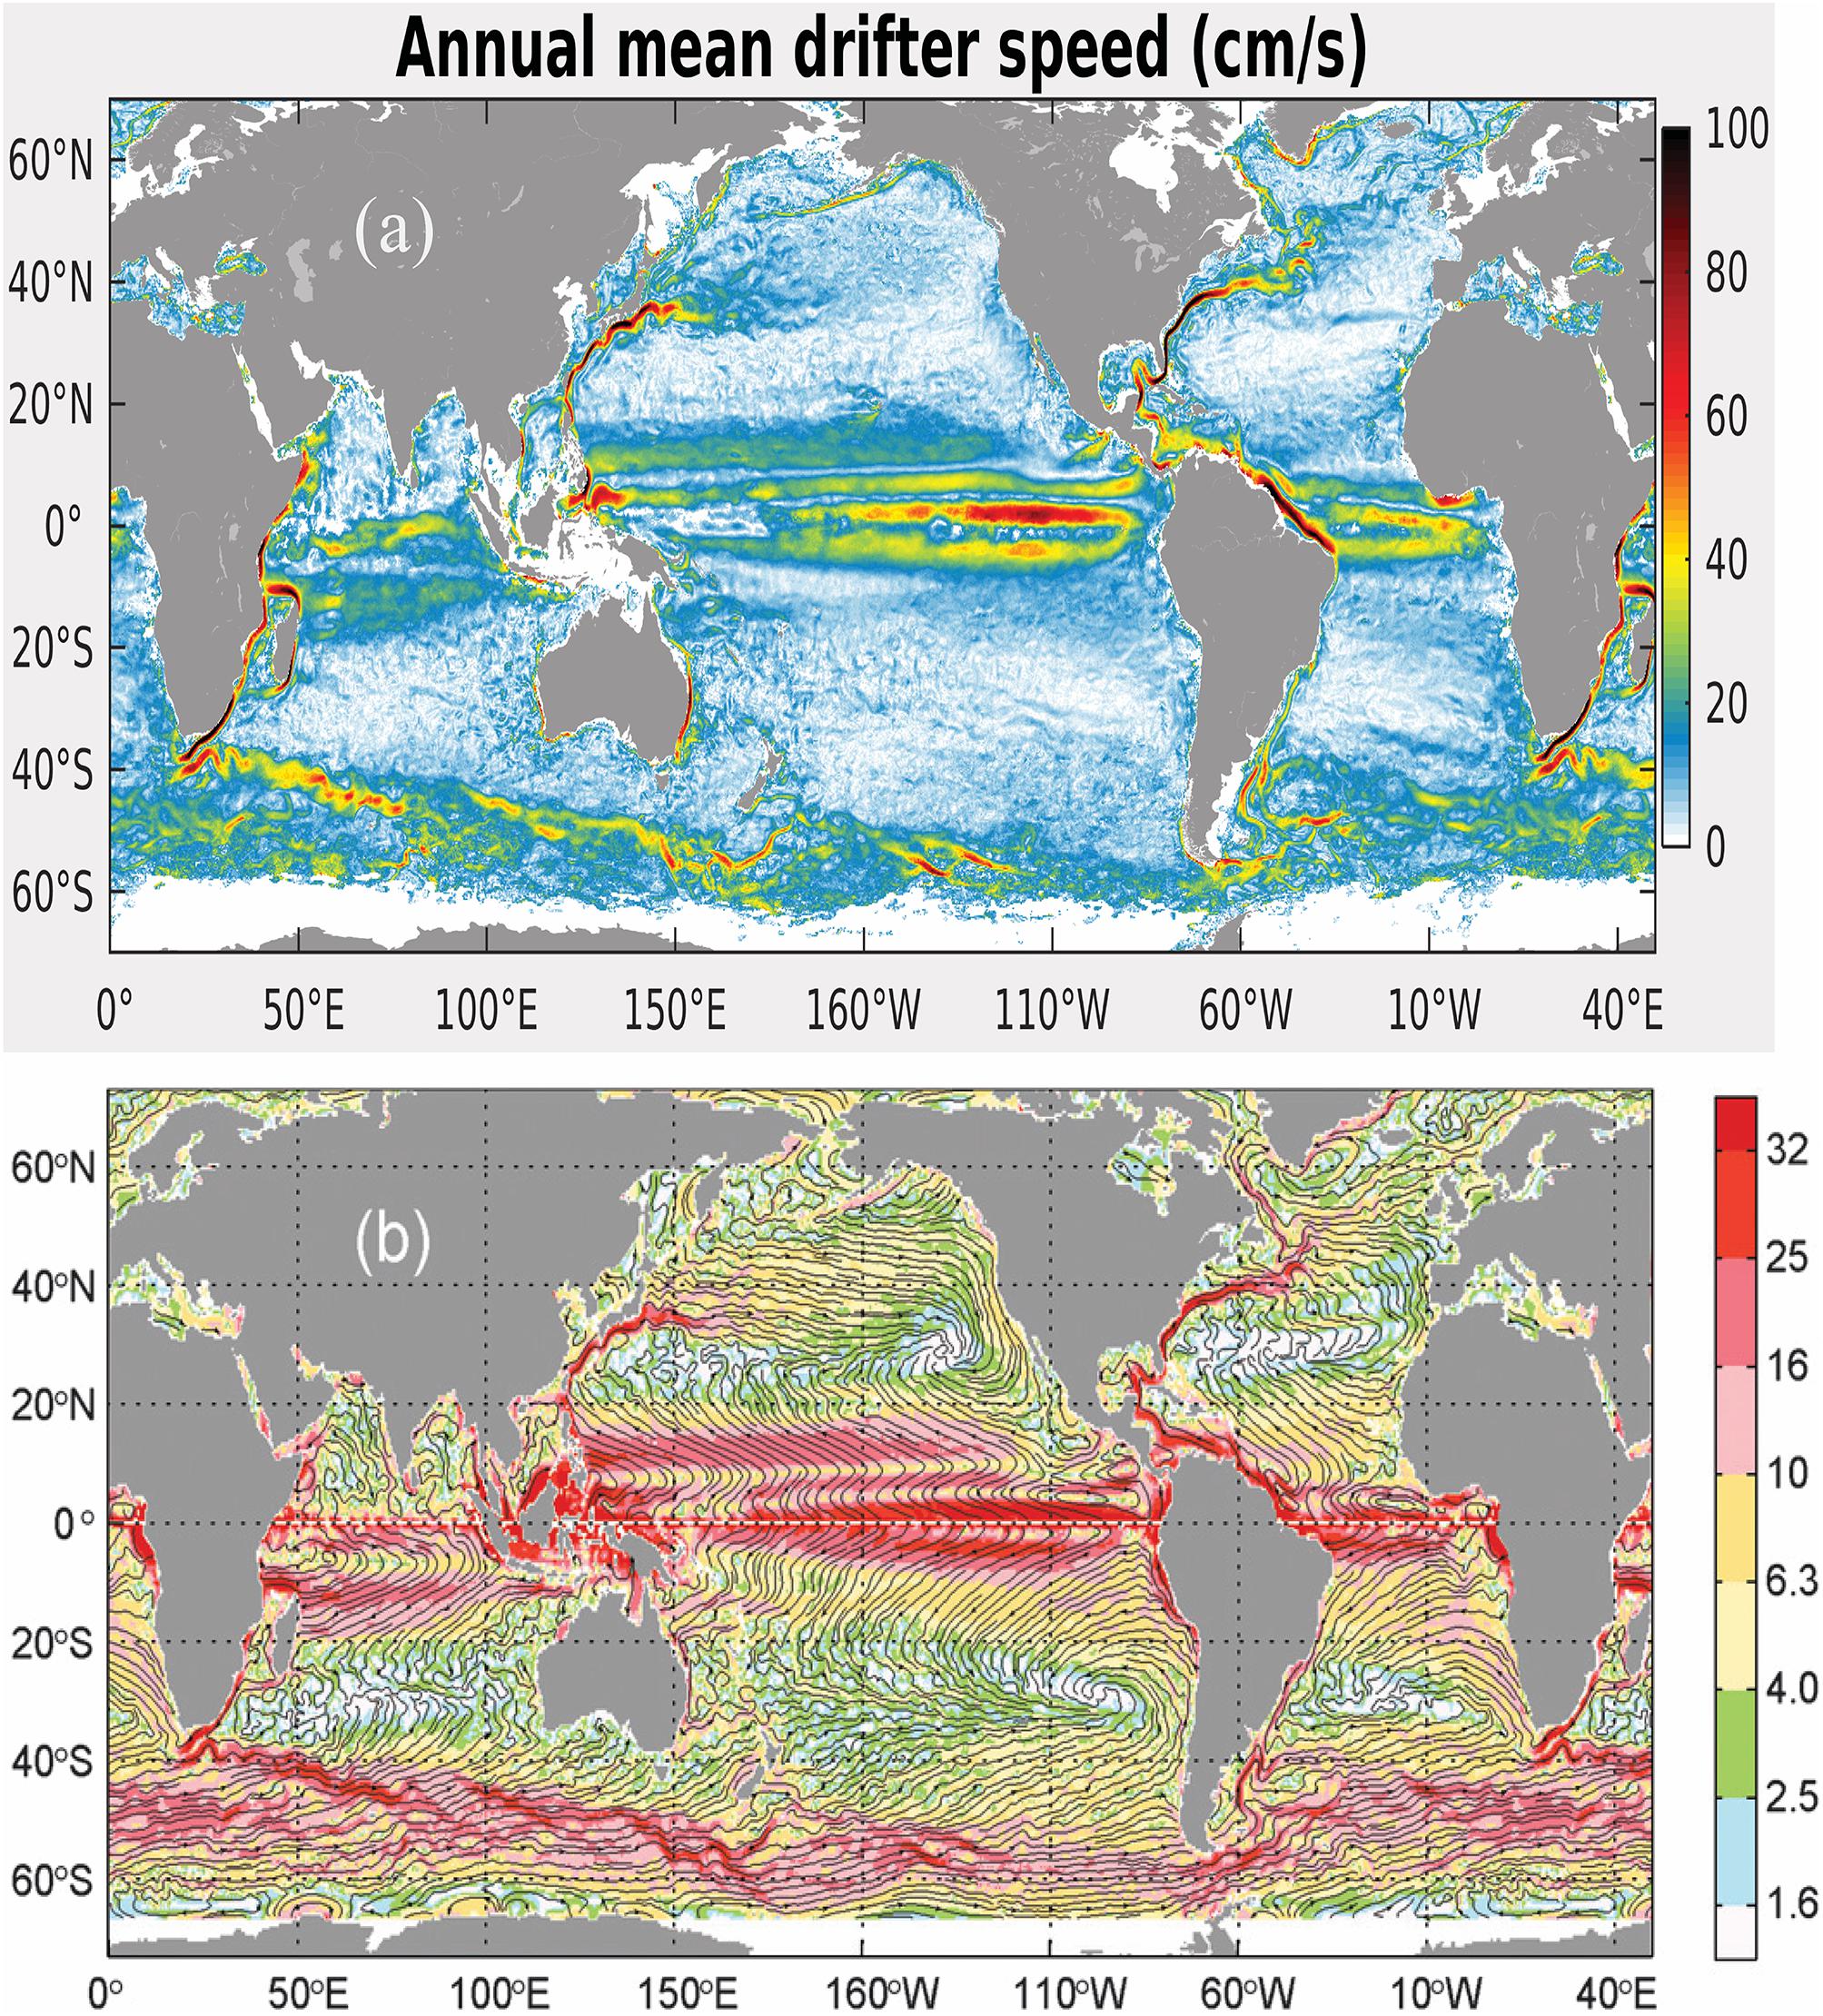
Figure 2. (a) Time mean near-surface current speed (cm/s) measured by GDP drifters; climatology available at https://www.aoml.noaa.gov/phod/gdp/mean _velocity.php. (b) Mean streamlines calculated from a combination of mean geostrophic and Ekman velocities; colors are magnitudes of mean geostrophic plus Ekman velocity (cm/s) used to compute the streamlines (from Maximenko et al., 2009).
Because of the unmatched temporal and spatial resolution and their ability to accurately measure horizontal ocean currents, the observations from SVP drifters have been used in studies of lateral dispersion and mixing due to mesoscale and submesoscale circulations, providing estimates of mixing rates (e.g., Koszalka et al., 2011; Zhurbas et al., 2014; Roach et al., 2018), regional turbulent transport regimes, and time scale dependence of mixing (e.g., Lacorata et al., 2001; Koszalka et al., 2009; Lumpkin and Elipot, 2010). The drifter-derived mixing rates are used to evaluate regional ocean models with implications for eddy parameterizations (e.g., Haza et al., 2007; Döös et al., 2011; Rühs et al., 2018). Turbulent parameters estimated from drifters are used to build stochastic Lagrangian models (e.g., Griffa et al., 1995; Sykulski et al., 2016) that are further used to study signal propagation of hydrographic anomalies (e.g., Koszalka et al., 2013) and dispersion of floating debris (e.g., Cozar et al., 2017; McAdam and van Sebille, 2018).
A further description of ocean current observations in the upper-ocean mixed layer from Lagrangian drifters is given by Lumpkin et al. (2017).
SST Observations From SVP Drifters
Through the GTS, the drifter SSTs contribute to the majority of reanalysis and validation datasets (e.g., OSTIA: Donlon et al., 2012; Coriolis CORA; the CMEMS drifter validation product: Etienne, 2018; EUMETSAT OSI SAF). Today, SVP drifters provide more SST observations than any other source of in situ data, including ships (factor of about 4), coastal moorings (factor of about 4), tropical moorings (factor of about 50), or Argo floats (factor of about 100) (Xu and Ignatov, 2014). Together with tropical moorings, they cover most of the global oceans, producing highly accurate data with near-uniform quality across multiple temperature sensors (Xu and Ignatov, 2016). Argo floats currently provide more uniform global coverage than SVP drifters and tropical moorings and have a lower measurement uncertainty. However, their normal 10-day operating cycle reduces the number of surface2 measurements by two orders of magnitude, leading to more limited validation statistics (e.g., Ignatov et al., 2016; Xu and Ignatov, 2016).
SVP drifters and tropical moorings are currently the main data sources for validation of satellite SST retrievals and are used by many groups to characterize the satellite data (e.g., Kilpatrick et al., 2001, 2015; Minnett and Barton, 2010; Dash et al., 2010; Ignatov et al., 2016), including the retrieval uncertainty (e.g., Bulgin et al., 2016) and the long-term stability of the satellite-derived SSTs (e.g., Kilpatrick et al., 2015; Xu and Ignatov, 2016; Berry et al., 2018). Three-way error analysis methods attempt to decouple errors in the three datasets being compared (e.g., O’Carroll et al., 2008; Xu and Ignatov, 2010, 2016; Lean and Saunders, 2013; Gentemann, 2014). The nominal accuracy and digitization of the temperature probes used to measure SST from SVP drifters deployed before 2014 were O0.1°C. The use of more accurate temperature sensors, with smaller drift, improved accuracy (O0.05°C) and digitization (O0.01°C), and more accurate geolocation using GPS, is becoming the new standard. The triple-collocation studies (e.g., O’Carroll et al., 2008; Xu and Ignatov, 2010, 2016; Lean and Saunders, 2013), reviewed and summarized in Kennedy (2014), estimate the root-mean-square error (rmse; which equates to a standard uncertainty) in drifter SSTs in open ocean conditions to be in the range of 0.15–0.25°C, higher than the expected range of 0.05–0.1°C, and the exact cause of this difference is not fully understood.
Such estimates of SVP drifter SST uncertainty try to exclude values affected by “gross errors” (i.e., instrument malfunctioning), but the details of any QC used can significantly affect the uncertainty estimate (Kennedy, 2014). Other subtle issues may play a role in the observed discrepancy between the nominal and inferred quality of old-generation drifters, and these include the stability of the analog/electronic components of the temperature sensors and variations in the drifters’ sampling methodology through the years. The contribution of real geophysical variability between point-wise in situ observations and space-averaged satellite observations that sense SST over about 1 km or larger pixels was first estimated by Minnett (1991) as 0.2°C for AVHRR and, more recently, by Castro et al. (2017) as 0.1°C for MODIS. New methods for satellite SST validation explicitly include geophysical effects (including depth and time differences as well as point in space) as summarized in Corlett et al. (2014). A benefit of the method detailed in Corlett et al. (2014) is the ability to validate the satellite SST uncertainty (Lean and Saunders, 2013; Bulgin et al., 2016; Nielsen-Englyst et al., 2018). Here, the uncertainty of the SVP drifter data is vital and ideally should be lower than that of the satellite data itself, which for three-channel retrievals from dual-view satellite radiometers is <0.1°C (Embury and Merchant, 2012). This requirement for SVP drifters with lower SST uncertainty has led to the development of and subsequent deployment by the United States GDP/LDL of SIO of hundreds of Iridium/GPS drifters with carefully calibrated temperature sensors, providing an accuracy better than 0.05°C (Centurioni, 2018) and reporting temperature data with higher resolution compared to the historical drifters. Between the DBCP and GHRSST, it has also led to the development of other versions of drifters with a target measurement uncertainty of 0.05°C, which are currently being evaluated (Poli et al., 2019).
Sea Level Atmospheric Pressure Observations From SVP Drifters
Since the 19th century, atmospheric pressure sensors have been relatively well distributed over land and have become increasingly common over the ocean, mainly due to the GSDA, the VOS scheme, and the moored buoy networks. While the GSDA represents a relatively short time series from a climate perspective, it represents the only source of in situ SLP data in many ocean regions. SLP observations from SVP-B drifters (Figure 3) are more accurate than those from ships because buoy barometers are located much closer to the sea level, whereas ship measurements require extrapolation from deck-level measurements (so-called reduction to sea level and subject to human errors), generating additional uncertainty, of the order of 0.8–0.9 hPa. SLP observations from ship-automated systems are free from human error and are of the order of 0.5 hPa (Poli et al., 2017). By the same diagnostics, SLP data from SVP-B drifters are characterized by 0.3 to 0.4 hPa rmse, which is consistent with the nominal accuracy of the sensor installed on the drifters (Centurioni, 2018). This also suggests that the sampling methodology of the SVP-B drifters, which are affected by surface waves that can be several meters in height (it should be recalled here that SLP can only be measured when the barometer port is exposed to air and that, because of their large drogues, drifters tend to float in the troughs and be submerged at crests in high seas), is not introducing a bias.
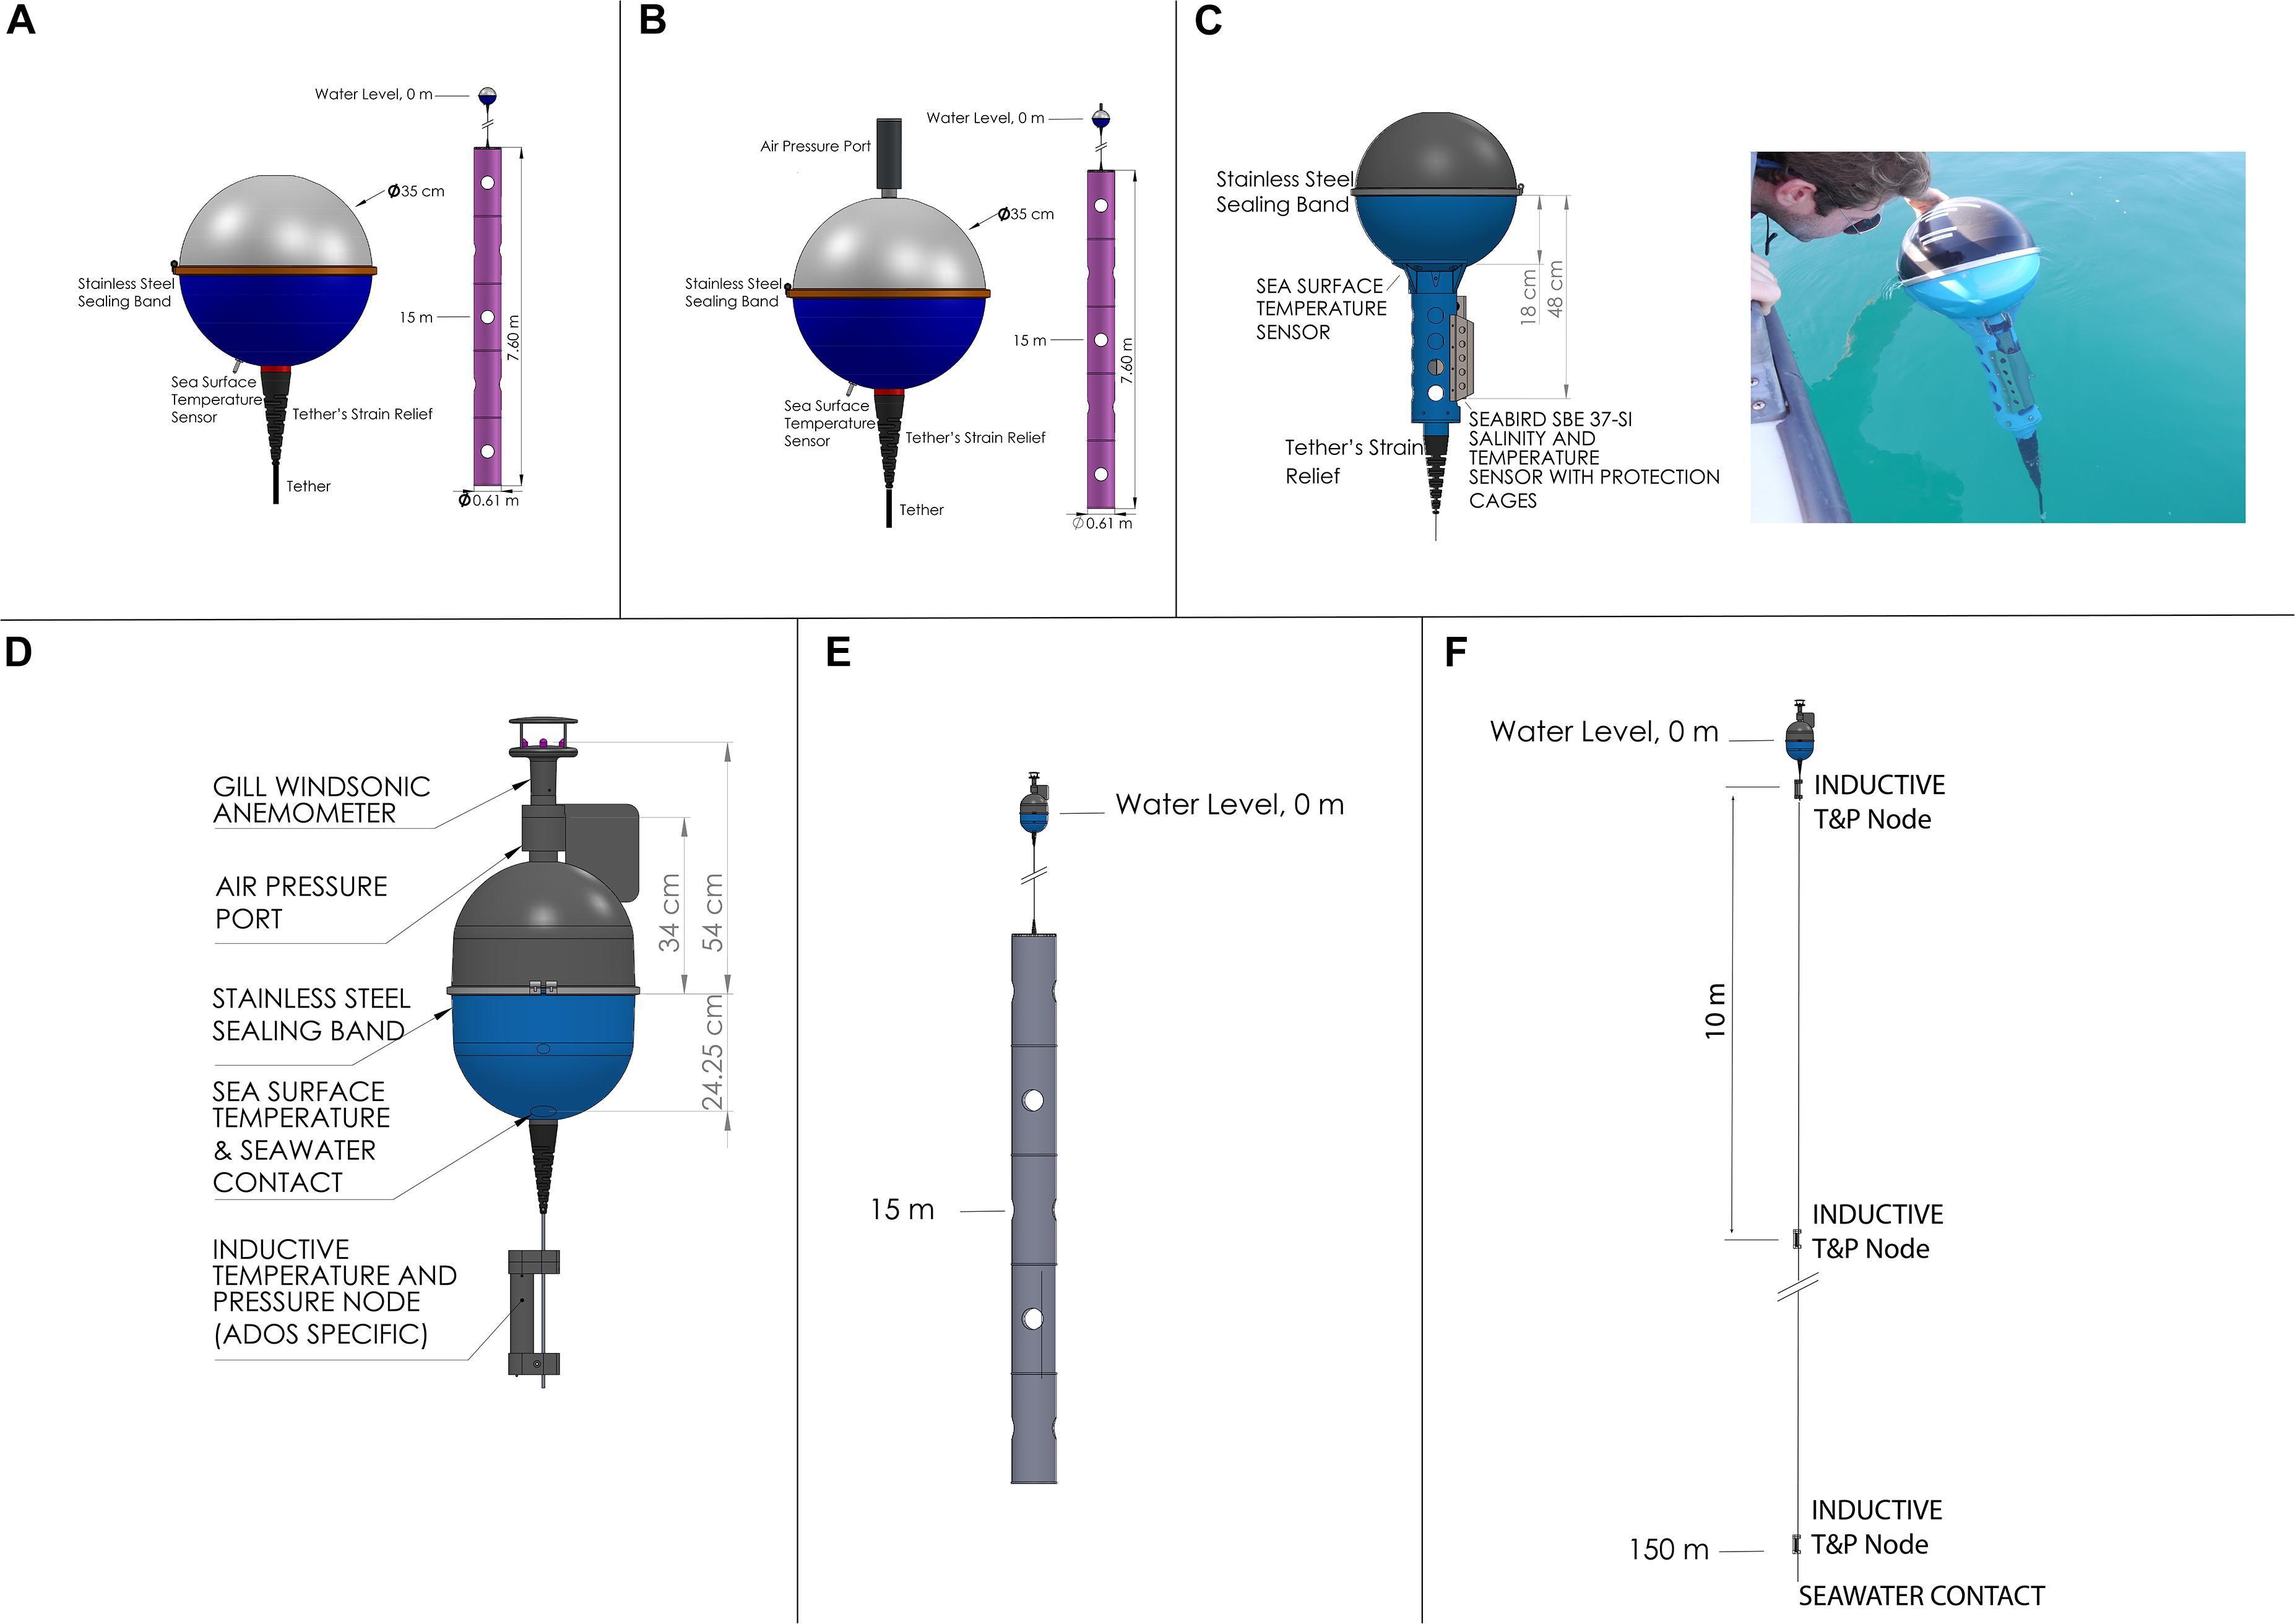
Figure 3. (A) Schematic of the LDL SVP drifter (SST, 15-m depth currents). (B) Schematic of the LDL SVP-B drifter (SST, SLP, 15-m depth currents). (C) Schematic and picture of the LDL SVP-S drifter (SST, SSS, SLP optional, 15-m depth currents). (D) Schematic of the surface buoy (horizontal wind, SLP, SST) used for the LDL Minimet and ADOS drifters. (E) Schematic of the Minimet drifter (SST, SLP, horizontal wind, and 15-m depth currents). (F) Schematic of the ADOS drifter (SST, SLP, horizontal wind, subsurface temperature and pressure, up to 200 m with 10-m resolution). The ADOS can also be configured with ADCPs and conductivity sensors. All sensors use inductive communication modules to relay the data in real time through the Iridium satellite system.
The spatial distribution of SLP data over the ocean, if SVP-B drifters were removed, would be affected by large gaps that exist between commercial shipping lanes, especially in the Southern Ocean and in the Arctic region (Woodruff et al., 2011). Even on trafficked shipping lanes, drifters are often the only source of SLP data when severe weather conditions occur and ships move out of the impacted areas.
SLP observations from SVP-B drifters contribute, directly or indirectly, to many reanalysis products used for climate assessments. Climate-related changes of the mean atmospheric load, or SLP, correspond to about 1-cm change of sea level for a 100-hPa difference, the so-called inverse barometer effect (Wunsch and Stammer, 1997). Although a study of the impact of SLP drifter data on the correction of sea-level satellite altimetry has never been performed, drifter-derived SLP data are likely to provide an important contribution to correct altimetry-derived sea level for atmospheric effects, especially in areas where drifters are the main or unique source of SLP ocean data.
Sea level pressure data from SVP-B drifters are used in the computation of trends to diagnose climate models and to construct climate indices. For example, the tropical Pacific SLP field is used to define the Multivariate El Niño–Southern Oscillation (ENSO) Index (MEI; Wolter and Timlin, 2011). The Southern Annular Mode (SAM) index is defined as the SLP difference between 40 and 65°S (Gong and Wang, 1999), and the North Atlantic Oscillation (NAO) index is based on the SLP difference between the subtropical (Azores) high and the subpolar low. SLP data from SVP-B drifters are also included in the Hadley Centre’s monthly historical mean SLP dataset (HadSLP2) and the ICOADS v.2.5 (ranging from 1662 to 2007), and subsequent updates are based exclusively on observations available on the GTS (Woodruff et al., 2011). Substantial differences between reanalysis products are observed in regions where observations are sparse, including the Southern Ocean and southeastern Pacific (Allan and Ansell, 2006). Other climate products that use the drifter data (i.e., SST and SLP) are global reanalyses, such as the Climate Forecast System Reanalysis (CFSR) of the National Centers for Environmental Prediction (NCEP; Saha et al., 2010), the European Centre for Medium-Range Weather Forecasts (ECMWF) Interim reanalysis (ERA-Interim; Dee et al., 2011), the United States National Aeronautics and Space Administration (NASA) Modern-Era Retrospective analysis for Research and Applications, Version 2 (MERRA-2; Gelaro et al., 2017), the 55-year Japanese Reanalysis (JRA-55; Kobayashi et al., 2015), the 20th Century Reanalysis (20CR; Compo et al., 2011), and the ECMWF 20th century reanalysis (Poli et al., 2016). As reanalysis systems are evolving to describe the Earth system, they move toward ocean–atmosphere coupling, as noted at the 5th International Conference on Reanalyses (Buizza et al., 2018); to support advances in atmosphere–ocean coupling, the subsequent demand for air–sea interface observations is expected to grow.
SLP observations are used to assess changes in the frequency of occurrence and intensity of extratropical storms, to monitor and predict monsoon variabilities as well as trends in extreme weather. However, recent Intergovernmental Panel on Climate Change (IPCC) reports indicate that the confidence in some of these evaluations is low due to inconsistencies between reanalysis products that use data from different years (e.g., early 1900s) and of different quality as well as the lack of long-term data, particularly in the southern hemisphere (IPCC, 2013 report, pg. 2–62). Ensuring the continuity of in situ SLP observations coming from a variety of sources, including the GSDA, should be considered a priority.
A particularly significant impact of the GSDA is the beneficial influence of drifter SLP data for NWP. Ingleby (2010) provides an overview of in situ ocean surface observations from a NWP perspective. Recent studies have quantified the implications of the non-availability of these data (Centurioni et al., 2017b). Observing system experiments (OSEs), as discussed in Centurioni et al. (2017b) and Horányi et al. (2017), were performed with the objective to evaluate associated NWP errors against reanalyses when only drifter SLP data were removed. The main conclusions of these studies are that the in situ drifter SLP data reduce the forecast error up to 5 days ahead near the surface and higher in the troposphere, up to 250 hPa. The largest error reductions were observed for the mean SLP and wind field forecasts. Such studies also suggest that the expansion of the SVP-B array to the tropics should be considered. Forecast sensitivity observation impact (FSOI) studies were also used to quantify the impact on the principal components of GCOS. Such assessments are often run operationally by ECMWF, the United Kingdom Met Office, and the Global Modeling and Assimilation Office of NASA. When the impact per observation or the fraction of beneficial observations is computed, the in situ drifter SLP data provide some of the largest values among the main components of GOS (Centurioni et al., 2017b; Horányi et al., 2017). In addition, Ingleby and Isaksen (2018) assessed the impact of removing half of the drifter SLP data from the assimilation; they concluded that the observing system was not yet saturated, and there was much room for improvement with additional SLP drifter data.
Other Observations From SVP Drifters
Lagrangian drifters based on the SVP design can be configured with a variety of meteorological and oceanographic sensors (Figure 3), including Gill’s Windsonic anemometers, conductivity sensors to measure sea surface salinity (SSS), radiometers and pyranometers, hydrophones, acoustic Doppler current profilers (ADCPs), and subsurface temperature and conductivity sensors (see Centurioni, 2018 for a review of the current technology). A large number of salinity drifters were deployed in recent years in support of the two “Salinity Processes in the Upper-ocean Regional Study” (i.e., SPURS-1 and SPURS-2) campaigns (Centurioni et al., 2015; Hormann et al., 2015; Reverdin et al., 2015; Schmitt et al., 2015), and in the Bay of Bengal during the Office of Naval Research (ONR) Departmental Research Initiative (DRI) “Air–Sea Interactions in the Northern Indian Ocean–Regional Initiative” (ASIRI; Hormann et al., 2016). Salinity drifters can provide SSS observations with an accuracy of about 0.01 psu for 1 year (Hormann et al., 2015).
Voluntary Observing Ship Scheme
International coordination of observing the weather from ships started as long ago as 1853 and has led to the WMO VOS scheme, which is an international program in which ships are recruited by NMSs to make meteorological observations at sea. Participation in the VOS scheme is encouraged in the International Maritime Organization (IMO) Safety of Life at Sea (SOLAS) convention. The VOS scheme is an observing program of the Ship Observations Team (SOT), coordinated by the WMO–IOC JCOMM and described by Smith et al. (2019), including the contribution of oceanographic research vessels to observations at the air–sea interface. VOS report air and sea variables that are assimilated in forecasting models and used for reanalysis products, similarly to those from drifters described above. In addition, VOS generally also report critical variables such as air temperature as well as relative humidity and wind, which are also assimilated in operational weather models and global reanalyses. Furthermore, when observers are present, observations of clouds and sea state are also collected. Figure 4 shows the locations of observations from VOS for a selected time period. This map indicates that the concentration of VOS is greater near economic centers of activity and shipping corridors or along coastlines. A few research vessels are further equipped with sensors to measure salinity, pH, fluorescence, and currents, though such information is generally not included in the VOS reports, but only available in delayed mode and for research. Currently, only few or no automated stations with broadcasting to the GTS report parameters such as pH, fluorescence, clouds, sea state, and currents. However, notable efforts are underway for pH and fluorescence (e.g., Choquer et al., 2013), for waves (Christensen et al., 2013) as well as for currents from position, compass direction, and ship speed transmitted through the Automatic Identification System (AIS; Guichoux et al., 2016). In recent decades, there has been a slow decline in the number of ships in the traditional VOS scheme, partly offset by an increase in automated (usually hourly) ship reports. There has also been an increase in average ship size. About half of the ship measurements are relatively close to the coast (see Ingleby, 2010 and references therein).
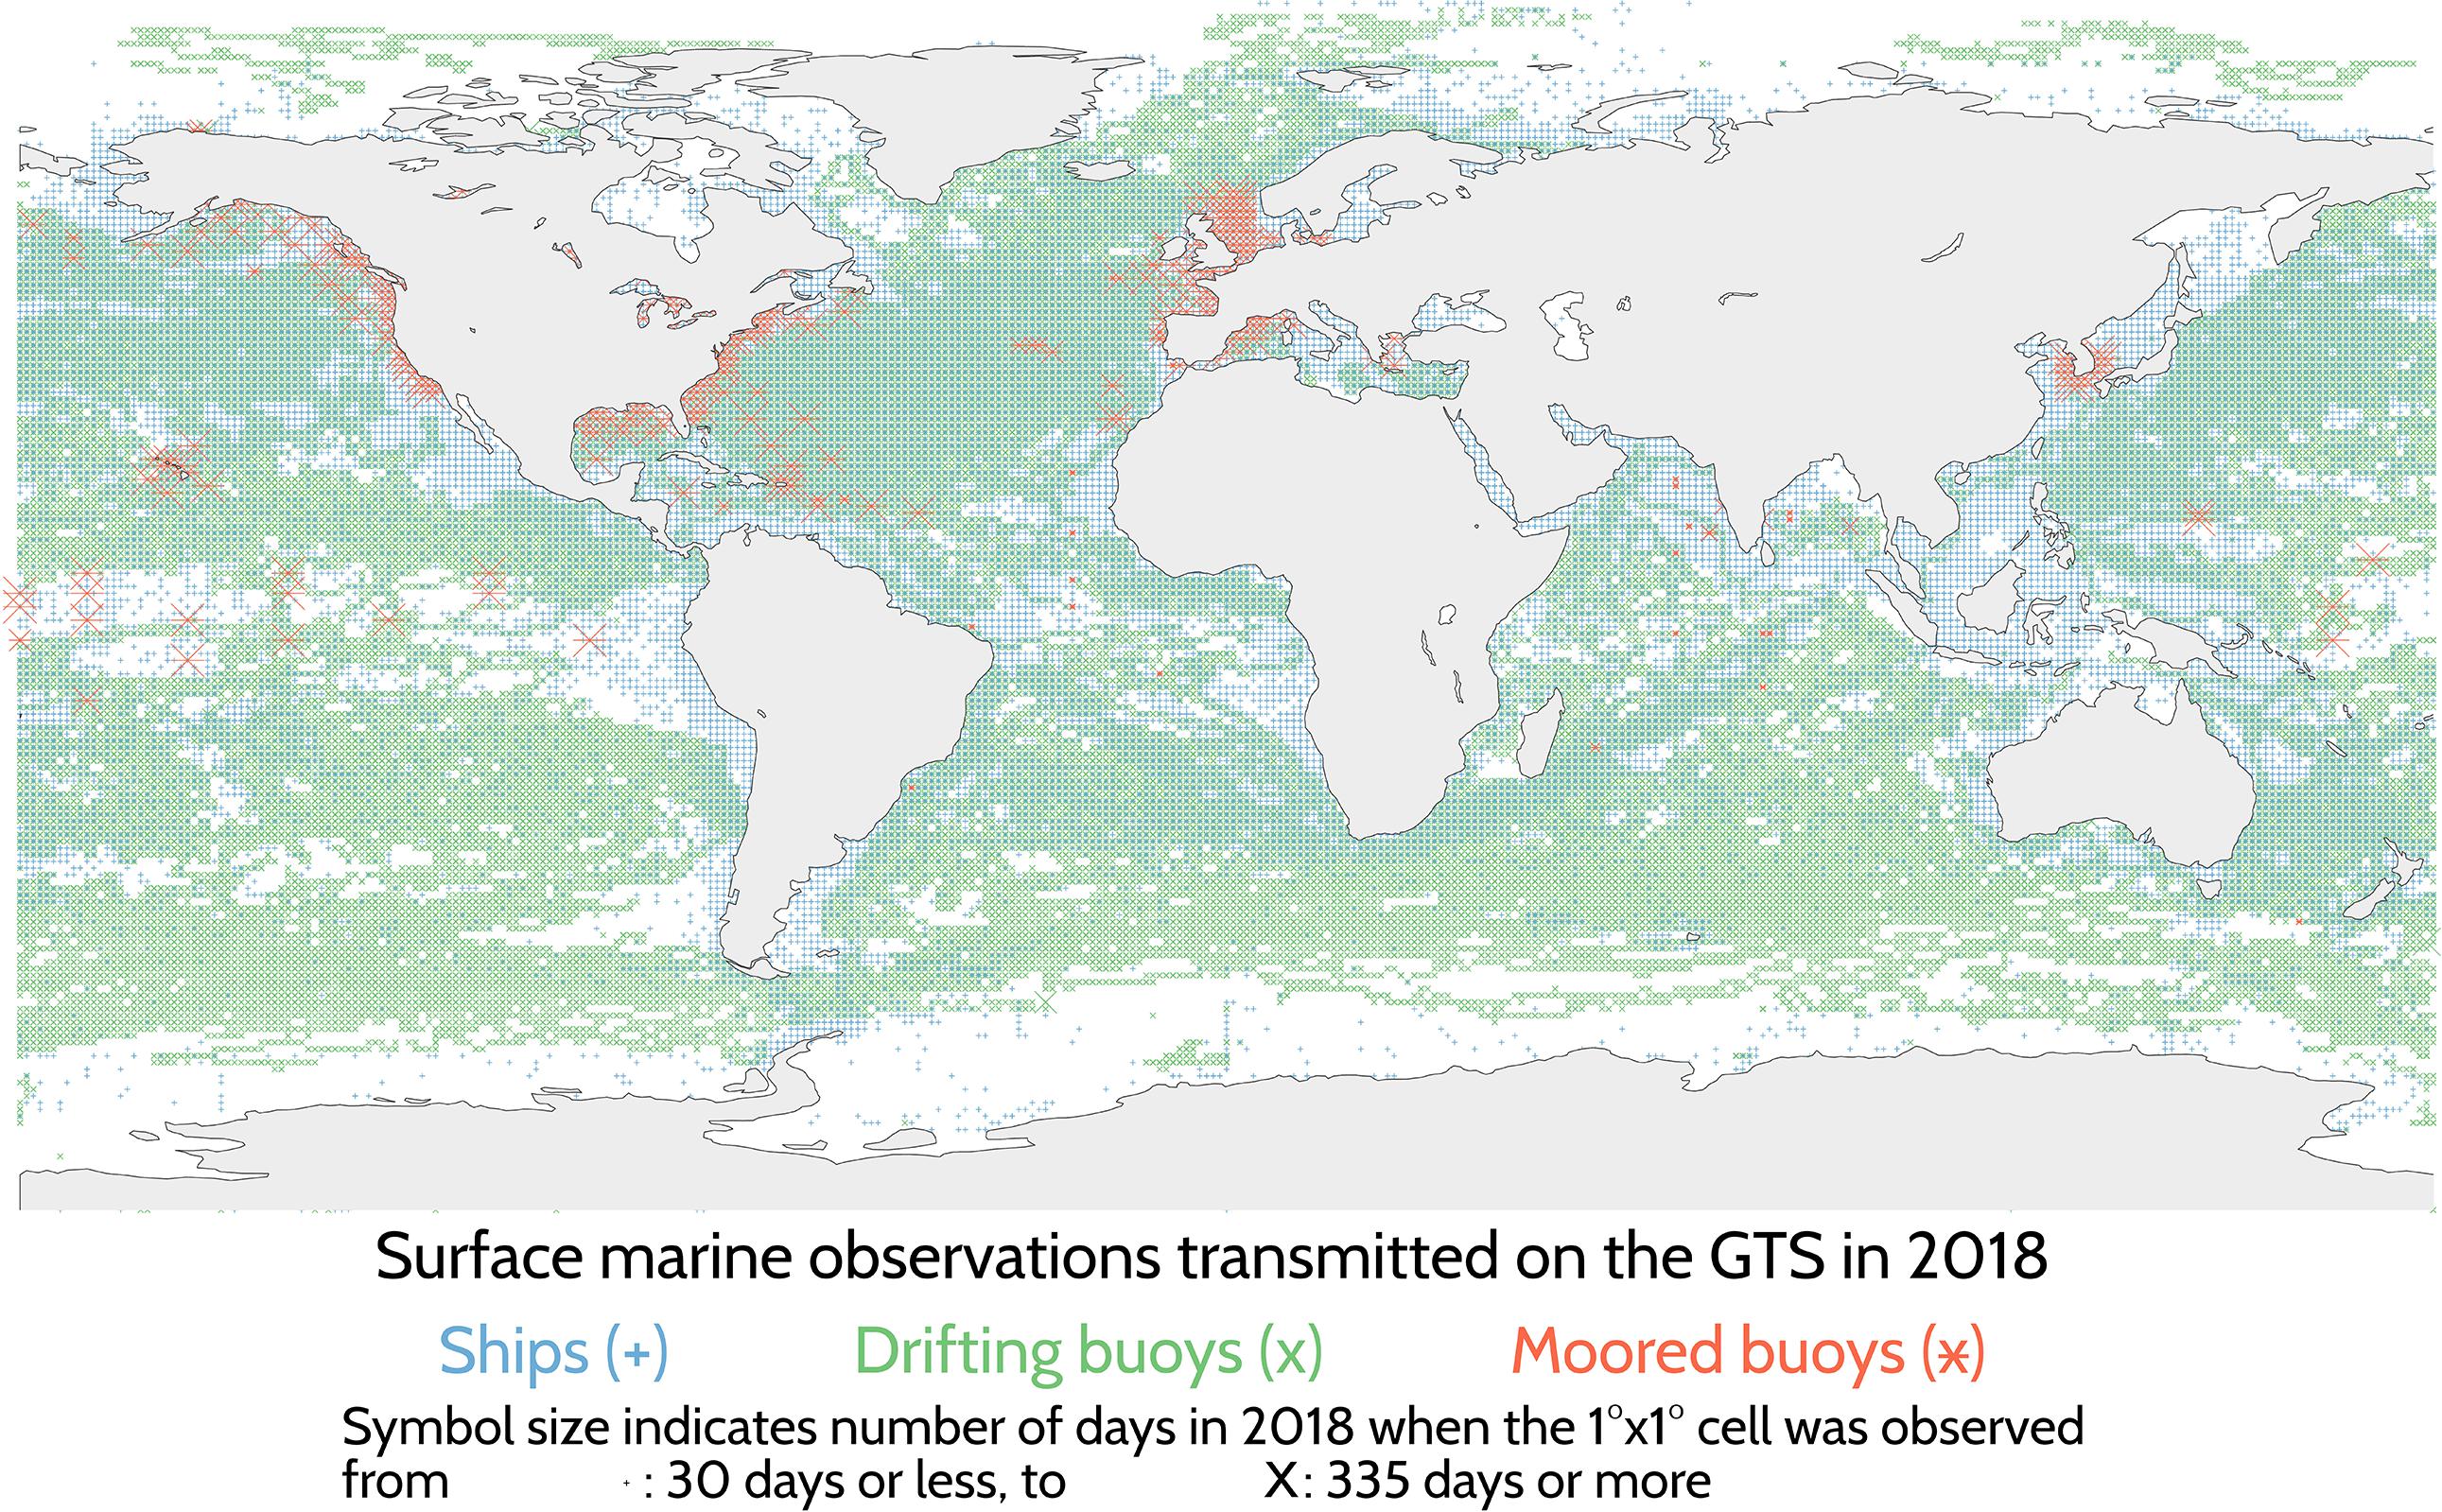
Figure 4. Data coverage by the three major components of GOS (i.e., ships, drifting buoys, and moored buoys) based on information received by Météo-France through the GTS in 2018 (see legend for symbol details).
Compared to drifters, the more complete set of variables from VOS enables the computation of air–sea fluxes from bulk parametrizations. A notable example is the surface flux and meteorological dataset of the National Oceanography Centre (NOC) version 2.0 (Berry and Kent, 2009), where air and sea temperatures observed by ships, along with observations of humidity, wind speed, and cloud cover, are used to estimate various components of heat fluxes (i.e., sensible, latent, short-, and longwave radiation). Such estimates are then useful benchmarks for the performance of weather and climate models and lead advances toward ocean–atmosphere coupling in models and data assimilation (Freeman et al., 2019).
Finally, research vessels can be equipped to directly measure some components of the air–sea fluxes (e.g., outgoing longwave radiation). This information is readily comparable to satellite measurements, enabling a better understanding of the uncertainties caused by atmospheric absorption in the retrievals. Such data serve to develop fiducial reference measurements (FRM) of SST from ships (Theocharous et al., 2016).
For further information, we refer the reader to the review by Smith et al. (2019) on the role of ship-based observations, including but not limited to VOS, in support of the physical, biological, and carbon dioxide (CO2) communities.
Moored Buoys
As noted earlier, the DBCP also coordinates observations from the TMBA and the various national (mainly coastal) meteorological and oceanographic moored buoy networks (including directional wave buoys). Figure 4 shows that the coverage achieved by moored buoys, especially the TMBA, complements the surface drifter array, which tends to be advected away from the equatorial band by the ocean circulation. The TMBA spans the Pacific (TAO/TRITON), Atlantic (PIRATA), and Indian (RAMA) ocean basins. It consists primarily of T-FLEX moorings developed at NOAA/Pacific Marine Environmental Laboratory (PMEL), and their configurations are determined by climate and regional processes of interest in the different basins. Reevaluations, such as the so-called TPOS 2020 effort (Cravatte et al., 2016), aim to maintain or increase the value of the arrays while responding to changes in partner commitments and funding pressures as well as other constraints (e.g., vandalism on data buoys). Numerous regional partners work together to maintain the three arrays, which require significant investment of ship time. TMBA moorings measure wind speed and direction, air temperature, humidity and downward shortwave radiation, and many also measure SLP. Ocean parameters measured include temperature and salinity in the upper 500 m of the ocean, and most also measure ocean currents at a depth of about 10 m using point acoustic current meters. The TMBA additionally includes a small number of ADCP moorings providing vertical profiles of ocean currents. Some TMBA as well as OceanSITES moorings have added biogeochemical observations such as oxygen, CO2 fugacity, and acoustic monitoring.
Over the last 25 years or so, national moored buoy networks have been developed by many countries as part of their operational observing capabilities. As such, there is no single global network of moored buoys but rather a “network of networks,” capable of measuring a wide range of ECVs and EOVs from marine meteorology and waves to subsurface oceanographic measurements that complement other sources of synoptic observations in coastal seas and the open ocean. They provide real-time data for operational services such as marine weather and wave forecasts (both for assimilation into and validation of forecast models), maritime safety information and warnings to end users, information for marine disaster and accident response, calibration/validation of satellite-derived observations, and data for research purposes. Many of these networks have been in place for at least a couple of decades, some for as long as 40 years, and so provide valuable time series for marine climate studies, in particular for wave climate analyses. Advances in sensor technology, moorings, best practices, and sharing of experience and expertise are coordinated through the DBCP and have helped improve the performance and reliability of these systems at sea.
Similar to drifters and ships, moored buoy data also assist in the development of ocean–atmosphere coupling in numerical models. For example, the June 2018 upgrade of the ECMWF operational system to coupling was validated using moored buoys measuring SLP, air and sea temperatures as well as wind speed (Mogensen et al., 2018).
Other Impacts of the Existing Air–Sea Networks
Besides the demonstrated beneficial impact of several air–sea in situ observations for NWP as well as operational ocean forecasting and their importance for assembling climate datasets used for research and assessments discussed in the previous paragraphs, data relayed from the existing air–sea in situ observational networks are commonly supporting a variety of other applications with direct relevance to society and the development of blue economy.
One example of the latter is the exploitation of the Lagrangian properties of drogued SVP drifters to study the biological dispersal (e.g., Carlton et al., 2017; Miller, 2018) and recruitment of fish larvae to support stock management (e.g., Hare and Walsh, 2007; Booker et al., 2008).
Also, surface currents transport oil spills and marine debris. Generally, every type of pollution moves differently from each other as well as from the water parcels. Modeling this drift remains challenging because it is a result of the rectification of high-frequency motions and a function of the near-surface vertical structure of the currents, neither of which are resolved by the present observing system. Maximenko et al. (2018) demonstrated that data from Lagrangian SVP drifters were critical for adequate modeling of debris drift from the 2011 tsunami in Japan to North American and Hawaiian shorelines. Drifters are expected to play an important role in the future Integrated Marine Debris Observing System (IMDOS; De Dominicis et al., 2012; Maximenko et al., 2019).
It should also be noted that some observing programs, driven by a scientific rather than fully operational rational, are capable of addressing fast response needs to emergencies or can provide critical data for such applications in an opportunistic way. For example, the GDP can quickly air-deploy special drifters designed to measure wind speed and direction, SLP, SST, subsurface temperature, and directional wave spectra ahead of tropical storms and provide real-time data through the GTS and web server interfaces to forecasters and for post-storm season assessments. These buoys are deployed from C-130J aircrafts by the United States Air Force Reserve’s 53rd Weather Reconnaissance Squadron “Hurricane Hunters.” The latest deployment, at the time of writing occurred ahead of Hurricane Michael in the Gulf of Mexico on October 8, 2018, when drifters sampled storm conditions at the sea surface for several hours ahead of the storm, inside the eye, and in the wake of the storm (Figure 5). It should be noted that the drifter technology has matured to a level of sophistication that allows such instruments to go through tropical cyclones unscathed (e.g., D’Asaro et al., 2013; Mrvaljevic et al., 2013; Hormann et al., 2014; Centurioni, 2018).
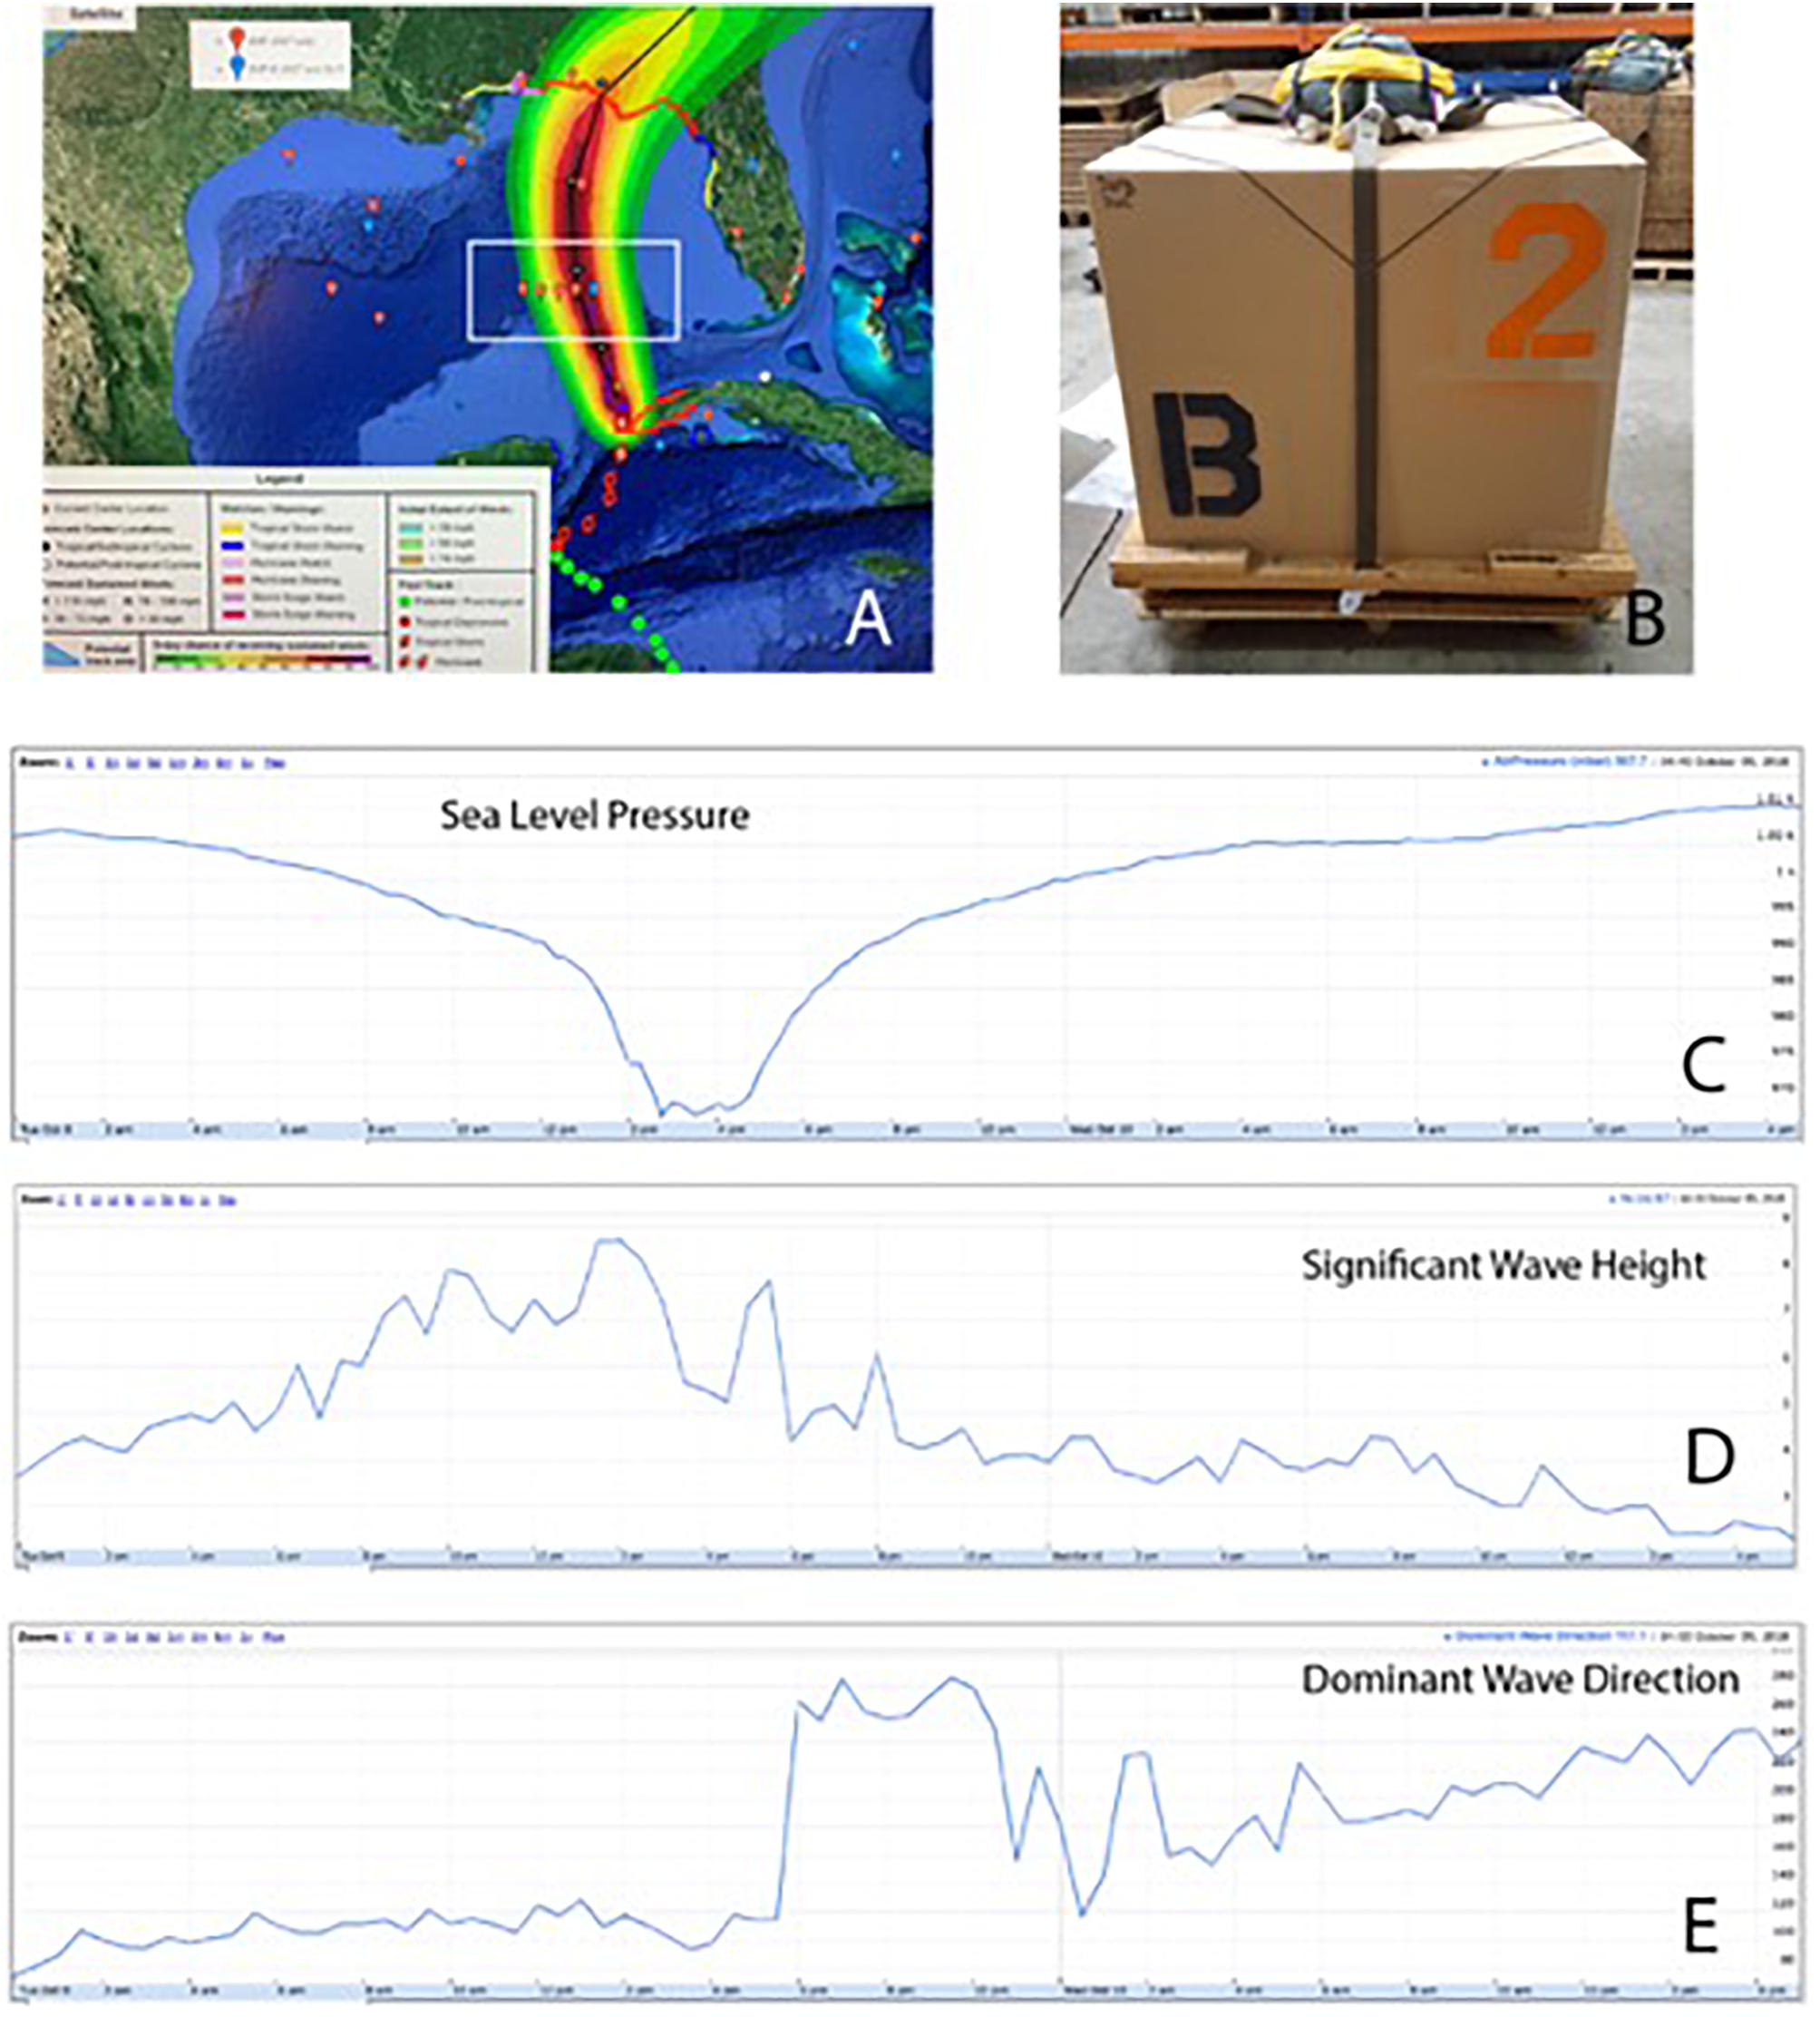
Figure 5. (A) Deployment location of 10 drifters ahead of Hurricane Michael (white box). The drifters were deployed on October 8, 2018, from a C-130J aircraft by the United States Air Force Reserve’s 53rd Weather Reconnaissance Squadron “Hurricane Hunters.” The transect was located approximately 24 h ahead of the predicted track of the storm, which is shown by green and red symbols. The forecast for the wind intensity is overlaid as a contour plot (see legend in panel A). The storm data were provided by NOAA’s National Hurricane Center (NHC). The 10 drifters were air-deployed at five stations using the deployment package shown in panel (B). Each box contained one SVP-B drifter and one directional wave spectra (DWS) drifter. One SVP-B drifter measured a minimum air pressure of 967.7 hPa inside the eye of the hurricane (C). The DWS drifter deployed at the same location measured a maximum significant wave height of 8.7 m (D). Note the sharp change of the dominant wave direction due to the hurricane moving over the DWS drifter (E) and the rapid decay of the wave field in the wake of the storm.
Furthermore, the GSDA is maintained with a buoy density that makes encounters of drifters with tropical cyclones a rather common occurrence, thus providing valuable SST and SLP observations for assimilation into forecasting models and to support forecast analysis. In the North Atlantic alone and for the January 2013–September 2018 period, a total of 160 SVP and SVP-B drifters were within 30 nautical miles (nm) of the tracks of systems that eventually developed into hurricanes (Figure 6).
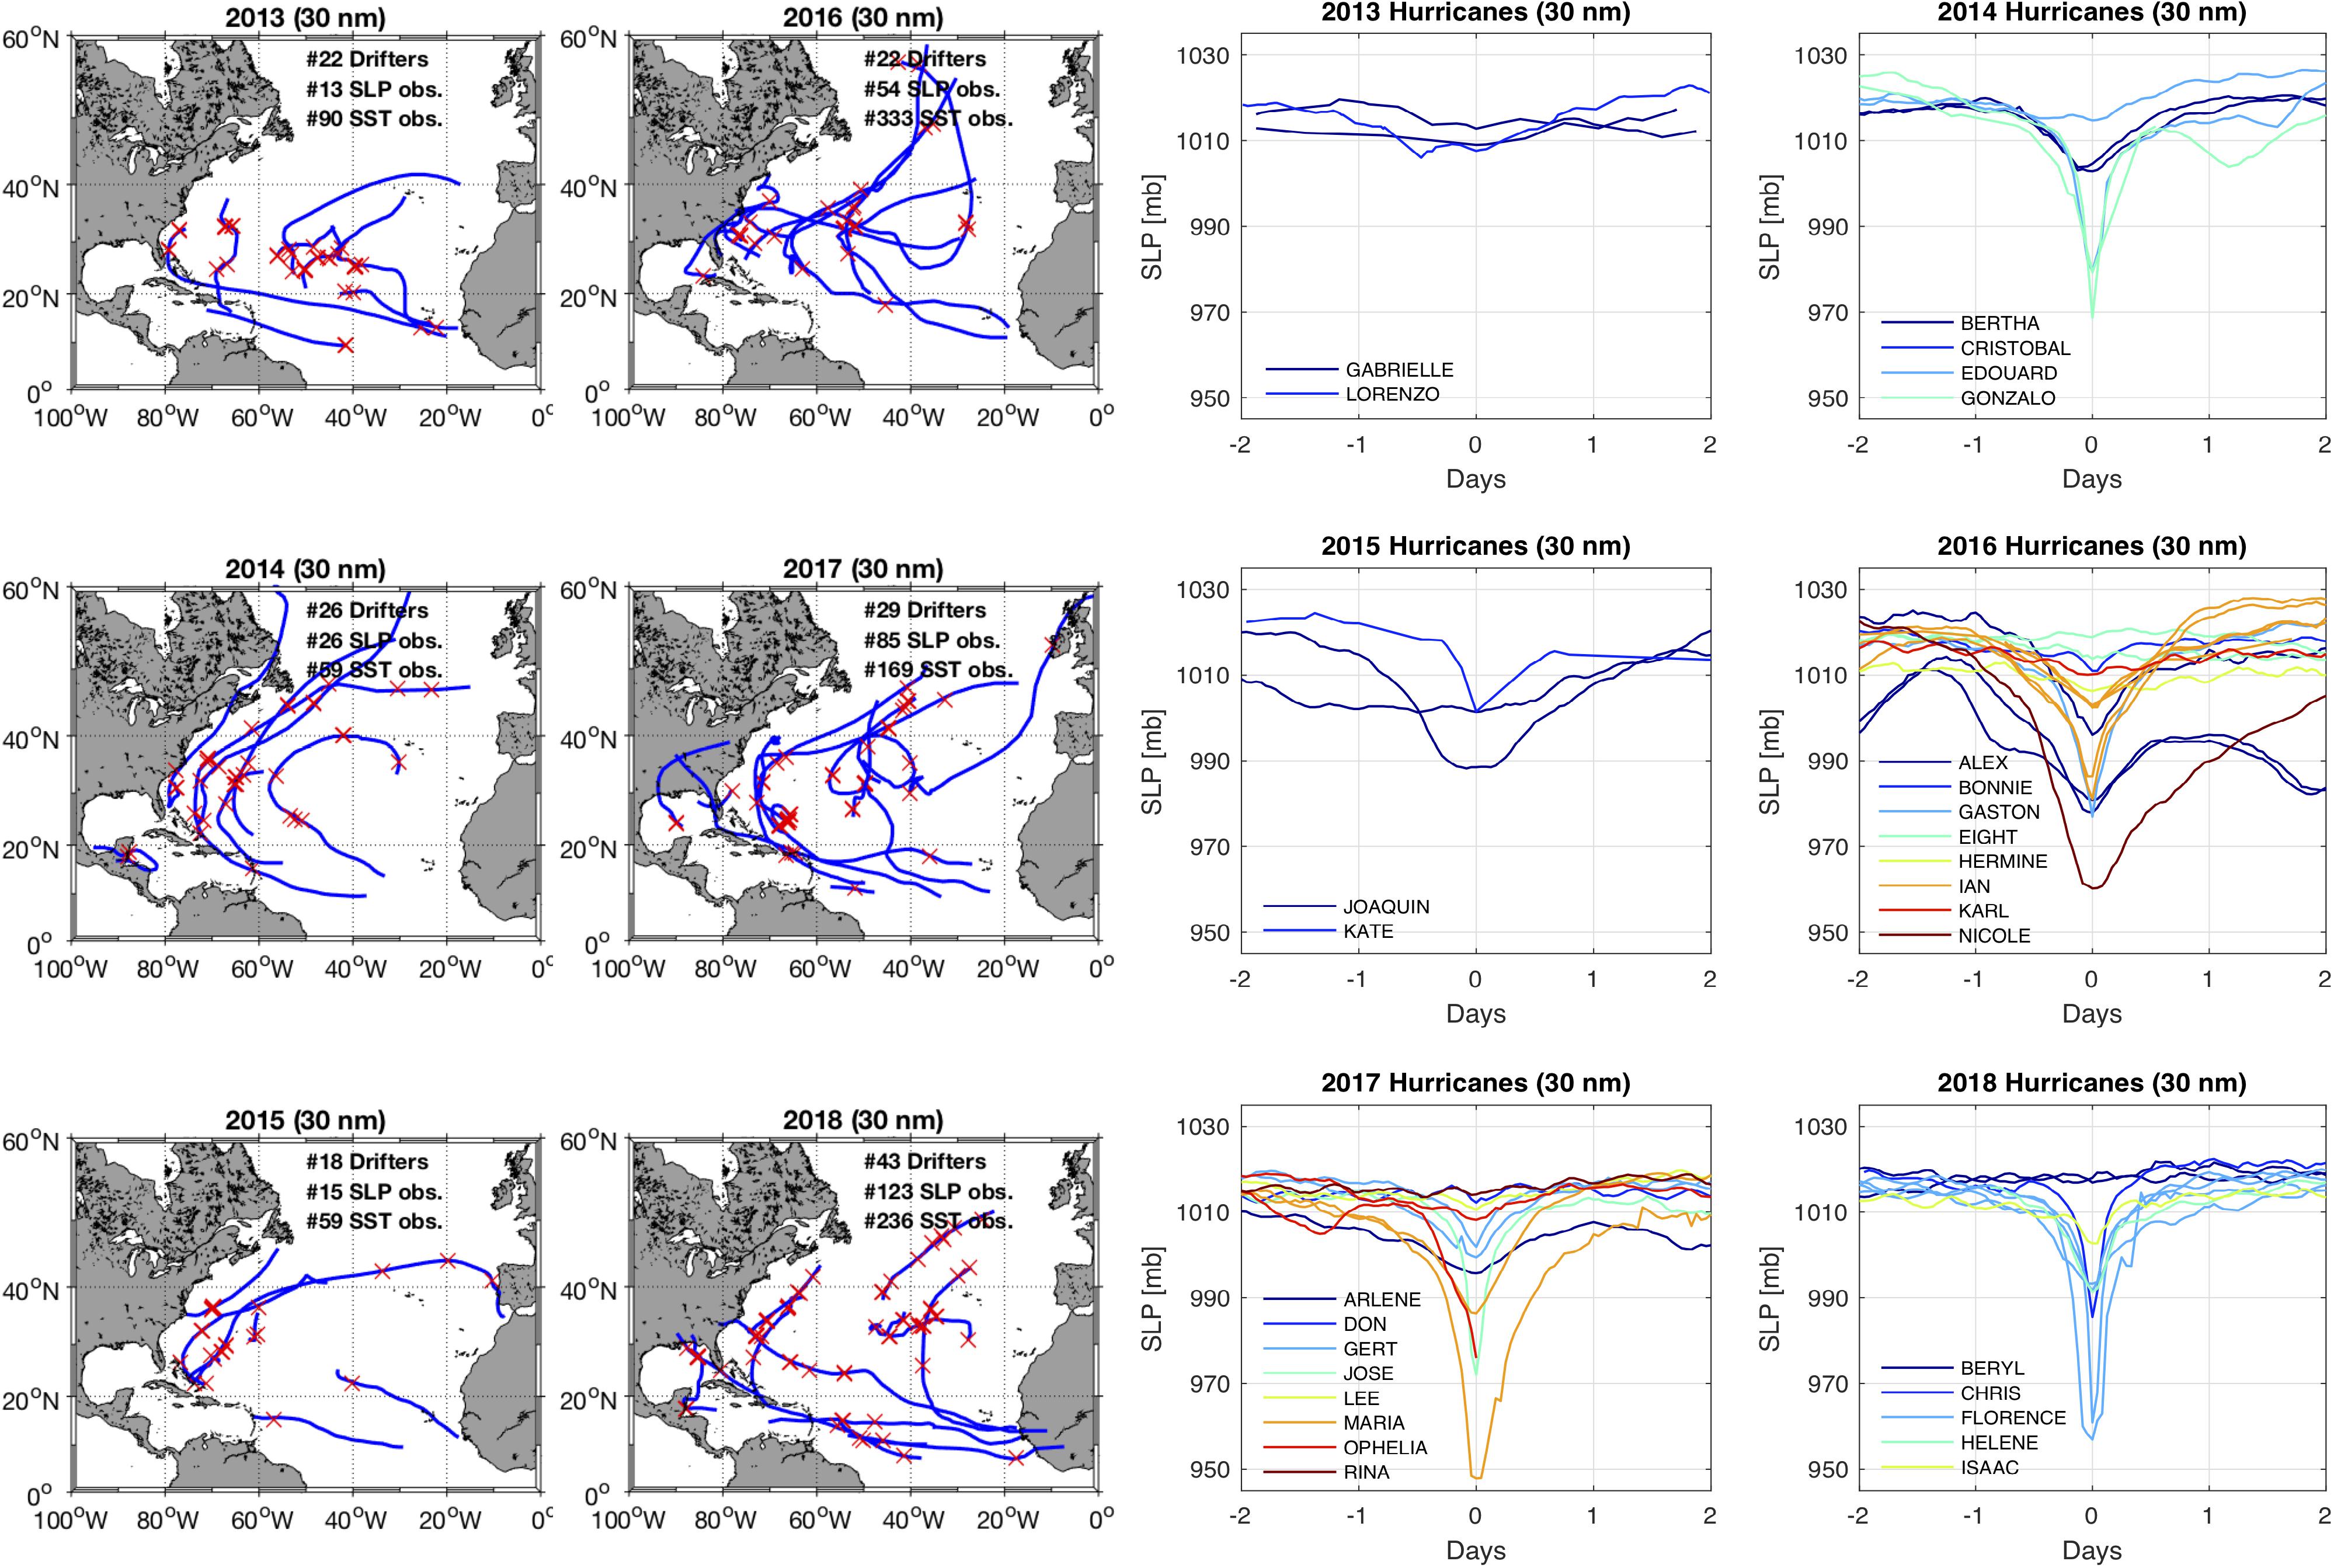
Figure 6. Drifter/hurricane encounters (June 2013–September 2018). All drifter observations are within 60 min of the track location. Matches within 30 nm (left) are marked by red crosses. The hurricane tracks are shown in blue. For each hurricane season, the numbers of drifter/hurricane encounters are reported for each matching criterion as well as the total number of SST and SLP observations collected. Time series of SLP for drifter/hurricane matches selected using the 30-nm proximity criteria, color coded by storm name, are also shown. The time series are 4 days long and are centered around the minimum SLP pressure observed by the drifters.
Gaps and Limitations of the Existing Air–Sea in situ Network
It is fair to say that the current air–sea in situ observing system is covering the basic needs for SST, SLP, and mixed-layer current observations. Notable lack of observed ECVs/EOVs at a spatial scale and temporal resolution compared to that provided by the GSDA include SSS, surface wind, directional wave spectra, air temperature, and relative humidity. For many (but not all) of these variables, the VOS and the moored buoy networks are the only sources of data, thus leaving many critical regions undersampled or not sampled at all. In the following, we review gaps and limitations of each observing system component.
The Global Surface Drifter Array
In its present configuration, the GSDA is sustainable with respect to global SST and near-surface currents, but gaps in the drifter distribution remain. Notable areas include some parts of the western Indian Ocean, stretching into the Arabian Sea, where sustained deployments in partnership with the shipping industry still present logistical challenges (Centurioni et al., 2017a). Furthermore, drifting buoys are largely absent in the Arctic, notably during summer months when the basin becomes largely ice free, with the exception of ice buoys deployed as part of the Arctic Buoy Program and the Year of Polar Prediction (YOPP) targeting important SLP observations.
The demonstrated beneficial impact of drifter SLP data in climate research and NWP is sufficient to justify the installation of barometers on all of the GSDA drifters, but as of now, only about 50% of the drifters carry barometers, mainly due to the additional cost (approximately 1,100 US$ per unit) and funding limitations. One of the most difficult tasks is to sustain a global drifter distribution; crucial to achieving this goal is the collaboration of the GDP, which evolved with a strong oceanographic connotation, with various NMSs from several countries. These include NOAA’s National Weather Services, Members of the European Meteorological Services Network (EUMETNET), Canada, Australia, South Africa, New Zealand, India, and many other partners who are interested in maintaining a global network of barometers at the sea surface. Such collaborations are coordinated by the DBCP and implemented through both the direct purchase of barometer drifters and by means of the GDP barometer drifter upgrade program. Therefore, the collaboration with the meteorological services has the effect to provide a significant number (i.e., 25–30%) of additional drifter deployments.
During the last decade, the drifter technology has evolved to measure other ECVs/EOVs. Drifters designed at SIO can measure SSS, sea-level wind velocity (Centurioni, 2018), upper-ocean temperature profiles, and surface radiation. Such technologies could be deployed for sustained operations, but funding limitations prevent the implementation on a global scale. Other observational gaps that could be addressed with surface drifters include air temperature, water vapor, sea state, and velocity shear in the upper ocean.
Voluntary Observing Ship Scheme
While ships can host a wide variety of sensors, placement of sensors is a primary issue for all variables. For SLP, the barometer can be up to several tens of meters above the surface, which introduces considerable additional errors when adjusting the measurements to the sea surface, especially when the proper barometer height is not used or misused (e.g., height depends on ship’s load, which is variable and often not reported). For temperature, the ship structures are known to affect the measurements, and daytime measurements are most affected by biases (Berry et al., 2004). For wind, in spite of general placement at the highest point (to reduce circulation effects on the ship structures), it should also be noted that the ship structure can sometimes disturb the air flow (Popinet et al., 2004). For some of these challenges, there are possible ways forward. For example, reduction in cost of multifrequency, multisystem Global Navigation Satellite System (GNSS) technology may permit dynamic estimation of the barometer height, along with the sea level, to report accurate SLP measurements. For wind, accounting for airflow distortion can help to reconcile air-flux measurements (using corrected winds) with direct flux measurements (Landwehr et al., 2015).
SST is most often measured at the engine intake or using hull contact sensors, but on a small number of commercial vessels as well as research ships, infrared radiometers can be deployed to provide skin SST measurements of high accuracy. Two such instruments, the ISAR (Infrared Sea Surface Temperature Autonomous Radiometer), a filter radiometer with internal calibration (Donlon et al., 2008), and the M-AERI (Marine-Atmospheric Emitted Radiance Interferometer), a Fourier-transform infrared spectroradiometer, also have internal blackbodies for at-sea calibration (Minnett et al., 2001). These radiometers were specifically developed to take measurements suitable for the validation of satellite-derived SSTs (Corlett et al., 2014), and both types have been deployed on commercial ships for this purpose (Minnett, 2010; Wimmer et al., 2012; Donlon et al., 2014a,b) as well as on research vessels. A major advantage of using a M-AERI-type instrument is that besides measuring the skin SST, a near-surface air temperature can be derived (Minnett et al., 2005) and, hence, an accurate determination of the air–sea temperature difference. In addition, the analysis of the infrared emission spectra of the sea surface can lead to an estimation of the temperature profile through the ocean skin layer (Wong and Minnett, 2016a, b) and the response of the skin layer to infrared radiative forcing (Wong and Minnett, 2018), which are not accessible by in situ methods.
Moored Buoys
Moored buoys are generally regarded as providing the highest-quality observations of a wide range of marine meteorological variables and, as noted earlier, are used to provide “ground truth” observations for satellite calibration/validation as well as for estimates of surface fluxes (e.g., Bourras, 2006) for which wind speed is an essential parameter. However, due to the costs and logistics in operating moored buoys, they cannot provide global spatial coverage as drifters do since they are primarily located in the tropics and adjacent to coastlines (mainly in the northern hemisphere) to meet national operational requirements. Deployment and servicing of moored buoys require dedicated ship time, which is becoming increasingly costly. Typically, servicing intervals can be as long as 2 years, during which time the sensors, which are often exposed to severe weather conditions, may drift or fail. On some moored buoy networks, this can be partly mitigated by having dual sensor systems to provide increased resilience. In addition, the mooring lines generally need replacing every 2 to 4 years, and these can be expensive for deep ocean moorings that can be several thousand meters long. Vandalism is also a major problem, particularly for moored buoys that are deployed in equatorial regions near areas of intense fishing activity. This can include moored buoys being dragged off station, mooring lines being cut by fishing vessels so that the buoy goes adrift and has to be recovered, sensors and satellite transmitters being removed and stolen, and deliberate or accidental (e.g., collision with a ship) damage. The DBCP is trying to mitigate the problem of vandalism through an outreach strategy that aims to inform the fishing communities that the buoys are operated to provide data that are to their benefit (i.e., improved weather and wave predictions, and tsunami warnings).
Gaps Across Programs and Platforms
Users exploiting past observational data always wish to know the actual sensing equipment used and the direct sensing environment (e.g., platform type, sensor placement on the platform). Accurate and exhaustive metadata are the basis for the correct utilization of the data and to maximize their impact. While this information is always recorded locally, there is very little coordination among individual projects regarding the content and format of the metadata. This lack of coordination constitutes a potential limitation to the full exploitation of the observations. Under WMO guidance, metadata are only recently started being collected internationally. We also identify this effort as a way forward to improve the current situation, and we refer the reader to the guide on WIGOS (https://library.wmo.int/doc_num.php?explnum_id=6010) which explains how the international community has now arranged for a comprehensive collection of metadata, and for a process to consolidate real-time and delayed-mode data repositories in the Marine Climate Data System (MCDS; Pinardi et al., 2019). Here, we just wish to point out the importance that individual programs invest adequate resources to endorse and facilitate the harmonization of their metadata.
Emerging Technologies
In this section, we describe some of the emerging technologies that are either mature for operations and large-scale deployments or have the potential to address some of the gaps and shortcomings described in the previous section.
Directional Wave Spectra (DWS) Drifters
Developed by the LDL at SIO, the DWS drifter (Centurioni et al., 2016 and Figure 7) is a very-low-cost and accurate wave rider based on the GPS technology that returns in real time the directional wave spectra of surface gravity waves and GHRSST-compliant SST. The DWS drifter is capable of a 1-year-long mission with 6-h measurements. The power spectral density, co-spectra, and quadrature-spectra parameters are derived by a Fourier transform of the correlation functions related to each pair of the three-dimensional wave orbital velocities, giving the “First-5” independent Fourier coefficients (a0, a1, a2, b1, b2) and, thus, the wave spectra for each 6-h (but as often as half-hourly) sea state. For each measured sea state, the three velocity components, the computed “First-5” Fourier coefficients, and the main wave data parameters can be stored onboard an optional data logger while platform information (timestamp, latitude, longitude, battery voltage, internal pressure, temperature, and humidity) at start of data collection, computed wave parameters (Hmo, Tp, Ta, and Dp), and, optionally, “First-5” coefficients in the 0.031–0.496 Hz frequency range with 1/256-Hz bandwidth are transmitted to shore in real time through the Iridium satellite system. The interval between measurements is programmable over the air, and spectral wave data can be retrieved as often as every 30 min. At the time of writing, a GTS format for the DWS drifter has been approved by WMO, with the objective to facilitate the distribution of these data on the GTS and the use of in situ spectral wave data with wave forecasting models and to assist operational forecasting centers. The DWS drifter technology has a technology readiness level (TRL) of 9, which has been demonstrated through the operational deployment from ships of 62 units in the Global Ocean and with the air deployment of 7 units in the Bay of Bengal and the Atlantic Ocean.
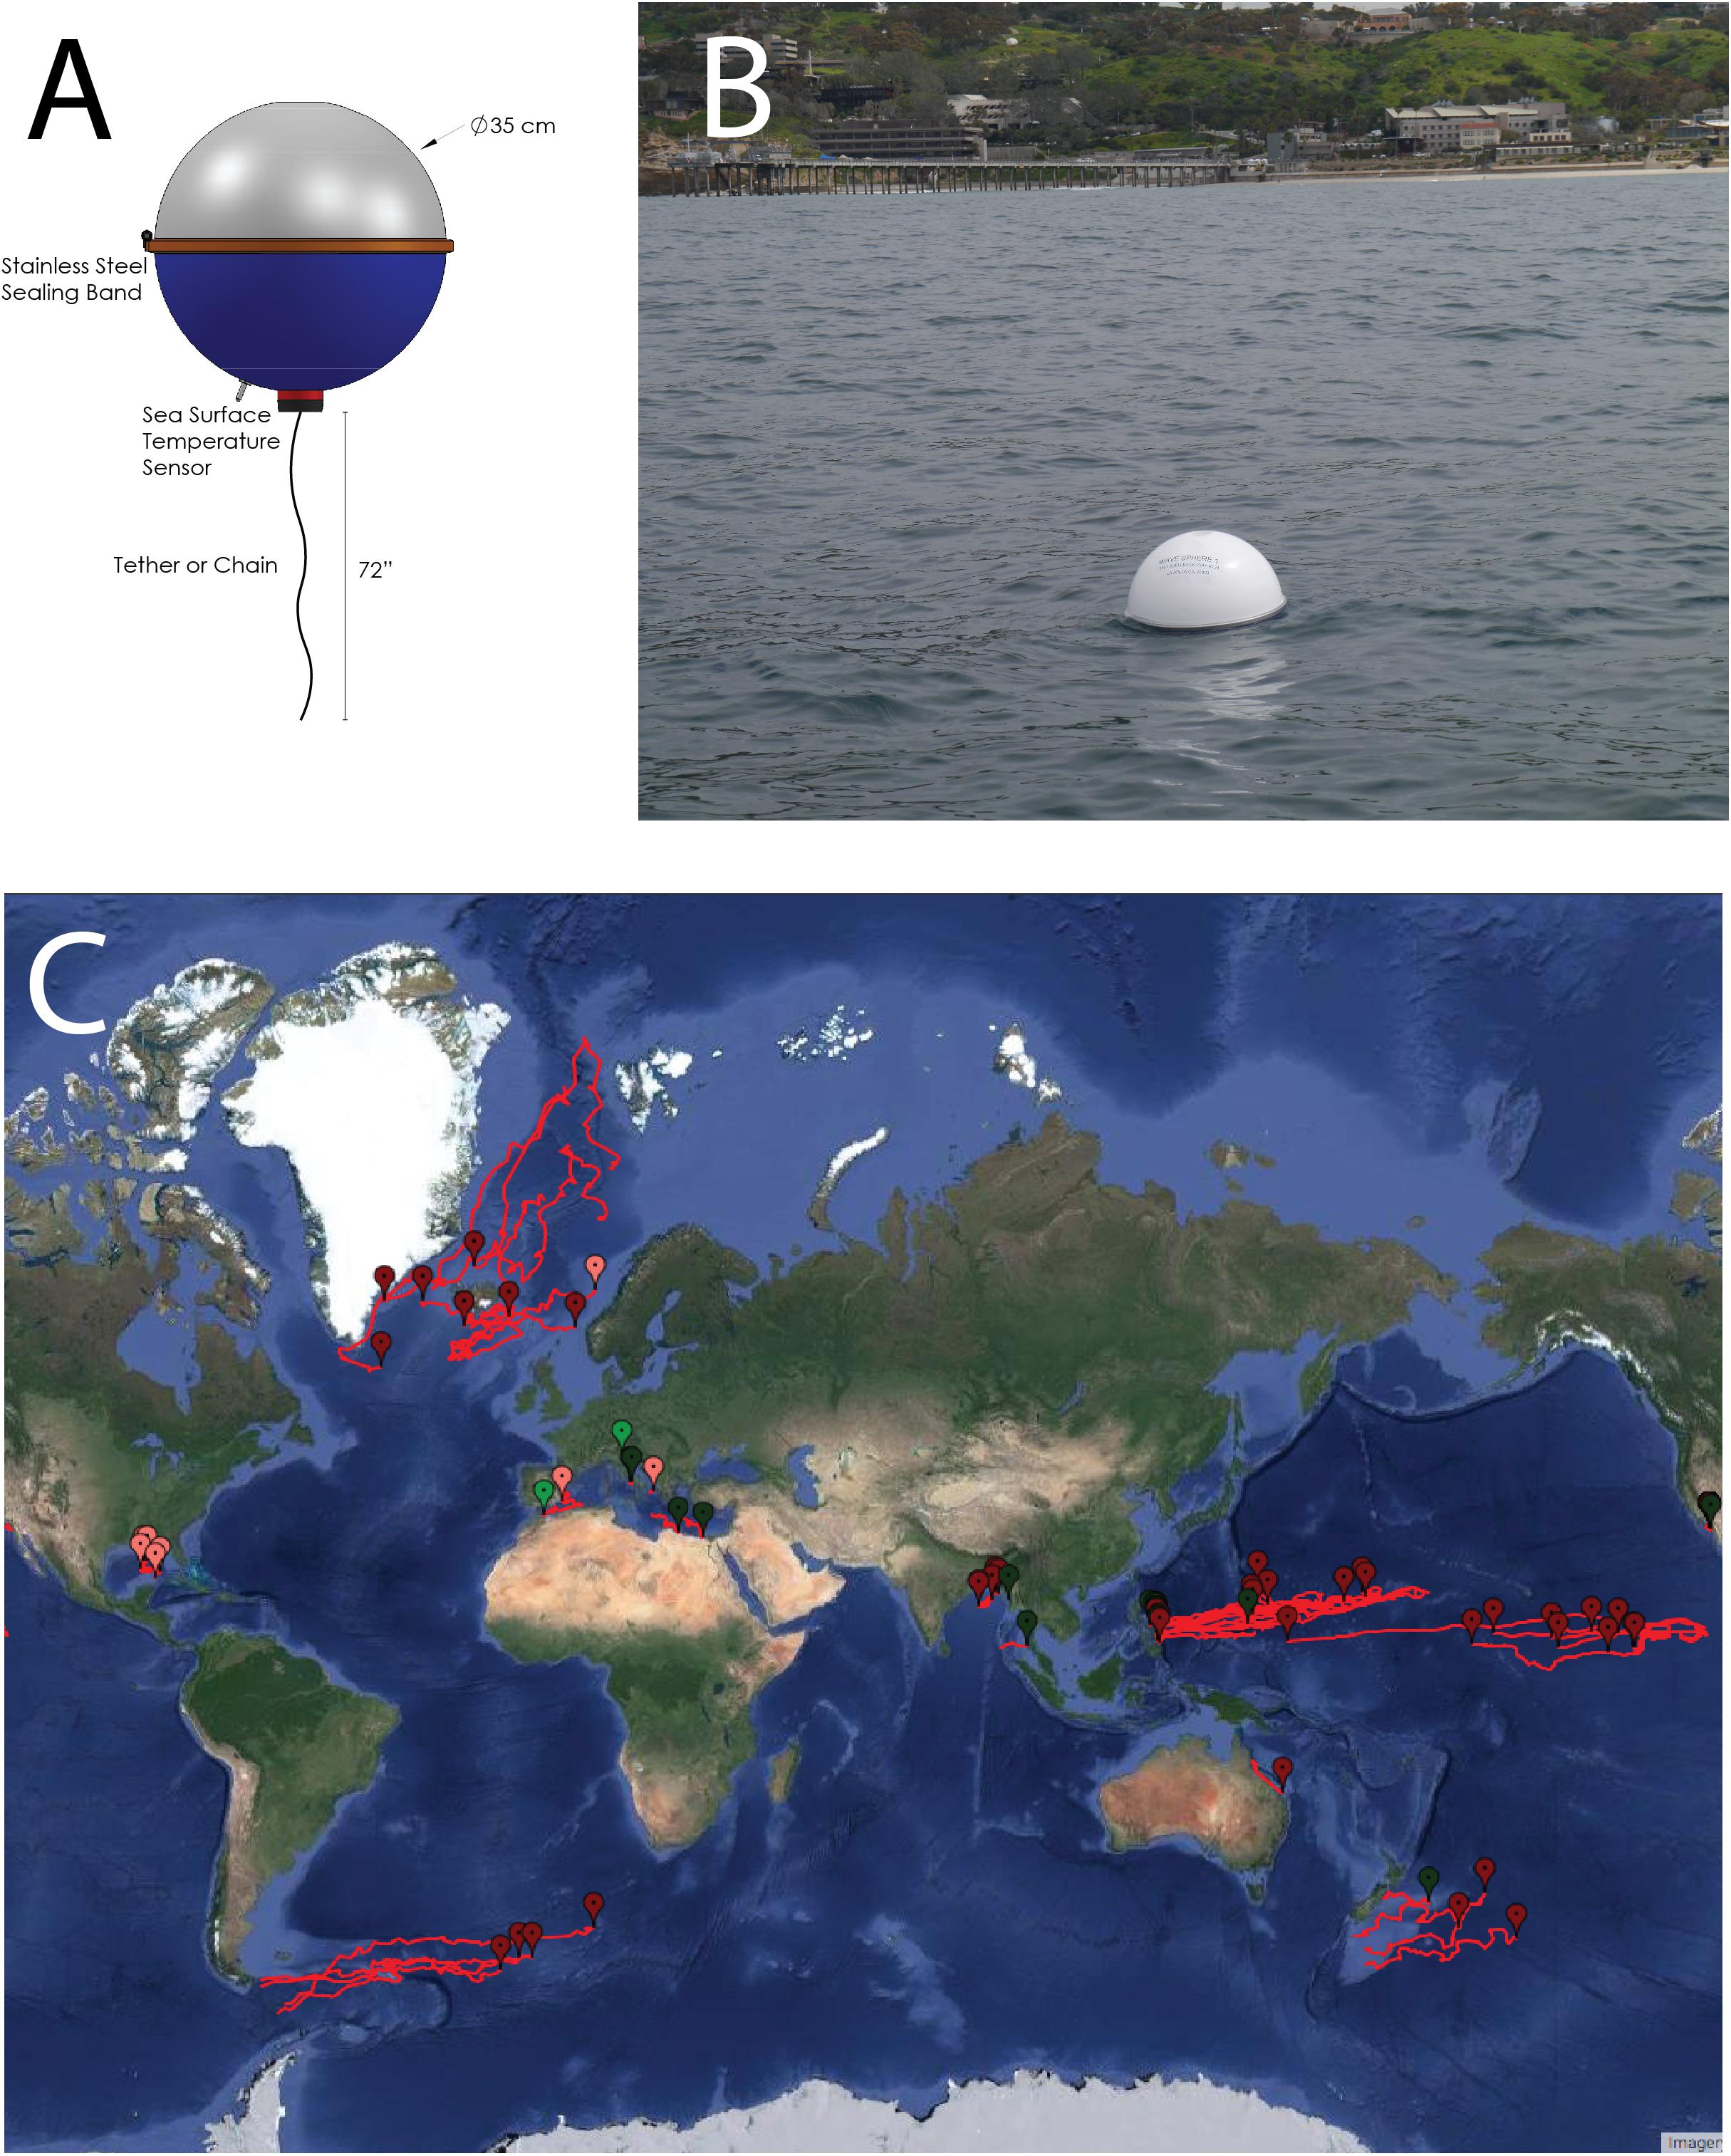
Figure 7. Schematic of the DWS drifter (A). A LDL DWS drifter test deployment off the SIO pier (B). Tracks of the 69 DWS drifters deployed to date by the LDL (C).
Drifting Air–Sea Interface Buoy (DrIB)
A newly designed non-Lagrangian drifter, called the drifting air–sea interface buoy (DrIB), was recently tested in the western Pacific. The DrIB is intended for atmospheric observations of surface wind, air temperature, air pressure, and relative humidity at a height of 3 m as well as for measuring SST (Figure 8). The data are transmitted by the Iridium or Beidou satellite systems.
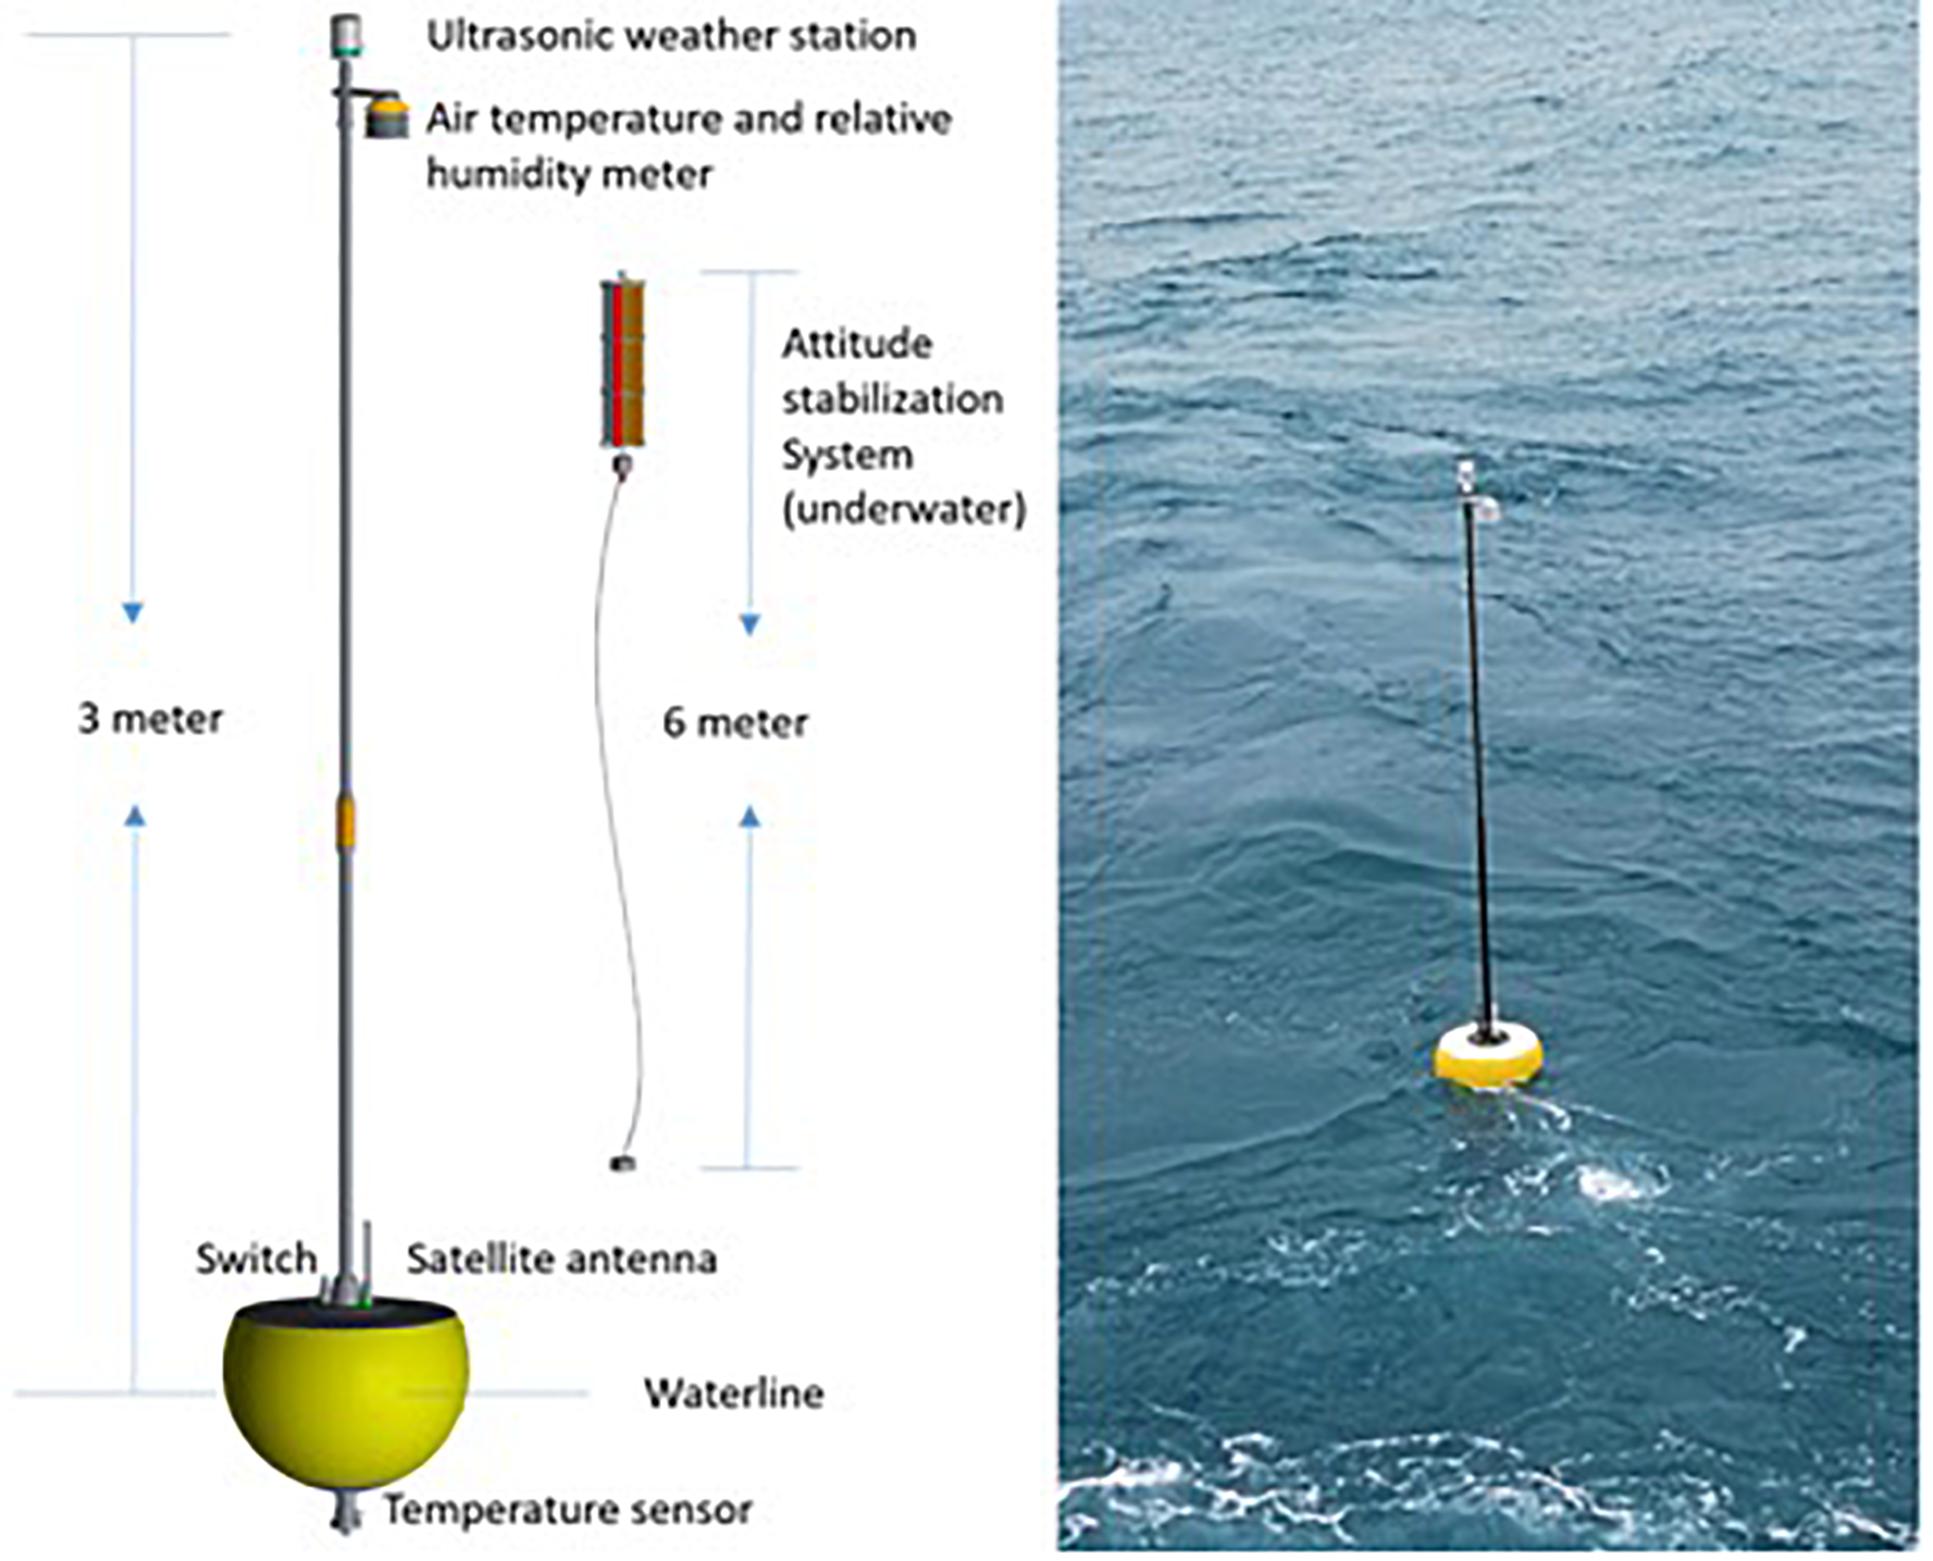
Figure 8. Schematics and picture of the DrIB.
The total weight of the DrIB is about 50 kg, and the maximum diameter is 0.54 m. An Airmar ultrasonic weather station is located at the top of the 3-m mast to measure wind velocity and atmospheric pressure. The NOTC SHT16-1 sensor is used to measure air temperature and relative humidity, and the NOTC MT15 is used to measure SST. Both sensors are manufactured by the National Ocean Technology Center of China and tested and calibrated by the National Center of Ocean Standard and Metrology of China.
The data communication, processing, and control systems have already been built, and two DrIBs have been used operationally by the State Oceanic Administration of China in 2018.
The DrIB was tested in the Kuroshio Extension region, and observations were compared with those obtained from the Kuroshio Extension Observatory (KEO). In 2019, over 40 DrIBs are planned to be deployed in the South China Sea and western Pacific, forming a mini-network for related studies on air–sea interaction and climate change. This will be beneficial to further validate/optimize forecast models.
Unmanned Surface Vehicles
In recent years, the use of autonomous vehicles, sometimes referred to as “gliders,” for ocean data collection has increased. These include unmanned (or autonomous) surface and underwater vehicles (USVs), where the former have potential for making measurements at the air–sea interface and, in the absence of an international community of practice, fall under the ambit of the DBCP. A number of commercially available USVs have been developed (e.g., Wave Glider, Saildrone, Sailbuoy, AutoNaut, and C-Enduro) that are becoming more widely used by the research community and industry. The various USVs typically have the following characteristics: long endurance at sea (e.g., by harnessing wave or wind energy for propulsion), ability to carry a range of meteorological and/or oceanographic sensors and payloads, possibility to post-calibrate sensors on recovery, and two-way communication, allowing them to be piloted remotely (e.g., to make measurements along a preset route or to operate around a fixed station) and to transmit data in real time.
Possible sensors that can be integrated in USVs include meteorological sensors for wind, air temperature, air pressure as well as directional wave sensors, and oceanographic sensors such as ADCPs, conductivity/salinity, temperature, and dissolved oxygen probes. Wave Gliders are capable of short-term to seasonal targeted sustained observations in data-void regions and, although slow moving, in tropical cyclones (Mitarai and McWilliams, 2016; Schmidt et al., 2017). Saildrones are larger in size and also capable of long-range missions in harsh conditions (Zhang et al., 2017). In 2015, NOAA/PMEL, the University of Washington, and Saildrone Inc., ran Saildrone missions in the Bering Sea and Norton Bay (Crance et al., 2017) traveling more than 4,100 nm. In 2017, two Saildrones were also used in the intensive SPURS-2 field campaign and in the pilot study of TPOS 2020 and are currently under evaluation (e.g., Meinig et al., 2019). A potential limiting factor on expanding the use of the Saildrones and potentially other emerging USV platforms is that some companies use a for-profit business model in which they maintain ownership of the USV and/or of the environmental and engineering data collected. This approach may ultimately increase the cost and decrease the effectiveness and rate of uptake of these platforms in the observing system.
Over the coming years, it is the intention of the DBCP community to evaluate USVs, which have the potential to complement and enhance the ocean observing system, as observations from USVs can complement those from fixed platforms such as moored buoys. In particular, USVs could also be used to provide observational backup during periods when moored buoys are out of service or even provide, in some cases, a cost-effective alternative to operating moored buoys. However, this will require a detailed examination of the quality of the data, the reliability of the USV platforms over extended deployments at sea, their ability to operate in and withstand severe weather conditions, and their operating costs. At this time, the use of USV for long-term operational data collection has still to be fully demonstrated, even though they have been more widely used in shorter-period research campaigns.
New Opportunities for Data Relay, Archiving, and Metadata
Collecting observations is not limited to operating the in situ infrastructure. In order to maximize the impact of the observations to the benefit of the scientific and operational communities and to support the development of the blue economy, the data and accompanying metadata need to be archived in an easily accessible way and in a variety of formats. Data collection, archiving, distribution, and the creation of QC products are an integral part of GCOS and should be harmonized and coordinated across the various subnetworks.
For example, observations from the air–sea observing system are currently underutilized for multidisciplinary scientific research, which often requires access to multiple datasets for interdisciplinary oceanographic and meteorological studies and implies that datasets from multiple sources need to be merged for subsequent analysis.
The WMO Information System (WIS; Pinardi et al., 2019) provides the global infrastructure for the exchange of data and information between all NMSs and incorporates the long-established WMO GTS for the delivery of real-time observational data (and increasingly those metadata needed to make best use of the real-time data) needed for their operational requirements. While the GTS remains the standard method of global data exchange between NMS and fulfills their operational requirements and applications, the academic community and the public have a clear need for a more streamlined and consolidated data management architecture, which should provide access to data and, equally important, to metadata in a common format.
Metadata, providing information such as sensor manufacturer, model, and accuracy, are a crucial component of any observing system because they allow to track changes in the technology that inevitably occur over the life of the programs, and their importance cannot be understated. For example, the GSDA contains data from drifters deployed in the late 1970, when the technology and the accuracy of the sensors were widely different from today’s drifters. The metadata need to be standardized to ensure that they contain a comprehensive set of information suitable to support multiple applications, and such formats need to evolve with the technology. Most importantly, metadata must feed into a searchable database that provides key information that can be quickly extracted, cross-correlated, or correlated with environmental data to investigate biases and ultimately increase our confidence, for example, in the computation of trends associated with a changing climate. Further, as issues in batch manufacturing are discovered, instrument metadata can be easily identified and updated to address anomalous measurements or behaviors. Such discoveries are critical in understanding differences in QC data and their unfiltered counterparts (see also Pearlman et al., 2019).
Managing metadata effectively within the current framework is a very difficult task. Current issues include not only the lack of standardization of the digital information and accessibility but also the very real possibility of human errors when the metadata are transferred from the fabricator to the operators of the observing system networks. While metadata systems are being developed now, they are still based on manual operator declarations, and the trend is to minimize human interventions using machine-to-machine protocols. More interestingly, technology develops in parallel, with Sensor Model Language (SensorML), which allows the observing platforms to broadcast sensor information. We believe that a metadata relay framework, in which every instrument reports its identification at regular intervals, will greatly simplify operations, enabling the traceability of the metadata contents to the original fabricator of the observing hardware. It is conceivable that metadata originating from the SensorML methodology could be distributed using a system analogous to the GTS or integrated within.
The evolving computer technology is quickly shifting the paradigm from specialized data centers with racks of physical servers, which require constant modernization and substantial maintenance efforts, to cloud-based services and interfaces that are increasingly platform independent and widely accessible.
We anticipate that the following features will shape the way we access data in the next decade. A network with service cloud computing availability, which can be compliant with various government regulations, can now provide multiple and robust backups to traditional and expensive physical data servers. Physical data servers require sophisticated data center-level monitoring to continuously house, climate control, and provide electricity and connections to the World Wide Web. Further, as hardware fatigues, interfaces rendered obsolete, the hardware requires careful maintenance or refreshes on the order of every 5–10 years. Conversely, multiple virtual servers can be run in parallel and spun-up as user load and privacy requirements dictate, thus reducing downtime in data distribution and ancillary costs during surges of end-user requirements. Otherwise, complex hardware upgrades, including optimizations for increased disk input/output, random-access memory (RAM), or central processing unit (CPU) throughput are reduced to simple graphical user interfaces, enabling end-users to customize their computing platforms with an operating system reboot. Utilizing such a network infrastructure enables the end-user to accomplish otherwise complex, costly, and time-consuming tasks such as relocating and/or replicating the geographical location of the server instance from one region to another with a few menu selections in the user’s dashboard interface.
Sustainability of the in situ Observing Networks
Key to sustaining large observational programs is the fulfillment of at least three main requirements. The first is the demonstration of positive impacts of the data in the context of WMO’s and IOC’s missions and programs and to their members’/member states’ scientific, operational, and economic interests. The second is the ability of each program to adjust to evolving requirements, innovate, and expand its scope as new emerging technologies allow. A third, very practical, requirement is the cost-effectiveness of the programs relative to the scientific and operational needs.
Major changes to the design of the existing air–sea in situ observing networks can have significant implications for their sustainability, for example, by hampering and/or dissipating scientific and technical knowledge and supporting infrastructures. However, there is an intrinsic need for all observing programs to evolve to better meet existing and new requirements. This may include altering the number and types of variables measured, their geographical distribution, and the frequency of observations. Such actions should be supported by tools designed to quantify the implications of such changes, which include OSE, observing system simulation experiments (OSSE), and FSOI studies. New technologies through which the cost-effectiveness of the observing networks can be improved should be tested with dedicated pilot experiments, and be complemented, whenever possible, with preliminary impact studies and validation of numerical models. The cost-effectiveness criterion is undeniably difficult to evaluate because it cannot be separated from the impact of the observations. Simple metrics such as the cost of equally accurate and comparable observations are, nevertheless, very valuable and need to be considered in the context of their scientific and operational impact.
Some established networks, such as the GSDA, have operated for a long time on specific design prerequisites and metrics that are, in some cases, several decades old. Modifications of the GSDA design and its performance metrics are discussed and reviewed each year by the DBCP, which is a particularly good example of an environment where scientific discussion, operational needs, and WMO guidance are integrated into planning the activities of the upcoming year and are instrumental in shaping the long-term vision of the buoy networks. Similarly, metrics have been, or are being, developed for the other components of the ocean observing system under the guidance of the JCOMM Observations Coordination Group (OCG).
Governance and Coordination of the in situ Air–Sea Observational Networks
At present, the various global ocean observing networks under the JCOMM Observations Programme Area (OPA) are coordinated by the OCG, which includes representatives of all the individual observing networks such as the DBCP, SOT, and Argo. OCG is looking to build on synergies, develop best practices across the networks, and looking toward a more optimal multiplatform observing system design based on EOV/ECV requirements (see also Pinardi et al., 2019). In general, GCOS has very little observational redundancy, but given the complexity of the air–sea in situ observing system and the complementarity with observations from space, there is room for optimization. Program operators need a forum to discuss cross-network synergies, technical developments, and future directions. Benefits from developing a cross-network expert team tasked to oversee and optimize the observing capabilities for global observations at the air–sea interface and to advise the panels coordinating the contributing networks (i.e., DBCP and SOT) and OCG will include a more widespread awareness of the scope and capabilities of the various contributing programs, better planning, and more efficient management of the resources dedicated to the implementation, research, and development, ultimately resulting in faster and more efficient adaptation of GCOS to WMO’s RRR.
The Next Decade
Based on the discussion of emerging technologies presented in the section “Sustainability of the in situ Observing Networks”, it is anticipated that in the next 10 years, the in situ observational network located at the interface between the ocean and the atmosphere will evolve to address many of the weaknesses and limitations identified in the section “Gaps and Limitations of the Existing Air–Sea in situ Network”.
Accurate directional wave observations are crucial for operational, engineering, and scientific applications, which include safety at sea; public safety warnings resulting from extreme events such as storm surges, winter storms, and hurricanes; the design of offshore structures; and, from a scientific research standpoint, improving our understanding of the physics of wave/wave interactions, wave/current interactions, mixed-layer depth models, to name a few. Accurate and standardized wave observations are also important for climate studies and for increasing resilience of coastal communities to the consequences of sea-level rise and severe storms.
In situ wave measurements are difficult in nature and are often plagued by biases that are highly dependent on the instrument type, configuration, and sampling methodology. The DBCP Task Team on Wave Measurements (TT-WM) aims to evaluate different wave measurement techniques, ensuing biases and standardization of wave measurement methods.
We are quickly reaching a stage at which we can fill the gap in offshore wave measurements using a sustainable methodology that consists of an array of expendable, low-cost, and yet accurate drifting wave riders, similar to the DWS drifter technology described above, thus providing fundamental and unique directional observations of the offshore wave field. Such observations will be crucial to validate existing wave forecasting models, better assess the severity of seasonal and extreme storms (e.g., hurricanes), and improve intraseasonal weather forecasting. They will also complement the existing wave climate dataset and will advance the science of physical oceanography. In situ offshore directional wave observations will play a critical role in validating and possibly calibrating satellite wave measurements, and we anticipate that such measurements will soon be assimilated in wave forecasting models. Altimetry satellites and the European Space Agency (ESA) Sentinel missions are already able to measure the significant wave height globally, but in situ reference directional wave data are substantially missing in offshore regions. The Surface Waves Investigation and Monitoring (SWIM) radar on the Chinese–French Oceanography Satellite (CFOSAT) is the first space radar designed to measure ocean directional wave spectra and, in conjunction with a global array of directional wave buoys, such as the DWS drifter described in the section “Directional Wave Spectra (DWS) Drifters”, may herald a new era in determining surface wave spectra, linking the spatially separated in situ measurements.
Recent research has also shown the importance of measuring SSS to gain insight into the accelerating global water cycle (e.g., Durack, 2015). Lagrangian platforms are an ideal observational tool to investigate the modulation of SSS by upper-ocean processes, an essential ingredient to quantify such changes. Furthermore, there are regions, such as the Bay of Bengal, where rapidly evolving shallow layers of freshwater and strong lateral salinity gradients at the surface modify the physics of air–sea interactions and affect the evolution of the Indian monsoon, which impact the welfare of a large fraction of the world’s population (e.g., Mahadevan et al., 2016). As ocean–atmosphere coupled models are increasingly used for intraseasonal and climate prediction, the need for in situ SSS observations for direct assimilation and/or for the validation of satellite products will increase. The development of low-cost and expendable conductivity sensors will pave the way for the large-scale deployment of salinity drifters (SVP-S) and will complement the observations from the Argo float array, which is designed to address the evolution of the salinity field of the ocean interior at a temporal resolution more relevant for climate studies.
SLP, wind, and other meteorological in situ observations over the World Ocean should be expanded. The Task Team on High-Resolution Marine Meteorology (TT-HRMM) is focused on improving VOS data.
Undeniably, enabling a stream of real-time, 15-m depth ocean currents from the GSDA would be very useful for the evaluation and future assimilation in ocean forecasting models. The widespread use of the GPS technology to obtain the location of the drifters should offer a solution for the near real-time drogue presence detection problem through the use of the GPS “time-to-first-fix” parameter, which is generally longer when the drogue is present. It is anticipated that, 10 years from now, currents from Lagrangian surface drifters will be used operationally.
More funds should be made available to sustain the in situ air–sea observing system, and as new technologies are transitioned to operations, there will be opportunities to augment the number of observed meteorological ECVs from expendable buoys and USVs to include surface winds, air temperature, and air humidity. To this end, the backbone of the in situ observing system array for air–sea observations (i.e., GSDA, moorings, and VOS) could be complemented with a sustainable and integrated use of USVs.
Summary of Recommendations
• Given the large positive impact of SLP observations from SVP drifters on the accuracy of global NWP and the potential for improving our understanding and forecasting of other important atmospheric phenomena (e.g., atmospheric rivers and fast developing storms), it is recommended that all drifters in the GSDA carry a barometer. This recommendation should be considered a high priority.
• The evaluation of real-time drogue detection for SVP drifters should become fully operational to facilitate the use of real-time near-surface current observations, with the goal to validate ocean circulation models. Efforts to assimilate drifter velocity data in ocean, and ocean–atmosphere coupled models should also be prioritized. The GSDA should be expanded to sustain deployments in undersampled regions, including, but not limited to, the Arctic, the Arabian Sea, and the southern Indian Ocean.
• SST observations from SVP drifters are the benchmark for the calibration and validation of satellite SST products. The DBCP, in full synergy with network operators, should ensure that the accuracy of SST observations from SVP drifters is maintained below 0.05°C. Efforts to understand and fully quantify other sources of error and biases of in situ SST measurements from drifters should be prioritized. Sustainable and cost-effective technical solutions to improve the quality of in situ SST observations from SVP drifters should be supported.
• Expendable, low-cost drifters designed to measure the directional spectra of surface waves should be utilized to implement a wave observing network in the open ocean. The impact of global wave observations in improving forecasts and our scientific understanding of upper-ocean mixed-layer processes (i.e., mixed-layer depth, wave/current interaction) should be assessed, for example, through OSEs. The findings will assist with the design of a global array. Other metrics pertaining to the validation of the forecast from wave models, useful to assess the impact of offshore wave observations, should be developed.
• Extending the range of meteorological and oceanographic observations from SVP drifters should be given full consideration and support. Critical in situ observations that should be considered include air temperature and relative humidity (a high priority, especially for tropical cyclone intensification), surface radiation, SSS, surface wind, and ocean color as technical developments permit.
• The VOS scheme is a very valuable air–sea observing network that allows unique measurements that cannot be obtained from SVP drifters, moorings, and USVs. The use of automated weather stations with dynamic estimation of barometer height should be prioritized to reduce the uncertainty of SLP observations. The expanded use of ISAR and M-AERI radiometers should be supported.
• Observations collected by the air–sea observing network form a record of climate relevance. The content of the metadata should comply with WIGOS requirements and should also contain all key, program-specific information that will form a permanent record. The overall objective is not only to facilitate the use of the data for scientific research and operations but also to allow a reassessment of the quality of the observations and subsequent reanalyses for years to come. Methods of metadata dissemination should favor machine-to-machine transfer to remove the human error component and to achieve full consistency and accuracy of the same records when they are stored at different locations. Cloud computing resources should be used alongside physical servers to improve the efficiency of data and metadata storage and distribution. Metadata self-reporting by the observing platforms should be considered as it will provide another means to improve the consistency of the data and metadata records.
• Governance bodies should be comprehensive and facilitate the exchange of scientific, operational, and technical topics across the operators and stakeholders of all in situ observing networks. Governance bodies should always include both the network operators and users and should address the synergy with other stakeholders, including the satellite observing community.
• The use of USVs to complement the existing air–sea observing network should be fully evaluated in the context of increasing capabilities, and their long-term endurance and operating costs should be assessed with respect to sustainability and quantifiable impacts.
Author Contributions
LC conceived the review manuscript and wrote the manuscript with many of the coauthors. All authors contributed to discussions of the review and the final manuscript.
Funding
LC, LB, and VH were supported by NOAA grant NA15OAR4320071 and ONR grant N00014-17-1-2517. RL was supported by NOAA/AOML and NOAA’s Ocean Observation and Monitoring Division. NM was partly supported by NASA grant NNX17AH43G. IK was supported by the Nordic Seas Eddy Exchanges (NorSEE) funded by the Norwegian Research Council (Grant 221780). DZ was partly funded by the Joint Institute for the Study of the Atmosphere and Ocean (JISAO) under NOAA Cooperative Agreement NA15OAR4320063. RJ was supported by the USACE’s Civil Works 096×3123.
Conflict of Interest Statement
The authors declare that the research was conducted in the absence of any commercial or financial relationships that could be construed as a potential conflict of interest.
Footnotes
- ^ https://oscar.wmo.int/surface//index.html#/
- ^ Here, we refer to the Argo measurement taken nearest to the surface in either pumped or unpumped operation.
References
Allan, R., and Ansell, T. (2006). A new complete monthly historical gridded mean sea level pressure dataset (HadSLP2): 1850–2004. J. Clim. 19, 5816–5842. doi: 10.1175/JCLI3937.1
Andersson, M., LaCasce, J. H., Koszalka, I., Orvik, K. A., and Mauritzen, C. (2011). Variability of the Norwegian Atlantic current and associated eddy field from surface drifters. J. Geophys. Res. 116:C08032. doi: 10.1029/2011JC007078
Ardhuin, F., Stopa, J. E., Chapron, B., Collard, F., Husson, R., Jensen, R. E., et al. (2019a). Observing sea states. Front. Mar. Sci. 6:124. doi: 10.3389/fmars.2019.00124
Ardhuin, F., Brandt, P., Gaultier, L., Donlon, C., Battaglia, A., Boy, F., et al. (2019b). SKIM, a candidate satellite mission exploring global ocean currents and waves. Front. Mar. Sci. 6:209. doi: 10.3389/fmars.2019.00209
Berry, D. I., and Kent, E. C. (2009). A new air–sea interaction gridded dataset from ICOADS with uncertainty estimates. Bull. Am. Meteorol. Soc. 90, 645–656. doi: 10.1175/2008BAMS2639.1
Berry, D. I., Corlett, G. K., Embury, O., and Merchant, C. J. (2018). Stability assessment of the (A)ATSR sea surface temperature climate dataset from the European Space Agency climate change initiative. Remote Sens. 10:126. doi: 10.3390/rs10010126
Berry, D. I., Kent, E. C., and Taylor, P. K. (2004). An analytical model of heating errors in marine air temperatures from ships. J. Atmos. Ocean. Technol. 21, 1198–1215. doi: 10.1175/1520-0426(2004)021<1198:aamohe>2.0.co;2
Booker, D. J., Wells, N. C., and Smith, I. P. (2008). Modelling the trajectories of migrating Atlantic salmon (Salmo salar). Can. J. Fish. Aquat. Sci. 65, 352–361. doi: 10.1139/f07-173
Bourassa, M. A., Meissner, T., Cerovecki, I., Chang, P., Dong, X., De Chiara, G., et al. (2019). Remotely sensed winds and wind stresses for marine forecasting and ocean modeling. Front. Mar. Sci. doi: 10.3389/fmars.2019.00443
Bourras, D. (2006). Comparison of five satellite-derived latent heat flux products to moored buoy data. J. Clim. 19, 6291–6313. doi: 10.1175/JCLI3977.1
Buizza, R., Poli, P., Rixen, M., Alonso-Balmaseda, M., Bosilovich, M. G., Brönnimann, S., et al. (2018). Advancing global and regional reanalyses. Bull. Am. Meteorol. Soc. 99, ES139–ES144. doi: 10.1175/BAMS-D-17-0312.1
Bulgin, C. E., Embury, O., Corlett, G., and Merchant, C. J. (2016). Independent uncertainty estimates for coefficient based sea surface temperature retrieval from the Along-Track Scanning Radiometer instruments. Remote Sens. Environ. 178, 213–222. doi: 10.1016/j.rse.2016.02.022
Carlton, J. T., Chapman, J. W., Geller, J. G., Miller, J. A., Carlton, D. A., McCuller, M. I., et al. (2017). Tsunami-driven rafting: transoceanic species dispersal and implications for marine biogeography. Science 357, 1402–1406. doi: 10.1126/science.aao1498
Carrier, M., Ngodock, H., Muscarella, P., and Smith, S. (2016). Impact of assimilating surface velocity observations on the model sea surface height using the NCOM-4DVAR. Mon. Weather Rev. 144, 1051–1068. doi: 10.1175/mwr-d-14-00285.1
Castro, S. L., Emery, W., Wick, G. A., and Tandy, W. (2017). Submesoscale sea surface temperature variability from UAV and satellite measurements. Remote Sens. 9:1089. doi: 10.3390/rs9111089
Centurioni, L. R. (2018). “Drifter technology and impacts for sea surface temperature, sea-level pressure, and ocean circulation studies,” in Observing the Oceans in Real Time, eds R. Venkatesan, A. Tandon, E. D’Asaro, and M. A. Atmanand (Cham: Springer International Publishing), doi: 10.1007/978-3-319-66493-4_3
Centurioni, L. R., Braasch, L., Di Lauro, E., Contestabile, P., De Leo, F., Casotti, R., et al. (2016). A new strategic wave measurement station off Naples port main breakwater. Coast. Eng. Proc. 1:36. doi: 10.9753/icce.v35.waves.36
Centurioni, L. R., Hormann, V., Chao, Y., Reverdin, G., Font, J., and Lee, D.-K. (2015). Sea surface salinity observations with Lagrangian drifters in the tropical north Atlantic during SPURS: circulation, fluxes, and comparisons with remotely sensed salinity from Aquarius. Oceanography 28, 96–105. doi: 10.5670/oceanog.2015.08
Centurioni, L. R., Hormann, V., Talley, L. D., Arzeno, I., Beal, L., Caruso, M., et al. (2017a). Northern Arabian Sea Circulation–Autonomous Research (NASCar): a research initiative based on autonomous sensors. Oceanography 30, 74–87. doi: 10.5670/oceanog.2017.224
Centurioni, L. R., Hornayi, A., Cardinali, C., Charpentier, E., and Lumpkin, R. (2017b). A global observing system for measuring sea level atmospheric pressure: effects and impacts on numerical weather prediction. Bull. Am. Meteorol. Soc 98, 231–238. doi: 10.1175/BAMS-D-15-00080.1
Centurioni, L. R., Niiler, P. N., and Lee, D.-K. (2009). Near-surface circulation in the South China Sea during the winter monsoon. Geophys. Res. Lett. 36:L06605. doi: 10.1029/2008GL037076
Centurioni, L. R., Ohlmann, J. C., and Niiler, P. P. (2008). Permanent meanders in the California Current System. J. Phys. Oceanogr. 38, 1690–1710. doi: 10.1175/2008JPO3746.1
Choquer, M., Blouch, P., Gaillard, F., Reynaud, T., Reverdin, G., Metzl, N., et al. (2013). The OceanoScientific Programme: Scientific Data Acquisition by Sailing Ships. Available at: https://www.wmo.int/pages/prog/www/IMOP/publications/IOM-116_TECO-2014/Session%201/O1_12_Choquer_OceanoScientific.pdf (accessed October, 2018).
Christensen, K. H., Röhrs, J., Ward, B., Fer, I., Broström, G., Saetra, Ø, et al. (2013). Surface wave measurements using a ship-mounted ultrasonic altimeter. Methods Oceanogr 6, 1–15. doi: 10.1016/j.mio.2013.07.002
Compo, G. P., Whitaker, J. S., Sardeshmukh, P. D., Matsui, N., Allan, R. J., Yin, X., et al. (2011). The twentieth century reanalysis project. Q. J. Roy. Meteor. Soc. 137, 1–28. doi: 10.1002/qj.776
Corlett, G. K., Merchant, C. J., Minnett, P. J., and Donlon, C. J. (2014). “Assessment of long-term satellite derived sea surface temperature records,” in Experimental Methods in the Physical Sciences, Optical Radiometry for Ocean Climate Measurements, Vol. 47, eds G. Zibordi, C. J. Donlon, and A. C. Parr (Cambridge, MA: Academic Press), 639–677. doi: 10.1016/b978-0-12-417011-7.00021-0
Cozar, A., Marti, E., Duarte, C. M., Garcia-de-Lomas, J., van Sebille, E., Ballatore, T. J., et al. (2017). The Arctic Ocean as a dead end for floating plastics in the North Atlantic branch of the Thermohaline circulation. Sci. Adv. 3:e1600582. doi: 10.1126/sciadv.1600582
Crance, J. L., Berchock, C. L., and Tabisola, H. (2017). Saildrone Summer 2016 Bering Sea Mission—Final Report. Available at: https://www.mmc.gov/wp-content/uploads/Saildrone-2017-MMC-Final-Report.pdf (accessed October, 2018).
Cravatte, S., Kessler, W. S., Smith, N., Wijffels, S. E., Yu, L., Ando, K., et al. (2016). First Report of TPOS 2020. Available at: http://tpos2020.org/first-report/ (accessed October, 2018).
Cronin, M. F., Gentemann, C. L., Edson, J., Ueki, I., Bourassa, M., Brown, S., et al. (2019). Air-sea fluxes with a focus on heat and momentum. Front. Mar. Sci. 6:430. doi: 10.3389/fmars.2019.00430
D’Asaro, E. A., Black, P. G., Centurioni, L. R., Chang, Y. T., Chen, S. S., Foster, R. C., et al. (2013). ‘Impact of typhoons on the ocean in the Pacific’. Bull. Am. Meteorol. Soc. 95, 1405–1418.
D’Asaro, E. A., Eriksen, C. C., Levine, M. D., Paulson, C. A., Niiler, P., and Van Meurs, P. (1995). Upper-ocean inertial currents forced by a strong storm. Part I: data and comparisons with linear theory. J. Phys. Oceanogr. 25, 2909–2936. doi: 10.1175/1520-0485(1995)025<2909:uoicfb>2.0.co;2
Dash, P., Ignatov, A., Kihai, Y., and Sapper, J. (2010). The SST Quality Monitor (SQAM). J. Atmos. Ocean. Technol. 27, 1899–1917. doi: 10.1175/2010JTECHO756.1
De Dominicis, M., Leuzzi, G., Monti, P., Pinardi, N., and Poulain, P.-M. (2012). Eddy diffusivity derived from drifter data for dispersion model applications. Ocean Dynam. 62, 1381–1398. doi: 10.1007/s10236-012-0564-2
Dee, D. P., Uppala, S. M., Simmons, A. J., Berrisford, P., Poli, P., Kobayashi, S., et al. (2011). The ERA-Interim reanalysis: configuration and performance of the data assimilation system. Q. J. Roy. Meteor. Soc. 137, 553–597. doi: 10.1002/qj.828
Donlon, C. J., Casey, K. S., Robinson, I. S., Gentemann, C. L., Reynolds, R. W., Barton, I., et al. (2009). The GODAE high-resolution sea surface temperature pilot project. Oceanography 22, 34–45. doi: 10.5670/oceanog.2009.64
Donlon, C. J., Martin, M., Stark, J., Roberts-Jones, J., Fiedler, E., and Wimmer, W. (2012). The Operational sea surface temperature and sea ice analysis (OSTIA) system. Remote Sens. Environ. 116, 140–158. doi: 10.1016/j.rse.2010.10.017
Donlon, C. J., Minnett, P. J., Fox, N., and Wimmer, W. (2014a). “Strategies for the laboratory and field deployment of ship-borne fiducial reference thermal infrared radiometers in support of satellite-derived sea surface temperature climate data records,” in Experimental Methods in the Physical Sciences, Optical Radiometry for Ocean Climate Measurements, Vol. 47, eds G. Zibordi, C. J. Donlon, and A. C. Parr (Cambridge, MA: Academic Press), 557–603. doi: 10.1016/b978-0-12-417011-7.00018-0
Donlon, C. J., Minnett, P. J., Jessup, A., Barton, I., Emery, W., Hook, S., et al. (2014b). “Ship-borne thermal infrared radiometer systems,” in Experimental Methods in the Physical Sciences, Optical Radiometry for Ocean Climate Measurements, Vol. 47, eds G. Zibordi, C. J. Donlon, and A. C. Parr (Cambridge, MA: Academic Press), 305–404. doi: 10.1016/b978-0-12-417011-7.00011-8
Donlon, C., Robinson, I. S., Reynolds, M., Wimmer, W., Fisher, G., Edwards, R., et al. (2008). An Infrared Sea Surface Temperature Autonomous Radiometer (ISAR) for deployment aboard volunteer observing ships (VOS). J. Atmos. Ocean. Technol. 25, 93–113. doi: 10.1175/2007jtecho505.1
Döös, K., Rupolo, V., and Brodeau, L. (2011). Dispersion of surface drifters and model-simulated trajectories. Ocean Model. 39, 301–310. doi: 10.1016/j.ocemod.2011.05.005
Durack, P. J. (2015). Ocean salinity and the global water cycle. Oceanography 28, 20–31. doi: 10.5670/oceanog.2015.03
Elipot, S., Lumpkin, R., and Prieto, G. (2010). Modification of inertial oscillations by the mesoscale eddy field. J. Geophys. Res. Oceans 115:20. doi: 10.1029/2009JC005679
Elipot, S., Lumpkin, R., Perez, R., Lilly, J., Early, J., and Sykulski, A. (2016). A global surface drifter data set at hourly resolution. J. Geophys. Res. Oceans 121, 2937–2966. doi: 10.1002/2016JC011716
Embury, O., and Merchant, C. J. (2012). A reprocessing for climate of sea surface temperature from the Along-Track Scanning Radiometers: a new retrieval scheme. Remote Sens. Environ. 116, 47–61. doi: 10.1016/j.rse.2010.11.020
Etienne, H. (2018). Product User Manual for Global Ocean Delayed-Mode in-situ Observations Of Ocean Surface Currents and Temperature from Drifters. Available at: http://resources.marine.copernicus.eu/documents/PUM/CMEMS-INS-PUM-013-044.pdf (accessed May, 2019).
Freeman, E., Kent, E. C., Brohan, P., Cram, T., Gates, L., Huang, B., et al. (2019). The International comprehensive ocean-atmosphere data set – meeting users needs and future priorities. Front. Mar. Sci. 6:435. doi: 10.3389/fmars.2019.00435
Freeman, E., Woodruff, S. D., Worley, S. J., Lubker, S. J., Kent, E. C., Angel, W. E., et al. (2016). ICOADS Release 3.0: a major update to the historical marine climate record. Int. J. Climatol. 37, 2211–2232. doi: 10.1002/joc.4775
Gasparin, F., Greiner, E., Lellouche, J.-M., Legalloudec, O., Garric, G., Drillet, Y., et al. (2018). A large-scale view of oceanic variability from 2007 to 2015 in the global high resolution monitoring and forecasting system at Mercator Océan. J. Mar. Syst. 187, 260–276. doi: 10.1016/j.jmarsys.2018.06.015
Gelaro, R., McCarty, W., Suarez, M. J., Todling, R., Molod, A., Takacs, L., et al. (2017). The modern-era retrospective analysis for research and applications, Version 2 (MERRA-2). J. Clim. 30, 5419–5454. doi: 10.1175/JCLI-D-16-0758.1
Gentemann, C. L. (2014). Three way validation of MODIS and AMSR-E sea surface temperatures. J. Geophys. Res. Oceans 119, 2583–2598. doi: 10.1002/2013JC009716
Gommenginger, C., Chapron, B., Hogg, A., Buckingham, C., Fox-Kemper, B., Eriksson, L., et al. (2019). SEASTAR: a mission to study ocean submesoscale dynamics and small-scale atmosphere-ocean processes in coastal, shelf and polar seas. Front. Mar. Sci. 6:457. doi: 10.3389/fmars.2019.00457
Gong, D. Y., and Wang, S. W. (1999). Definition of Antarctic oscillation index. Geophys. Res. Lett. 26, 459–462. doi: 10.1029/1999GL900003
Griffa, A., Lumpkin, R., and Veneziani, M. (2008). Cyclonic and anticyclonic motion in the upper ocean. Geophys. Res. Lett. 35:L01608. doi: 10.1029/2007GL032100
Griffa, A., Owens, K., Piterbarg, L., and Rozovskii, B. (1995). Estimates of turbulence parameters from Lagrangian data using a stochastic particle model. J. Mar. Res. 53, 371–401. doi: 10.1357/0022240953213151
Guichoux, Y., Lennon, M., and Thomas, N. (2016). “Sea surface currents calculation using vessel tracking data,” in Proceedings of the Maritime Knowledge Discovery and Anomaly Detection Workshop, (Ispra: JRC Science Hub), 5–6.
Hansen, D. V., and Poulain, P.-M. (1996). Quality control and interpolations of WOCE-TOGA drifter data. J. Atmos. Ocean. Technol. 13, 900–909. doi: 10.1175/1520-0426(1996)013<0900:qcaiow>2.0.co;2
Hare, J. A., and Walsh, H. J. (2007). Planktonic linkages among marine protected areas on the south Florida and southeast United States continental shelves. Can. J. Fish. Aquat. Sci. 64, 1234–1247. doi: 10.1139/f07-089
Haza, A. C., Piterbarg, L. I., Martin, P., Ozgokmen, T. M., and Griffa, A. (2007). Lagrangian subgridscale model for particle transport improvement and application in the Adriatic Sea using the navy coastal ocean model. Ocean Model. 17, 68–91. doi: 10.1016/j.ocemod.2006.10.004
Horányi, A., Cardinali, C., and Centurioni, L. (2017). The global numerical weather prediction impact of mean-sea-level pressure observations from drifting buoys. Q. J. Roy. Meteor. Soc. 143, 974–985. doi: 10.1002/qj.2981
Hormann, V., Centurioni, L. R., and Reverdin, G. (2015). Evaluation of drifter salinities in the subtropical North Atlantic. J. Atmos. Ocean. Technol. 32, 185–192. doi: 10.1175/JTECH-D-14-00179.1
Hormann, V., Centurioni, L. R., Mahadevan, A., Essink, S., D’Asaro, E. A., and Kumar, B. P. (2016). Variability of near-surface circulation and sea surface salinity observed from Lagrangian drifters in the Northern Bay of Bengal during the waning 2015 southwest monsoon. Oceanography 29, 124–133. doi: 10.5670/oceanog.2016.45
Hormann, V., Centurioni, L. R., Rainville, L., Lee, C. M., and Braasch, L. J. (2014). Response of upper ocean currents to Typhoon Fanapi. Geophys. Res. Lett 41, 3995–4003. doi: 10.1002/2014GL060317
Ignatov, A., Zhou, X., Petrenko, B., Liang, X., Kihai, Y., Dash, P., et al. (2016). AVHRR GAC SST reanalysis version 1 (RAN1). Remote Sens. 8:315. doi: 10.3390/rs8040315
Ingleby, B. (2010). Factors affecting ship and buoy data quality: a data assimilation perspective. J. Atmos. Ocean. Technol. 27, 1476–1489. doi: 10.1175/2010JTECHA1421.1
Ingleby, B., and Isaksen, L. (2018). Drifting buoy pressures: impact on NWP. Atmos. Sci. Lett. 19:e822. doi: 10.1002/asl.822
IPCC (2013). “Climate Change 2013: The physical science basis,” in Contribution of Working Group I to the Fifth Assessment Report of the Intergovernmental Panel on Climate Change, eds T. F. Stocker, D. Qin, G.-K. Plattner, M. Tignor, S. K. Allen, J. Boschung, et al. (Cambridge: Cambridge University Press), 1535.
Kennedy, J. (2014). A review of uncertainty in in-situ measurements and data sets of sea surface temperature. Rev. Geophys. 52, 1–32. doi: 10.1002/2013RG000434
Kent, E. C., Rayner, N. A., Berry, D. I., Eastman, R., Grigorieva, V. G., Huang, B., et al. (2019). Observing requirements for long-term climate records at the ocean surface. Front. Mar. Sci. 6:441. doi: 10.3389/fmars.2019.00441
Kilpatrick, K. A., Podestá, G. P., and Evans, R. H. (2001). Overview of the NOAA/NASA Pathfinder algorithm for sea surface temperature and associated Matchup Database. J. Geophys. Res. 106, 9179–9198.
Kilpatrick, K. A., Podestá, G., Walsh, S., Williams, E., Halliwell, V., Szczodrak, M., et al. (2015). A decade of sea surface temperature from MODIS. Remote Sens. Environ. 165, 27–41. doi: 10.1016/j.rse.2015.04.023
Kobayashi, S., Ota, Y., Harada, Y., Ebita, A., Moriya, M., Onoda, H., et al. (2015). The JRA-55 reanalysis: general specifications and basic characteristics. J. Meteorol. Soc. Japan 93, 5–48. doi: 10.2151/jmsj.2015-001
Koszalka, I., LaCasce, J. H., and Orvik, K. A. (2009). Relative dispersion in the Nordic Seas. J. Mar. Res. 67, 411–433. doi: 10.1357/002224009790741102
Koszalka, I., LaCasce, J. H., Andersson, M., Orvik, K. A., and Mauritzen, C. (2011). Surface circulation in the Nordic Seas from clustered drifters. Deep Sea Res. Part I Oceanogr. Res. Pap. 58, 468–485. doi: 10.1016/j.dsr.2011.01.007
Koszalka, I., LaCasce, J. H., and Mauritzen, C. (2013). In pursuit of anomalies—Analyzing the poleward transport of Atlantic Water with surface drifters. Deep Sea Res. II 85, 96–108. doi: 10.1016/j.dsr2.2012.07.035
Kunze, E. (1985). Near-inertial wave propagation in geostrophic shear. J. Phys. Oceanogr. 15, 544–565. doi: 10.1175/1520-0485(1985)015<0544:niwpig>2.0.co;2
Lacorata, G., Aurell, E., and Vulpiani, A. (2001). Drifter dispersion in the Adriatic Sea: Lagrangian data and chaotic model. Ann. Geophys. 19, 121–129. doi: 10.5194/angeo-19-121-2001
Landwehr, S., O’Sullivan, N., and Ward, B. (2015). Direct flux measurements from mobile platforms at sea: motion and airflow distortion corrections revisited. J. Atmos. Ocean. Technol. 32, 1163–1178. doi: 10.1175/JTECH-D-14-00137.1
Laurindo, L. C., Mariano, A., and Lumpkin, R. (2017). An improved surface velocity climatology for the global ocean from drifter observations. Deep Sea Res. Part I Oceanogr. Res. Pap. 124, 73–92. doi: 10.1016/j.dsr.2017.04.009
Lean, K., and Saunders, R. W. (2013). Validation of the ATSR Reprocessing for Climate (ARC) dataset using data from drifting buoys and a three-way error analysis. J. Clim. 26, 4758–4772. doi: 10.1175/JCLI-D-12-00206.1
Lellouche, J.-M., Greiner, E., Le Galloudec, O., Garric, G., Regnier, C., Drevillon, M., et al. (2018). Recent updates on the Copernicus Marine Service global ocean monitoring and forecasting real-time 1/12° high resolution system. Ocean Sci. 14, 1093–1126. doi: 10.5194/os-14-1093-2018
Lellouche, J.-M., Le Galloudec, O., Drevillon, M., Regnier, C., Greiner, G., Ferry, N., et al. (2013). Evaluation of global monitoring and forecasting systems at Mercator Ocean. Ocean Sci. 9, 57–81. doi: 10.5194/os-9-57-2013
Loew, A., Bell, W., Brocca, L., Bulgin, C. E., Burdanowitz, J., Calbet, X., et al. (2017). Validation practices for satellite-based Earth observation data across communities. Rev. Geophys. 55, 779–817. doi: 10.1002/2017RG000562
Lumpkin, R., and Elipot, S. (2010). Surface drifter pair spreading in the North Atlantic. J. Geophys. Res. 115:C12017. doi: 10.1029/2010JC006338
Lumpkin, R., and Johnson, G. (2013). Global ocean surface velocities from drifters: mean, variance, ENSO response, and seasonal cycle. J. Geophys. Res. Oceans 118, 2992–3006. doi: 10.1002/jgrc.20210
Lumpkin, R., and Pazos, M. (2007). “Measuring surface currents with Surface Velocity Program drifters: the instrument, its data and some recent results,” in Lagrangian Analysis and Prediction of Coastal and Ocean Dynamics, Chap. 2, ed. A. Griffa (Cambridge: Cambridge University Press), 39–67. doi: 10.1017/cbo9780511535901.003
Lumpkin, R., Centurioni, L., and Perez, R. C. (2016). Fulfilling observing system implementation requirements with the global drifter array. J. Atmos. Ocean. Technol. 33, 685–695. doi: 10.1175/JTECH-D-15-0255.1
Lumpkin, R., Maximenko, N., and Pazos, M. (2012). Evaluating where and why drifters die. J. Atmos. Ocean. Technol. 29, 300–308. doi: 10.1175/JTECH-D-11-00100.1
Lumpkin, R., Ozgokmen, T., and Centurioni, L. (2017). Advances in the applications of surface drifters. Annu. Rev. Mar. Sci. 9, 59–81. doi: 10.1146/annurev-marine-010816-060641
Mahadevan, A., Paluszkiewicz, T., Ravichandran, M., Sengupta, D., and Tandon, A. (2016). Introduction to the special issue on the Bay of Bengal: from monsoons to mixing. Oceanography 29, 14–17. doi: 10.5670/oceanog.2016.34
Maximenko, N. A., Hafner, J., Kamachi, M., and MacFadyen, A. (2018). Numerical simulations of debris drift from the 2011 tsunami in Japan, verified with boat reports. Mar. Pollut. Bull. 132, 5–25. doi: 10.1016/j.marpolbul.2018.03.056
Maximenko, N., Corradi, P., Law, K. L., Van Sebille, E., Garaba, S. P., Lampitt, R. S., et al. (2019). Towards the Integrated Marine Debris Observing System. Front. Mar. Sci. doi: 10.3389/fmars.2019.00447
Maximenko, N., Lumpkin, R., and Centurioni, L. (2013). “Ocean surface circulation,” in Ocean Circulation and Climate: A 21st Century Perspective, eds G. Siedler, S. M. Griffies, J. Gould, and J. A. Church (Cambridge, MA: Academic Press), 283–304. doi: 10.1016/b978-0-12-391851-2.00012-x
Maximenko, N., Niiler, P., Rio, M.-H., Melnichenko, O., Centurioni, L., Chambers, D., et al. (2009). Mean dynamic topography of the ocean derived from satellite and drifting buoy data using three different techniques. J. Atmos. Ocean. Technol. 26, 1910–1919. doi: 10.1175/2009JTECHO672.1
McAdam, R., and van Sebille, E. (2018). Surface connectivity and interocean exchanges from drifter-based transition matrices. J. Geophys. Res. Oceans 123, 514–532. doi: 10.1002/2017JC013363
Meinig, C., Burger, E. F., Cohen, N., Cokelet, E. D., Cronin, M. F., Cross, J. N., et al. (2019). Public-private partnerships to advance regional ocean-observing capabilities: a saildrone and NOAA–PMEL case study and future considerations to expand to global scale observing. Front. Mar. Sci. 6:448. doi: 10.3389/fmars.2019.00448
Miller, J. (2018). Antarctica is not protected from an influx of new species. Phys. Today 71, 14–16. doi: 10.1063/pt.3.4012
Minnett, P. J. (1991). Consequences of sea surface temperature variability on the validation and applications of satellite measurements. J. Geophys. Res. 96, 18475–18489.
Minnett, P. J., and Barton, I. J. (2010). “Remote sensing of the Earth’s surface temperature,” in Radiometric Temperature Measurements and Applications, eds Z. M. Zhang, B. K. Tsai, and G. Machin (Cambridge, MA: Academic Press), 333–391. doi: 10.1016/S1079-4042(09)04306-9
Minnett, P. J., Knuteson, R. O., Best, F. A., Osborne, B. J., Hanafin, J. A., and Brown, O. B. (2001). The Marine-Atmospheric Emitted Radiance Interferometer (M-AERI), a high-accuracy, sea-going infrared spectroradiometer. J. Atmos. Ocean. Technol. 18, 994–1013. doi: 10.1175/1520-0426(2001)018<0994:tmaeri>2.0.co;2
Minnett, P. J., Maillet, K. A., Hanafin, J. A., and Osborne, B. J. (2005). Infrared interferometric measurements of the near surface air temperature over the oceans. J. Atmos. Ocean. Technol. 22, 1016–1029.
Minnett, P. J. (2010). “The validation of sea surface temperature retrievals from spaceborne infrared radiometers,” in Oceanography from Space, eds V. Barale, J. Gower, and L. Alberotanza (Dordrecht: Springer).
Mitarai, S., and McWilliams, J. C. (2016). Wave glider observations of surface winds and currents in the core of Typhoon Danas. Geophys. Res. Lett. 43, 11312–11319. doi: 10.1002/2016GL071115
Mogensen, K. S., Hewson, T., Keeley, S., and Magnusson, L. (2018). Effects of Ocean Coupling on Weather Forecasts. Available at: https://www.ecmwf.int/en/newsletter/156/news/effects-ocean-coupling-weather-forecasts (accessed October, 2018).
Moltmann, T., Turton, J., Zhang, H. M., Nolan, G., Gouldman, C., Griesbauer, L., et al. (2019). A Global Ocean Observing System (GOOS), delivered through enhanced collaboration across regions, communities, and new technologies. Front. Mar. Sci. 6:291. doi: 10.3389/fmars.2019.00291
Mrvaljevic, R. K., Black, P. G., Centurioni, L. R., Chang, Y.-T., D’Asaro, E. A., Jayne, S. R., et al. (2013). ‘Observations of the cold wake of Typhoon Fanapi (2010)’. Geophys. Res. Lett. 40, 316–321. doi: 10.1029/2012gl054282
Muscarella, P., Carrier, M. J., Ngodock, H., Smith, S., Lipphardt, B. L., Kirwan, A. D., et al. (2015). Do assimilated drifter velocities improve Lagrangian predictability in an operational ocean model? Mon. Weather Rev. 143, 1822–1832. doi: 10.1175/mwr-d-14-00164.1
Nielsen-Englyst, P., Høyer, J. L., Toudal Pedersen, L., Gentemann, C. L., Alerskans, E., Block, T., et al. (2018). Optimal estimation of sea surface temperature from AMSR-E. Remote Sens. 10:229. doi: 10.3390/rs10020229
Niiler, P. P. (2001). “The world ocean surface circulation,” in Ocean Circulation and Climate, International Geophysics Series, Vol. 77, eds G. Siedler, J. Church, and J. Gould (New York, NY: Academic Press), 193–204. doi: 10.1016/s0074-6142(01)80119-4
Niiler, P. P., Maximenko, N. A., and McWilliams, J. C. (2003a). Dynamically balanced absolute sea level of the global ocean derived from near-surface velocity observations. Geophys. Res. Lett. 30:2164. doi: 10.1029/2003GL018628
Niiler, P. P., Maximenko, N. A., Panteleev, G. G., Yamagata, T., and Olson, D. B. (2003b). Near-surface structure of the Kuroshio extension. J. Geophys. Res. Oceans 108:3193. doi: 10.1029/2002JC001461
Niiler, P. P., Sybrandy, A. S., Bi, K., Poulain, P. M., and Bitterman, D. (1995). Measurements of the water-following capability of holey-sock TRISTAR drifters. Deep Sea Res. Part I Oceanogr. Res. Pap. 42, 1951–1964. doi: 10.1016/0967-0637(95)00076-3
O’Carroll, A. G., Armstrong, E. M., Beggs, H., Bouali, M., Casey, K. S., Corlett, G. K., et al. (2019). Observational needs of sea surface temperature. Front. Mar. Sci. 6:420. doi: 10.3389/fmars.2019.00420
O’Carroll, A. G., Eyre, J. R., and Saunders, R. W. (2008). Three-way error analysis between AATSR, AMSR-E, and in-situ sea surface temperature observations. J. Atmos. Ocean. Technol. 25, 1197–1207. doi: 10.1175/2007JTECHO542.1
Pazan, S. E., and Niiler, P. P. (2001). Recovery of near-surface velocity from undrogued drifters. J. Atmos. Ocean. Technol. 18, 476–489. doi: 10.1175/1520-0426(2001)018<0476:ronsvf>2.0.co;2
Pearlman, J., Bushnell, M., Coppola, L., Karstensen, J., Buttigieg, P. L., Pearlman, F., et al. (2019). Evolving and sustaining ocean best practices and standards for the next decade. Front. Mar. Sci. 6:277. doi: 10.3389/fmars.2019.00277
Peng, S., Qian, Y.-K., Lumpkin, R., Du, Y., Wang, D., and Li, P. (2015). Characteristics of the near-surface currents in the Indian Ocean as deduced from satellite-tracked surface drifters. Part I: Pseudo-Eulerian statistics. J. Phys. Oceanogr. 45, 441–458. doi: 10.1175/jpo-d-14-0050.1
Phillipson, L., and Toumi, R. (2017). Impact of data assimilation on ocean current forecasts in the Angola Basin. Ocean Model. 114, 45–58. doi: 10.1016/j.ocemod.2017.04.006
Pinardi, N., Stander, J., Legler, D. M., O’Brien, K., Boyer, T., Cuff, T., et al. (2019). The joint IOC (of UNESCO) and WMO collaborative effort for met-ocean services. Front. Mar. Sci. 6:410. doi: 10.3389/fmars.2019.00410
Poli, P., Cohuet, J.-B., Kleta, H., and Verboom, H. (2017). E-SURFMAR Operational Service VOS Activities. London: Ninth Session of the JCOMM Ship Observations Team.
Poli, P., Hersbach, H., Dee, D. P., Berrisford, P., Simmons, A. J., Vitart, F., et al. (2016). ERA-20C: an atmospheric reanalysis of the twentieth century. J. Clim. 29, 4083–4097. doi: 10.1175/JCLI-D-15-0556.1
Poli, P., Lucas, M., O’Carroll, A., Le Menn, M., David, A., Corlett, G. K., et al. (2019). The Copernicus surface velocity platform drifter with barometer and reference sensor for temperature (SVP-BRST): genesis, design, and initial results. Ocean Sci. 15, 199–214. doi: 10.5194/os-15-199-2019
Pollard, R. T., and Millard, R. C. (1970). Comparison between observed and simulated wind-generated inertial oscillations. Deep Sea Res. Oceanogr. Abstr. 17, 813–821. doi: 10.1016/0011-7471(70)90043-4
Popinet, S., Smith, M., and Stevens, C. (2004). Experimental and numerical study of the turbulence characteristics of airflow around a research vessel. J. Atmos. Ocean. Technol. 21, 1575–1589. doi: 10.1175/1520-0426(2004)021<1575:eansot>2.0.co;2
Poulain, P.-M., and Centurioni, L. (2015). Direct measurements of world ocean tidal currents with surface drifters. J. Geophys. Res. Oceans 120, 6986–7003. doi: 10.1002/2015JC01081
Poulain, P.-M., Bussani, A., Gerin, R., Jungwirth, R., Mauri, E., Menna, M., et al. (2013). Mediterranean surface currents measured with drifters: from basin to subinertial scales. Oceanography 26, 38–47. doi: 10.5670/oceanog.2013.03
Price, J. F. (1983). Internal wave wake of a moving storm. Part I: scales, energy budget and observations. J. Phys. Oceanogr. 13, 949–965. doi: 10.1175/1520-0485(1983)013<0949:iwwoam>2.0.co;2
Reverdin, G., Morisset, S., Marie, L., Bourras, D., Sutherland, G., Ward, B., et al. (2015). Surface salinity in the North Atlantic subtropical gyre during the STRASSE/SPURS summer 2012 cruise. Oceanography 28, 114–123. doi: 10.5670/oceanog.2015.09
Riser, S., Freeland, H. J., Roemmich, D., Wijffels, S., Troisi, A., Belbéoch, M., et al. (2016). Fifteen years of ocean observations with the global Argo array. Nat. Clim. Change 6, 145–153. doi: 10.1038/NCLIMATE2872
Roach, C. J., Balwada, D., and Speer, K. (2018). Global observations of horizontal mixing from Argo float and surface drifter trajectories. J. Geophys. Res. Oceans 123, 4560–4575. doi: 10.1029/2018JC013750
Roemmich, D., Johnson, G., Riser, S., Davis, R., Gilson, J., Owens, B., et al. (2009). The Argo Program: observing global ocean with profiling floats. Oceanography 22, 34–43. doi: 10.1029/2018JC014059
Rühs, S., Zhurbas, V., Koszalka, I. M., Durgadoo, J. V., and Biastoch, A. (2018). Eddy diffusivity estimates from Lagrangian trajectories simulated with ocean models and surface drifter data—a case study for the Greater Agulhas System. J. Phys. Oceanogr. 48, 175–196. doi: 10.1175/JPO-D-17-0048.1
Saha, S., Moorthi, S., Pan, H.-L., Wu, X., Wang, J., Nadiga, S., et al. (2010). The NCEP climate forecast system reanalysis. Bull. Am. Meteorol. Soc 91, 1015–1057. doi: 10.1175/2010BAMS3001.1
Schmidt, K. M., Swart, S., Reason, C., and Nicholson, S.-A. (2017). Evaluation of satellite and reanalysis wind products with in-situ Wave Glider wind observations in the Southern Ocean. J. Atmos. Ocean. Technol. 34, 2551–2568. doi: 10.1175/JTECH-D-17-0079.1
Schmitt, R. W., Asher, W., Bingham, F., Carton, J., Centurioni, L., Farrar, T., et al. (2015). From salty to fresh—Salinity processes in the upper-ocean regional study-2 (SPURS-2): diagnosing the physics of a rainfall-dominated salinity minimum. Oceanography 28, 150–159. doi: 10.5670/oceanog.2015.15
Smith, S. R., Alory, G., Andersson, A., Asher, W., Baker, A., Berry, D. I., et al. (2019). Ship-based contributions to global ocean, weather, and climate observing systems. Front. Mar. Sci. 6:434. doi: 10.3389/fmars.2019.00434
Swart, S., Gille, S. T., Delille, B., Josey, S., Mazloff, M., Newman, L., et al. (2019). Constraining Southern Ocean air-sea-ice fluxes through enhanced observations. Front. Mar. Sci. 6:421. doi: 10.3389/fmars.2019.00421
Sykulski, A. M., Olhede, S. C., Lilly, J. M., and Danioux, E. (2016). Lagrangian time series models for ocean surface drifter trajectories. J. R. Stat. Soc. Ser. C 65, 29–50. doi: 10.1111/rssc.12112
Theocharous, E., Fox, N., Göttsche, F., Høyer, J. L., Wimmer, W., et al. (2016). Fiducial Reference Measurements for Validation of Surface Temperature from Satellites (FRM4STS) Technical Report 1: Procedures and Protocols for the Verification of TIR FRM Field Radiometers and Reference Blackbody Calibrators. ESA Contract No. 4000113848_15I-LG. Teddington: National Physical Laboratory.
Villas Bôas, A. B., Ardhuin, F., Ayet, A., Bourassa, M. A., Brandt, P., Chapron, B., et al. (2019). Integrated Observations of Global Surface Winds, Currents, and Waves: Requirements and Challenges for the Next Decade. Front. Mar. Sci. 6:425. doi: 10.3389/fmars.2019.00425
Wanninkhof, R., Pickers, P. A., Omar, A. M., Sutton, A., Murata, A., Olsen, A., et al. (2019). A surface ocean CO2 reference network, SOCONET and associated marine boundary layer CO2 measurements. Front. Mar. Sci. 6:400. doi: 10.3389/fmars.2019.00400
Weller, R. A., Baker, D. J., Glackin, M. M., Roberts, S. J., Schmitt, R. W., Twigg, E. S., et al. (2019). The challenge of sustaining ocean observations. Front. Mar. Sci. 6:105. doi: 10.3389/fmars.2019.00105
Wimmer, W., Robinson, I. S., and Donlon, C. J. (2012). Long-term validation of AATSR SST data products using shipborne radiometry in the Bay of Biscay and English Channel. Remote Sens. Environ. 116, 17–31. doi: 10.1016/j.rse.2011.03.022
Wolter, K., and Timlin, M. S. (2011). El Nino/Southern Oscillation behaviour since 1871 as diagnosed in an extended multivariate ENSO index (MEI.ext). Int. J. Climatol. 31, 1074–1087. doi: 10.1002/joc.2336
Wong, E. W., and Minnett, P. J. (2016a). Retrieval of the ocean skin temperature profiles from measurements of infrared hyperspectral radiometers—part I: derivation of an algorithm. IEEE Trans. Geosci. Remote Sens. 54, 1879–1890. doi: 10.1109/TGRS.2015.2483746
Wong, E. W., and Minnett, P. J. (2016b). Retrieval of the ocean skin temperature profiles from measurements of infrared hyperspectral radiometers—part II: field data analysis. IEEE Trans. Geosci. Remote Sens. 54, 1891–1904. doi: 10.1109/TGRS.2015.2501425
Wong, E. W., and Minnett, P. J. (2018). The response of the ocean thermal skin layer to variations in incident infrared radiation. J. Geophys. Res. Oceans 123:19. doi: 10.1002/2017JC013351
Woodruff, S. D., Worley, S. J., Lubker, S. J., Ji, Z., Freeman, J. E., Berry, D. I., et al. (2011). ICOADS release 2.5: extensions and enhancements to the surface marine meteorological archive. Int. J. Climatol. 31, 951–967. doi: 10.1002/joc.2103
Wunsch, C., and Stammer, D. (1997). Atmospheric loading and the oceanic “inverted barometer” effect. Rev. Geophys. 35, 79–107. doi: 10.1029/96RG03037
Xu, F., and Ignatov, A. (2010). Evaluation of in-situ sea surface temperatures for use in the calibration and validation of satellite retrievals. J. Geophys. Res. Oceans 115:C09022. doi: 10.1029/2010JC006129
Xu, F., and Ignatov, A. (2014). In-situ SST quality monitor. J. Atmos. Ocean. Technol. 31, 164–180. doi: 10.1175/JTECH-D-13-00121.1
Xu, F., and Ignatov, A. (2016). Error characterization in iQuam SSTs using triple collocations with satellite measurements. Geophys. Res. Lett. 43, 10826–10834. doi: 10.1002/2016GL070287
Zhang, D., Cronin, M. F., Lin, X., Inoue, R., Fassbender, A., Bishop, S., et al. (2017). Observing air–sea interaction in the western boundary currents and their extension regions: considerations for OceanObs 2019. CLIVAR Variat. 15, 23–30.
Keywords: global in situ observations, air-sea interface, essential climate and ocean variables, climate variability and change, weather forecasting, SVP drifters
Citation: Centurioni LR, Turton J, Lumpkin R, Braasch L, Brassington G, Chao Y, Charpentier E, Chen Z, Corlett G, Dohan K, Donlon C, Gallage C, Hormann V, Ignatov A, Ingleby B, Jensen R, Kelly-Gerreyn BA, Koszalka IM, Lin X, Lindstrom E, Maximenko N, Merchant CJ, Minnett P, O’Carroll A, Paluszkiewicz T, Poli P, Poulain P-M, Reverdin G, Sun X, Swail V, Thurston S, Wu L, Yu L, Wang B and Zhang D (2019) Global in situ Observations of Essential Climate and Ocean Variables at the Air–Sea Interface. Front. Mar. Sci. 6:419. doi: 10.3389/fmars.2019.00419
Received: 30 October 2018; Accepted: 05 July 2019;
Published: 30 August 2019.
Edited by:
Minhan Dai, Xiamen University, ChinaReviewed by:
Scott Doney, University of Virginia, United StatesNadia Pinardi, University of Bologna, Italy
Copyright © 2019 Centurioni, Turton, Lumpkin, Braasch, Brassington, Chao, Charpentier, Chen, Corlett, Dohan, Donlon, Gallage, Hormann, Ignatov, Ingleby, Jensen, Kelly-Gerreyn, Koszalka, Lin, Lindstrom, Maximenko, Merchant, Minnett, O’Carroll, Paluszkiewicz, Poli, Poulain, Reverdin, Sun, Swail, Thurston, Wu, Yu, Wang and Zhang. This is an open-access article distributed under the terms of the Creative Commons Attribution License (CC BY). The use, distribution or reproduction in other forums is permitted, provided the original author(s) and the copyright owner(s) are credited and that the original publication in this journal is cited, in accordance with accepted academic practice. No use, distribution or reproduction is permitted which does not comply with these terms.
*Correspondence: Luca R. Centurioni, lcenturioni@ucsd.edu
†Present address: Theresa Paluszkiewicz, Octopus Ocean Consulting LLC, Oak Hill, VA, United States