Doctor Drone: Non-invasive Measurement of Humpback Whale Vital Signs Using Unoccupied Aerial System Infrared Thermography
 Travis W. Horton1*
  Nan Hauser2,3
  Shannon Cassel4 K. Frederika Klaus4
  Ticiana Fettermann2,3,5 Nicholas Key6
- 1Department of Geological Sciences, University of Canterbury, Christchurch, New Zealand
- 2Center for Cetacean Research and Conservation, Avarua, Cook Islands
- 3Cook Islands Whale Research, Avarua, Cook Islands
- 4Skidmore College, Saratoga Springs, New York, NY, United States
- 5Institute for Applied Ecology New Zealand, Auckland University of Technology, Auckland, New Zealand
- 6Department of Geography, University of Canterbury, Christchurch, New Zealand
Measuring and monitoring the behavior and biomedical condition of free-ranging whales remains a fundamental challenge in cetacean science and conservation. Advances in unoccupied aerial systems (UAS) and infrared thermography (IRT) create unprecedented opportunities to fill these knowledge gaps and advance our understanding of how cetaceans interact with the environment. Here, we show that non-invasive UAS-IRT systems, deployed from shore-based positions in a humpback whale (Megaptera novaeangliae) calving ground, can be used to document rarely observed whale behaviors and to quantify biomedical vital signs, including blowhole and dorsal fin skin temperature, respiration rate, and heart rate. Our findings demonstrate: (1) prolonged (>3 h) logging behavior by a mother-calf pair located ∼550 m offshore; (2) that the calf’s respiration rate (∼3 breaths per minute) was six times higher than its mother’s (∼0.5 breaths per minute); (3) that the calf’s blowholes were ∼1.55°C warmer than adjacent ocean water and that the mother’s blowholes were ∼2.16°C warmer than adjacent ocean water; (4) that the mother’s dorsal fin included four infrared (IR) hot-spots, each separated by ∼20 cm in horizontal distance, that ranged between 1 and 2°C warmer than adjacent ocean water; (5) a significant (p <<0.05; wavelet analysis) temporal cyclicity in the hottest of the mother’s dorsal fin hot-spots consistent with cardiovascular blood flow pumped at an apneic heart rate of ∼9.3 beats per minute. Despite these novel results, there remain several key limitations to UAS-IRT, including its: sensitivity to environmental conditions and animal behavior; equipment costs and associated risks; potential regulatory restrictions; time-intensive nature of IR data processing; factors that can impact data quality, such as imaging angle and sensor accuracy. Future opportunities created by the UAS-IRT results we report center on the potential to couple non-invasive behavioral and physiological monitoring tools, quantify cetacean response to prolonged environmental change and acute disturbances, and extend UAS-IRT applications to cover a wider range of environmental and behavioral contexts. Considering the small sample size of the dataset we report, application of UAS-IRT to live-stranded and captive cetaceans, where environmental and cetacean conditions can be independently measured, is of paramount importance.
Introduction
Biomedical vital signs, including respiration rate, body temperature, and heart rate are important indicators of mammalian health and physiological condition. Although technological advances in infrared thermography (IRT) and signal processing have facilitated measurement of human vital signs (e.g., Sun et al., 2017), such techniques are not yet widely applied to marine mammals. Although prior marine mammal research has used IRT to measure the dorsal fin surface temperatures of free-swimming bottlenose dolphins (Tursiops truncatus) during small boat surveys (Barbieri et al., 2010) and thermal reference points on captive marine mammals (Melero et al., 2015), airborne IRT has been limited to estimating pinniped colony size using both aircraft (Udevitz et al., 2008) and unoccupied aerial systems (UAS; Seymour et al., 2017). Thus, our overarching goal was to explore the potential utility of UAS-IRT technology as a non-invasive tool for quantifying wild cetacean behaviors and biomedical vital signs.
Here, we show that IRT sensors deployed on UAS can be used to quantify the respiration rate, skin temperature and heart rate of free-ranging humpback whales (Megaptera novaeangliae). Remote sensing of cetacean vital signs using UAS-IRT creates novel opportunities to assess and monitor the condition of both free-ranging whales and whales impacted by entanglement, stranding, or deliberate human engagement (e.g., whale watching; scientific research). For example, the respiration rate, temperature and heart rate data gained from UAS-IRT creates opportunities to deliver biomedical profiling of individual cetaceans across behavioral state transitions, including the potential for tachycardia during periods of stress (e.g., entanglement, stranding, invasive human engagements) and bradycardia during rest periods and prolonged diving. When combined with UAS derived estimates of body size of photo-identified individuals (e.g., Dawson et al., 2017), UAS-IRT biomedical monitoring has the potential to enable longitudinal profiling of cetacean health and condition through time.
UAS-IRT techniques present distinct advantages due to their non-invasive nature. A large body of research demonstrates the changes in cetacean behavior that occur when vessels approach (Corkeron, 1995; Richter et al., 2006; Schaffar et al., 2013); widely embraced international guidelines establish clear limitations on appropriate vessel traffic within 300 m of any whale (Carlson, 2012). When compared to boats, UAS reduce the impacts of human disturbances on cetaceans (Fettermann et al., 2019). By minimizing the whale’s flight response to engagement, drones further afford opportunities to more intimately view and document rarely observed behaviors, such as neonatal mother-calf interactions. Significant progress in the use of drones in marine mammal research is already happening (e.g., Dawson et al., 2017; Pirotta et al., 2017; Torres et al., 2018) and further innovative applications will no doubt be developed.
To explore the potential use of shore-based UAS-IRT technology as a means of quantifying humpback whale vital signs, we deployed a gimbaled radiometric DJI Zenmuse XT infrared (IR) sensor on a DJI Matrice 200 drone in Rarotonga, Cook Islands, on the afternoon of August 26, 2018. The first goal of our research was to test the hypothesis: low zenith angle (i.e., near vertical) thermographic images of open humpback whale blowholes and dorsal fins appear as positive brightness temperature anomalies (BTA) relative to adjacent ocean water. This is an important hypothesis to test as the brightness temperature measured by an IR sensor depends on the angle between the target object’s surface and the IR sensor (e.g., uncooled microbolometer). For example, cetacean blows/spouts will appear as relatively warm IR features when measured from oblique (i.e., near horizontal) angles but relatively cold IR features when measured from perpendicular (i.e., near vertical) angles (Horton et al., 2017, this study). Thus, robust measurement of cetacean thermal reference points, including blowholes (Melero et al., 2015), requires careful consideration of the relationship between imaging angle and emissivity (Horton et al., 2017). Our study helps to overcome this challenge through quantification of cetacean brightness temperatures from low zenith angles. A second goal of our research was to explore the possibility that high frame rate UAS-IRT was capable of capturing cyclical changes in whale dorsal fin temperatures consistent with cardiovascular circulation (e.g., Sun et al., 2017). This is an important goal to pursue, as there are currently no conventional approaches for measuring cetacean heart rates in the wild.
The data we present here establishes a novel approach to quantifying marine mammal respiration rate, skin temperature, and heart rate using non-invasive UAS-IRT technology. However, realizing the utility of this new approach as a means of quantifying cetacean vital signs requires significant further research, including: (1) expansion of preliminary UAS-IRT marine mammal datasets; (2) development and refinement of UAS-IRT data processing tools; (3) studies designed to identify optimal operational protocols and field methods for different species, and species behaviors, across a variety of environmental contexts.
Materials and Methods
On the afternoon of August 26, 2018 (Cook Island Time, CKT) a logging female humpback whale and her surface-active < 1 month old calf (Figure 1) were spotted from an onshore position (-21.20308°S; -159.76245°W) on the north coast of Rarotonga, Cook Islands, approximately 4.45 km east of Rarotonga International Airport. Following an initial period of observation and environmental assessment (ca. 14:30–15:00), we decided to initiate UAS imaging of the mother-calf pair. During the initial observation period, and throughout the UAS imaging, tripod mounted digital visible (Fujifilm X-T2) and IR (FLIR A615) videographic cameras were used to document the time, location, and surface behavior of both whales (e.g., Figures 1C,D).
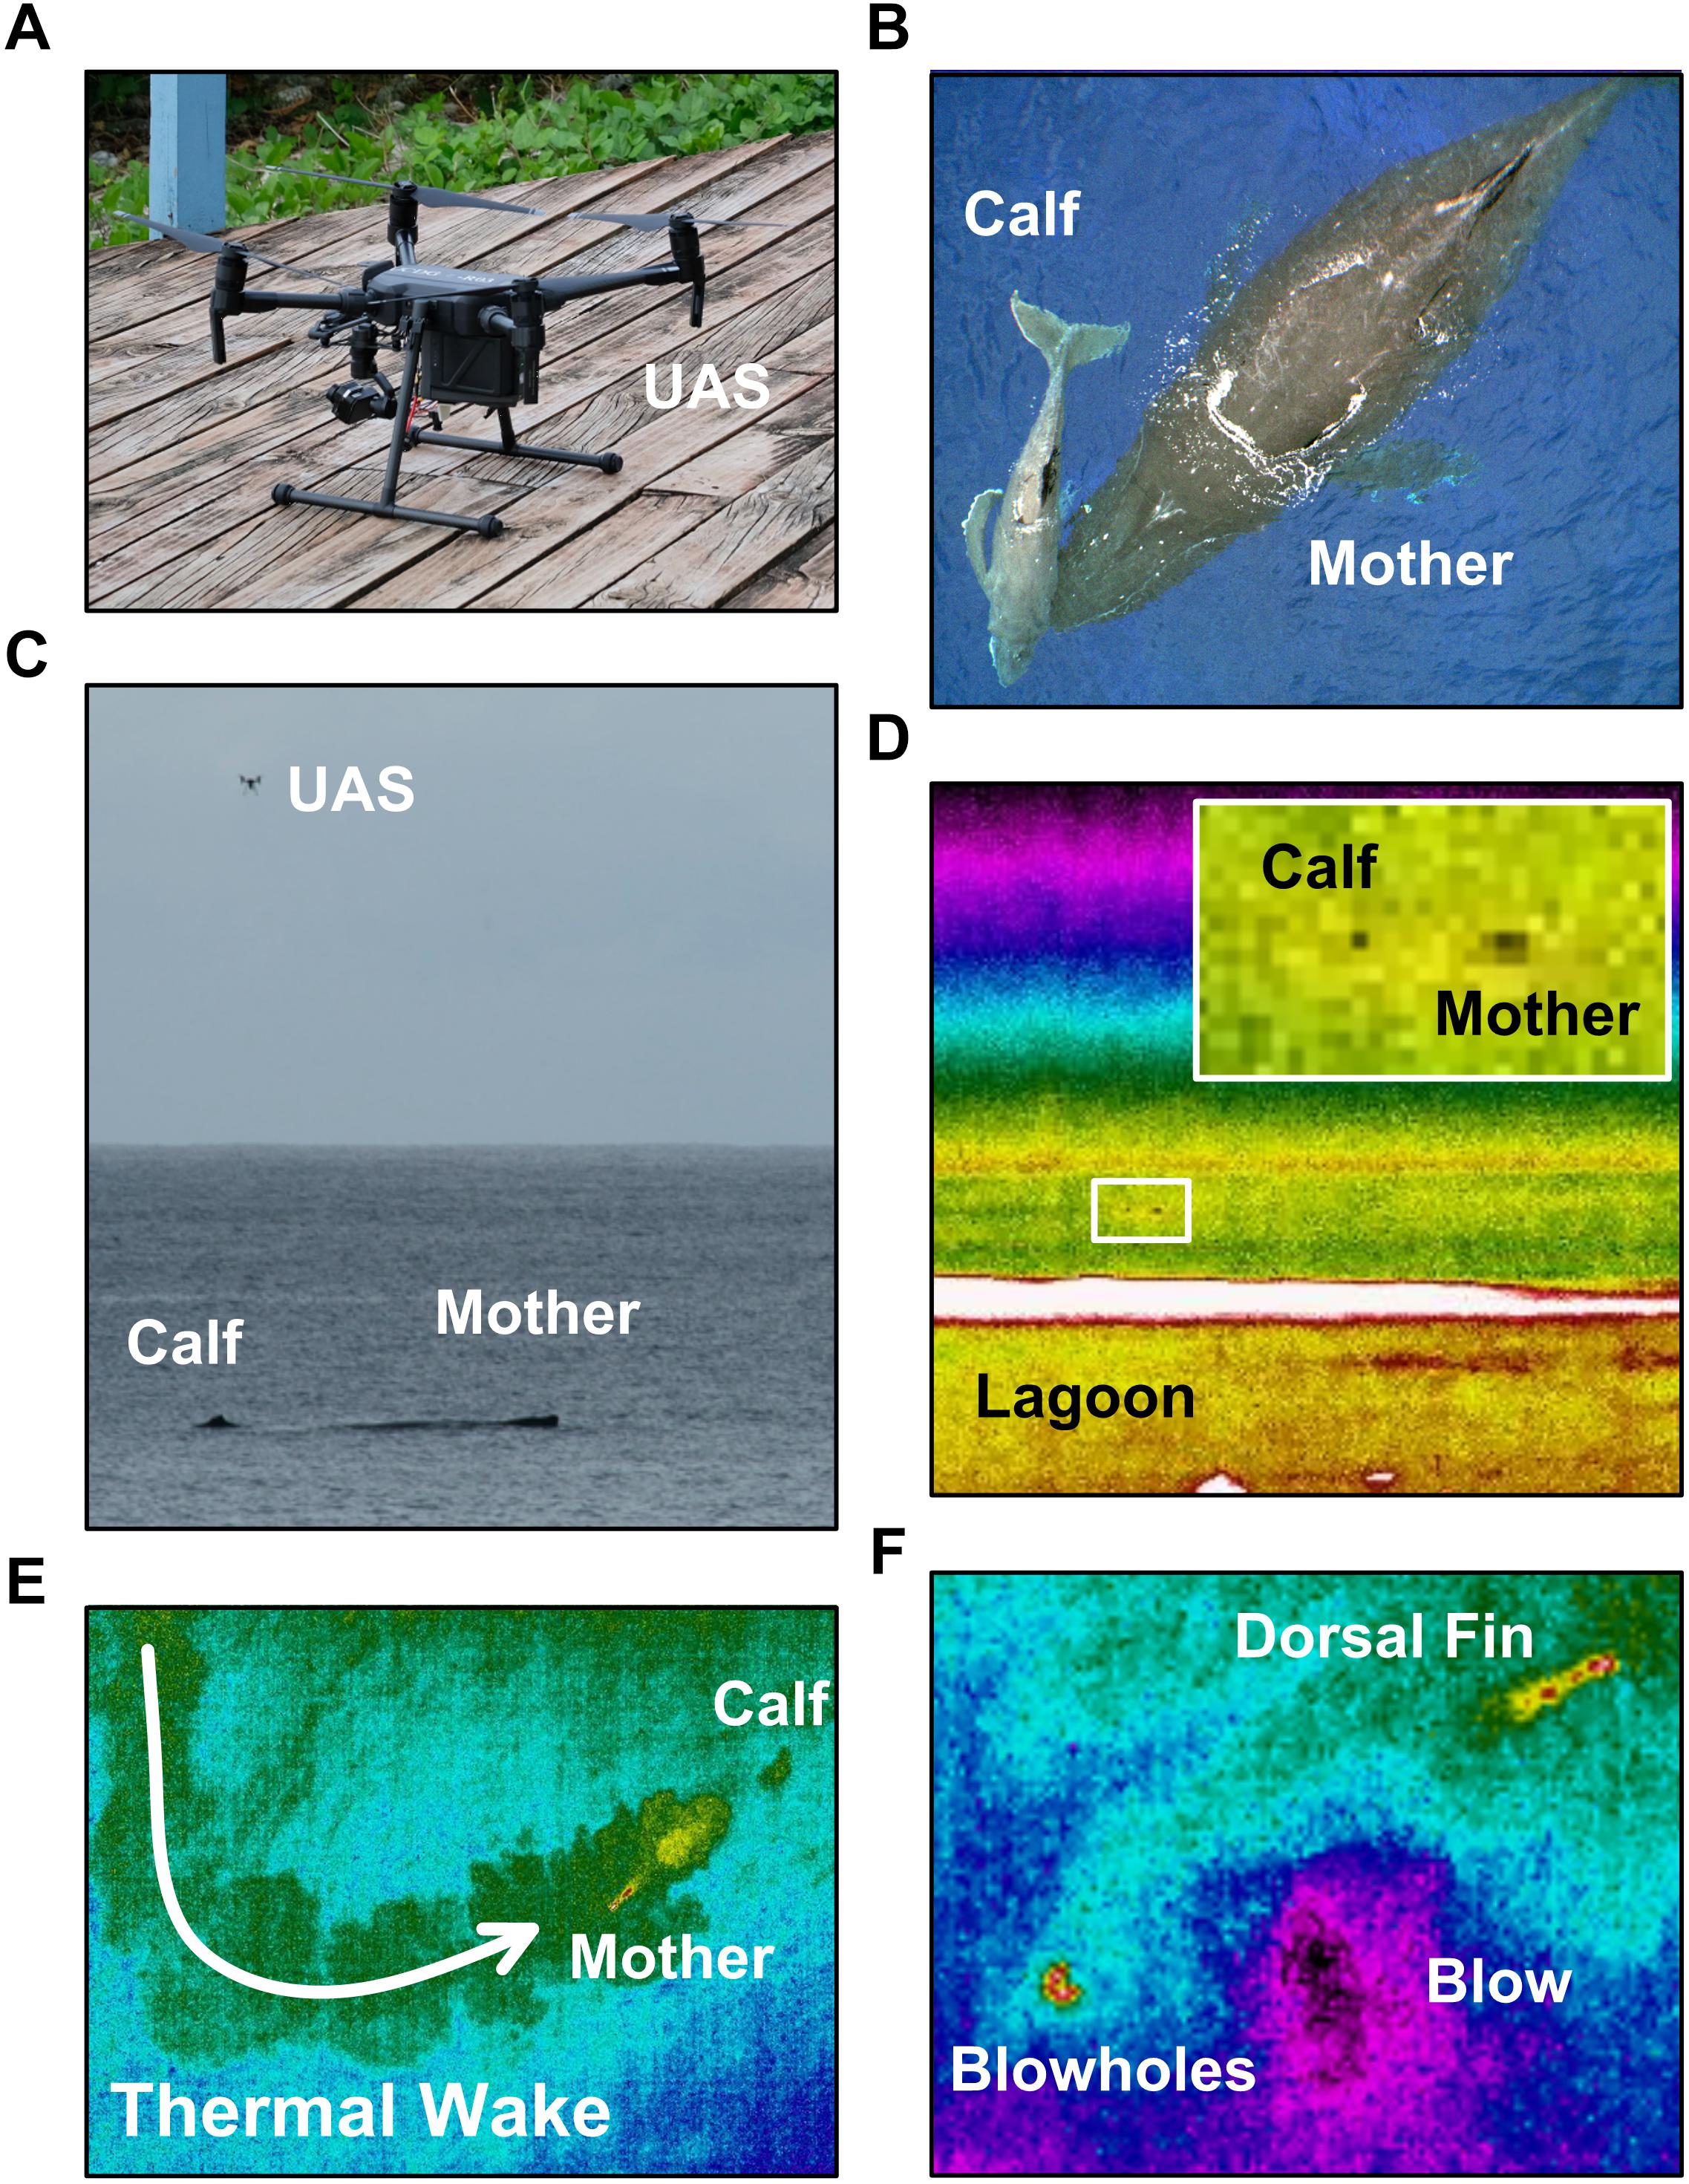
Figure 1. Visible and infrared spectrum images of: the DJI Matrice 200 unoccupied aerial system (UAS; i.e., drone) used in this study (A); 20 m altitude aerial visible spectrum image of a logging mother-calf humpback whale pair (B); shore-based Fujifilm XT2 visible spectrum image of the humpback calf, its mother, and the UAS taken with a 200 mm telephoto lens (C); shore-based FLIR A615 infrared spectrum image of the humpback whale mother-calf pair (D); 20 m altitude aerial Zenmuse XT infrared spectrum image of the mother-calf pair’s thermal wake and mother’s dorsal fin (E); 20 m altitude aerial Zenmuse XT infrared spectrum image of the mother blowholes, blow spout, and dorsal fin (F).
First, we collected multispectral images (e.g., Figure 1B) using a MicaSense RedEdge 3 camera deployed on a DJI Matrice 200 UAS. Second, we performed two sequential ∼15 min duration UAS-IRT flights between 16:08 and 16:46 on August 26, 2018, Cook Island Time (CKT; between 2:08 and 2:46 on August 27, 2018 UTC). Researchers aboard a Cook Islands Whale Research vessel were able to record underwater images of the mother-calf pair approximately 45 min after completion of the second UAS-IRT flight ca. 17:30 CKT using a pole-mounted GoPro Hero 4 underwater digital video camera.
Radiometric IR images and non-radiometric IR videos of the mother-calf pair were collected during both UAS-IRT flights using a gimbaled radiometric DJI Zenmuse XT IR sensor mounted on a DJI Matrice 200 UAS (see Supplementary Video). Radiometric IR images assign brightness temperatures, in degrees, to each image pixel. In contrast, non-radiometric IR videos record brightness temperatures, in relative intensity units (0–255), to each image pixel. Due to the very large file size radiometric IR video files, the UAS-mounted XT IR sensor was only able to record radiometric still images and non-radiometric videos. Our first UAS-IRT flight was flown at 20 m above sea level, whereas the second flight was flown between 20 and 60 m above sea level. The mother-calf pair was located 520–560 m from shore during both flights, approximately 380 m seaward of Rarotonga’s fringing reef crest.
The radiometric and non-radiometric IR data we collected were analyzed using a variety of software tools. Blowhole and dorsal fin brightness temperatures were extracted from radiometric images using FLIR Tools+ (FLIR Systems, Inc.). BTA (i.e., the observed temperature difference between the target object and the background ocean surface) were determined using the technique described by Horton and others (2017). In brief, the line measurement tool in FLIR Tools+ was used to extract both target feature (i.e., blowhole or dorsal fin) and background ocean surface temperature profiles. Target feature measurement lines were both: (1) parallel to the long-axis of the feature; (2) drawn through the feature’s maximum brightness temperature. Similar length background ocean surface measurement lines were drawn parallel to the target feature measurement lines, enabling testing of the hypothesis that blowholes and dorsal fins appear as positive IR anomalies relative to ocean water.
To gain quantitative high temporal resolution data of the mother whale’s dorsal fin IR hot-spots, individual frames were extracted from 30 Hz non-radiometric IR videos using video processing software (e.g., FFmpeg, FFmpeg project; VLC, VideoLAN Organization) at 0.1 s intervals. Python (Python Software Foundation) was then used to convert the extracted image files to ASCII formatted intensity values (0–255) at the individual pixel scale. Local pixel intensity maxima (i.e., thermal hot-spots) at the rear of the mother whale’s dorsal fin were identified in each ASCII formatted data file, and the average brightness temperature was calculated for a 5 pixel × 5 pixel array centered on the pixel with the highest brightness temperature value. Background ocean surface average brightness temperatures were also calculated for a 5 pixel × 5 pixel array located at the edge of each extracted image and in the same pixel row as the rear-most dorsal fin hot-spot. Dorsal fin hot-spot BTA were then calculated by subtracting the hot-spot’s average brightness temperature from the background ocean surface average brightness temperature for individual image frames. We have included all of the software command line codes used in this research as Supplementary Material to this article (see Supplementary Data Analysis Codes).
Using the technique applied to similar IRT signals observed in human skin (Chekmenev et al., 2005), we performed both spectral and wavelet time-series analyses on evenly spaced (10 Hz) non-radiometric BTA values for the mother whale’s rear-most dorsal fin hot-spot using PAST (Hammer et al., 2001). In brief, spectral analysis refers to least-squares fitting of different frequency sinusoids to a time-series of equally spaced data points. Thus, spectral analysis is a form of Fourier analysis (i.e., harmonic decomposition) that identifies any stationary frequencies (i.e., periods) that significantly contribute to the variance in the time-series dataset. For more detailed descriptions of spectral analysis, see Platt and Denman (1975) and Press et al. (2007). Wavelet analysis, in contrast, estimates a time-series dataset’s spectral characteristics as a function of time (i.e., unlike spectral analysis, wavelet analysis is non-stationary). Thus, wavelet analysis performs signal decomposition at localized time-scales across the entirety of a time-series record. For a more detailed description of wavelet analysis, see Torrence and Compo (1998).
Results
Whale Behavior
Our onshore, aerial and at-sea datasets include several rarely described observations of humpback whale mother and newborn calf behavior.
First, the mother remained at the surface, resting if not sleeping (i.e., logging), throughout the 3-h observation period (14:30–17:30, August 26, 2018, CKT). Underwater images collected at the end of our UAS observation period reveal that the mother’s eyes were closed and that her fluke was hanging in a ∼45° downward position. Remarkably, the mother’s dorsal fin remained above the ocean’s surface for nearly the entire 3-h observation period. Excluding breathing, the mother exhibited no other surface behavior for at least 3 h.
Second, while the mother logged, the calf remained active. In contrast to the mother, the calf’s dorsal fin was below the ocean’s surface during the majority of the observation period. Overall, the calf’s behavior was entirely normal, including dorsal fin raises immediately following breathing and occasional slapping of one or the other pectoral fins on the ocean’s surface. Although the calf remained active throughout the afternoon, we did not observe any fluking behavior or breaches. Our UAS multispectral and IR imaging reveals that the calf showed a notable preference for remaining immediately in front and to the right of its mother’s head (e.g., Figure 1). We have no evidence demonstrating that the calf was ever more than a few meters away from this right-front maternal position throughout the 3-h observation period.
Third, UAS-IRT images demonstrate that the mother followed a slow (ca. 0.1 m sec-1) counter-clockwise ∼30 m diameter circular movement across a 13-min period between 16:10 and 16:23. It is impossible to determine if this slow circling behavior was a deliberate action performed by the mother, or the consequence of the calf’s positioning on its mother’s right side.
Fourth, the mother and calf pair remained within 50 m of -21.198287°S; -159.764114°W during both of our UAS-IRT flights. Such stationary behavior is not well documented for humpback whales. In this particular instance, the lack of movement would logically appear to be associated with the mother whale’s resting behavior at the ocean’s surface. The extent to which such rests occur in humpback whales is not well known, a knowledge gap that is likely reinforced by traditional vessel-based whale observation. We are not aware of any other animals or vessels within the immediate proximity (i.e., 500 m) of the mother-calf pair throughout our 3-h observation period.
For this study, we deliberately decided to keep our at-sea research vessel several kilometers distant, off the west coast of Rarotonga, for the duration of our UAS flights and shore-based imaging. This precaution was taken in order to minimize the risk of disturbing the mother-calf pair. When the vessel did arrive in the area ca. 17:30, it was producing no wake and the engine was put into neutral >100 m away from both whales. Despite these conservative and permitted whale research engagement protocols, the mother-calf pair started moving off to the west, albeit slowly (ca. 0.5 m sec-1) and in the direction from which the whale research vessel arrived, within minutes of the research vessel’s arrival in the area. Neither whale exhibited any notable change in behavior during the ∼2-h period in which we performed our UAS flights.
Vital Signs
The radiometric and non-radiometric data recorded during our UAS-IRT flights enabled quantification of humpback whale respiration rate, skin temperature at the blowholes and dorsal fin, and heart rate. Respiration rate was easily quantified for both mother and calf due to the relatively low brightness temperature of ocean water droplets present in exhaled blows (i.e., spouts) and the relatively high brightness temperatures of their open blowholes. Blowhole and dorsal fin skin temperatures, for both mother and calf, were quantified from radiometric UAS-IRT images using the spot and line measurement tools included in FLIR Tools+. Heart rate was the most challenging vital sign to measure as it required significant data processing, including conversion of hundreds of image frames from non-radiometric UAS-IRT video to ASCII formatted data files for time-series analysis.
The UAS-IRT images we collected indicate that the calf’s respiration rate was ∼6 times higher than its mother’s. Mother and calf respiration rates during UAS-IRT flight 1 were 0.64 (± 0.2, 1σ) breaths per minute, and 3.0 (± 1.54, 1σ) breaths per minute, respectively. Similar values, of 0.48 (± 0.16, ± 1σ, mother) and 3.0 (± 1.61, ± 1σ, calf), were observed during the UAS-IRT flight 2, approximately 20 min later in the afternoon. Blow spouts were not always recognizable in shore-based visible spectrum videos recorded using a 250 mm telephoto lens due to the absence of ocean water trapped behind the nasal dam and above the blowholes. This was particularly the case for the calf. Thus, the respiration rates we report correspond with the average time interval separating sequential openings of the blowholes, an easily recognized brightness temperature anomaly in both radiometric and non-radiometric UAS-IRT images.
No significant difference in respiration rate (p > 0.05; student’s t-test, two-tailed) was observed between the two UAS-IRT flights with respect to the same individual. However, the calf’s respiration rate was significantly faster (p < 0.05; student’s t-test, two-tailed) than its mother’s respiration rate during both flights.
Our UAS-IRT images enabled quantification of the mother humpback whale’s skin temperatures at both of her blowholes (Figure 2) and along her dorsal fin (Figure 3). In contrast, only blowhole temperatures were quantified for the calf (Figure 2) due to the absence of any recognizable thermal anomalies associated with its dorsal fin.
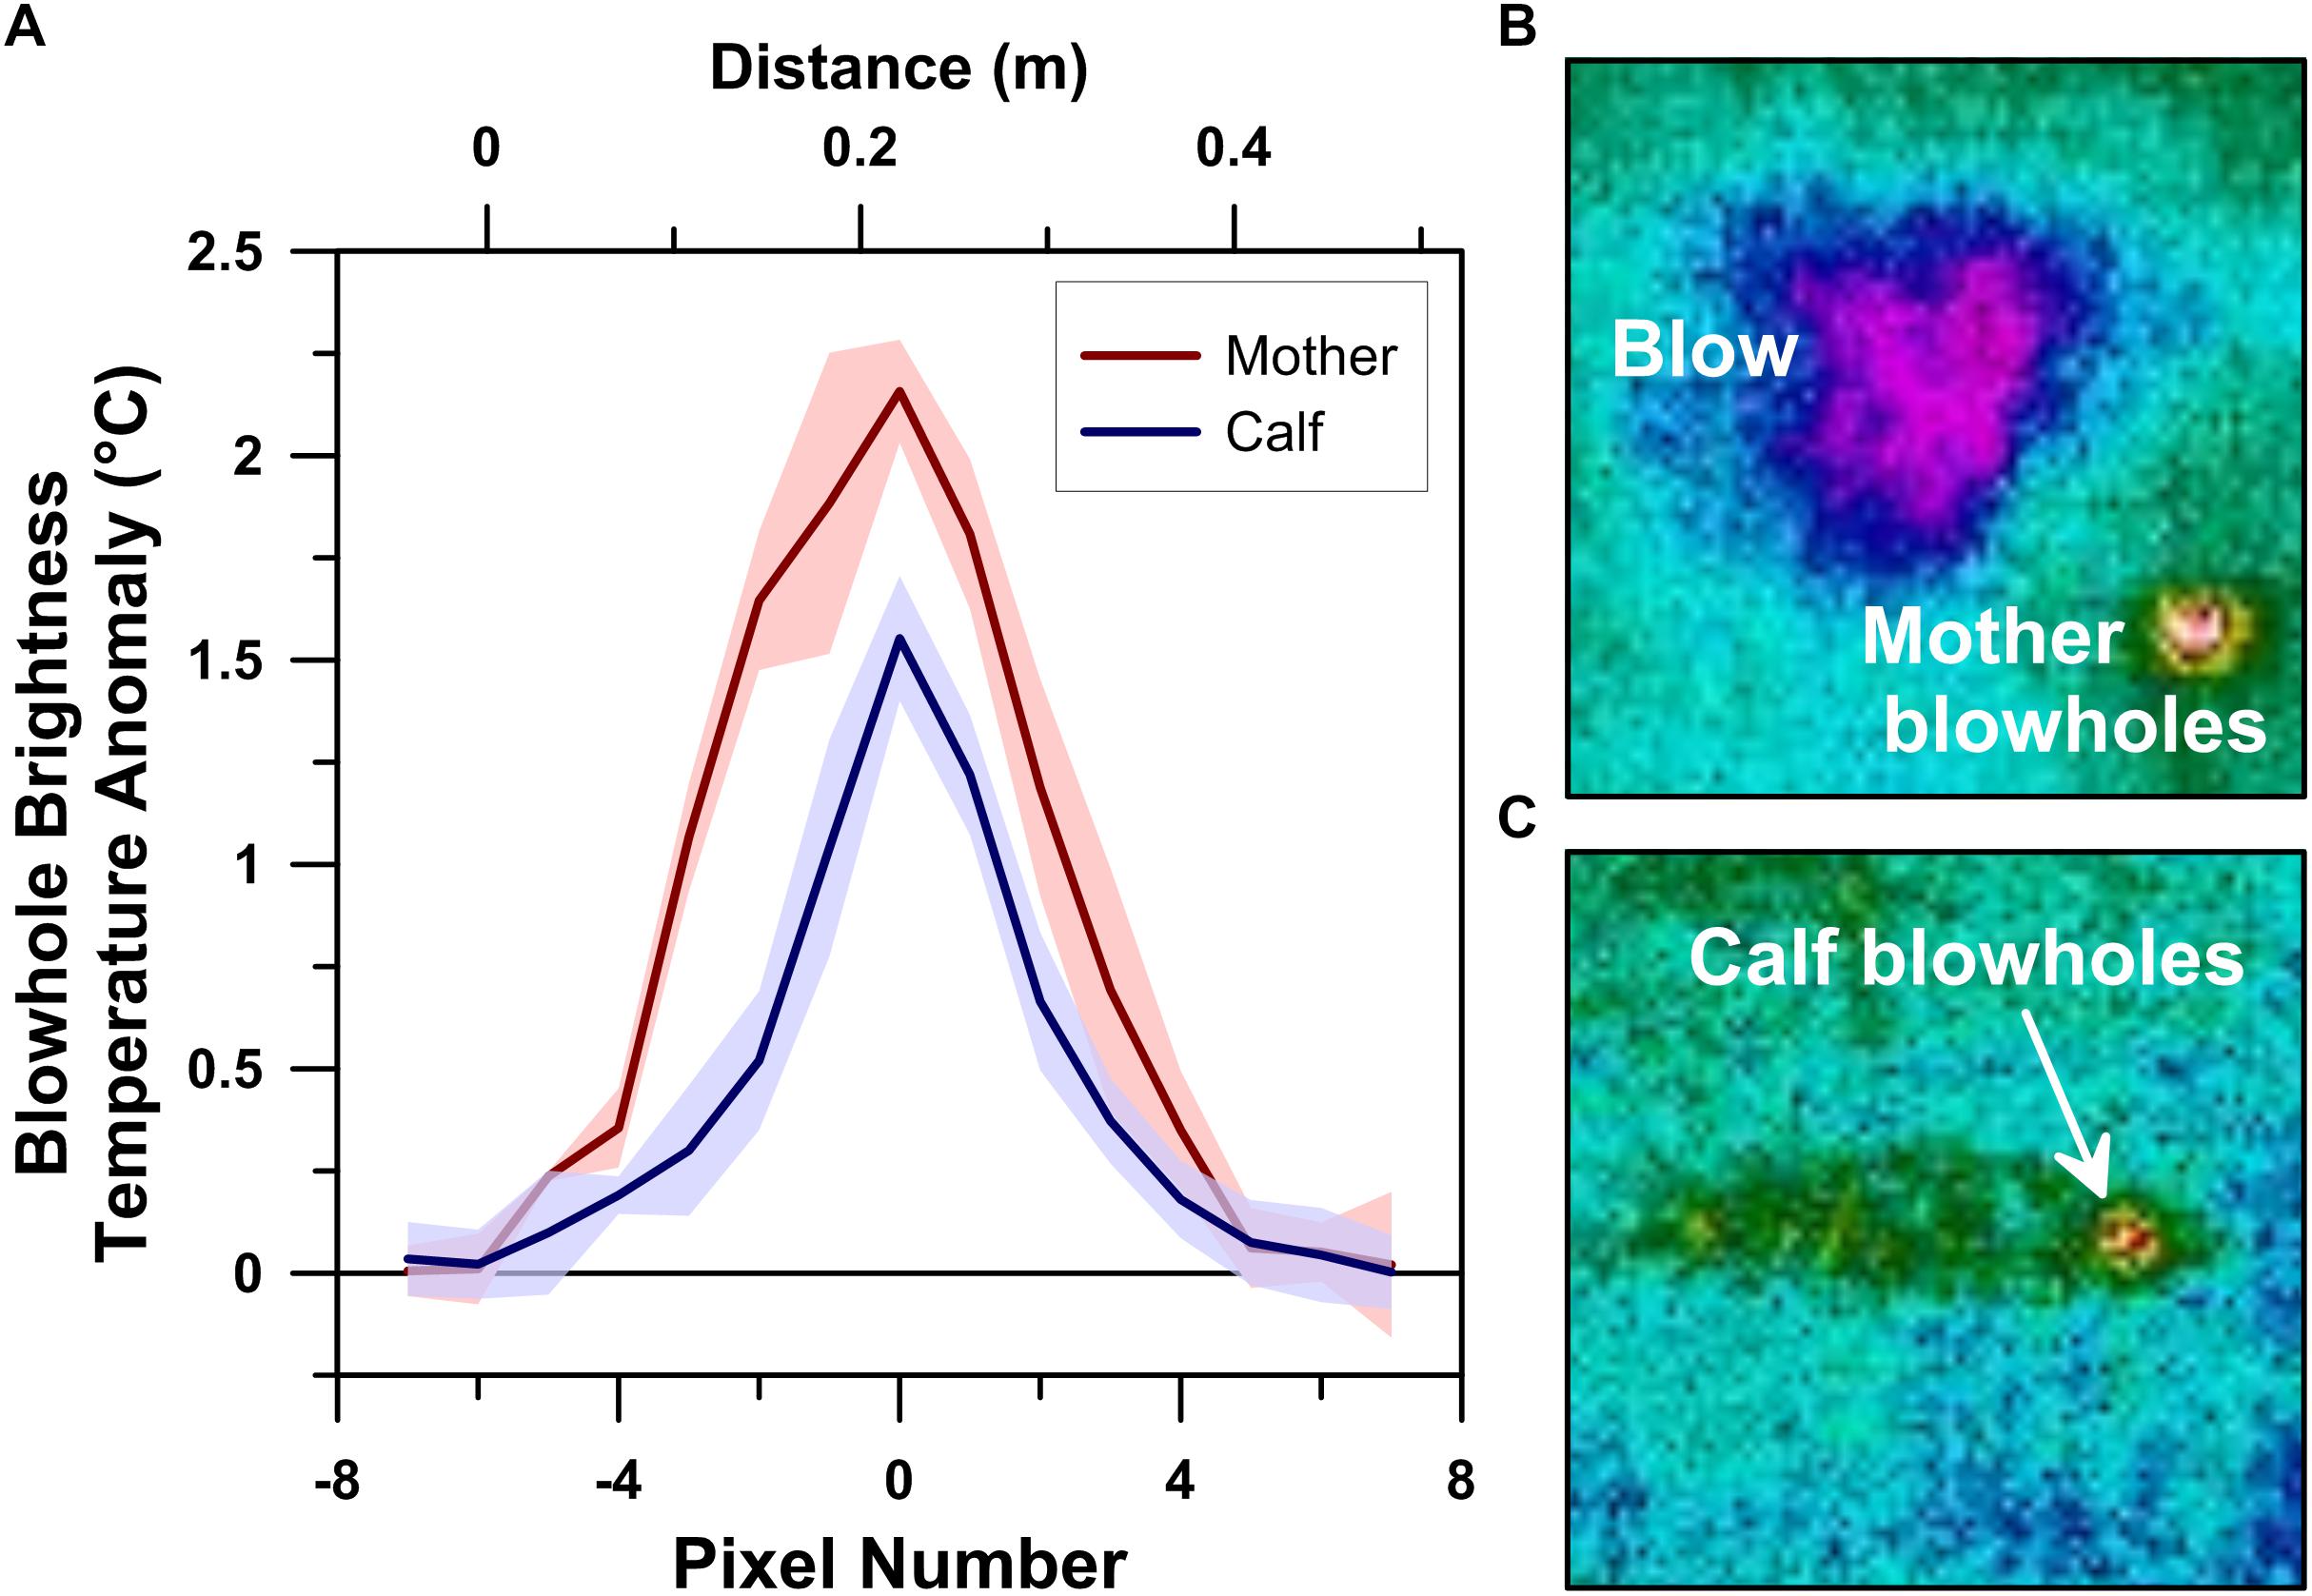
Figure 2. Thermographic blowhole profiles of a logging humpback whale mother-calf pair measured using a drone-deployed radiometric infrared camera (A). Infrared spectrum images of the mother whale’s lanceolate (i.e., tapered oval) blowholes and blow (B) and the calf’s ovate blowhole/nasal area (C).
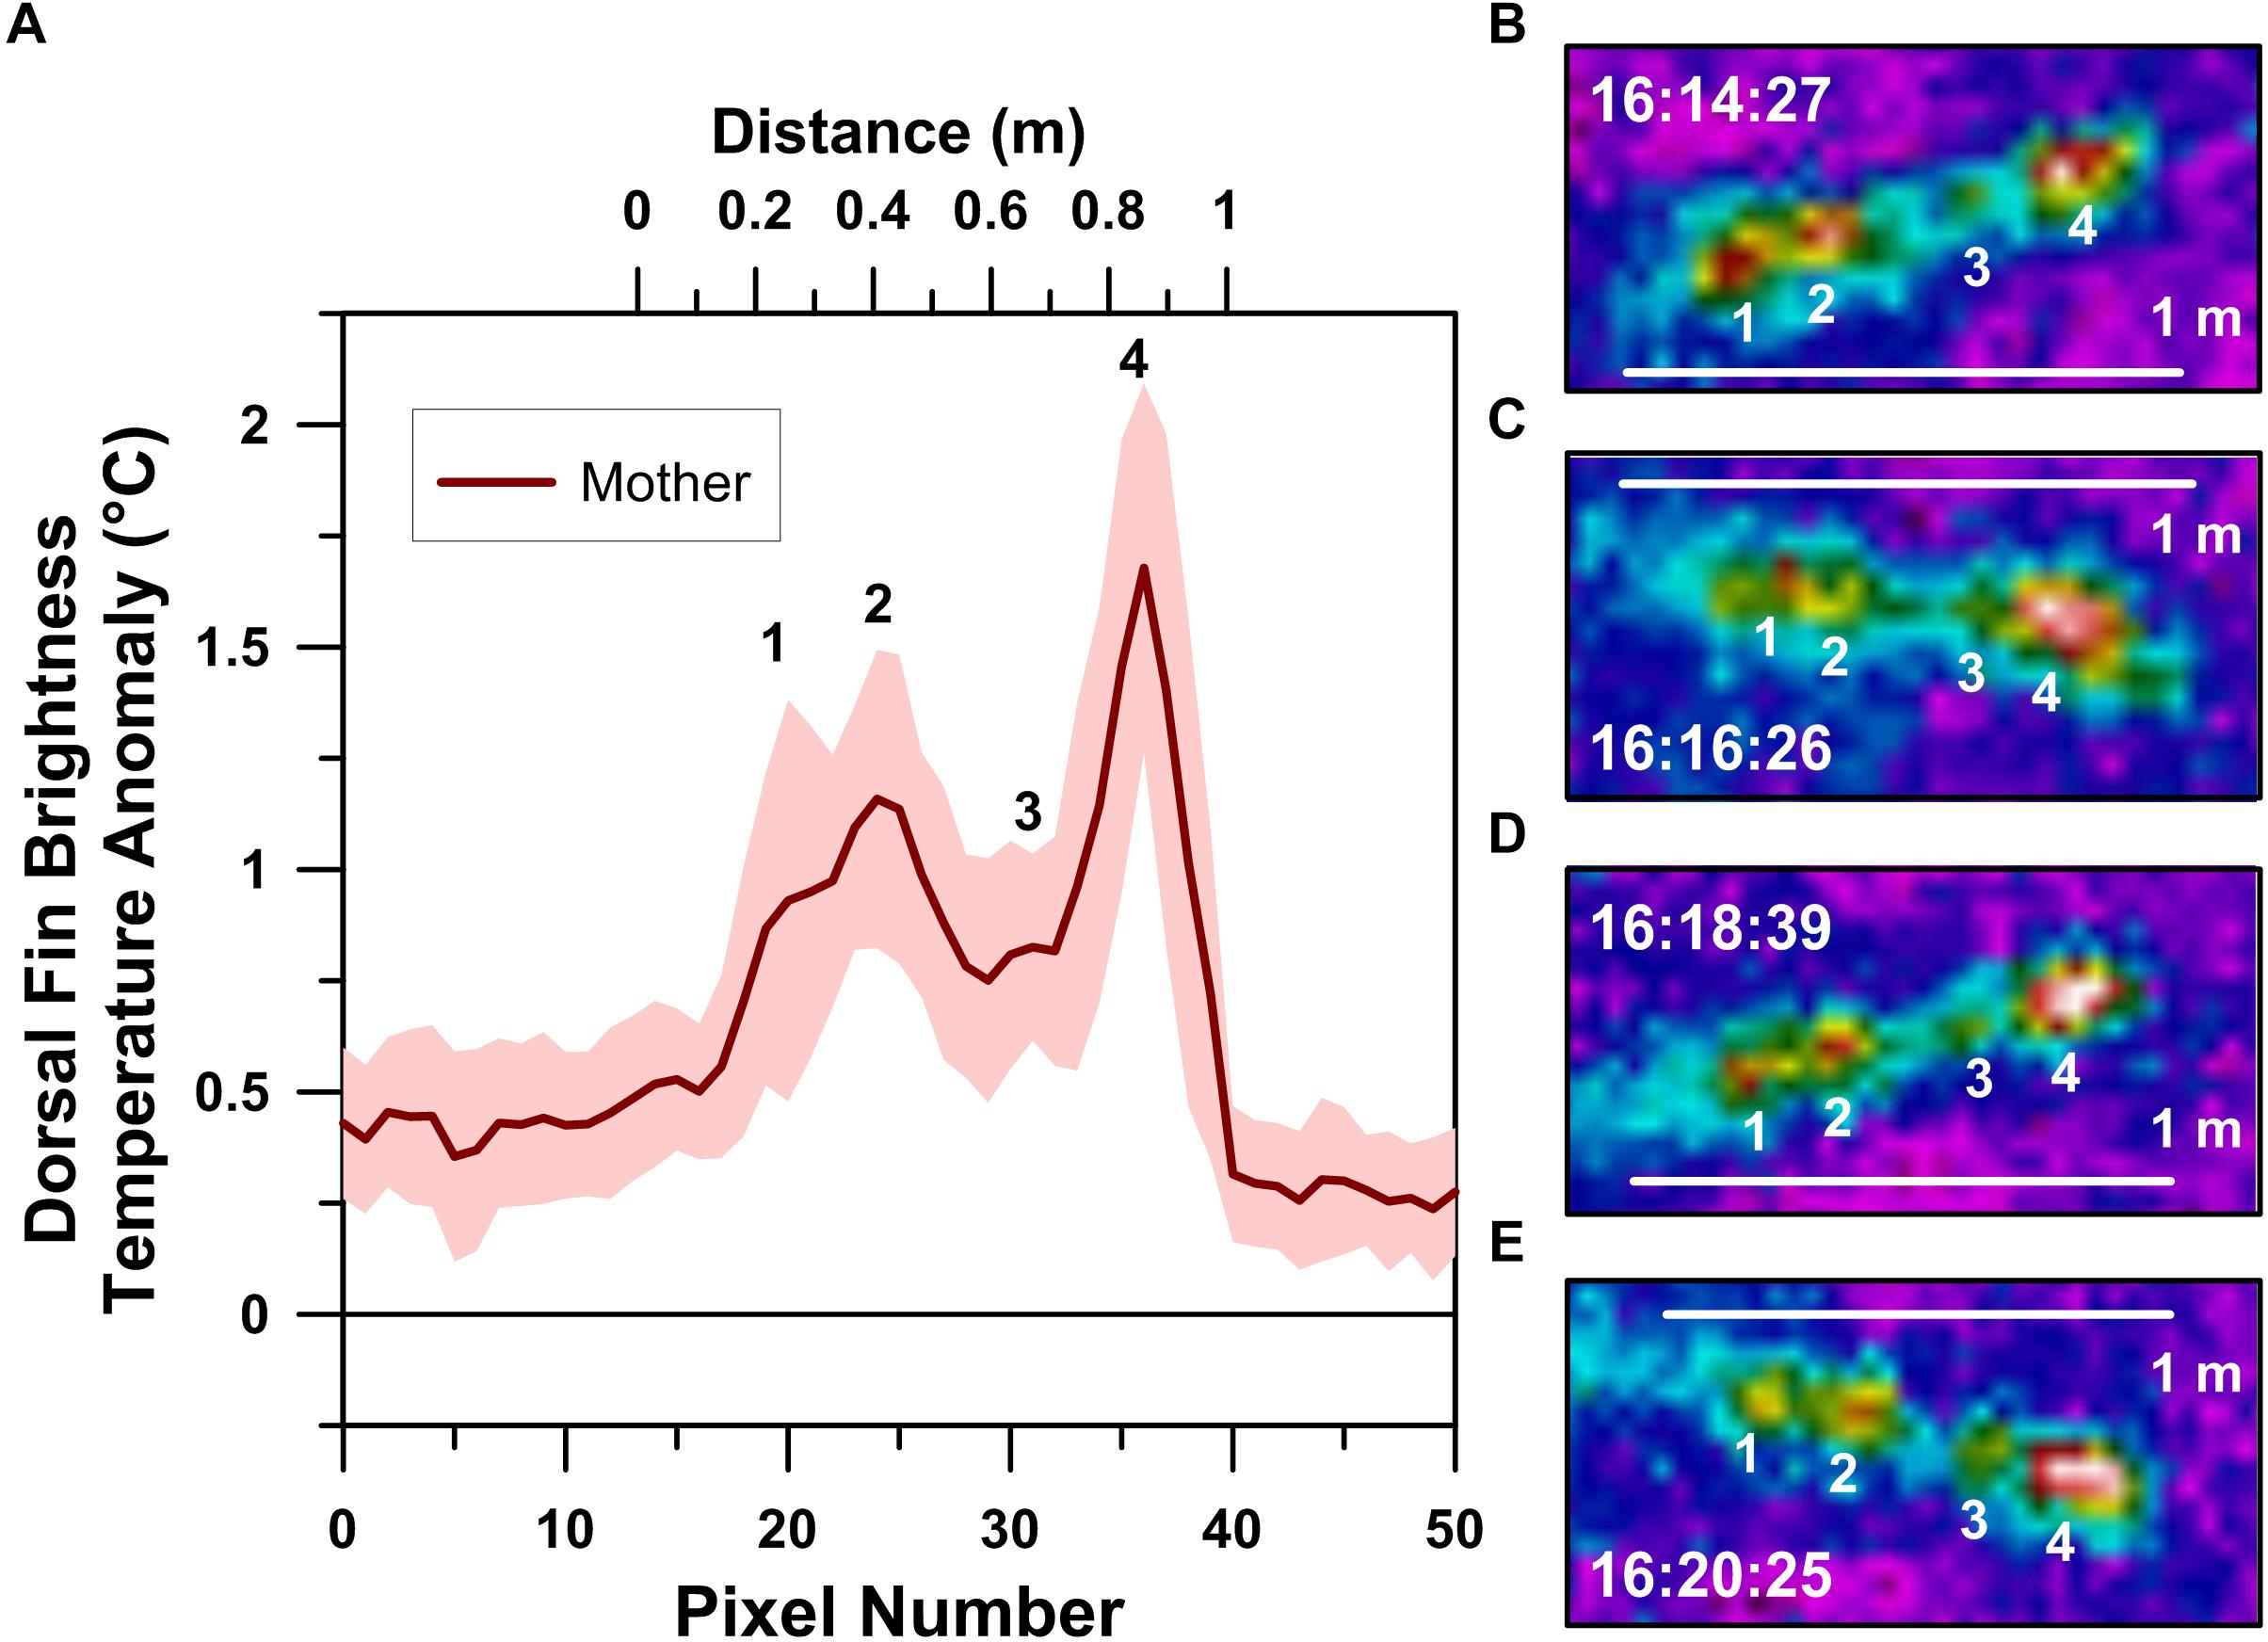
Figure 3. Thermographic profile of a logging mother humpback whale’s dorsal fin (A). Local maxima in the profile, labeled 1–4, correspond with the numbered dorsal fin hot-spots recognized in infrared spectrum images collected ∼2 min apart and at 20 m altitude (B–E). Clock times indicated in B–E are in Cook Island Time during the afternoon of August 26, 2018.
The mother’s individual left and right blowholes exhibited consistent maximum BTA values that ranged between +2.08 and +2.33°C (n = 4; avg. = +2.16°C; 1σ = 0.13°C). The mother’s blowholes appeared as 11–12 pixels (∼42–45 cm) long tapered oval hot-spots in our 20 m flight altitude UAS-IRT images (Figure 2). The calf’s maximum blowhole BTA values were also very stable, ranging between +1.35 and 1.79°C (n = 9; avg. = +1.55°C; 1σ = 0.15°C). However, the calf’s separate left and right blowholes could not be individually resolved at our 20 m flight altitude. The calf’s blowholes combined to present as a single 11–12 pixel long ovate hot-spot in the UAS-IRT images we collected (Figure 2).
Radiometric UAS-IRT images reveal the presence of four hot-spots in the mother whale’s dorsal fin (Figure 3). The position of these hot-spots along the dorsal fin was fixed, with each hot-spot being ∼20 cm apart across several minutes of UAS-IRT imaging. In addition to their positional stability, each of the four hot-spots maintained relatively stable BTA values, with the second and fourth hot-spots from the front of the dorsal fin consistently exhibiting the highest BTA values of approximately 1° to 2°C above background (Figure 3).
The blowhole and dorsal fin brightness temperature data we report support the hypothesis that low zenith angle thermographic images of open humpback whale blowholes and dorsal fins appear as positive BTA relative to adjacent ocean water. These results are consistent with prior research indicating that the best IRT reference points for monitoring captive cetacean body temperature are the open blowhole(s) (Melero et al., 2015).
Higher temporal resolution analysis (i.e., 0.1 s time interval between sequential IRT images) reveals a cyclical temporal structure to the mother whale’s dorsal fin thermal profile (Figure 4A). Spectral analysis performed on the mother whale’s dorsal fin thermal time-series (Figure 4A) identified three significant (p << 0.05) periodicities that are consistent with reasonable estimations of a large (i.e., 25,000–30,000 kg) whale’s apneic heart rate: (1) 8 beats per minute; (2) 9.4 beats per minute; (3) 14.8 beats per minute (Figure 4B; Ponganis and Kooyman, 1999). A similar value was identified by the wavelet analysis, wherein the highest power period that spans the entire time-series record equates to a heart rate of 9.3 beats per minute (p << 0.05; Figure 4C). The significant periodicities revealed by both spectral (Figure 4B) and wavelet (Figure 4C) analyses are consistent with a cardiovascular driver of the observed thermal cycles.
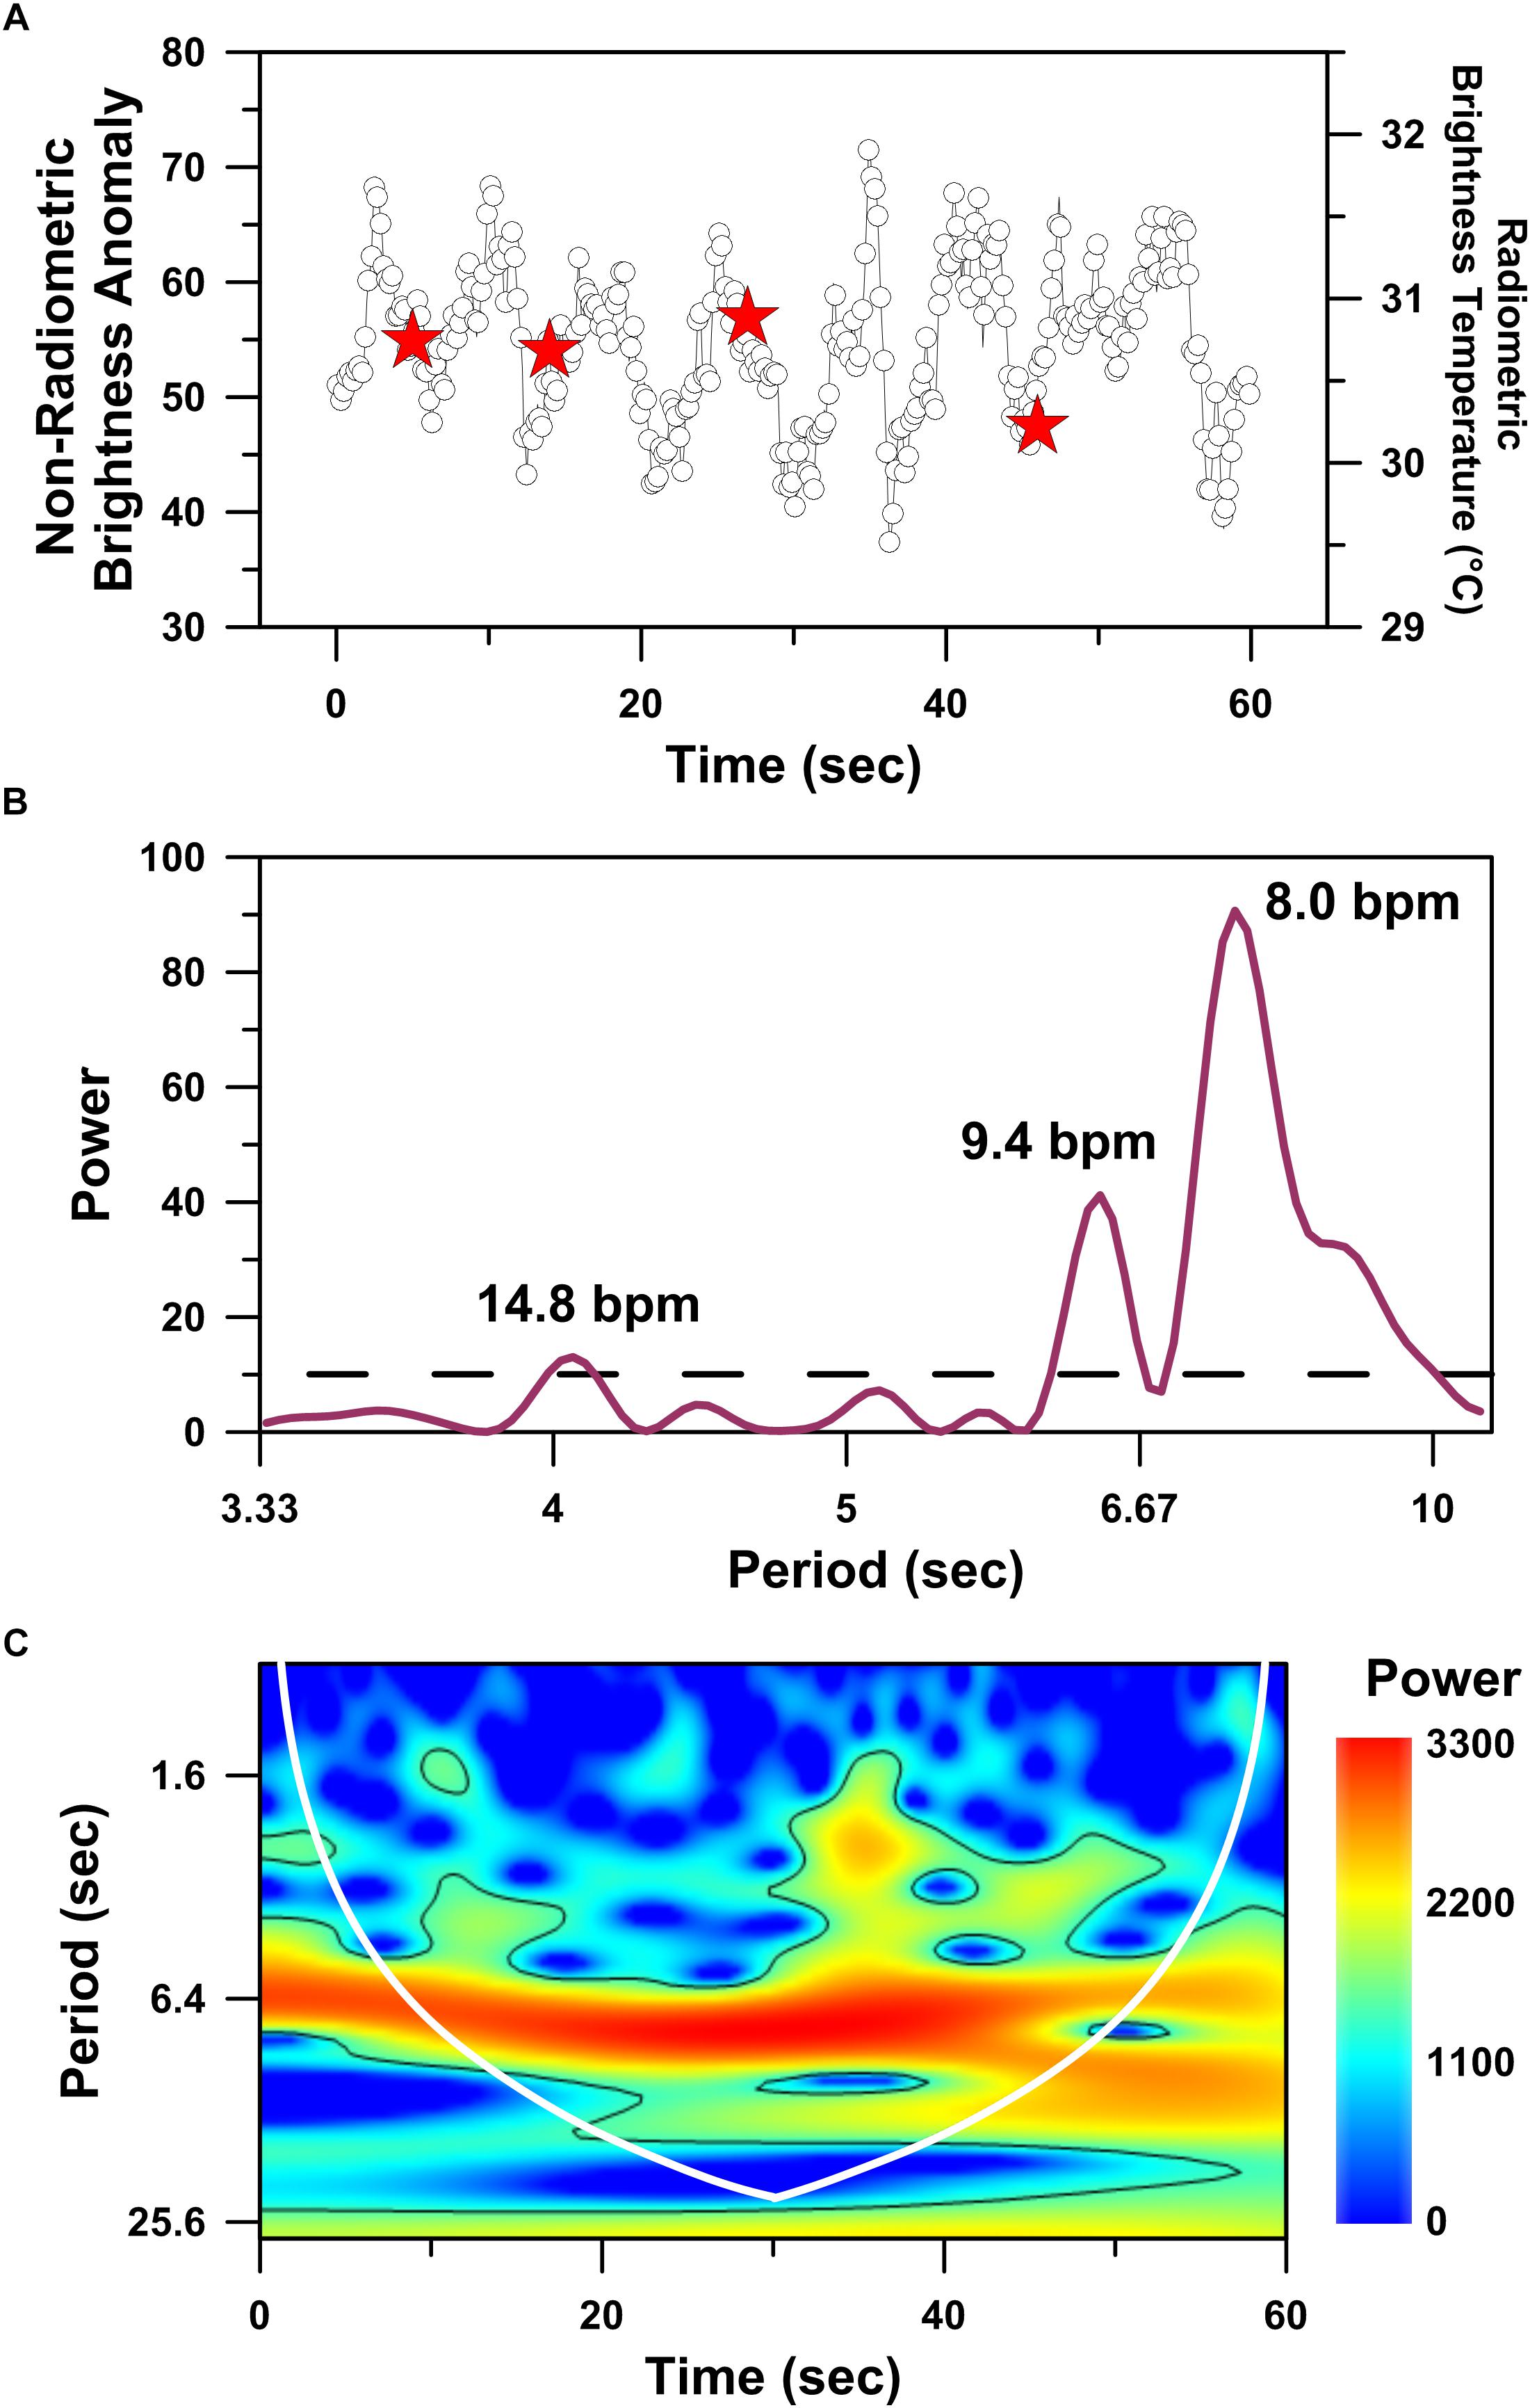
Figure 4. Time series analyses performed on the hottest infrared hot-spot recognized in drone-deployed non-radiometric thermographic video of a mother humpback whale’s dorsal fin. Time series plot of non-radiometric dorsal fin hot-spot intensities (white circles) and radiometric dorsal fin hot-spot temperatures (red stars) simultaneously recorded over a 60 s interval (A). Periodogram showing significant (p < 0.05) periodicities (above dashed line) present in the dorsal fin hot-spot time series dataset and detected using the Lomb–Scargle algorithm (B). Wavelet power spectrum showing significant (p < 0.05) periodicities (i.e., higher power areas inside the solid black line) present in the dorsal fin hot-spot time series dataset (C). Cone of influence indicated by white line in C.
Discussion
Our results demonstrate that rarely observed cetacean behaviors and vital signs can be quantified using non-invasive IR thermographic sensors deployed on drones. These findings represent a significant step forward in cetacean science, as there is currently no established technique for non-invasively monitoring cetacean vital signs in the wild. However, our data set is restricted to observations of a single humpback whale mother-calf pair, and it would be dubious to interpret potential drivers of the behavioral and physiological observations from such a small sample size. Instead, we focus the following discussion on some of the limitations and opportunities manifest in our UAS-IRT research in an effort to help the advancement of cetacean science and conservation.
Limitations
Although there are many positive outcomes that can be achieved through widespread application of non-invasive UAS-IRT techniques, there are also several limitations. These limitations include: equipment costs; risks to the UAS-IRT equipment; regulatory restrictions; data quality; data processing; miscellaneous factors associated with local environmental conditions and animal behavior. To help raise researcher awareness, we briefly discuss each of these limitations below.
Drones capable of carrying a gimbaled radiometric IR sensor for 15 min or more during relatively long-distance flights (ca. 1–2 km) are relatively expensive, typically in excess of US$10,000. Furthermore, drone-deployable radiometric IR sensors themselves are similarly expensive (ca. US$10,000–US$20,000). Thus, there are inherent financial investments and risks associated with conducting UAS-IRT research on free-ranging cetaceans. For this study, we were able to rent a gimbaled Zenmuse XT camera (US$2300 for a week-long rental) and deploy it on a Matrice 200 series drone owned by the University of Canterbury (Christchurch, New Zealand).
Having made such a potentially significant investment, practitioners will no doubt want to minimize risks to the equipment. In our study, we deliberately restricted our UAS-IRT flights to shore-based deployments due to risks associated with small vessel-based deployments: we minimized the risk to our equipment and its human operators by ensuring that the drone had a stable and stationary homing location. Other risks to the equipment include weather conditions, particularly high winds. With our set up, we chose not to fly when wind speeds exceeded 20 knots.
Regulatory restrictions are a third limitation, and they will vary between study areas. Researchers are urged to explore all possible regulations with local authorities early in their research design process. For example, in New Zealand, flying a drone within 150 m horizontal distance of any marine mammal requires a permit from the Department of Conservation1. Given the importance of low zenith angle data collection in IR research (Horton et al., 2017), gaining the appropriate permit(s) for flying directly over marine mammals is an essential consideration. Further regulatory restrictions associated with flying drones near airports should be discussed with the local air traffic control. Typically, there will be a minimum 4 km horizontal distance no-fly zone surrounding all airfields and airports. However, controlled airspaces around some airports can exceed 4 km.
With respect to data quality, IR sensors can be very sensitive but not terribly accurate. For example, the Zenmuse XTR we used in this study has a thermal sensitivity of <50 mK but a ± 10°C accuracy under ideal conditions2. Thus, the intended outcome of the thermographic research must be carefully considered when designing the study. For example, if quantifying blowhole temperatures is set as a research goal, care must be taken to ensure that thermal reference points of known temperature (e.g., local ocean water measured with a thermometer; ice water) are included in the research design. Including such thermal reference points facilitates UAS-IRT data quality control and assurance, as recorded brightness temperatures can be compared to independently measured temperatures and corrected for any offset(s).
Similarly, care must also be taken to ensure that potential emissivity effects, including the relationship between emissivity and imaging angle (Masuda et al., 1988; Cuyler et al., 1992), are accounted for in the UAS-IRT research design. Keeping a drone directly above a stationary to slow moving target animal is relatively straight forward provided the pilot can refer to visible spectrum (i.e., not IR) video during the flight. In our study, we attached a small first-person vision visible spectrum camera to our Matrice 200 UAS as we found it challenging to pilot off the mounted Zenmuse XT’s IR video in isolation. Piloting off a visible spectrum video-feed made it much easier to keep the drone directly above the mother-calf pair and helped minimize data quality effects associated with changing emissivity as a consequence. From our experience, and due to water’s IR opacity, a visible spectrum video-feed is essential for any UAS-IRT research targeting free-swimming cetaceans.
After UAS-IRT data is collected, it will likely require significant management and processing. We found no advantage to using non-radiometric sensors, other than price. Unfortunately, the processing of non-radiometric datasets using purpose-built thermographic software (e.g., FLIR Tools+) is not currently possible. For example, when working with non-radiometric IR video recordings, the researcher is reliant upon generic image processing software packages for the extraction (e.g., FFmpeg, VLC), conversion (Python), and analysis of the collected IR data files (see section “Materials and Methods”). In contrast, radiometric IR video files are much more efficiently managed and processed using programs like FLIR Tools+ and its built-in spot, line and area measurement tools.
UAS-IRT techniques are also sensitive to a number of miscellaneous factors associated with local environmental conditions and animal behavior. For example, uncooled microbolometer IR sensors, like the Zenmuse XT we used here, are sensitive to temperature and environmental conditions (Bhan et al., 2009). Typically, sensors using an uncooled microbolometer have a built-in auto-correction (e.g., Flat Field Correction, FFC) to overcome changes in microbolometer operating temperature and/or changes in ambient temperature. In practice, following a change in temperature, the IR sensor will automatically close its lens shutter for <1 s to create a flat thermal field from which an offset correction is determined. This helps the IR sensor maintain high sensitivity as ambient and/or operational temperature changes. However, such auto-corrections can cause large instantaneous shifts in recorded non-radiometric brightness temperature (Figure 5A; ca. 477 s).
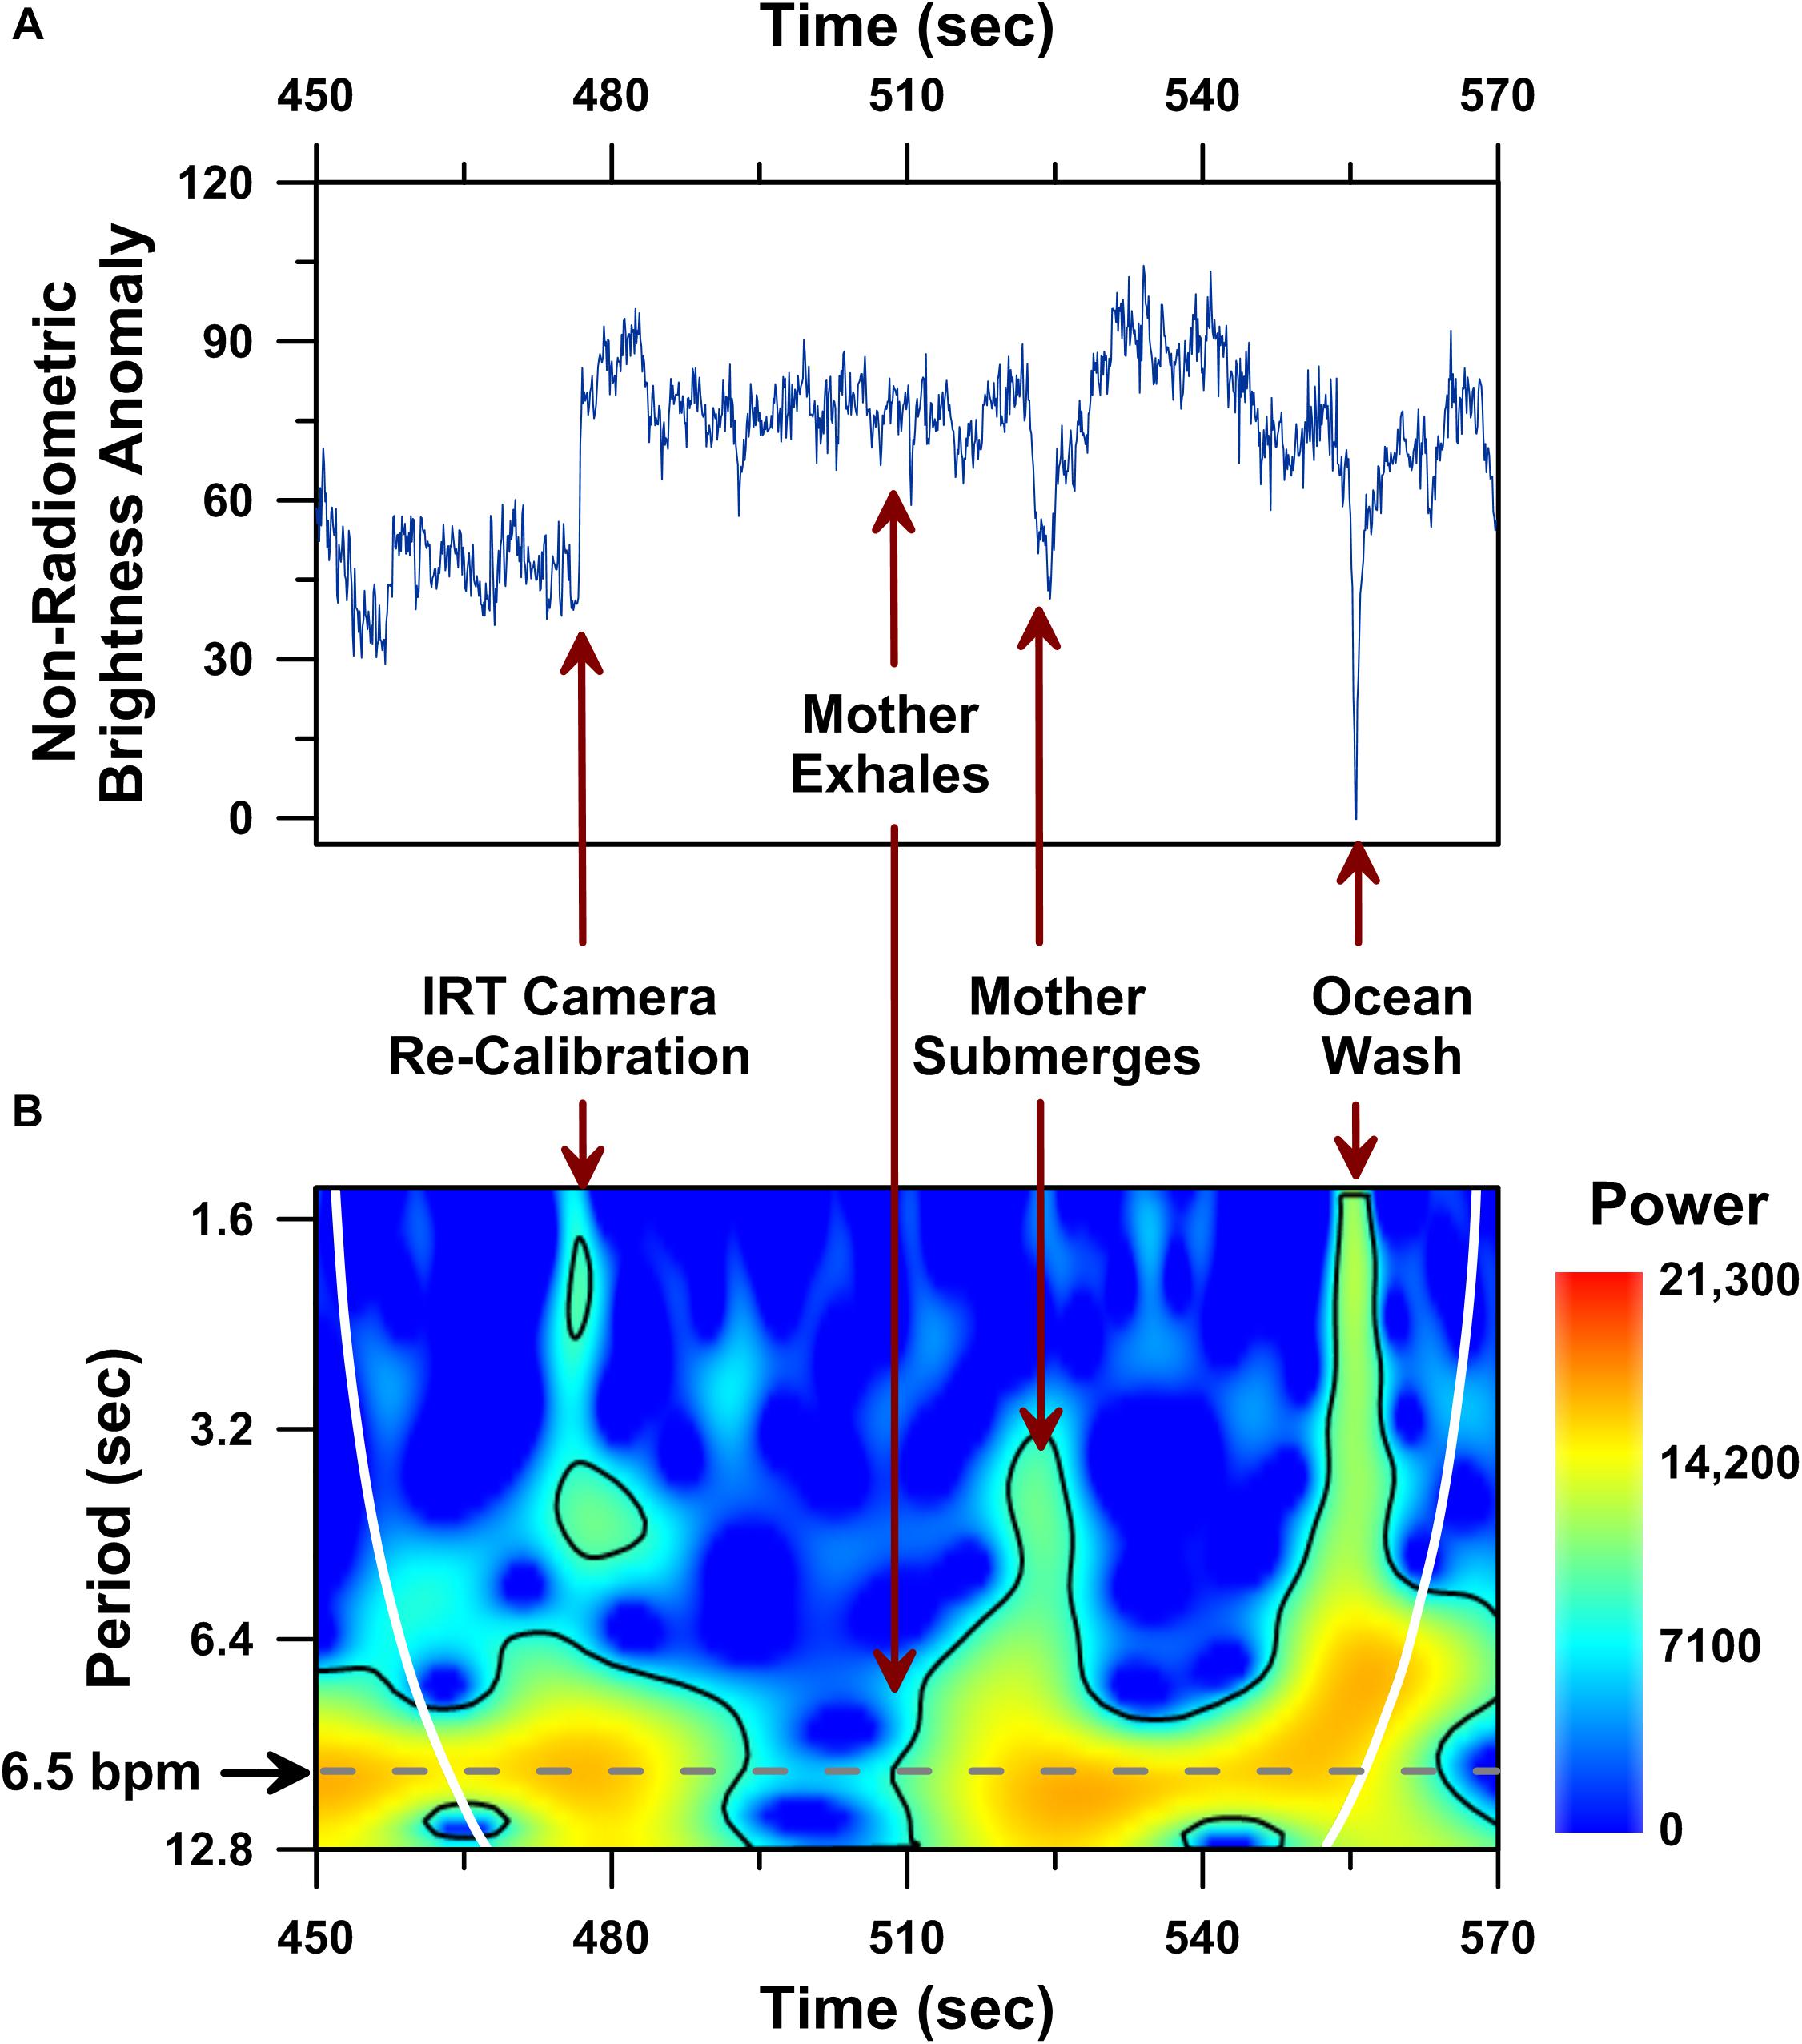
Figure 5. Dorsal fin non-radiometric brightness temperature time series analysis performed on a 120 s-long UAS-IRT recording of the same mother humpback whale reported in Figure 4. Time series plot of raw non-radiometric dorsal fin hot-spot brightness temperatures (A), including: (i) brightness temperature effects of an IRT camera re-calibration (i.e., flat field correction) at 477 s; (ii) whale submergence at 523 s; (iii) ocean water washing over the whale’s dorsal fin at 555 s. Wavelet power spectrum showing significant (p < 0.05) periodicities (i.e., higher power areas inside the solid black line) present in the same 120 s-long record (B). Cone of influence indicated by white line in B.
Large changes in brightness temperature also result from uncontrollable changes in target animal behavior, such as the mother humpback’s submergence following an exhalation (Figure 5A; ca. 523 s), and environmental effects, like a wave washing over the mother humpback’s dorsal fin (Figure 5A, ca. 555 s). Although these uncontrollable factors clearly impacted the raw radiometric brightness temperatures (Figure 5A), this same 2 min-long IR record included a significant ∼6–9 s long periodicity (p < 0.05; wavelet analysis) in raw non-radiometric brightness temperature values (Figure 5B).
Opportunities
Despite its limitations, UAS-IRT represents an important and non-invasive advance for the monitoring and assessment of cetacean behavior and biomedical vital signs. Numerous opportunities are immediately apparent, including: coupled behavioral and physiological monitoring; quantifying cetacean response to prolonged environmental change and acute disturbances; extending UAS-IRT applications to cover a wider range of environmental and behavioral contexts.
The results we report demonstrate that drones facilitate the monitoring of rarely observed cetacean behaviors, including neonatal experiences. As our results demonstrate, coupling UAS behavioral observations with IRT analyses enables quantification of both mother and calf respiration rates and radiometric blowhole brightness temperatures across periods of prolonged solitude.
One of the most immediate opportunities created by our research is the potential to expand these behavioral and physiological UAS-IRT datasets to include additional mother-calf pairs and other whales (e.g., escorts to mother-calf pairs). For endangered populations that have been slow to recover from the effects of whaling, like the humpback whales of Oceania (Olavarría et al., 2007; Childerhouse et al., 2008), monitoring calves and mature females is of paramount importance. Thus, coupling the UAS-IRT techniques we report with other non-invasive UAS advances, including morphometric (e.g., Dawson et al., 2017) and health monitoring (e.g., Pirotta et al., 2017) tools, will create a novel platform for improved longitudinal profiling of endangered whale condition at the individual level.
Wider deployment of the UAS-IRT techniques we report will also facilitate quantification of cetacean response(s) to prolonged environmental change and rapid disturbances. For example, wider deployment of UAS-IRT will enable the quantification of cetacean blowhole and dorsal fin brightness temperatures relative to ocean water temperature through time. It is largely unknown how cetaceans will respond as ocean water temperatures in breeding ground habitats continue to warm (Derville et al., 2019). Will whales respond by shedding more body heat to the environment through superficial venous return and arterio-venous anastomoses present in their fins and flippers (Rommel et al., 2006)? What effects will thermoregulatory responses to climate change have on migratory cetacean health and condition? In addition to providing answers to these longer-term questions, UAS-IRT also has the potential to improve our understanding of the effects of acute disturbances. For example, how do whale vital signs respond to whale watching, satellite tag deployment, entanglement, ship-strike, seismic exploration, marine development and stranding?
One of the most exciting opportunities created by our research is the potential to quantify cetacean vital signs across a wider range of environmental and behavioral contexts. For example, deploying UAS-IRT tools in both high latitude humpback whale feeding grounds and low latitude breeding areas will strengthen our understanding of humpback whale thermoregulation and the potential drivers of long distance migration (Corkeron and Connor, 1999). Specific questions for further consideration, include: (1) How do southern hemisphere humpback whale skin temperatures, respiration rates and heart rates respond, if at all, to the 20–25°C ocean water temperature change they experience during their long-distance migrations? (2) Do northern hemisphere humpbacks, who experience a 10–15°C seasonal change in ocean water temperature, show similar physiological responses?
With respect to opportunities for quantifying cetacean vital signs across behavioral contexts, one of the most important is the application of UAS-IRT to rapidly moving whales. Our study benefited from the quiescent behavioral state of the humpback whale mother we imaged; we were fortunate to have several hours of calm wind, calm water and calm whales to work with. However, these relatively ideal conditions raise questions regarding how UAS-IRT will perform when applied to whales in a more active behavioral state. If the UAS pilot can repeatedly position the drone directly over a rapidly moving whale’s blowhole(s) and dorsal fin, UAS-IRT should have no problem quantifying skin temperature and respiration rate across a wide-range of behaviors. However, whether or not the same approach could be used to quantify the heart rate of a rapidly moving free-swimming whale is not as clear.
To explore this challenge, we modeled a moving whale’s UAS-IRT brightness temperature time-series by combining 30 and 40 s-long intervals of background ocean water brightness temperature data with 3-s long intervals of the mother humpback’s dorsal fin brightness temperature data (Figure 6). The resulting time-series models represent a first-approximation of a moving whale’s ∼3 min long dorsal fin UAS-IRT signal for a 5-breath breathing sequence (Figure 6A) and a 4-breath breathing sequence (Figure 6C). Wavelet analyses of both the 5-breath and 4-breath models show significant 6–10 s-long periodicities (p < 0.05; wavelet analysis) corresponding with the local maximum in spectral power centered on each of the 3 s-long dorsal fin raises when the simulated whale is coming to the surface to breathe. The strongest periodicities detected in our model span the same range as the strongest periodicities detected in our continuous UAS-IRT dorsal-fin hot-spot time-series (Figures 4, 5). Although simplistic, our model suggests that UAS-IRT time-series analyses should be able to successfully detect significant periodicities, consistent with cardiovascular circulation, in the dorsal fin brightness temperatures of free-swimming whales provided a few seconds of low zenith angle dorsal fin brightness temperature data can be acquired.
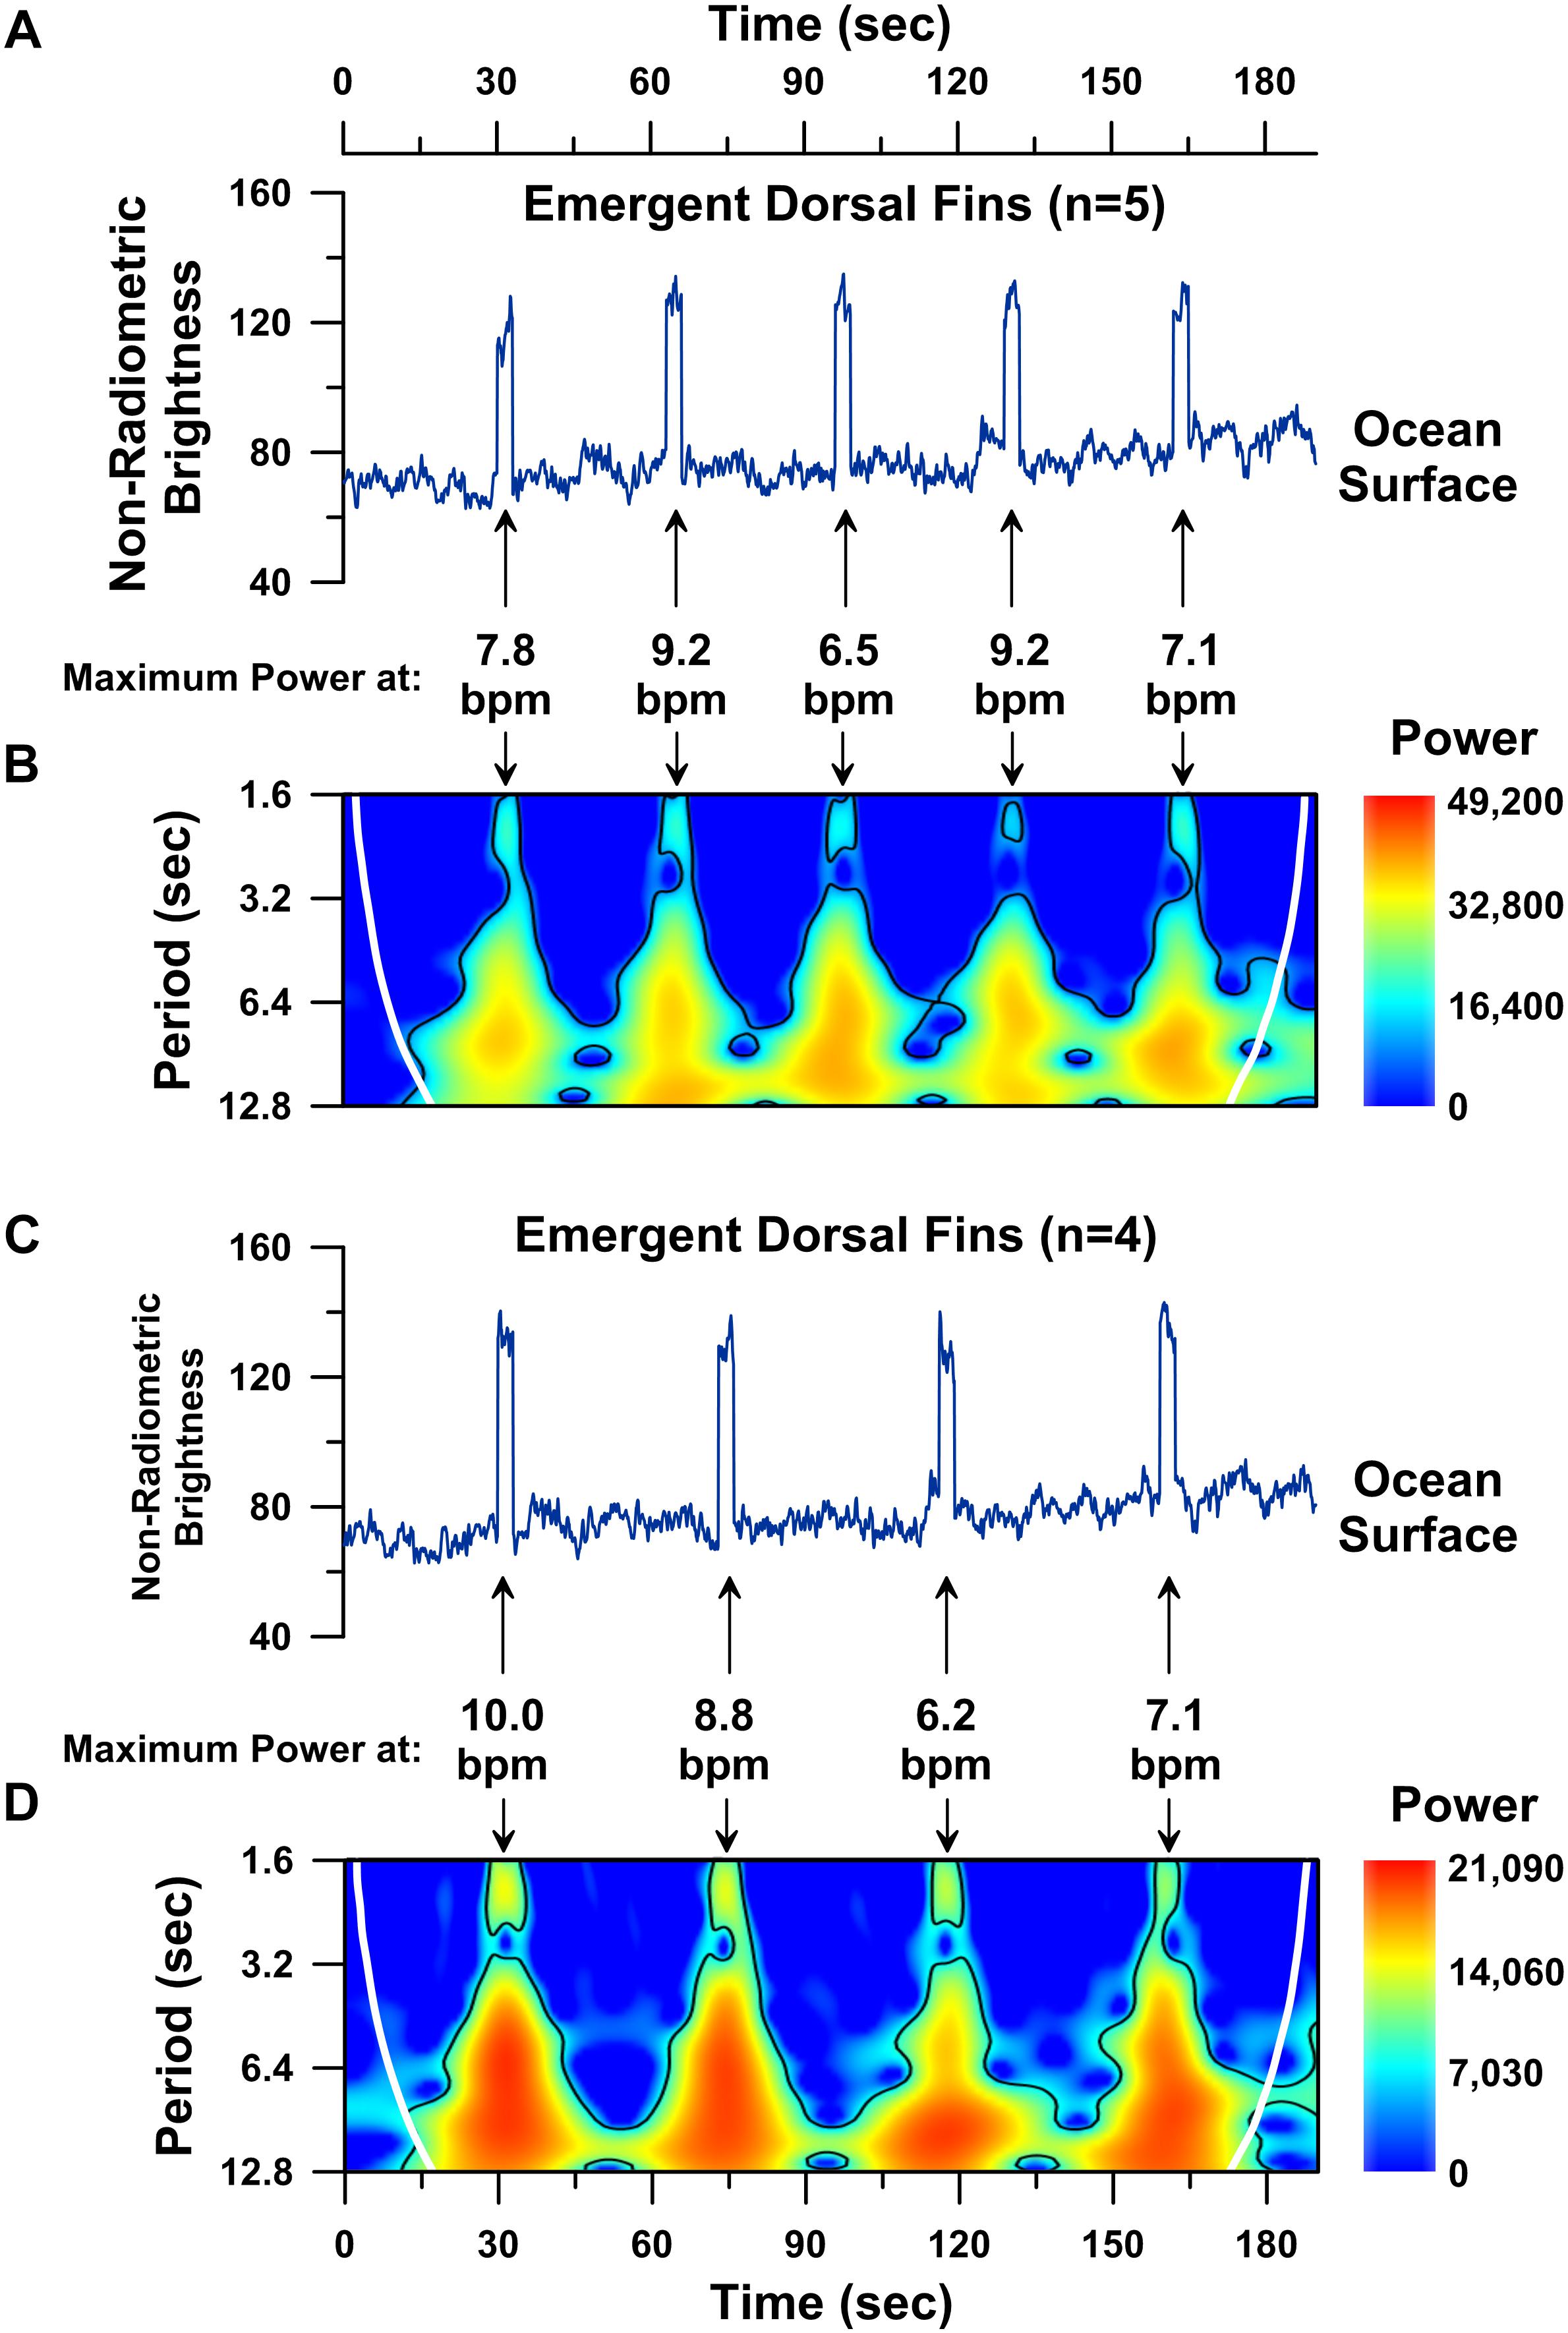
Figure 6. Time series analysis performed on constructed 190 s-long model brightness temperature records for a simulated free-swimming whale. Time series plot of non-radiometric ocean surface water brightness temperatures (blue line; values < 100) followed by 3 s-long dorsal fin hot-spot brightness temperatures (blue line; values > 100) simulating a 5-breath breathing sequence with 30 s separating each breath (A). Wavelet power spectrum showing significant (p < 0.05) periodicities (i.e., higher power areas inside the solid black line) present in the modeled 5-breath sequence (B). Time series plot of non-radiometric ocean surface water brightness temperatures (blue line; values < 100) followed by 3 s-long dorsal fin hot-spot brightness temperatures (blue line; values > 100) simulating a 4-breath breathing sequence with 40 s separating each breath (C). Wavelet power spectrum showing significant (p < 0.05) periodicities (i.e., higher power areas inside the solid black line) present in the modeled 4-breath sequence (D). Cone of influence indicated by white line in B,D.
Conclusion
Drones represent attractive non-invasive tools available to the modern cetacean scientist. Combining drones with IRT creates unprecedented opportunities to quantify and monitor cetacean behavior and biomedical vital signs without direct engagement with the animal. Specific research goals that should rapidly and significantly improve the utility of UAS-IRT in cetacean science and conservation, include: (1) expansion of brightness temperature and brightness temperature anomaly datasets for dorsal fins and blowholes of several species across a variety of environmental contexts (e.g., across low to high latitude habitats); (2) focal follows of individual whales across behavioral state transitions; (3) longitudinal thermal profiling of individuals demonstrating high levels of site fidelity to critical habitat; (4) coupled UAS-IRT and morphometric and health-monitoring UAS research, especially on rapidly developing calves in endangered populations; (5) UAS-IRT research targeting transdermally tagged, injured, entangled, or stressed cetaceans; (6) UAS-IRT monitoring of stranded and/or captive whale vital signs in contexts where local environmental conditions and vital signs can be independently measured.
Ethics Statement
The unoccupied aerial system infrared thermographic research presented here was carried out in accordance with animal ethics consents given to Cook Islands Whale Research by the Cook Islands Government, Office of the Prime Minister.
Author Contributions
TH conceived the study and wrote the initial manuscript. NH, TF, and NK contributed to the fieldwork and imaging research. TH, SC, and KK performed all of the image processing, data analysis, and prepared all the figures. All authors contributed to the revision of the initial manuscript.
Funding
This research was supported by the Center for Cetacean Research and Conservation, Cook Islands Whale Research, and in part by a sabbatical grant-in-aid awarded by the University of Canterbury to TH.
Conflict of Interest Statement
The authors declare that the research was conducted in the absence of any commercial or financial relationships that could be construed as a potential conflict of interest.
Acknowledgments
The authors thank Frontiers Abroad for its outstanding support of research experiences for undergraduate students.
Supplementary Material
The Supplementary Material for this article can be found online at: https://www.frontiersin.org/articles/10.3389/fmars.2019.00466/full#supplementary-material
Footnotes
- ^https://www.doc.govt.nz/get-involved/apply-for-permits/drone-use-on-conservation-land/flying-drones-near-marine-mammals/
- ^https://dl.djicdn.com/downloads/zenmuse_xt/en/Zenmuse_XT_User_Manual_V1.2_en_0708.pdf
References
Barbieri, M. M., McLellan, W. A., Wells, R. S., Blum, J. E., Hofmann, S., Gannon, J., et al. (2010). Using infrared thermography to assess seasonal trends in dorsal fin surface temperatures of free-swimming bottlenose dolphins (Tursiops truncatus) in sarasota bay, florida. Mar. Mammal Sci. 26, 53–66.
Bhan, R. K., Saxena, R. S., Jalwania, C. R., and Lomash, S. K. (2009). Uncooled infrared microbolometer arrays and their characterisation techniques. Defence Sci. J. 59, 580–589.
Carlson, C. (2012). A Review of Whale Watch Guidelines and Regulations Around the World: Version 2012. Impington: International Whaling Commission.
Chekmenev, S. Y., Rara, H., and Farag, A. A. (2005). Non-contact, wavelet-based measurement of vital signs using thermal imaging. in Proceedings of the 1st International Conference on Graphics, Vision, and Image Processing (GVIP ’05), Louisville, KY.
Childerhouse, S., Jackson, J., Baker, C. S., Gales, N., Clapham, P. J., and Brownell, R. L. Jr. (2008). Megaptera novaeangliae Oceania subpopulation. The IUCN Red List of Threatened Species 2008: e.T132832A3463914. Available at: http://dx.doi.org/10.2305/IUCN.UK.2008.RLTS.T132832A3463914.en (accessed November 10, 2018).
Corkeron, P. J. (1995). Humpback whales (Megaptera novaeangliae) in hervey bay, queensland: behaviour and responses to whale-watching vessels. Can. J. Zool. 73, 1290–1299.
Corkeron, P. J., and Connor, R. C. (1999). Why do baleen whales migrate? 1. Mar. Mammal Sci. 15, 1228–1245.
Cuyler, L. C., Wiulsrød, R., and Øritsland, N. A. (1992). Thermal infrared radiation from free living whales. Mar. Mammal Sci. 8, 120–134. doi: 10.1111/j.1748-7692.1992.tb00371.x
Dawson, S. M., Bowman, M. H., Leunissen, E., and Sirguey, P. (2017). Inexpensive aerial photogrammetry for studies of whales and large marine animals. Front. Mar. Sci. 4:366. doi: 10.3389/fmars.2017.00366
Derville, S., Torres, L. G., Albertson, R., Andrews, O., Baker, C. S., Carzon, P., et al. (2019). Whales in warming water: assessing breeding habitat diversity and adaptability in oceania’s changing climate. Glob. Change Biol. 25, 1466–1481. doi: 10.1111/gcb.14563
Fettermann, T., Fiori, L., Bader, M., Doshi, A., Breen, D., Stockin, K. A., et al. (2019). Behaviour reactions of bottlenose dolphins (Tursiops truncatus) to multirotor unmanned aerial vehicles (UAVS). Sci. Rep. 9:8558. doi: 10.1038/s41598-019-44976-9
Hammer,Ø, Harper, D. A. T., and Ryan, P. D. (2001). PAST: paleontological statistics software package for education and data analysis. Palaeontol. Electron. 4:9.
Horton, T. W., Oline, A., Hauser, N., Khan, T. M., Laute, A., Stoller, A., et al. (2017). Thermal imaging and biometrical thermography of humpback whales. Front. Mar. Sci. 4:424. doi: 10.3389/fmars.2017.00424
Masuda, K., Takashima, T., and Takayama, Y. (1988). Emissivity of pure and sea waters for the model sea surface in the infrared window regions. Remote Sens. Environ. 24, 313–329. doi: 10.1016/0034-4257(88)90032-6
Melero, M., Rodríguez-Prieto, V., Rubio-García, A., García-Párraga, D., and Sánchez-Vizcaíno, J. M. (2015). Thermal reference points as an index for monitoring body temperature in marine mammals. BMC Res. Notes 8:411. doi: 10.1186/s13104-015-1383-6
Olavarría, C., Baker, C. S., Garrigue, C., Poole, M., Hauser, N., Caballero, S., et al. (2007). Population structure of South Pacific humpback whales and the origin of the eastern Polynesian breeding grounds. Mar. Ecol. Prog. Ser. 330, 257–268.
Pirotta, V., Smith, A., Ostrowski, M., Russell, D., Jonsen, I. D., Grech, A., et al. (2017). An economical custom-built drone for assessing whale health. Front. Mar. Sci. 4:425. doi: 10.3389/fmars.2017.00425
Platt, T., and Denman, K. L. (1975). Spectral analysis in ecology. Annu. Rev. Ecol. Syst. 6, 189–210.
Ponganis, P. J., and Kooyman, G. L. (1999). Heart rate and electrocardiogram characteristics of a young california gray whale (Eschrichtius robustus). Mar. Mammal Sci. 15, 1198–1207.
Press, W. H., Teukolsky, S. A., Vetterling, W. T., and Flannery, B. P. (2007). Numerical Recipes 3rd Edition: The Art of Scientific Computing. Cambridge, MA: Cambridge university press.
Richter, C., Dawson, S., and Slooten, E. (2006). Impacts of commercial whale watching on male sperm whales at Kaikôura. New Zealand. Mar. Mammal Sci. 22, 46–63.
Rommel, S. A., Costidis, A. M., Fernandez, A., Jepson, P. D., Pabst, D. A., Houser, D. S., et al. (2006). Elements of beaked whale anatomy and diving physiology and some hypothetical causes of sonar-related stranding. J. Cetacean Res. Manage. 7, 189–209.
Schaffar, A., Madon, B., Garrigue, C., and Constantine, R. (2013). Behavioural effects of whale-watching activities on an endangered population of humpback whales wintering in new caledonia. Endanger. Species Res. 19, 245–254.
Seymour, A. C., Dale, J., Hammill, M., Halpin, P. N., and Johnston, D. W. (2017). Automated detection and enumeration of marine wildlife using unmanned aircraft systems (UAS) and thermal imagery. Sci. Rep. 7:45127. doi: 10.1038/srep45127
Sun, G., Nakayama, Y., Dagdanpurev, S., Abe, S., Nishimura, H., Kirimoto, T., et al. (2017). Remote sensing of multiple vital signs using a CMOS camera-equipped infrared thermography system and its clinical application in rapidly screening patients with suspected infectious diseases. Int. J. Infect. Dis. 55, 113–117. doi: 10.1016/j.ijid.2017.01.007
Torrence, C., and Compo, G. P. (1998). A practical guide to wavelet analysis. B. Am. Meteorol. Soc. 79, 61–78.
Torres, L. G., Nieukirk, S. L., Lemos, L., and Chandler, T. E. (2018). Drone up! quantifying whale behavior from a new perspective improves observational capacity. Front. Mar. Sci. 5:319. doi: 10.3389/fmars.2018.00319
Keywords: drone, humpback whale, infrared, behavior, vital signs
Citation: Horton TW, Hauser N, Cassel S, Klaus KF, Fettermann T and Key N (2019) Doctor Drone: Non-invasive Measurement of Humpback Whale Vital Signs Using Unoccupied Aerial System Infrared Thermography. Front. Mar. Sci. 6:466. doi: 10.3389/fmars.2019.00466
Received: 22 December 2018; Accepted: 11 July 2019;
Published: 30 July 2019.
Edited by:
Daniel Rittschof, Duke University, United StatesReviewed by:
Justin Tyler Ridge, Duke University, United StatesLeigh Gabriela Torres, Oregon State University, United States
Copyright © 2019 Horton, Hauser, Cassel, Klaus, Fettermann and Key. This is an open-access article distributed under the terms of the Creative Commons Attribution License (CC BY). The use, distribution or reproduction in other forums is permitted, provided the original author(s) and the copyright owner(s) are credited and that the original publication in this journal is cited, in accordance with accepted academic practice. No use, distribution or reproduction is permitted which does not comply with these terms.
*Correspondence: Travis W. Horton, travis.horton@canterbury.ac.nz