Lessons From the Pacific Ocean Portal: Building Pacific Island Capacity to Interpret, Apply, and Communicate Ocean Information
 Molly Powers
 Zulfikar Begg
 Grant Smith
 Elaine Miles
- 1Pacific Community (SPC), Suva, Fiji
- 2Bureau of Meteorology, Melbourne, VIC, Australia
The need for improved access to ocean observations for Pacific Island countries (PICs) and territories has been increasingly recognized over the last decade, particularly in the face of a changing climate. Although more remote sensing and in situ data are available than ever before, however, oceanographic, and marine forecasting expertise in the region is limited. To support capacity building in these areas, the Climate and Oceans Support Program in the Pacific (COSPPac) has engaged with partners in the National Meteorological Services (NMS) and other relevant agencies in 14 Pacific Island nations, to identify priorities and to develop tools and training to address these needs. A key tool is the online Pacific Ocean Portal. With a focus on the Pacific Islands region, this website provides ocean data relevant to a range of sectors and applications such as tourism, fishing, shipping, coastal inundation, and environmental management. Via a user-friendly interface, the portal serves up data from a variety of sources including near real-time observations, historical information and forecast data. Training modules have been designed for portal users and delivery has gone hand-in-hand with in-country stakeholder engagement workshops, allowing sector users to make requests for ocean information products. Eight workshops have been delivered from November 2015 to June 2018, training a total of 97 NMS staff and 116 ocean sector stakeholders including port authorities, disaster management, tourism, fisheries, community leaders, and many more. As a result, five Pacific Island NMSs (Tonga, Tuvalu, Kiribati, Samoa, and Vanuatu) are now producing monthly Ocean Outlooks, guided by the needs of in-country stakeholders. Outlooks are tailored for each country and can include forecasts such as sea surface temperature, coral bleaching, and sea level, as well as information about current chlorophyll conditions, wind, and wave climate.
Introduction
Pacific Island countries (PICs) are custodians of 20% of global Exclusive Economic Zones (EEZs), where ocean space exceeds land area by an average factor of 300 to 1. Pacific Island countries often referred to as small island developing states (SIDS), can be more accurately described as large ocean developing states due to the size of their EEZs, which are rich in biodiversity and natural resources (Appeltans et al., 2016). The majority of economic activities in these countries- from tourism to fishing- rely upon the ocean, justifying the Pacific Island Forum's focus on the development of a sustainable Blue Pacific Economy (Pacific Islands Forum Pacific Islands Forum Secretariat, 2017).
The need to support SIDS in implementing the United Nations Sustainable Development Goal 14 was highlighted in the call for action from the 2017 Oceans Conference in New York. Ocean information has also been identified as a requirement for successful implementation of the United Nations-led initiative Global Framework for Climate Services (GFCS) in SIDS that are particularly vulnerable to climate variability and climate change (WMO, 2014).
The diffuse geography of PICs presents many challenges in disseminating ocean information to isolated communities. Datasets covering entire EEZs can be very large and this is especially true for data that extend below the ocean surface. Transmission of large datasets puts significant strain on internet bandwidth in locations that already have limited or unreliable capacity (Iwamoto et al., 2017). Datasets are becoming more sophisticated with improvements in spatial and temporal resolution, exacerbating transmission issues. Depending on the technical ability of the user, analysis of raw data may be too difficult and time consuming for practical application. Although many ocean data sources include visual representations, these may not always be ideally suited for the given application or target audience. Most ocean datasets only include a global or ocean basin view, which is not practical for small island nations.
Pacific Island National Meteorological Services (NMSs) are primarily responsible for weather observations, climate services, and seasonal climate outlooks. Many NMSs have expressed their aspiration to better engage the marine sector within their respective countries. For this to occur, NMSs require access to relevant ocean data that is frequently updated, low bandwidth, tailored for priority applications within their EEZs, and accompanied by a training program. It is essential that guidance is provided to NMSs and relevant stakeholders on how to access and interpret ocean data, which can then inform relevant decision-making (Bax et al., 2018).
The Climate and Oceans Support Program in the Pacific (COSPPac) was an AU$36 million program funded by the Department of Foreign Affairs & Trade (DFAT formerly AusAID) over 6 years (July 2012 to June 2018). It was recently extended for an additional 4 years and AU$23 million until June 2022. The COSPPac program carries on the legacy from previous phases of support for NMSs in sea-level monitoring and climate prediction with the inclusion of capacity development and communication, information technology services, and ocean services (Commonwealth of Australia, 2012). The program objective is to enhance the capacity across NMSs and key stakeholders in 14 Pacific Island nations in climate and ocean variability and its applications. The countries participating in this program include the Cook Islands, Federated States of Micronesia, Fiji, Kiribati, Marshall Islands, Nauru, Niue, Palau, Papua New Guinea, Samoa, Solomon Islands, Tonga, Tuvalu and Vanuatu (illustrated in Supplementary Figure 1).
This paper offers a case study perspective on the development and roll-out of the COSPPac Pacific Ocean Portal (http://oceanportal.spc.int), a web-based delivery system for ocean data in support of Pacific NMSs and in-country stakeholders. It also discusses lessons learnt, outcomes, and benefits to portal users, and explores future opportunities.
Ocean Information Requirements for the Pacific
For the majority of Pacific Island countries, the ocean is the most significant natural asset available to support sustainable economic development. Pacific regional leaders have promoted numerous initiatives to secure the conservation and sustainable use of the ocean and its resources. These include, but are not limited to, the Western and Central Pacific Fisheries Convention of 2004, the Framework for Resilient Development in the Pacific (2017–2030), and the Framework for a Pacific Oceanscape of 2010. Building upon the “Blue Pacific” concept endorsed by Pacific Island Leaders in 2017, the 49th Pacific Islands Forum Meeting in 2018 highlighted oceans, fisheries, and climate change and disaster resilience among the priority issues confronting the region (Pacific Islands Forum Secretariat, 2018).
At the Pacific Meteorological Council in Nuku'alofa, Tonga in 2015, the region highlighted the critical need for improved ocean and marine services and established the Pacific Islands Marine and Ocean Services (PIMOS) Expert Panel, tasked to advise NMSs on how best to meet these needs. Subsequently, the mid-term review of the Pacific Islands Meteorological Strategy in 2017 resulted in the revision of Pacific Key Outcome (PKO) 2 to include: Improved marine weather and establishment of ocean services (Secretariat of the Pacific Regional Environment Programme, 2017).
Underscoring the regional effort are actions at national levels seeking a better understanding of ocean processes to support management and conservation. Despite growing political support in the Pacific, the ocean science capacity of Pacific governments is limited and oceanographic expertise is available almost exclusively at the regional level. Improved ocean science and analysis capacity is required, not only for informed and sustainable resource management, but also for robust early warning systems, sea-level rise monitoring, adaptation planning, climate-smart development, and growing the blue economy.
Feedback from representatives of 14 PICs captured at a consultation in April 2011 identified 65 references to ocean information products and services. There was significant focus on disaster mitigation, especially inundation events experienced from high tides, sea-level rise, high waves, and storm surge. Sea-level historical climatology, predictions, and long-term projections were of interest. Fisheries were identified as an important aspect of Pacific livelihoods requiring decision-making tools. Sea surface temperature relating to coral bleaching and the impact on local fisheries was also a key concern. Consequently, delivery of a set of PIC ocean products and services was planned under COSPPac (Commonwealth of Australia, 2012) to fulfill the outcome “Pacific Island NMSs and other relevant in-country agencies understand and use climate, ocean, and sea level products for the benefit of island communities and governments.”
Based on requests and needs identified, it was determined that a Pacific Ocean services web portal would be useful for NMSs to deliver more comprehensive climate and ocean data services. Most of the data available in the portal can be accessed via other individual websites online, but the Pacific Ocean Portal seeks to make them available in a single location, organized by application, and visually consistent in their presentation, to facilitate interpretation.
A similar approach was successfully undertaken to synthesize climate change time series data into the Pacific Climate Change Data Portal under the Pacific Climate Change Science Program (McGree et al., 2014). In terms of a visual map-based portal, the most similar product for the Pacific is the PacIOOS Voyager tool (Iwamoto et al., 2017, Potemra et al., 2017). The Voyager website was developed for US-affiliated PICs and later extended to all PICs. It is comprehensive, including detailed historical, near-real time, and forecast data, resulting in a high bandwidth requirement. Feedback from Pacific users stated that it was difficult to ascertain the application of the different datasets when they were grouped by data sources or data type. User feedback and specialist reviews of these tools directly informed the development of the COSPPac Pacific Ocean Portal.
Pacific Ocean Portal Design and Data
The Pacific Ocean Portal is an interactive website for visualizing and accessing historical, real-time and predictive ocean data categorized by marine applications on an integrated and user-friendly platform. The intended primary users of the portal are scientists within NMSs and other government agencies, marine industry and conservation stakeholders, and the general public. It is a tool that aims to both obtain and communicate ocean information. A range of visual formats are employed to support different downstream applications (i.e., maps, time-series, statistical charts, profiles as illustrated in Supplementary Figure 2). Data sources include satellite observations, in situ observations, and numerical models (reanalysis and forecast).
From the outset, the portal aimed to provide regional-to-country level information (Commonwealth of Australia, 2012). The intention was to make the portal as intuitive as possible through use of a point-and-click interface to access data, graphs, and tables. Early on in the project, an IT capacity mapping of 14 PIC NMSs was undertaken. Following the discovery that PIC internet speeds were all in the order of kilobytes per second, significant effort was made to ensure the portal minimized bandwidth use. The design needed support of all major browser platforms.
The architecture for the portal was informed by business requirements for the COSPPac project, user cases, and feedback from PIC and Australian climatologists. COSPPac prioritized the sustainability of products beyond the life of the project. With this in mind, only open-source components were selected so they could be used in the PICs without licensing fees. The tools and libraries selected are the most suitable for the purpose and also widely supported by developers and organizations around the world. Using familiar products ensures that it is easy to find experts capable of extending the tools and enables re-use of the components in future products. As will be discussed in section References, this design attribute has already proven valuable.
High-resolution datasets were chosen as the preferred option where possible to better resolve small islands, although there were limitations across many gridded datasets. The datasets and sources initially selected for integration into the portal are listed in Table 1, along with the potential applications of this data for PICs.
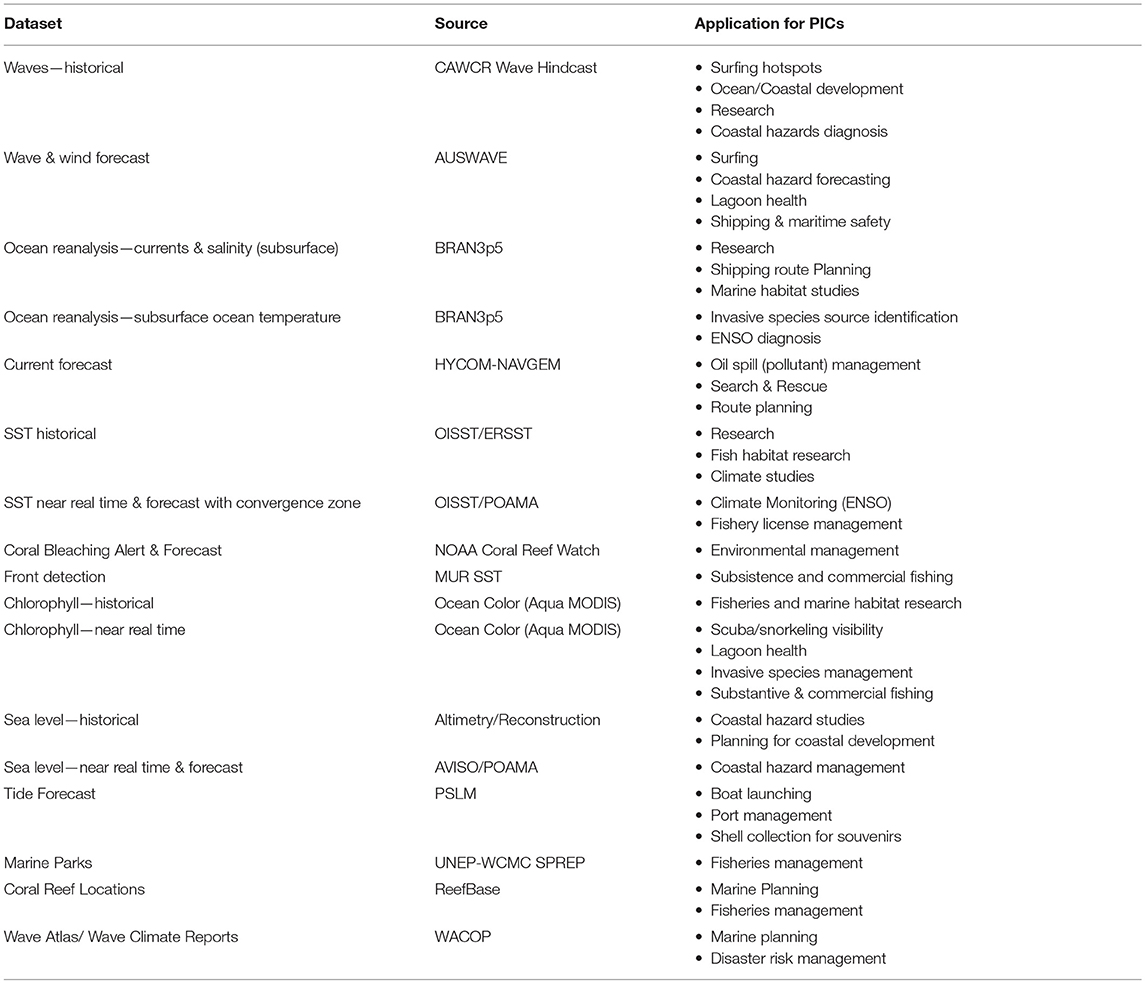
Table 1. Datasets available within the Pacific Ocean Portal with data source and potential PIC applications.
The portal's landing page, shown in Figure 1, is designed to direct specialist and non-specialist users alike toward the datasets or information that will be most relevant for their needs, based primarily on its application. All of the spatial datasets within the portal are accessible via an interactive mapping environment that permits exploration through zooming, scrolling, and data point extraction, allowing the user to create tailored imagery for communication purposes, and to screen capture data outputs for any location.
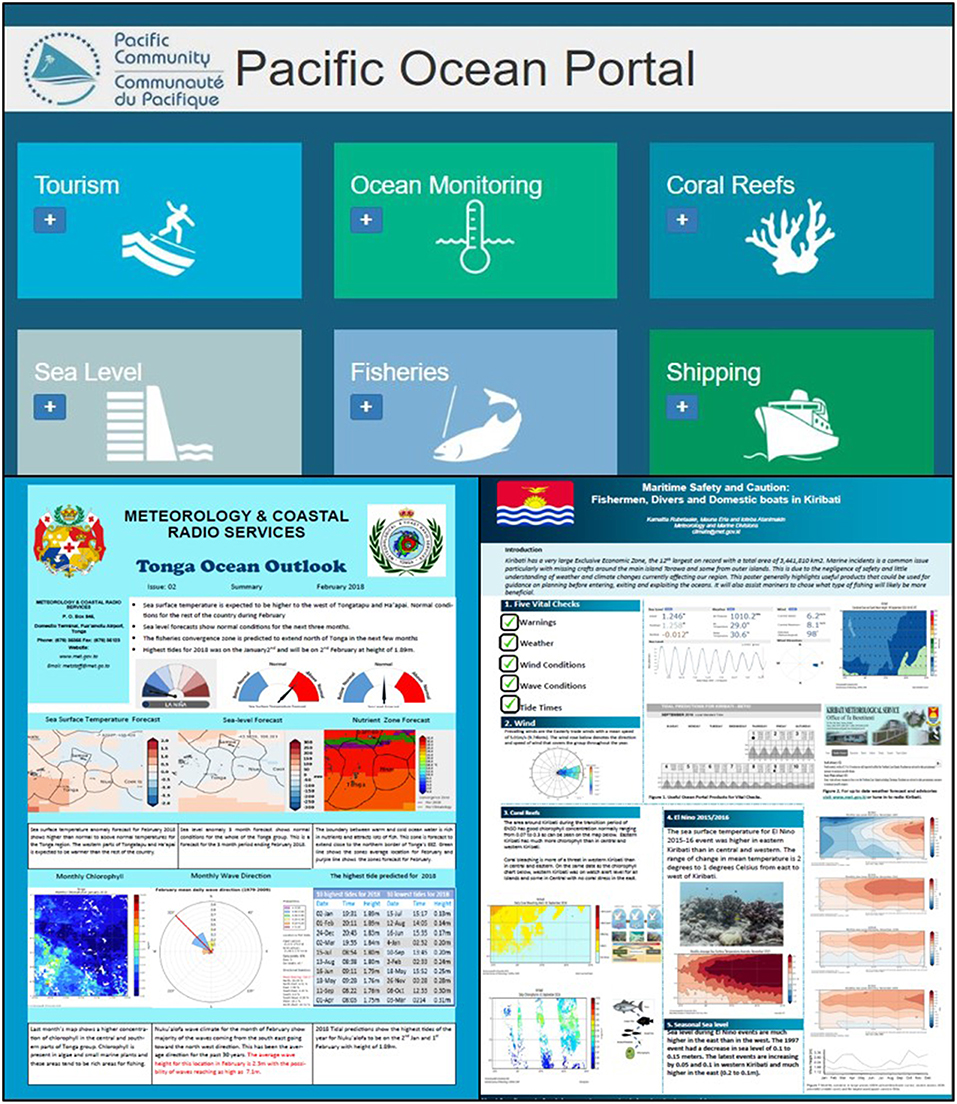
Figure 1. (Top) landing page of the Pacific Ocean Portal http://oceanportal.spc.int (Bottom left) Monthly Ocean Outlook produced by Tonga Meteorological Service (Tonga Meteorological Service (TMS), 2018) and (Bottom right) an Ocean Science for Maritime Safety and Caution poster produced by Kiribati stakeholders at the Fiji Sub-regional Workshop in 2016 (Eria et al., 2016).
Education, Training, and Awareness Building
As recommended, COSPPac sought to facilitate the uptake the Pacific Ocean Portal to PIC users (Commonwealth of Australia, 2012; Thompson et al., 2012). Sustainable capacity building is a frequent challenge in development initiatives, particularly those that introduce a new tool or technology. To address this challenge, an integrated approach was employed spanning portal design, tailored training, and training material development, collaboration with Pacific regional organizations and in-country partners, ongoing consultation, high-level endorsement, and ultimately, integration into existing regional products, services, courses and initiatives.
A series of “help” documents were created for each dataset that describes the dataset, background science behind the data, how to navigate the portal to obtain the information, suggested applications for the dataset in the Pacific, and technical details regarding the data sources, including references.
The portal was the key teaching tool introduced in a series of Ocean & Tides Workshops delivered across the Pacific between 2015 and 2018. Sub-regional and national workshops were conducted in the Solomon Islands (November 2015), Fiji (September 2016), Cook Islands (November 2016), Marshall Islands (March 2017), Tuvalu (October 2017), Tonga (November 2017), Niue (March 2018), and Samoa (May 2018) with NMS and other ocean-related agencies and organizations in each country. A total of 97 NMS staff across 14 countries were trained, plus an additional 116 stakeholders. Of the 213 total Pacific Islanders trained, 41 of them were women (19%).
The workshops aimed to provide background ocean science behind the portal, teach workshop participants how to navigate the portal, provide examples of marine applications, and support NMSs in initiating dialogue with in-country users of ocean data. Workshops were hosted by and developed in consultation with the local NMS, according to their needs. Typically, the program would include a few days of technical training for NMS staff, followed by a stakeholder training and consultation allowing sector users to make requests for ocean information products. Where practical, case studies, demonstrations, field trips, and presentations by local experts were incorporated to cater to different learning styles and reinforce the local relevance of science tools and training. At regional workshops, participants were encouraged to develop science posters using outputs from the portal and national workshops focused around the development of national ocean services and, where relevant, products using the portal as illustrated in Figure 1.
Nine training modules with explicit learning outcomes were designed to familiarize users with ocean science concepts, the portal, and other ocean data products. Each module includes a step-by-step guide, followed by a series of exercises to help self-directed learners explore. The modules were progressively tailored to ensure relevance to each country prior to the workshop, and later updated based upon participant and facilitator feedback.
The Pacific Ocean Portal was officially launched by the President of the Republic of Fiji, Jioji Konrote on World Oceans Day, 8th June 2018, in Suva, Fiji, as the opening event at the World Oceans Day Symposium. In the Pacific region, securing a visible and formal endorsement of such a tool is a unique opportunity to boost awareness and use among key stakeholders. The 1-day event directly reached more than 200 participants, invited guests and visitors, and many more people through television, radio, and newspaper features and interviews. In addition, an introductory Know Your Ocean YouTube video demonstrating applications of the portal was produced for this event to reinforce the user-friendly nature of the portal, encourage sharing on social media, and promote ocean awareness and monitoring.
Outcomes, Benefits, and Future Opportunities
Since the soft-launch of the first portal version in 2015 until the official launch in June 2018, there have been a number of successful outcomes and significant benefits of this new tool to the Pacific Islands region. Notably, the portal has been integrated into routine early warning products and services of Pacific NMSs, regional organizations, and regional training courses, including the University of the South Pacific (USP)'s post-graduate Physical Oceanography course.
The open-source design of the portal has proven a prudent strategy, as hosting and management was successfully handed-over from the Bureau of Meteorology (BoM) to the Pacific Community (SPC) based in Suva, Fiji in June 2018. This handover was intended to ensure the sustainability of the portal and to reinforce the regional ownership and relevance of the products. SPC is the Pacific Islands' regional technical organization, with an established Ocean & Maritime Programme providing the region's hub of oceanographic expertise, and has led delivery of in-country portal training since 2016. The portal is also poised to contribute to the proposed Pacific Community Center for Ocean Science (PCCOS), an integrated facility to improve accessibility of ocean knowledge and facilitate inter-disciplinary partnerships (Pacific Community, 2018a). As the regional coordinator for the UN Decade of Ocean Science for Sustainable Development 2021–2030, SPC is thus well-placed to ensure the continued investment in portal development and support for training.
Even with its low bandwidth design, the portal was observed to have difficulty loading larger maps and graphs in countries with lower bandwidth internet access. Since the portal was first designed, however, internet access across the region has improved significantly. Further upgrades are planned and therefore an associated improvement in portal performance is anticipated into the future. As a bandwidth comparison, accessing the portal web page, and producing the most recent SST anomaly required 1.9MB, compared to PacIOOS Voyager, which required 3.3MB. Since the transition, SPC has continued to add value to the portal and is currently integrating a new data management interface, updating wave climate reports, and adding new resources to the site. Regular maintenance is required as data sources are constantly changing and being upgraded. As new applied research and Pacific data become available, SPC can expand the portal to include these features if there is a clearly identified application and benefit for the additional data.
Since 2015, the website has received over 14,000 users worldwide with 3,500 separate users accessing the portal across Melanesia, Polynesia, and Micronesia. SPC counted over 2,500 hits in September 2018, and 285 users, 62% of whom were returning users. The largest peaks in traffic occurred during cyclonic events in the Pacific, demonstrating that users have a strong interest in ocean information in the fields of risk management and disaster mitigation. There was a noticeable uptick in users in countries following COSPPac in-country workshops. Follow-up surveys conducted 6 months after workshops held in Niue and Samoa indicate that at least 25% of workshop participants gained new skills, passed new skills onto another colleague, and have implemented changes to their work as a result the training.
Following in-country workshops and NMS staff attachment trainings at BoM and SPC, six Pacific Island NMS (Tonga, Tuvalu, Kiribati, Samoa, Fiji, and Vanuatu) are now producing monthly ocean outlooks, as in Figure 1. Ocean outlooks are tailored to individual country user needs and include forecasts such as SST, convergence zone location, coral bleaching alerts, and sea level, as well as information about current chlorophyll conditions, wind and wave climate. In Tonga, Tuvalu, Fiji, Vanuatu and Samoa, the outlooks were co-designed by users to include priority sector-specific information. With close collaboration between PICs and support from SPC, these outlooks offer other NMSs an example of what can be achieved using the portal. In another example, in March 2019, the Fiji Met Service used the portal to respond to requests from local media on marine heatwaves in the region, providing SST anomaly and bleaching risk maps, a textual interpretation of the data, and background science that was sourced from the included “help files” within the portal.
Targeted in-country training and stakeholder engagement on ocean data applications under COSPPac has helped to cement NMSs as focal agencies for ocean forecasting services while also providing tools and skills to other ocean-data users such as fisheries, shipping and maritime, environment, and disaster management. Ocean stakeholders have also reported beneficial outcomes. Following the Niue workshop in March 2018, the owner of Niue Tours and Commodore of the Niue Yacht Club reported, “After the workshop, we immediately started using the tide chart for our tour operations. I am also collating all the relevant information from the ocean portal to be included in the Niue Yacht Club's website for the coming season” (Pacific Community, 2018b).
SPC conducted a COSPPac Ocean Information Products user-survey in September 2018. This is an inter-annual practice to assess the relevance of products, and to plan improvements and future products. Of 94 participants (out of 400 surveyed) from 15 different Pacific countries and territories, 65% indicated that it was a highly valuable tool for them or their work. Users reported that Ocean Monitoring (74.5%) and Sea Level (71.3%) were most useful datasets and functions of the portal. As knowledge brokers for climate and ocean science, NMSs were the most frequent users, integrating the portal into their daily operations, monitoring severe weather conditions, and producing monthly outlooks. In addition, other users reported using the portal as a reference for search and rescue operations, scheduling of recreational activities, fishing, and fieldwork, and even using outputs or information from helpfiles to create new information products or country reports. Survey results are reported in Supplementary Table 1.
Looking toward the future, SPC aims to continue to develop the portal in response to regional needs and requests. In coordination with the PMC, PIMOS Panel and WMO, SPC plans to develop an accredited online oceanographic competency module for NMSs that incorporates the portal and training materials. In addition, continued collaboration with regional educational institutions is proposed to explore the development of online courses and other options to formalize portal training and increase accessibility.
While satellite technology is revolutionizing ocean observations, the resolution of many large ocean datasets is still insufficient to resolve the small island states in the Pacific. Downscaled, local models are essential for understanding the impacts of increasing SSTs in atoll lagoons, sea-level rise, and wave transformation on small island coastlines, for example.
It is hoped that an increase in PIC oceanographic capacity will contribute to increased investment in ocean observations infrastructure and increased engagement with the global ocean observing community. The Pacific may be the world's largest ocean, but it is also the most data-sparse and PICs are significantly under-represented in global discussions on ocean observations (Secretariat of the Pacific Regional Environment Programme, 2017). The region also needs to engage in international discussions on improved data sharing standards so that systems can be upgraded easily and information shared.
The UN Decade of Ocean Science presents a timely opportunity to catalyze action on ocean monitoring, and the Pacific Islands region is poised to be a key player, as the stakes are high for Large Ocean States. Protecting ocean resources, ensuring economic security, understanding vulnerability to climate change and variability all rely on robust ocean monitoring systems. However, the importance of human capacity to interpret and act upon information available from these systems is equally vital. Facilitating the transformation of data to information, information to knowledge, and knowledge to policy and action is a critical challenge for ocean observations. This requires not only scientific expertise and technological advances, but an integrated approach informed by science communication, social science, user-centered design, and policy best-practice.
In conclusion, the Pacific Ocean Portal is an example of consultative design and, accompanied by outcome-driven training, it is already contributing significantly toward the development of ocean and marine services in the Pacific Islands. Embedded within SPC's Ocean and Maritime Programme and with the ongoing Australian Aid support through 2022, it is anticipated that the portal will continue to develop and play a key role in building the marine meteorological competency of Pacific NMSs to meet the needs of the Pacific marine community into the future.
Author Contributions
MP: primary drafting, editing of the paper, circulated for feedback among other authors, Ocean Literacy & Capacity Building Leader at SPC- led delivery of workshops. GS: drafted first three sections, shaped the content, edited, provided some references, led development of BoM Ocean Portal, curriculum development and helpfile drafting. ZB: edited, proof-read, and provided details on ocean portal data sets in Table 1, currently overseeing and maintaining Ocean Portal. EM: edited and suggested future-forward content, supported development of the Portal.
Conflict of Interest Statement
The authors declare that the research was conducted in the absence of any commercial or financial relationships that could be construed as a potential conflict of interest.
Supplementary Material
The Supplementary Material for this article can be found online at: https://www.frontiersin.org/articles/10.3389/fmars.2019.00476/full#supplementary-material
References
Appeltans, W., Dujardin, F., Flavell, M., Miloslavich, P., and Webb, T. J. (2016). Biodiversity Baselines in the Global Ocean, The Open Ocean: States and Trends. Paris: UNESCO.
Bax, N. J., Appeltans, W., Brainard, R., Duffy, J. E., Dunstan, P., Hanich, Q., et al. (2018). Linking capacity development to GOOS monitoring networks to achieve sustained ocean observation. Front. Mar. Sci. 5:346. doi: 10.3389/fmars.2018.00346
Commonwealth of Australia (2012). Climate and Ocean Support Program in the Pacific (COSPPac). Program Design Document, Melbourne.
Eria, M., Rubetaake, K., and Atanimakin, I. (2016). Maritime Safety and Caution: Fisherman, Divers, and Domestic Boats in Kiribati, Nadi: Fiji.
Iwamoto, M., Langenberger, F., and Ostrander, C. E. (2017). Ocean observing: serving stakeholders in the pacific islands, marine technology society. Journal 50:pp 47–54. doi: 10.4031/MTSJ.50.3.2
McGree, S., Whan, K., Jones, D., Alexander, L. V., Imielska, A., Diamond, H., et al. (2014). An updated assessment of trends and variability in total and extreme rainfall in the western Pacific. Int. J. Climatol. 34, 2775–2791. doi: 10.1002/joc.3874
Pacific Community (2018a). Pacific Community Centre for Ocean Science Implementation Strategy, Noumea, New Caledonia.
Pacific Community (2018b). Ocean and Tides Workshop Makes immediate Impact on Niue Communities, Suva, Fiji. 9 April 2018.
Pacific Islands Forum Secretariat (PIFS) (2017). State of Pacific Regionalism Report 2017, Suva, Fiji.
Pacific Islands Forum Secretariat (PIFS) (2018). Forty-Ninth Pacific Islands Forum Communique, Yaren, Nauru.
Potemra, J., Maurer, J., and Burns, E. S. (2017). “Providing Oceanogrpahic Data and Information to Pacific Island Communities,” in Oceanographic and Marine Cross-Domain Data Management for Sustainable Development, eds P. Diviacco, A. Leadbetter, and H. Glaves (Hershey, PA: IGI Global), 253–281. doi: 10.4018/978-1-5225-0700-0.ch011
Secretariat of the Pacific Regional Environment Programme (SPREP) (2017). Pacific Islands Meteorological Strategy 2017–2026. Apia, Samoa.
Thompson, E., Howie, M., and Amjadali, A. (2012). Pacific Islands Climate Prediction Project Completion Report. Melbourne, Australia.
Tonga Meteorological Service (TMS) (2018). Tonga Ocean Outlook, Nuku'alofa, Tonga. Available online at: http://www.met.gov.to/
Keywords: Pacific Islands, capacity building, SIDS, portal, ocean outlook
Citation: Powers M, Begg Z, Smith G and Miles E (2019) Lessons From the Pacific Ocean Portal: Building Pacific Island Capacity to Interpret, Apply, and Communicate Ocean Information. Front. Mar. Sci. 6:476. doi: 10.3389/fmars.2019.00476
Received: 30 October 2018; Accepted: 15 July 2019;
Published: 02 August 2019.
Edited by:
Frank Edgar Muller-Karger, University of South Florida, United StatesReviewed by:
Nicholas J. Bax, Commonwealth Scientific and Industrial Research Organisation (CSIRO), AustraliaVardis Maximilian Tsontos, NASA Jet Propulsion Laboratory (JPL), United States
Copyright © 2019 Powers, Begg, Smith and Miles. This is an open-access article distributed under the terms of the Creative Commons Attribution License (CC BY). The use, distribution or reproduction in other forums is permitted, provided the original author(s) and the copyright owner(s) are credited and that the original publication in this journal is cited, in accordance with accepted academic practice. No use, distribution or reproduction is permitted which does not comply with these terms.
*Correspondence: Molly Powers, mollyp@spc.int