The Unknown and the Unexplored: Insights Into the Pacific Deep-Sea Following NOAA CAPSTONE Expeditions
 Brian R. C. Kennedy1,2*
  Kasey Cantwell2,3
  Mashkoor Malik2
  Christopher Kelley2,4 Jeremy Potter5 Kelley Elliott2 Elizabeth Lobecker2,6 Lindsay McKenna Gray2,7
  Derek Sowers2,6 Michael P. White2,6
  Scott C. France8
  Steven Auscavitch9
  Christopher Mah10 Virginia Moriwake4
  Sarah R. D. Bingo4
  Meagan Putts4
  Randi D. Rotjan1*
- 1Department of Biology, Boston University, Boston, MA, United States
- 2NOAA Office of Ocean Exploration and Research, Silver Spring, MD, United States
- 3MAXIMUS, Metro Center, Reston, VA, United States
- 4University of Hawai’i at Manoa Joint Institute of Marine and Atmospheric Research (JIMAR), Honolulu, HI, United States
- 5Bureau of Ocean Energy Management, Camarillo, CA, United States
- 6Cherokee Nation Strategic Programs, Richmond Hwy Suite, Arlington, TX, United States
- 7Athenium Analytics, Dover, DE, United States
- 8Department of Biology, University of Louisiana at Lafayette, Lafayette, LA, United States
- 9Department of Biology, Temple University, Philadelphia, PA, United States
- 10Department of Invertebrate Zoology, National Museum of Natural History, Smithsonian Institution, Washington, DC, United States
Over a 3-year period, the National Oceanic and Atmospheric Administration (NOAA) organized and implemented a Pacific-wide field campaign entitled CAPSTONE: Campaign to Address Pacific monument Science, Technology, and Ocean NEeds. Under the auspices of CAPSTONE, NOAA mapped 597,230 km2 of the Pacific seafloor (with ∼61% of mapped area located within US waters), including 323 seamounts, conducted 187 ROV dives totaling 891.5 h of ROV benthic imaging time, and documented >347,000 individual organisms. This comprehensive effort yielded dramatic insight into differences in biodiversity across depths, regions, and features, at multiple taxonomic scales. For all deep sea taxonomic groups large enough to be visualized with the ROV, we found that fewer than 20% of the species were able to be identified. The most abundant and highest diversity taxa across the dataset were from three phyla (Cnidaria, Porifera, and Echinodermata). We further examined these phyla for taxonomic assemblage patterns by depth, geographic region, and geologic feature. Within each taxa, there were multiple genera with specific distribution and abundance by depth, region, and feature. Additionally, we observed multiple genera with broad abundance and distribution, which may focus future ecological research efforts. Novel taxa, records, and behaviors were observed, suggestive of many new types of species interactions, drivers of community composition, and overall diversity patterns. To date, only 13.8% of the Pacific has been mapped using modern methods. Despite the incredible amount of new known and unknown information about the Pacific deep-sea, CAPSTONE is far from the culminating experience the name suggests. Rather, it marks the beginning of a new era for exploration that will offer extensive opportunities via mapping, technology, analysis, and insights.
Introduction
The oceans contain 1,335 million km3 of water covering 361.9 million km2 of seafloor across 71% of the planet (Eakins and Sharman, 2010). Abyssal plains cover ∼70% of the seabed, while the oceanic ridge system extends for 80,000 km around the globe, and there are an estimated 100,000 seamounts throughout the world ocean (Wessel et al., 2010). In the past few decades, there has been substantial effort put into mapping and exploring these benthic seafloor habitats (Mayer et al., 2018) fueled by the advent of new technologies that more easily enable deepwater access (Tyler et al., 2016).
Modern day deep-sea exploration has experienced a renaissance in recent years as massive exploratory infrastructure, expeditions, and institutions have entered the landscape (Tyler et al., 2016). Results from these growing efforts have demonstrated that the seafloor possesses a wealth of biodiversity often exceeding that of coastal systems, and rivaling that of coral reefs and tropical rainforests (McClain and Schlacher, 2015). These abundant and diverse ecosystems, and organisms within, play vital roles in carbon sequestration (Zachos et al., 2008), decomposition (Graf, 1989), nutrient cycling (Danovaro et al., 2001), and fisheries (De Leo et al., 2010). Mapping and exploration technology contribute to our understanding of deep-sea ecosystem dynamics, including tectonic spreading centers and subduction zones as well as a variety of seafloor features (Watling and Auster, 2017; Dunn et al., 2018). Benthic storms, down-slope transport, seamount- and canyon-influenced hydrodynamics, turbidity flows, temporal pulses of food, and even tidal dynamics point to an ever-changing deep sea (Levin et al., 2001). From the discovery of deep-sea vents, seamount coral gardens, high-productivity whale falls, and life even in the deepest trenches, we now understand that the deep sea hosts a variety of habitats, each with their own ecology and unique species (Van Dover, 2000; McClain and Schlacher, 2015). Yet, we still have limited knowledge of these ecosystems, which is increasingly problematic as they may be influenced by drivers such as sea level rise, ocean warming, deoxygenation, acidification, commercial fishing, seabed mining, and other dynamic drivers with unknown potential for feedback to the climate system (Sarmiento et al., 2004; Koslow et al., 2011; Ramirez-Llodra et al., 2011; Mengerink et al., 2014).
The Pacific is the worlds’ largest ocean, and hosts a large diversity of deep-sea habitat including the deepest troughs on the planet, trenches, ridges, hadal holes, seamounts, abyssal plains, and other benthic features (Jamison, 2015). The Pacific Ocean covers a total area of 161.76 million km2, and hosts a volume of 660 million km3 (Eakins and Sharman, 2010). The history of Pacific Ocean exploration dates back to 1521, when Ferdinand Magellan first attempted to measure the depth by deploying a 732 m weighted line but did not reach the bottom (Murray, 1895). The United States’ first major foray into the Pacific was the Explorations Expedition (1838–1842); while this expedition mapped many of the Pacific Islands for the first time, it largely ignored the marine fauna and oceanographic conditions (Philbrick, 2004). The first systematic oceanographic exploration of the Pacific (as part of a circumglobal tour) was the Challenger Expedition in the mid-1870s, which discovered 715 new genera and 4,417 new species globally in 4 years, with 37% of the sampling effort focused on the Pacific (Murray, 1895). Despite this Herculean effort, the vast majority of the Pacific still remained (and remains) unexplored.
The United States has approximately 60% of its exclusive economic zone (EEZ) in the Pacific, and characterizing these Pacific benthic habitats is important to (a) fundamentally understand and effectively manage US submerged resources, (b) enable novel insights into Pacific benthic ecosystems, and (c) to establish baselines of these habitats to better understand their vulnerability and resilience to change. To address the growing need for exploration in the Pacific US EEZ, the National Oceanic and Atmospheric Administration (NOAA) launched a 3-year exploration campaign entitled CAPSTONE: Campaign to Address Pacific monument Science, Technology, and Ocean NEeds. Led by NOAA’s Office of Ocean Exploration and Research (OER), CAPSTONE was a multiyear initiative to collect deep-water mapping and seafloor characterization data – providing a baseline dataset. These data were primarily acquired via the NOAA Ship Okeanos Explorer in and around US EEZ, US marine protected areas (MPAs), and international sister sites in the central and western Pacific (Friedlander et al., 2016). CAPSTONE was initiated in July 2015 and concluded in September of 2017, and engaged nearly 270 scientists, student researchers, and managers, making it one of the largest dedicated ocean exploration efforts ever conducted by the US government (Leonardi et al., 2018).
Deep-water areas documented during CAPSTONE (Figure 1; track lines) included nearly every type of marine geological feature, including conical seamounts, guyots, banks, ridges, islands, atolls, vents, and abyssal habitat. Given the consistency in operations over a wide geographic and temporal scale, CAPSTONE may provide one of the largest systematically acquired, basin-wide data sets across the Pacific Ocean with 187 remotely operated vehicle (ROV) dives spanning numerous ecosystem types and 597,230 km2 of seafloor mapped. These data have created an incredible opportunity to examine broad-scale geographic patterns of benthic deep-sea diversity, and also present the opportunity for discovery of new taxa and geologic features, as well as the quantification of the unknown.
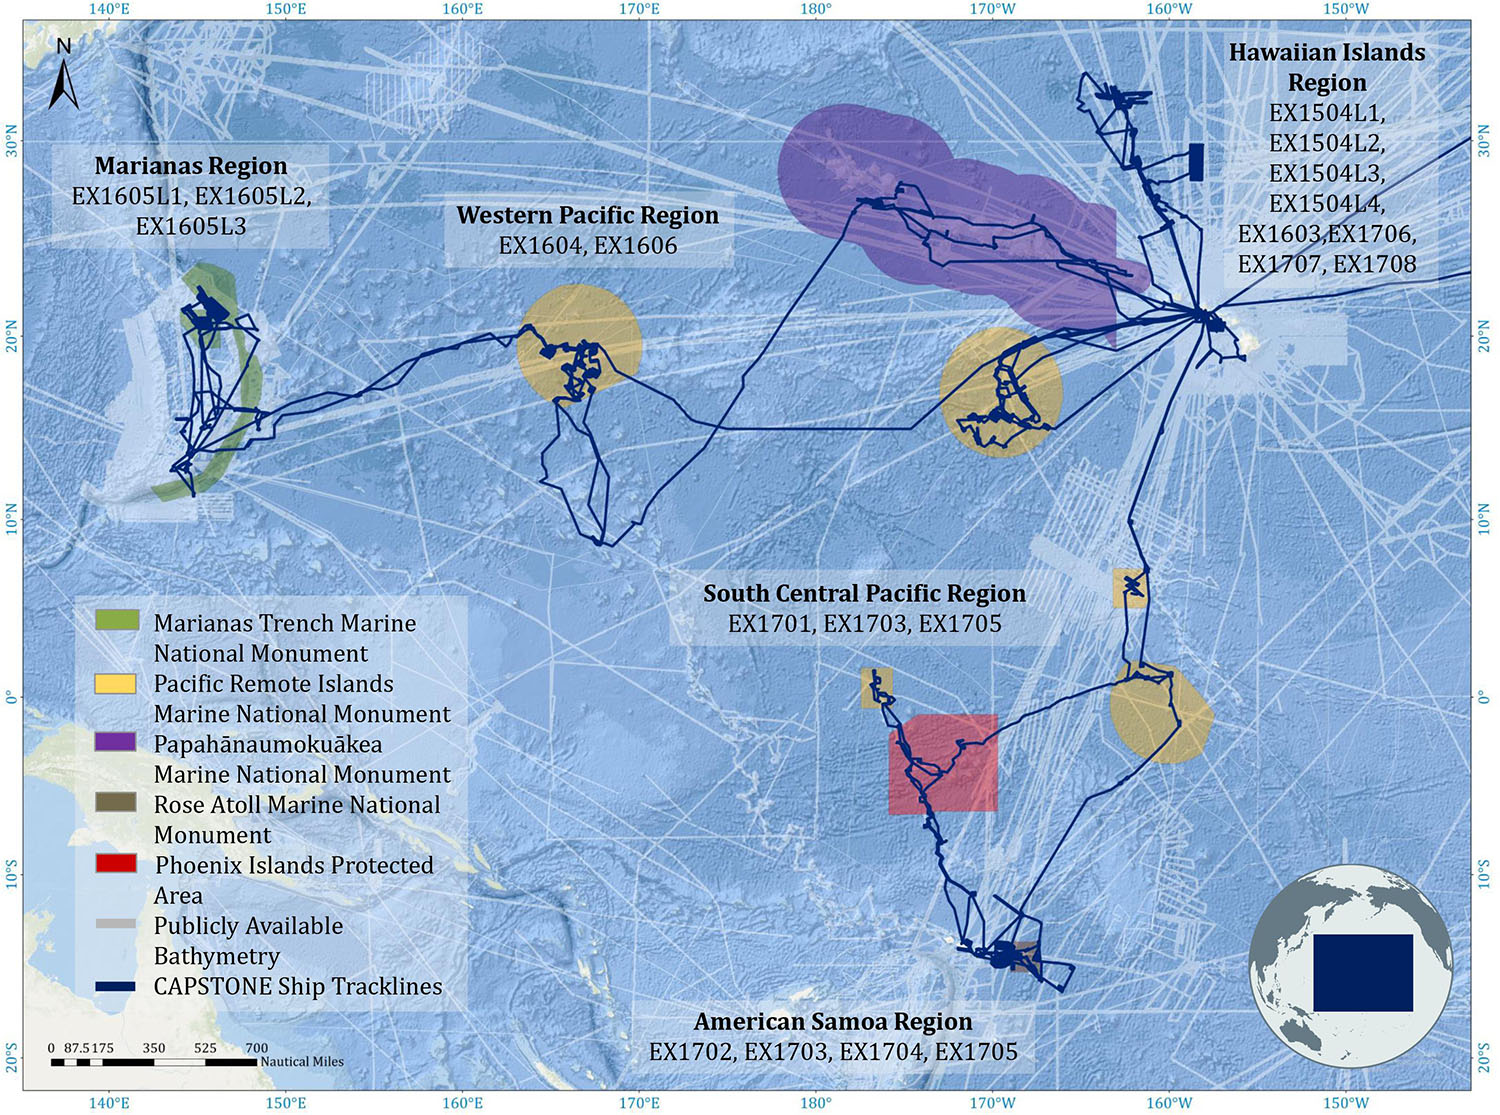
Figure 1. Multibeam EM302 operations conducted by NOAA Ship Okeanos Explorer (dark blue ship track lines) during CAPSTONE 2015–2017. Existing bathymetry background layer was obtained from National Centers for Environmental Information (NCEI), made available through a request to NCEI staff to provide multibeam footprint of data held at NCEI.
It is a widely held assumption that most deep-sea biota are yet-to-be-discovered (Mora et al., 2011). As such, the process of exploration in the deep-sea goes hand-in-hand with the task of species collection and description, and pending that, grappling with the unknown. For most of the world’s taxa, both extant and extinct, unknowns must be estimated because they cannot be directly measured. For example, with 527 genera of non-avian dinosaurs known from fossil and genetic evidence, there are an estimated ∼1,850 genera total, but the true number may never be known (Wang and Dodson, 2006). Microbial diversity is another area that requires estimation, typically using a combination of genetics and statistics (e.g., Hughes et al., 2001). In the deep-sea, species diversity has also only been estimated to-date. For example in the Mediterranean, species diversity was estimated across taxa and depth with rarefaction curves, and it was found that each unique habitat or ecosystem contributed significantly to biodiversity (Danovaro et al., 2010). Across these (and other) studies, the challenge of adequately estimating species diversity is a major source of attention and debate. However, in the case of CAPSTONE, a unique opportunity is presented in that the unknowns are visually identified as unknown taxa. Each observed organism was assigned the highest confidence taxonomic identification, or characterized as unidentified, creating an inventory of what can (and cannot) be identified by video and images, noting that taxonomic evaluation remains pending for many organisms collected during CAPSTONE.
Benthic exploration science is evolving, looking to answer more sophisticated questions regarding drivers of biodiversity, patterns of reproduction and recruitment, genetic and ecosystem connectivity, oceanographic influences on benthic diversity and abundance, and trophic connectivity (McClain and Rex, 2015; McClain and Schlacher, 2015; Baco et al., 2016). To begin to address these questions, one aim of this paper is to quantitatively assess the contributions of unknown taxa to deep-sea biodiversity. Another objective is to contextualize the known taxa by depth, geologic feature, and geographic region in terms of diversity and abundance patterns. Finally, this paper will describe, with broad strokes, the findings of CAPSTONE in terms of mapping and visual surveys, to become a resource for future investigations of Pacific patterns of diversity and abundance.
In this study, >347,000 individual organisms were recorded across a subset of 168 dives, coupled with over 597,230 km2 of seafloor mapped, to look for emergent patterns of diversity and abundance by depth, benthic feature, and geographic region. We explored these patterns in more detail for a single class, Anthozoa, and two phyla, Porifera and Echinodermata, which together were the three most characterized biota by both diversity and abundance during CAPSTONE. Because CAPSTONE is the first modern-era exploration expedition of this scope, we describe, in great detail, the technology and methodology employed to obtain data used for analyses. The main goals of this paper are thus to generate a detailed methodological description and a high-level data overview of the CAPSTONE campaign. The specific scientific aims are to (a) describe what we now know about the Pacific deep-ocean, and (b) describe what we still don’t know about the Pacific deep-ocean, and how to contextualize these findings and challenges.
Materials and Methods
Expeditions
Mapping and exploration took place aboard the NOAA Ship Okeanos Explorer, a 68 m vessel equipped with a full suite of mapping sonars capable of telepresence-enabled operations. While CAPSTONE efforts were further augmented by Schmidt Ocean Institute’s R/V Falkor and other partners, we exclusively worked with Okeanos Explorer data in this study. The Okeanos Explorer was also equipped with a dedicated two-body ROV system, Deep Discoverer (D2) and Seirios, with a 6,000 m depth rating. Using telepresence, the ship was able to sail with only two to three scientists onboard while simultaneously interfacing with dozens of scientists onshore to provide real-time, minute-to-minute feedback and scientific expertise (Kennedy et al., 2016). A suite of Internet-based tools connected the remote teams to enable a unique exploration model with global reach, input, and diverse feedback.
This community-driven science agenda was operationalized with a designated science lead or co-science leads, coupled with a NOAA OER expedition coordinator, who together were responsible for building a consensus among the full community of participants and scientists, regardless of their onboard vs. telepresence participation. In this manner, expertise was available organically or “on-call,” and interdisciplinary teams of scientists could collaborate on common interests, which were usually focused around organisms, depth range, region, or geological feature. To help guide at-sea operations throughout CAPSTONE, NOAA adopted a set of guiding exploration themes: support priority US Monument and Sanctuary science and management needs; identify and map vulnerable marine habitats – particularly high-density deep-sea coral and sponge communities; characterize seamounts in and around the Prime Crust Zone (PCZ), a region with the highest concentration of commercially valuable deep-sea minerals in the Pacific (Hein et al., 2013); investigate the geologic history of Pacific seamounts; and increase understanding of deep-sea biogeographic patterns across the central and western Pacific (Leonardi et al., 2018). Additional scientific objectives were also solicited in each operating area from local stakeholders, resource managers, and the science community to help address region-specific data gaps and management needs.
Mapping
Acoustic mapping during CAPSTONE was conducted with EM302, EK60, and Knudsen sub-bottom profilers (SBP) (Supplementary Table 1). The EM302 is a multibeam sonar with nominal frequency of 30 kHz, capable of providing data to a water depth of ∼7,000 m. The system is capable of producing three different types of data: bathymetry, seafloor backscatter, and water column backscatter. The data were collected using Kongsberg’s Seafloor Information System (SIS version: 4.3.2). The bathymetric data were processed in near real-time and results made available to participating scientists. Acoustic data collected by EM 302, EK60, and Knudsen SBP data, along with preliminary processed products, are publicly available at National Centers for Environment Information (NCEI). To understand the structure of the seafloor, bathymetric data (summarized in Figure 1) was examined at a grid resolution of 25–50 m (depth dependent).
Dive Site Selection
All dive sites were chosen through the collaborative process between the ship- and shore-based science participants. Priority targets were submitted pre-cruise, and then refined over a series of dive planning meetings (pre-cruise, pre- and post- each ROV deployment). Throughout the expedition, operational planning meetings streamed data via high-definition video originating on-ship to provide situational awareness for the shore-based team, showing the latest bathymetry and other available data, previous exploration in the region, and current weather conditions. In selecting dive sites, lessons learned were implemented throughout each expedition, and dive targets were refined based on feedback from previous dives. Care was taken to focus dive and mapping effort on sites and depths that were unexplored by previous efforts. For example, in the Hawaiian Islands region, there had been numerous dives by the Pisces submersibles (1973–present), and thus CAPSTONE focused efforts below the Pisces maximum operating depth of 2,000 m.
ROV Dives
All ROV dives in CAPSTONE were conducted with NOAA’s dual body 6,000 m rated ROV system Deep Discover (D2) and Seirios that were operated by the Global Foundation for Ocean Exploration (GFOE) personnel. ROV dives typically last 8 h, but were occasionally extended to 10+ h based on science objectives, at-sea conditions, and operational limits. Dives were primarily conducted during the day for ease of operations for the crew (described in detail by Quattrini et al., 2015). Seirios is negatively buoyant and therefore remains in the water column, directly below the stern of the ship. It is tethered to the Okeanos Explorer with a standard oceanographic armored, fiber-optic cable (1.73 cm diameter), and operated 3–10 m above D2, providing additional lighting and allowing for wide landscape views of the seafloor. D2 was linked to Seirios with a neutrally buoyant tether, isolating the ROV from surface ship’s motion and allowing precise maneuvering in steep bathymetry close to the seafloor (0–4 m). D2 typically traversed the seafloor at a speed of approximately between 0.1 and 0.3 knots (1 knot = 0.514 m s–1) and normally operates between 0 and 1.5 m above the seafloor. Both ROVs were outfitted with a suite of high-definition video cameras, two of which were maneuverable and used principally for scientific observation; these data were recorded for archival and subsequent analysis. All HD video from Seirios and D2 were recorded in PRORES 1080i format. In addition, numerous fixed pilot cameras were used in real-time, but data were often not recorded or used for scientific operations. Lighting consisted of numerous LED lamps providing 272,000 lumens of light across both vehicles. D2 has eight LED lamps mounted on four hydraulically positioned booms to allow for precise adjustment to the light field. During every descent, the HD cameras on D2 are color- and white-balanced in situ to a known reference card to ensure accurate color on the video. During the dive, expert video engineers made minor color balance adjustments to compensate for changes in water clarity and location of the object of interest within D2 light field (Gregory et al., 2016).
To record physical oceanographic measurements, Sea-bird 911 + conductivity–temperature–depth (CTD) loggers with dissolved oxygen (DO) sensors were attached to both D2 and Seirios and recorded for the entire duration of the dive. In 2017, Oxidation and Reduction Potential (ORP) and light scattering sensors (LSSs) were added to the vehicles suite of sensors. In addition to the CTD to log ambient water conditions, D2 was equipped with a high temperature probe to make targeted measurements of vents or brine flows. Paired lasers (10 cm apart) were mounted on the primary high-definition video camera to estimate the size of objects being imaged.
Deep Discover was also equipped with two manipulator arms that were used to collect physical samples. Throughout CAPSTONE, NOAA practiced a limited sampling protocol, only collecting a few voucher samples per dive. During 2015 and 2016, the only biological samples collected were those that were thought to be potential new species, or demonstrate a substantial range extension. In 2017, the sampling protocol was widened to include collection of dominant-morphotype taxa that could not be identified by video. In addition, geological samples were collected on the majority of dives to aid in isotopically dating features and to help characterize the overall geology of the dive site.
Area Imaged
An Ultra Short BaseLine (USBL) navigation system was used on D2. The precision and accuracy of the system is heavily dependent on water depth, and to a lesser degree both sea state and local bathymetry (Wu et al., 2017). The accuracy of this system can range between ∼5 and 50 m depending on these conditions. In addition to this wide range, there were additional operational decisions and technical limitations that made it difficult to quantify the total seafloor area captured on video. These challenges include: (1) distinguishing errors in the USBL navigation versus rapid changes in vehicle position, due to rapid and abrupt movement as D2 searched for new and novel organisms or maneuvered around geological features and (2) the continuous and constant tweaks and adjustments to the camera angle and zoom values that are required to precisely calculate view angle, but were not recorded.
To provide estimates of the seafloor area imaged during CAPSTONE, we quantified the minimum and maximum area of seafloor likely documented during a dive to provide a range of possible area visualized. The average of that range was used to estimate the area of seafloor imaged. To accomplish this, we measured the linear distance traveled by D2 by manually tracing a line of best fit based on the subsampled (1 Hertz) USBL navigation file provided by NOAA as part of the ROV data collection available via the OER Digital Atlas (see the section “Data Management”). When D2 is at an altitude of 1 m, and the camera angle of the primary HD camera is at a 45-degree angle, the field of view yields 2.7 m of seafloor horizontally across the video frame (assuming a steady ROV heading). Because the pilots were nearly continuously changing the heading of the vehicle while scanning the seafloor, as well as flying the vehicle at variable altitudes as the bathymetry dictated, we estimated a visual swath width of a minimum of 5 m (2.5 m on either side of the vehicle path over the bottom) and a maximum of 50 m (calculated as twice the effective length of the tether connecting D2 and Seirios). The minimum range value of 5 m corrects for the changes of altitude and heading changes. The maximum range value of 50 m estimates the effective length of the neutrally buoyant tether between D2 and Seirios. While the tether is on average 30 m in length, the effective tether length is more accurately estimated at 25 m given the placement of positively buoyant floats, and the difference in depth between the vehicles. Therefore, the maximum range assumes that D2 can never move >50 m quickly without having to move the ship, which controls the movement and placement of Seirios. Any move of >50 m would be slower and would be clear in the USBL navigation, and is easy to distinguish from erroneous readings in navigation files. Based on these assumptions and estimates, we assume that the area surveyed during CAPSTONE dives included the seafloor between 2.5 and 25 m on both sides of the averaged dive track.
Image Annotation
A detailed video analysis was carried out at the University of Hawai‘i, supported by NOAA’s Deep Sea Coral Research and Technology Program (DSCRTP). The annotation creation process was completed based on benthic video from Okeanos Explorer using Video Annotation and Reference System (VARS), created by the Monterey Bay Aquarium Research Institute (Schlining and Stout, 2006) and customized for the University of Hawai‘i. VARS was used to generate records of animals from ROV dive video captured while on the seafloor. This system was used to quantify the abundance of deep-sea fishes, corals, sponges, and associated animals observed during CAPSTONE. The records of deep-sea invertebrates and fishes were catalogued and characterized with their in situ environmental conditions including habitat, substrate, water chemistry, and geographic location. Animals were identified using a deep water identification guide, with 1,700 reference images prepared with taxonomic assistance from experts around the world1.
All records were subjected to a custom quality assurance/quality control (QA/QC) protocol, looking for inconsistencies in depth, substrate, and identifications. Any potentially problematic records were re-reviewed in triplicate for QC. In addition, each identification was double-checked against the WoRMs online taxonomic database. The annotations used in this study can be accessed through the DSCRTP web-based data portal2.
In total, there were 89,398 annotations describing the presence of taxa in an area, yielding more than 347,000 individual organisms recorded (abundance) across 168 dives over the 3-year CAPSTONE campaign. While there were 187 ROV dives completed in total during CAPSTONE, we eliminated dives that were focused on marine archeology, midwater exploration, and ROV engineering trials for the purposes of this study, for a total of 168 dives used in this study.
Annotation Limitations
Many annotations made during CAPSTONE expeditions could not be identified to a specific taxon and thus were categorized as “unidentified” or unknown. This category includes several types of unknowns: (a) unclassified species that are new to science, (b) organisms that require microscopy for identification, and (c) bad imagery where the detail required to make an identification is not available. These limitations make it impossible to draw conclusions about the absolute number of unknowns. However, given that all the CAPSTONE annotations were based on video from the same platform, and analyzed by the same team at the University of Hawai‘i, data collection and analysis were consistent across the entire 3-year CAPSTONE campaign. Thus, comparisons between unknowns observed across feature, depth, and region are valid as a relative comparison.
Analysis
Sample Selection and Groupings
All dives were characterized by the predominant geological feature on which the dive took place, geographical region, and the depth of the vehicle when the annotation was made.
The geological feature categories (Table 1) were as follows: (a) Island: emergent land mass at the summit but is not an atoll, (b) Atoll: emergent land mass at the seamount summit with a central lagoon, (c) Bank: a seamount where the summit depth is shallower than 200 m but does not break the surface, (d) Guyot (Tablemount): a flat top seamount that is expected to have a carbonate cap and was thought to have once been emergent, (e) Conical Seamount: an underwater mount rising at least 1,000 m above the surrounding seafloor that has a cone shaped summit, (f) Ridge Seamount: an underwater mount rising at least 1,000 m above the surrounding seafloor that has a ridgeback summit feature that is connected continuously with several other feature to from a subsea ridge, (g) Inactive vent system: any area that was obviously previously hydrothermally altered or has had a recent volcanic activity creating new seafloor, (h) Active vent system: any site that has active warm or hot water venting caused by geological activity, (i) Abyssal: any area between 4,000 and 6,000 m.
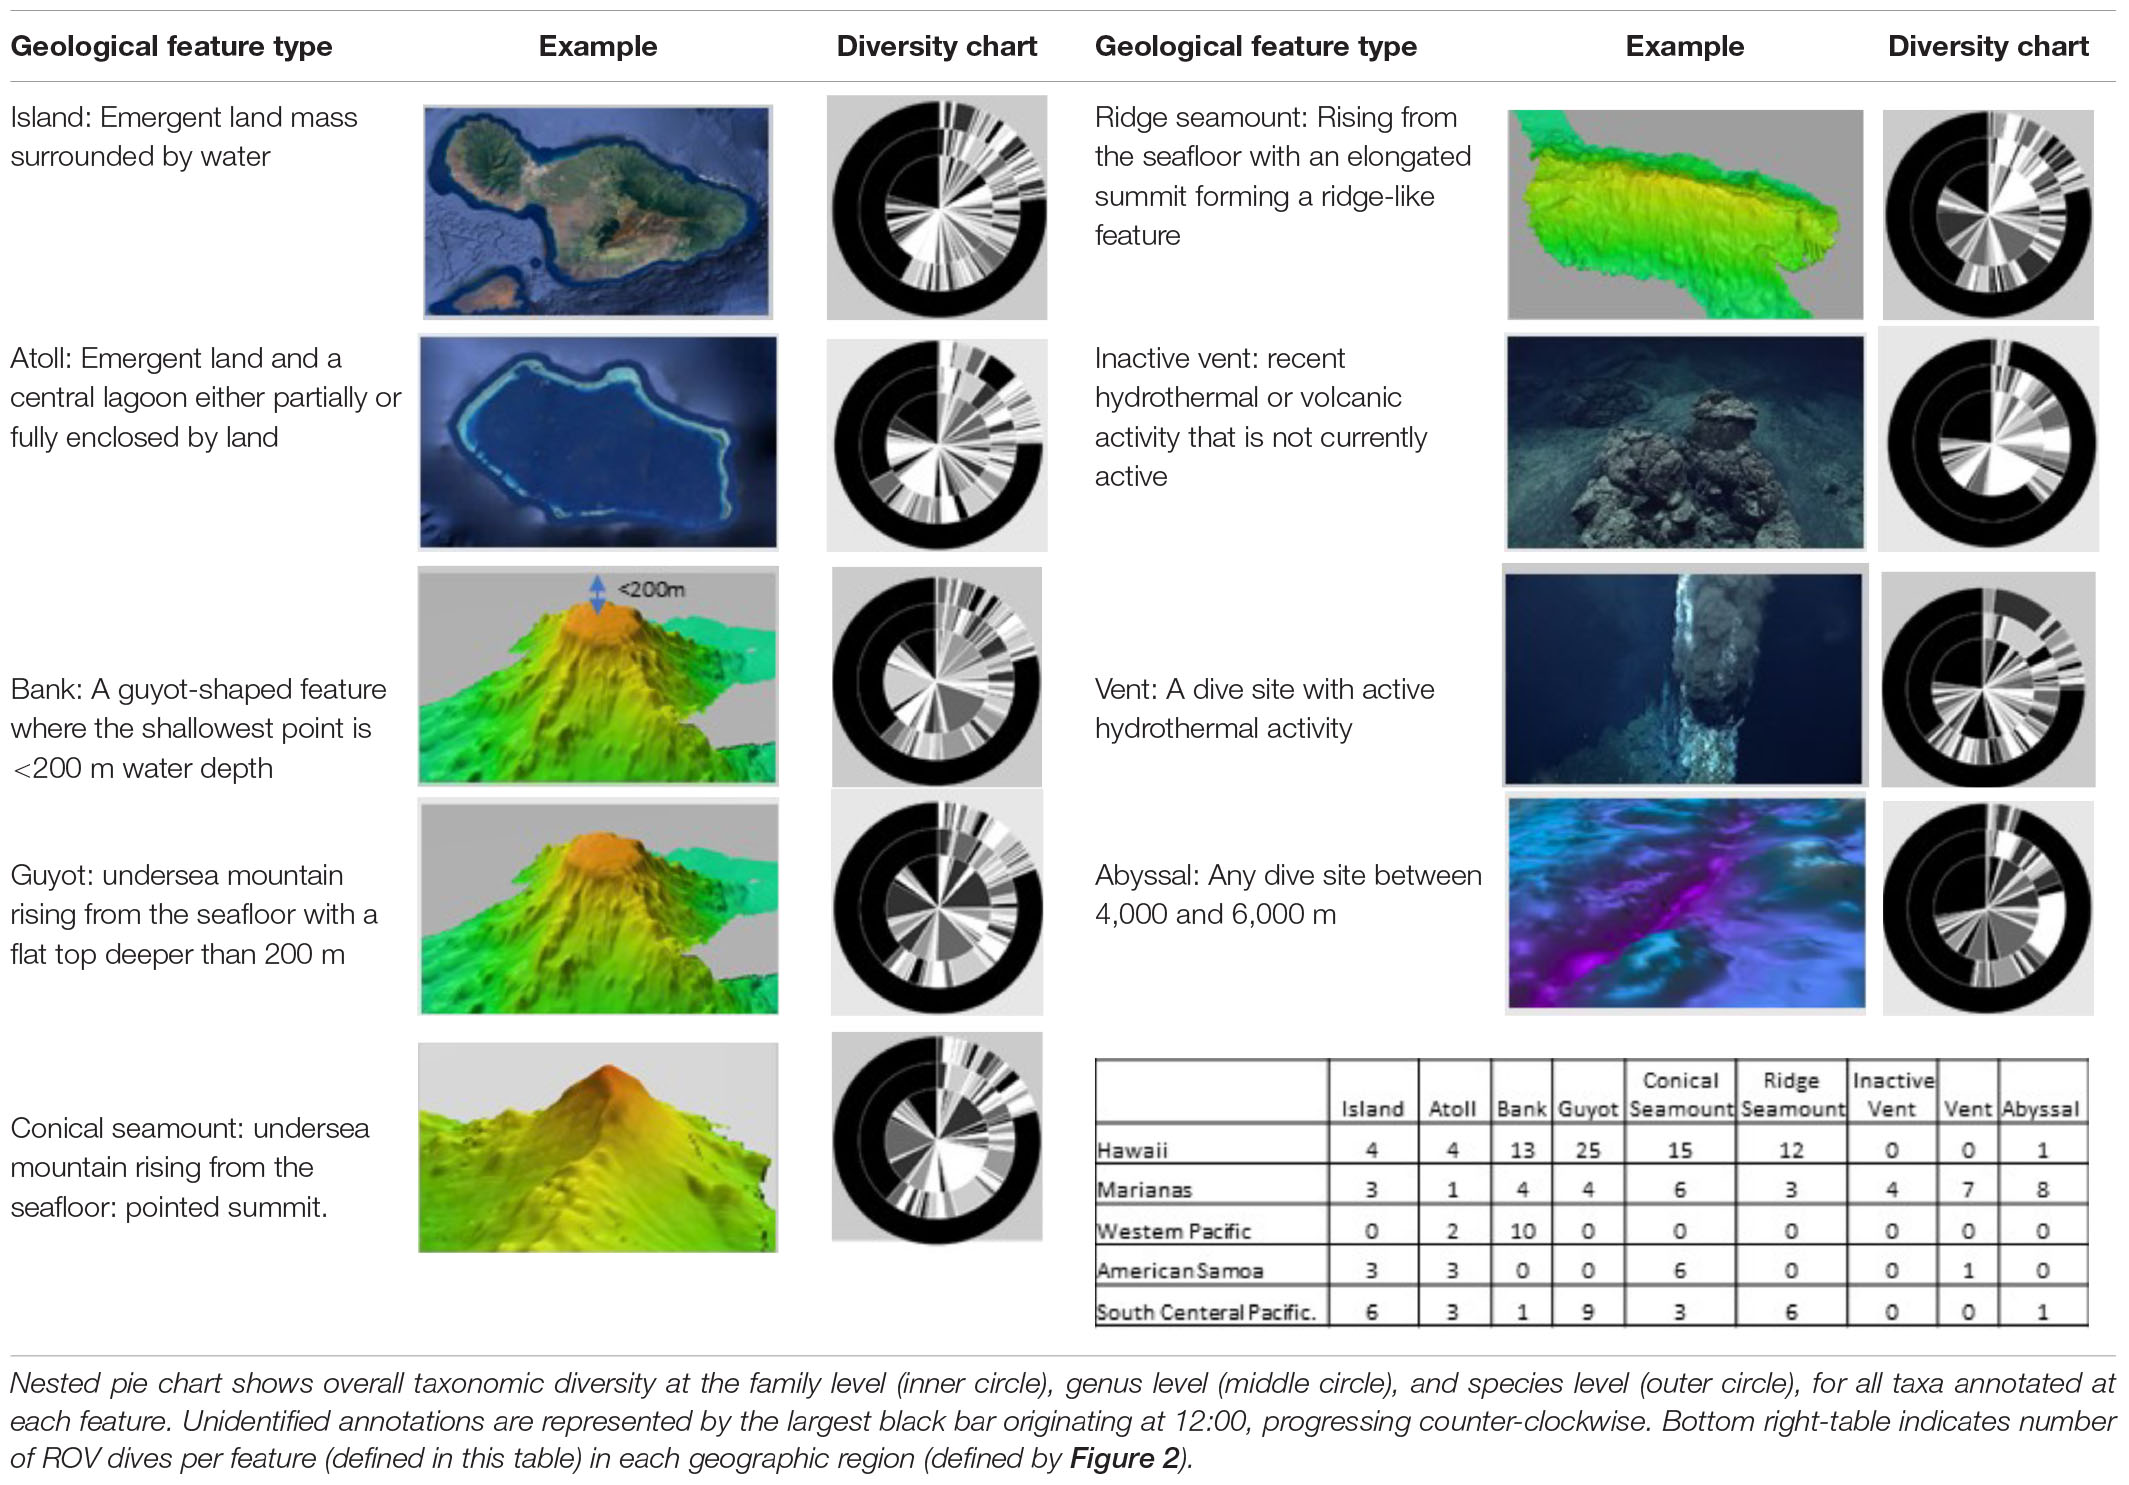
Table 1. Definitions and diversity associated with the nine geological features measured by CAPSTONE.
The geographic regions (Figure 2 and Supplementary Figure 1) were as follows: (1) Hawaiian Islands Region, including the main inhabited Hawaiian Islands, the Northwest Hawaiian Islands, Johnston Atoll, Geologist and Musician Seamounts; (2) Marianas region, including all dives conducted within the US EEZ around Guam and the Commonwealth of the Northern Marianas Islands (CNMI); (3) Western Pacific Region, including the US EEZ surrounding Wake Island and the High Seas between Wake and Guam; (4) South Central Pacific Region, including all dives conducted in the Phoenix and Line Islands, as well as in the US EEZ around Jarvis Island and along the Manihiki Plateau; and (5) American Samoa, which includes all dives conducted in the US EEZ around American Samoa. The American Samoa region was broken out based on a hypothesized biogeographic break in the area (Watling et al., 2013; Herrera et al., 2018). Of note, the following features were not included in this paper, but do have some limited representation (20 dives) in the CAPSTONE campaign: archeology dives, submerged cultural heritage sites, midwater dives and transects, engineering dives, and special purpose dives for equipment recovery. Archived data associated with these dives can be found via the OER Digital Atlas (see the section “Data Management”).
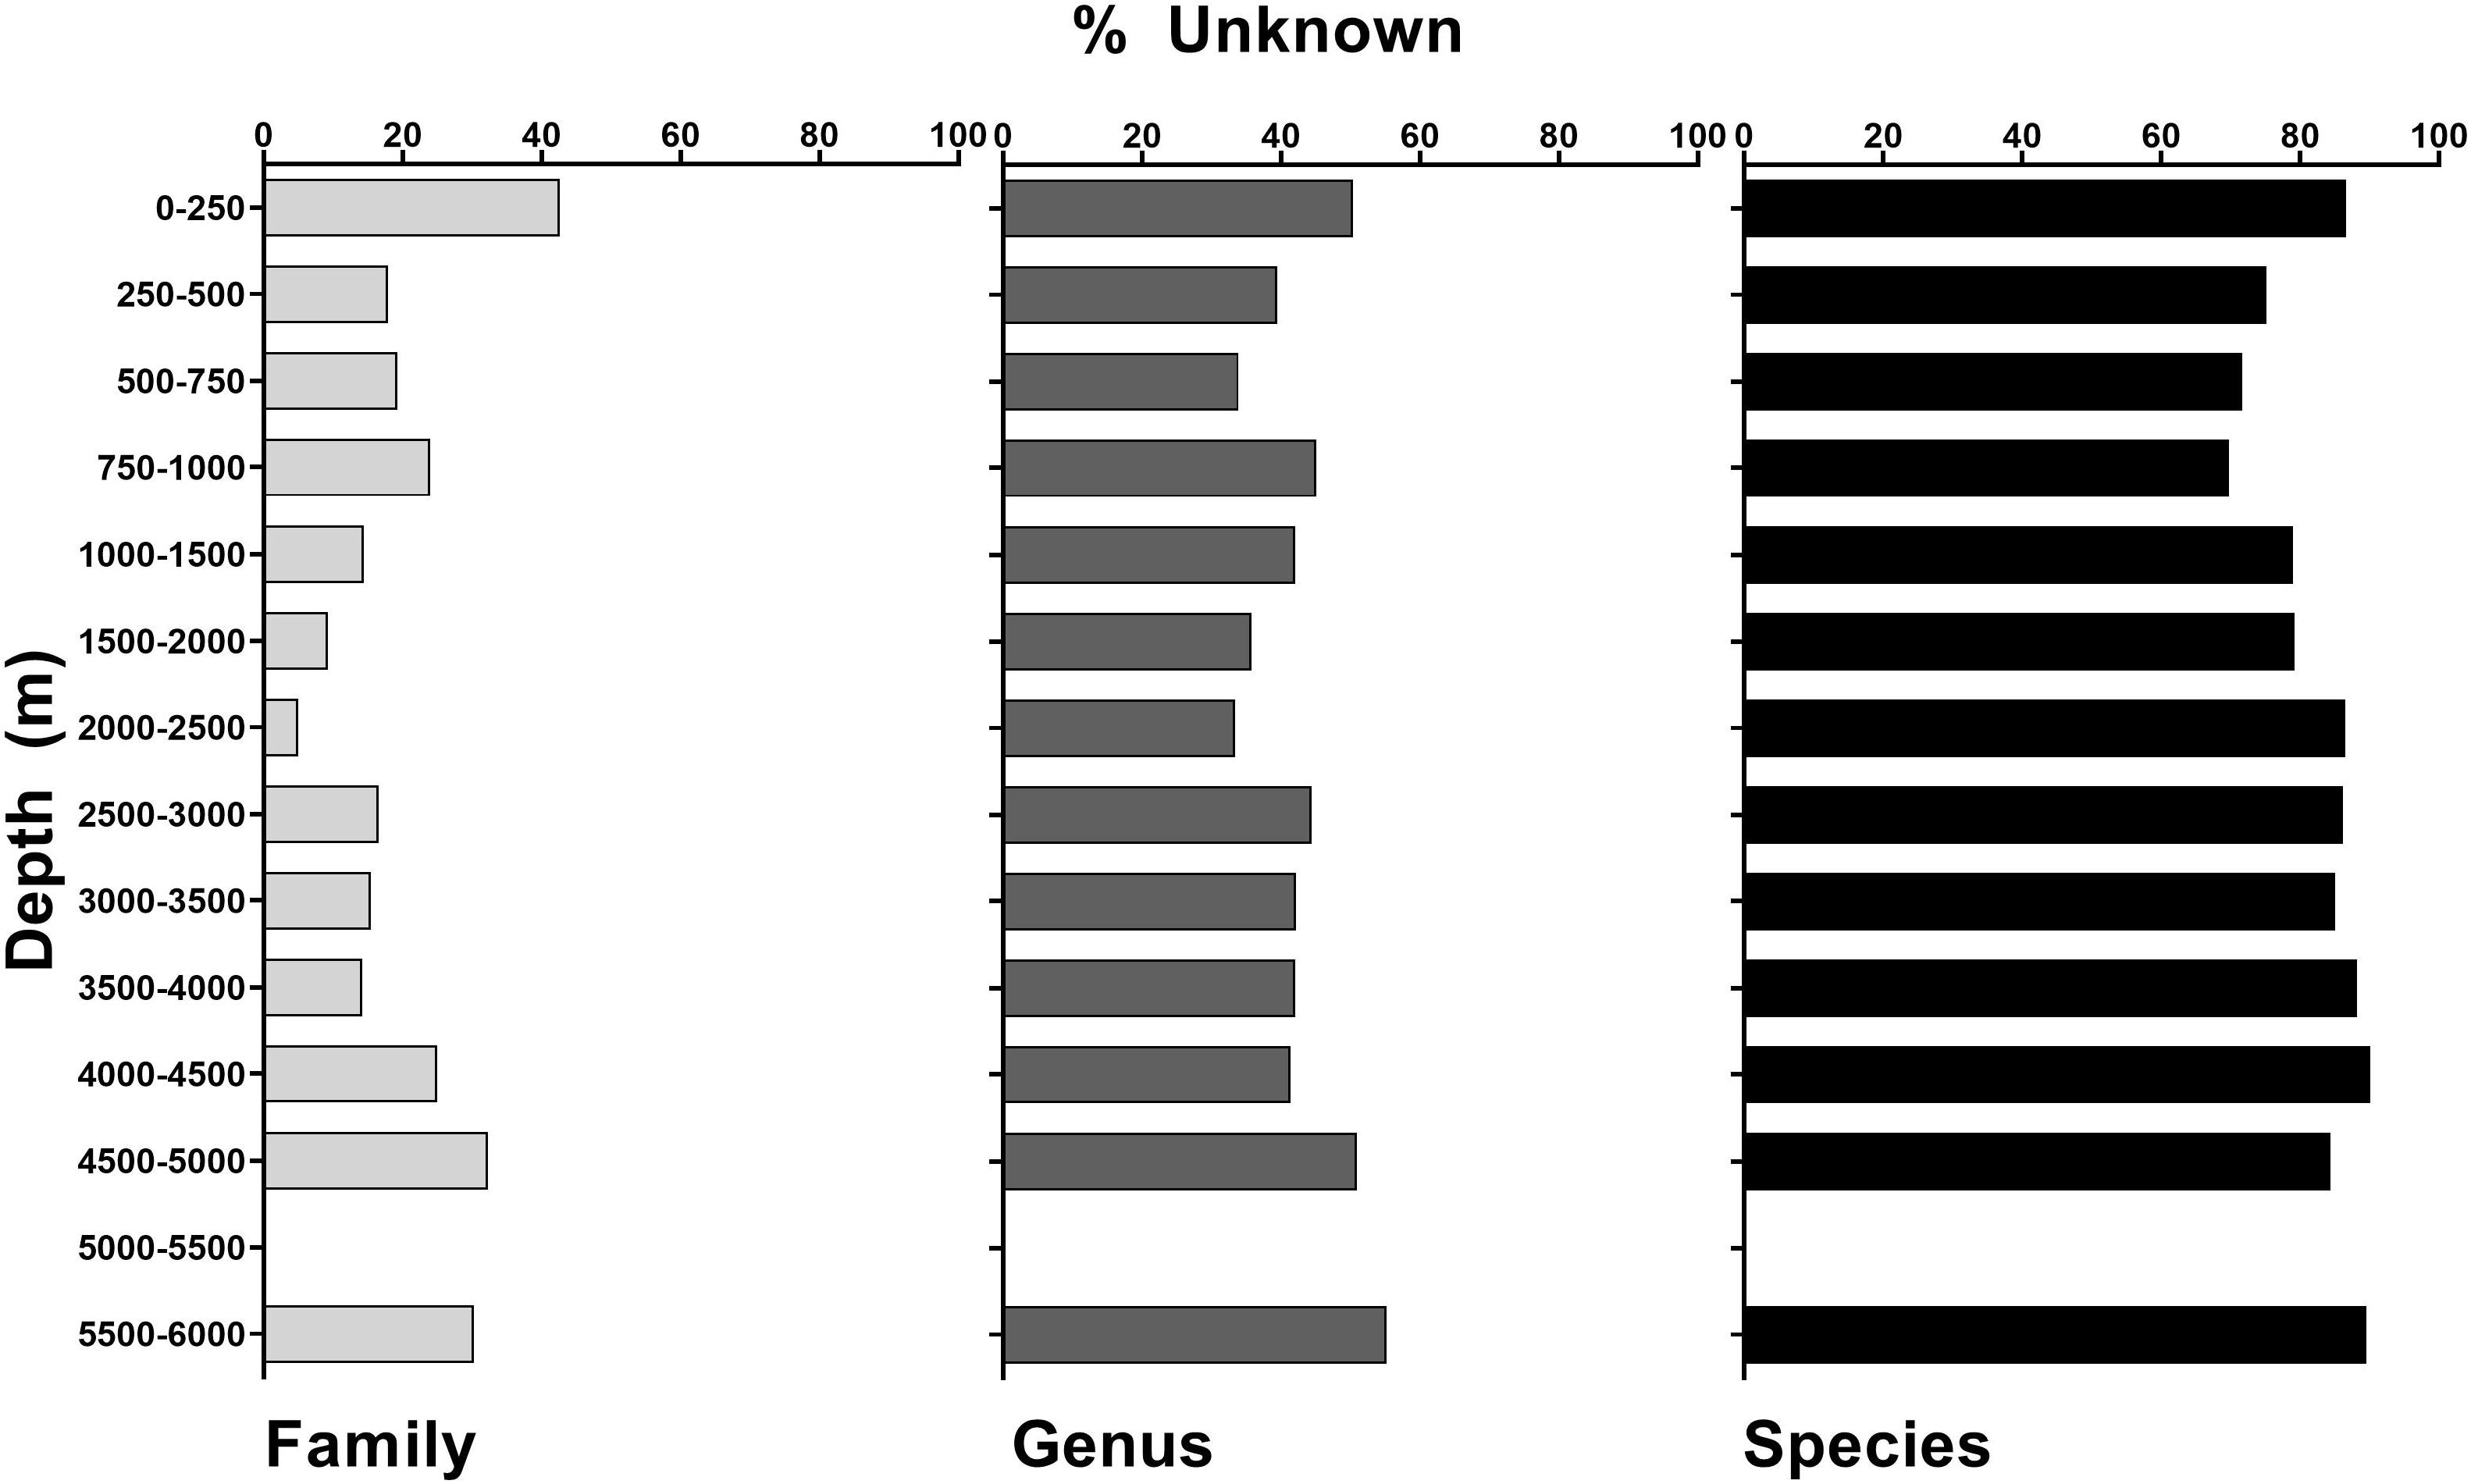
Figure 2. CAPSTONE ROV dive sites (black dots) organized by region (Marianas, Western Pacific, Hawaiian Islands, South-Central Pacific, American Samoa). Marine Protected Areas boundaries are indicated by polygons. Nested pie charts show overall taxonomic diversity at the family level (inner circle), genus level (middle circle), and species level (outer circle), for each region. Unidentified annotations are always represented by the largest black bar originating at 12:00, progressing counter-clockwise.
Abundance Calculations
Annotations in the DSCRTP web-based data portal were recorded (1) each time an individual taxa was seen (presence), and (2) the number of individuals seen at the same time (abundance). We used presence data for nested pie-charts and for depth ranges within each taxonomic group. Abundance data were displayed and used for regional comparisons (Shannon–Weiner diversity indices and corresponding heat maps), and for groupings by feature. We chose a conservative cap of a maximum of 100 individuals seen in any one observation period to correct for inaccuracies when organisms were too abundant to count. Thus, our abundance calculations are likely very conservative in total number of organisms.
Diversity Calculations
To visually examine relative taxonomic diversity at the family, genus, and species level within taxa, across region, and across feature, nested pie-charts were generated depicting all known annotated organisms vs. all unknown (represented by the largest black bar originating vertically at the 12 o’clock position, progressing counter-clockwise). In every nested pie-chart, diversity at the family level is represented by the inner circle, the genus level is represented by the middle ring, and species level is shown on the outer ring. Pearson’s chi-square statistics was calculated to compare known versus unknown annotations across taxa, or between taxonomic levels. Pearson’s chi-square tests were completed using R (version 3.5.1).
To ecologically compare taxonomic diversity between the five geographic regions (American Samoa, Hawaiian Islands, Southern Central Pacific, Western Pacific, and Marianas), video annotations were used to analyze community composition. Annotations were grouped by region and then assessed for abundance, evenness and diversity, using Shannon–Weiner’s index (Levin et al., 2009; Rex and Etter, 2010). Overall diversity, relative abundance (the proportion of focal organisms relative to the total observed), and evenness (a measure of organismal distribution across taxa) were assessed for each region at the family and genus levels. Separately, genus-level diversity, abundance, and evenness were assessed for Anthozoa, Echinodermata, and Porifera, the three taxonomic groups with the largest number of annotations. Annotations that could not be identified to a family or genus (categorized as “unknown”) were excluded from family and genus diversity analyses.
Measures of genus-level density were calculated using observation-based rarefaction curves (taxa accumulation curves, in this case, at the genus-level), with 95% confidence intervals. This analytical technique provides a means to standardize taxonomic counts to a given level of sampling-effort, in this case, number of ROV dives conducted. Rarefaction curves were computed using the community ecology Vegan package for R, version 3.5.1 (Oksanen et al., 2018). Results are reported for the number of genera observed for each ROV dive, tabulated separately for Anthozoa, Porifera, and Echinodermata. Rarefaction curves were tabulated by depth, broken down into bins of 0–1,000, 1,000–2,000, 2,000–3,000, 3,000–4,000, and 4,000–6,000 m depth, with the number of ROV dives corresponding to the number of dives per depth.
Non-metric multidimensional scaling (NMDS) plots were created using the 35 most abundant genera for Anthozoa, Porifera, and Echinodermata. Plots were created using Bray–Curtis dissimilarity in the metaNMDS function in the R vegan package (Oksanen et al., 2018). To plot major taxa by geographic region and geologic feature, the most abundant genera were selected; for Anthozoa, any genus represented by >1,500 sightings per km2 by geologic feature (N = 37 genera), for Porifera and Echinodermata, any genus represented by >50 sightings per geologic feature (N = 33 and N = 34 genera, respectively).
Data Management
In order to facilitate effective collaborative teamwork between ship and shore through telepresence, Okeanos Explorer expeditions used real-time data management strategies. Data collected on the ship needed to be moved to shore as quickly as possible to help shore-based participants maintain situational awareness. To facilitate this, OER employed a shore-side repository server where data became immediately accessible through a secure File Transfer Protocol (FTP) site. Once the cruise was complete, data from this intermediate repository server were moved to the NOAA’s NCEI long-term archives. This system provided real-time data access during the cruise, and also met the requirements for long-term archival data access and discoverability after the cruise (Mesick et al., 2016). Data were distributed across several different archives within NCEI by data type, and aggregated into a discoverability tool called the OER Digital Atlas3. The OER Digital Atlas provides search capability and links the user to the appropriate data archive to access both raw and processed data. All data collected during CAPSTONE were made publicly available through the NCEI data archives (Mesick et al., 2016).
Although not analyzed in detail as part of this paper, CAPSTONE expeditions collected biological and geological samples, many of which are thought to be new species, new records, or unusual morphotypes. These specimens were archived for public use and future analysis through the Smithsonian National Museum of Natural History Invertebrate Zoology collection and the Oregon State University Marine and Geology Repository. Additionally, genetic subsamples of most biological specimens are available through the Ocean Genome Legacy Center at Northeastern University (Cantwell et al., 2018a).
Results
Mapping
Campaign to Address Pacific monument Science, Technology, and Ocean NEeds contributed a substantial amount of mapping effort, totaling 597,230 km2 (Table 2), with 323 total seamounts mapped. Specifically, Okeanos Explorer mapped 10 atolls, 7 banks, 148 conical seamounts, 114 guyots, 24 islands, and 61 ridge seamounts. Many of these features were located within MPAs, and in many cases, CAPSTONE made major contributions to the overall bathymetry available in these locales (Figure 1 and Table 2). Of the 363,526 km2 mapped during CAPSTONE, 60.86% was within the US EEZ, amounting to 2.99% of US EEZ total. This effort represents 0.37% of the total Pacific Ocean mapped. While CAPSTONE made a contribution to both domestic and international mapping initiatives, the Pacific Ocean is vast, with only 13.78% currently mapped using modern techniques (Figure 1 and Table 2) – highlighting that there remains a substantial data gap in coverage of the Pacific Ocean.
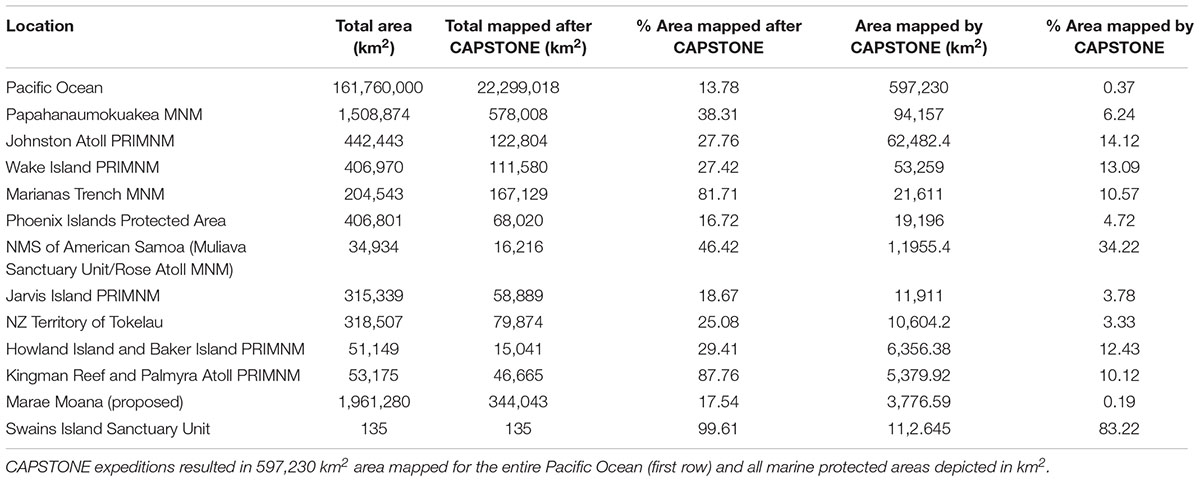
Table 2. CAPSTONE multibeam mapping accomplishments after 3 years of effort by the Okeanos Explorer.
Analysis of Unknown Diversity
Campaign to Address Pacific monument Science, Technology, and Ocean NEeds logged 891.5 h of ROV bottom time over 168 dives, making 89,398 annotations of biota over an estimated 29.3 km2 of seafloor imaged (Table 2). At the family and genus level, 87.2 and 61.4% of taxa were known and identifiable, respectively. However, at the species level, only 21% of taxa were identifiable, with a corresponding 79% unknown (Table 1 and Supplementary Table 2). This trend is consistent across features, depths, and regions (Table 1 and Figures 2, 3). Similarly, the highest percentage of identifiable taxa was always at the family level across regions, features, and depth, and within Anthozoa, Porifera, and Echinodermata (Figures 4–6 inner circle of nested pie-charts; family-level Pearson’s chi-square χ2 = 7,843.5, df = 2, p < 0.001). For echinoderms, there were fewer knowns compared to unknowns at the genus level (Figures 4–6 middle ring of nested pie-charts; Echinodermata-specific comparison across family, genus, and species Pearson’s chi-square χ2 = 8.5642, df = 2, p < 0.001). For all taxa at the species level, there were more unknowns than knowns (Figures 4–6 outer circle of nested pie-charts; species-level Pearson’s chi-square χ2 = 2,057.3, df = 2, p < 0.001). Anthozoa was better categorized at the family and species levels compared to Porifera (Figures 4, 5).
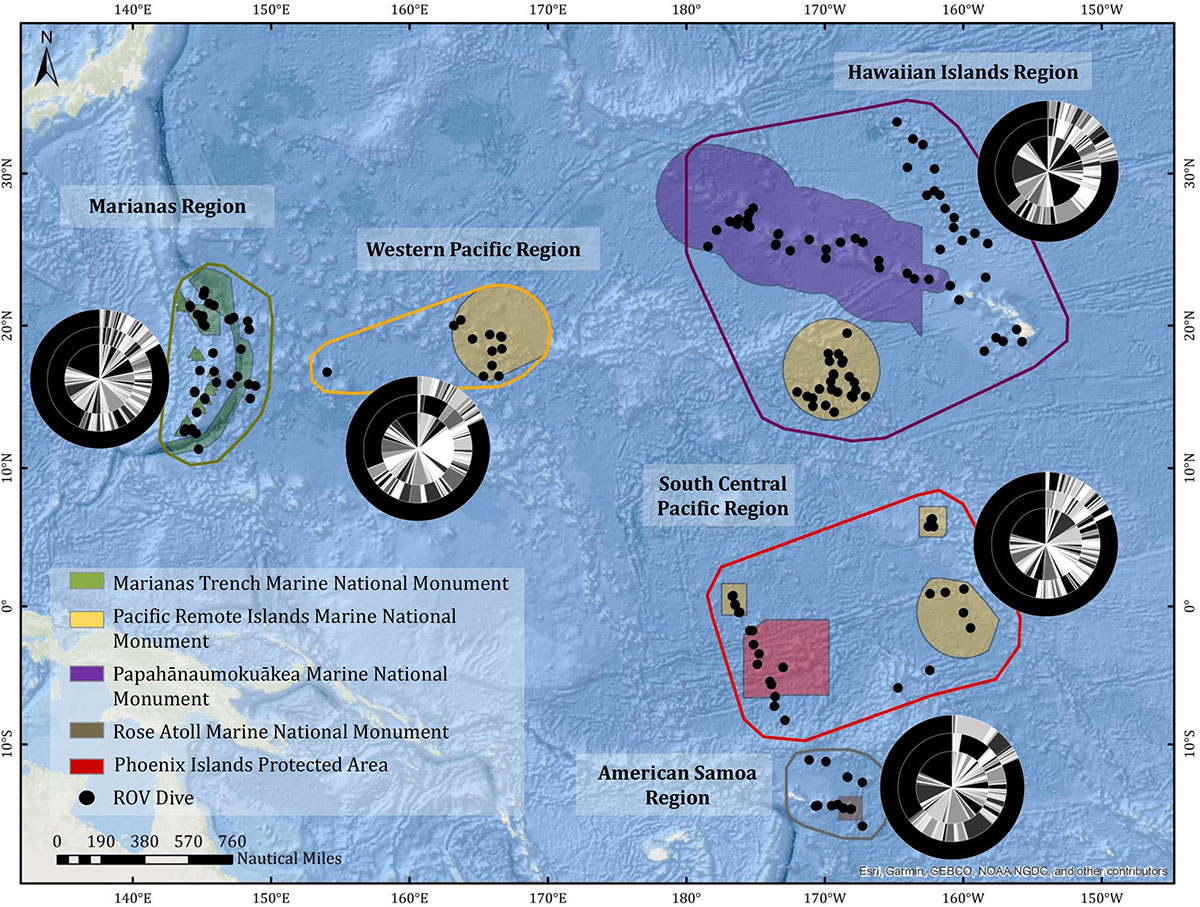
Figure 3. Unidentified annotations (%) across all taxa at the family, genus, and species levels for all of CAPSTONE, demarcated by depth ranges.
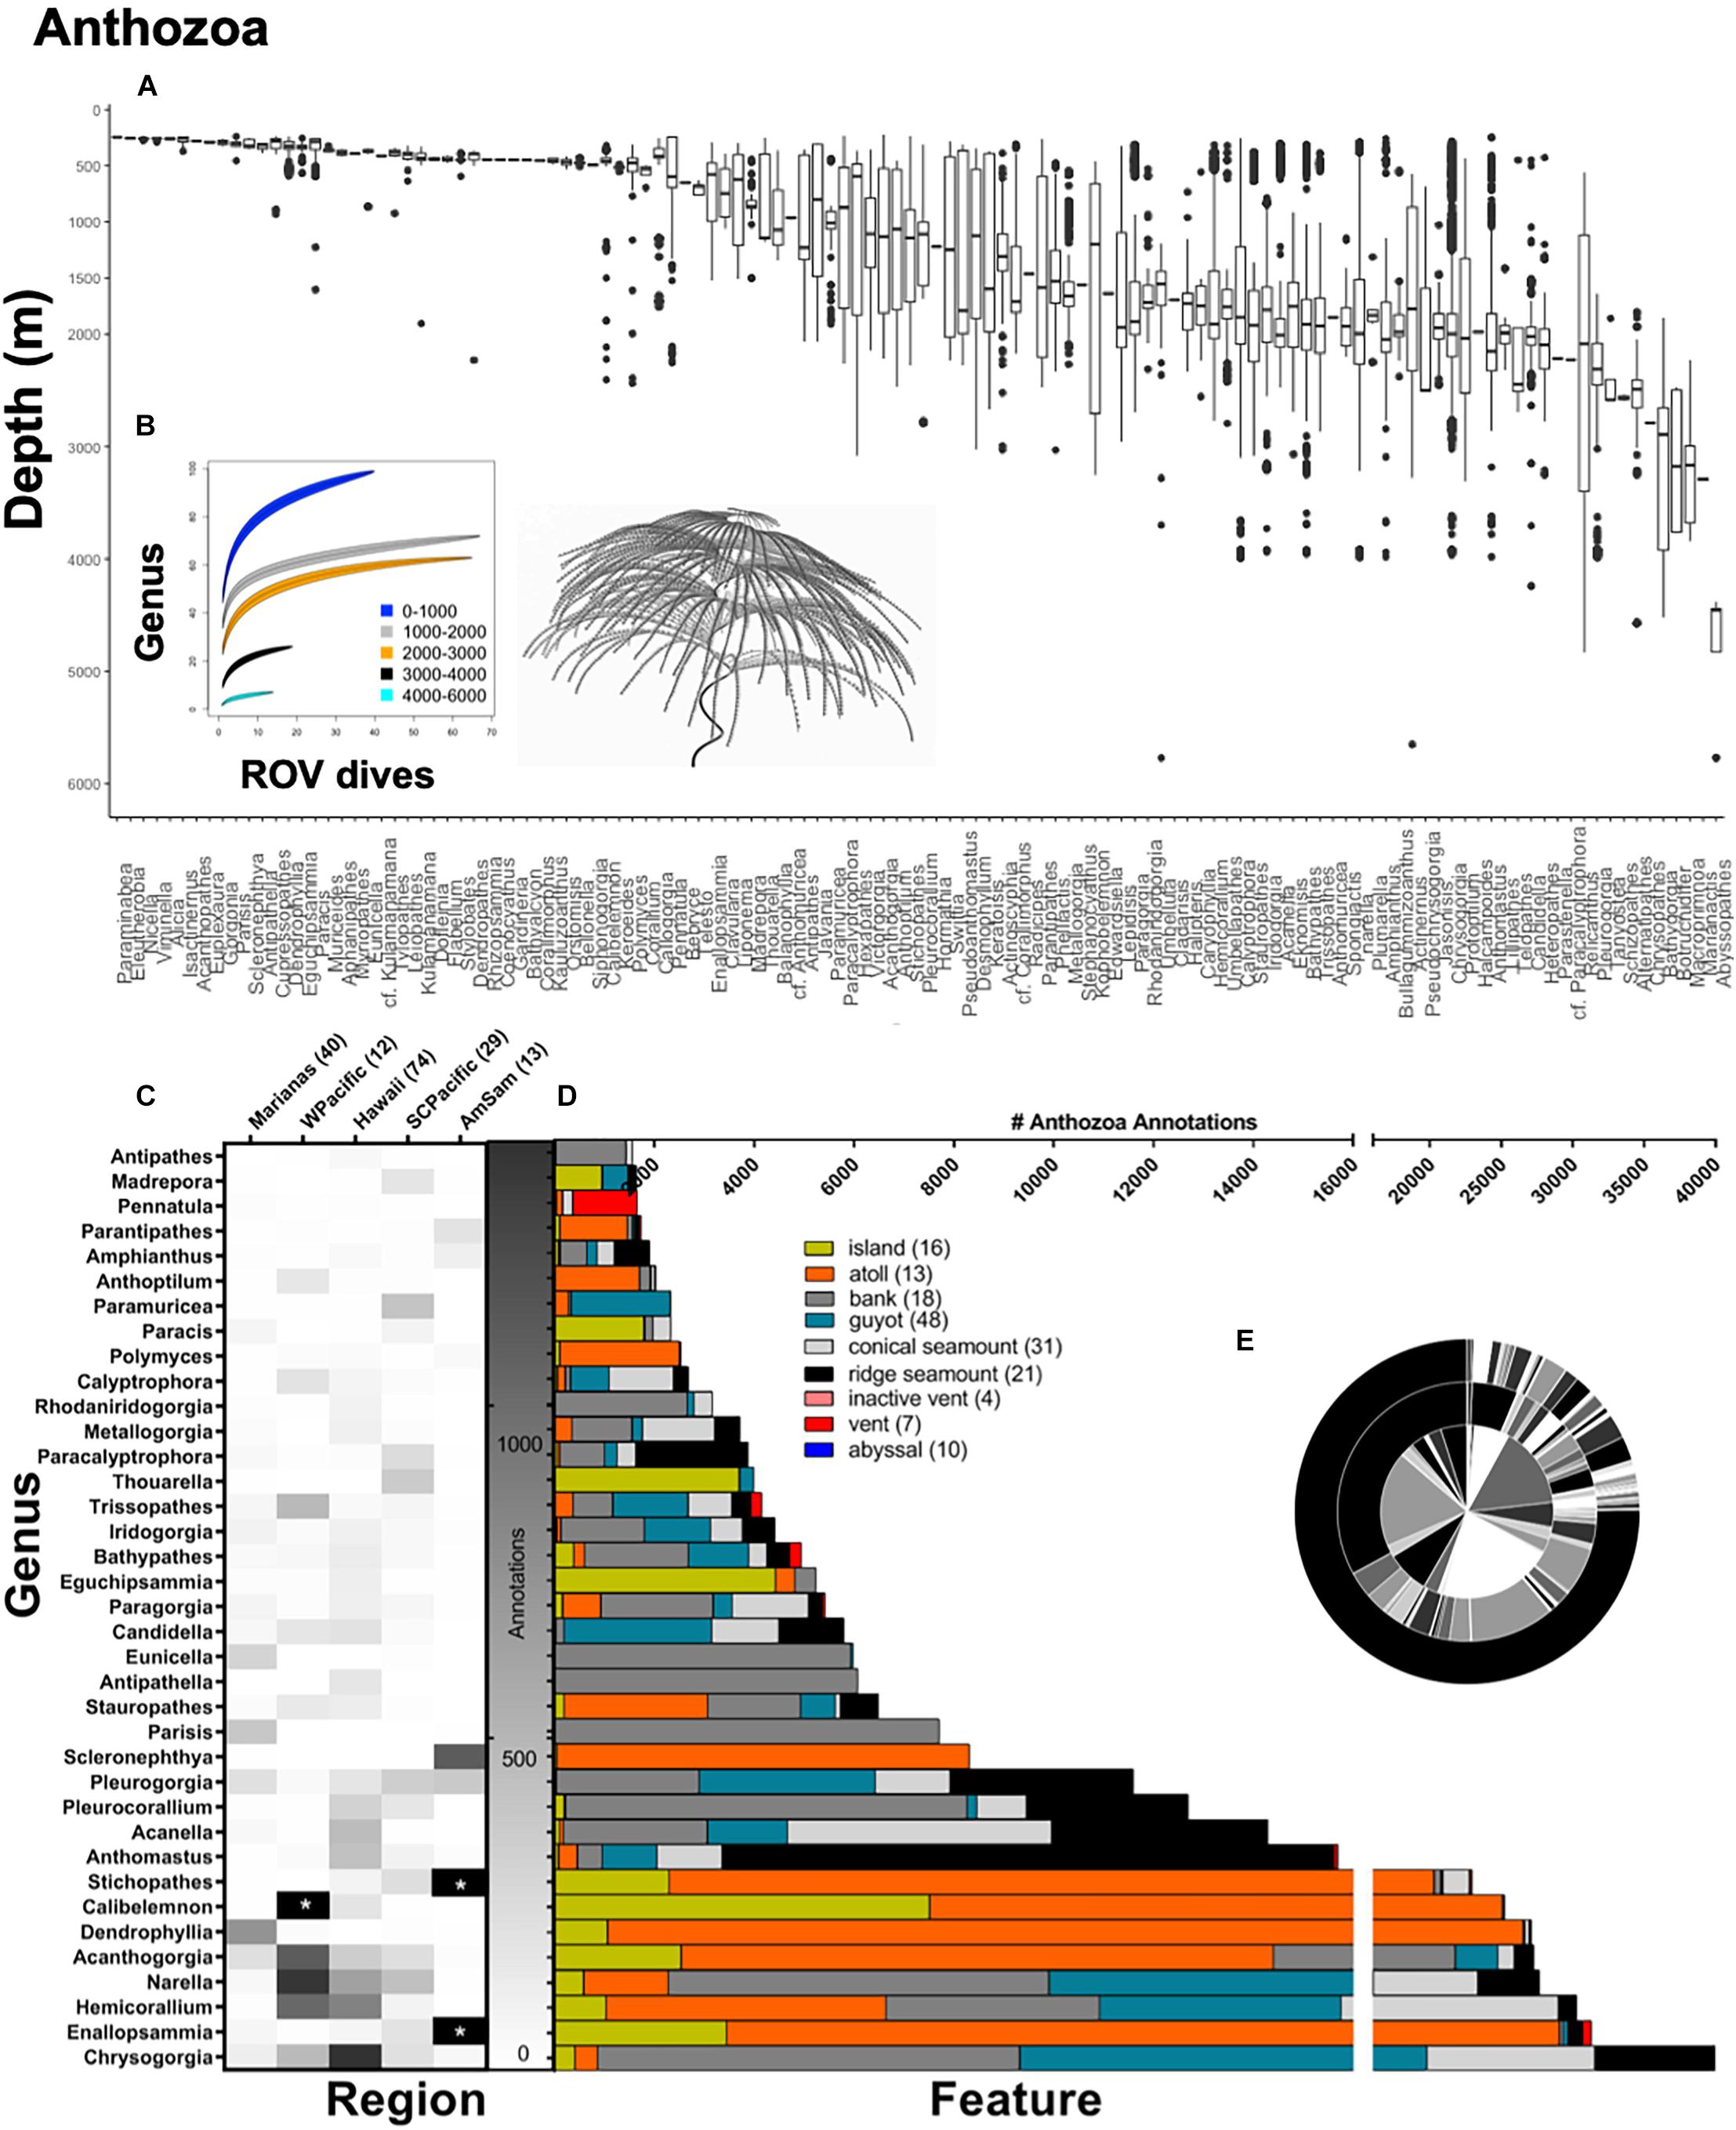
Figure 4. Top panel: (A) Anthozoa annotations at the genus-level demarcated by depth (m). A total of 221,264 anthozoan annotations were used to make box-and-whisker plots, organized from shallow to deep along the x-axis. A total of 122 anthozoan genera were observed over CAPSTONE. Rarefaction curves (B) are shown for all of Anthozoa (122 genera), color coded by depth 0–1,000 m (blue) 1,000–2,000 m (gray), 2,000–3,000 m (orange), 3,000–4,000 m (black), and 4,000–6,000 m (cyan). Lines are drawn with a 95% confidence envelope. Bottom panel: Anthozoa annotations representing at the genus-level demarcated by (C) geographic region and (D) geologic feature; the number of dives for both are in associated parentheses. A total of 37 anthozoan taxa are shown, representing every genus where 1,500 observations or more were made during CAPSTONE. Starred boxes on heatmap represent abundances outside the range represented, specifically, 33,080.25 Enallopsammia spp. corals and 24,342.32 Stichopathes spp. were observed (corrected for effort) in American Samoa. Axis breaks by feature do not omit any data; breaks instead allocate annotation effort on different scales. (E) Nested pie chart shows overall taxonomic diversity at the family level (inner circle), genus level (middle circle), and species level (outer circle), for all anthozoans annotated. Unidentified annotations are represented by the largest black bar originating at 12:00, progressing counter-clockwise.
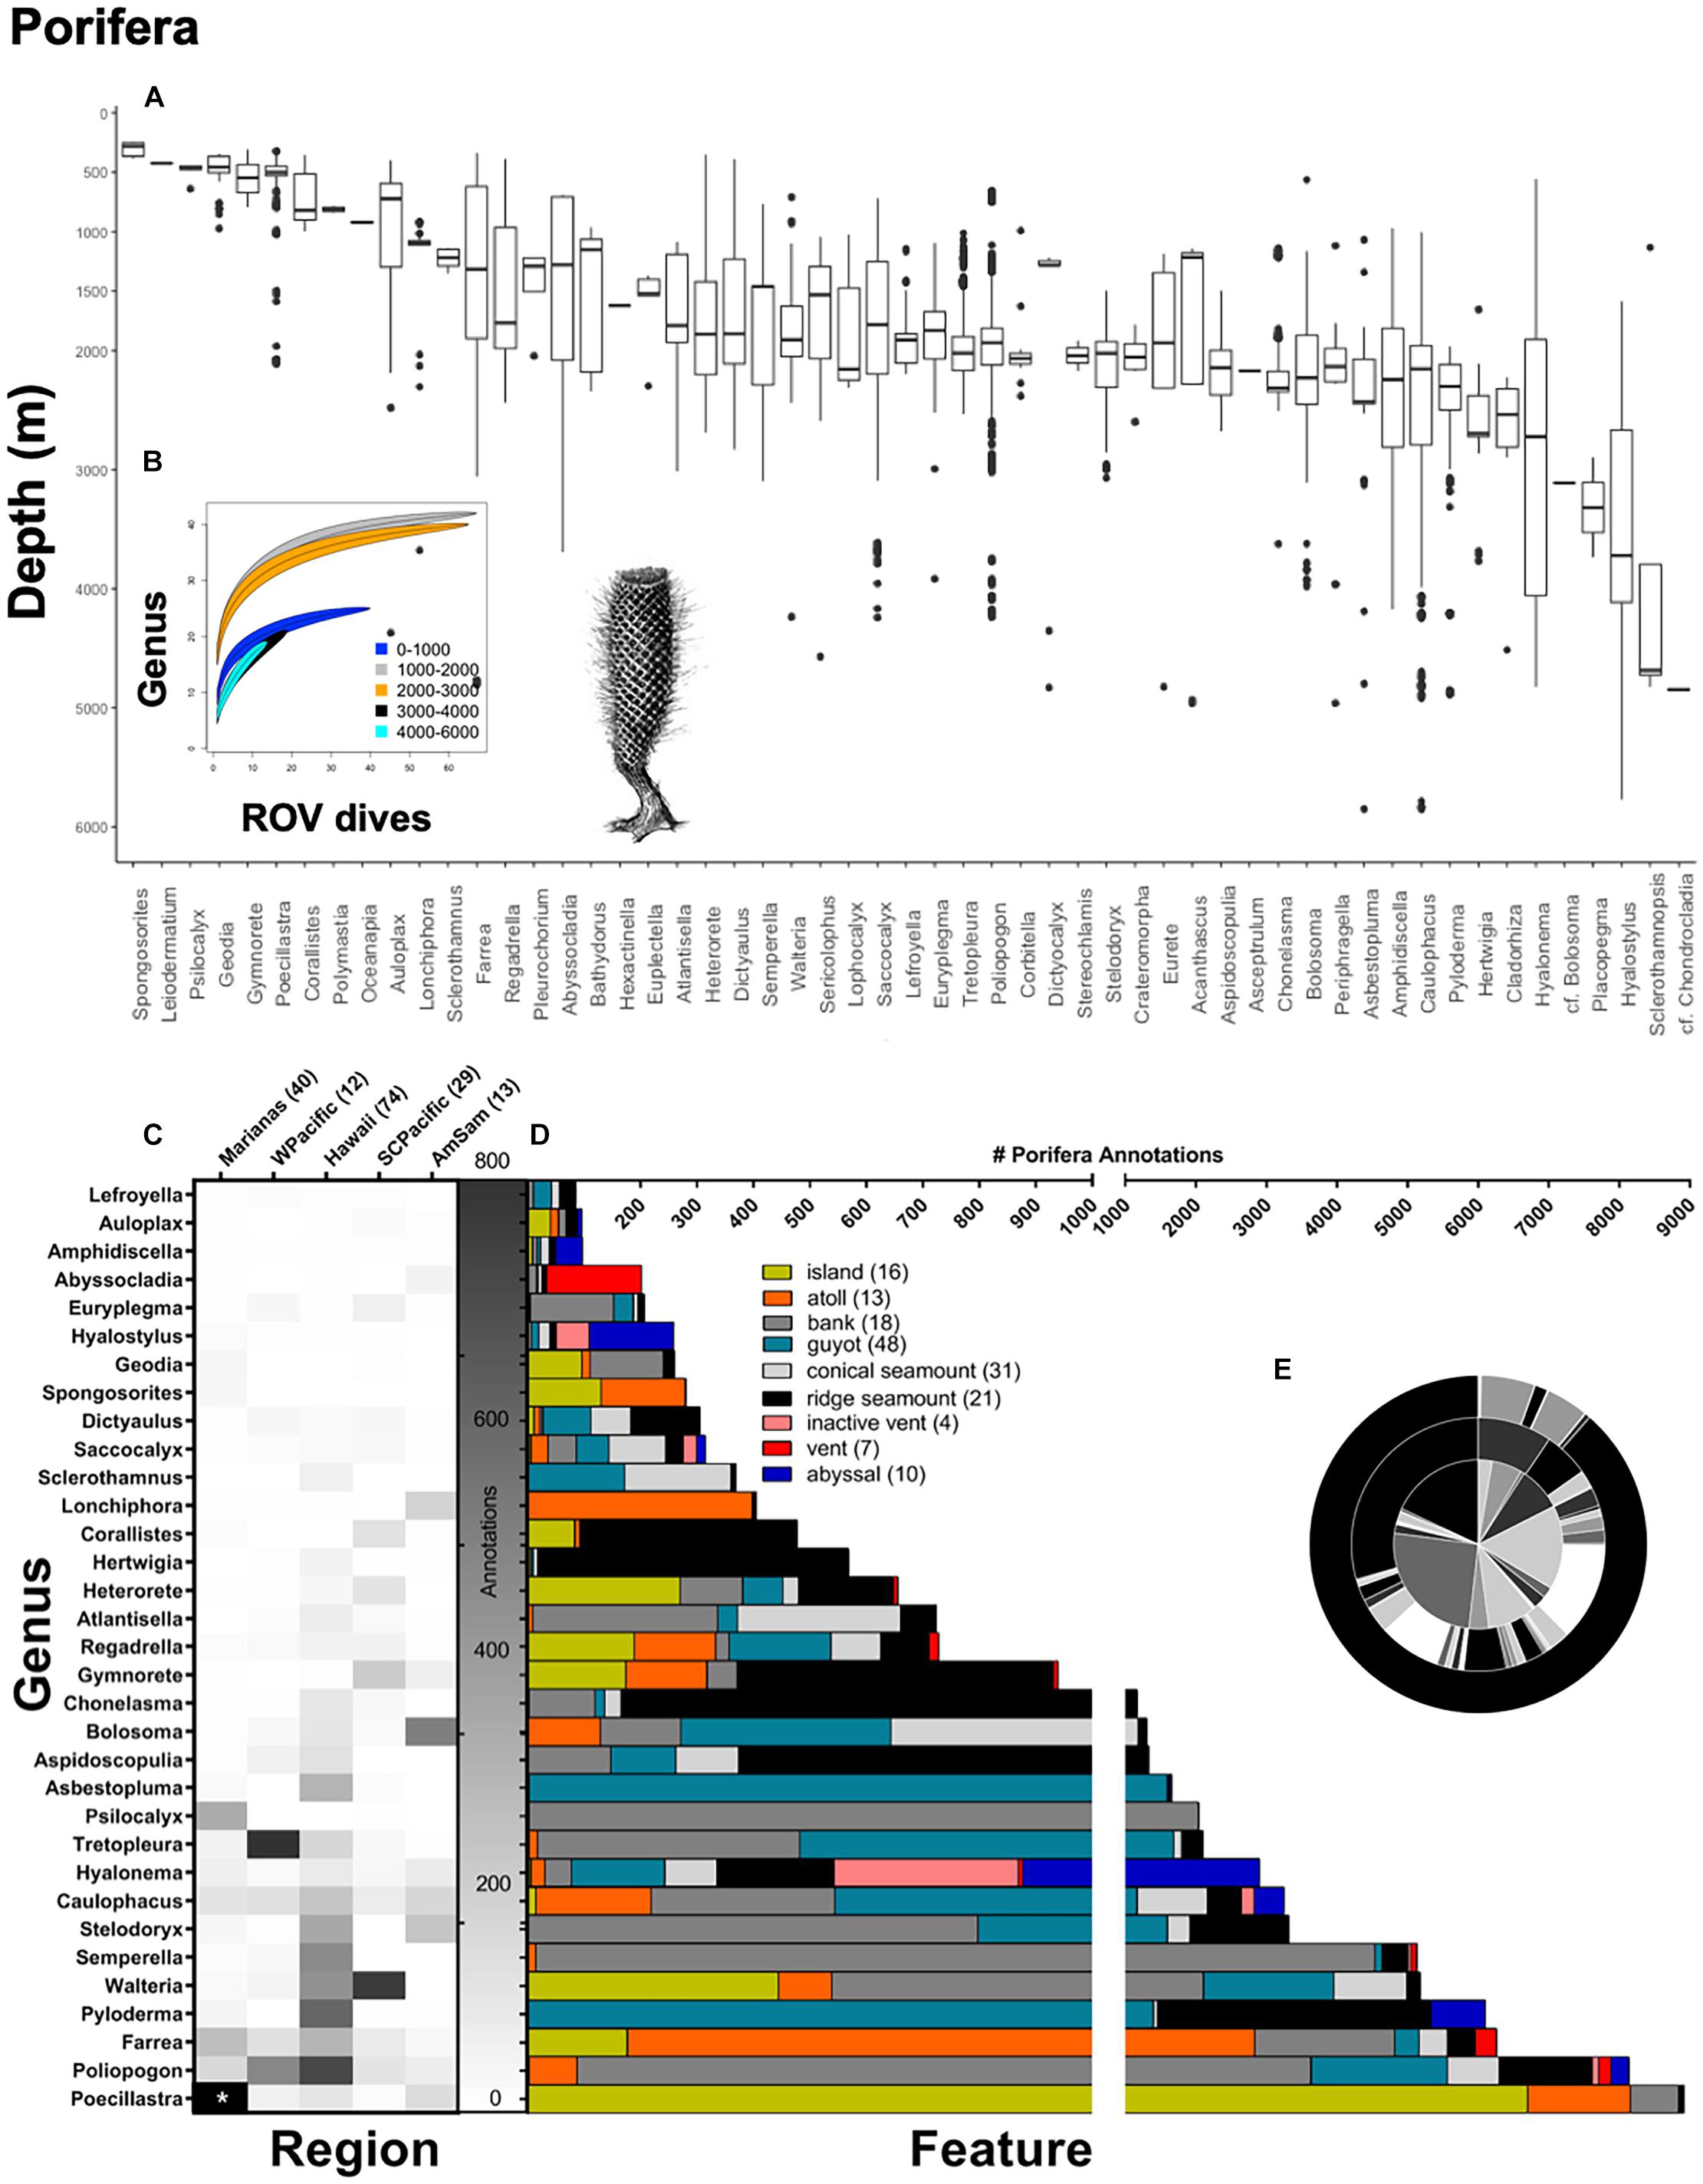
Figure 5. Top panel: (A) Poriferan annotations at the genus-level demarcated by depth (m). A total of 46,128 poriferan annotations were used to make box-and-whisker plots, organized from shallow to deep along the x-axis. A total of 55 poriferan genera were observed over CAPSTONE. Rarefaction curves (B) are shown for all of Porifera (55 genera), color coded by depth 0–1,000 m (blue) 1,000–2,000 m (gray), 2,000–3,000 m (orange), 3,000–4,000 m (black), and 4,000–6,000 m (cyan). Lines are drawn with a 95% confidence envelope. Bottom panel: Porifera annotations representing at the genus-level demarcated by (C) geographic region and (D) geologic feature; the number of dives for both are in associated parentheses. A total of 33 poriferan taxa are shown, representing every genus where 50 observations or more were made during CAPSTONE. Starred boxes on heatmap represent abundances outside the range represented, specifically, 2,877.59 Poecillastra spp. were observed (corrected for effort) in the Marianas Region. Axis breaks by feature do not omit any data; breaks instead allocate annotation effort on different scales. (E) Nested pie chart shows overall taxonomic diversity at the family level (inner circle), genus level (middle circle), and species level (outer circle), for all poriferans annotated. Unidentified annotations are represented by the largest black bar originating at 12:00, progressing counter-clockwise.
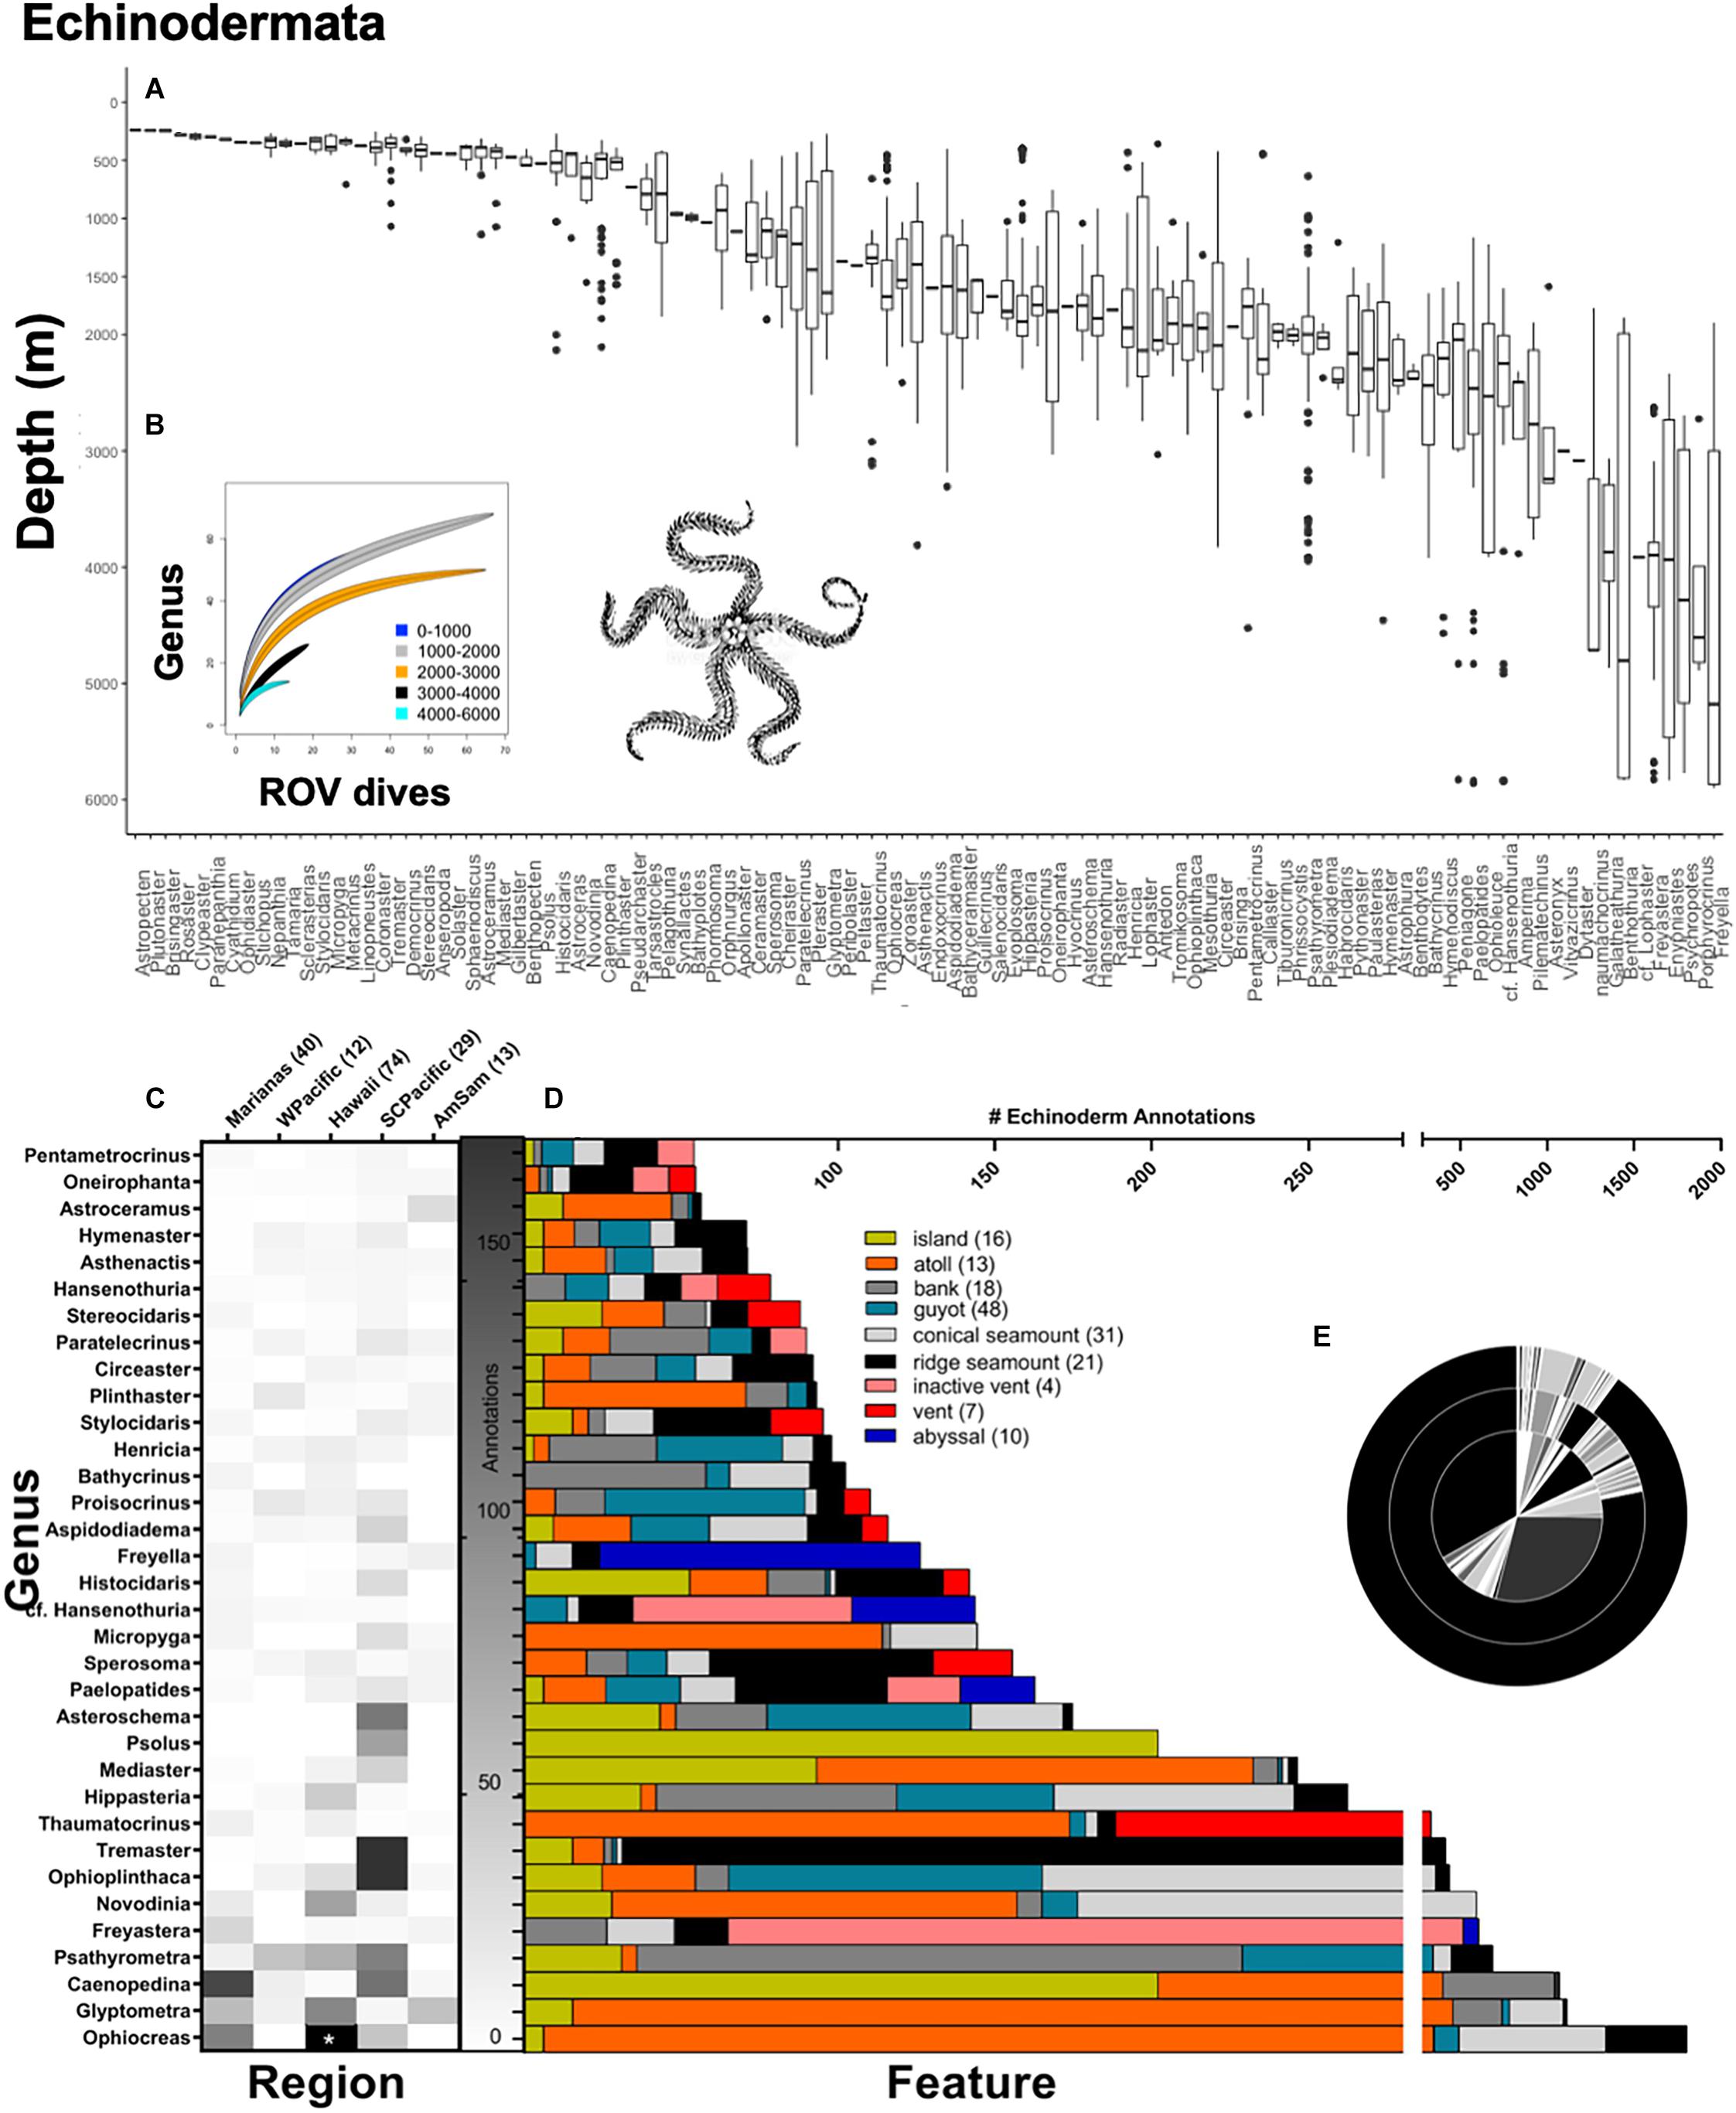
Figure 6. Top panel: Echinoderm annotations at the genus-level demarcated by depth (m). (A) A total of 29,934 echinoderm annotations were used to make box-and-whisker plots, organized from shallow to deep along the x-axis. A total of 106 echinoderm genera were observed over CAPSTONE. Rarefaction curves (B) are shown for all of Echinodermata (106 genera), color coded by depth 0–1,000 m (blue) 1,000–2,000 m (gray), 2,000–3,000 m (orange), 3,000–4,000 m (black), and 4,000–6,000 m (cyan). Lines are drawn with a 95% confidence envelope. Bottom panel: Echinoderm annotations representing at the genus-level demarcated by (C) geographic region and (D) geologic feature; the number of dives for both are in associated parentheses. A total of 34 echinoderm taxa are shown, representing every genus where 50 observations or more were made during CAPSTONE. Starred boxes on heatmap represent abundances outside the range represented, specifically, 417.32 Ophiocreas spp. were observed (corrected for effort) in the Hawaiian Islands Region. Axis breaks by feature do not omit any data; breaks instead allocate annotation effort on different scales. (E) Nested pie chart shows overall taxonomic diversity at the family level (inner circle), genus level (middle circle), and species level (outer circle), for all echinoderms annotated. Unidentified annotations are represented by the largest black bar originating at 12:00, progressing counter-clockwise.
Across geologic features, inactive vents had the least well-characterized biological communities, with the highest unidentifiable taxa at the genus and species levels (Table 1 and Supplementary Table 2). Islands, atolls, banks, guyots, conical seamounts, and ridges, which all share similar vertical relief from the seafloor, were similarly diverse at the genus and species level, with guyots and conical seamounts hosting the highest number of identifications at the family level (Table 1 and Supplementary Tables 2–5). Despite disproportionate dive effort in the Hawaiian Islands Region, all regions showed similar diversity at the species level. However, the South-Central Pacific and Marianas regions are the least well known at the genus level (Figure 3).
Of this unknown diversity, CAPSTONE expeditions collected 786 biological and 278 geological samples, many of which are thought to be new species, new records, or unusual morphotypes (Figure 7) and are currently available for taxonomic classification.
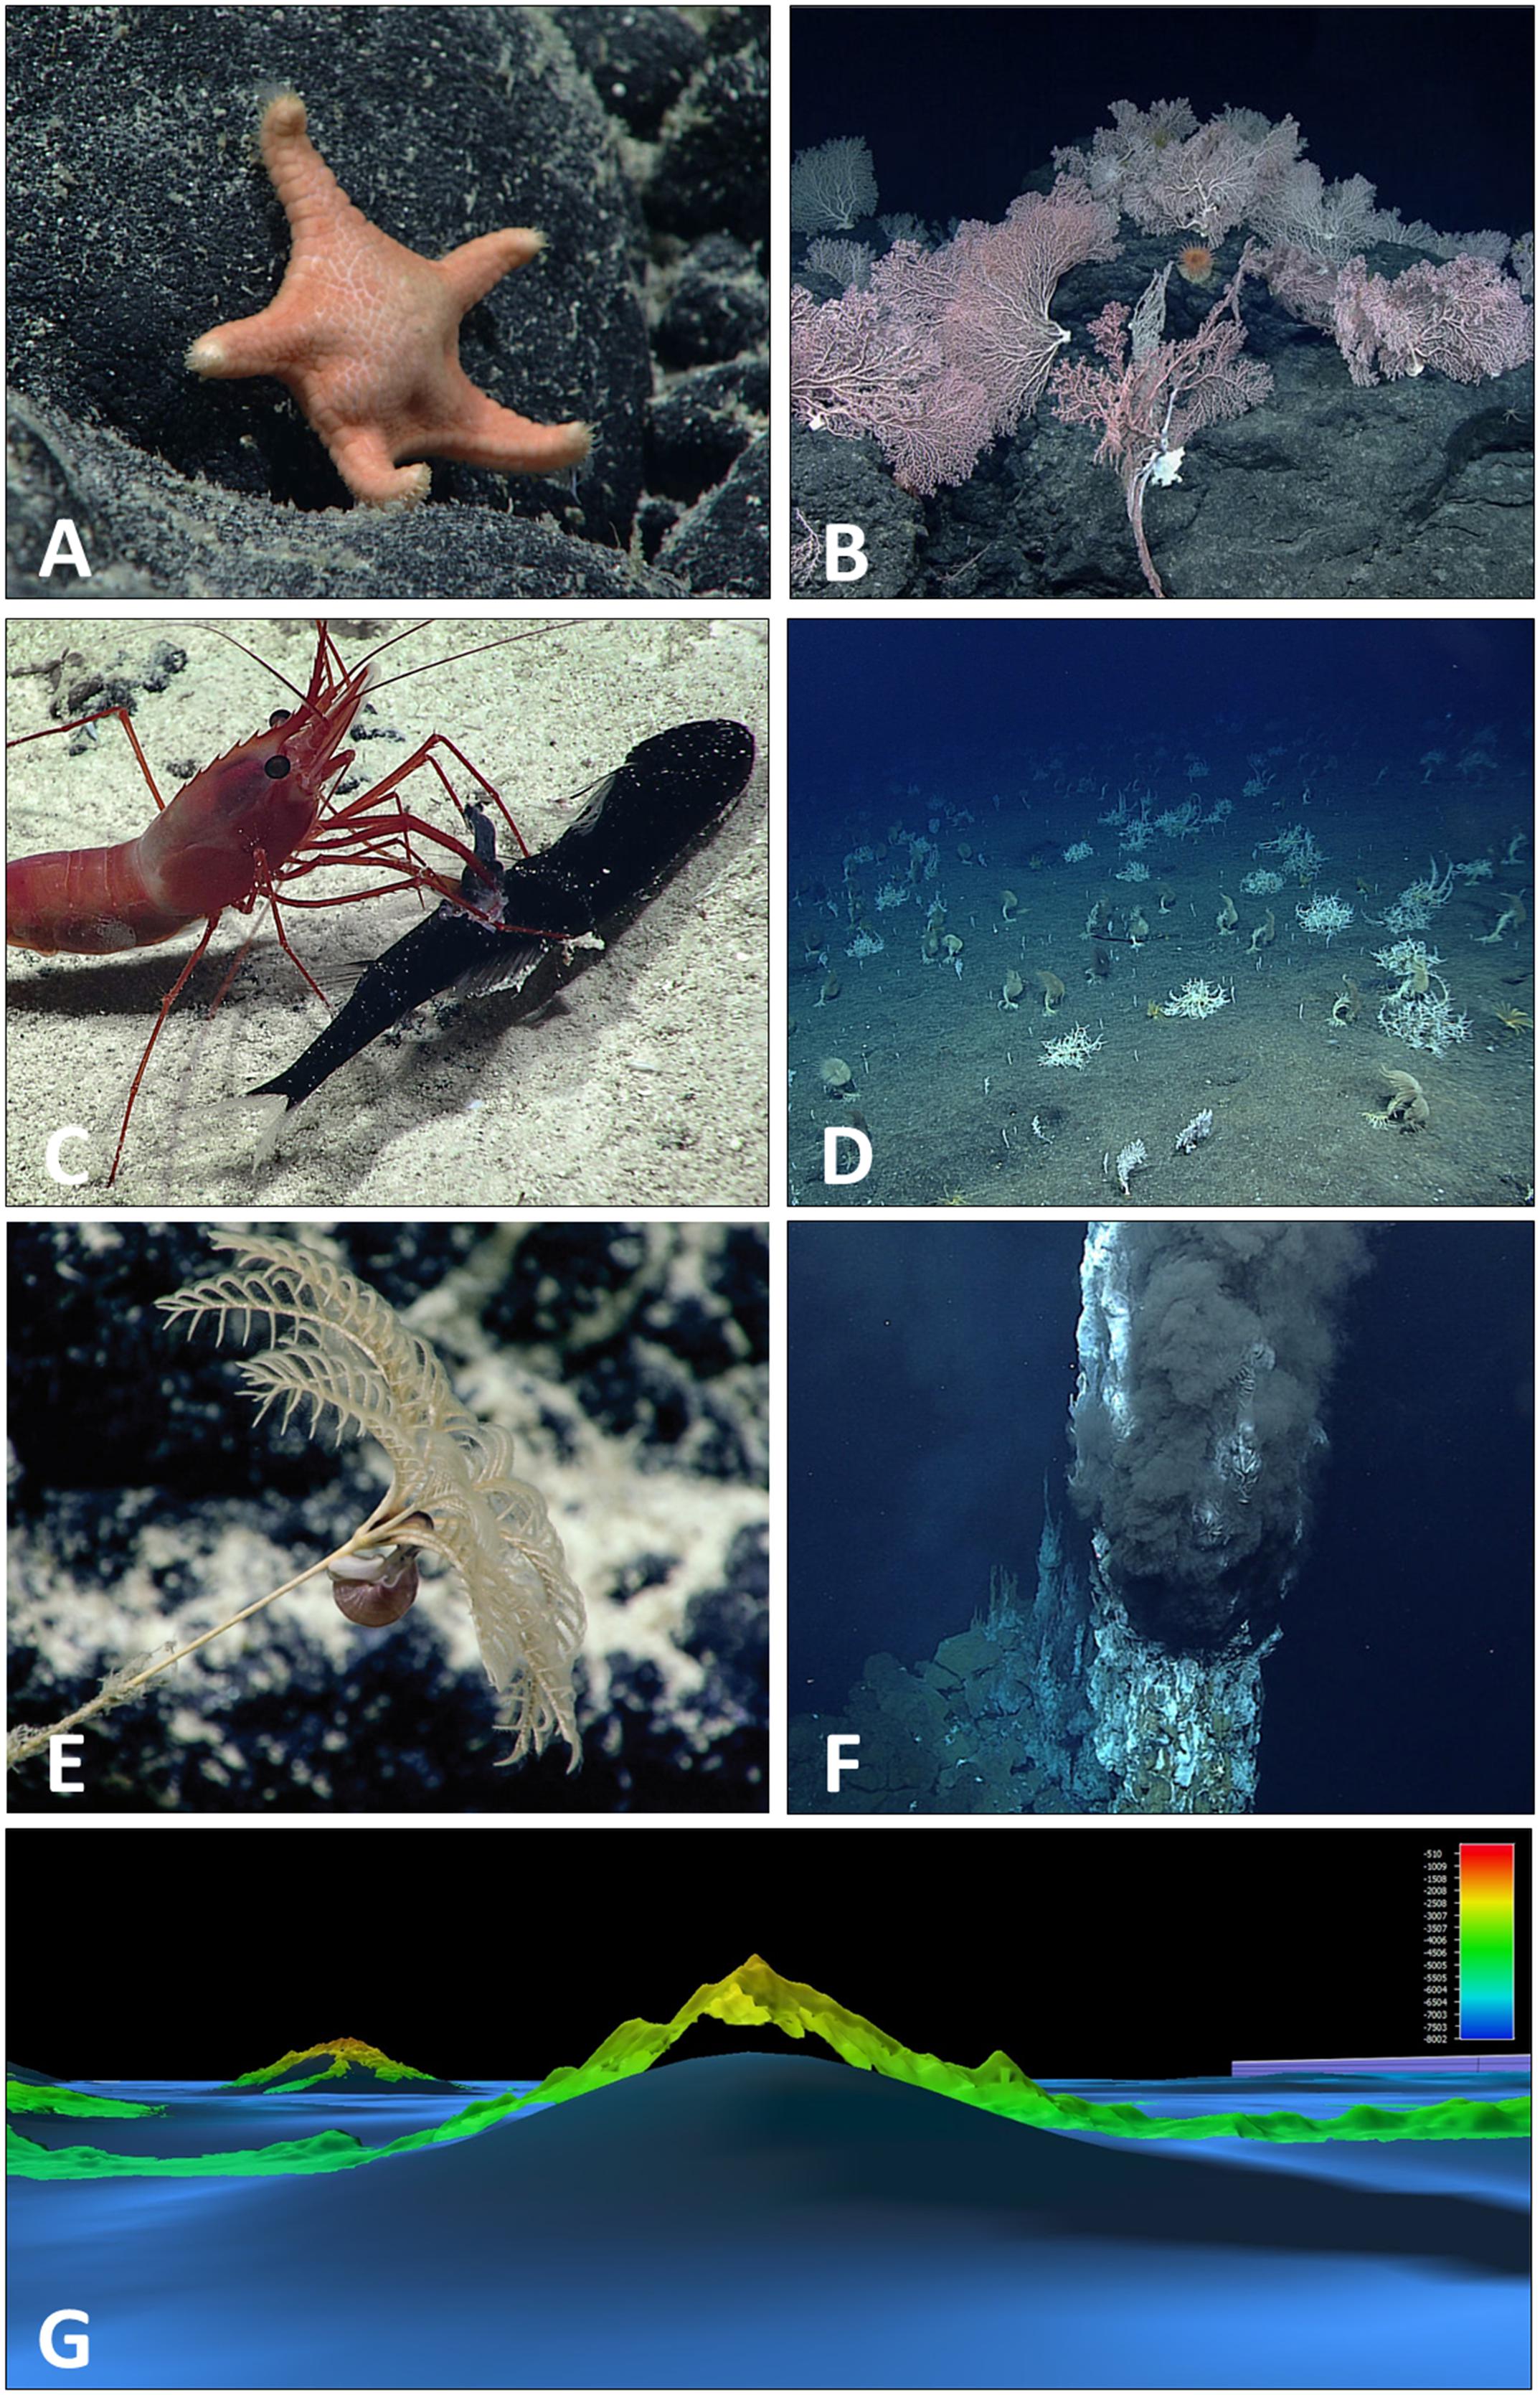
Figure 7. Plate of CAPSTONE curiosities: novel taxa, features, and interactions. Several new genera and new species were observed and collected during CAPSTONE, including (A) a previously undescribed genus and species of sea star (family Goniasteridae, class Asteroidea) (C. Mah, personal communication, description in preparation) discovered in the Musicians Seamounts in 2017 (EX1708). In several areas, CAPSTONE expeditions documented deep-sea corals for the first time, including (B) in the Musicians Seamounts (EX1708) where coral communities were observed on every dive not focused on water column exploration or archeology characterization. As the number of observations in the deep sea are limited when compared to the size of the biome, every predator–prey interaction observed contributes to our understanding of deep-sea life history. (C) A caridean shrimp, Heterocarpus sp., was observed capturing and feeding on a mid-water dragonfish, potentially Astronesthes sp., at Ufiata Seamount in Tokelau (EX1703), an unusual observation as Heterocarpus sp. are typically thought to be scavengers. Of particular interest to CAPSTONE were high density communities. Although most observed during CAPSTONE were composed of corals and sponges (Demopoulos et al., 2018; Smith et al., 2018) (D) at Zealandia Bank in the Marianas (EX1603L1) we documented a rarely observed large aggregation of gorgonocephalid basket stars. (E) In the deepwater areas around Kingman Reef (EX1705) several gastropods were observed with mouth apparently placed on the anal vent of multiple bathycrinid stalked crinoids, reminiscent of coprophagus snails (Platyceratidae) known from Paleozoic fossils but thought to be extinct. CAPSTONE also included exploration of hydrothermal vents in the Marianas (EX1605L1 and L3) revealing three new site of hydrothermal activity, including (F) the first survey of a new black smoker vent field composed of multiple chimneys in the Mariana Back Arc. Multibeam data collected over areas that had previously only been mapped using satellite altimetry, often showed significant differences in depth or form of features. (G) In the Jarvis Unit of PRIMNM, multibeam data (EX1701) revealed an approximate 1,700 m height difference when compared to previous satellite altimetry.
Diversity of Identifiable “Known” Taxa
Although there were many visual observations unable to be identified, there are data hotspots where more is known than unknown. For example, the best characterized depth is 2,000–2,500 m, where 90% of all taxa were identifiable at the family level (Figure 3). Similarly, at the family level, anthozoans are particularly well characterized. Across all regions, features, depths, and most taxa, there were more identifiable annotations at the genus level than the species level. Thus, for all analyses of diversity, we used genus-level taxonomic information unless otherwise noted. The three taxa with the largest number of observations were the class Anthozoa (221,264 individuals), phylum Porifera (46,128 individuals), and phylum Echinodermata (29,934 individuals). Thus, these three taxonomic groups were selected for further analysis by depth, geographic region, and geologic feature (Figures 4–6). It is important to note that the focus of the annotations was to document coral and sponge communities, and their associates. As such, not every free living individual invertebrate may have been noted, which may bias the analysis toward corals and sponge symbionts.
The basin-wide scale approach of these data crossed 48 degrees of latitude and 61 degrees of longitude. While postulating biogeographic provinces is outside the scope of this paper, it should be noted that the South-Central Pacific region had highest family (H = 3.23) and genus (H = 3.96) diversity, estimated using the Shannon–Weiner diversity index. The South-Central Pacific region also had the most even distribution (J′ = 0.68) of genera among communities observed. Both family and genus diversity were lowest in the American Samoa region (H = 2.10 for family diversity; H = 2.02 for genus diversity). In both assessments, the American Samoa region had the lowest evenness with evidence of dominant taxa. The top three genera in the American Samoa region were all corals: Enallopsammia, Stichopathes, and Scleronephthya, which combined represented 79.5% of genera observed.
Anthozoa
There were 122 anthozoan genera observed during CAPSTONE. To assess whether anthozoan diversity saturates with effort, we conducted rarefaction analyses across depth ranges at the genus level, noting that coral genera can dramatically vary with depth (Figure 4A). Most dive efforts were focused at the 1,000–3,000 m depth range, which also showed generic diversity approaching saturation. Genera between 0 and 1,000 m deep accumulated rapidly with increased sampling effort, as did diversity between 3,000 and 4,000 m, with curves not reaching a clear asymptotic value therefore suggesting the need for further sampling effort at those depths (Figure 4B). There is a very distinct anthozoan community at shallower depths (Figure 4A), but deeper than ∼800 m, coral genera appear more widely distributed across depths (Figure 4A).
The South-Central Pacific region had the highest diversity (H = 3.01), using the Shannon–Wiener Diversity Index, and most even distribution (J′ = 0.73) among Anthozoa (Figure 4C). The American Samoa region had the lowest anthozoan diversity (H = 1.47) and least even distribution (J′ = 0.40) of all regions, yet two of the three most abundant genera overall were found there; Stichopathes and Enallopsammia (Figure 4C). Across geologic feature, the most abundant coral genera appear on atolls, with the exception of Chrysogorgia and Narella (Figure 4D). There appears to be higher abundance on atolls compared to islands overall, and higher abundance on banks compared to guyots (Figure 4D). There are also some genera that appear to be highly feature-specific. For example, Anthomastus spp. are more abundant on ridge seamounts, Scleronephthya spp. and Polymyces spp. are found almost exclusively on atolls, and there are several genera found almost exclusively on banks, e.g., Parisis, Antipathella, Antipathes, and Eunicella spp. (Figure 4D). Very few corals are found at vents, but Pennatula, Trissopathes, Bathypathes, and Enallopsammia spp. all had representation near vent features.
Overall diversity of the Anthozoa is well characterized at the family level and genus level, though there are more unknowns than knowns at the species level (Figure 4E, Pearson’s chi-square χ2 = 55,664, df = 2, p < 0.001). Anthozoans at vent communities were similar to those found on ridge seamounts, guyots, and conical seamounts (Figure 8). Islands and atolls shared similar assemblages (Figure 8), even though abundances differed dramatically by genus (Figure 4D). The top 35 coral genera were not represented in abyssal habitats, even when corrected for effort (Figures 4D, 8). Across regions, the diversity assemblages in the Marianas region were the most distinct (Figure 8).
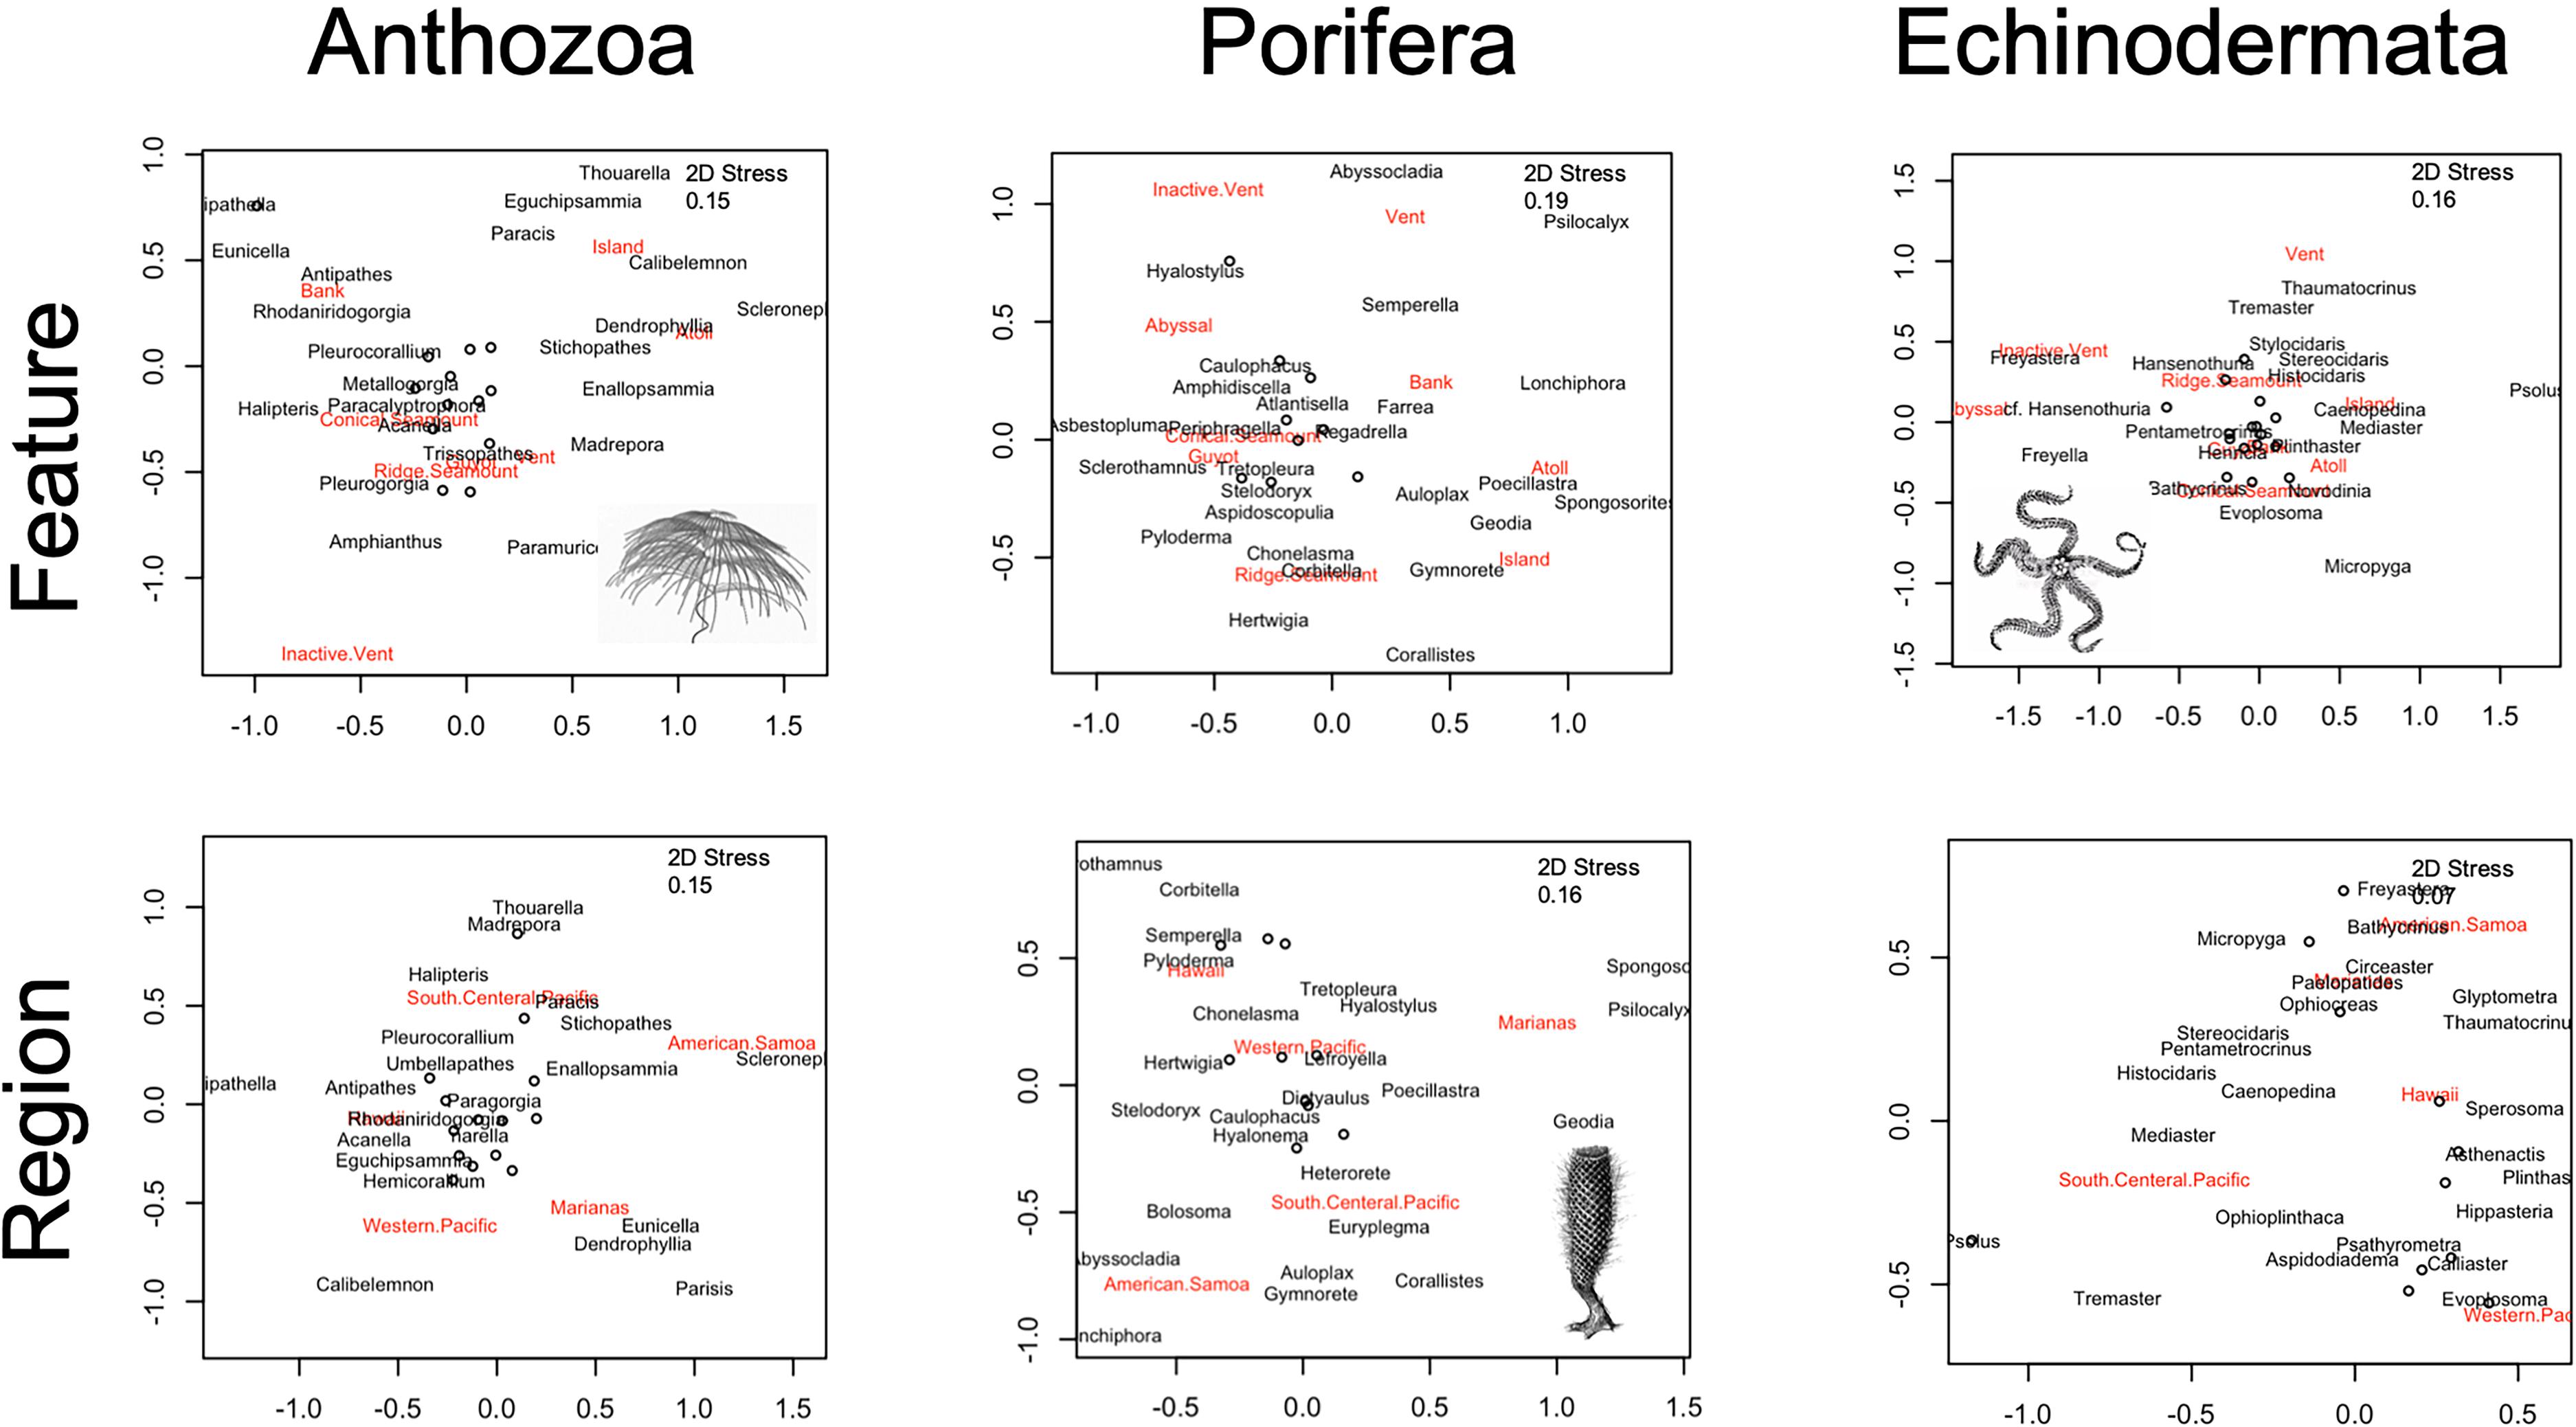
Figure 8. Non-metric multiple dimensional scaling ordination of the Bray–Curtis dissimilarity matrices are displayed, with geologic feature (top panel) and geographic region (bottom panel) groups noted. Taxonomic assemblages are abundances corrected for effort at the genus-level for the highest frequency genera observed (N = 35 for each).
Porifera
There were 55 poriferan genera identified during CAPSTONE (Figure 5), which is dramatically lower than the diversity of anthozoans (Figure 4). We conducted rarefaction analyses across depth ranges to assess whether poriferan generic diversity saturated with effort, with depth. Genera in Porifera differed from Anthozoa, in that the shallowest sponge communities were not the most diverse (Figure 5B). Instead, the highest diversity (per effort) was observed 1,000–3,000 m. From 3,000 to 6,000 m, rarefaction curves suggest the potential for greater generic diversity than has previously been documented, given the rapid accumulation with no clear asymptote at those depths (Figure 5B). Unlike Anthozoa, poriferan genera appear to be more widely tolerant of depth changes, with few exceptions shallow (e.g., Leiodermatium and Psilocalyx spp.), and deep (e.g., Cladorhizidae cf. Chondrocladia), and some unusually depth-specific taxa in intermediate depths, e.g., cf. Bolosoma, Asceptrulum, Bathydorus, Polymastia, and Corallistes spp. (Figure 5A).
Across regions, the Hawaiian Islands had the highest diversity (H = 2.69) using the Shannon–Wiener Diversity Index, and most even distribution (J′ = 0.72) among 41 genera within Porifera (Figure 5C). The Hawaiian Islands also had the highest number of identifiable genera among the regions, with only 18% of annotations excluded due to a lack of taxonomic identification. The lowest diversity among Poriferan genera was observed in the Western Pacific Region (Figure 5C; H = 1.95); however, 42% of annotations were excluded because they could not be identified reliably to genera. The Marianas Islands had the most unique sponge assemblage at the genus level (Figure 8). Across geologic feature, the most abundant sponge genus, Poecillastra spp., was most prevalent on islands, but that appears to be the exception among sponges (Figure 5D). Broadly across taxa, sponges appeared most abundant on banks, guyots, and ridges, with some taxa appearing almost exclusively on a single feature, e.g., Asbestopluma spp. on guyots, Psilocalyx and Semperella spp. on banks, and Hertwiga spp. on ridges (Figure 5D). Overall, very few poriferans were identifiable to species (Figure 5E). Although the percent identifiable was similar to Anthozoa at the genus level, there are more unknown taxa at the family level (Pearson’s chi-square χ2 = 16,956, df = 2, p < 0.001). Guyots, conical seamounts, and ridge seamounts had relatively similar poriferan communities, whereas banks, island, and atolls had more unique assemblages (Figure 8).
Echinodermata
There were 29,934 echinoderm annotations, overall, representing 106 genera (Figure 6). Echinoderm genera appear to be highly specific at shallow depths (200–500 m), where each taxon was only observed in a very narrow depth range (Figure 6A). In contrast, deepwater genera (3,000–6,000 m) were observed across a much broader depth range, displaying a high degree of flexibility (Figure 6A). To examine whether and how diversity saturated with effort, we built rarefaction curves displayed by ROV dive effort, categorized by depth. The highest degree of under sampled diversity was noted in the 3,000–4,000 m depth range (Figure 8). Although there was more effort 1,000–2,000 m, shallower depths (0–1,000 m) achieved the same taxonomic saturation (Figure 8).
Among Echinodermata, the Western Pacific had the most even distribution (J′ = 0.90) among observed genera, though all communities were comparatively even with little evidence of a dominant genus (Figure 8). One exception was Ophiocreas in the Hawaiian Islands, which had 417.32 records (corrected for effort), which was the most abundant of any echinoderm taxon observed (Figure 8). Measured using the Shannon–Wiener Diversity Index, the highest diversity among Echinoderm genera was documented in the Southern Central Pacific (H = 3.19; Figure 6C), though generally all regions had similar diversities (H ranged from 2.65 to 3.11).
When examining the organization of echinoderms on various features, some trends were notable or consistent with their known life mode. For example, many filter-feeding echinoderms were observed on features where they or associated fauna could exploit desirable water currents. The brisingid Novodinia and two crinoids, Glyptometra spp., and Thaumatocrinus, exploit water currents for food, and displayed high abundance on atolls. The feather star Psathyrometra as well as two stalked crinoids, Bathycrinus and Proisocrinus, which are filter-feeders, were observed on guyots and conical seamounts (Figure 6D). The deep-sea coral commensal ophiuroid Ophiocreas was also observed in high abundance on atolls, likely in association with optimal current habitat of its octocoral host.
The brisingid Freyastera was observed on several inactive vents with its arms extended into the water. In contrast, the sea cucumber, cf. Hansenothuria spp. was also observed on inactive vent settings but feeding mode was suggested deposit feeding (Figure 6D). Other trends included the sea cucumber Psolus spp. present only on islands, and brisingid species in the genus Freyella were abundant in abyssal habitats (Figure 6D). Of all the taxa examined in this study, echinoderms were the least well characterized, showing a higher ratio of knowns to unknowns only at the family level (Pearson’s chi-square χ2 = 8,564.2, df = 2, p < 0.001). In general, community assemblages are similar across ridge and conical seamounts, banks, guyots, atolls, and islands, and surprisingly, vents harbor similar assemblages as well (Figure 8). Abyssal and inactive vents have distinct echinoderm communities at the genus level (Figure 8). American Samoa displayed the most unique taxonomic assemblage (Figure 8).
Several observations of undescribed echinoderm taxa, including nine new species and two new genera of asteroids, in the families Goniasteridae and Ganeriidae were made during CAPSTONE. Important ecological observations of rarely encountered species, known only from unique or damaged specimens, were also made throughout the campaign. The goniasterid, Circeaster arandae, described by Mah (2006), was originally described from two dried specimens collected in the early 20th Century and not seen since. CAPSTONE was the first to observe this species in situ and as a significant predator on deep-sea octocorals.
Regional Comparisons
Across anthozoans, poriferans, and echinoderms, the most abundant taxa are concentrated in the Western Pacific, Hawaiian Islands, and South-Central Pacific Regions (Figures 4–6). Marianas and American Samoa Regions have unique taxa (heatmaps, Figures 4–6). Despite this, all regions show similar patterns of known versus unknown diversity at the family, genus, and species level (Figure 2). The Western Pacific Region appears to have the most known diversity at the genus level (Figure 2), but note that the majority of dives in this region were on guyots (Supplementary Figure 1).
The family Chrysogorgiidae was the only family to be in the top five most abundant for all regions (Supplementary Table 6), with abundance ranging from 4.58% (American Samoa region) to 15.50% (Hawaiian region; Figure 4C). Isididae was the most abundant family in Hawaiian region, fifth most abundant in Marianas, and was in the top 10 most abundant for all other regions. Primnoidae was the most abundant family in South-Central Pacific (17.59%) and Western Pacific (21.06%) and in the top five most abundant for the Hawaiian region (10%). Primnoidae represented only 3.82% of individuals observed in the Marianas and 0.39% of individuals in the Marianas.
While the family Coralliidae was common in the Hawaiian Region (11.77%), South-Central Pacific (2.76%), and Western Pacific (10.17%), it was completely absent from the American Samoa region and represented only 0.26% of individuals in the Marianas. Conversely, other families were common in the Marianas and absent elsewhere. For example, Stylasteridae only appeared in the top five most abundant families in the Marianas region (14.34%). Although geographically distant, there were some similarities between American Samoa and the Marianas, which generally grouped away from other regions (Figure 8). For example, the most abundant family in American Samoa was Dendrophylliidae (39.3%), which was the third most abundant family in the Marianas (10.33%), but not in the top five most abundant for any other region. Antipathidae was only in the top five most abundant families in the American Samoa region (26.08%). There was no overlap between the most abundant genus in each region.
Discussion
The Pacific Ocean, totaling 161,760,000 km2, has hosted voyaging and discovery since the beginning of human history, and as such has become an icon of vastness and exploration. CAPSTONE was a systematic exploration effort aimed to increase the mapping and ROV image data available for the Pacific seafloor. In this, CAPSTONE greatly succeeded, and has generated new ideas and hypotheses as well as highlighted challenges and opportunities for future exploration. The main contributions of this paper are therefore (1) providing a high-level overview of the methods, datasets, and key findings of CAPSTONE; (2) conducting a high-level initial analysis of basin-scale patterns of biogeography and biodiversity across the Pacific; (3) generating new hypotheses about distribution of taxa across depth, geographic regions, and geologic features, and (4) highlighting the knowledge gaps in mapping, exploration, and biodiversity in the Pacific deep-ocean.
Prior to CAPSTONE, the best bathymetry available in most of the areas was satellite-derived bathymetry (Amante and Eakins, 2009). The bathymetry acquired during CAPSTONE enabled detailed examination of 323 seamounts and seafloor features, which in turn enabled 168 ROV dives. This overall effort yielded 0.37% bathymetry mapping of the seafloor in the Pacific Ocean. However, because ∼68% of the Pacific is abyssal plain (deeper than 3,000 m), and because CAPSTONE mapping data were disproportionately focused on features of interest (e.g., seamounts, atolls, and vents), the contribution of CAPSTONE to our understanding of Pacific Ocean geology and biology is much >0.37% and 3% of US EEZ. At the same time, these statistics reveal how much is still yet-to-be-explored.
One of the major findings of this paper is the extent of unidentified observations over the 3 years of CAPSTONE. It has long been known that the deep-sea is one of the largest and last earth wildernesses to be explored (Ramirez-Llodra et al., 2011) but the ability to quantify the extent to which we need to explore it has not previously been fully articulated. It is now clear that 86.22% of the Pacific has yet-to-be mapped (Table 2), and over 99% of it yet-to-be-imaged (Ramirez-Llodra et al., 2010). For all taxonomic groups examined in the deep sea, we found that fewer than 20% of the species were able to be identified, and this number is limited to the organisms large enough to be visualized in habitats accessible with the ROV. In the Mediterranean deep-sea, biodiversity among different taxa was estimated to the species level across depths, with meiofauna expected to be the most biodiverse (Danovaro et al., 2010). CAPSTONE did not assess any meiofauna, thus even with the incredible diversity measured on this campaign, quantitative unknowns are still likely to underestimate overall diversity. Clearly, more taxonomy and systematics work is needed, in addition to basic mapping and exploration.
Patterns of biodiversity across the Pacific are still unresolved, as there are very few extensive studies that occur over a basin-wide scale. A recent paper proposed biogeographic provinces for the bathyal, abyssal, and hadal faunal communities across the Pacific (Watling et al., 2013), but full tests of the proposed Pacific boundaries have been challenging due to lack of data. The basin-wide scale approach of CAPSTONE crossed 48 degrees of latitude and 61 degrees of longitude. While postulating biogeographic provinces is outside the scope of this paper, the South-Central Pacific region had highest family and genus diversity, which is consistent with previous evidence showing that the Central Pacific deep sea has relatively high benthic diversity (Lambshead et al., 2002). Although geographically close, American Samoa is very distinct from the South-Central Pacific, likely due to ocean circulation passages in the region that may act as a barrier for larval dispersal, specifically the Samoan Passage (Herrera et al., 2018). In addition, American Samoa lies in close proximity to the intersection of bathyal provinces predicted by Watling et al. (2013), which may also contribute to the difference in community assemblage compared to the South-Central Pacific. In contrast, though geographically distant, American Samoa and Marianas had some unexpected similarities in community assemblages, especially within Anthozoa, that beg further investigation.
More broadly, species biodiversity has been thought to be unimodal with an equatorial peak and a corresponding decline in species richness from the lower to higher latitudes, generally demonstrated in terrestrial (Kaufman, 1995; Gaston, 2000), and shallow-water marine species distributions (Hillebrand, 2004; Fautin et al., 2013). However, Chaudhary et al. (2016) found a dip in shallow marine species richness just below the equator. Although taxonomic assemblages varied widely among regions and features across the Pacific, we found that all regions show similar patterns of known versus unknown diversity at the family, genus, and species level (Figure 2), which was relatively surprising. However, the current proposed biogeographic boundaries for bathyal species (Watling et al., 2013) were largely derived from ophiuroid fauna on the Austral plate (O’Hara et al., 2011) and from seamount data largely describing deep-sea sponge and coral communities. We thus similarly restricted our focused taxonomic examinations to the class Anthozoa, and phyla Porifera and Echinodermata, which were the top three most abundant and highest confidence identifications, though CAPSTONE annotation data captured all taxa identifiable by visual surveys on ROV dives.
There are many insights to be gleaned from CAPSTONE data, many of which will require substantial further investigation. For example, we found that Anthozoa, Porifera, and Echinodermata all have some genera that are highly specific to geologic features. This is surprising because, at depth (1,000–4,000 m), no major differences were expected between vertical slopes on islands, atolls, banks, guyots, or conical seamounts. Historically, seamounts have been proposed as deep-sea refugia and stepping stones for dispersal due to similarities among clusters of seamounts (reviewed by Clark et al., 2010; Shank, 2010). Generally, these features are all manganese-encrusted, residing in similar oceanographic conditions (Hein et al., 2000), and often in close geographic proximity. Therefore, we expected that dispersal and recruitment on available structures would be indiscriminate of seamount shape or height. Yet, the apparently preferential distribution and abundance of specific taxa to one feature over another in our data suggests otherwise. Recent work in shallow reef environments has shown that the terrestrial environment has been more important than previously appreciated, mostly mediated by bird guano and nutrient inputs via groundwater and lagoonal flow (McMahon and Santos, 2017; Graham et al., 2018); anthropogenic impacts via wastewater and manure have been shown to affect nutrient coastal fluxes on tropical Pacific islands via groundwater as well (Shuler et al., 2019). Submarine groundwater discharge has been shown to impact marine biota across all kingdoms of life, around the globe (reviewed by Lecher and Mackey, 2018), but the depths to which these impacts reach have thus far remained uninvestigated. Our study tantalizingly suggests that surface or shallow-water dynamics on islands versus atolls versus banks may influence deep-sea benthic communities; this requires further study.
Several new genera and new species were observed and collected during CAPSTONE, including a previously undescribed genus and species of sea star (family Goniasteridae, class Asteroidea) discovered in the Musicians Seamounts in 2017 (Figure 7). CAPSTONE data have already been instrumental in the description of 13 new species and two new genera of Primnoid corals (Cairns, 2018), as well as a new species of stylasterid coral, Crypthelia kelleyi from the Northwest Hawaiian Islands (Cairns, 2017). One new genus, Macroprimnoa spp., possesses some of the largest polyps in the family (Cairns, 2018). A likely novel species of Neopilina monoplacophoran was observed in American Samoa, which expands the known diversity of living monoplacophorans (Sigwart et al., 2018), which were previously known from the fossil record but only discovered to be extant in 1952 (Lemche, 1957). New species are still regularly being discovered, to some extent scaling with exploration effort (e.g., Ramirez-Llodra et al., 2010). As such, our rarefaction curves for each taxon, demarcated by depth, should help to focus exploration effort by depth and taxa for the future.
In addition to new taxa, there have been several new records of range, depth, size, or behavior. In the Hawaiian Islands Region, incirrate octopods were discovered deeper than had previously been reported, 4,120–4,197 m (Purser et al., 2016). One of the largest living sponges in existence, a hexactinellid sponge in the subfamily Lanuginellinae, was documented at 2,117 m in the Papahānaumokuākea Marine National Monument in the Hawaiian Islands region (Wagner and Kelley, 2017). The only other living sponges known to be comparable in size are Monorhaphis chuni sponges from the East and South China Sea, with spicules reaching up to 2.7 m in length (Jochum et al., 2017). Our study did not examine fish in any detail beyond inclusion in all-taxa diversity pie-charts; however, CAPSTONE has already yielded some teleost discoveries. The first aphyonid-clade brotula fish was observed alive in its natural habitat in the Mariana Archipelago (2,504.2 m); this improbable fish, which is translucent with no swim bladder and diminished eyes, had never been imaged in situ prior to CAPSTONE (Mundy et al., 2018). Myriad other new records likely exist in the dataset. For example, in the deepwater areas around Kingman Reef, several gastropods were observed putatively grazing on bathycrinid stalked crinoids, reminiscent of coprophagus snails (Platyceratidae) known from Paleozoic fossils but thought to be extinct (Figure 7). These, and other observations have yet to be fully described and require additional analysis.
Whole new features have also been discovered, for example three new sites of hydrothermal activity in the Marianas, including the first survey of a new black smoker vent field composed of multiple chimneys in the Mariana Back Arc (Figure 7). While not covered in this analysis, CAPSTONE also included some of the first-ever midwater ROV exploration dives in many of these areas (Netburn et al., 2018) and collected numerous geological samples that may provide new insights into seafloor history or ferromanganese crust dynamics. Additionally, on the benthos, many more features were discovered with high resolution multibeam mapping over areas that had previously only been mapped using satellite altimetry, often resolving great discrepancies in depth or form of features. For example, in the Jarvis Unit of the Pacific Remote Islands Marine National Monument (PRIMNM), multibeam data revealed an approximate 1,700 m height difference when compared to previous satellite altimetry (Figure 7G). Yet, despite these massive leaps forward in mapping, exploration, taxonomic description, and functional insights, the context for our ocean understanding is still derived from a scant 5% of the seafloor explored, with <10% mapped with modern methods (Mayer et al., 2018). Thus, the discovery of new features is expected to increase with additional mapping and exploration effort.
In addition to providing valuable information on the features, habitats, and species in the Pacific, CAPSTONE also contributed publicly accessible baseline data and critical information needed to respond to emerging regional issues such as deep-sea mining, sustainable deep-sea fisheries, and changes in ocean dynamics. During the 3 years of CAPSTONE expeditions, Okeanos Explorer visited every US National Marine Monument in the Pacific, including many that previously had no information about their deepwater communities, thus greatly expanding our deep-sea knowledge within these boundaries (Wagner et al., 2017; Cantwell et al., 2018b; Leonardi et al., 2018). These expeditions conducted the deepest surveys in every unit of PRIMNM, Papahānaumokuākea Marine National Monument, and Rose Atoll Marine National Monument/the National Marine Sanctuary of American Samoa. In several areas, CAPSTONE expeditions were the first to explore in deep-water, for example in the Phoenix Islands (in both the United States and Kiribati), Wake Island, Johnston Atoll, and the Musicians Seamounts (Elliott et al., 2016; Bohnenstiehl et al., 2018; Cantwell et al., 2018b; Demopoulos et al., 2018; Smith et al., 2018).
Modern advances are broadening the opportunities for exploration with increased robotics, optics, and telepresence (Kaiser et al., 2012; Gregory et al., 2016; Kennedy et al., 2016; Vogt et al., 2018). While there are still more advances to be made, CAPSTONE represents the largest area of seafloor imaged in a single campaign. While using video data for taxonomic identification has limitations, such as instances of poor image quality and the inability to conduct lab-based analyses, the key advantage is that video annotation affords an efficient and tractable method to study taxa. Given emerging deep-sea technologies and exploits, exploration is a global priority (Cordes and Levin, 2018). Exploration helps to describe species and habitats, understand the drivers of community structure, and generate testable hypotheses about deep-sea ecosystems that will better-serve all users and stakeholders. One major contribution of this paper is intended to be the initial consolidation and presentation of the CAPSTONE data suite, to showcase the opportunities for novel hypothesis-testing and seed novel ideas. Differences between islands vs. atolls, or conical seamounts vs. guyots, for example, were not previously thought to be important in structuring deep-sea communities. Our analyses suggest otherwise, and these observations (and others) in this paper would benefit from future, finer-scale analysis efforts. Additionally, as technology improves, new methods for maximizing the utility of deep-sea video data for biological research will allow the use of emergent technologies such as machine-learning and autonomous data collection platforms to increase the pace of exploration. The current video archive can be re-annotated and mined for new observations and patterns that were not originally intended. Thus, CAPSTONE data offer the opportunity to test how large-scale video analysis and annotation can be creatively used now, and into the future.
Now that data baselines have been set across 168 dive sites in the Pacific, it is important to leverage these visual observations to more thoroughly test mechanisms and drivers of community composition in the deep-sea. Many of the places visited during CAPSTONE are remote and infrequently visited, thus the ability to deploy expendable technology that would continue to record time series data after the ships have departed, without the need to return to for retrieval, will be critical to turn single-visit observations into a much richer dataset. With forward planning, ROV visitation could optimize our ability to understand community distribution, long-term site conditions, and how deep sea fauna interact with their environment and begin to inform connectivity patterns, basin-wide. Especially because most of the Pacific CAPSTONE sites reside within large-scale marine protected areas (LSMPAs), these locales will likely remain free from exploitation, thus serving as valuable benchmarks for deep-sea community response to larger-scale issues and changes in global and Pacific-wide ocean dynamics. Although historically LSMPAs lack sufficient deep-water information for government officials to effectively manage these areas and monitoring these LSMPAs has been shown to be particularly difficult (Friedlander et al., 2016), the baseline provided by CAPSTONE and the potential for future autonomous monitoring will enable managers to better assess LSMPA status.
Coordinated field efforts that result in consistent datasets are absolutely critical in order to reduce “unknowns” in the deep sea. Standardized efforts across large areas offer opportunities to better understand geographic patterning as well as the rare ability to make regional comparisons. CAPSTONE has made major inroads into the necessary data to generate these comparisons, though there are still major gaps in our understanding, due in part to the uneven distribution of effort across feature types and depth ranges that could be remedied with a gap analysis and a future targeted effort to fill exploration gaps by region, and also by depth and feature. Nonetheless, CAPSTONE represented a model of systematic exploration that is critical to understanding one of the earth’s largest ecosystems (Ramirez-Llodra et al., 2011). As we look to the future of ocean exploration, coordinated field campaigns should incorporate multiple ships and additional technologies including towed arrays, ship mounted systems, and autonomous systems, in order to maximize data collected. Projects like Seabed 2030 (Mayer et al., 2018) have set ambitious goals that can only be accomplished through internationally coordinated efforts. If one ship can only map 0.37% of the Pacific in 3 years, additional assets with a diversity of systems will need to work together to map the whole ocean in just over a decade.
Ironically named, CAPSTONE is more of a beginning than a culminating experience. It is the launch of decades of data-mining, visual analyses, hypothesis-generation, and justification for future exploration. The trends highlighted in this paper offer a snapshot of what is known, and what remains unknown, in the Pacific Ocean. What we have learned from 3 years and 891.5 h on the seafloor is that the Pacific is not just a place of historical exploration and voyaging: it is a place that offers extensive opportunities for technology innovations, and insights. In other words, it is a place for future discovery.
Data Availability
The datasets generated by the NOAA Ship Okeanos Explorer that were analyzed for this study are archived in the NOAA archives and can be found through the OER Digital Atlas (https://www.ncddc.noaa.gov/website/google_maps/OE/mapsOE.htm). ROV video annotations can be found in the Deep Sea Coral Research and Technologies’ Deep Sea Coral Data Portal at https://deepseacoraldata.noaa.gov/.
Author Contributions
BK, RR, KC, and MM were primarily responsible for manuscript preparation and data analysis. BK, KC, MM, EL, DS, MW, KE, and LG were responsible for sailing and coordinating all CAPSTONE expeditions. CK, VM, SB, and MP were responsible for creating all the annotations from the ROV video. SA, SF, and CM provided expertise and context on Anthozoa and Echinodermata analysis. JP was responsible for the creation of CAPSTONE and CK was the CAPSTONE science advisor to NOAA. All authors participated in editing and final preparation of the manuscript.
Funding
Funding and in-kind contributions for field work were provided by the NOAA’s Office of Ocean Exploration and Research, the National Marine National Marine Sanctuaries Program, the Pacific Islands Fisheries Science Center, the Pacific Islands Regional Office, the DSCRTP, and the National Marine Fisheries Service. Funding for the creation of the annotations was provided by the DSCRTP. Funding for data analysis and manuscript preparation was provided by the DSCRTP through a memorandum of understanding with the University Corporation for Atmospheric Research.
Conflict of Interest Statement
KC is employed by MAXIMUS, LG is employed by Athenium Analytics, and DS, EL, and MW are employed by Cherokee Nation Strategic Programs.
The reviewer FA declared a past co-authorship with one of the authors CM to the handling Editor.
The remaining authors declare that the research was conducted in the absence of any commercial or financial relationships that could be construed as a potential conflict of interest.
Acknowledgments
We would like to thank the NOAA for their funding and support of CAPSTONE, specifically the Office of Ocean Exploration and Research, the Office of Marine and Aviation Operations, the Pacific Island Fisheries Science Center, the Pacific Islands Regional Office, the DSCRTP, the Office of National Marine Sanctuaries, the National Center for Environmental Information (NCEI), the National Ocean Service, the National Environmental Satellite, Data, and Information Service (NESDIS), the Oceanic and Atmospheric Research (OAR), the National Marine Fisheries Service’s (NMFS), and the officers and crew of NOAA Ship Okeanos Explorer. Thanks to the Hawai‘i Undersea Research Laboratory (HURL), the GFOE, the University of Hawaii, the Smithsonian Natural Museum of Natural History, and the Oregon State University’s Marine Geology Repository for their continuous and critical support throughout CAPSTONE. We also acknowledge the Monterey Bay Aquarium Research Institute for its VARS software and support. Additionally, we are grateful to Craig Russell (NOAA OER) and the rest of the expedition science teams from CAPSTONE expeditions for sharing their expertise and guiding operations in real-time as well as all of the regional managers and stakeholders who contributed to expedition planning. We would also like to thank Jesse Varner (NOAA NCEI) who helped process the multibeam footprint for data held at NCEI and Abby Reft (NOAA NMFS) who provided archived sample use information and coordinated Smithsonian participation in this manuscript. Additional funding for analysis was provided by the NOAA DSCRTP through the University Corporation for Atmospheric Research. CAPSTONE was completed in accordance with all regulations regarding environmental compliance and local permitting including the following permits: Kiribati Phoenix Islands Protected Area permit #1/17, Commonwealth of the Northern Mariana Islands Department of Lands and Natural Resources permit #03345, Hawai’i Department of Land and Natural Resources permit #SAP-2016-64, Cook Islands Marae Moana permit #05/17, National Marine Sanctuary of American Samoa permit #NMAS-2017-001, American Samoa Department of Marine and Wildlife Resources permit #2017/001, US Fish and Wildlife Convention on International Trade in Endangered Species (CITES) import permit #17US36207C/9; Papahānaumokuākea Marine National Monument permit #PMN-2015-018; and Marshall Islands Ministry of Foreign Affairs permit #US/98-15. Any use of trade, product, or firm names is for descriptive purposes only and does not imply endorsement by the US Government.
Supplementary Material
The Supplementary Material for this article can be found online at: https://www.frontiersin.org/articles/10.3389/fmars.2019.00480/full#supplementary-material
Footnotes
- ^ https://oceanexplorer.noaa.gov/okeanos/animal_guide/animal_guide.html
- ^ https://www.ncei.noaa.gov/maps/deep-sea-corals/mapSites.htm
- ^ https://service.ncddc.noaa.gov/website/google_maps/OE/mapsOE.htm
References
Amante, C., and Eakins, B. W. (2009). ETOPO1 Arc-Minute Global Relief Model: Procedures, Data Sources and Analysis. NOAA Technical Memorandum NESDIS NGDC-24. Silver Spring, MD: National Geophysical Data Center, NOAA, doi: 10.7289/V5C8276M
Baco, A. R., Etter, R. J., Ribeiro, P. A., von der Heyden, S., Beerli, P., and Kinlan, B. P. (2016). A synthesis of genetic connectivity in deep-sea fauna and implications for marine reserve design. Mol. Ecol. 25, 3276–3298. doi: 10.1111/mec.13689
Bohnenstiehl, D. R., France, S. C., Cantwell, K., and White, M. (2018). Mountains in the deep: exploration of the seamounts of the Central Pacific Basin. Oceanography 31, 78–79. doi: 10.5670/oceanog.2018.supplement.01
Cairns, S. D. (2017). New species of stylasterid (Cnidaria: Hydrozoa: Anthoathecata: Stylasteridae) from the Northwestern Hawaiian Islands. Pacific Sci. 71, 77–81. doi: 10.2984/71.1.7
Cairns, S. D. (2018). Primnoidae (Cnidaria: Octocorallia: Calcaxonia) of the Okeanos explorer expeditions (CAPSTONE) to the central Pacific. Zootaxa 4532, 1–43. doi: 10.11646/zootaxa.4532.1.1
Cantwell, K., Elliott, K., Kelley, C., and Gottfried, S. (2018a). CAPSTONE sampling overview: providing insights in the remote pacific. Oceanography 31, 84–85.
Cantwell, K., Elliott, K., and Kennedy, B. R. C. (2018b). Deepwater exploration of the pacific remote islands marine national monument and Central Pacific Basin. Oceanography 31, 74–75. doi: 10.5670/oceanog.2018.supplement.01
Chaudhary, C., Saeedi, H., and Costello, M. J. (2016). Bimodality of {Latitudinal} {Gradients} in {Marine} {Species} {Richness}. Trends Ecol. Evol. 31, 670–676. doi: 10.1016/j.tree.2016.06.001
Clark, M. R., Rowden, A. A., Schlacher, T., Williams, A., Consalvey, M., Stocks, K. I., et al. (2010). The ecology of seamounts: structure, function, and human impacts. Ann. Rev. Mar. Sci. 2, 253–278. doi: 10.1146/annurev-marine-120308-081109
Cordes, E. E., and Levin, L. A. (2018). Exploration before exploitation. Science 359:719. doi: 10.1126/science.aat2637
Danovaro, R., Corinaldesi, C., D’Onghia, G., Galil, B., Gambi, C., Gooday, A. J., et al. (2010). Deep-sea biodiversity in the mediterranean sea: the known, the unknown, and the unknowable. PLoS One 5:e11832. doi: 10.1371/journal.pone.0011832
Danovaro, R., Dell’Anno, A., Fabiano, M., Pusceddu, A., and Tselepides, A. (2001). Deep-sea ecosystem response to climate changes: the eastern Mediterranean case study. Trends Ecol. Evol. 16, 505–510. doi: 10.1016/s0169-5347(01)02215-7
De Leo, F. C., Smith, C. R., Rowden, A. A., Bowden, D. A., and Clark, M. R. (2010). Submarine canyons: hotspots of benthic biomass and productivity in the deep sea. Proc. R. Soc. B Biol. Sci. 277, 2783–2792. doi: 10.1098/rspb.2010.0462
Demopoulos, A. W. J., Auscavitch, S., Sowers, D., Pawlenko, N., and Kennedy, B. R. C. (2018). Discovering the deep: exploring remote pacific marine protected areas. Oceanography 31, 76–77. doi: 10.5670/oceanog.2018.supplement.01
Dunn, D. C., Van Dover, C. L., Etter, R. J., Smith, C. R., Levin, L. A., Morato, T., et al. (2018). A strategy for the conservation of biodiversity on mid-ocean ridges from deep-sea mining. Sci. Adv. 4:eaar4313. doi: 10.1126/sciadv.aar4313
Eakins, B. W., and Sharman, G. F. (2010). Volumes of the World’s Oceans from ETOPO1. Boulder, CO: NOAA National Geophysical Data Center.
Elliott, K. P., Kennedy, B. R. C., Elizebeth, L., and Potter, J. (2016). Okeanos explorer 2015 field season overview. Oceanography 29, 58–61. doi: 10.5670/oceanog.2016.supplement.01
Fautin, D. G., Malarky, L., and Soberón, J. (2013). Latitudinal diversity of sea anemones (cnidaria: Actiniaria). Biol. Bull. 224, 89–98. doi: 10.1086/BBLv224n2p89
Friedlander, A. M., Wagner, D., Gaymer, C. F., Wilhelm, T. A., Lewis, N. A., Brooke, S., et al. (2016). Co-operation between large-scale MPAs: successful experiences from the Pacific Ocean. Aquat. Conserv. Mar. Freshw. Ecosyst. 26, 126–141. doi: 10.1002/aqc.2645
Graf, G. (1989). Benthic-pelagic coupling in a deep-sea benthic community. Nature 341, 437–439. doi: 10.1038/341437a0
Graham, N. A. J., Wilson, S. K., Carr, P., Hoey, A. S., Jennings, S., and Macneil, M. A. (2018). Seabirds enhance coral reef productivity and functioning in the absence of invasive rats. Nature 559, 250–253. doi: 10.1038/s41586-018-0202-3
Gregory, T., Lovalvo, D., Mohr, B., McLetchie, K., and Ryan, M. (2016). Advancing undersea technology. Oceanography 29, 52–55. doi: 10.5670/oceanog.2016.supplement.01
Hein, J. R., Koschinsky, A., Bau, M., Manheim, F. T., Kang, J.-K., and Roberts, L. (2000). “Cobalt-rich ferromanganese crusts in the Pacific,” in Handbook of Marine Minerals, ed. D. S. Cronan (Boca Raton, FL: CRC Press), 239–279. doi: 10.1201/9780203752760-9
Hein, J. R., Mizell, K., Koschinsky, A., and Conrad, T. A. (2013). Deep-ocean mineral deposits as a source of critical metals for high- and green-technology applications?: comparison with land-based resources. Ore Geol. Rev. 51, 1–14. doi: 10.1016/j.oregeorev.2012.12.001
Herrera, S., Jackson, M. G., Elliott, K., and Lobecker, E. (2018). “Biodiversity of the deep-sea benthic fauna in the American Samoa region,” in Proceedings of the Ocean Sciences Meeting on ME52A-05: Oral Presentation, (Portland, OR).
Hillebrand, H. (2004). Strength, slope and variability of marine latitudinal gradients. Mar. Ecol. Prog. Ser. 273, 251–267. doi: 10.1371/journal.pone.0067596
Hughes, J. B., Hellmann, J. J., Ricketts, T. H., and Bohannan, B. J. M. (2001). Counting the uncountable: statistical approaches to estimating microbial diversity. Appl. Environ. Microbiol. 67, 4399–4406. doi: 10.1128/AEM.67.10.4399-4406.2001
Jamison, A. (2015). The Hadal Zone – Life in the Deepest Ocean, 1st Edn. Cambridge, MA: Cambridge University Press.
Jochum, K. P., Schuessler, J. A., Wang, X. H., Stoll, B., Weis, U., Müller, W. E. G., et al. (2017). Whole-ocean changes in Silica and Ge/Si ratios during the last deglacial deduced from long-lived giant glass sponges. Geophys. Res. Lett. 44, 11,555–11,564. doi: 10.1002/2017GL073897
Kaiser, C. L., Kinsey, J. C., Pinner, W., Yoerger, D. R., German, C. R., and Van Dover, C. L. (2012). “Satellite based remote management and operation of a 6000m AUV,” in Proceeddings of the Ocean 2012 MTS/IEEE Harnessing Power Ocean, (Hampton Roads, VA), doi: 10.1109/OCEANS.2012.6404900
Kaufman, D. M. (1995). Diversity of New World mammals: universality of the latitudinal gradients of species and bauplans. J. Mammal. 76, 322–334. doi: 10.2307/1382344
Kennedy, B. R. C., Elliott, K. P., Cantwell, K., and Mesick, S. (2016). Telepresence-enabled exploration with NOAA ship okeanos explorer. Oceanography 29, 50–51. doi: 10.5670/oceanog.2016.supplement.01
Koslow, J. A., Goericke, R., Lara-Lopez, A., and Watson, W. (2011). Impact of declining intermediate-water oxygen on deepwater fishes in the California current. Mar. Ecol. Prog. Ser. 436, 207–218. doi: 10.3354/meps09270
Lambshead, P. J. D., Brown, C. J., Ferrero, T. J., Mitchell, N. J., Smith, C. R., Hawkins, L. E., et al. (2002). Latitudinal diversity patterns of deep-sea marine nematodes and organic fluxes: a test from the central equatorial Pacific. Mar. Ecol. Prog. Ser. 236, 129–135. doi: 10.3354/meps236129
Lecher, A., and Mackey, K. (2018). Synthesizing the effects of submarine groundwater discharge on marine biota. Hydrology 5:60. doi: 10.3390/hydrology5040060
Lemche, H. (1957). A new living deep-sea mollusc of the Cambro-Devonian Class Monoplacophora. Nature 179, 413–416. doi: 10.1038/179413a0
Leonardi, A., Armor, J., Montanio, P., and Werner, C. (2018). CAPSTONE: NOAA’s campaign to address Pacific monument Science, Technology, and Ocean Needs. Oceanography 29, 48–52.
Levin, L. A., Etter, R. J., Rex, M. A., Gooday, A. J., Smith, C. R., Pineda, J., et al. (2001). Environmental influences on regional deep-sea species diversity. Annu. Rev. Ecol. Syst. 32, 51–93. doi: 10.1146/annurev.ecolsys.32.081501.114002
Levin, S. A., Godfray, H. C., Kinzing, A. P., Loreau, M., Losos, J., Walker, B., et al. (2009). The Princeton Guide to Ecology. Princeton, NJ: Princeton University Press.
Mah, C. L. (2006). Phylogeny and biogeography of the deep-sea goniasterid Circeaster (Echinodermata, Asteroidea, Goniasteridae) including descriptions of six new species. Zoosystema 28, 917–954.
Mayer, L., Jakobsson, M., Allen, G., Dorschel, B., Ferrini, V., Snaith, H., et al. (2018). The Nippon foundation—GEBCO seabed 2030 project: the quest to see the world’s oceans completely mapped by 2030. Geosciences 8:63. doi: 10.3390/geosciences8020063
McClain, C. R., and Rex, M. A. (2015). Toward a conceptual understanding of β-Diversity in the deep-sea benthos. Annu. Rev. Ecol. Evol. Syst. 46, 623–642. doi: 10.1146/annurev-ecolsys-120213-091640
McClain, C. R., and Schlacher, T. A. (2015). On some hypotheses of diversity of animal life at great depths on the sea floor. Mar. Ecol. 36, 849–872. doi: 10.1111/maec.12288
McMahon, A., and Santos, I. R. (2017). Nitrogen enrichment and speciation in a coral reef lagoon driven by groundwater inputs of bird guano. J. Geophys. Res. Ocean. 122, 7218–7236. doi: 10.1002/2013JC009262.Received
Mengerink, K. J., Van Dover, C. L., Ardron, J., Baker, M., Escobar-Briones, E., Gjerde, K., et al. (2014). A call for deep-ocean stewardship. Science 344, 696–698. doi: 10.1126/science.1251458
Mesick, S., Gottfried, S., Reser, B., and Woodard, K. (2016). Applied excellence in data management. Oceanography 29, 56–57. doi: 10.5670/oceanog.2016.supplement.01
Mora, C., Aburto-Oropeza, O., Ayala-Bocos, A., Ayotte, P. M., Banks, S., Bauman, A. G., et al. (2011). Global human footprint on the linkage between biodiversity and ecosystem functioning in reef fishes. PLoS Biol. 9:e1000606. doi: 10.1371/journal.pbio.1000606
Mundy, B. C., Gerringer, M. E., Nielsen, J. G., Fryer, P., and Leitner, A. (2018). First in situ observation of an aphyonid fish (Teleostei, Ophidiiformes, Bythitidae). Deep. Res. Part II Top. Stud. Oceanogr. 150, 164–169. doi: 10.1016/j.dsr2.2017.09.009
Murray, J. (1895). A Summary of the Scientific Results Obtained at the Sounding, Dredging and Trawling Stations of HMS Challenger, Vol. 1. Richmond: HM Stationery Office.
Netburn, A. N., Ford, M., and Lindsay, D. (2018). 2017 midwater exploration on okeanos explorer. Oceanography 31, 61–63. doi: 10.5670/oceanog.2018.supplement.01
O’Hara, T. D., Rowden, A. A., and Bax, N. J. (2011). A Southern Hemisphere bathyal fauna is distributed in latitudinal bands. Curr. Biol. 21, 226–230. doi: 10.1016/j.cub.2011.01.002
Oksanen, A. J., Blanchet, F. G., Kindt, R., Legen-, P., Minchin, P. R., Hara, R. B. O., et al. (2018). Package ‘ vegan ’ version 2.5-2.
Philbrick, N. (2004). Sea of Glory: America’s Voyage of Discovery, The U.S. Exploring Expedition, 1838-1842. New York, NY: Penguin Books.
Purser, A., Marcon, Y., Hoving, H. J. T., Vecchione, M., Piatkowski, U., Eason, D., et al. (2016). Association of deep-sea incirrate octopods with manganese crusts and nodule fields in the Pacific Ocean. Curr. Biol. 26, R1268–R1269. doi: 10.1016/j.cub.2016.10.052
Quattrini, A. M., Nizinski, M. S., Chaytor, J. D., Amanda, W., Demopoulos, J., Roark, E. B., et al. (2015). Exploration of the canyon-incised continental margin of the northeastern United States reveals dynamic habitats and diverse communities. PLoS One 10:e0139904. doi: 10.1371/journal.pone.0139904
Ramirez-Llodra, E., Brandt, A., Danovaro, R., De Mol, B., Escobar, E., German, C. R., et al. (2010). Deep, diverse and definitely different: unique attributes of the world’s largest ecosystem. Biogeosciences 7, 2851–2899. doi: 10.5194/bg-7-2851-2010
Ramirez-Llodra, E., Tyler, P. A., Baker, M. C., Bergstad, O. A., Clark, M. R., Escobar, E., et al. (2011). Man and the last great wilderness: human impact on the deep sea. PLoS One 6:e22588. doi: 10.1371/journal.pone.0022588
Rex, M. A., and Etter, R. J. (2010). Deep-Sea Biodiversity: Pattern and Scale. Boston, MA: Harvard University Press.
Sarmiento, J. L., Gruber, N., Brzezinski, M. A., and Dunne, J. P. (2004). High-latitude controls of thermocline nutrients and low latitude biological productivity. Nature 427, 56–60. doi: 10.1038/nature02127
Schlining, B. M., and Stout, N. J. (2006). “MBARI ’ s video annotation and reference system,” in Proceedings of the Marine Technology Society/Institute of Electrical and Electronics Engineers Oceans Conference, (Boston, MA), 1–5.
Shank, T. (2010). Seamounts: deep-ocean laboratories of faunal connectivity, evolution, and endemism. Oceanography 23, 108–122. doi: 10.5670/oceanog.2010.65
Shuler, C., Amato, D., Veronica Gibson, V., Baker, L., Olguin, A., Dulai, H., et al. (2019). Assessment of terrigenous nutrient loading to coastal ecosystems along a human land-Use gradient, Tutuila, American Samoa. Hydrology 6:18. doi: 10.3390/hydrology6010018
Sigwart, J. D., Wicksten, M. K., Jackson, M. G., and Herrera, S. (2018). Deep-sea video technology tracks a monoplacophoran to the end of its trail (Mollusca, Tryblidia). Mar. Biodivers. 49, 825–832. doi: 10.1007/s12526-018-0860-2
Smith, J. R., Putts, M. R., Mittelstaedt, E., Cantwell, K., Lobecker, E., and White, M. (2018). Symphony of the deep: exploration of the musicians seamounts. Oceanography 31, 82–83.
Tyler, P. A., Baker, M., and Ramirez-Llodra, E. (2016). “Deep-sea benthic habitats,” in Biological Sampling in the Deep Sea, eds A. A. R. Malcolm, R. Clark, and M. Consalvey (West Sussex: John Wiley and Sons. Ltd), 1–15. doi: 10.1002/9781118332535.ch1
Van Dover, C. L. (2000). The Ecology of Deep-Sea Hydrothermal Vetns, 1st Edn. Chichester: Princeton University Press.
Vogt, D. M., Becker, K. P., Phillips, B. T., Graule, M. A., Rotjan, R. D., Shank, T. M., et al. (2018). Shipboard design and fabrication of custom 3D-printed soft robotic manipulators for the investigation of delicate deep-sea organisms. PLoS One 13:e0200386. doi: 10.1371/journal.pone.0200386
Wagner, D., and Kelley, C. D. (2017). The largest sponge in the world? Mar. Biodivers. 47, 367–368. doi: 10.1007/s12526-016-0508-z
Wagner, D., Tree, J., Kennedy, B. R. C., and Cantwell, K. (2017). 2016 Hohonu Moana: exploring the deep waters off Hawai‘i. Oceanography 30, 56–57. doi: 10.5670/oceanog.2017.supplement.01
Wang, S. C., and Dodson, P. (2006). Estimating the diversity of dinosaurs. Proc. Natl. Acad. Sci. U.S.A. 103, 13601–13605. doi: 10.1073/pnas.0606028103
Watling, L., and Auster, P. J. (2017). Seamounts on the high seas should be managed as vulnerable marine ecosystems. Front. Mar. Sci. 4:14. doi: 10.3389/fmars.2017.00014
Watling, L., Guinotte, J., Clark, M. R., and Smith, C. R. (2013). A proposed biogeography of the deep ocean floor. Prog. Oceanogr. 111, 91–112. doi: 10.1016/j.pocean.2012.11.003
Wessel, P., Sandwell, D. T., and Kim, S.-S. (2010). The global seamount census. Oceanography 23, 24–33. doi: 10.5670/oceanog.2010.60
Wu, Y., Zhu, D., Chu, Z., Zhong, C., and Luo, C. (2017). “Autonomous underwater vehicles navigation method based on ultra short base line and dead reckoning,” in Proceedings of the 2016 IEEE International Conference on Underwater System Technology: Theory and Applications (USYS), (Penang), 105–109. doi: 10.1109/USYS.2016.7893934
Keywords: ocean exploration, multibeam mapping, biodiversity, seamounts, Okeanos Explorer, Anthozoa, Porifera, Echinodermata
Citation: Kennedy BRC, Cantwell K, Malik M, Kelley C, Potter J, Elliott K, Lobecker E, Gray LM, Sowers D, White MP, France SC, Auscavitch S, Mah C, Moriwake V, Bingo SRD, Putts M and Rotjan RD (2019) The Unknown and the Unexplored: Insights Into the Pacific Deep-Sea Following NOAA CAPSTONE Expeditions. Front. Mar. Sci. 6:480. doi: 10.3389/fmars.2019.00480
Received: 02 April 2019; Accepted: 16 July 2019;
Published: 06 August 2019.
Edited by:
Cinzia Corinaldesi, Marche Polytechnic University, ItalyReviewed by:
Franziska Althaus, Commonwealth Scientific and Industrial Research Organisation (CSIRO), AustraliaPedro A. Ribeiro, University of Bergen, Norway
Copyright © 2019 Kennedy, Cantwell, Malik, Kelley, Potter, Elliott, Lobecker, Gray, Sowers, White, France, Auscavitch, Mah, Moriwake, Bingo, Putts and Rotjan. This is an open-access article distributed under the terms of the Creative Commons Attribution License (CC BY). The use, distribution or reproduction in other forums is permitted, provided the original author(s) and the copyright owner(s) are credited and that the original publication in this journal is cited, in accordance with accepted academic practice. No use, distribution or reproduction is permitted which does not comply with these terms.
*Correspondence: Brian R. C. Kennedy, KennedyB@BU.edu