Growth Response of Arctica Islandica to North Atlantic Oceanographic Conditions Since 1850
 Pierre Poitevin1*
  Julien Thébault1
  Valentin Siebert1 Sébastien Donnet2
  Philippe Archambault3
  Justine Doré1
  Laurent Chauvaud1 Pascal Lazure4
- 1Laboratoire des Sciences de l’Environnement Marin, Institut Universitaire Européen de la Mer, Université de Bretagne Occidentale, Plouzané, France
- 2Fisheries and Oceans Canada, Northwest Atlantic Fisheries Centre, Newfoundland, NL, Canada
- 3Département de Biologie, Québec-Océan, Université Laval, Québec, QC, Canada
- 4Ifremer, Laboratoire d’Océanographie Physique et Spatiale, Institut Universitaire Européen de la Mer, Plouzané, France
The Northwest Atlantic is a key region with an essential role in global climate regulation, redistributing heat and influencing the carbon cycle. However, little is known about its evolution before 1950, mainly because of the lack of long-term instrumental measurements. The hard parts of long-lived marine biota hold the potential to extend instrumentally derived observation by several decades or centuries and enhance our understanding of global climate processes. Here, we investigate the effects of local, regional, and large-scale climate variability on the marine bivalve, Arctica islandica (Linnaeus, 1767) from Saint-Pierre and Miquelon (SPM). This archipelago lies at the boundary zone between the cold Labrador Current in the north and the warm Gulf Stream waters to the south, an excellent site to capture changes in North Atlantic climate and oceanography. This study presents the northernmost, statistically robust A. islandica growth chronology (1850–2015) from the Western North Atlantic and its potential as an environmental proxy record for past climatic and hydrographic variabilities at different time and geographical scales. In view of our results, it seems that A. islandica shell growth anomalies in SPM are mostly controlled by local primary production. Since long term instrumental records of this environmental variable are not available; we investigate the influence of global and regional environmental phenomena on A. islandica growth and indirectly on primary productivity of archipelago waters. The chronology correlates significantly and positively with the Atlantic Multidecadal Oscillation (AMO) and negatively with the North Atlantic Oscillation, two global climatic indices. The North Atlantic spatial pattern of correlation shows significant and positive correlations of 0–100 m temperatures from 1950 with A. islandica growth in SPM encompassing the subpolar gyre area. These global-scale relationships are refined and the mechanisms leading to them explained by comparing A. islandica growth chronology to regional environmental datasets. These relationships existing between the A. islandica shell growth record at SPM and environmental datasets covering different geographical scales could yield details about past North Atlantic basin and regional environmental conditions through their influence on SPM coastal environment.
Introduction
The global climate system is undergoing deep and rapid changes. The oceans and their interaction with the atmosphere have become a focal point of climate studies because of the ocean’s role in ongoing global warming (e.g., Kerr, 2005; Belkin, 2009; Saba et al., 2016; Lozier et al., 2019). The subpolar North Atlantic is one of the most climate-relevant regions of the oceans to observe these interactions because of its role on the global thermohaline circulation. In this region, warm and saline surface waters from the tropics are transported northward, where they cool, become denser and sink, ultimately creating North Atlantic deep water (Rhein et al., 2011). This intense deep convection occurs in the subpolar gyre (SPG) which is therefore an important component of this system (Häkkinen and Rhines, 2004). This oceanic circulation is not constant over time as suggested by many observational and modeling studies (Bohm et al., 2015; Rahmstorf et al., 2015; Srokosz and Bryden, 2015; Lozier et al., 2019) and its changes are driving many other climatic events across wide ranges of spatial and temporal scales (Delworth et al., 2008). The oceanic and atmospheric leading modes of variability in the North Atlantic region are the Atlantic Multidecadal Oscillation (AMO) and the North Atlantic Oscillation (NAO), respectively. These two large-scale climatic drivers strongly influence marine ecosystem structure (e.g., Carroll et al., 2014) at inter-decadal and multi-decadal time scales. Thus, the evolution of these oceanic and atmospheric patterns and their changes under the effects of warming and increasing freshwater release is a major concern in the global climate evolution (Liu et al., 2017).
The southern Newfoundland’s coast and Saint-Pierre and Miquelon region lie at the confluence of the main oceanographic currents ruling the North Atlantic Basin hydrodynamics, the Gulf Stream and Labrador Current (LC) (Figure 1). The LC flows toward the south and carries cold and less saline water of Arctic origin along the Labrador slope and Grand Banks and extends to the Scotian shelf, finally affecting the whole Middle Atlantic Bight (e.g., Chapman and Beardsley, 1989). However, despite its importance, the circulation over the shelf in this region is still insufficiently observed and numerically resolved (e.g., Wu et al., 2012). This gap exists mainly because of the lack of long-term environmental records in this area, where they are sparse and spatiotemporally incomplete before the mid-20th century (Halfar et al., 2011).
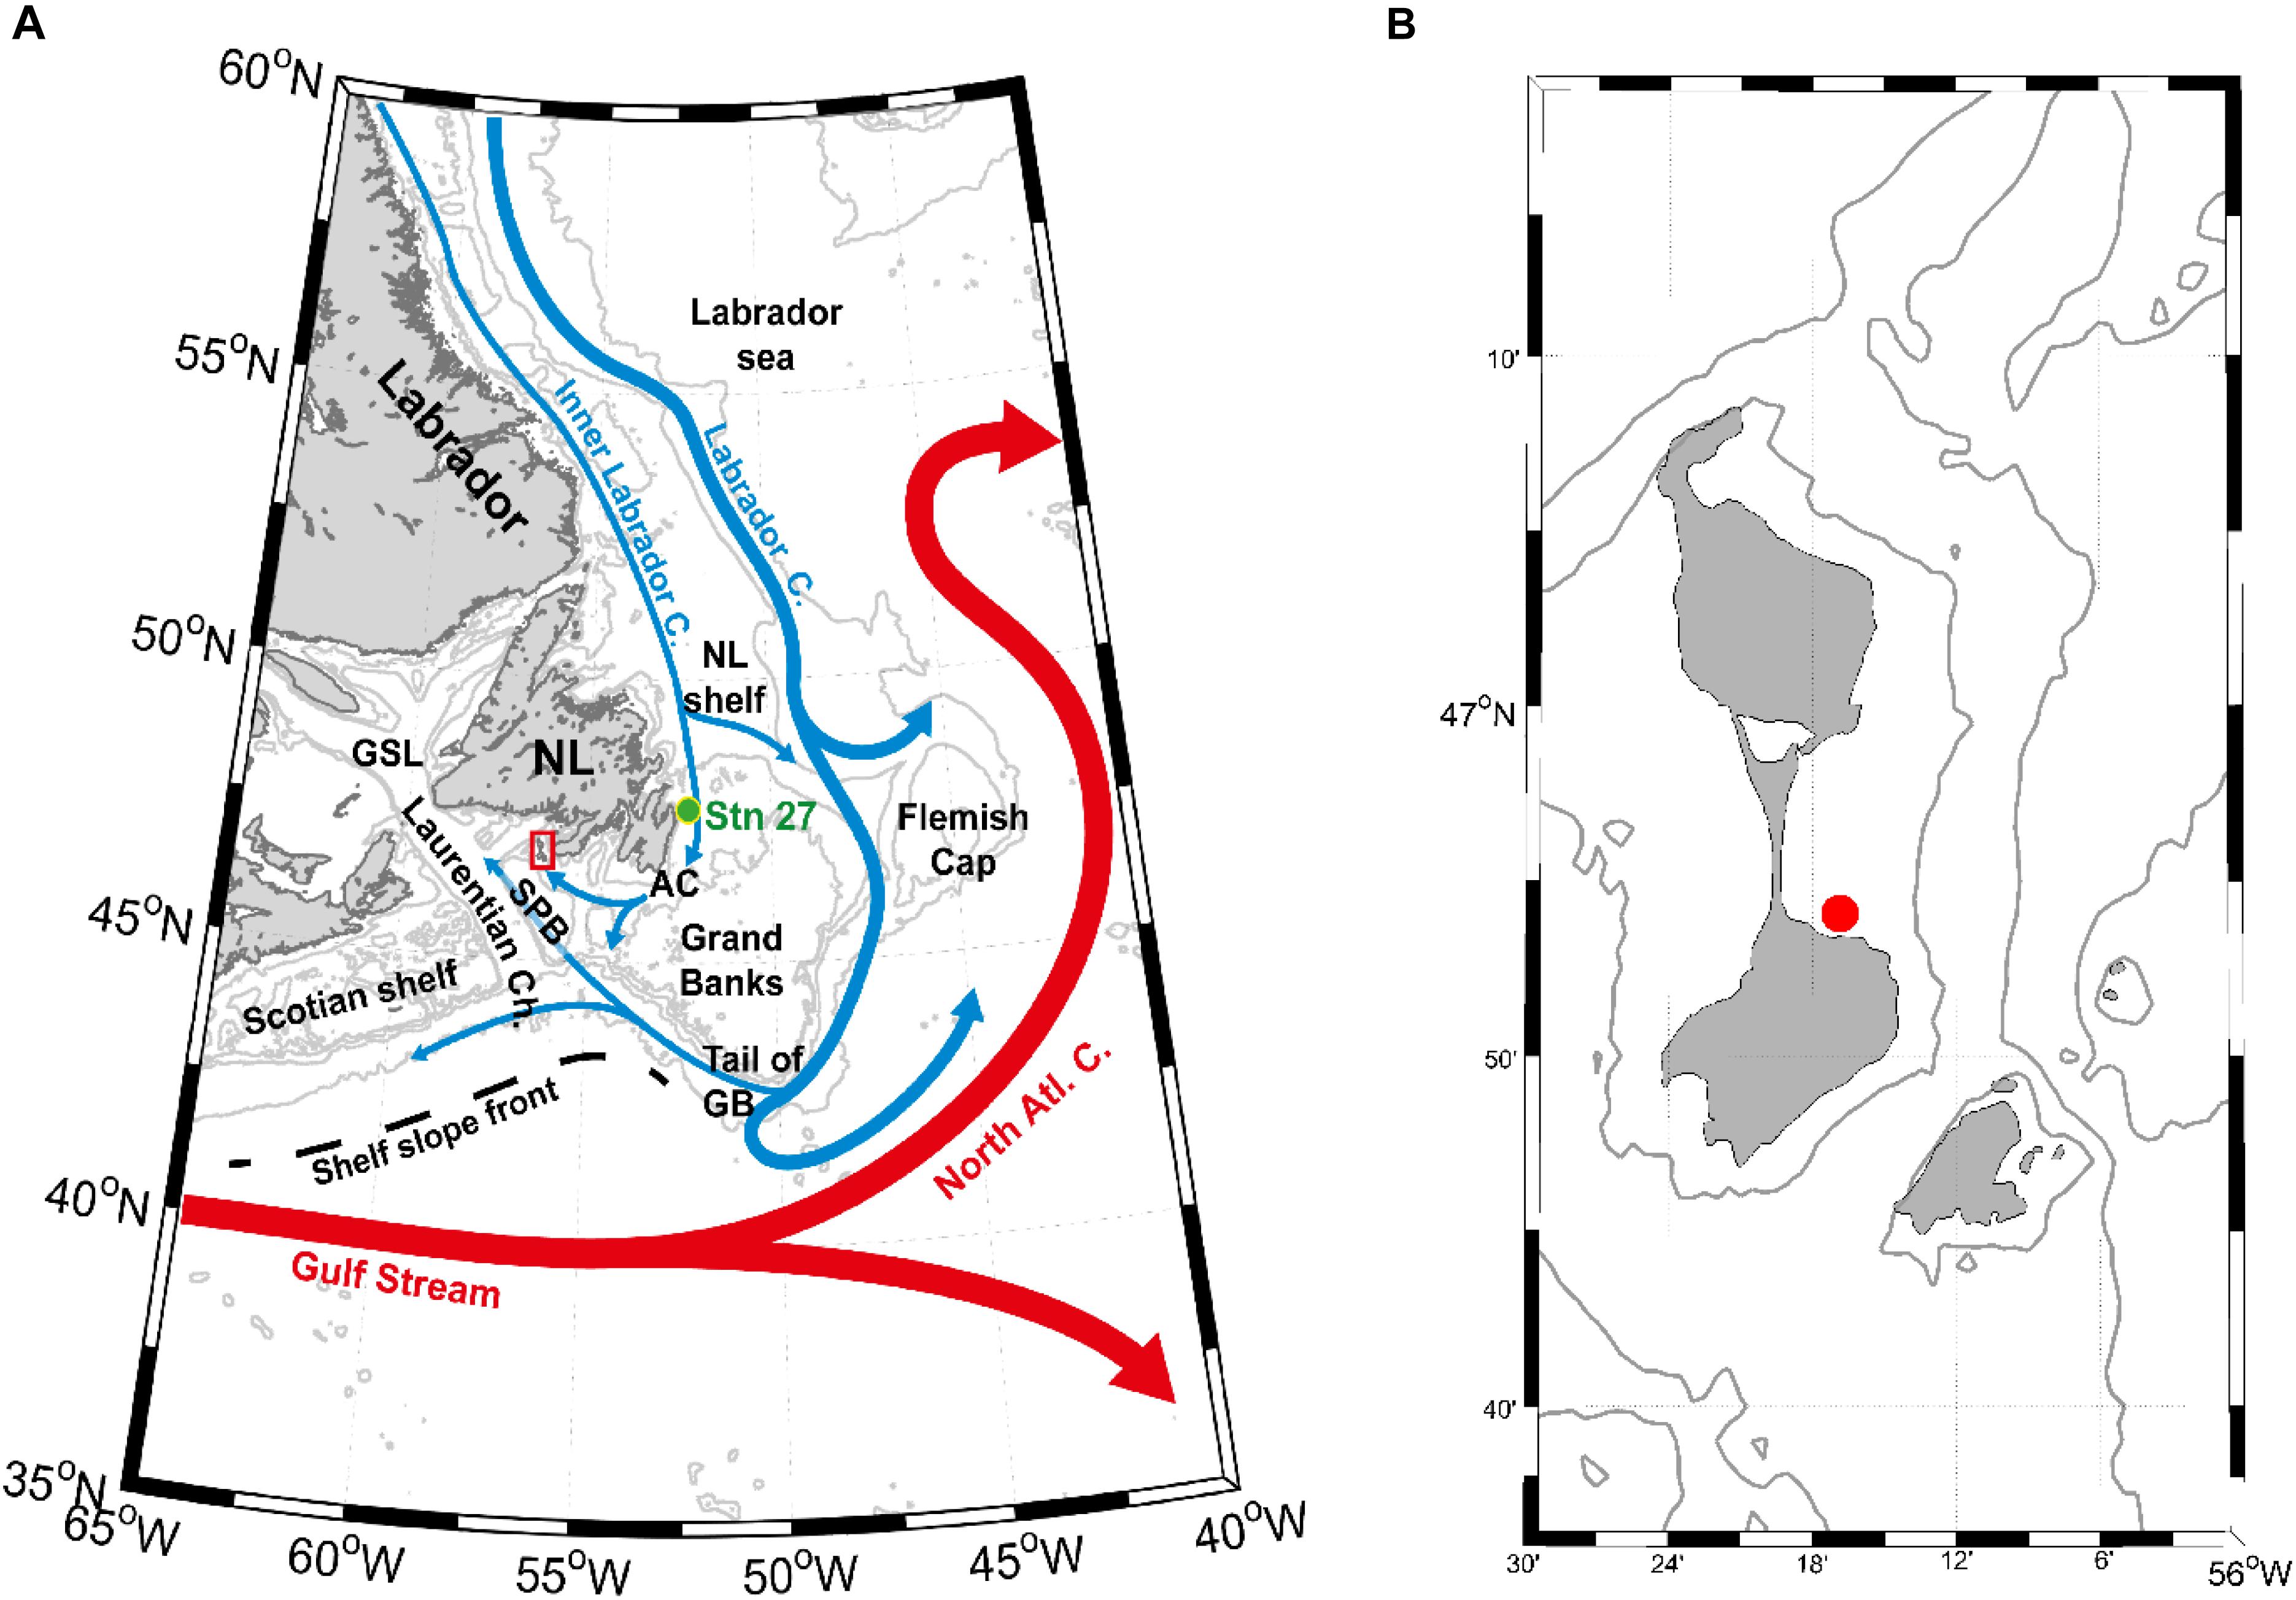
Figure 1. (A) Major features of the regional surface circulation (inspired in the Figure Fratantoni and McCartney, 2009) and main location names. The cold inner and outer LCs are in blue; Gulf Stream and North Atlantic currents are in red; black dashed line represents the Shelf Slope Front mean position (according to Peterson et al., 2017). In green is historical hydrographic Station 27 (Stn. 27). The main acronyms corresponding to location names are as follows: NL – Newfoundland; SPB – Saint-Pierre Bank; GSL – Gulf of Saint-Lawrence; AC – Avalon Channel; and GB – Grand Banks. (B) Sampling location of Arctica islandica (red dot).
Proxy data allow us to generate such records retrospectively. In boreal and temperate regions, most paleoenvironmental reconstructions are based on terrestrial proxies. However, such data do not necessarily reflect marine environmental conditions. In the oceanic realm, analysis of the carbonate hard structures of marine species could potentially extend instrument-derived observations by several decades or centuries. For example, a recent study (Thibodeau et al., 2018) carried out on benthic foraminifera from sediment cores retrieved from the Laurentian Channel demonstrates the link existing between paleo environmental information and processes ruling the North Atlantic oceanic circulation. As shown by several studies (e.g., Witbaard et al., 1997; Schöne et al., 2005b; Wanamaker et al., 2012; Butler et al., 2013; Bonitz et al., 2018) the shells of the bivalve mollusc A. islandica (Linnaeus, 1767) can also be used as a high-resolution archive of paleoclimate dynamics. The main assets of this species are (i) its wide geographic repartition across the North Atlantic in the upper 500 m (Nicol, 1951), and (ii) its extraordinary longevity, with a maximum recorded age of 507 years (Butler et al., 2013). Regionally, some studies (e.g., Marchitto et al., 2000; Wanamaker et al., 2009, 2018) present paleo environmental information from the Gulf of Maine using A. islandica, to enhance the spatial and temporal understanding of the climatic and hydrographic variability in this region. However, to our knowledge, no studies have been carried out on A. islandica as a recorder of past environmental variability on the Newfoundland shelf.
Like other molluscs, this species contains distinct annual growth increments in its shell (Jones, 1980; Weidman et al., 1994; Schöne, 2013). The width of the growth increments is defined by annual growth lines formed during certain periods of the year associated with reduced growth rates (Dunca et al., 2009). With this periodic banding, each increment can be placed in a temporal context. Moreover, if the date of a specific growth increment is known (the date of death, for instance), it becomes possible to assign precise calendar dates to an entire shell record. Based on synchronous changes in shell growth, increment width time series of specimens with overlapping lifespans can be combined to build composite or master chronologies (e.g., Witbaard et al., 1997; Schöne et al., 2005b; Wanamaker et al., 2012; Bonitz et al., 2018). Annual increment size generally results from interactions between the environment and organism physiology (Rhoads and Lutz, 1980, for a review). Although genetic factors can influence ontogenetic growth trends and other fitness-related traits (David et al., 1995), year-to-year variability is mainly caused by external factors (Marchitto et al., 2000). These external factors have often been related to environmental variables such as food availability (e.g., Witbaard et al., 1997; Ballesta-Artero et al., 2017) or water temperature (e.g., Butler et al., 2009; Marali and Schöne, 2015). However, assigning growth patterns to any single environmental variable or to a combination is challenging because of their interactions, which may also vary in time and space (Butler et al., 2013).
This study focuses on Saint-Pierre and Miquelon (SPM) to present the northernmost A. islandica growth chronology (1850–2015) from the western North Atlantic and its potential as an environmental proxy record for past climatic and hydrographic variabilities. More specifically the objectives of this study are to (i) determine if synchronous changes in shell growth among specimens from surface waters (<15 m) allow construction of a statistically robust composite chronology and (ii) test whether A. islandica shell growth variability can serve as a tool for estimating past environmental variability in SPM and in a broader oceanic spatiotemporal context.
Materials and Methods
Sample Collection
Thirty-two A. islandica specimens were analyzed. All of them were collected live at 14–15 m depth by scuba diving along the southeastern shore of the Miquelon-Langlade sandy isthmus (46°54′08″N; 56°16′86″W) in September 2016 (Figure 1). The habitat at the sampling station was homogeneous and consisted of compacted and well graded stable fine sand (85% of its mass comprised between 100 and 200 μm). Soft tissues were removed from the live-collected shells immediately after collection. All specimens were carefully cleaned with freshwater to remove adherent sediment and biological tissues before sample preparation.
Sample Preparation
For each shell, a section roughly 2–3-cm in width was cut, using a robust tile saw, from the hinge through to the ventral margin encapsulating the apex of the umbo and the axis of maximum growth. The cut section was embedded in a polyester mounting resin (SODY 33, ESCIL) to prevent cracking during sectioning. A thin cross-section (2 mm thick) was cut along the axis of maximum growth using a low-speed precision saw (Struers, Secotom 10; rotation speed 500 rpm; feed rate 200 μm s-1) equipped with a 600-μm-thick diamond-coated blade continuously cooled by deionized water. Thin sections were carefully ground on a rotating polishing table (Struers, TegraPol-35) with a sequence of 800, 1200, 2500, and 4000 grit wet-table carborundum paper, followed by polishing with 3-μm diamond liquid (Struers) to remove any saw marks. Cross-sections were ultrasonically cleaned with deionized water between each grinding or polishing step to remove residual abrasive material.
The polished shell sections were then etched in a Mutvei’s solution (Schöne et al., 2005a) for 45 min at room temperature, soaked in a deionized water bath, and left to air dry before imaging. Treatment with Mutvei’s solution results in a three-dimensional display of growth patterns and reveals clear annual growth lines.
Shell sections were photographed under reflected light (Carl Zeiss, KL 2500 LCD) using an AxioCam MRC 5 installed on a Carl Zeiss SteREO Lumar.V12 stereomicroscope equipped with a motorized stage, under 25 × magnification. Photomosaics were constructed using AxioVision 4.9.1 software (Carl Zeiss). Annual growth increment widths corresponding to the curved distance between two successive annual growth lines were measured digitally in the outer shell layer (Schöne et al., 2005a) to the nearest 1 μm (Figure 2) using the image processing and analysis software Image J (NIH Image). Each growth increment was assigned to a particular year starting from the ventral margin of the shell, yielding a time series of increment width for each individual.
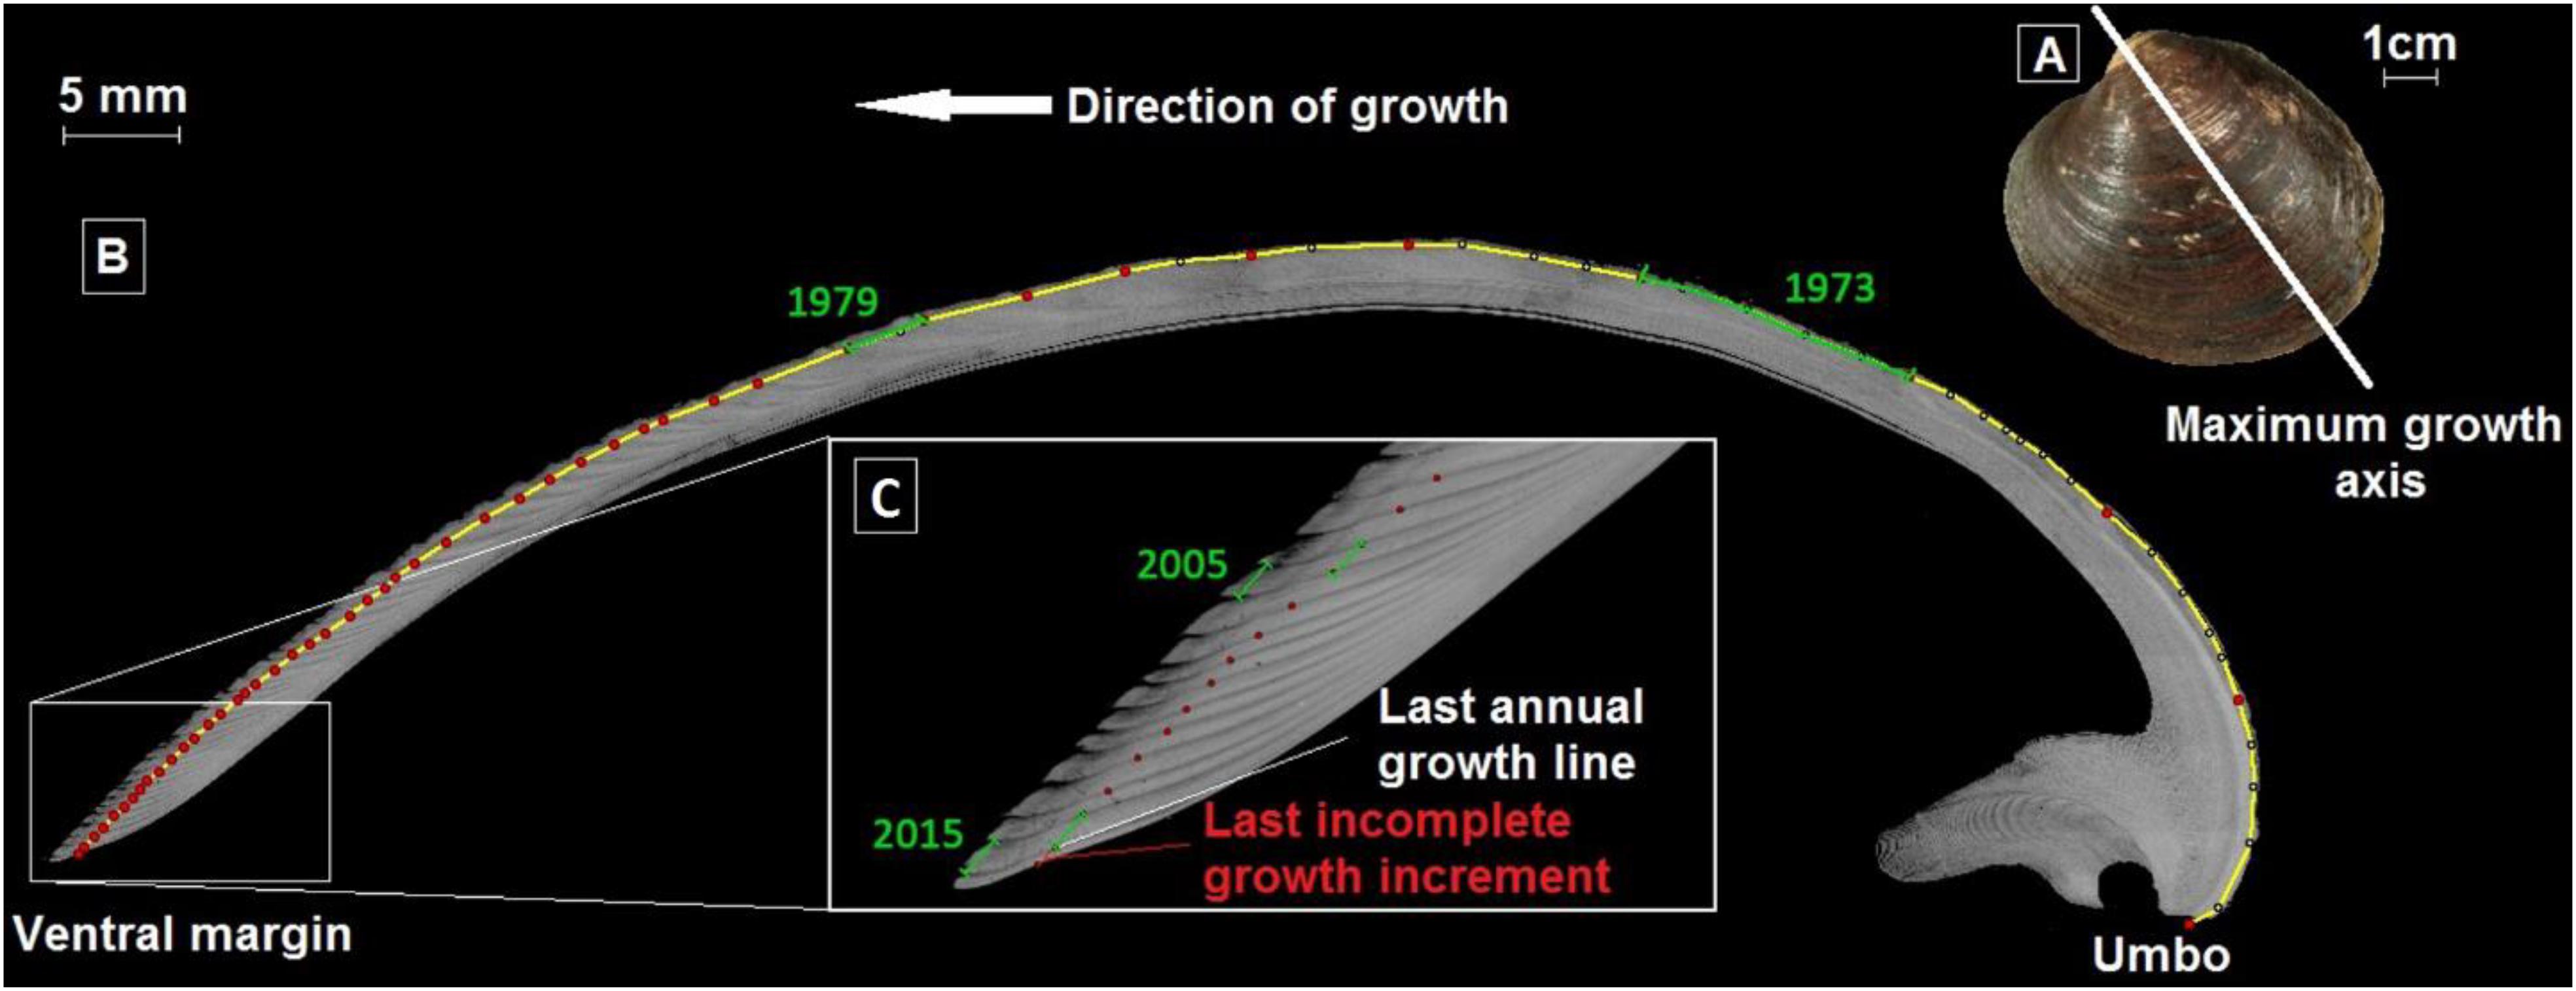
Figure 2. Arctica islandica growth patterns. (A) Outer shell surface of an A. islandica left valve and its axis of maximum growth along which thin cross sections were cut. (B) Photomosaic of a cross-section stained by Mutvei’s solution, and (C) zoom on the ventral margin to observe the last annual growth line and 2016 incomplete growth increment. The yellow line corresponds to the trajectory on which annual growth lines (red dots) were placed and growth increments measured (green lines).
Chronology Construction
To isolate environmental signals from time series of increment width, ontogenetic age trends were individually removed. This ontogenetic trend can be estimated mathematically by a growth equation. In the present study, a dynamic optimized model deriving the generalized von Bertalanffy growth function (von Bertalanffy, 1938) was fitted to each measured increment width time series. This code was written with Scilab 6.0.0, free and open source software (distributed under CeCILL license – GPL compatible) developed by Scilab Enterprises (2012) and is available upon request.
Growth indices (GIs) were then calculated for each year and each individual by dividing the measured increment width by the predicted increment width (Schöne, 2013), as follows:
Where GIt is the growth index at t (in years), Lt+1 – Lt is the measured shell increment at t, and L(p)t+1–L(p)t is the predicted shell increment length at the same time t. Individual time-series of GI were then standardized as follows (Schöne, 2013):
Where μ is the average of all GI values and σ the standard deviation. The standardized GI (SGI) is a dimensionless measure of how growth deviates from the predicted trend. Positive values represent greater than expected growth, whereas negative values represent less than expected growth. The robustness of the SGI chronology was tested. A frequently used assessment of the robustness of composite chronologies is the expressed population signal (EPS) (Wigley et al., 1984), which is given as:
Where Rbar is the average of all correlations between pairs of SGI chronologies and n is the number of specimens used to construct the stacked chronology. EPS > 0.85 indicates that the variance of a single SGI chronology sufficiently expresses the common variance of all SGI series. All these analyses were carried out using COFECHA (Grissino-Mayer, 2001) and the R package dplR (Bunn, 2008).
Environmental Datasets
In order to reveal potential relationships between shell growth and local phytoplankton dynamics, SGI master chronology was compared with monthly satellite chlorophyll a measurements (1998–2015). The data were downloaded from the GlobColour website1 and are weighted monthly averages of single-sensor products (SeaWiFS/MERIS/MODIS/VIIRSN merged chlorophyll concentrations) over the area 46.6–47.3°N/56.0–56.6°W (i.e., waters surrounding the SPM archipelago within ca. 30 km).
Temperature measurements were obtained from oceanographic Station 27 (at 10, 20, 30, 50, 75, 100, 125, 150, and 175 m; 47.55°N, 52.583°W), the oldest regularly monitored site of the LC inshore branch (Figure 1). This historical hydrographic station located 7 km off St. John’s Harbor in the Avalon channel provides more than 50 years of in situ measurements of coastal ocean parameters in monthly sampling resolution. Station 27 data are available from June 1946 onward. However, because of data gaps in the years 1946–1949 (more than 4 measurements/year missing), only data from 1950 onward were used in this study. The distance between Station 27 and SPM archipelago via ocean currents is about 400 km.
To test the effect of regional and local environmental conditions on shell growth, the master chronology was also compared to regional environmental datasets (Figure 1), namely the LC volume transport along the Tail of Grand Banks, the position of the Shelf Slope Front (SSF), the St Lawrence River fresh water runoff and the sea ice coverage off Newfoundland.
The LC volume transport along the Tail of Grand Banks from 1992 to 2013 at transect 226 (Han and Li, 2008) was compared to our shell growth master chronology, and is available at: http://www.meds-sdmm.dfo-mpo.gc.ca/isdm-gdsi/azmp-pmza/climat/labrador/transport-eng.htm. The SSF lies between cold fresh shelf water and warm slope water at the South (Gatien, 1976). Its latitudinal position was digitized from 1973 to present, between -65°W and -50°W at each 1° of longitude from sea surface temperature–based analysis charts of the Bedford institute, available at: http://www.meds-sdmm.dfo-mpo.gc.ca/isdm-gdsi/azmp-pmza/climat/gulf-golfe/slope-plateau-eng.htm. The monthly St Lawrence River fresh water runoff at Quebec City from 1914 to 2015 was also used and is available at: http://www.meds-sdmm.dfo-mpo.gc.ca/isdm-gdsi/azmp-pmza/climat/basins-eng.asp?id=rivsum. Finally, we compared SGI variations with sea ice coverage surface over the Newfoundland shelf (in km2) from 1963–2016, reported on a monthly basis2.
At a broader spatial scale, the SGI master chronology was also compared with annual climatic indices reflecting climate and ocean dynamics over the North Atlantic Ocean on a inter-decadal or multi-decadal time scale: the Atlantic Meridional Oscillation (AMO) (Schlesinger and Ramankutty, 1994), the North Atlantic Oscillation (NAO) (Hurrell, 1995), and the Sub-Polar Gyre (SPG) index (Häkkinen and Rhines, 2004).
The AMO is an index reflecting sea surface temperature variations in the North Atlantic. The positive (negative) AMO phase corresponds with positive (negative) SST anomalies over most of the North Atlantic basin (0°N-65°N, 80°W-0°E), with stronger anomalies in the subpolar region and weaker anomalies in the tropics. The dataset used in this study extends from 1870 to 2010 and is available at: http://www.cgd.ucar.edu/cas/catalog/climind/AMO.html.
The NAO is the difference in atmospheric pressure between Azores high pressures and Icelandic low pressures, which drive the westerlies. In this region, the negative (positive) phase of the NAO is related to lower (stronger) north-westerly winds, reduces (enhances) heat losses by the ocean, and deep convection in the Labrador Sea and sea ice cover over the Newfoundland shelf (Wanner et al., 2001). Several datasets on NAO are available and can differ significantly (even in the last decades) depending on the atmospheric data used (mainly their location) and their treatments. In this study, we used three datasets:
- The DFO (Canada) dataset covers 1895–2017 on a yearly basis and is available at: http://www.meds-sdmm.dfo-mpo.gc.ca/isdm-gdsi/azmp-pmza/climat/nao-oan-eng.htm
- CRU (University of East Anglia) from 1821 to present, now on a monthly and yearly basis and available at: https://crudata.uea.ac.uk/cru/data/nao/index.htm
- NCEP reanalysis of NOAA from 1950 to present on a monthly basis, available at: ftp://ftp.cpc.ncep.noaa.gov/wd52dg/data/indices/nao_index.tim
The SPG time series used in this study come from Berx and Payne (2017) and cover the period 1992–2016 on a monthly basis. This index is based on maps of sea surface height. Its variability seems to be weakly dependent of the spatial domain and compares favorably with previous studies (Häkkinen and Rhines, 2009). Positive values of this index are associated with a strong sub-polar gyre circulation with a wide spread and a strong LC over the Labrador and northeastern Newfoundland Slope. In comparison, negative values of SPG index are associated with a weak sub-polar gyre and westward retraction and weak LC transport over the Labrador and northeastern Newfoundland Slope. The data set is available at: https://data.marine.gov.scot/dataset/sub-polar-gyre-index.
To assess the spatial correlation between SGI and North Atlantic hydrology, we used the gridded objective analysis of world ocean temperature (averaged from the surface to 100 m) of the UK Met Office Hadley centre EN4.2.1 (Good et al., 2013, with bias corrections from Levitus et al., 2009). This dataset has a spatial resolution of 1°, 42 vertical levels, and a monthly time step, and extends from 1900 to present. We decided to use only the last 66 years (1950–2015) because of the larger uncertainties of environmental measurements during the first half of the 20th century (Wolfe et al., 2019). These data are available at: https://www.metoffice.gov.uk/hadobs/en4/download-en4-2-1.html#l09_analyses.
Statistics
For comparisons between the master chronology and environmental datasets, the Pearson correlation was used. The commonly used alpha value of 0.05 was chosen as the threshold value for significance of the correlations. In some cases, correlations were performed using monthly averaged environmental variables given that hydrographic conditions during specific months can strongly influence annual bivalve growth. In addition, to consider water mass transit time between the SSF and SPM archipelago the correlations between A. islandica annual growth rate and SSF position at different longitudes were performed between August (Y-1) and June (Y).
Results
Chronology Construction
The shell-based growth records of the 32 live-collected A. islandica specimens from surface waters ( < 15 m) of SPM covered the time interval from 1850 to 2015 (Figure 3). The shortest and longest time series that were used to build the master chronology were 41 and 166 years, respectively. The average length of these 32 time series was 106.94 years (1σ = 33.39), and 23 were longer than 100 years. Shells had strongly synchronous detrended growth patterns among individuals, with wide increments between 1915 and 1955 and narrow increments from 1981 to 2015. Correlations between each detrended time series and the average of others were all positive and statistically significant (p < 0.05), with a mean of 0.537 (series intercorrelation). Average mean sensitivity calculated according to Eq. 2 in Biondi and Qeadan (2008) was 0.270. Since 1889 and until 2015, running EPS values (15-year windows with 8-year overlaps) remained above the critical threshold of 0.85 (Wigley et al., 1984; Figure 3).
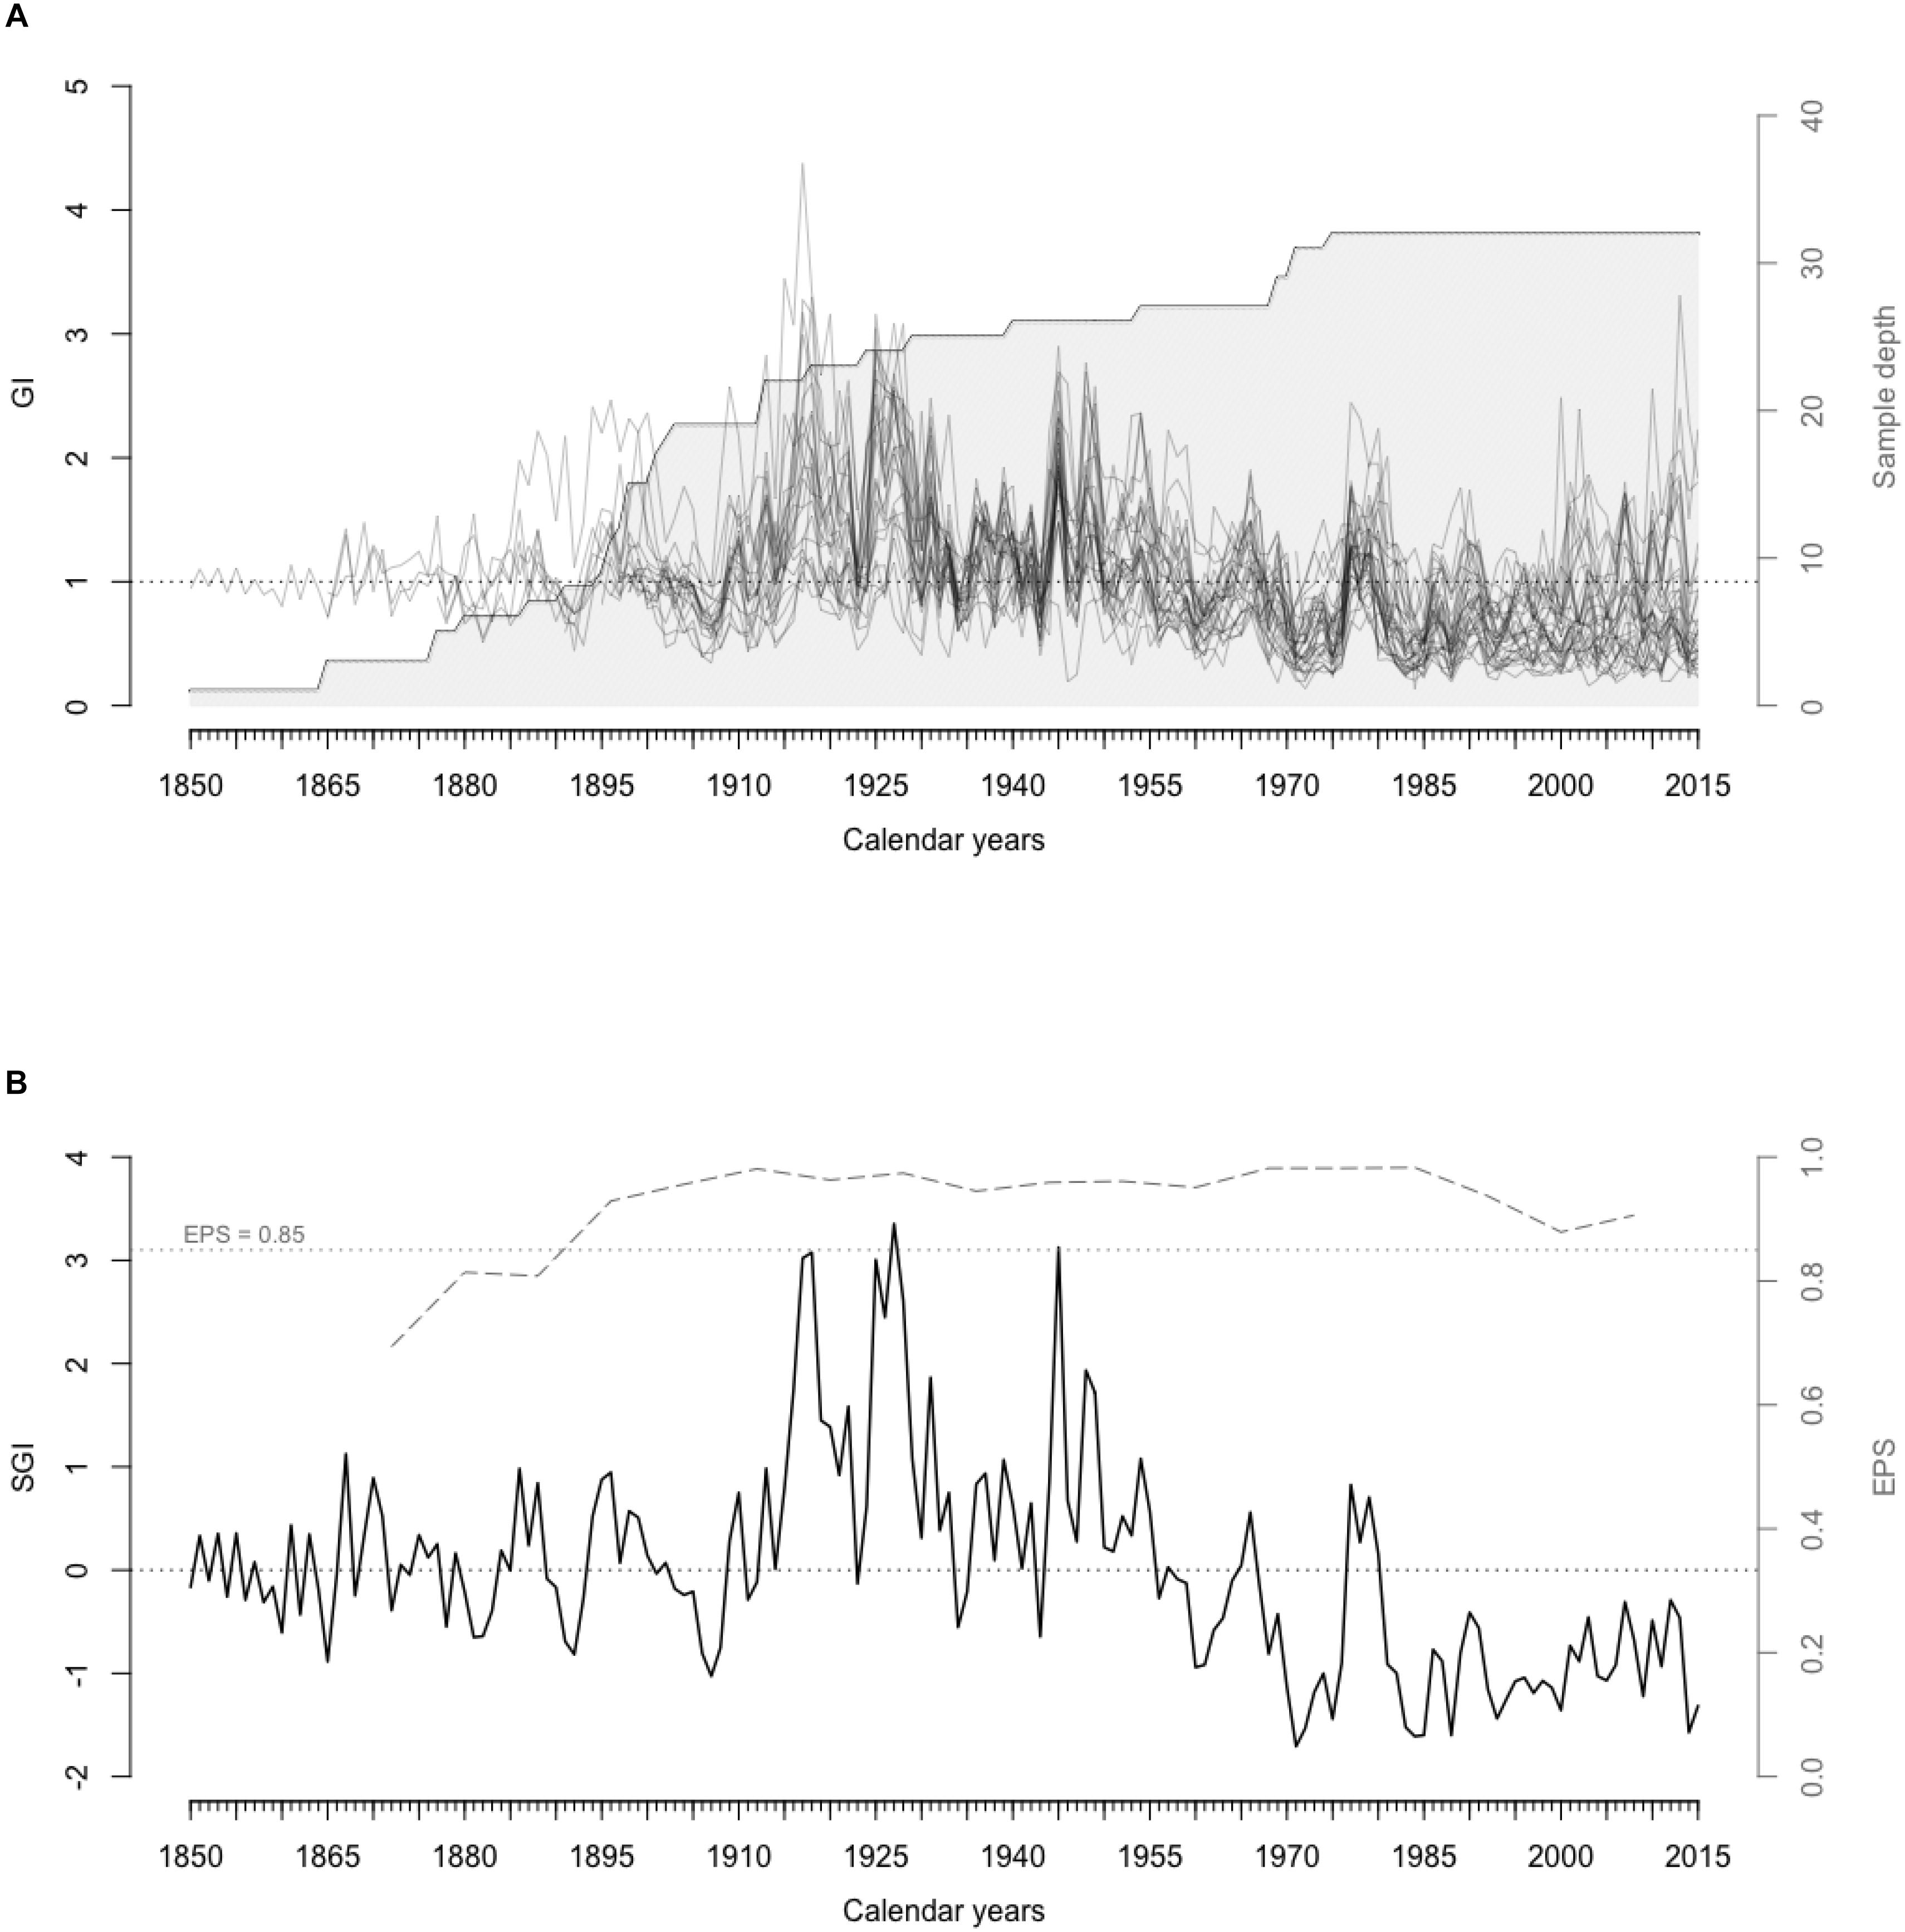
Figure 3. (A) Detrended A. islandica shell growth series (GI) and number of shells in the chronology through time (Sample depth). (B) SGI master chronology (black curve) and EPS values (gray dashed curve) from the master chronology computed in 15-year running windows with arbitrary EPS threshold value 0.85 (gray dotted line) above which the master chronology is statistically robust.
Shell Growth Variability and Environmental Data
Correlation With Regional Environmental Datasets
Shell growth was positively correlated (N = 18, r = 0.43, p < 0.05) with mean local chlorophyll a concentration from April to October over the period 1998–2015.
The SPG western flank consists of the LC, which includes two branches, a main offshore branch and a smaller inshore one (Matthews, 1914; Smith et al., 1937). Station 27 located in the Avalon channel within the LC inshore branch provides the longest time series of hydrologic properties in this area. Correlations between SGI chronology and Station 27 temperature have been sought at each depth level monthly from 1950 to 2015 (Figure 4). Strong positive correlations were observed between shell growth and Station 27 temperature during January and February at all bathymetric levels and almost all year long below 100 m.
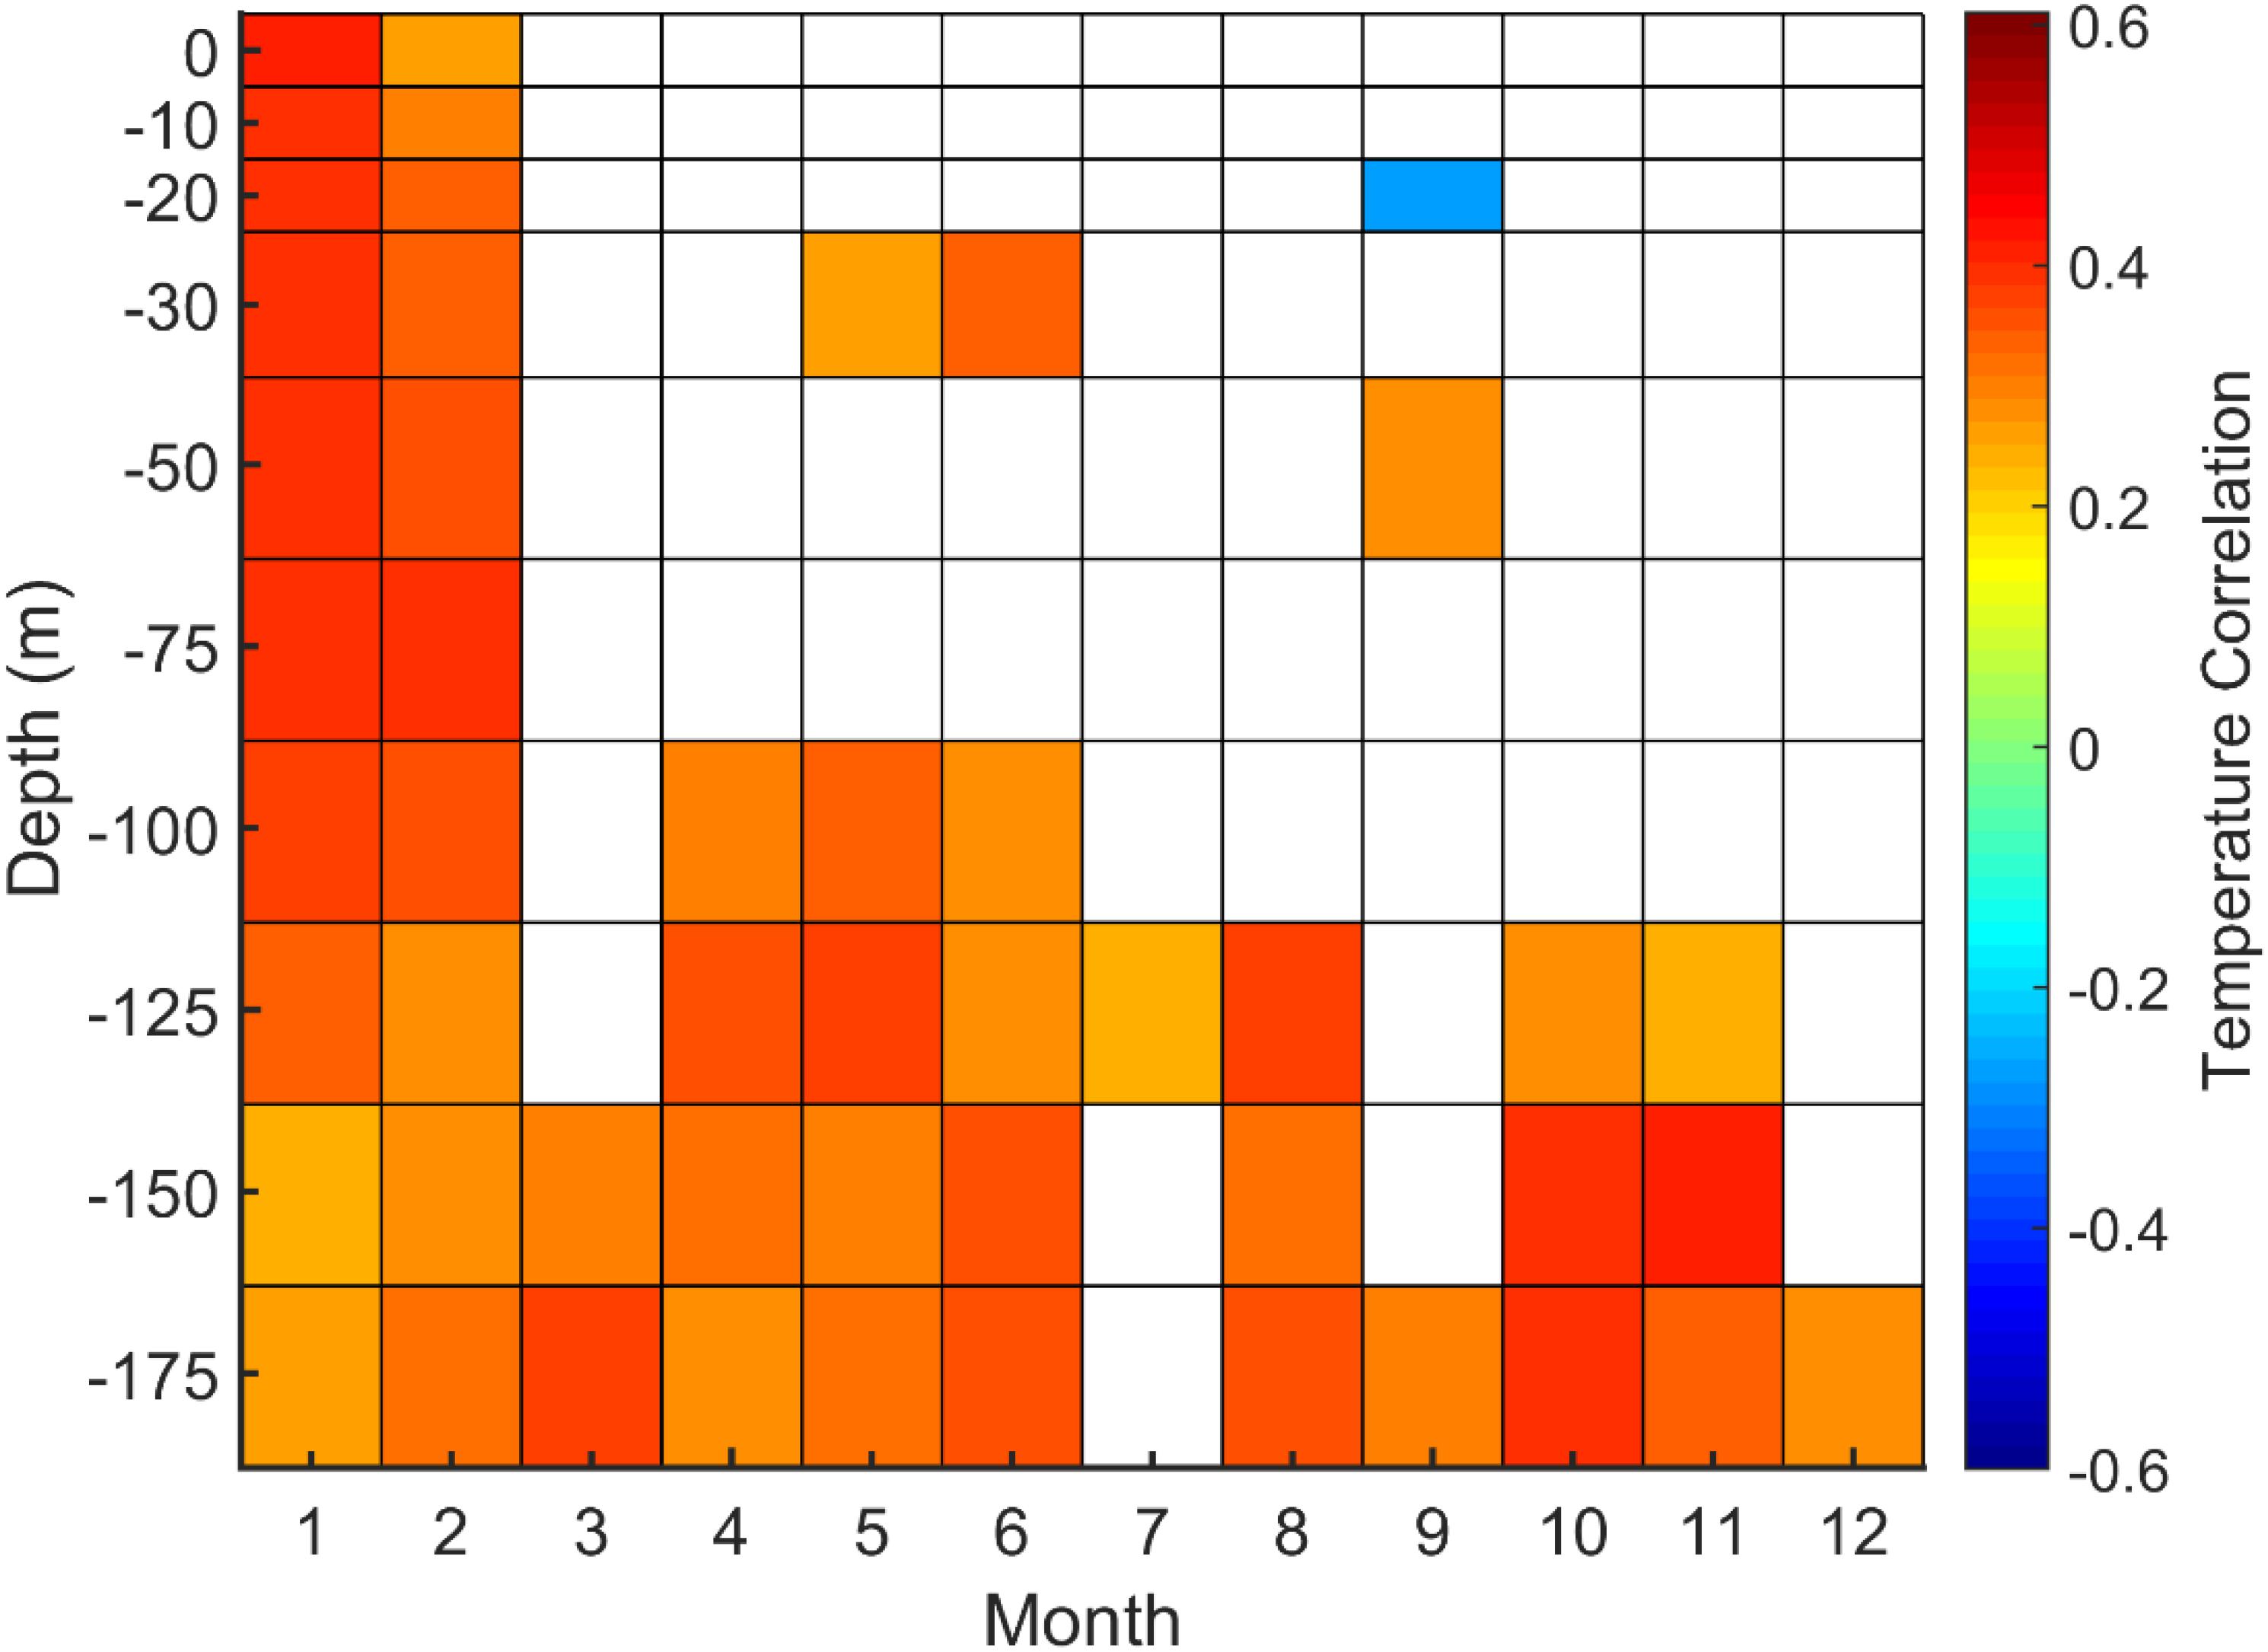
Figure 4. Correlations between A. islandica SGI and Station 27 temperature time series at each depth level (in meter) for each month (p > 0.05 are not displayed).
A key point for LC observation is the Tail of Grand Banks where westward transport (Sv) of the offshore LC branch along the slope has been calculated from 1992 to 2013. Strong positive correlations between shell SGI and winter transport (December, January, February) at the Tail of Grand Banks were found (N = 22, r = 0.45, p < 0.05) and (N = 22, r = 0.64, p < 0.05) when the series were linearly detrended (Figure 5).
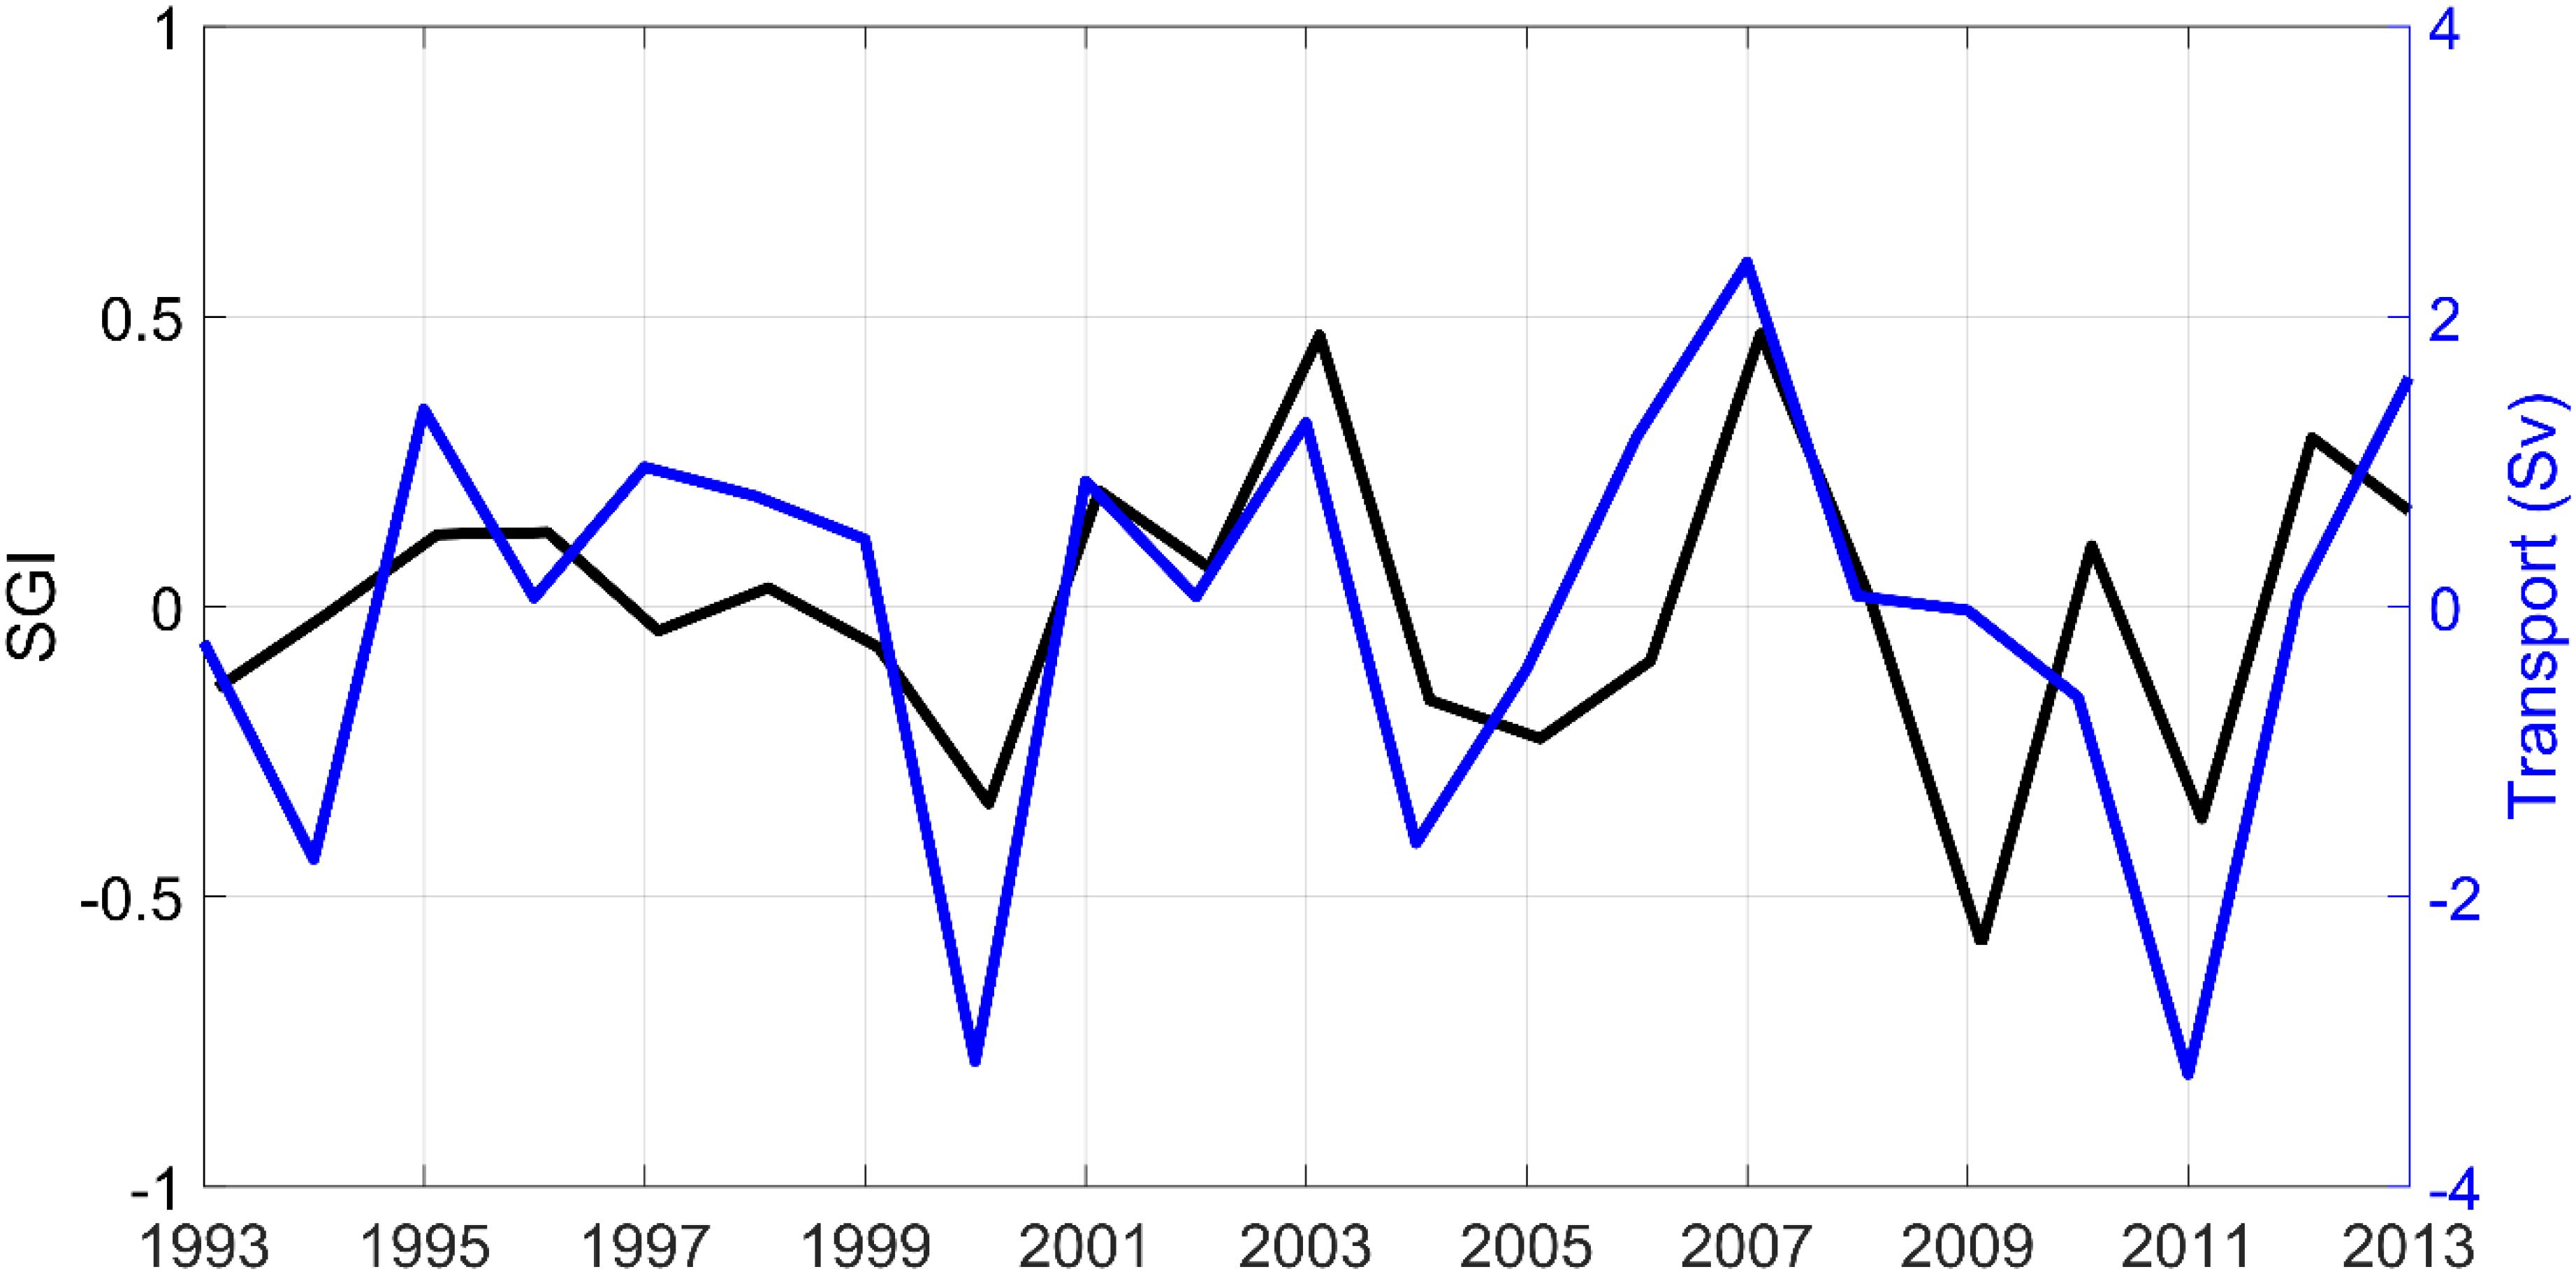
Figure 5. The blue curve represents detrended westward transport at the Tail of the Grand Banks (in Sv, denoted Tail of GB on Figure 1) in winter (December, January, and February). The black curve corresponds to A. islandica detrended SGI.
The average latitudinal position of the SSF is between 42 and 43°N, and this latitude at each degree of longitude varies with season and year. At each longitude from 50 to 65°W, a time series of the monthly latitude of the SSF (with a minimum of three observations per month) is correlated with SGI. Correlations between growth rate and SSF latitudinal position were always negative (meaning that growth is favoured by a southward shift of SSF) and often significant (Figure 6). Between 60 and 50W, strong negative correlations occurred during the previous fall (October, November, and December) and spring (April, May, and June) to a lesser extent.
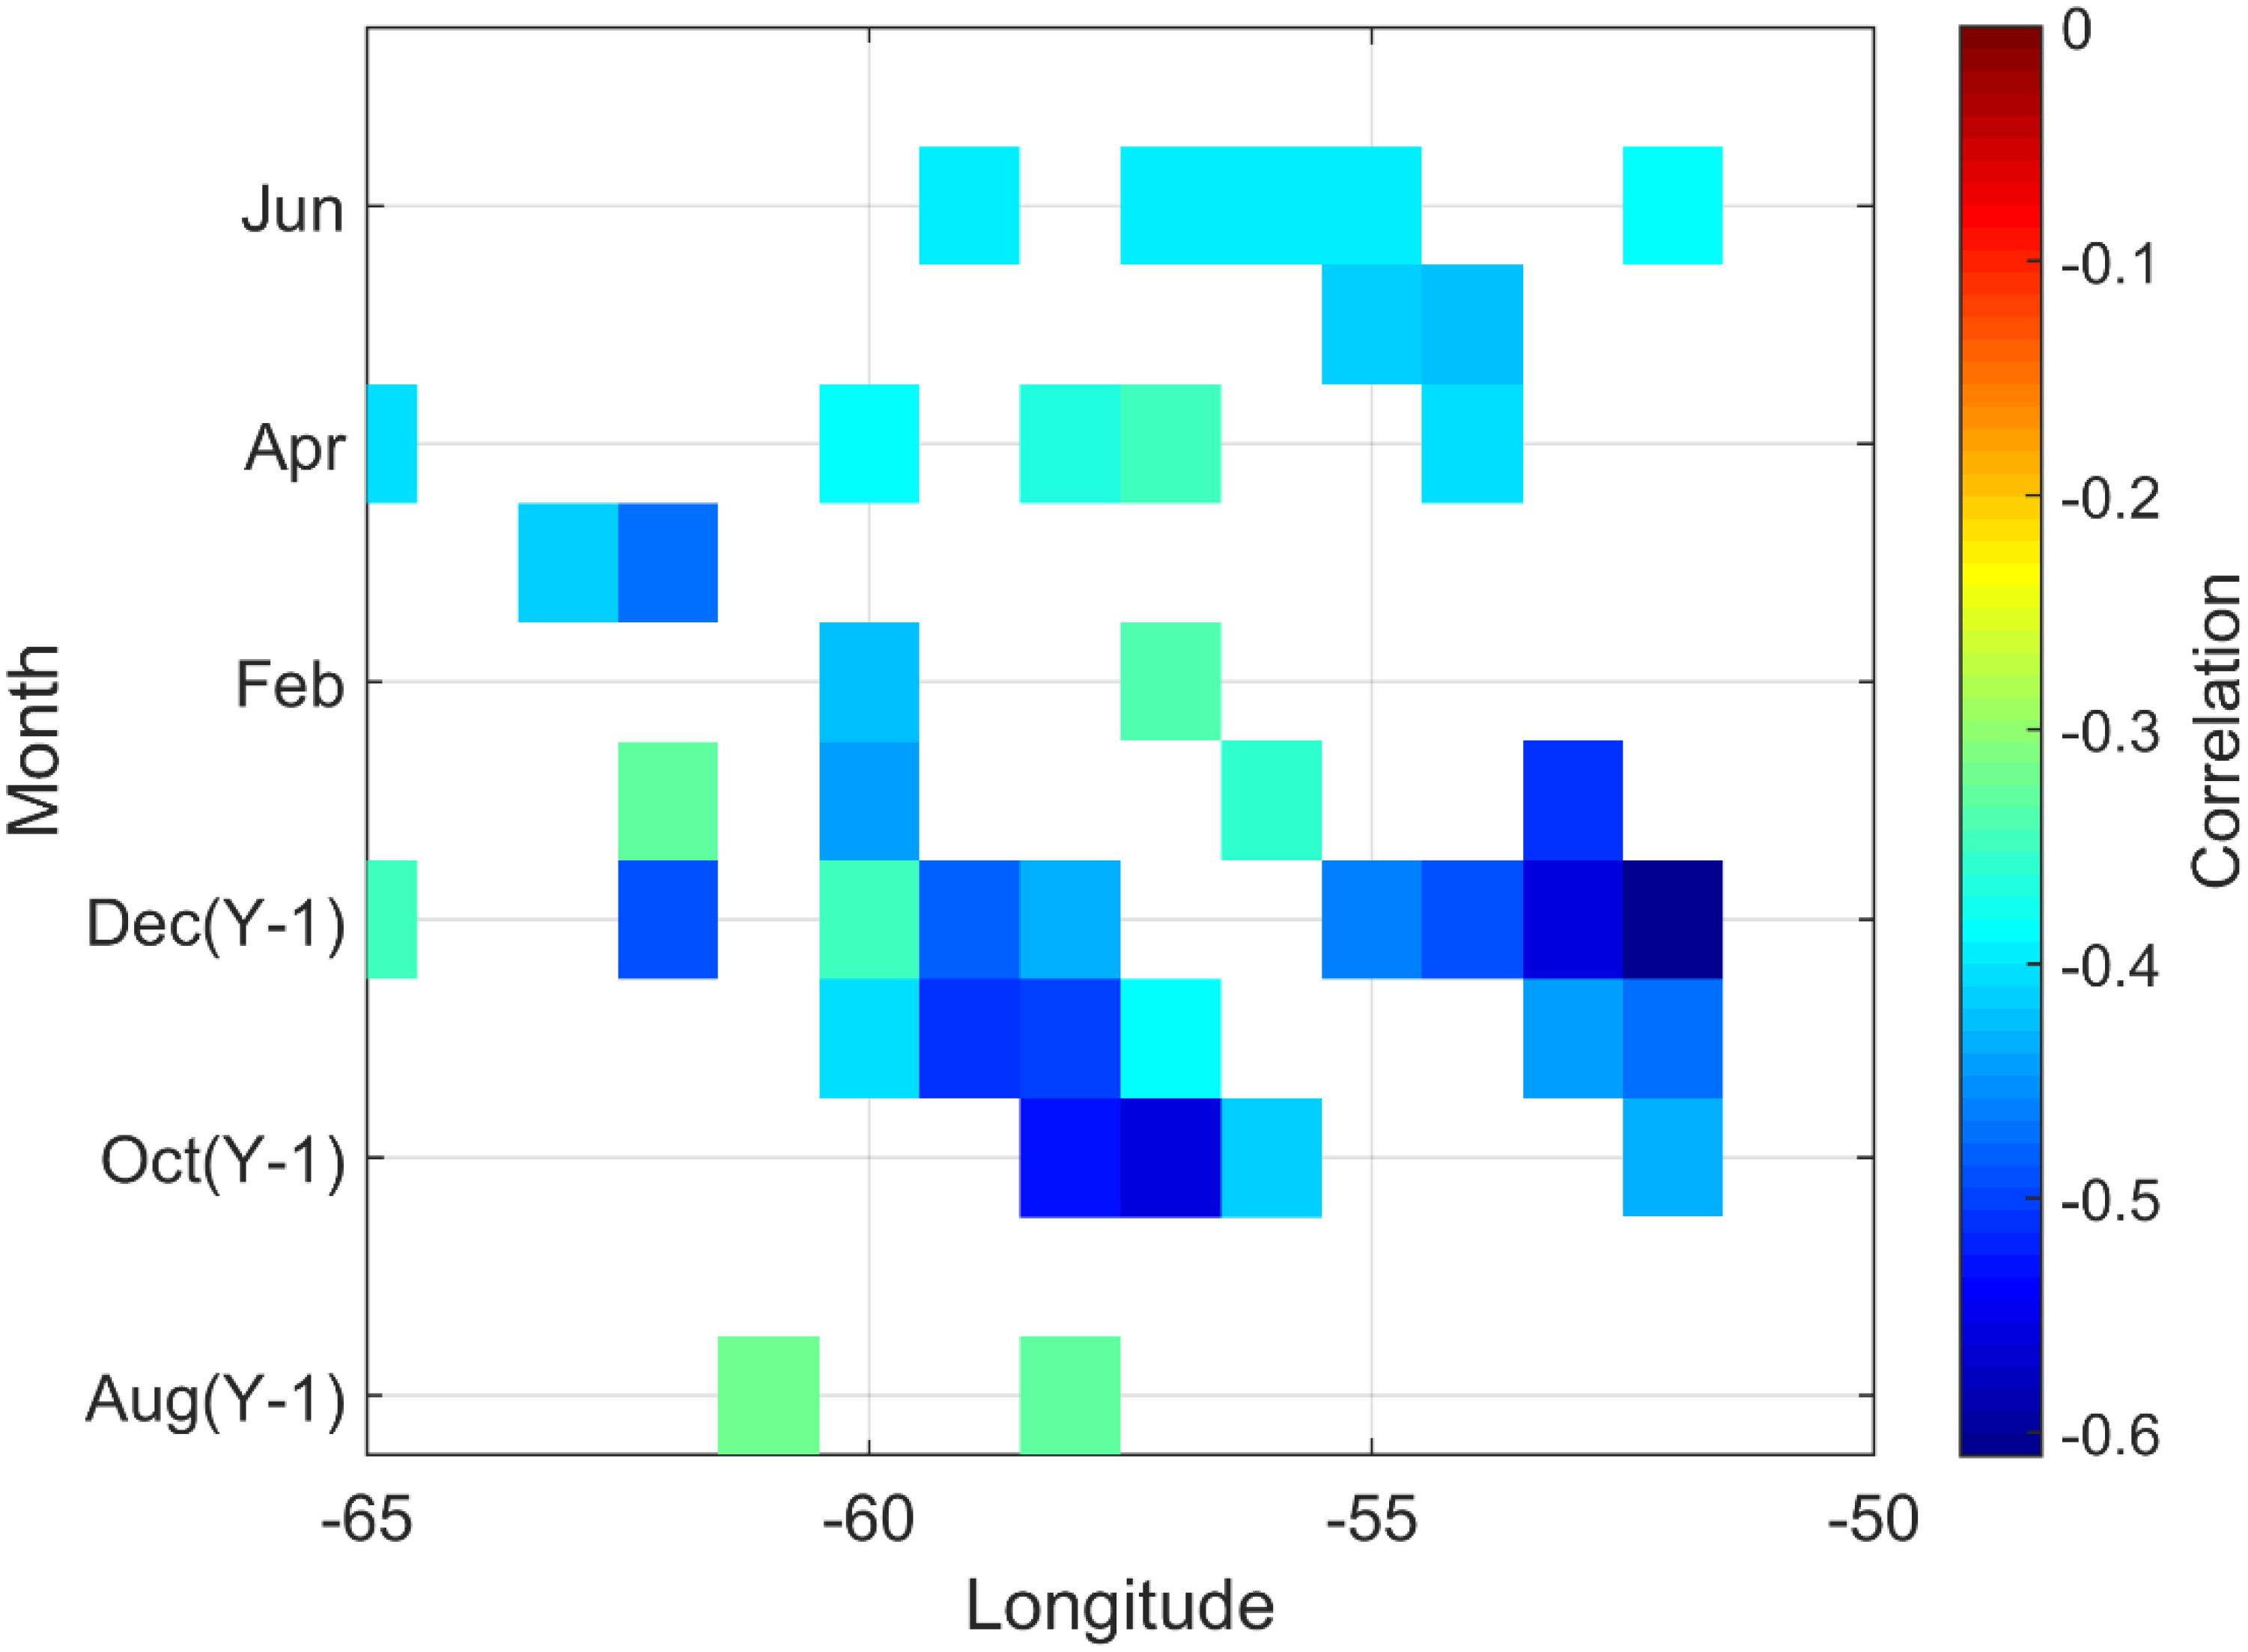
Figure 6. Significant correlations (p < 0.05) between A. islandica growth rate in SPM and SSF latitudinal position August (Y-1) and June (Y).
Correlation between detrended St Lawrence River runoff and SGI were not significant whatever the time lag (from 0 to 2 years).
Using sea ice cover monthly data over the Newfoundland shelf, a significant negative correlation with the master chronology was found from 1963 to 2015. The average correlation from January to June is (N = 53, r = -0.4, p < 10-3), with a maximum in February (N = 53, r = -0.46, p < 10-3) and minimum in June (N = 53, r = -0.34, p < 10-3).
Correlation With Spatial Datasets
The spatial correlations between A. islandica SGI chronology and monthly near surface (average between surface and 100 m) temperature, from the UK Met Office Hadley centre EN4.2.1, are represented in Figure 7 for mid-winter (February), mid-spring (May), mid-summer (August), and mid-fall (November). Given the spatial heterogeneities of the environmental observations in the first half of the 20th century, the correlations were calculated only for the last 66 years (1950–2015). The most striking features were the strong positive correlations with temperature, which cover a large area in the NE of Newfoundland and south of Greenland, encompassing the Labrador and Irminger seas (Figure 7). This area broadly delineates the SPG.
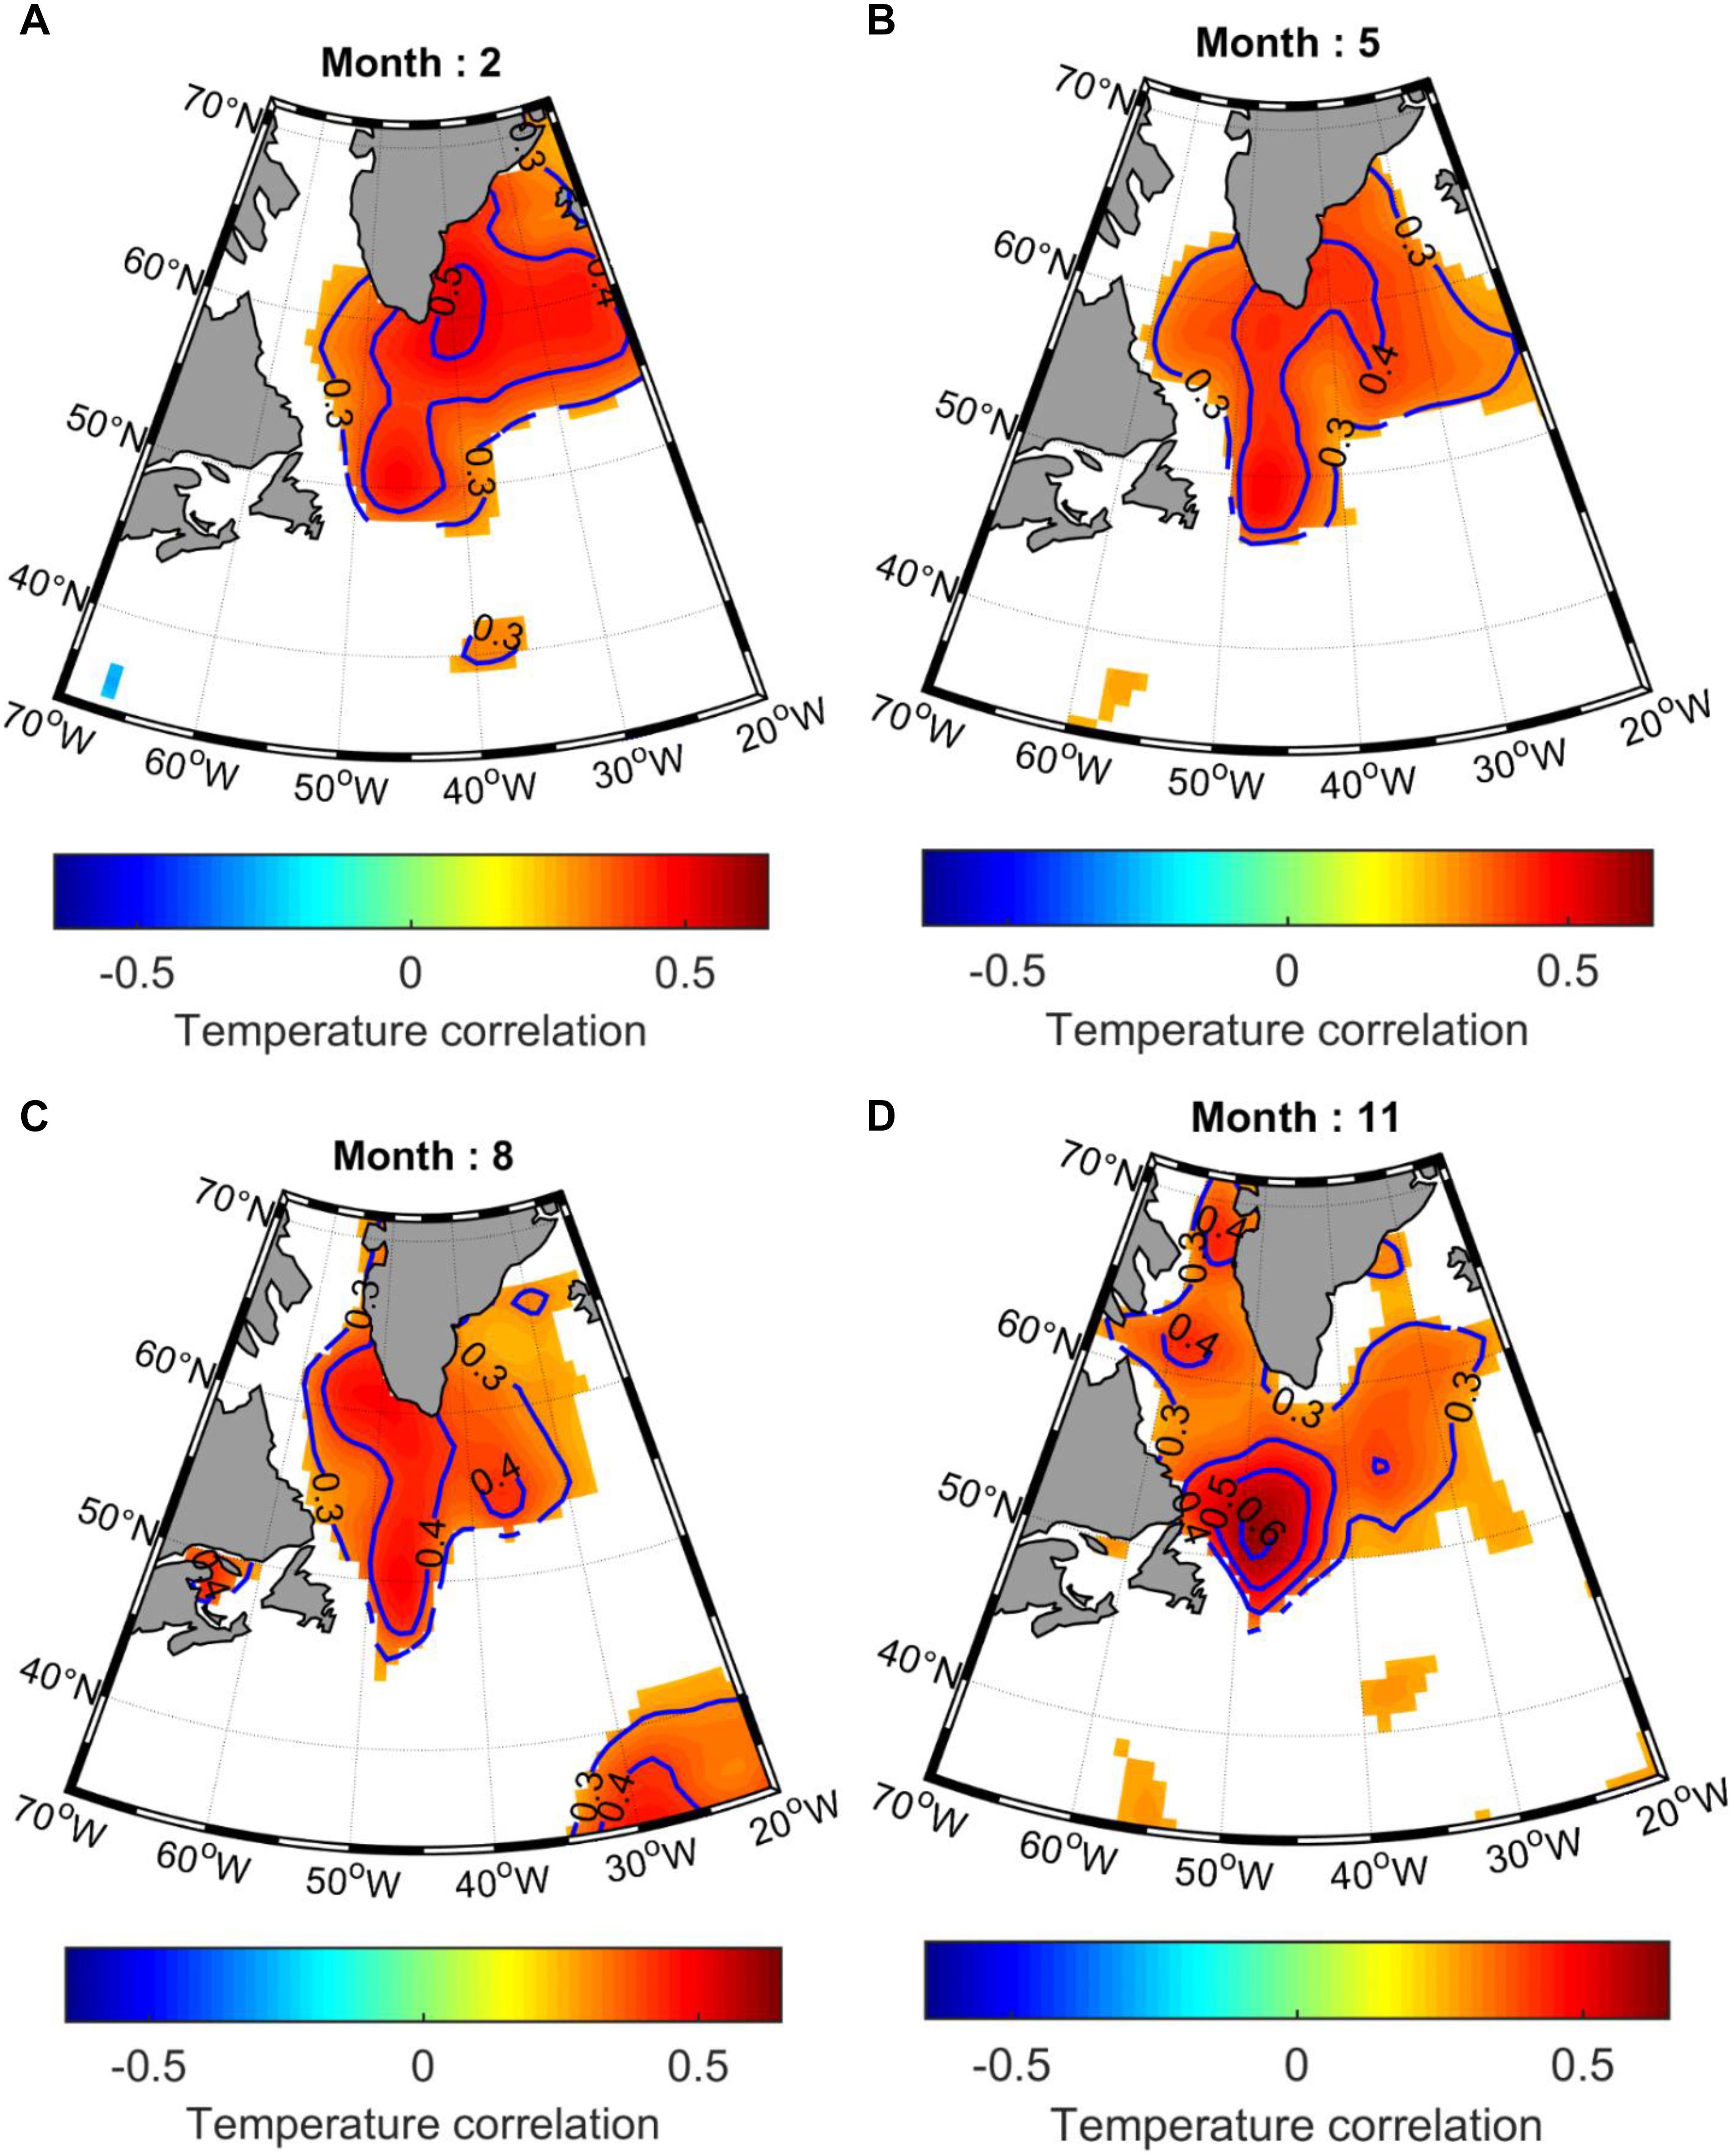
Figure 7. Spatial Pearson correlations between A. islandica SGI and detrended monthly near surface (0–100 m) temperature, from the UK Met Office Hadley centre EN4.2.1, represented for (A) mid-winter (February), (B) mid-spring (May), (C) midsummer (August), and (D) mid-fall (November). Only significant (p < 0.05) correlation coefficients are represented.
Correlation With Global Climatic Indices (AMO, NAO, SPG)
The correlation between SGI (10-year running mean) and AMO dataset from the UCAR series (1870–2011) was significant (N = 142, r = 0.34, p < 0.05). Even, if we do not find any correlations between our master chronology and the full CRU NAO time series, a weak negative correlation was found between our master chronology and the full DFO NAO series (N = 120, r = -0.16, p < 0.1), this correlation being slightly higher (N = 120, r = -0.23, p < 0.05) if we smooth the series over 3 years, as suggested by Petrie (2007) results which showed that the persistence of the same NAO phase for at least 2 years is likely to have a stronger influence on environmental conditions on the Newfoundland-Labrador shelf. Weak negative correlations were found between SGI master chronology and short NAO time series (1950–2015) from the NCEP (N = 66, r = -0.36, p < 0.05), United Kingdom (N = 66, r = -0.28, p < 0.05), and DFO (N = 66, r = -0.36, p < 0.05) datasets. A. islandica SGI chronology was negatively correlated (N = 24, r = -0.56, p < 0.05) with the annual SPG index from Berx and Payne (2017) over the period 1992–2015.
Discussion
The initial objective of this study was to assess the potential of A. islandica from SPM for paleo-environmental reconstructions. Sclerochronological analysis of our shells provided a statistically robust SGI master chronology and allowed us to test its potential as an environmental proxy for multiscale past climatic and hydrographic variabilities.
Chronology
Obtaining a synchronous growth signal within a population is key to evaluate if individuals are consistently responding to common external factors (e.g., Douglas, 1920; Mette et al., 2016). This study demonstrated that shell growth of contemporaneous individuals of A. islandica from SPM shallow waters (<15 m) was highly synchronous based on EPS, the criterion for signal strength. According to Wigley et al. (1984), EPS values > 0.85 indicate that the growth signal in a chronology sufficiently represents the whole population signal. In our study, EPS values were > 0.85 from 1889 to 2015. Moreover, series inter-correlation (0.537) and mean sensitivity (0.270) were fully comparable with those observed in other bivalve, fish, and tree species studies (e.g., Black et al., 2005; Helama et al., 2007). In addition, the potential application of this chronology for paleo-environmental research is enhanced because the specimens came from the coastal waters off southern Newfoundland, an excellent site for capturing changes in North Atlantic climate and oceanography (e.g., Pearce et al., 2013). SPM lies in the boundary zone between the North Atlantic subpolar and subtropical gyres, an important site of water mixing (e.g., Pearce et al., 2013; Sheldon et al., 2016) and one of the most rapidly warming areas on earth (Belkin, 2009; Saba et al., 2016). For these reasons, this region seems to be perfect for studying past environmental variations in the uppermost ca. 20 m of the ocean, which directly interacts with the atmosphere and controls weather and climate phenomena (Wanner et al., 2001). Despite the relevance of investigating the growth dynamics of a given species close to the limits of its ecological distribution, to our knowledge, this A. islandica growth chronology is the northernmost and shallowest of the western North Atlantic.
Correlations With Environmental Parameters
The strength of the common growth signal expressed by A. islandica from SPM indicated that our SGI chronology was expressing environmental variability. Several studies have shown that A. islandica growth is predominantly governed by temperature and food quantity and quality, in varying proportions depending on their geographical origin (Witbaard et al., 1997; Butler et al., 2009, Wanamaker et al., 2012; Marali and Schöne, 2015; Mette et al., 2016; Ballesta-Artero et al., 2017). They also reveal that local temperature variability explains less shell growth changes than food supply and quality do (see Schöne, 2013, for a review). However, temperature seems to regulate the cross-shelf distribution of A. islandica, with 6–16°C optimal, and temperatures above 16°C during summer months limit its distribution (Cargnelli et al., 1999). This species is a shallow infaunal filter feeder (Cargnelli et al., 1999) that mainly consumes phytoplankton and organics detritus (Morton, 2011).
The total absence of in situ marine environmental data near or around SPM led us to compare our A. islandica growth chronology with locally observed satellite data. Although we observed a statistically significant positive correlation between the growth of A. islandica in SPM and mean local chlorophyll a concentration from April to October over the period 1998–2015 we did not find any correlations between satellite measurements of SST at SPM and our master chronology. These local results seem to show that A. islandica growth in SPM is more sensitive to changes in primary productivity than to local SST variations, although we cannot exclude biases related to the proximity of the coast with respect to pixel size. However, the short time period covered by these satellite-based chlorophyll a time series led us to investigate other environmental variables spanning longer time periods at a broader geographical scale which are an indirect reflection of phytoplankton production in SPM surface water.
Therefore, our goal was to identify the environmental drivers that can explain the inter-annual to inter-decadal variations in A. islandica growth over the last 160 years in SPM by inferring potential links between different oceanographic parameters variability and local nutrient availability and primary production. Our approach uses environmental datasets sourced from observations as much as possible because climatic indices arising from coupled climate models are rarely successful in accurate reproduction of large spatial scale climatic indices (Pyrina et al., 2017). First, we have chosen to look at the influence of large-scale climatic and oceanographic indices on the dynamics of the northern part of the Labrador Sea, which controls the strength of the LC in the offshore and inner branches off Newfoundland (tracked by station 27 physical parameters, sea ice coverage, Tail of the Grand Banks transport and SSF position), and their subsequent potential influence on the local (SPM) nutrient availability and primary production.
We sought correlations of A. islandica growth in SPM with AMO and NAO indices which strongly influence marine ecosystem structure (e.g., Carroll et al., 2014). The NAO index varies at inter-decadal time scale (Hurrell, 1995) whereas the AMO has longer periods about 60–80 years (Schlesinger and Ramankutty, 1994; Moore et al., 2017). Both indices are closely linked through complex ocean-atmosphere interactions. At SPM, A. islandica growth was significantly and positively correlated with the AMO and negatively related with the NAO. These results indicate that part of the growth variability may be explained by low-frequency climate variations. The positive relationship between SGI and AMO seems to indicate that A. islandica enhanced growth in SPM correspond with AMO warm phases. Moreover, SGI and NAO showed a negative correlation which indicates that NAO negative phases correspond to enhanced shell growth in SPM. As shown by Petrie (2007), negative anomalies of NAO lead to warmer bottom temperature over the Newfoundland and eastern Scotian shelf; a finding consistent with several observational and modeling studies suggesting that the positive (negative) phases of the AMO, led to more frequent negative (positive) phases of the NAO (e.g., Hodson et al., 2014; Peings and Magnusdottir, 2014, 2016). In this region, the negative phase of the NAO is related to lower north-westerly winds, reduced heat losses by the ocean, and deep convection in the Labrador Sea and sea ice cover over the Newfoundland shelf (Wanner et al., 2001). This is again coherent with the strong negative correlation between sea ice cover and A. islandica growth in SPM, as well as the positive correlation observed between the winter temperature at Station 27 and our SGI master chronology.
This result seems to be confirmed by positive spatial correlations between A. islandica SGI from SPM and temperature within the SPG extent all year long (Figure 7) suggesting that enhanced growth rates of A. islandica in SPM correlates with a warmer SPG. This finding led us to further explore SPG dynamics and its influence on water properties around SPM. The significant negative correlation observed between SPG index and A. islandica growth rates in SPM seems to have the same implications as temperature spatial correlations and raises the question of SPG dynamics. The SPG western flank consists of the LC. The LC flows southward west of the SPG and its spatiotemporal structure along the Labrador coast and over the Grand Banks is complex. On the Newfoundland shelf, it has two branches: a main offshore branch flowing south and feeding the SPG and a much smaller inshore branch (about 10 times smaller flow rates) that flows over the Labrador shelf and spreads along the Newfoundland coast over the Grand Banks (e.g., Matthews, 1914; Smith et al., 1937; Petrie and Anderson, 1983; Lazier and Wright, 1993; Han et al., 2014; Wang et al., 2015). In terms of nutrients, the LC transports Arctic water particularly rich in nitrate, phosphate, and especially silicate to subarctic regions (Torres-Valdés et al., 2013; Hátún et al., 2017). In the subpolar North Atlantic, silicate is the main limiting nutrient for diatom growth (Allen et al., 2005), which seems to be an important food source for A. islandica. For example, Witbaard (1996) linked the period of A. islandica low growth rates with a period of low diatom abundance in Fladen Ground (Scotland). Based on this observation, we could expect a positive correlation between the SPG strength and A. islandica SGI in SPM. However, the opposite is highlighted here. This is explained by an important finding in Han et al. (2014) suggesting that the surface LC passing the Tail of the Grand Banks and reaching the southwestern Newfoundland (including SPM) and the Scotian Slope is out of phase with the LC strength over the Labrador and northeastern Newfoundland Slope.
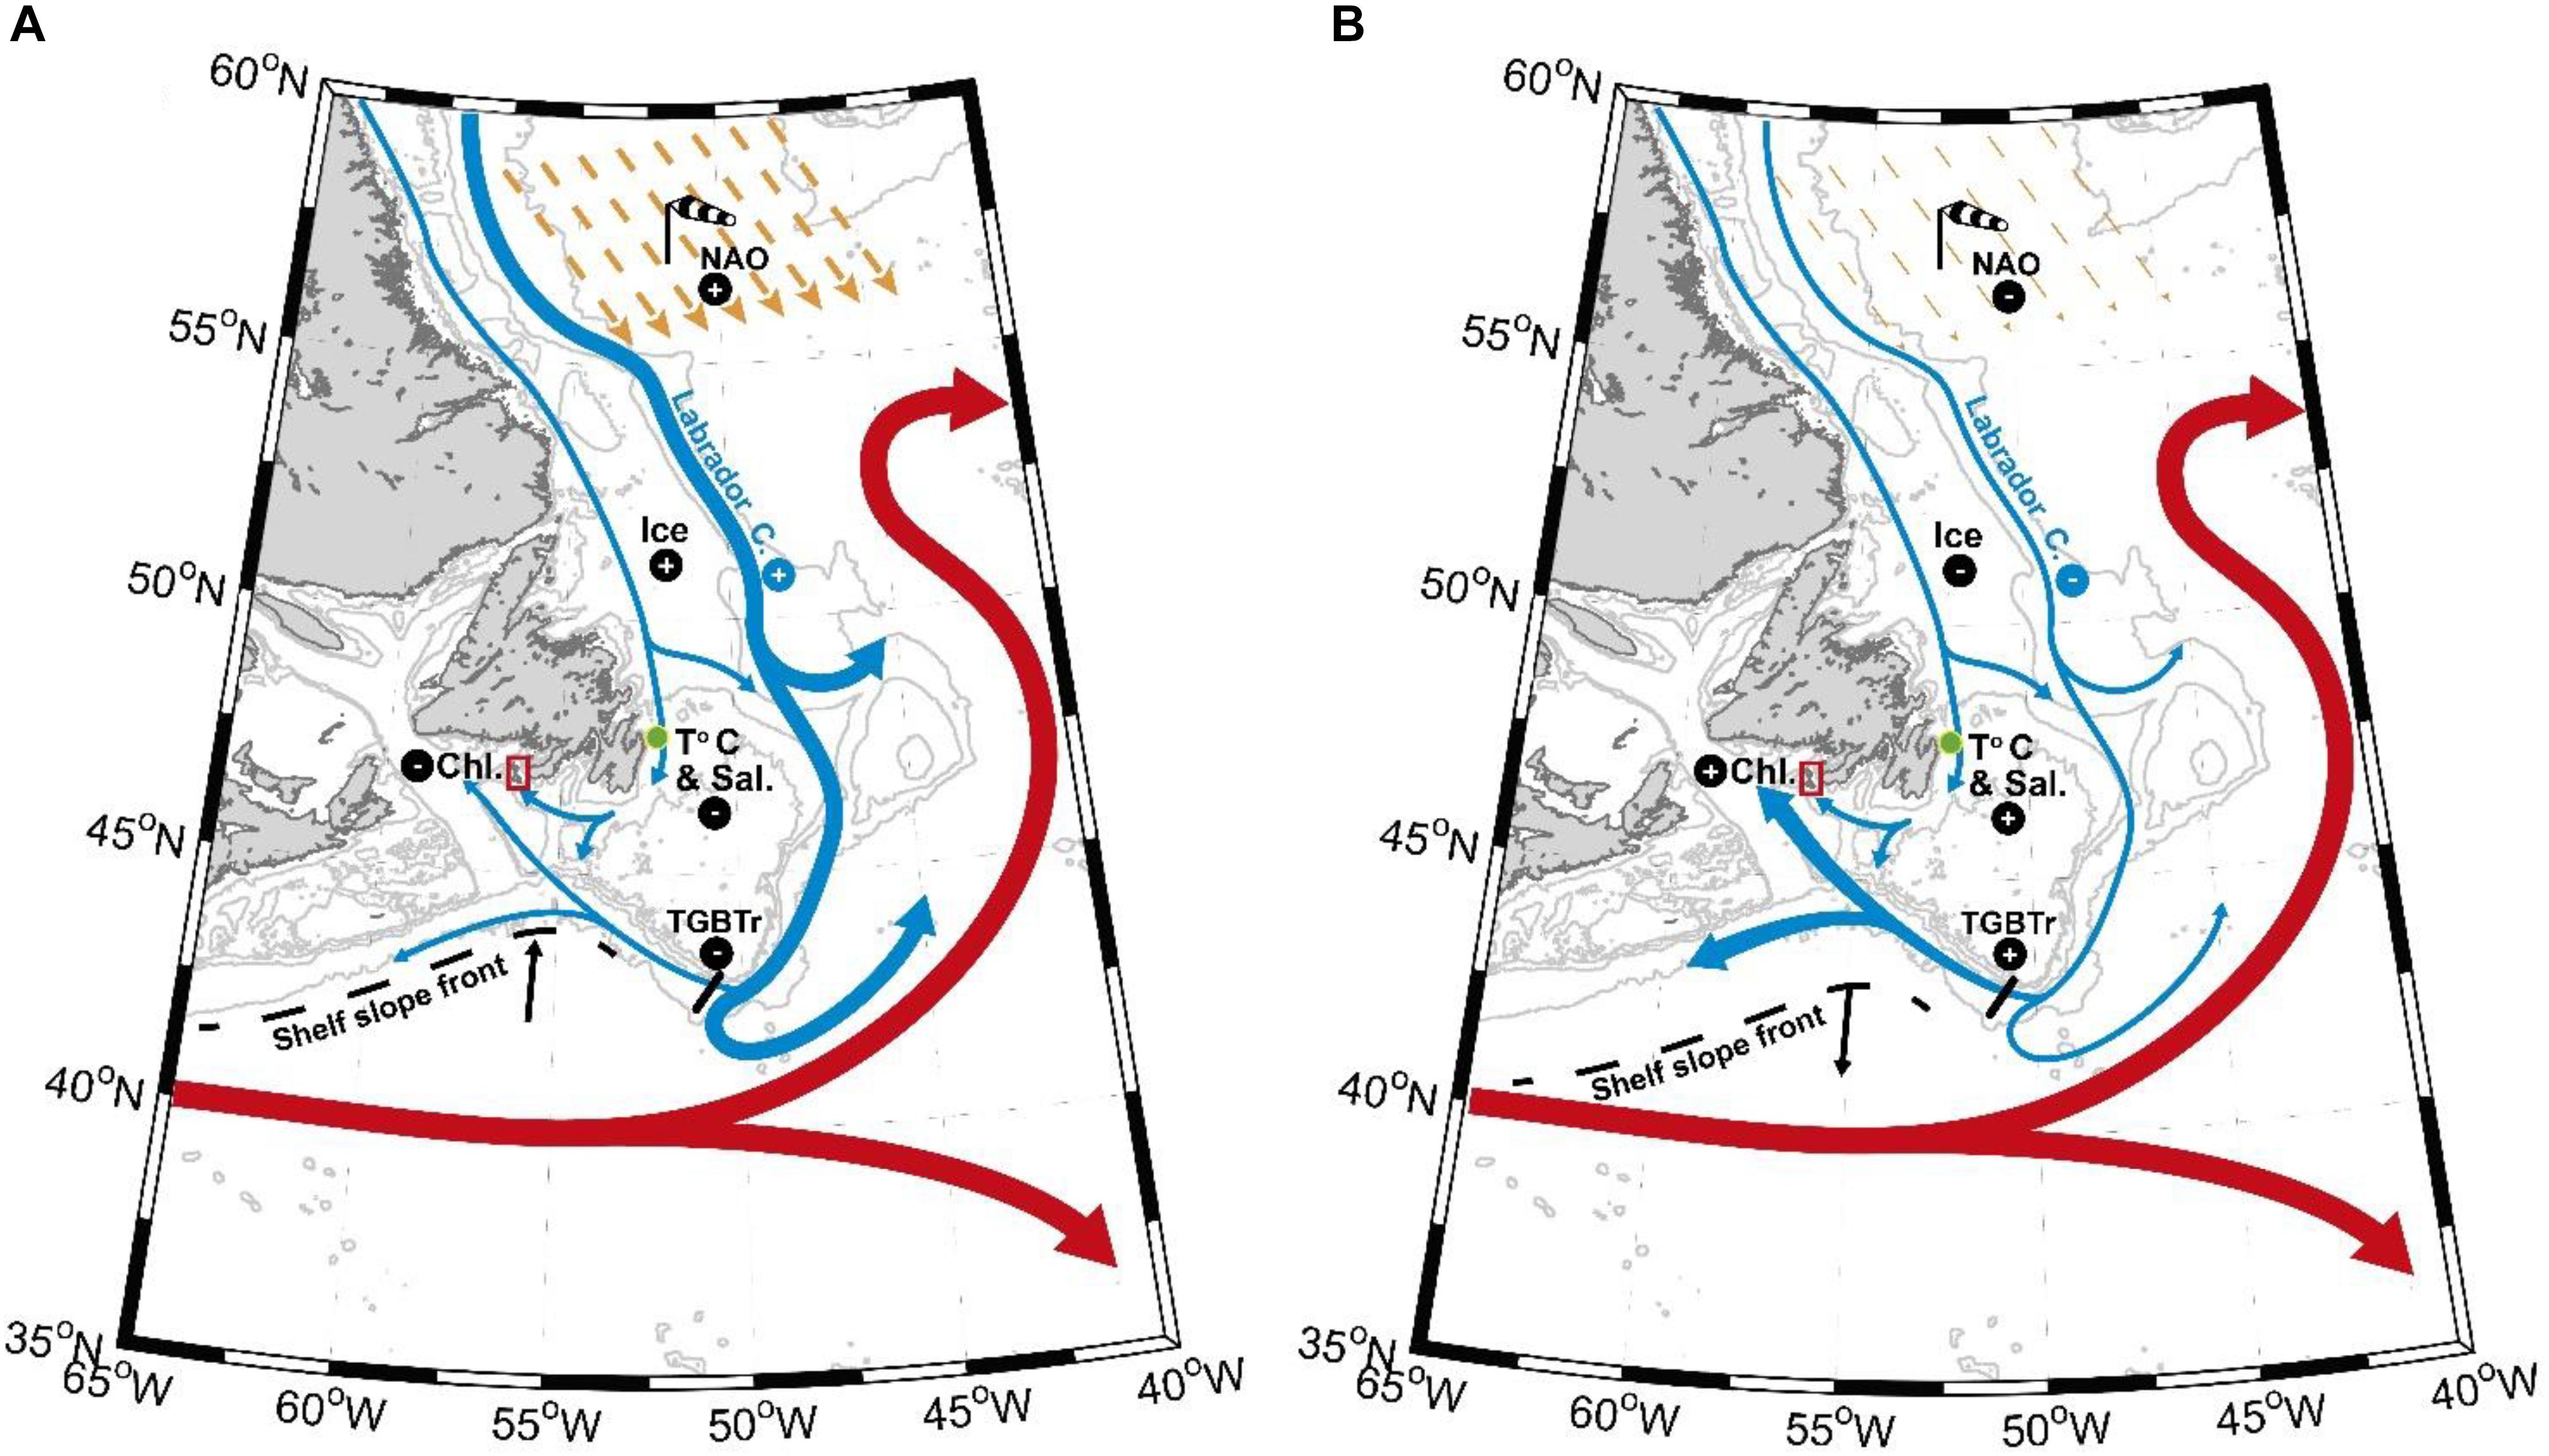
Figure 8. Maps illustrating the environmental scenarios associated with negative (A) and positive (B) growth anomalies of A. islandica at SPM. Yellow arrows in the Labrador Sea represent north westerly winds (black and white windsock) related to NAO positive (A) or negative (B) phases. The main acronyms corresponding to environmental datasets names are as follow: NAO – North Atlantic Oscillation; Ice – Sea ice cover over the Newfoundland shelf; T°C and Sal. – Station 27 temperature and salinity; TGBTr – Tail of the Grand Banks westward transport; Chl. – Mean local chlorophyll a concentration from April to October.
This possibility led us to investigate the Tail of the Grand Banks circulation (Figure 1) which was already known to affect the SPM region under certain conditions (Petrie and Drinkwater, 1993; Peterson et al., 2017). A part of the offshore branch of LC that follows the continental slope retroflexes to the east, joining the North Atlantic Current before reaching the Tail end of the Grand Banks (Fratantoni and McCartney, 2009). The remaining LC branch flows westward after the Tail of the Grand Banks at about 15 to 25 cm/s along the shelf break (Petrie and Anderson, 1983). It then turns northward, toward Cabot Strait and may spread around the SPM region. These observations are corroborated by Urrego-Blanco and Sheng (2014) in a modeling study showing that this northward flow affects the eastern side of the Laurentian channel. This transport at the Grand Banks tail was calculated for 1992 to 2013 and found to correlate positively with A. islandica SGI. This result seems to indicate that A. islandica growth in SPM increases with westward volume transport. This current bringing nutrient rich water from the LC (Torres-Valdés et al., 2013; Hátún et al., 2017) toward the SPM region and through the Laurentian Channel (Urrego-Blanco and Sheng, 2014). Offering further evidence of the role of this route is the latitudinal location of the SSF south of the Newfoundland shelf, around 43°N. In this region, the SSF lies between cold fresh shelf water and warm slope water at the south (Gatien, 1976). The monthly mean position of SSF (Figure 1) as a function of longitude south of SPM (between 55 and 60°W) is around 43°N (about 4° off the SPM region). At a northward speed over the western part of the Grand Banks and in the eastern Laurentian channel of 2 cm/s to 20 cm/s (Greenberg and Petrie, 1988; Urrego-Blanco and Sheng, 2014), the transit time between the front and SPM region will vary from 20 to 200 days. This pattern justifies assessing the correlation between growth rate and SSF position with negative lag of 0 to 1 year (SSF position leads). Correlations between A. islandica growth and SSF positions were always negative, meaning that a northward shift of warm slope water leads to decreased A. islandica shell growth in SPM. The positive correlation between shell growth and westward transport and negative correlation between shell growth and northward extension of the SSF could be explained by the recent study of Peterson et al. (2017). They showed that the “SSF is the surface expression of the southwestward extension of the Labrador Current.” This suggests that the more the LC flows west, the more A. islandica grows in SPM. Similar relationships between NAO, SSF position, and LC westward transport at the tail of the Grand Banks have also be found by Han et al. (2014). Indeed, this study showed that between 1992 and 2012, as the NAO weakens in general, the LC in the north becomes weaker in strength but extends equatorward, passing the tail of the Grand Banks. At the same time, the southward shift of the SSF allows the penetration of LC nutrient rich water south of the Newfoundland shelf (including SPM region) and into the Scotian Slope region.
The LC inner branch dynamics and its influence on A. islandica growth in SPM remains to be addressed. On the northern Newfoundland shelf, around 48°30–49°30N, a sizeable portion of this inner branch strongly bifurcates to the east joining the offshore, shelf break, branch (Wu et al., 2012; Wang et al., 2015). Southward, the inshore branch water transport along the Avalon Peninsula weakens and flows westward along the Newfoundland coast. Over the Grand Banks, between the two main branches, the flow is rather weak, generally flowing southeast-ward and is not fully understood (Petrie and Anderson, 1983; Han et al., 2008; Urrego-Blanco and Sheng, 2014; Brickman et al., 2016). The positive correlations between A. islandica SGI and winter temperature at different bathymetric levels in Station 27 seem to confirm that a warmer LC inshore branch during winter enhances A. islandica growth in SPM. This result seems consistent with our previous findings, as warmer winter conditions on the Newfoundland shelf are related to NAO negative phase (Wanner et al., 2001), stronger LC flowing equatorward passing the Tail of the Grand Banks (Han et al., 2014), southward shift of the SSF (Peterson et al., 2017) allowing penetration of LC nutrient rich water into SPM region. The lack of correlations between our chronology and Station 27 temperatures above 100 m depth from March to December (stratified period) is quite certainly related to local (Eastern Newfoundland) atmospheric phenomena which are probably not the same as at SPM. Whereas, below 100 m we should track mainly the LC inshore branch parameters. As assumed by Pepin et al. (2017), warmer winter conditions can increase the background biomass of phytoplankton, but the lack of data on primary production does not enable us from going further and linking A. islandica growth at SPM to nutrient concentrations and phytoplankton dynamics on the eastern Newfoundland shelf. The correlation time lag between Station 27 environmental parameters and A. islandica SGI in SPM could be explained by current speed. Indeed, the distance between Station 27 and SPM is about 400 km via ocean route; assuming a mean current speed of 10 cm/s, as shown by (Han et al., 2008; Wang et al., 2015), some part of this water could spread into the SPM region about 2 months later in March or April, at the time of the first spring bloom. Recent work on SPM hydrodynamics (Lazure et al., 2018) has shown very strong near-diurnal (25.82 h) current and bottom temperature oscillations, from mid-spring to fall that correspond to cyclic bottom water upwelling associated to a tidal coastal trapped wave. These oscillations could contribute to coastal waters nutrient enrichment by mixing rich bottom waters with surface waters in the photic zone. While the seasonality of the coastal branch differs from that of the offshore branch (Han et al., 2008; Wang et al., 2015), interannual variability of inshore branch transport remains poorly known and cannot be fully described with our data sets.
The lack of correlation between St Lawrence River runoff and A. islandica SGI reinforces our hypothesis that the source of A. islandica growth variability in SPM is mostly a function of hydrological conditions on the Newfoundland and Labrador shelves. The main reason explaining this lack of correlation is probably related to the fact that fresh water from St Lawrence River flows out along the western side of Cabot Strait and spreads over the Scotian shelf (e.g., Wu et al., 2012; Brickman et al., 2016; Richaud et al., 2016; Rutherford and Fennel, 2018), explaining the limited impact of this water mass on our study site.
This study demonstrates that understanding a local ecological response to environmental variability can provide insight into global, regional and local hydro-climatic forcing and interactions. In view of our results, it seems that A. islandica shell growth anomalies in SPM are mostly controlled by local primary production. However, the lack of past marine environmental records near or around SPM led us to investigate the influence of global and regional phenomena on A. islandica growth and indirectly on archipelago’s waters primary production. All these results previously discussed are summarized in Figure 8 as follow. Positive (negative) phases of NAO mostly occur during AMO negative (positive) periods leading to colder (warmer) conditions of the LC inshore branch (Station 27) and to increased (decreased) offshore LC transport along the northeast Newfoundland shelf break. This is clarified by the spatial pattern of correlation between A. islandica shell growth records and large scale SST variability encompassing the path of the SPG suggesting that a SPG expansion (contraction) is associated to decreased (increased) westward transport at the Grand Bank Tail, northward (southward) shifts of the SSF, and finally decreased (increased) primary production in SPM inducing negative (positive) local A. islandica shell growth anomalies. These results highlight the importance of environmental information contained in coastal A. islandica shells from SPM to address larger questions of the dynamics and history of North Atlantic marine hydroclimate variability. While it is not yet possible to ascribe a single easily identifiable driver of shell growth in this region, further physiological studies are needed to calibrate this paleo environmental proxy and refine our analysis. Additional geochemical analysis of A. islandica shells (e.g., Ba/Ca or Li/Ca as primary production proxies) could also be useful to disentangle the highly complex relationships existing between shell growth of A. islandica and multi-scale oceanographic parameters. These findings should be taken into account in subsequent studies involving dead collected shells, which may in the future be successfully cross dated with our absolutely dated master chronology. This could potentially extend our paleo environmental records of several centuries in SPM and provide us an indirect reflection of past North Atlantic basin and regional environmental conditions through their influence on local A. islandica growth.
Data Availability
The datasets generated for this study are available on request to the corresponding author.
Ethics Statement
All Arctica islandica were handled with respect to the animal welfare. Field sampling was carried out in accordance with the general governmental regulations. No endangered or protected species were involved.
Author Contributions
PP, PL, JT, and LC conceived the project, and designed and organized the field studies. PP, VS, and JD performed the sclerochronological laboratory and measurement work. PL, PP, and SD carried out the data analysis, interpreted the results, and wrote the manuscript with contributions from JT, LC, and PA.
Funding
This work was supported by the EC2CO program MATISSE of the CNRS INSU, the Cluster of Excellence LabexMER, and the LIA BeBEST CNRS INEE. This research was carried out as part of the Ph.D. thesis of PP at the University of Western Brittany with a French Ministry of Higher Education and Research grant.
Conflict of Interest Statement
The authors declare that the research was conducted in the absence of any commercial or financial relationships that could be construed as a potential conflict of interest.
Acknowledgments
We thank the LEMAR (UMR 6539) Secretariat team (Anne-Sophie Podeur, Geneviève Cohat, and Yves Larsonneur) for their invaluable assistance during the administrative preparation of the field trip associated with this publication. We also thank the DTAM divers’ crew (Yoann Busnot, Luc Thillais, and Jean-Marc Derouet) for their help during A. islandica sampling off Miquelon Island. We are sincerely grateful to the Club Nautique Saint-Pierrais for renting their boat and especially to its president, Stephane Salvat, for his incredible availability and kindness. In addition, we express our sincere gratitude to Herlé Goraguer, IFREMER delegate in SPM, for his help with local authorisations and logistics. We also thank Eric Dabas for his technical assistance during sclerochronological sample preparation and Sébastien Hervé for conceiving Figures 1, 8. We also thank Prof. J. M. Guarini for the age detrending model conception, and Dr. B. Petrie (DFO) and Dr. G. Han (DFO) for their very useful discussion on the regional oceanography. This manuscript greatly benefited from very useful comments made by the two reviewers.
Footnotes
- ^ http://hermes.acri.fr
- ^ http://www.meds-sdmm.dfo-mpo.gc.ca/isdm-gdsi/azmp-pmza/climat/ice-glace/coverage-couverture-eng.htm
References
Allen, J. T., Brown, L., Sanders, R., Moore, C. M., Mustard, A., Fielding, S., et al. (2005). Diatom carbon export enhanced by silicate upwelling in the northeast Atlantic. Nature 437, 728–732. doi: 10.1038/nature03948
Ballesta-Artero, I., Witbaard, R., Carroll, M. L., and Van der Meer, J. (2017). Environmental factors regulating gaping activity of the bivalve Arctica islandica in Northern Norway. Mar. Biol. 164:116. doi: 10.1007/s00227-017-3144-7
Belkin, I. M. (2009). Rapid warming of large marine ecosystems. Prog. Oceanogr. 81, 207–213. doi: 10.1016/j.pocean.2009.04.011
Berx, B., and Payne, M. R. (2017). The sub-polar gyre index - a community dataset for application in fisheries and environment research. Earth Syst. Sci. Data 9, 259–266. doi: 10.5194/essd-9-259-2017
Biondi, F., and Qeadan, F. (2008). Inequality in paleorecords. Ecology 89, 1056–1067. doi: 10.1890/07-0783.1
Black, B. A., Boehlert, G. W., and Yoklavich, M. M. (2005). Using tree-ring crossdating techniques to validate annual growth increments in long-lived fishes. Can. J. Fish. Aquat. Sci. 62, 2277–2284. doi: 10.1139/f05-142
Bohm, E., Lippold, J., Gutjahr, M., Frank, M., Blaser, P., Antz, B., et al. (2015). Strong and deep Atlantic meridional overturning circulation during the last glacial cycle. Nature 517, 73–76. doi: 10.1038/nature14059
Bonitz, F., Andersson, C., Trofimova, T., and Hátún, H. (2018). Links between phytoplankton dynamics and shell growth of Arctica islandica on the Faroe Shelf. J. Mar. Syst. 179, 72–87. doi: 10.1016/j.jmarsys.2017.11.005
Brickman, D., Wang, Z., and DeTracey, B. (2016). Variability of current streams in Atlantic Canadian waters: a model study. Atmos. Ocean 54, 218–229. doi: 10.1080/07055900.2015.1094026
Bunn, A. G. (2008). A dendrochronology program library in R (dplR). Dendrochronologia 26, 115–124. doi: 10.1016/j.dendro.2008.01.002
Butler, P. G., Richardson, C. A., Scourse, J. D., Wanamaker, A. D. Jr., , Shammon, T. M., and Bennel, J. D. (2009). Marine climate in the Irish Sea: analysis of a 489-year marine master chronology derived from growth increments in the shell of the clam Arctica islandica. Quat. Sci. Rev. 29, 1614–1632. doi: 10.1016/j.quascirev.2009.07.010
Butler, P. G., Wanamaker, A. D. Jr., Scourse, J. D., Richardson, C. A., and Reynolds, D. J. (2013). Variability of marine climate on the North Icelandic Shelf in a 1357-year proxy archive based on growth increments in the bivalve Arctica islandica. Palaeogeogr. Palaeoclimatol. Palaeoecol. 373, 141–151. doi: 10.1016/j.palaeo.2012.01.016
Cargnelli, L. M., Griesbach, S. J., Packer, D. B., and Weissberger, E. (1999). Ocean Quahog, Arctica Islandica, Life History and Habitat Characteristics. NOAA Technical Memorandum NMFS-NE-148. Woods Hole, MA: U.S. Department of Commerce, 1–12.
Carroll, M. L., Ambrose, W. G. Jr., Locke, W. L., Ryan, S. K., and Johnson, B. J. (2014). Bivalve growth rate and isotopic variability across the Barents Sea Polar Front. J. Mar. Syst. 130, 167–180. doi: 10.1016/j.jmarsys.2013.10.006
Chapman, D. C., and Beardsley, R. C. (1989). On the origin of shelf water in the middle Atlantic bight. J. Phys. Oceanogr. 19, 384–391. doi: 10.1175/1520-04851989019<0384:OTOOSW<2.0.CO;2
David, P., Delay, B., Berthou, P., and Jarne, P. (1995). Alternative models for allozyme-associated heterosis in the marine bivalve Spisula ovalis. Genetics 139, 1719–1726.
Delworth, T. L., Clark, P. U., Holland, M., Johns, W. E., Kuhlbrodt, T., Lynch-Stieglitz, J., et al. (2008). The Potential for Abrupt Change in the Atlantic Meridional Overturning Circulation. Abrupt Climate Change. Reston, VA: U.S. Geological Survey, 117–162.
Dunca, E., Mutvei, H., Göransson, P., Mörth, C. M., Schöne, B. R., Whitehouse, M. J., et al. (2009). Using ocean quahog (Arctica islandica) shells to reconstruct palaeoenvironment in Öresund, Kattegat and Skaggerak, Sweden. Int. J. Earth Sci. 98, 3–17. doi: 10.1007/s00531-008-0348-6
Fratantoni, P. S., and McCartney, M. S. (2009). Freshwater export from the labrador current to the North Atlantic current at the Tail of the Grand Banks of Newfoundland. Deep-Sea Res. 57, 258–283. doi: 10.1016/j.dsr.2009.11.006
Gatien, M. G. (1976). Study in slope water region south of Halifax. J Fish. Res. Board Can. 33, 2213–2217. doi: 10.1139/f76-270
Good, S. A., Martin, M. J., and Rayner, N. A. (2013). EN4: quality controlled ocean temperature and salinity profiles and monthly objective analyses with uncertainty estimates. J. Geophys. Res. Oceans 118, 6704–6716. doi: 10.1002/2013jc009067
Greenberg, D. A., and Petrie, B. D. (1988). The mean barotropic circulation on the Newfoundland shelf and slope. J. Geophys. Res. Oceans 93, 15541–15550.
Grissino-Mayer, H. D. (2001). Evaluating crossdating accuracy: a manual and tutorial for the computer program COFECHA. Tree-Ring Res. 57, 205–221.
Häkkinen, S., and Rhines, P. B. (2004). Decline of subpolar North Atlantic circulation during the 1990s. Science 304, 555–559. doi: 10.1126/science.1094917
Häkkinen, S., and Rhines, P. B. (2009). Shifting surface currents in the northern North Atlantic Ocean. J. Geophys. Res. Oceans 114:C04005. doi: 10.1029/2008JC004883
Halfar, J., Hetzinger, S., Adey, W., Zack, T., Gamboa, G., Kunz, B., et al. (2011). Coralline algal growth-increment widths archive North Atlantic climate variability. Palaeogeogr. Palaeoclimatol. Palaeoecol. 302, 71–80. doi: 10.1016/j.palaeo.2010.04.009
Han, G., Chen, N., and Ma, Z. (2014). Is there a north-south phase shift in the surface labrador current transport on the interannual-to-decadal scale? J. Geophys. Res. Oceans 119, 276–287. doi: 10.1002/2013JC009102
Han, G., and Li, J. (2008). Sea level and geostrophic current features from tandem TOPEX/Poseidon-Jason data in the newfoundland offshore. Int. J. Remote Sens. 29, 265–280. doi: 10.1080/01431160701271982
Han, G., Lu, Z., Wang, Z., Helbig, J., Chen, N., and de Young, B. (2008). Seasonal variability of the labrador current and shelf circulation off newfoundland. J. Geophys. Res. 113:C10013. doi: 10.1029/2007JC004376
Hátún, H., Azetsu-Scott, K., Somavilla, R., Rey, F., Johnson, C., Mathis, M., et al. (2017). The subpolar gyre regulates silicate concentrations in the North Atlantic. Sci. Rep. 7:14576. doi: 10.1038/s41598-017-14837-4
Helama, S., Schöne, B. R., Kirchhefer, A. J., Nielsen, K., Rodland, D. L., and Janssen, R. (2007). Compound response of marine and terrestrial ecosystems to varying climate: pre-anthropogenic perspective from bivalve shell growth increments and tree-rings. Mar. Environ. Res. 63, 185–199. doi: 10.1016/jmarenvres.2006.08.003
Hodson, D. L. R., Robson, J. I., and Sutton, R. T. (2014). An anatomy of the cooling of the North Atlantic Ocean in the 1960s and 1970s. J. Clim. 27, 8229–8243. doi: 10.1175/JCLI-D-14-00301.1
Hurrell, J. W. (1995). Decadal trends in the North-Atlantic Oscillation - regional temperatures and precipitation. Science 269, 676–679. doi: 10.1126/science.269.5224.676
Jones, D. S. (1980). Annual cycle of shell growth increment formation in two continental shelf bivalves and its paleoecologic significance. Paleobiology 6, 331–340. doi: 10.1017/S0094837300006837
Kerr, R. A. (2005). Atlantic climate pacemaker for millennia past, decades hence? Science 309, 41–43. doi: 10.1126/science.309.5731.41
Lazier, J. R. N., and Wright, D. G. (1993). Annual velocity variations in the labrador current. J. Phys. Oceanogr. 23, 659–678. doi: 10.1175/1520-0485(1993)023<0659:avvitl>2.0.co;2
Lazure, P., Le Cann, B., and Bezaud, M. (2018). Large diurnal bottom temperature oscillations around the Saint Pierre and Miquelon archipelago. Sci. Rep. 8:13882. doi: 10.1038/s41598-018-31857-w
Levitus, S., Antonov, J. I., Boyer, T. P., Locarnini, R. A., Garcia, H. E., and Mishonov, A. V. (2009). Global ocean heat content 1955-2008 in light of recently revealed instrumentation problems. Geophys. Res. Lett. 36:L07608. doi: 10.1029/2008GL037155
Linnaeus, C. (1767). Systema Naturae Sive Regna Tria Naturae, Secundum Classes, Ordines, Genera, Species, Cum Characteribus, Differentiis, Synonymis, Locis, Tomus 1, 212th Edn. Holmiae: Laurentii Salvii, 533–1327.
Liu, W., Xie, S.-P., Liu, Z., and Zhu, J. (2017). Overlooked possibility of a collapsed Atlantic meridional overturning circulation in warming climate. Sci. Adv. 3:e1601666. doi: 10.1126/sciadv.1601666
Lozier, M. S., Li, F., Bacon, S., Bahr, F., Bower, A. S., Cunningham, S. A., et al. (2019). A sea change in our view of overturning in the subpolar North Atlantic. Science 363, 516–521. doi: 10.1126/science.aau6592
Marali, S., and Schöne, B. R. (2015). Oceanographic control on shell growth of Arctica islandica (Bivalvia) in surface waters of Northeast Iceland implications for paleoclimate reconstructions. Palaeogeogr. Palaeoclimatol. Palaeoecol. 420, 138–149. doi: 10.1016/j.palaeo.2014.12.016
Marchitto, T. M. Jr., Jones, G. A., Goodfriend, G. A., and Weidman, C. R. (2000). Precise temporal correlation of Holocene mollusk shells using sclerochronology. Quat. Res. 53, 236–246. doi: 10.1006/qres.1999.2107
Matthews, D. J. (1914). Hydrographical observations in the labrador current in 1913. J. Mar. Biol. Assoc. U.K. 10, 515–517. doi: 10.1017/s0025315400008298
Mette, M. J., Wanamaker, A. D. Jr., Carroll, M. L., Ambrose, W. G. Jr., and Retelle, M. J. (2016). Linking large-scale climate variability with Arctica islandica shell growth and geochemistry in northern Norway. Limnol. Oceanogr. 61, 748–764. doi: 10.1002/lno.10252
Moore, G. W. K., Halfar, J., Majeed, H., Adey, W., and Kronz, A. (2017). Amplification of the Atlantic multidecadal oscillation associated with the onset of the industrial-era warming. Sci. Rep. 7:40861. doi: 10.1038/srep40861
Morton, B. (2011). The biology and functional morphology of Arctica islandica (Bivalvia: Arcticidae): a gerontophilic living fossil. Mar. Biol. Res. 7, 540–553. doi: 10.1080/17451000.2010.535833
Nicol, D. (1951). Recent species of the veneroid pelecypod Arctica. J. Washington Acad. Sci. 41, 102–106.
Pearce, C., Seidenkrantz, M., Kuijpers, A., Massé, G., Reynisson, N. F., and Kristiansen, S. M. (2013). Ocean lead at the termination of the Younger Dryas cold spell. Nat. Commun. 4:1664. doi: 10.1038/ncomms2686
Peings, Y., and Magnusdottir, G. (2014). Forcing of the wintertime atmospheric circulation by the multidecadal fluctuations of the North Atlantic Ocean. Environ. Res. Lett. 9:061001. doi: 10.1088/1748-9326/9/3/034018
Peings, Y., and Magnusdottir, G. (2016). Wintertime atmospheric response to Atlantic multidecadal variability: effect of stratospheric representation and ocean-atmosphere coupling. Clim. Dyn. 47, 1029–1047. doi: 10.1007/s00382-015-2887-4
Pepin, P., Maillet, G., Fraser, S., Doyle, G., Robar, A., Shears, T., et al. (2017). Optical, Chemical, and Biological Oceanographic Conditions on the Newfoundland and Labrador Shelf During 2014-2015. Ottawa: Fisheries and Oceans Canada, Canadian Science Advisory Secretariat.
Peterson, I., Greenan, B., Gilbert, D., and Hebert, D. (2017). Variability and wind forcing of ocean temperature and thermal fronts in the slope water region of the Northwest Atlantic. J. Geophys. Res. Oceans 122, 7325–7343. doi: 10.1002/2017JC012788
Petrie, B. (2007). Does the North Atlantic oscillation affect hydrographic properties on the Canadian Atlantic continental shelf? Atmos. Ocean 45, 141–151. doi: 10.3137/ao.450302
Petrie, B., and Anderson, C. (1983). Circulation on the newfoundland continental shelf. Atmos. Ocean 21, 207–226. doi: 10.1080/07055900.1983.9649165
Petrie, B., and Drinkwater, K. (1993). Temperature and salinity variability on the Scotian Shelf and in the Gulf of Maine 1945-1990. J. Geophys. Res. Oceans 98, 20079–20089. doi: 10.1029/93JC02191
Pyrina, M., Wagner, S., and Zorita, E. (2017). Evaluation of CMIP5 models over the northern North Atlantic in the context of forthcoming paleoclimatic reconstructions. Clim. Dyn. 49, 3673–3691. doi: 10.1007/s00382-017-3536-x
Rahmstorf, S., Box, J. E., Feulner, G., Mann, M. E., Robinson, A., Rutherford, S., et al. (2015). Exceptional twentieth-century slowdown in Atlantic Ocean overturning circulation. Nat. Clim. Change 5, 475–480. doi: 10.1038/nclimate2554
Rhein, M., Kieke, D., Hüttl-Kabus, S., Roessler, A., Mertens, C., Meissner, R., et al. (2011). Deep water formation, the subpolar gyre, and the meridional overturning circulation in the subpolar North Atlantic. Deep Sea Res. 58, 1819–1832. doi: 10.1016/j.dsr2.2010.10.061
Rhoads, D. C., and Lutz, R. A. (1980). Skeletal Growth of Aquatic Organisms. New York, NY: Plenum Publication Corporation, 750.
Richaud, B., Kwon, Y.-O., Joyce, T. M., Fratantoni, P. S., and Lentz, S. J. (2016). Surface and bottom temperature and salinity climatology along the continental shelf off the Canadian and US East Coasts. Cont. Shelf Res. 124, 165–181. doi: 10.1016/j.csr.2016.06.005
Rutherford, K., and Fennel, K. (2018). Diagnosing transit times on the northwestern North Atlantic continental shelf. Ocean Sci. 14, 1207–1221. doi: 10.5194/os-14-1207-2018
Saba, V. S., Griffies, S. M., Anderson, W. G., Winton, M., Alexander, M. A., Delworth, T. L., et al. (2016). Enhanced warming of the Northwest Atlantic Ocean under climate change. J. Geophys. Res. Oceans 121, 118–132. doi: 10.1002/2015JC011346
Schlesinger, M., and Ramankutty, N. (1994). An oscillation in the global climate system of period 65-70 years. Nature 367, 723–726. doi: 10.1038/367723a0
Schöne, B. R. (2013). Arctica islandica (Bivalvia): a unique paleoenvironmental archive of the northern North Atlantic Ocean. Glob. Planet. Change 111, 199–225. doi: 10.1016/j.gloplacha.2013.09.013
Schöne, B. R., Fiebig, J., Pfeiffer, M., Gleβ, R., Hickson, J., Johnson, A. L. A., et al. (2005b). Climate records from a bivalved Methuselah (Arctica islandica, Mollusca; Iceland). Palaeogeogr. Palaeoclimatol. Palaeoecol 228, 130–148. doi: 10.1016/j.palaeo.2005.03.049
Schöne, B. R., Dunca, E., Fiebig, J., and Pfeiffer, M. (2005a). Mutvei’s solution: an ideal agent for resolving microgrowth structures of biogenic carbonates. Palaeogeogr. Palaeoclimatol. Palaeoecol 228, 149–166. doi: 10.1016/j.palaeo.2005.03.054
Scilab Enterprises, (2012). Scilab: Free and Open Source Software for Numerical Computation (OS, Version 6.0.0) [Software]. Available at: http://www.scilab.org (accessed January 31, 2018).
Sheldon, C. M., Seidenkrantz, M. S., Pearce, C., Kuijpers, A., Hansen, M. J., Christensen, E. Z., et al. (2016). Holocene oceanographic changes in SW Labrador Sea, off Newfoundland. Holocene 26, 274–289. doi: 10.1177/0959683615608690
Smith, E. H., Soule, F. M., and Mosby, O. (1937). The marion and general green expeditions to Davis Strait and Labrador Sea. Bull. U.S. Coast. Guard. 19:259.
Srokosz, M. A., and Bryden, H. L. (2015). Observing the Atlantic Meridional overturning circulation yields a decade of inevitable surprises. Science 348:1255575. doi: 10.1126/science.1255575
Thibodeau, B., Not, C., Zhu, J., Schmittner, A., Noone, D., Tabor, C., et al. (2018). Last century warming over the Canadian Atlantic shelves linked to weak Atlantic meridional overturning circulation. Geophys. Res. Lett. 45, 376–385. doi: 10.1029/2018GL080083
Torres-Valdés, S., Tsubouchi, T., Bacon, S., Naveira-Garabato, A. C., Sanders, R., McLaughlin, F. A., et al. (2013). Export of nutrients from the Arctic Ocean. J. Geophys. Res. Oceans 118, 1625–1644. doi: 10.1002/jgrc.20063
Urrego-Blanco, J., and Sheng, J. (2014). Study on subtidal circulation and variability in the Gulf of St. Lawrence, Scotian Shelf, and Gulf of Maine using a nested-grid shelf circulation model. Ocean Dyn. 64, 385–412. doi: 10.1007/s10236-013-0688-z
Wanamaker, A. D. Jr., Butler, P. G., Scourse, J. D., Heinemeier, J., Eiríksson, J., Knudsen, K. L., et al. (2012). Surface changes in the North Atlantic meridional overturning circulation during the last millennium. Nat. Commun. 3:899. doi: 10.1038/ncomms1901
Wanamaker, A. D. Jr., Griffin, S. M., Ummenhofer, C. C., Whitney, N. M., Black, B., Parfitt, R., et al. (2018). Pacific climate influences on ocean conditions and extreme shell growth events in the northwestern Altantic (Gulf of Maine). Clim. Dyn. 382:4513. doi: 10.1007/s00382-018-4513-8
Wanamaker, A. D., Kreutz, K. J., Schöne, B. R., Maasch, K. A., Pershing, A. J., Borns, H. W., et al. (2009). A late Holocene paleo-productivity record in the western Gulf of Maine, USA, inferred from growth histories of the long-lived ocean quahog (Arctica islandica). Int. J. Earth Sci. 98, 19–29. doi: 10.1007/s00531-008-0318-z
Wang, Z., Yashayaev, I., and Greenan, B. (2015). Seasonality of the inshore Labrador Current over the Newfoundland shelf. Cont. Shelf Res. 100, 1–10. doi: 10.1016/j.csr.2015.03.010
Wanner, H., Brönnimann, S., Casty, C., Gyalistras, D., Luterbacher, J., Schmutz, C., et al. (2001). North atlantic oscillation – concepts and studies. Surv. Geophys. 22, 321–382. doi: 10.1023/A:1014217317898
Weidman, C. R., Jones, G. A., and Kyger. (1994). The long-lived mollusk Arctica islandica: a new paleoceanographic tool for the reconstruction of bottom temperatures for the continental shelves of the northern North Atlantic Ocean. J. Geophys. Res. 99, 18305–18314. doi: 10.1029/94jc01882
Wigley, T. M. L., Briffa, K. R., and Jones, P. D. (1984). On the average value of correlated time series, with applications in dendroclimatology and hydrometeorology. J. Appl. Meteorol. Clim. 23, 201–213. doi: 10.1175/1520-04501984023<0201:OTAVOC<2.0.CO;2
Witbaard, R. (1996). Growth variations in Arctica islandica L. (Mollusca): a reflection of hydrography-related food supply. ICES J. Mar. Sci. 53, 981–987. doi: 10.1006/jmsc.1996.0122
Witbaard, R., Duineveld, G. C. A., and DeWilde, P. A. W. J. (1997). A long-term growth record derived from Arctica islandica (Mollusca, Bivalvia) from the fladen ground (northern North Sea). J. Mar. Biol. Assoc. U.K. 77, 801–816. doi: 10.1017/S0025315400036201
Wolfe, C. L. P., Hameed, S., and Chi, L. (2019). On the drivers of decadal variability of the Gulf Stream North Wall. J. Clim. 32, 1235–1249. doi: 10.1175/JCLI-D-18-0212.1
Keywords: Arctica islandica, paleoecology, North Atlantic, sub polar gyre, labrador current, bivalve, sclerochronology, climate change
Citation: Poitevin P, Thébault J, Siebert V, Donnet S, Archambault P, Doré J, Chauvaud L and Lazure P (2019) Growth Response of Arctica Islandica to North Atlantic Oceanographic Conditions Since 1850. Front. Mar. Sci. 6:483. doi: 10.3389/fmars.2019.00483
Received: 12 February 2019; Accepted: 18 July 2019;
Published: 06 August 2019.
Edited by:
Paul E. Renaud, Akvaplan-niva, NorwayReviewed by:
Nina Whitney, Iowa State University, United StatesWilliam Gerald Ambrose Jr., Coastal Carolina University, United States
Copyright © 2019 Poitevin, Thébault, Siebert, Donnet, Archambault, Doré, Chauvaud and Lazure. This is an open-access article distributed under the terms of the Creative Commons Attribution License (CC BY). The use, distribution or reproduction in other forums is permitted, provided the original author(s) and the copyright owner(s) are credited and that the original publication in this journal is cited, in accordance with accepted academic practice. No use, distribution or reproduction is permitted which does not comply with these terms.
*Correspondence: Pierre Poitevin, poitevin.pierre@gmail.com