 Arani Chandrapavan
 Nick Caputi
 Mervi I. Kangas
- Western Australian Fisheries & Marine Research Laboratories, Department of Primary Industries and Regional Development, North Beach, WA, Australia
Driven by a very strong La Niña event and a record strength Leeuwin Current, the 2011 Western Australian marine heatwave (MHW) raised sea surface temperatures (SSTs) along the Western Australian coastline by up to 5°C between November 2010 and March 2011. This single thermal perturbation led to several mortality events and recruitment impairment of commercially important species including Australia's single highest producing blue swimmer crab (Portunus armatus) fishery in Shark Bay. Monthly catch landings dramatically declined from 166 t in April 2011 to <10 t by December 2011 promoting a fishery closure in 2012 to allow for stock recovery. Examination of stock-environment relationships critical to the recruitment of blue swimmer crabs living toward their thermal maxima, showed juvenile P. armatus to be most susceptible to heat stress when mean water temperatures between December and January were >24°C, and detrimental when they exceed 26°C as was the case during the 2011 MHW when SSTs reached 29°C inside Shark Bay. Partial recovery of the crab stock 18 months after the MHW was strongly associated with mean summer temperatures returning below 24°C. Together with a change in management to a quota system, the fishery returned to full recovery status in 2018 with sustainable catch levels of up to 550 t. Long term productivity of this fishery is now at high risk from climate change impacts with shifts in winter water temperatures being cooler by 2°C and occurring earlier by few months inside the Bay. This cooling trend appears to be impacting the spawning period with the timing of peak recruitment also occurring earlier, shifting from February to November. The impacts of the 2011 MHW highlighted the risk to stock sustainability through external drivers such as climate change that was previously poorly understood. The south-west region of Western Australia is considered a climate change hotspot with water temperatures rising at rates above global trends and at increased risk from further MHWs. Therefore, responding to climate change is now about managing risks to achieve a balance between fisheries sustainability and economic viability. Increased stock monitoring now provides biomass measures 12 months prior to the fishing season, a form of stock forecasting that stakeholders can utilize to better manage their fishing business and minimize economic loss. Development of a flexible harvest strategy is also underway which responds to recruitment variation and climate extremes.
Introduction
Effective fisheries management strives to maintain long-term sustainability of the resource, maximize the economic and social value of a fishery, and minimize ecosystem impacts of its practices (Caddy and Cochrane, 2001). This balancing act is often confounded by recruitment variability which typically requires reduction in harvest levels in response to low stock biomass, and vice versa, so as to avoid recruitment overfishing. However, as climate change creates conditions that are increasingly outside the dimensions of historical experiences, the risks increase, and maintaining stable productivity may no longer be a realistic objective, particularly for species at their distributional range limits. Symptomatic of a warming climate is the increasing frequency of extreme events such as marine heatwaves (MHWs) (Bond et al., 2015; Benthuysen et al., 2018; Oliver et al., 2018), which are “prolonged discrete anomalously warm water events” (Hobday et al., 2016) of varying duration, intensity, and spatial extent that can cause devastating impacts on fisheries and ecosystems including the social and economic regimes they support (Wernberg et al., 2013; Fraser et al., 2014; Caputi et al., 2016; Le Nohaïc et al., 2017; Arias-Ortiz et al., 2018; Smale et al., 2019).
The Western Australian 2011 MHW is currently the only Category IV (extreme) MHW (Hobday et al., 2018) recorded which occurred during the austral summer of 2010/11 for 66 days between November 2010 and March 2011. Nearshore water temperatures along the 200 km of the mid-west coast of Western Australia rose 2–3°C higher than historical temperatures and up to 5°C higher in some coastal regional areas (Feng et al., 2013). The 2011 MHW occurred as a result of the alignment of inter-seasonal and inter-decadal processes, where an extremely strong La Niña event over the summer months was accompanied by an unseasonal early surge of a very strong Leeuwin Current accompanied by unusually high atmospheric heat input into the ocean (Feng et al., 2013; Pearce and Feng, 2013). During the 2011 MHW, reports of species range extensions (north to south), fish kills of finfish and invertebrates, coral bleaching, and seagrass die-offs were widespread (Pearce et al., 2011; Abdo et al., 2012; Wernberg et al., 2013; Caputi et al., 2014; Lenanton et al., 2017; Smale et al., 2017). In the months following the MHW, impacts on early recruitment processes were amongst the less visible impacts that were being detected from monitoring surveys and commercial fishing data. This was the case for the Shark Bay blue swimmer crab (Portunus armatus) resource, one of 14 managed blue swimmer crab stocks that contribute to Australia's fisheries economy (Johnston et al., 2018) and nationally the most popular recreationally caught invertebrate species (Ryan et al., 2017; Chandrapavan, 2018).
The Shark Bay crab resource is harvested commercially by both trap and trawl fishing sectors, and during the 2010/11 season it was Australia's single highest producing (787 t) blue swimmer crab fishery with an estimated value of $4 million (Harris et al., 2014). By the end of 2011, the stock status dramatically shifted to being severely depleted with unprecedented low biomass levels across the Bay leaving everyone wondering what went wrong (Pearce et al., 2011). Management measures were taken in consultation with industry to cease commercial fishing and intensive stock monitoring and research began into understanding environmental drivers of crab recruitment in Shark Bay and the impacts from the 2011 MHW (Chandrapavan et al., 2018). The socio-economic impact to the region and communities supporting fishing operations was also high (Daley and van Putten, 2018), especially since the Shark Bay scallop fishery also closed at this time due to significant stock decline as a result of the MHW (Caputi et al., 2015a). Crab fishers were under considerable stress from the uncertainty regarding stock recovery potential and future productivity. Shark Bay is a World Heritage area whose economy is derived from eco-tourism, fisheries and agriculture. The regional community is familiar with seasonal environmental cycles and episodic flooding events, however, the concept of an extreme marine heatwave was fairly novel, even to the wider scientific community trying to understand this phenomenon. Following the decline in crab abundance, fisheries managers and industry stakeholders identified the need for predictive tools for better stock forecasting so they can better manage the fishery and their fishing business to minimize economic loss. To facilitate this process, an understanding of how stocks were impacted by local-scale climate shifts was recognized as a high priority to better inform future harvest strategies.
This study describes the decline and recovery of the Shark Bay blue swimmer crab population as one example of stock resilience to the 2011 MHW and ongoing climate variability. Caputi et al. (2016) first identified a negative relationship between commercial catch rates and the previous summer water temperatures in the years leading up to and including the stock decline in 2012. We build on this study by examining all post recovery years up to 2018 using fishery-independent survey data to hypothesize that the 2011 MHW caused a significant thermal disruption to the recruitment dynamics of P. armatus in Shark Bay. To test this hypothesis, we examined sea surface temperature (SST) data together with long-term fishery-independent survey biomass indices to identify key periods when water temperatures impacted negatively on recruitment processes. In doing so we discuss how ongoing climate shifts inside Shark Bay are likely to impact future productivity of P. armatus which historically been at an optimum temperature range.
Materials and Methods
Study Area
Shark Bay is the largest marine embayment in Australia and received a UNESCO World Heritage status in 1991 for its unique marine and terrestrial ecosystems that include extensive and diverse seagrass meadows, examples of Earth's evolutionary history in the form of stromatolites and microbial mats, steep salinity gradients forming three biotic zones and a range of endemic and endangered flora and fauna (NESP, 2018). It is an inverse estuary covering an area of ~13 000 km2, with a semi-arid climate with limited exchange of oceanic water, minimal freshwater input and high evaporation rates (Francesconi and Clayton, 1996; Burling et al., 2003; Figure 1). Water temperatures are typically between 23 and 26°C during the austral summer months, January to March, and dominated by strong southerly wind conditions creating greater mixing between the cool dense, saltier bottom layer and the warmer, oceanic upper layer in the water column (Nahas et al., 2005). Water temperatures begin to cool from April with winter typically between August to September (20–22°C) when weaker winds create pleasant conditions for the peak tourist season. During autumn/winter the Bay can experience the intrusion of warmer waters of the southward flowing Leeuwin Current at the channel entrances which can influence greater flushing rates from the Bay (Hetzel et al., 2015). This seasonal pattern in climate and circulation is considered “typical” in comparison to the events during the summer of 2010/11 and thereafter.
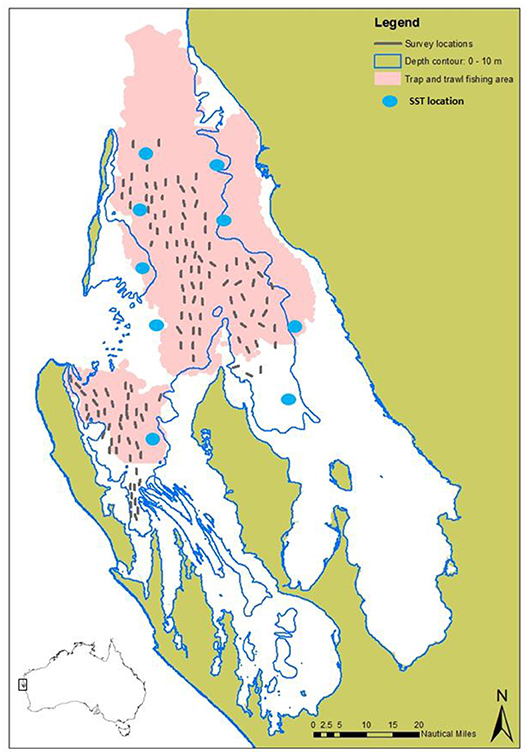
Figure 1. Map showing the main commercial fishing grounds of the trap and trawl sectors (from log book data) combined (pink), overlayed with the survey sites (gray lines) sampled during the fishery-independent crab surveys, and locations for the SST satellite data (blue dots).
Biological Data
P. armatus has a large geographical distribution range from tropical (Queensland) to temperate latitudes around Australia (South Australia) with Western Australia having a number of managed stocks along its coastline (Johnston et al., 2018). It is a short-lived (2–3 years), fast-growing and highly fecund tropical species (de Lestang et al., 2003; Harris et al., 2014), and typically in Shark Bay, low level spawning activity is observed all year with increased spawning activity during the cooler months of the year July to October (Chandrapavan et al., 2018) when more stable wind conditions are likely to be favorable for larval retention (Kangas et al., 2012). Recruits of 0+ age cohort of crabs [<100 mm carapace width (CW)] first settle among shallower seagrass habitats of the Bay for greater protection where they rapidly molt and grow over the spring/summer months and are first detected on the deeper trawl grounds from 50 mm CW onwards around February. Females reach maturity around 110 mm CW and enter their first breeding season producing up to 1.3 million eggs per/batch (for a 150 mm CW female) and can produce multiple batches within a breeding season (Chandrapavan et al., 2018). The 12-month commercial fishing season for crabs begins in November and fishers target larger adult crabs ≥ 135 mm CW (~18 months old).
Commercial catch and effort data since 1989 have been provided by fishers through a combination of log book and catch disposal records for unloaded catch. Since the trawl sector is a multi-species fishery, directed effort cannot be attributed to crabs, therefore monthly catch rate data is only available for the trap sector. Since 2002, information relating to crab abundance has been collected as part of the annual fishery-independent (standardized scientific survey at sea not affected by changes in fishing efficiency) scallop trawl survey program, where crab catch rates (kg/nm2) (kg per nautical mile2 trawled), size composition (CW), sex and breeding condition are recorded (Chandrapavan et al., 2018). This survey is undertaken in November each year and consists of up to 82 sampling sites across central Shark Bay and Denham Sound (Western Gulf) regions (Figure 1). Following the 2011 MHW, an expanded stock monitoring program was established for blue swimmer crabs where additional sites and sampling months (February and June) were included to better capture peak recruitment and peak spawning biomass levels. The timing of these surveys during peak summer and winter periods also allows for more informative assessments of summer and winter environmental conditions on stock recovery.
Temperature Effect on Crab Stock
Satellite-derived continuous daily sea surface temperatures (SSTs) were obtained from the NOAA OIv2 dataset (NOAA, 2019) from 1982 onwards at ¼ degree (~28 km) resolution at nine sites (Figure 1) across the varying depths inside Shark Bay. Daily SST data were used to calculate monthly mean SSTs and characterize trends and anomalies inside Shark Bay. Standardization of survey catch rates (weighted by area trawled) were calculated assuming that the densities of crabs among the individual trawl shots have a delta-lognormal distribution (see details in Chandrapavan et al., 2018).
We examined the relationship between fishery-independent survey catch rates of legal (crabs ≥135 mm CW), spawning (all females ≥110 CW), immature juvenile (males <100 mm, females <110 mm CW) crabs with SST data. The annual November survey is the longest time-series of fishery-independent survey of crab data available and even though it is not representative of peak spawning and recruitment, the biomass is proportional to the overall annual stock levels (Chandrapavan et al., 2018). The cohort of legal-sized (1+) crabs entering the fishery in November every year would have been juveniles (0+) during the previous summer. Correlations of standardized survey catch rates of legal-size and juvenile crabs between 2002 and 2018 with mean monthly SSTs during previous months was determined using Pearson's correlation coefficients (r). If any significant periods were identified for recruitment, this was used to explore a preliminary stock-recruitment relationship using the peak spawning catch rate of crabs from the June survey and peak juvenile recruitment catch rate from the February survey. All analyses were done using R (version 3.0.2; R Core Team, 2013).
Results
Stock Decline
The 2010/11 commercial crab season began in November 2010 with average crab landings by the trap sector, which gradually increased to above-average landings once the trawl sector started fishing from March 2011 onwards. Adverse impacts from the MHW was not immediately identified. In August 2011, almost 6 months post MHW, monthly commercial catch from both the trap and trawl fleets and trap catch rates declined to historically low levels (<10 t) for this time of year (Figure 2), although catches usually decline progressively toward the end of fishing season. When the 2011/12 fishing season began in November 2011, a marked shift in crab distribution patterns and biomass was observed by trap fishers when their catch rates declined to a record-low ~0.5 kg/traplift and <5 t overall had been landed by February 2012 (Figure 3).
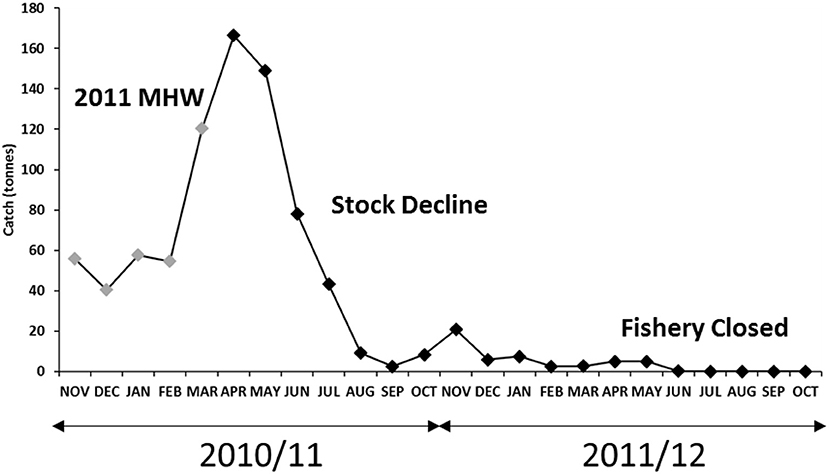
Figure 2. Monthly crab catches during the 2010/11 and 2011/12 fishing seasons showing catches landed during the 2011 MHW (gray), stock decline (low abundance August 2011 onwards), and fishery closure (April/May 2012).
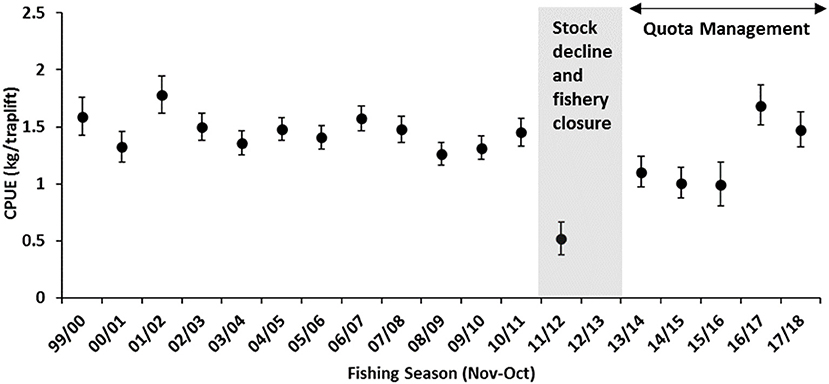
Figure 3. Standardized commercial crab trap legal-size catch rate (mean ± 95% CI) (kg/traplift) for the Shark Bay Crab Managed Fishery.
The November 2011 trawl survey confirmed the unprecedented stock decline in the Bay where the survey CPUE of all crabs dropped from an average of 1,345 to 41 kg/nm2 (Figure 4A), and spawning and legal-sized crabs were at historically record-low biomass levels of 3–6 kg/nm2 (Figures 4B,C). While juvenile abundance was also relatively low (Figure 4D), the November survey was not an optimal time to measure the abundance of new recruits. Management measures were taken to cease commercial fishing in April 2012 to allow the surviving stock to recover and rebuild.
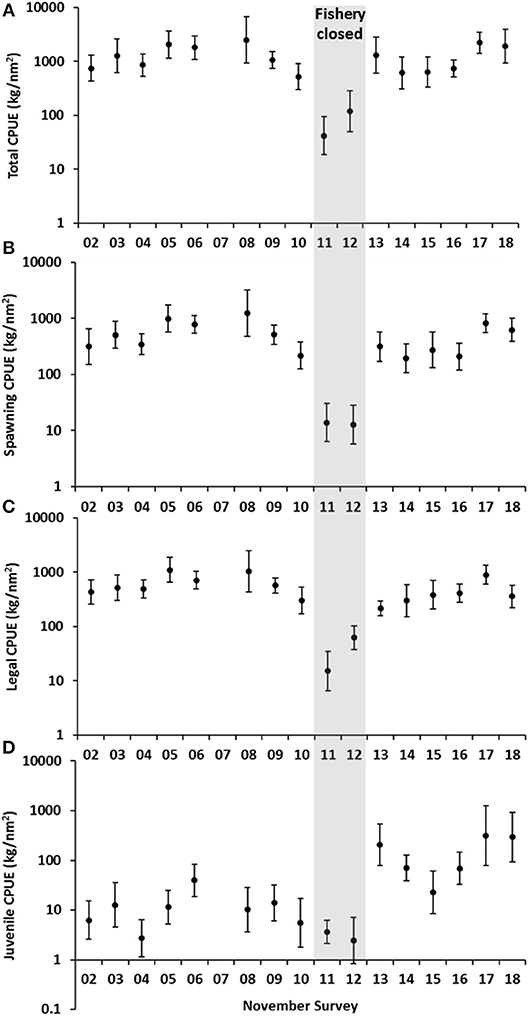
Figure 4. Annual November fishery-independent survey catch rates (standardized mean ± 95% CI) presented on a log scale (A) total (all crabs) biomass levels (B) spawning (all females ≥110 mm CW) (C) legal (all crabs ≥135 mm CW) and (D) juvenile (females <110 mm CW, males <100 mm CW). Catch rates prior to 2011 represents fishery operating under input management system, 2011–2012 represents stock decline and recovery period, 2013–2018 represents recovery under a quota management system.
Environmental Conditions and Stock Recovery
Typically (mean SST between 1981 and 2009), the coolest winter period inside Shark Bay has been August to October with a SST range of 20.5–21.5°C, and the warmest summer period as February to April with a SST range of 24–25 °C (Figure 5A). During 2010, SSTs were cooler than the average between February and September, lowest during July 2010 at 20.0°C. From September 2010 onwards, mean monthly SSTs rapidly increased to above-average temperatures peaking during February 2011 at ~29°C. Shallower regions of the Bay experienced above-average temperatures of up to 5°C while the central deeper Bay regions experienced up to 3°C above-average temperatures. The 2011 MHW was part of the 2010–12 La Niña event which consisted of two peaks in La Niña strength over successive summers (BOM, 2019a). The 2011/12 peak was weaker, but still of moderate strength, and led to SSTs up to 2°C warmer inside Shark Bay (Figure 5B).
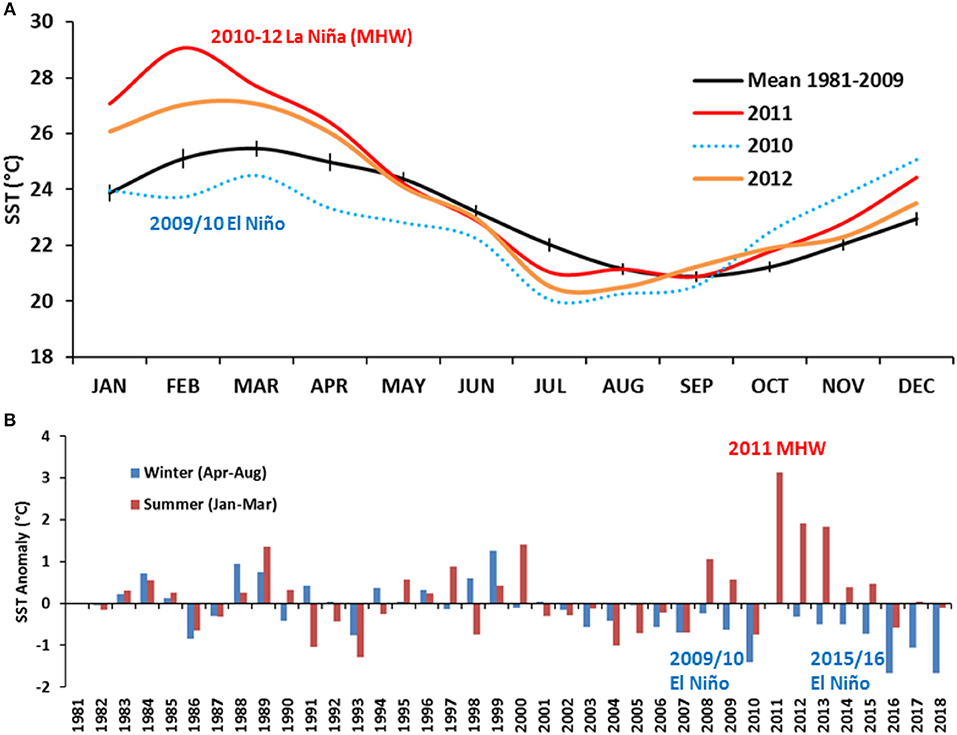
Figure 5. (A) Comparison of the historical (pre-heatwave) mean monthly SST [mean (±95% CI) (1981–2009] and the mean monthly SST between 2010 and 2012 showing a combination of the 2009/10 El Niño phase transitioning to the 2011 MHW as part of the 2010–12 La Niña phase. (B) Mean winter (April to August—blue) and summer (January to March—red) SST anomalies for Shark Bay region from 1982 to 2018, calculated against the 1982–2009 means (representing pre-heatwave years).
Following the 2012/13 summer, February and June 2013 surveys delivered the first positive indication of sustained stock recovery with peak recruitment levels of 991 kg/nm2 and spawning levels of 1,789 kg/nm2. Through industry consultation, a limited commercial fishing trial was undertaken during July 2013 to assess the feasibility of reopening the fishery. The trial was deemed successful with commercial catch rates reflecting those of pre-MHW years and provided confidence to resume commercial operations. Prior to the stock decline, the fishery was in the process of transitioning to a quota management system as a measure to reduce fishing pressure and to resolve resource allocation issues between trap and trawl sectors (Chandrapavan et al., 2018). Implementing the quota system as part of the stock rebuilding strategy was a timely regulatory action that was key to managing harvest levels without impeding stock recovery. After extensive consultation with stakeholders, an initial quota of 200 t was set for the 2013/14 season, but later revised to 400 t after a mid-season review of commercial catch rates and additional survey information indicated moderate sustainability risk of this increase to the recovering stock. Increasing levels of recruitment and spawning biomass were observed during 2015, 2016, and 2017 with biomass levels slowly returning to historical (pre-MHW) ranges (Figure 4). Landings also increased from 341 to 516 t under quota limits of 400 t (2014/15 to 2016/17) to 550 t (2017/18) (Figure 6).
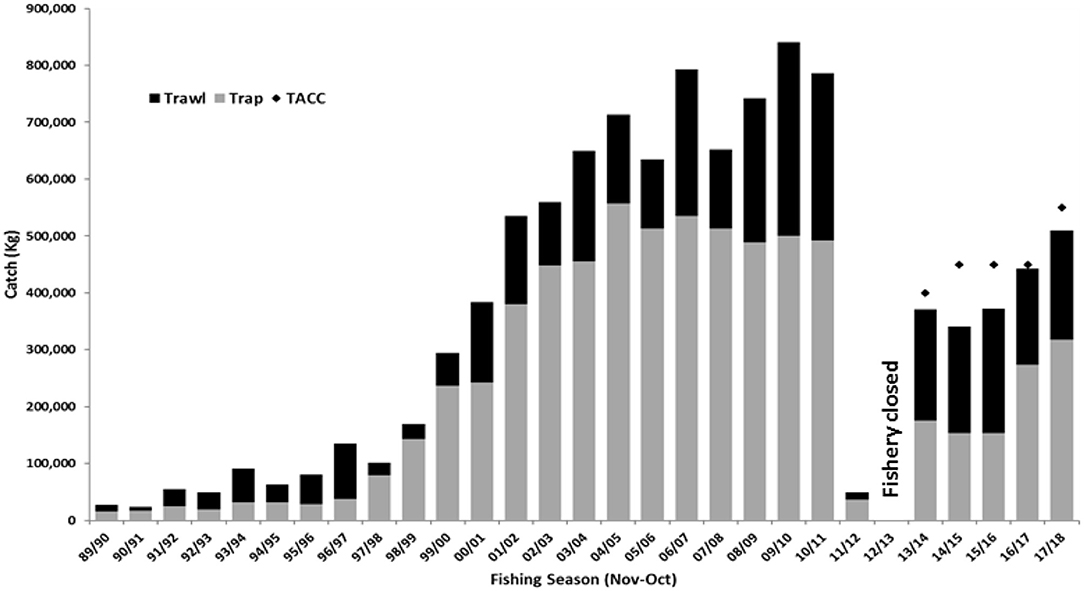
Figure 6. Catch history of the Shark Bay Managed Fishery (by trap and trawl sectors) between 1989 and 2018. Also indicated is the total allowable commercial catch (TACC) levels from 2013/14 onwards when the fishery changed to a quota management system.
Stock-Environment Relationships
Correlation analyses identified (log-transformed) survey catch rates of legal crabs (1+ cohort) during November (year y) being negatively correlated with SSTs during the previous summer months December to January (y-1/y). The regression analysis provided a significant model fit of r2 = 0.73 (p < 0.01) (Figure 7).
The relationship suggests that achieving above-average recruitment requires cooler summer temperatures ≤24°C which are likely to produce higher catch rates (>ln5.5 or >245 kg/nm2) of legal crabs in the following summer when they start to recruit into the fishery (and the reason the quota fishing season is set from November to October). Stock decline during 2011 is clearly associated with the highest mean SST (Dec-Jan) of 26.1°C, followed by progressive decreases in mean temperatures during 2012 and 2013 as SSTs fell toward 24°C allowing the stock to rebuild in the absence of fishing pressure. Legal crab CPUE in the fishery-independent survey increased slightly during 2014 with a cooler mean summer SST of 24.5°C, although this catch rate had been impacted by resumed fishing removing 371 t of crabs during the 2013/14 season. Since 2015, summer (Dec-Jan) SSTs have been cooler than the historical average (Figure 5B) and below 24°C allowing recruitment to return back within the historical range (Figure 7) under catch levels of up to 518 t.
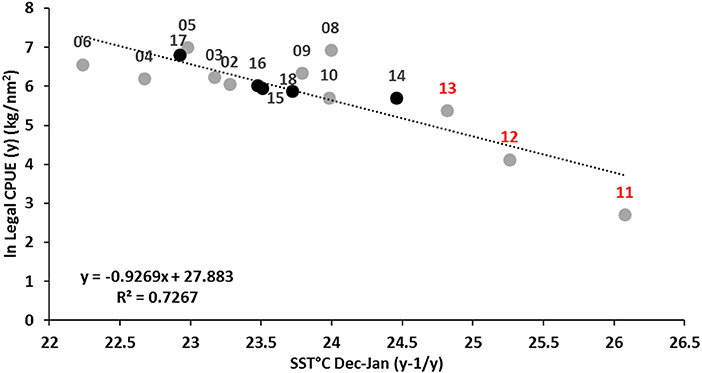
Figure 7. Relationship between log-transformed legal crab catch rate during the survey in November (year y) and mean SST during December–January (y-1/ y). Stock decline and fishery closure years 2011–2013 shown in red; stock recovery years under quota management 2014–2018 indicated by solid black points. Survey data is not available for 2007.
The other significant environmental relationship relating to recruitment was that between juvenile (0+) recruitment levels during November (y) and mean SSTs during the preceding winter months of June and July (y). The regression analysis provided a significant model fit of r2 = 0.57 (p < 0.01) (Figure 8).
This relationship suggests higher catch rates (>log 3 or >20 kg/nm2) of juvenile crabs in November are associated with winter SSTs ≤21.5°C and low to below average catch rates with winter SSTs >21.5°C. Interestingly, all the winters that were colder than 21.5°C were between 2013 and 2018, post- 2011 MHW years, while the warmer winter seasons were all associated with pre-MHW years. This has resulted in an increase in the average juvenile catch rates from 11 kg/nm2 before 2013 to 163 kg/nm2 since 2014. As the peak recruitment is considered to occur around February, this relationship may not represent environmental effect on juvenile recruitment abundance. The relationship probably reflects the effect of the environment on the earlier onset of juveniles present in the November surveys in recent years. Data from 2010 to 2012 were omitted from this analysis as they may have been confounded by unknown level of mortality during the 2011 MHW and subsequent low spawning stock levels during 2012. Since 2011, there has been a notable shift in the winter period in Shark Bay with the coolest SSTs occurring earlier, between June and July and also on average being cooler by ~2°C (Figure 5A). In fact, winter SST anomalies Shark Bay, April to August, have been cooler than the average since 2002, with record-low winter SSTs during 2010, 2016, and 2018 (Figure 5B).
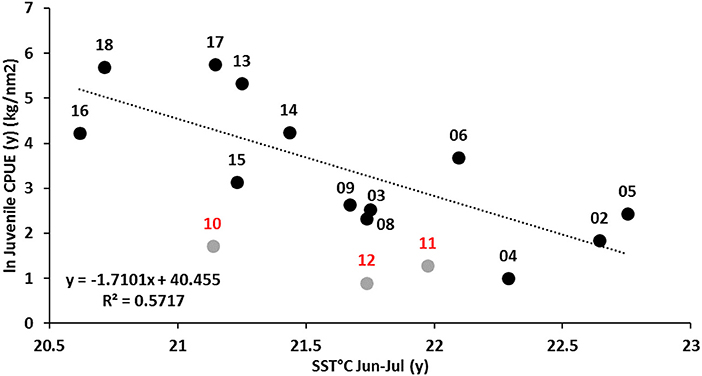
Figure 8. Relationship between log transformed juvenile crab catch rate during November (y) and mean SST during May-July (y) for all years 2002–2018 excluding 2010–2012 as they were affected by 2011 MHW and subsequent low spawning stock levels. Survey data is not available for 2007.
A preliminary examination of the stock-recruitment relationship was attempted using juvenile recruitment during February (y) with peak spawning catch rate during June (y-1). This analysis provided a significant model fit of r2 = 0.85 (p < 0.05) showing spawning stock as the major driver of recruitment variability since 2012 (Figure 9).
The model outcomes are not surprising for the 7 years of stock rebuilding since the 2011 MHW where summer SSTs have not been highly variable and harvest levels have been restricted. The low recruitment in 2012/13 is likely due to a combination of low spawning stock abundance and the warmer than average summer temperatures. The large increase in recruitment from 2012/13 to 2013/14 was a period of no fishing in conjunction with summer temperatures dropping toward 24°C. Since the resumption of fishing, spawning stock and recruitment levels have improved and have been maintained during successive years of cooler summer SSTs but also through setting the harvest levels (quota) such that recruitment overfishing is avoided.
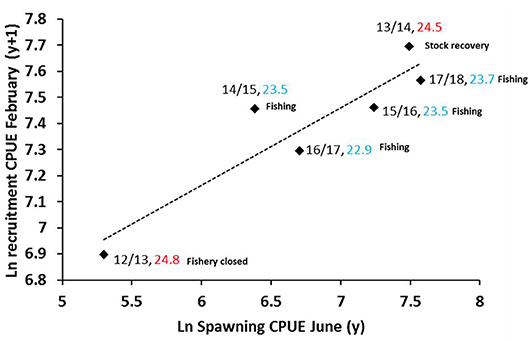
Figure 9. Preliminary stock-recruitment relationship for the Shark Bay crab stock based on peak spawning (all females ≥110 mm CW) biomass during the June survey (t) and peak recruitment (females <110 mm, males <105 mm CW) biomass during the following February survey (y+1). Labels refer to year of spawning/year of recruitment, mean summer SST (Dec–Jan) (y/y+1) ≥24°C in red and <24°C in blue and fishery status.
Discussion
A significant decline in overall stock abundance of blue swimmer crabs 6–12 months after the 2011 MHW and partial recovery within 18 months (a single generation time for P. armatus) demonstrated both vulnerability and resilience of the Shark Bay crab population to acute and moderate temperature shifts. This study has identified two significant stock-environment relationships critical to the recruitment processes of blue swimmer crabs that will continue to impact the long-term productivity of this fishery, particularly as their environment shifts toward suboptimal conditions.
Our study infers juvenile (5–8 month old) P. armatus in Shark Bay to be most susceptible to heat stress when mean water temperatures between December and January are >24°C, and detrimental when they exceeded 26°C (Figure 7). During the 2011 MHW, mean SSTs were higher than 24°C from November through to May with peak SSTs up to 29°C (Figure 10). Prolonged and sustained high water temperatures without reprieve across the whole Bay region would have escalated thermal stress levels beyond physiological repair leading to mortality. Dead crabs were not observed directly during the heatwave period and good catch rates were maintained for a few months after the heatwave. However, fish kills of Pink Snapper (Chrysophrys auratus) in Shark Bay and other invertebrate species such as lobsters and abalone along the WA coastline during the MHW (Pearce et al., 2011) from (assumed) similar physiological stress responses. During the post-heatwave years, P. armatus recruitment levels have increased as the mean December–January temperatures returned and remained below the thermal threshold temperature of 24°C. Therefore, summer water temperature does appear to be a significant driver of recruitment in Shark Bay. The preliminary stock-recruitment relationship during the stock recovery years since the MHW, show spawning stock in 2012 appears to be the major driver of the 2013 recruitment. This analysis is based on a very short time series and a return to warmer summer SSTs will test this relationship into the future as more years of data become available. We believe a combination of favorable summer water temperatures for recruitment and a change to quota management allowing greater protection of the spawning stock has together recovered the crab stock back to sustainable levels after the MHW.
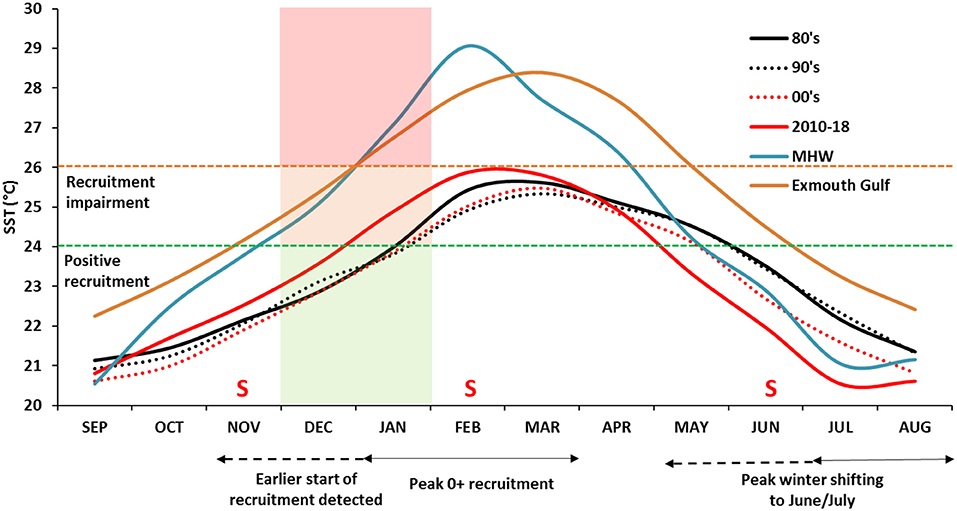
Figure 10. Decadal trends in mean monthly SST between the 1980's, 1990's, 2000s in Shark Bay in comparison to the months pre and post 2011 MHW (September 2010-August 2011) and mean monthly SSTs in Exmouth Gulf (1981–2009). Overlain on the plot are the temperature thresholds for positive recruitment (24°C) and recruitment impairment (26°C) during December and January. Fishery-independent survey months indicated by “S”.
Many crustaceans including crabs respond to variation in water temperatures through changes to molt timing and frequency, growth rates, size at maturity, spawning period, larval development, and survival (Green et al., 2014). When these shifts reach their thermal thresholds it will ultimately limit productivity as one or more environmental conditions compromise reproductive success. In Shark Bay, decadal trends in monthly SSTs are showing an increase of summer temperatures from the 1980s to recent years. The mean January SST has increased from around 24°C during the 1980's, 1990's, 2000s to 24.8°C since 2010 as a result of the MWH and following two warm summers (Figure 10). It is therefore important to monitor and understand the trends in these summer temperatures as they can have major effect on crab recruitment. The current summer SSTs inside Exmouth Gulf, the next largest embayment 400 km north of Shark Bay, are similar to that experienced during the MWH in Shark Bay. Blue swimmer crabs are incidentally retained by the trawl fishery in Exmouth Gulf and constitute a minor trap fishery (Johnston et al., 2018) along the northern Western Australian coastline. Annual catches are highly variable and generally <50 t and reflect the reduced performance of this species at higher latitudes and water temperatures above the critical thermal tolerance range for juvenile P. armatus. We hypothesize that if there is greater warming of summer months in Shark Bay into the future, it will gradually alter the success of the protracted spawning period to one more restricted toward those months conducive for larval survival and settlement.
Shark Bay is currently also experiencing greater magnitude of annual temperature variation (difference between maximum and minimum SST) of 6°C in the past decade compared with 4.8°C during the 1980's. A warming summer trend is partly responsible for this variation, however it seems to be also driven by winter water temperatures cooling at a faster rate between April and September. The mean temperature minima is shifting forward to June/July from August/September (Figure 10) and this cooling phenomenon is restricted to waters inside the Bay. Cooler than average SSTs are usually associated with strong El Niño events such as during 2009 and 2016 (Figure 5B), however both 2017 and 2018 were neutral ENSO years where winter SSTs were 1–2°C below average temperatures. Recent investigations reveal Shark Bay (and likely Exmouth Gulf) as being sensitive to the shifts and position of the subtropical ridge (STR), a band of high pressure systems which is positioned over Shark Bay during winter and moves further south during summer (BOM, 2019b). Global climate change is now causing the shift in the STR to be further south allowing stronger easterly winds to dominate. Stronger winds cause greater heat loss to the atmosphere thus cooling the inner waters of Shark Bay during winter (Hetzel, 2018).
In Shark Bay, peak juvenile (<100 mm CW) recruitment over the summer months largely arises due to winter water temperatures between 20 and 22°C as being optimal for spawning (Chandrapavan, 2018). Prior to 2011, peak spawning was likely around August-September, and therefore juvenile crabs were not generally sampled during the November survey as they were too small to have moved out on to the central Bay region from the inshore seagrass habitats. Currently, the peak winter temperature range is occurring 2 months earlier during June-July (Figure 10) while concurrently higher catch rate of juvenile abundance during November surveys are also being observed. The negative relationship with juvenile recruitment during November and SSTs during June-July supports our hypothesis that a forward shift in the peak spawning is occurring, allowing crabs to take advantage of optimal temperatures earlier (Figure 10) resulting in an earlier observation of juveniles in the November survey since 2013 (Figure 8).
Ongoing climate change is expected to continue to alter crab recruitment patterns and timing of spawning given organisms generally evolve to coincide reproduction with food availability for survival and development of the offspring (Green et al., 2014). While acute cold stress events such as cold spells and cold snaps are known to occur due to climate variability (Schlegel et al., 2017), the observed long-term climate change driven cooling pattern as observed inside Shark Bay may be unique to this region of Western Australia with the phenomenon also occurring inside Exmouth Gulf. What remains unclear is the impact of temperatures cooler than 20°C on larval development and survival, which the Bay has not experienced in the past but is occurring at greater frequency since 2014. Climate models are also predicting a long-term southward shift of the STR, therefore Shark Bay may experience colder SSTs and greater wind intensity which will certainly impact the overall circulation and flushing of the Bay thus affecting overall larval dispersal and recruitment processes inside the Bay (Hetzel, 2018). Furthermore, climate change is also likely to alter primary productivity and overall trophic structures of the system either through discrete events or gradual ecological changes (Wernberg et al., 2013). Approximately 36% of the seagrass habitat was severely damaged or lost following the 2011 MHW (Arias-Ortiz et al., 2018) and this may have contributed to the recruitment decline of P. armatus. However, the remaining seagrass habitat appears to be sufficient to support the recovery of the crab stock in the subsequent years despite little recovery in the seagrass habitat. Further research is required to fully understand the changes in oceanography-habitat-species interactions that are likely to occur with changes in climate and hydrodynamics of the Bay.
In trying to project the productivity of the Shark Bay crab resource forward, it is clear that the role of climate in determining recruitment success adds significant uncertainty and risk to estimates of future yields. One of the key lessons learned from the rebuilding of the Shark Bay crab population was the importance of environmental and stock monitoring programs that are able to capture changes in stock abundance with changes in the environment. Targeted surveys around peak recruitment and spawning during summer and winter months allows for biomass indices of future harvest to be assessed precisely but more importantly provides early detection of any impacts from environmental perturbations. Hence an accurate assessment of stock status and harvest levels is currently based on a risk-based weight of evidence approach (Department of Fisheries, 2015), utilizing a range of survey indices, environmental and climate data, biomass dynamics modeling and validation using commercial performance indicators. This information is assessed to set appropriate harvest levels 6 months prior to a fishing season and is re-assessed mid-season to allow for harvest levels to be adjusted (higher or lower) in accordance with the control rules governing the harvest strategy. Early detection of any impacts on the stocks through monitoring the pre-recruit abundance thus allows for more timely decision making for both the protection of the stock and to inform industry.
No La Niňa events have occurred in years since the 2010–12 event which occurred unseasonably over the summer months. Previously, the “Western Australia 1999 MHW (Category 3)” occurred during the autumn/winter months (Hobday et al., 2018) with no known documented impacts and was primarily considered to be a warmer than average winter period due to the accompanying strong La Niňa event. The Bureau of Meteorology (BOM, 2019c) provides ENSO forecasting which is regularly reviewed prior to and during the crab fishing season in Shark Bay. Therefore, with further development of stock-recruitment-environment models, the capacity to act early to reduce fishing pressure ahead of catastrophic events is now possible.
Conclusion
The south-west coast of Western Australia, with Shark Bay at its northern range, is identified as one of 24 global marine hot-spots thus increasing the likelihood and frequency of extreme events (Hobday and Pecl, 2013; Hallett et al., 2018). The 2011 MHW highlighted the risk of climate variability to crab (and other fish) stocks from a single climatic perturbation. Its impact on the Shark Bay crab fishery and industry was devastating. Rapid rebuilding has occurred through a combination of return to ideal environmental conditions, increased monitoring of stock abundance and environmental factors, adaptive management actions combined with industry cooperation. Using these learnings, consideration of environmental parameters is currently being incorporated into the fishery's harvest strategy.
The “typical” climate and circulation processes characteristic of Shark Bay are changing as shifts in seasonal temperatures and wind patterns are creating “atypical” environmental conditions. The cooling phenomenon inside Shark Bay further highlights the importance of considering climate shifts and impacts at a local scale irrespective of global or national climate model projections. Risk assessments of Western Australian fishery resources identified blue swimmer crabs as at the highest risk level to climate change impacts (Caputi et al., 2015b). More recently, a climate change vulnerability index developed for assessing climate change impacts across World Heritage Sites ranked Shark Bay at “High Risk” (NESP, 2018). This assessment considered multiple stressors due to climate change on both the terrestrial and marine ecosystems highlighting the need for urgent action. Adapting to this new reality will be an evolving and challenging process. Fishing industries need to find ways to remain profitable and competitive within a changing climate, while fisheries regulatory bodies need to provide flexible and adaptive management frameworks to support sustainability, deal with uncertainty and respond to climate change.
Data Availability
The datasets for this manuscript are not publically available because of confidentiality restrictions under the Fisheries Act. Requests to access the datasets should be directed to the corresponding author.
Author Contributions
AC and MK designed the study. AC collected some of the data, processed and analyzed the datasets, and worked on interpretations of the results with NC. AC wrote the manuscript. MK and NC contributed to the text by reviewing and writing.
Conflict of Interest Statement
The authors declare that the research was conducted in the absence of any commercial or financial relationships that could be construed as a potential conflict of interest.
Acknowledgments
The authors thank the Fisheries Research and Development Corporation for their financial support of this project. We thank the research technical team S. Wilkin, N. Breheny, I. Koefoed, M. Shanks, and D. Meredith and crew of the Research Vessel Naturaliste, for the field assistance, sample and data collections, and data entry. We thank P. Cavalli, G. Jackson, and three reviewers for their valuable editorial comments and suggestions for improving the manuscript.
References
Abdo, D. A., Bellchambers, L. M., and Evans, S. N. (2012). Turning up the heat: increasing temperature and coral bleaching at the high latitude coral reefs of the Houtman Abrolhos Islands. PLoS ONE 7:e43878. doi: 10.1371/journal.pone.0043878
Arias-Ortiz, A., Serrano, O., Masqué, P., Lavery, P. S., Mueller, U., Kendrick, G. A., et al. (2018). A marine heatwave drives massive losses from the world's largest seagrass carbon stocks. Nat. Clim. Change 8, 338–344. doi: 10.1038/s41558-018-0096-y
Benthuysen, J. A., Oliver, E. C. J., Feng, M., and Marshall, A. G. (2018). Extreme marine warming across tropical Australia during austral summer 2015–2016. J. Geophys. Res. 123, 1301–1326. doi: 10.1002/2017JC013326
BOM (2019a). Australian Climate Influences Timeline. El Nino and La Nina events. La Nina -Detailed Australian Analysis. Available online at: http://www.bom.gov.au/climate/enso/lnlist/index.shtml (accessed March 02, 2019).
BOM (2019b). Australian Climate Influences. Sub-tropical Ridge. Available online at: http://www.bom.gov.au/watl/about-weather-and-climate/australian-climate-influences.shtml?bookmark=stridge (accessed March 2, 2019).
BOM (2019c). Climate outlook. ENSO Wrap-Up. Available at: http://www.bom.gov.au/climate/enso/ (accessed March 2, 2019).
Bond, N. A., Cronin, M. F., Freeland, H., and Mantua, N. (2015). Causes and impacts of the 2014 warm anomaly in the NE Pacific. Geophys. Res. Lett. 42, 3414–3420. doi: 10.1002/2015GL063306
Burling, M. C., Pattiaratchi, C. B., and Ivey, G. N. (2003). The tidal regime of Shark Bay, Western Australia. Estu. Coast. Shelf Sci. 57, 725–735. doi: 10.1016/S0272-7714(02)00343-8
Caddy, J. F., and Cochrane, K. L (2001). A review of fisheries management past and present and some future perspectives for the third millennium. Ocean Coast. Manag. 44, 653–682. doi: 10.1016/S0964-5691(01)00074-6
Caputi, N., Feng, M., Pearce, A., Benthuysen, J., Denham, A., Hetzel, Y., et al. (2015a). Management Implications of Climate Change Effect on Fisheries in Western Australia: Part 1 Environmental Change and Risk Assessment. FRDC Project 2010/535, Fisheries Research Report 260. Department of Fisheries, Perth, WA.
Caputi, N., Feng, M., Pearce, A., Benthuysen, J., Denham, A., Hetzel, Y., et al. (2015b). Management Implications of Climate Change Effect on Fisheries in Western Australia, Part 2: Case Studies. FRDC Project No. 2010/535, Fisheries Research Report No. 261. Department of Fisheries, Perth, WA.
Caputi, N., Jackson, G., and Pearce, A. (2014). The Marine Heatwave Off Western Australia During the Summer of 2010/11 – 2 Years on. Fisheries Research Report No. 250. Department of Fisheries, Perth, WA.
Caputi, N., Kangas, M., Denham, A., Feng, M., Pearce, A., Hetzel, Y., et al. (2016). Management adaptation of invertebrate fisheries to an extreme marine heat wave event at a global warming hotspot. Ecol. Evolu. 6, 3583–3593. doi: 10.1002/ece3.2137
Chandrapavan, A. (2018). “Improving confidence in the management of the blue swimmer crab (Portunus armatus) in Shark Bay,” in Part 111. Proceedings of the Third National Workshop on Blue Swimmer Crab Portunus armatus. FRDC Project No. 2012/15, Fisheries Research Report 285. Department of Fisheries, Perth, WA.
Chandrapavan, A., Kangas, M. I., Johnston, D., Caputi, N., Hesp, A., Denham, A., et al. (2018). Improving Confidence in the Management of the Blue Swimmer Crab (Portunus armatus) in Shark Bay. PART I: Rebuilding of the Shark Bay Crab Fishery. Fisheries Research Report No. 283. Department of Primary Industries and Regional Development, Perth, WA.
Daley, R., and van Putten, I. (2018). Improving Confidence in the Management of the Blue Swimmer Crab (Portunus armatus) in Shark Bay. Part 11. Socio-Economic Significance of Commercial Blue Swimmer Crabs in Shark Bay. FRDC Project No. 2012/15, Fisheries Research Report No. 284. Department of Fisheries, Perth, WA.
de Lestang, S., Hall, N. G., and Potter, I. C. (2003). Reproductive biology of the blue swimmer crab, Portunus pelagicus (Decapoda: Portunidae) in five water bodies on the west coast of Australia. Fish. Bull. 101, 745–757.
Department of Fisheries (2015). Harvest Strategy Policy and Operational Guidelines for Aquatic Resources of Western Australia. Fisheries Management Paper 271. Department of Fisheries, Perth, WA.
Feng, M., McPhaden, M. J., Xie, S. P., and Hafner, J. (2013). La Niña forces unprecedented Leeuwin Current warming in 2011. Sci. Rep. 3:1277. doi: 10.1038/srep01277
Francesconi, K., and Clayton, D. (1996). Shark Bay: Management Paper for Fish Resources. Fisheries Management Paper No. 91. Department of Fisheries, Perth, WA.
Fraser, M. W., Kendrick, G. A., Statton, J., Hovey, R. K., Zavala-Perez, A., and Walker, D. I. (2014). Extreme climate events lower resilience of foundation seagrass at edge of biogeographical range. J. Ecol. 102, 1528–1536. doi: 10.1111/1365-2745.12300
Green, B. S., Gardner, C., Hochmuth, J. D., and Linnane, A. (2014). Environmental effects on fished lobsters and crabs. Rev. Fish Biol. Fish. 24:613–638. doi: 10.1007/s11160-014-9350-1
Hallett, C. S., Hobday, A. J., Tweedley, J. R., Thompson, P. A., McMahon, K., and Valesini, F. J. (2018). Observed and predicted impacts of climate change on the estuaries of south-western Australia, a Mediterranean climate region. Reg. Environ. Change. 1357–1373. doi: 10.1007/s10113-017-1264-8
Harris, D., Johnston, D., Sporer, E., Kangas, M., Felipe, N., and Caputi, N. (2014). Status of the Blue Swimmer Crab Fishery in Shark Bay, Western Australia. Fisheries Research Report No. 233. Department of Fisheries, Perth, WA.
Hetzel, Y. (2018). “Latitudinal shifts of the subtropical high pressure ridge cause anomalous winter cooling in Shark Bay, Australia,” in Presentation at ECSA 57: Changing Estuaries, Coasts, and Shelf Systems—Diverse Threats and Opportunities (Perth, WA).
Hetzel, Y., Pattiaratchi, C., Lowe, R., and Hofmeister, R. (2015). Wind and tidal mixing controls on stratification and dense water outflows in a large hypersaline bay. J. Geophys. Res. Oceans 120, 6034–6056. doi: 10.1002/2015JC010733
Hobday, A., and Pecl, G. (2013). Identification of global marine hotspots: sentinels for change and vanguards for adaptation action. Rev. Fish Biol. Fish. 24:415. doi: 10.1007/s11160-013-9326-6
Hobday, A. J., Alexander, L. V., Perkins, S. E., Smale, D. A., Straub, S. C., Oliver, E. C. J., et al. (2016). A hierarchical approach to defining marine heatwaves. Progr. Oceanogr. 141, 227–238. doi: 10.1016/j.pocean.2015.12.014
Hobday, A. J., Oliver, E. C. J., Gupta, A. S., Benthuysen, J. A., Burrow, M. T., Donat, M. G., et al. (2018). Categorizing and naming marine heatwaves. Oceanography 31, 1–13. doi: 10.5670/oceanog.2018.205
Johnston, D., Chandrapavan, A., Garland, A., Beckmann, C., and Johnson, D. (2018). “Blue swimmer crab Portunus armatus,” in Status of Australian Fish Stocks Reports. Available online at: https://www.fish.gov.au/report/179-Blue-Swimmer-Crab-2018
Kangas, M. I., Chandrapavan, A., Hetzel, Y. L., and Sporer, E. C. (2012). Minimising Gear Conflict and Resource Sharing Issues in the Shark Bay Trawl Fisheries and Promotion of Scallop Recruitment. Fisheries Research Report No. 229. Department of Fisheries, Perth, WA.
Le Nohaïc, M., Ross, C. L., Cornwall, C. E., Comeau, S., Lowe, R., McCulloch, M. T., et al. (2017). Marine heatwave causes unprecedented regional mass bleaching of thermally resistant corals in northwestern Australia. Sci. Rep. 7:14999. doi: 10.1038/s41598-017-14794-y
Lenanton, R. C. J., Dowling, C. E., Smith, K. A., Fairclough, D. V., and Jackson, G. (2017). Potential influence of a marine heatwave on range extensions of tropical fishes in the eastern Indian Ocean – Invaluable contributions from amateur observers. Reg. Stud. Marine Sci. 13, 19–31. doi: 10.1016/j.rsma.2017.03.005
Nahas, E. L., Pattiaratchi, C. B., and Ivey, G. N. (2005). Processes controlling the position of frontal systems in Shark Bay, Western Australia. Estu. Coast. Shelf Sci. 65, 463–474. doi: 10.1016/j.ecss.2005.06.017
NESP Earth Systems and Climate Change Hub (2018). Climate Change and the Shark BaQy World Heritage Area: Foundations for a Climate Change Adaptation Strategy and Action Plan. Earth Systems and Climate Change Hub Report No. 7. NESP Earth Systems and Climate Change Hub, Melbourne, VIC.
NOAA (2019). NOAAHigh Resolution SST data provided by the NOAA/OAR/ESRL PSD, Boulder, Colorado, USA. Available online at: https://www.esrl.noaa.gov/psd/ (accessed March 20, 2019).
Oliver, E. C. J., Donat, M. G., Burrow, M. T., Moore, P. J., Smale, D. A., Alexander, L. V., et al. (2018). Longer and more frequent marine heatwaves over the last century. Nat. Commun. 9:1324. doi: 10.1038/s41467-018-03732-9
Pearce, A., Lenanton, R., Jackson, G., Moore, J., Feng, M., and Gaughan, D. (2011). The “Marine Heat Wave” off Western Australia During the Summer of 2010/2011. Fisheries Research Report 222. Department of Fisheries, Perth, WA.
Pearce, A. F., and Feng, M. (2013). The rise and fall of the “marine heat wave” off Western Australia during the summer of 2010/2011. J. Marine Syst. 111–112, 139–156. doi: 10.1016/j.jmarsys.2012.10.009
R Core Team (2013). A Language and Environment for Statistical Computing. Vienna: R Foundation for Statistical Computing. Available online at: http://www.R-project.org/
Ryan, K. L., Hall, N. G., Lai, E. K., Smallwood, C. B., Taylor, S. M., and Wise, B. S. (2017). Statewide Survey of Boat-Based Recreational Fishing in Western Australia 2015/16. Fisheries Research Report No. 287. Department of Primary Industries and Regional Development, Perth, WA. 205.
Schlegel, R. W., Oliver, E. C. J., Perkins-Kirkpatrick, S., Kruger, A., and Smit, A. J. (2017). Predominant atmospheric and oceanic patterns during coastal marine heatwaves. Front. Marine Sci. 4:323. doi: 10.3389/fmars.2017.00323
Smale, D. A., Wernberg, T., Oliver, E. J. C., Thomsen, M. S., Harvey, B. P., Straub, S. C., et al. (2019). Marine heatwaves threaten global biodiversity and the provision of ecosystem services. Nat. Clim. Change Lett. 9, 306–312. doi: 10.1038/s41558-019-0412-1
Smale, D. A., Wernberg, T., and Vanderklift, M. A. (2017). Regional-scale variability in the response of benthic macroinvertebrate assemblages to a marine heatwave. Marine Ecol. Progr. Ser. 568, 17–30. doi: 10.3354/meps12080
Keywords: Shark Bay, Western Australia, 2011 marine heatwave, crab fishery, stock decline, climate change
Citation: Chandrapavan A, Caputi N and Kangas MI (2019) The Decline and Recovery of a Crab Population From an Extreme Marine Heatwave and a Changing Climate. Front. Mar. Sci. 6:510. doi: 10.3389/fmars.2019.00510
Received: 01 April 2019; Accepted: 05 August 2019;
Published: 21 August 2019.
Edited by:
Thomas Wernberg, University of Western Australia, AustraliaReviewed by:
Mads Solgaard Thomsen, School of Biological Sciences, College of Science, University of Canterbury, New ZealandCamilla With Fagerli, Norwegian Institute for Water Research (NIVA), Norway
Copyright © 2019 Chandrapavan, Caputi and Kangas. This is an open-access article distributed under the terms of the Creative Commons Attribution License (CC BY). The use, distribution or reproduction in other forums is permitted, provided the original author(s) and the copyright owner(s) are credited and that the original publication in this journal is cited, in accordance with accepted academic practice. No use, distribution or reproduction is permitted which does not comply with these terms.
*Correspondence: Arani Chandrapavan, QXJhbmkuQ2hhbmRyYXBhdmFuQGRwaXJkLndhLmdvdi5hdQ==