Seasonal Fish Assemblage Structure Using Environmental DNA in the Yangtze Estuary and Its Adjacent Waters
 Hui Zhang
 Susumu Yoshizawa
 Wataru Iwasaki
 Weiwei Xian
- 1CAS Key Laboratory of Marine Ecology and Environmental Sciences, Institute of Oceanology, Chinese Academy of Sciences, Qingdao, China
- 2Laboratory for Marine Ecology and Environmental Science, Qingdao National Laboratory for Marine Science and Technology, Qingdao, China
- 3Center for Ocean Mega-Science, Chinese Academy of Sciences, Qingdao, China
- 4Atmosphere and Ocean Research Institute, The University of Tokyo, Chiba, Japan
- 5Department of Biological Sciences, Graduate School of Science, The University of Tokyo, Tokyo, Japan
The fisheries resources of the Yangtze Estuary and its adjacent waters have undergone dramatic declines as a consequence of environmental changes and human activities, with traditional ecological investigations demonstrating progressive decreases in species diversity and annual numbers in the fisheries resource. Environmental DNA (eDNA) technology has been demonstrated as an effective tool by many studies for detecting fish species, monitoring fish biodiversity, and indicating the abundance of fish. In the present study, we chose the Yangtze Estuary and its adjacent waters as a primary research area to investigate fish assemblage structure using eDNA technology. A total of 50 eDNA samples were collected in the estuary in 2018. The results showed that 41 operational taxonomic units were identified from three seasons, with 18, 12, and 33 fish species associated specifically with spring, summer and autumn, respectively. The fish assemblage differed significantly among seasons. Canonical correspondence analysis showed that water temperature, salinity, and dissolved oxygen were the main environmental factors affecting structure of the seasonal assemblages. Results of the present study indicate that eDNA technology can be an effective tool not only for fisheries monitoring, but might also importantly assist marine resources conservation, sustainable exploitation of fisheries, the aquatic products processing industry, eco-friendly development, and socioeconomic stability.
Introduction
The Yangtze Estuary and its adjacent waters is an important spawning and nursery ground for many commercial fish species, and is also a large and important bait field for many species in summer and autumn (Luo and Shen, 1994). Additionally, the Yangtze Estuary is the only migration channel of the endangered species such as Chinese sturgeon, roughskin sculpin, and reeves shad. Thus, the Yangtze Estuary occupies an important ecological and economical position (Luo and Shen, 1994). In recent years, with the environmental changes and human activities, fisheries resources of the Yangtze Estuary seriously decline, and the species and numbers of fisheries resources based on the traditional ecological investigation is decreasing year by year (Zhang et al., 2015, 2016, 2019).
Environmental DNA (eDNA) refers to DNA that can be extracted from environmental samples without first isolating any target organisms (Taberlet et al., 2012). Ficetola et al. (2008) were the first to report on eDNA. By collecting eDNA samples, based on genetic analysis methods (e.g., next-generation sequencing technologies), it is possible to detect species that appear in the survey area. Recently, research conducted in various aquatic environments and concerning different species have verified the effectiveness and sensitivity of eDNA in species detection. For example, a large study conducted in the United States by the Water Conservation Center developed eDNA technology for the detection of silver carp Hypophthalmichthys molitrix and bighead carp H. nobilis in waterways connecting to the Great Lakes (Jerde et al., 2011). Goldberg et al. (2011) demonstrated the use of eDNA techniques involving DNA extraction and PCR methods for the detection of Idaho giant salamander Dicamptodon aterrimus and Rocky Mountain tailed frog Ascaphus montanus in source-water streams. Thomsen et al. (2012) showed that eDNA techniques can be effective for monitoring crustaceans, aquatic insects, aquatic mammals, birds, and terrestrial mammals in freshwater environments. Since 2012, there has been a significant increase in articles on the use of eDNA for the detection of vertebrates, including several review papers, notably those of Bohmann et al. (2014); Barnes and Turner (2016), and Rees et al. (2014), plus at least 12 papers on biosafety as mentioned by Goldberg et al. (2015). Together, these studies provide a necessary foundation for further using eDNA technology for detecting fish species and monitoring fish biodiversity in marine environments.
Marine fish stock surveys are usually carried out using sampling with nets, which is most reliable when monitoring highly abundant species but has less probability of catching valued though low-abundance fish or endangered species. Thus, as many wild fish resources continue to decrease, traditional resource survey methods may lack reliability (Magnuson et al., 1994). Numerous studies have now shown that the eDNA method can be more sensitive and efficient than traditional survey methods. For instance, Dejean et al. (2012) investigated two traditional bullfrog species in a study of alien species invasion, and compared a traditional survey method with eDNA technology; their results showed that eDNA was the more convenient and effective choice. Takahara et al. (2012) developed a method using eDNA technology for estimating the biomass of carp in experimental environments and in waters in the wild, and concluded that eDNA technology might be aptly applied to estimations of fish biomass in the wild. Davy et al. (2015) used eDNA to monitor eight species of freshwater turtles, thereby demonstrating the method's applicability to potential investigations and monitoring of endangered species. Sigsgaard et al. (2015) monitored a near-extinct species of loach in Danish waters using both traditional survey methods and eDNA techniques; the results showed that the eDNA method was reliable and cost less. Smart et al. (2016) likewise concluded that the eDNA method would be more cost-efficient than traditional methods for the purposes of aquatic taxonomy, and they explored the costs of optimizing eDNA technology. Evans et al. (2017) compared the advantages and disadvantages of the electroshock method with eDNA metabarcoding for quantifying brook trout Salvelinus fontinalis, showing that the eDNA method was more time- and labor-efficient (saving about 67% of the costs); thereby suggesting that eDNA can valuably complement other methods of investigation.
Spatial and temporal variation in fish assemblages of the Yangtze Estuary has been widely studied (Yang et al., 1990; Zhu et al., 2002; Zhong et al., 2007; Zhang et al., 2015, 2016, 2019). The changing environmental status of the Yangtze Estuary has compelled numerous studies of the seasonal variation in species composition and biodiversity, including the characteristics of the region's ichthyoplankton assemblage structure and its relationship with environmental factors, such as water temperature, depth, dissolved oxygen, and salinity.
This study utilized water samples and data on environmental conditions collected during three cruises on the Yangtze Estuary and its adjacent waters, in 2018, to characterize the estuary's fish assemblage. Especially, we applied eDNA technology to determine species composition and biodiversity, and thereby further reveal relationships between the spatial-temporal distribution patterns in the fish assemblage and prevailing environmental factors. To our knowledge, this investigation is the first attempt to use eDNA in the Yangtze Estuary and its adjacent waters for the benefit of fishery science in the region. The results should provide an improved scientific basis for management and sustainable utilization of the estuary's fisheries resources.
Materials and Methods
Sample Collection
A total of 50 eDNA samples were collected from the Yangtze Estuary and its adjacent waters (30°45′-32°00′ N, 121°00′-123°20′ E), during spring, summer and autumn cruises, in 2018. We collected 15 eDNA samples in spring and summer, and 20 in autumn. Briefly, 2-L water samples were collected at the surface using a bucket, and from bottom waters using a van Dorn sampler (Table 1 and Figure 1). Water samples were immediately filtered on the research vessel using a Sterivex™-GP filter unit without a filling bell (pore size 0.22 μm; EMD Millipore Corp.). To minimize cross-contamination, the filter funnels and measuring cups were bleached after every filtration, and 50 artificial seawaters were filtered. We then added DNA preservation buffer (Tiandz Inc.) into the filter unit. Total eDNA was extracted from each filter using a DNeasy Blood and Tissue Kit (Qiagen). To check for cross-contamination during eDNA extraction, eDNA was simultaneously extracted from deionized water. These eDNA samples and negative-control samples were obtained specifically for this study.
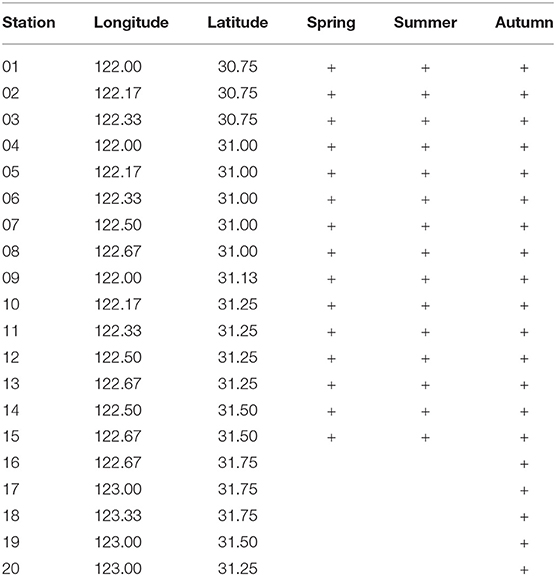
Table 1. Sampling location.
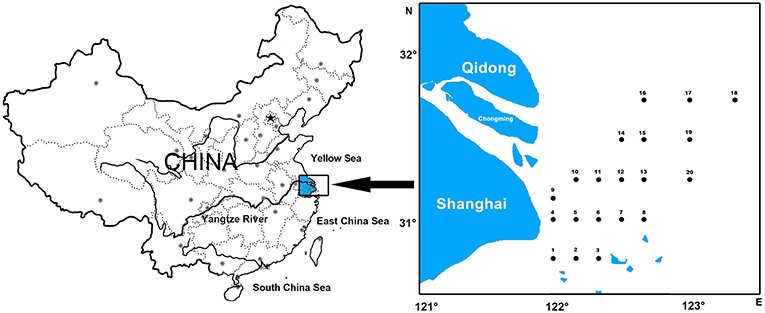
Figure 1. Sampling location.
Real-time data on the environmental parameters of the water column were measured, including water temperature (T), salinity (S), total nitrogen (TN), total phosphorus (TP), pH, suspended matter (SPM), depth (D), dissolved oxygen (DO), and chemical oxygen demand (COD). Collection of all data followed the guidelines in “Specification of Oceanographic Investigation” (GB12763-2007).
Paired-End Library Preparation on the MiSeq Platform
Amplicon libraries of partial 12S rRNA genes were obtained by PCR amplification using the universal primer pairs for fish eDNA, MiFish-U/E (Miya et al., 2015). The first PCR was performed using the two universal primer pairs. The total reaction volume was 12 μl and comprised 6.0 μl of 2 × KAPA HiFi HotStart ReadyMix, 3.6 pmol of each MiFish primer, 1 μl of template, and water. The thermal-cycle profile was: 95°C for 3 min; 35 cycles of 98°C for 20 s, 65°C for 15 s, and 72°C for 15 s; and 72°C for 5 min. The first PCR products were diluted 10 times using Milli-Q water, and used as a template for the following PCR. The second PCR was performed to add MiSeq adaptor sequences and 8 bp index sequences to both amplicon ends. The total reaction volume of the second PCR was also 12 μl, comprising 6.0 μl of 2 × KAPA HiFi HotStart ReadyMix, 3.6 pmol each of the forward and reverse primers, 1 μl of template, and water. The thermal-cycle profile for the second PCR was: 95°C for 3 min; 12 cycles of 98°C for 20 s, and 72°C for 30 s; and 72°C for 5 min. PCR amplifications were performed in triplicate for each eDNA sample. As a result, three replications of a single eDNA sample had different index sequences, allowing us to assess whether PCR replication increased the number denoting the species detected. All the indexed PCR products were pooled in an equal volume and the pooled libraries were purified by agarose gel electrophoresis. Finally, the libraries were sequenced using an Illumina MiSeq v2 Reagent Kit for 2 × 150 bp paired-end reads (Illumina, San Diego, CA, USA). We acknowledge that all samples analyzed in the present study were sequenced on a single MiSeq run, but that samples analyzed for other research projects were simultaneously sequenced on this run. The total number of reads obtained from the run was 2,308,620 for spring, 1,475,304 for summer, and 4,320,556 for autumn.
Data Quality Control and Reads Assembly
Using the program FastQC (Andrews, 2010), the tails of each MiSeq read were trimmed until the Phred quality score (related to the base-calling accuracy) of the last base was ≥20. The paired-end reads (R1 and R2 in the MiSeq platform) were then assembled using the program Flash (Magoč and Salzberg, 2011) when read pairs overlapped by more than 9 bp; reads that could not be assembled were discarded. Next, we discarded reads containing ambiguous bases (Ns). After that, because the expected amplicon length (target region + 127 bp of the first PCR primer sequences) was 297 ± 25 bp, according to comparisons of fish 12S rRNA gene sequences, reads with sequence lengths outside the range 272–322 bp were similarly discarded. In addition, chimeric reads were searched and removed using UCHIME (Edgar et al., 2011). Finally, primer sequences were removed from each read using TagCleaner. In this process, we allowed for mismatches in <4 bases in the search for primer sequences, for two reasons: the sequence of MiFish-U/E primer sets show a two-base difference in forward primers and a one-base difference in reverse primers; and, PCR can amplify fish 12S rRNA sequences even if the sequences have a few mismatches in the primer binding sites. When primer sequences were not found, the read was discarded. This data processing was implemented by the MitoFish database (Iwasaki et al., 2013) and MiFish pipeline (Sato et al., 2018; available at http://mitofish.aori.u-tokyo.ac.jp/).
Fish Species Identification
We used the same pipeline program mentioned above for taxonomic assignment of the obtained sequences. Before taxonomic assignment, MiSeq reads with an identical sequence (97% sequence similarity, E-value = 10−5) were assembled using UCLAST (Edgar et al., 2011), and assembled sequences with ≥2 MiSeq reads were subjected to a BLAST search (Camacho et al., 2009). If the sequence similarity between queries and the top BLAST hit was ≥99% and the E-value was ≤ 10−5, the assembled sequence was assigned to the top-hit species. Conversely, if the top-hit sequence was <99%, the unique sequence was not subjected to the following analyses. Note that ≥99% similarity indicates a less than two-base difference between the query and reference sequences because the maximum sequence length subjected to taxonomic assignment is 195 bp. This procedure also works as a filter for erroneous reads because erroneous reads are expected to never match the reference species DNA at ≥97% similarity by chance. After BLAST searches, assembled sequences assigned to the same species were clustered, and we considered the clustered sequences as an operational taxonomic unit (OTU). The reliability of each assignment was evaluated and classified as high, moderate, or low (Miya et al., 2015). Of those three classes, low-confidence assignments suggest that the taxon assigned to an OTU cannot be distinguished from a second candidate taxon. In the present study, MitoFish, NCBI Organelle Genome Resources were used for the BLAST search. After blast, we confirm the species name according to supplementary of Miya et al. (2015).
Fish Assemblage Structure
Fish abundance was analyzed according to the total number of reads of each species that was detected in the Yangtze River in the present study.
The Simpson index (D) and Shannon–Wiener index (H′, loge) were calculated for each season. The related equations were as follows (Ludwig and Reynolds, 1988):
Where S is the number of species, N is the total individuals, and Pi is the proportion of individuals belonging to a species to the total individuals. Calculations were carried out using the diversity function in the vegan package of R software (v3.5.3).
Nonmetric multidimensional scaling (NMDS) was used to show the seasonal difference. NMDS analysis was performed on the weighted UniFrac distance and unweighted UniFrac distance using R software (v3.5.3), and assemblage structure was described by a two-dimensional sorting graph. The thermal image was used to show the difference of assemblage composition based on the abundance distribution of the OTUs or the degree of similarity between the seasons.
Canonical correspondence analysis (CCA) was applied to analyze the correlation between environmental factors and the distribution pattern of ichthyoplankton assemblages. To eliminate the effect of few dominant species and plenty of zeros in the species data and highly variable values in the environment data, all data matrices were transformed by log(x + 1). This analysis was performed with CANOCO 5.0.
Results
Species Composition
After the quality-control process, the total number of reads obtained from the run was 2,308,620 for spring, 1,475,304 for summer, and 4,320,556 for autumn. All the reads were blasted in MitoFish, NCBI Organelle Genome Resources, and M.M.'s laboratory (the raw data is available online as Supplementary Material). A total of 41 OTUs were identified from the three seasons in the Yangtze Estuary and its adjacent waters in 2018; there were 18, 12, and 33 species separately belonging to spring, summer, and autumn, respectively (Table 2 and Figure 2), 17 species were found in at least two seasons. Due to the strong biases of species composition in different seasons, we selected the first 20 species with read numbers higher than 4,000 for further analysis, because others were detected only in autumn.
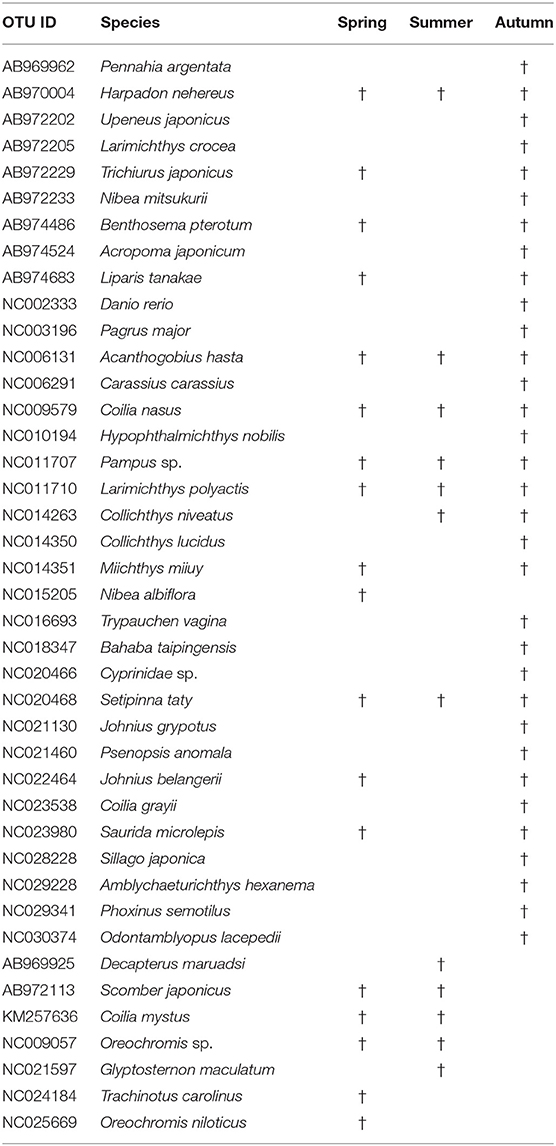
Table 2. OTUs and species information for three seasons.
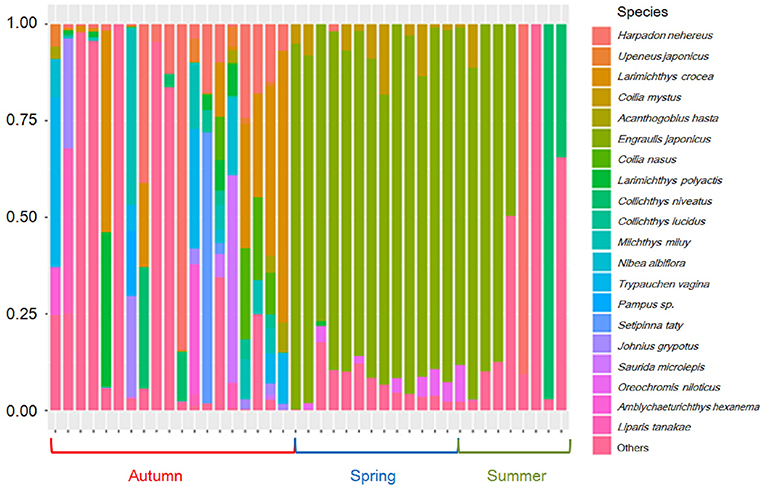
Figure 2. Species distribution in three seasons.
The dominant fish species were large yellow croaker Larimichthys crocea, Bombay duck Harpadon nehereus, Chinese drum Miichthys miiuy, burrowing goby Trypauchen vagina, Japanese grenadier anchovy Coilia nasus, the lizardfish Saurida microlepis, croaker Johnius grypotus, scaly hairfin anchovy Setipinna taty, Osbeck's grenadier anchovy Coilia mystus, and pinkgray goby Amblychaeturichthys hexanema, with read numbers all higher than 10,000.
Diversity and Seasonal Assemblage Structure
Indices D and H′ were calculated in each season to show differences among the three seasons (Table 3 and Figure 3). Autumn presented the highest diversity indexes, and summer presented the lowest (Table 3). Furthermore, according to the results of multiple comparisons, the diversity indices all differed significantly among spring, summer, and autumn (Figure 3).
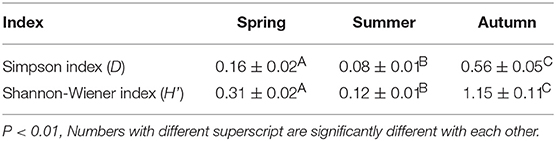
Table 3. Diversity index in different seasons.
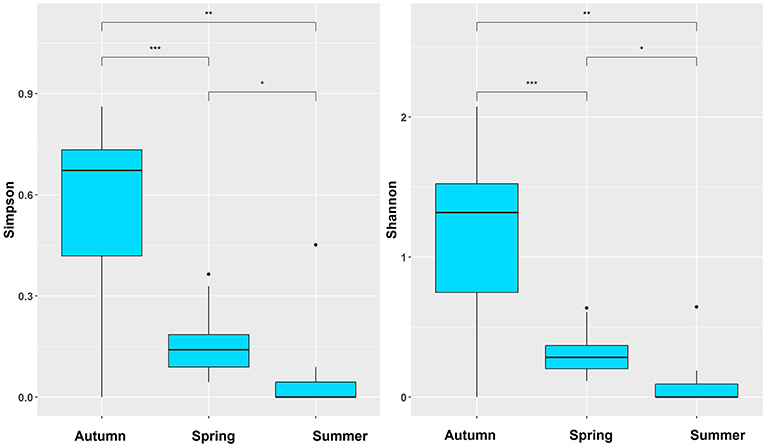
Figure 3. The seasonal difference based on Simpson and Shannon-Wiener index; *p < 0.05, **p < 0.01, ***p < 0.001.
Seasonal assemblage structure was described in a two-dimensional sorting graph based on the NMDS analysis. These results showed that the assemblage structure differed significantly among the three seasons (Figure 4). The thermal image was also used to show the difference of assemblage composition based on the abundance distribution of the OTUs or the degree of similarity among the seasons (Figure 5).
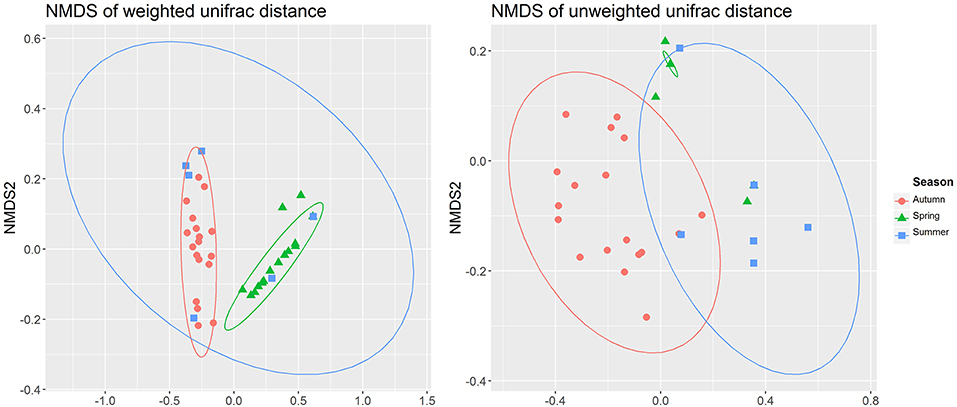
Figure 4. Two-dimensional sorting graph of NMDS analysis.

Figure 5. Thermal image shows the difference of assemblage composition; OTUs id refers to Table 2.
Relationship With Environmental Factors
The relationships between the environmental factors and the detected species were clarified in a CCA ordination diagram using data from the 20 species and the set of eight environmental factors (Table 4). A Monte-Carlo test indicated that T was the key environmental factor affecting the fish assemblages (P < 0.05); as shown in the plot, the first axis is strongly correlated with T, S, and DO.
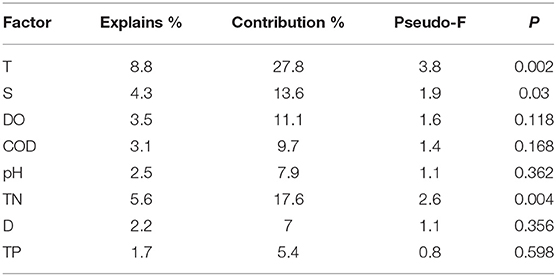
Table 4. Conditional effects and correlations of environmental variables by CCA.
As shown in the CCA ordination plot of fish species (Figure 6), the correlation between environmental factors and distributions of the different species was inconsistent, although most of the species showed a strong relationship with T and DO.
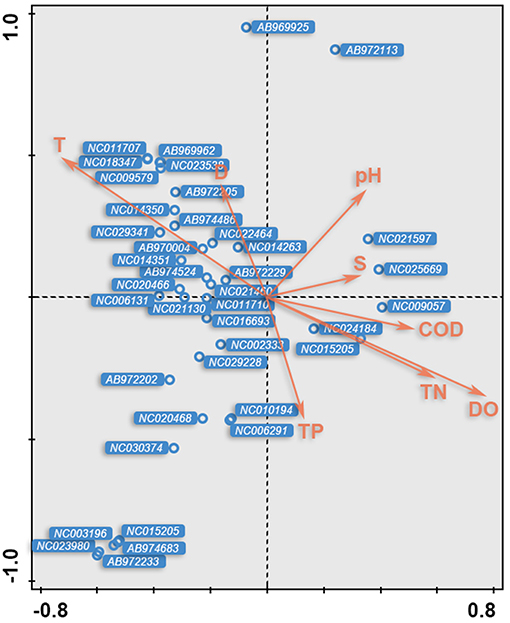
Figure 6. The CCA biplot of fish species; OTUs ID were in italic and referred to Table 2.
Discussion
The results of the present study demonstrate that eDNA can likewise be an effective tool to estimate fish species diversity, abundances, biomass, and spatial distributions in the Yangtze Estuary and its adjacent waters. As a survey method in aquatic environments, eDNA technology is less disruptive to target species and less destructive to ecosystems, and it can be used to monitor species in different vertebrate categories. For example, eDNA has been effectively used to detect the Japanese giant salamander Andrias japonicus (Fukumoto et al., 2015), the loach Misgurnus fossilis (Sigsgaard et al., 2015), Alabama sturgeon Scaphirhynchus suttkusi (Pfleger et al., 2016), and brook trout Salvelinus fontinalis (Evans et al., 2017), among other monitored species.
In recent years, studies have shown that by monitoring changes in eDNA concentrations, eDNA can be used to predict functional trends for spawning grounds, feeding grounds, and nursery habitats in a target area, with less effort and research cost and more-efficient ecological monitoring. Spear et al. (2015) used eDNA to investigate the resource of hellbender salamander Cryptobranchus alleganiensis and found that the eDNA concentration was at its highest during the animal's concealed breeding period. Erickson et al. (2016) studied the migration path and spawning location of invasive carp using eDNA techniques, and found a correlation between the eDNA concentration and the migration path. Buxton et al. (2017) found that the seasonal concentration of eDNA for northern crested newt Triturus cristatus was highest starting in June and exposed an increasing population size for juveniles starting in mid-August. Bylemans et al. (2017) demonstrated that changes in eDNA concentration were an important means of monitoring the oviposition behavior of the endangered freshwater Macquarie perch Macquaria australasica, and likewise might be used to discern the spawning periods of other fish species.
Other studies have shown that species abundance and floristic distribution could be determined based on positive correlations between eDNA concentrations and species biomass. Pilliod et al. (2013) used traditional field survey methods and eDNA to sample 13 rivers in Idaho, concluding that the eDNA method was more advantageous and that eDNA concentrations significantly positively correlated with biodensity and biomass. Maruyama et al. (2014) studied the release rate of eDNA into the freshwater environment for various developmental stages of bluegill Lepomis macrochirus and found a positive correlation between eDNA concentration and biomass, based on qPCR. Evans et al. (2016) determined the sequences of six mitochondrial gene fragments for nine freshwater species (eight fishes and one amphibian); the sequence copy number positively correlated with the abundances of the nine species. Doi et al. (2017) undertook a snorkeling survey of the Zopo River in Japan and proved a relationship between the concentration of eDNA and the abundance and biomass of ayu Plecoglossus altivelis. Pont et al. (2018) demonstrated of the capacity of eDNA metabarcoding to describe longitudinal fish assemblage patterns in a large river, and metabarcoding appears to be a reliable, cost-effective method for future monitoring. Thus, eDNA has the potential to be used as an indicator of biological abundance. Lacoursière-Roussel et al. (2016) argue that a large number of examples showing a relationship between eDNA concentration and species abundance proves that eDNA might now be feasibly and widely used in fisheries assessments.
In the present study, after quality control, the total number of reads obtained from the run was 2,308,620 for spring, 1,475,304 for summer, and 4,320,556 for autumn, with a total of 41 fish species identified in the 2018 samples across three seasons. This number is a reasonable estimate when compared with traditional surveys. For instance, Zhang (2012) identified 36 species from fish captures in the estuary in 2004 and 2007, 42 species in 2009 and 2010, and 36 species in 2011, though the species composition differed from that found in the present study (Table 5). However, the dominant species were different from the present work compared to other studies. The main reason for this should be for the net survey, IRI index is always used for determine dominant species (Zhang, 2012) while we used number of sequence reads in the present study. Other studies also suggest that eDNA analysis is a useful tool to estimate fish abundance/biomass as well as their spatial distribution (such as Doi et al., 2017).
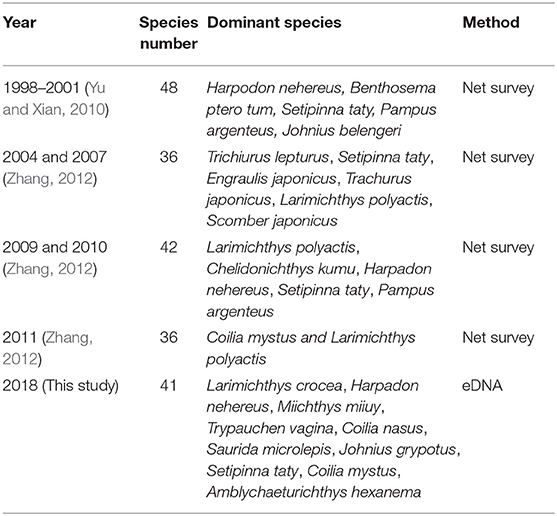
Table 5. Species composition in different years.
Besides the detection of dominant species, our eDNA analysis also distinguished several rarer fishes, namely large yellow croaker Larimichthys crocea, bighead croaker Collichthys niveatus, Pacific rudderfish Psenopsis anomala, and Gray's grenadier anchovy Coilia grayii, which were all regularly captured in the 1980s, before construction of the Three Gorges Dam (Luo and Shen, 1994), but have not been captured in recent years. This finding is particularly useful in relation to conservation of the fisheries resource in the Yangtze Estuary and its adjacent waters.
Strong seasonal changes in the composition of estuarine fish communities are relatively common (Castillo-Rivera et al., 2003), particularly in intermittently open estuaries. Many studies have shown that most estuarine fish assemblages undergo significant seasonal changes in community structure, often related to changes in the estuarine mouth phase and salinity regime (e.g., Vorwerk et al., 2003; Becker and Laurenson, 2008; James et al., 2008; Mendoza et al., 2009). However, some studies have found no seasonal patterns in the fish communities of intermittently closed estuaries, such as in southeastern Australia and along the southeast coast of South Africa; there is no clear seasonality to the mouth-opening events in these systems, which might explain the lack of seasonal patterns in the fish species composition (Griffiths, 2001; Jones and West, 2005; James et al., 2008).
In the present study, the D and H′ indices calculations, NMDS, and the thermal image showed that significant seasonal differences occur in the Yangtze Estuary and its adjacent waters. CCA indicated that T, S, and DO were the main environmental factors affecting the seasonal fish assemblages. In previous work, we attributed significant variations in the fish assemblage from 1999 to 2009 to declines in the number of fish species and biomass, leading to the succession of dominant species. Water temperature, depth, and salinity still have a strong impact on the fish assemblage, while TSM has an important influence on their spatial structure. Freshwater inflow is the critical factor determining abiotic and biotic variability (Morais et al., 2009), and has an important impact on the distribution and abundance of ichthyoplankton within an estuarine ecosystem (Faria et al., 2006). Changes in freshwater flow into an estuary and adjacent areas affect nutrient levels, with consequences for primary productivity and associated trophic chains (Morais et al., 2009). In Yangtze Estuary and its adjacent waters, there are significant differences of freshwater flow in different seasons (Luo and Shen, 1994), thus the environmental factors, especially T, S, and DO change a lot in different season. Variation in environmental factors plays a major role in partitioning fish assemblages in many estuarine systems (e.g., Akin et al., 2003, 2005). The current results suggest that the environmental factors impacting the estuary's fish assemblage have likely changed since the previous study; while it is a common phenomenon that an estuary ecosystem may undergo change, continuous ecological monitoring is needed.
The present primary study is the first case to use eDNA to determine the seasonal fish assemblage structure in the Yangtze Estuary and its adjacent waters, and ongoing research on this topic is warranted. Continuing investigation will broadly benefit the region's marine resource conservation, sustainable exploitation of fisheries, aquatic products processing, environmental-friendly development, and socioeconomic stability.
Data Availability
The datasets generated for this study can be found in the Supplementary Material.
Author Contributions
HZ wrote the first draft of the manuscript. HZ and WX collected the samples and designed the experiment. SY guided the methods. WI guided the data analysis. All the authors revised the manuscript.
Funding
This work was supported by National Natural Science Foundation of China (Nos. 41976094, U1606404, and 31872568); The International Partnership Program of Chinese Academy of Sciences (CAS-JSPS, GJHZ1885); The Youth Talent Support Program of the Laboratory for Marine Ecology and Environmental Science, Pilot National Laboratory for Marine Science, and Technology (Qingdao) (LMEES-YTSP-2018-01-12). The funders had no role in study design, data collection and analysis, decision to publish, or preparation of the manuscript.
Conflict of Interest Statement
The authors declare that the research was conducted in the absence of any commercial or financial relationships that could be construed as a potential conflict of interest.
Supplementary Material
The Supplementary Material for this article can be found online at: https://www.frontiersin.org/articles/10.3389/fmars.2019.00515/full#supplementary-material
References
Akin, S., Buhan, E., Winemiller, K. O., and Yilmaz, H. (2005). Fish assemblage structure of Koycegiz Lagoon-Estuary, Turkey: spatial and temporal distribution patterns in relation to environmental variation. Estuar. Coast. Shelf Sci. 64, 671–684. doi: 10.1016/j.ecss.2005.03.019
Akin, S., Winemiller, K. O., and Gelwick, F. P. (2003). Seasonal and spatial variations in fish and macrocrustacean assemblage structure in Mad Island Marsh estuary, Texas. Estuar. Coast. Shelf Sci. 57, 269–282. doi: 10.1016/S0272-7714(02)00354-2
Andrews, S. (2010). FastQC: A Quality-Control Tool for High-Throughput Sequence Data. Available online at: http://www.bioinformatics.babraham.ac.uk/projects/fastqc/ (accessed April 21, 2016).
Barnes, M. A., and Turner, C. R. (2016). The ecology of environmental DNA and implications for conservation genetics. Conserv. Genet. 17, 1–17. doi: 10.1007/s10592-015-0775-4
Becker, A., and Laurenson, L. J. B. (2008). Presence of fish on the shallow flooded margins of a small intermittently open estuary in southeastern Australia under variable flooding regimes. Estuar. Coast. 31, 43–52. doi: 10.1007/s12237-007-9004-9
Bohmann, K., Evans, A., Gilbert, M. T., Carvalho, G. R., Creer, S., Knapp, M., et al. (2014). Environmental DNA for wildlife biology and biodiversity monitoring. Trends Ecol. Evol. 29, 358–367. doi: 10.1016/j.tree.2014.04.003
Buxton, A. S., Groombridge, J. J., Zakaria, N. B., and Griffiths, R. A. (2017). Seasonal variation in environmental DNA in relation to population size and environmental factors. Sci. Rep. 7:46294. doi: 10.1038/srep46294
Bylemans, J., Furlan, E. M., Hardy, C. M., McGuffie, P., Lintermans, M., and Gleeson, D. M. (2017). An environmental DNA (eDNA) based method for monitoring spawning activity: a case study using the endangered Macquarie perch (Macquaria australasica). Methods Ecol. Evol. 8, 646–655. doi: 10.1111/2041-210X.12709
Camacho, C., Coulouris, G., Avagyan, V., Ma, N., Papadopoulos, J., Bealer, K., et al. (2009). BLAST+: architecture and applications. BMC Bioinformatics 10:421. doi: 10.1186/1471-2105-10-421
Castillo-Rivera, M., Zavala-Hurtado, J. A., and Zárate, R. (2003). Exploration of spatial and temporal patterns of fish diversity and composition in a tropical estuarine system of Mexico. Rev. Fish Biol. Fisher. 12, 167–177. doi: 10.1023/A:1025051027676
Davy, C. M., Kidd, A. G., and Wilson, C. C. (2015). Development and validation of environmental DNA (eDNA) markers for detection of freshwater turtles. PLoS ONE 10:e0130965. doi: 10.1371/journal.pone.0130965
Dejean, T., Valentini, A., Miquel, C., Taberlet, P., Bellemain, E., and Miaud, C. (2012). Improved detection of an alien invasive species through environmental DNA barcoding: the example of the American bullfrog Lithobates catesbeianus. J. Appl. Ecol. 49, 953–959. doi: 10.1111/j.1365-2664.2012.02171.x
Doi, H., Inui, R., Akamatsu, Y., Kanno, K., Yamanaka, H., Takahara, T., et al. (2017). Environmental DNA analysis for estimating the abundance and biomass of stream fish. Freshw. Biol. 62, 30–39. doi: 10.1111/fwb.12846
Edgar, R. C., Haas, B. J., Clemente, J. C., Quince, C., and Knight, R. (2011). UCHIME improves sensitivity and speed of chimera detection. Bioinformatics 27, 2194–2200. doi: 10.1093/bioinformatics/btr381
Erickson, R. A., Rees, C. B., Coulter, A. A., Merkes, C. M., McCalla, S. G., Touzinsky, K. F., et al. (2016). Detecting the movement and spawning activity of bigheaded carps with environmental DNA. Mol. Ecol. Resour. 16, 957–965. doi: 10.1111/1755-0998.12533
Evans, N. T., Olds, B. P., Renshaw, M. A., Turner, C. R., Li, Y., Jerde, C. L., et al. (2016). Quantification of mesocosm fish and amphibian species diversity via environmental DNA metabarcoding. Mol. Ecol. Resour. 16, 29–41. doi: 10.1111/1755-0998.12433
Evans, N. T., Shirey, P. D., Wieringa, J. G., Mahon, A. R., and Lamberti, G. A. (2017). Comparative cost and effort of fish distribution detection via environmental DNA analysis and electrofishing. Fisheries 42, 90–99. doi: 10.1080/03632415.2017.1276329
Faria, A., Morais, P., and Chicharo, M. (2006). Ichthyoplankton dynamics in the Guadiana estuary and adjacent coastal area, South-East Portugal. Estuar. Coast. Shelf Sci. 70, 85–97. doi: 10.1016/j.ecss.2006.05.032
Ficetola, G. F., Miaud, C., Pompanon, F., and Taberlet, P. (2008). Species detection using environmental DNA from water samples. Biol. Lett. 4, 423–425. doi: 10.1098/rsbl.2008.0118
Fukumoto, S., Ushimaru, A., and Minamoto, T. (2015). A basin-scale application of environmental DNA assessment for rare endemic species and closely related exotic species in rivers: a case study of giant salamanders in Japan. J. Appl. Ecol. 52, 358–365. doi: 10.1111/1365-2664.12392
Goldberg, C. S., Pilliod, D. S., Arkle, R. S., and Waits, L. P. (2011). Molecular detection of vertebrates in stream water: a demonstration using Rocky Mountain tailed frogs and Idaho giant salamanders. PLoS ONE 6:e22746. doi: 10.1371/journal.pone.0022746
Goldberg, C. S., Strickler, K. M., and Pilliod, D. S. (2015). Moving environmental DNA methods from concept to practice for monitoring aquatic macroorganisms. Biol. Conserv. 183, 1–3. doi: 10.1016/j.biocon.2014.11.040
Griffiths, S. P. (2001). Factors influencing fish composition in an Australian intermittently open estuary. Is stability salinity dependent. Estuar. Coast. Shelf Sci. 52, 739–751. doi: 10.1006/ecss.2000.0756
Iwasaki, W., Fukunaga, T., Isagozawa, R., Yamada, K., Maeda, Y., Satoh, T. P., et al. (2013). MitoFish and MitoAnnotator: a mitochondrial genome database of fish with an accurate and automatic annotation pipeline. Mol. Biol. Evol. 30, 2531–2540. doi: 10.1093/molbev/mst141
James, N. C., Whitfield, A. K., and Cowley, P. D. (2008). Long-term stability of the fish assemblages in a warm-temperate South African estuary. Estuar. Coast. Shelf Sci. 76, 723–738. doi: 10.1016/j.ecss.2007.07.036
Jerde, C. L., Mahon, A. R., Chadderton, W. L., and Lodge, D. M. (2011). Sight-unseen detection of rare aquatic species using environmental DNA. Conserv. Lett. 4, 150–157. doi: 10.1111/j.1755-263X.2010.00158.x
Jones, M. V., and West, R. J. (2005). Spatial and temporal variability of seagrass fishes in intermittently closed and open coastal lakes in southeastern Australia. Estuar. Coast. Shelf Sci. 64, 277–288. doi: 10.1016/j.ecss.2005.02.021
Lacoursière-Roussel, A., Côté, G., Leclerc, V., and Bernatchez, L. (2016). Quantifying relative fish abundance with eDNA: a promising tool for fisheries management. J. Appl. Ecol. 53, 1148–1157. doi: 10.1111/1365-2664.12598
Ludwig, J. A., and Reynolds, J. F. (1988). Statistical Ecology: A Primer in Methods and Computing. Hoboken, NJ: John Wiley and Sons.
Luo, B., and Shen, H. (1994). Impacts of the Three Gorges Project on Estuarine Ecology and Environment. Beijing: Science Press.
Magnuson, J. J., Benson, B. J., and McLain, A. S. (1994). Insights on species richness and turnover from long-term ecological research: fishes in north temperate lakes. Am. Zool. 34, 437–451. doi: 10.1093/icb/34.3.437
Magoč, T., and Salzberg, S. L. (2011). FLASH: fast length adjustment of short reads to improve genome assemblies. Bioinformatics 27, 2957–2963. doi: 10.1093/bioinformatics/btr507
Maruyama, A., Nakamura, K., Yamanaka, H., Kondoh, M., and Minamoto, T. (2014). The release rate of environmental DNA from juvenile and adult fish. PLoS ONE 9:e114639. doi: 10.1371/journal.pone.0114639
Mendoza, E., Castillo-Rivera, M., Zárate-Hernández, R., and Ortiz Burgos, S. (2009). Seasonal variations in the diversity, abundance, and composition of species in an estuarine fish community in the Tropical Eastern Pacific, Mexico. Ichthyol. Res. 56, 330–339. doi: 10.1007/s10228-009-0102-5
Miya, M., Sato, Y., Fukunaga, T., Sado, T., Poulsen, J. Y., Sato, K., et al. (2015). MiFish, a set of universal PCR primers for metabarcoding environmental DNA from fishes: detection of more than 230 subtropical marine species. Roy. Soc. Open Sci. 2:150088. doi: 10.1098/rsos.150088
Morais, P., Chícharo, M. A., and Chícharo, L. (2009). Changes in a temperate estuary during the filling of the biggest European dam. Sci. Total. Environ. 407:2245–2259. doi: 10.1016/j.scitotenv.2008.11.037
Pfleger, M. O., Rider, S. J., Johnston, C. E., and Janosik, A. M. (2016). Saving the doomed: using eDNA to aid in detection of rare sturgeon for conservation (Acipenseridae). Glob. Ecol. Conserv. 8, 99–107. doi: 10.1016/j.gecco.2016.08.008
Pilliod, D. S., Goldberg, C. S., Arkle, R. S., and Waits, L. P. (2013). Estimating occupancy and abundance of stream amphibians using environmental DNA from filtered water samples. Can. J. Fish. Aquat. Sci. 70, 1123–1130. doi: 10.1139/cjfas-2013-0047
Pont, D., Rocle, M., Valentini, A., Civade, R., Jean, P., Maire, A., et al. (2018). Environmental DNA reveals quantitative patterns of fish biodiversity in large rivers despite its downstream transportation. Sci. Rep. 8:10361. doi: 10.1038/s41598-018-28424-8
Rees, H. C., Maddison, B. C., Middleditch, D. J., Patmore, J. R. M., and Gough, K. C. (2014). The detection of aquatic animal species using environmental DNA: a review of eDNA as a survey tool in ecology. J. Appl. Ecol. 51, 1450–1459. doi: 10.1111/1365-2664.12306
Sato, Y., Miya, M., Fukunaga, T., Sado, T., and Iwasaki, W. (2018). MitoFish and MiFish pipeline: a mitochondrial genome database of fish with an analysis pipeline for environmental DNA metabarcoding. Mol. Biol. Evol. 35, 1553–1555. doi: 10.1093/molbev/msy074
Sigsgaard, E. E., Carl, H., Møller, P. R., and Thomsen, P. F. (2015). Monitoring the near-extinct European weather loach in Denmark based on environmental DNA from water samples. Biol. Conserv. 183, 46–52. doi: 10.1016/j.biocon.2014.11.023
Smart, A. S., Weeks, A. R., van Rooyen, A. R., Moore, A., McCarthy, M. A., and Tingley, R. (2016). Assessing the cost-efficiency of environmental DNA sampling. Methods Ecol. Evol. 7, 1291–1298. doi: 10.1111/2041-210X.12598
Spear, S. F., Groves, J. D., Williams, L. A., and Waits, L. P. (2015). Using environmental DNA methods to improve detectability in a hellbender (Cryptobranchus alleganiensis) monitoring program. Biol. Conserv. 183, 38–45. doi: 10.1016/j.biocon.2014.11.016
Taberlet, P., Coissac, E., Hajibabaei, M., and Rieseberg, L. H. (2012). Environmental DNA. Mol. Ecol. 21, 1789–1793. doi: 10.1111/j.1365-294X.2012.05542.x
Takahara, T., Minamoto, T., Yamanaka, H., Doi, H., and Kawabata, Z. (2012). Estimation of fish biomass using environmental DNA. PLoS ONE 7:e35868. doi: 10.1371/journal.pone.0035868
Thomsen, P. F., Kielgast, J., Iversen, L. L., Wiuf, C., Rasmussen, M., Gilbert, M. T. P., et al. (2012). Monitoring endangered freshwater biodiversity using environmental DNA. Mol. Ecol. 21, 2565–2573. doi: 10.1111/j.1365-294X.2011.05418.x
Vorwerk, P. D., Whitfield, A. K., Cowley, P. D., and Paterson, A. W. (2003). The influence of selected environmental variables on fish assemblage structure in a range of southeast African estuaries. Environ. Biol. Fish. 66, 237–247. doi: 10.1023/A:1023922521835
Yang, D. L., Wu, G. Z., and Sun, J. R. (1990). The investigation of pelagic eggs, larvae and juveniles of fishes at the mouth of the Changjiang River and adjacent areas. Oceanol. Limnol. Sin. 4, 346–355.
Yu, H. C., and Xian, W. W. (2010). Fish assemblage structure in adjacent Sea of Yangtze Estuary and its relationship with environmental factors. J. Yangtze River Sci. Res. Inst. 27, 88–92.
Zhang, H., Xian, W., and Liu, S. (2015). Ichthyoplankton assemblage structure of springs in the Yangtze Estuary revealed by biological and environmental visions. PeerJ 3:e1186. doi: 10.7717/peerj.1186
Zhang, H., Xian, W., and Liu, S. (2016). Autumn ichthyoplankton assemblage in the Yangtze Estuary shaped by environmental factors. PeerJ 4:e1922. doi: 10.7717/peerj.1922
Zhang, H., Xian, W. W., and Liu, S. D. (2019). Seasonal variations of the ichthyoplankton assemblage in the Yangtze Estuary and its relationship with environmental factors. PeerJ 7:e6482. doi: 10.7717/peerj.6482
Zhang, Y. Q. (2012). Environmental impact on the fish assemblage structure in adjacent sea area of the Yangtze River Estuary (Master's thesis). Graduate University of Chinese Academy of Sciences, Beijing, China.
Zhong, J., Wu, M., and Lian, Q. (2007). Composition of fish larvae and juveniles in spring and summer in surf zone of Yangtze Estuary. J. Fish. Sci. China. 3, 436–443. doi: 10.3321/j.issn:1005-8737.2007.03.014
Keywords: Yangtze Estuary, marine fish, assemblage structure, environmental DNA, MiSeq, seasonal assemblages
Citation: Zhang H, Yoshizawa S, Iwasaki W and Xian W (2019) Seasonal Fish Assemblage Structure Using Environmental DNA in the Yangtze Estuary and Its Adjacent Waters. Front. Mar. Sci. 6:515. doi: 10.3389/fmars.2019.00515
Received: 28 May 2019; Accepted: 05 August 2019;
Published: 03 September 2019.
Edited by:
Zhiqiang Han, Zhejiang Ocean University, ChinaReviewed by:
Xiaoshou Liu, Ocean University of China, ChinaXiubao Li, Hainan University, China
Sher Khan Panhwar, University of Karachi, Pakistan
Copyright © 2019 Zhang, Yoshizawa, Iwasaki and Xian. This is an open-access article distributed under the terms of the Creative Commons Attribution License (CC BY). The use, distribution or reproduction in other forums is permitted, provided the original author(s) and the copyright owner(s) are credited and that the original publication in this journal is cited, in accordance with accepted academic practice. No use, distribution or reproduction is permitted which does not comply with these terms.
*Correspondence: Hui Zhang, zhanghui@qdio.ac.cn; Weiwei Xian, wwxian@qdio.ac.cn