Physicochemical Controls on Zones of Higher Coral Stress Where Black Band Disease Occurs at Mākua Reef, Kaua‘i, Hawai‘i
 Ferdinand K. J. Oberle1*
  Curt D. Storlazzi1
  Olivia M. Cheriton1
  Renee K. Takesue1 Daniel J. Hoover1 Joshua B. Logan1 Christina Runyon2
  Christina A. Kellogg3 Cordell D. Johnson1
  Peter W. Swarzenski4
- 1U.S. Geological Survey, Pacific Coastal and Marine Science Center, Santa Cruz, CA, United States
- 2Department of Marine Biology, University of Hawai‘i at Mānoa, Honolulu, HI, United States
- 3U.S. Geological Survey, St. Petersburg Coastal and Marine Science Center, St. Petersburg, FL, United States
- 4International Atomic Energy Agency, Monaco, Monaco
Pervasive and sustained coral diseases contribute to the systemic degradation of reef ecosystems, however, to date an understanding of the physicochemical controls on a coral disease event is still largely lacking. Water circulation and residence times and submarine groundwater discharge (SGD) all determine the degree to which reef organisms are exposed to the variable chemistry of overlying waters; understanding these physical controls is thus necessary to interpret spatial patterns in coral health. The recent discovery of coral Black Band Disease at Mākua Reef on Kaua‘i, Hawai‘i prompted an investigation into the physicochemical drivers and geomorphic controls of reef water circulation, and the temporally variable nutrient fluxes derived from SGD. Results reveal localized stagnant water parcels at Mākua Reef where groundwater-derived high nutrient loading and low salinities act in concert as stressors to coralline health – and where Black Band Disease was uniquely identified. The observed high nutrient levels during low tide conditions are likely associated with nearby upstream cesspools and drain fields. Information obtained using such a multidisciplinary approach has direct value for successful management of coastal aquifers and the health and sustainability of adjacent nearshore coral reef ecosystems.
Introduction
Coral reefs are one of the most vulnerable marine ecosystems (Gattuso et al., 2014). They occupy less than 0.1% of the ocean floor yet play multiple important roles, housing high levels of biological diversity as well as contributing key ecosystem services such as coastal protection, fisheries habitats, and environments for tourism (Weijerman et al., 2018). On the Hawaiian Islands these services include provisioning (food, livelihoods, medicine), supporting (primary production, nutrient cycling), regulating (shoreline protection, water quality), and cultural (religion, tourism) services (Gattuso et al., 2014). The economic value of these services is of primary importance for the State of Hawai‘i, having been estimated at $34 billion (Bishop et al., 2011). Addressing the drivers of change for coral reef health is thus not only intrinsically valuable but of great societal importance.
Coral reef health is largely dependent on water chemistry, biology, and sediment dynamics, which in turn are critically controlled by water circulation and residence times on reefs (Lowe and Falter, 2015). Although submarine groundwater discharge (SGD) has been shown to be a significant driver in the exchange of coastal materials, SGD is rarely put into the context of circulation on coral reefs. Coastal SGD is a highly dynamic and complex hydrogeological phenomenon that involves both terrestrial and marine drivers. These drivers determine the amount and rate of submarine discharge into the coastal sea, and this discharge also includes the exchange of water masses through seawater intrusion into the aquifer (Zektser and Dzyuba, 2014). SGD is geochemically distinct and typically enriched in dissolved solutes relative to both fresh waters and the receiving marine waters (Slomp and Van Cappellen, 2004), and as a result may affect coral reef ecosystems. Few studies have shown that SGD has a large impact on coral reef health (Cyronak et al., 2013). This is somewhat surprising, considering that SGD into the marine environment is thought to be of the same order of magnitude as riverine discharge worldwide (Moore, 2010; Kwon et al., 2014). SGD has been shown to alter the temperature, salinity, and nutrient loading of seawater and to introduce anthropogenic substances from land including toxins, pathogens, and other pollutants (Taniguchi et al., 2002; Burnett et al., 2006; Paytan et al., 2006; Swarzenski et al., 2006). On oceanic high volcanic islands such as the Hawaiian archipelago that are generally considered oligotrophic regions, SGD is an important source of freshwater, nutrients, and toxins to the coastal zone (Dollar and Atkinson, 1992; Garrison et al., 2003; Kim, 2003; Paytan et al., 2006; Street et al., 2008; Cardenas et al., 2010; Swarzenski et al., 2013). As a result, SGD can impact marine biotic communities by delivering elevated nutrient loads that may lead to eutrophication, decreased coral abundance and diversity, and increased algal abundance (Fabricius, 2005; Lapointe et al., 2005; Abaya et al., 2018), as well as low pH water that can cause coastal acidification (Wang et al., 2014; Prouty et al., 2017). Septic leachate and fertilizers can lead to eutrophication and alter ecosystem structures that shift reefs from being dominated by corals to being dominated by algae (Andréfouët et al., 2002; Hughes et al., 2007) and increase reef vulnerability to coral diseases (Bruno et al., 2003; Redding et al., 2013).
Most of these impacts, however, are likely dependent on water motion (Monismith, 2007; Hearn, 2011; Storlazzi et al., 2018). Due to the high proximity of land-based sediment and nutrient and dissolved materials sources, water circulation patterns on a reef-scale affect reef metabolism and calcification rates (Wyatt et al., 2010; Zhang and Mandal, 2012; Prouty et al., 2017). Water circulation patterns also affect larval retention, export, and connectivity between reefs (Tay et al., 2012; Storlazzi et al., 2017). The principal impact of stressors on coral reefs can be reduced to two opposing water circulation processes that either disperse or concentrate stressors (Erftemeijer et al., 2012; Shedrawi et al., 2017; Storlazzi et al., 2018). Consequently, knowing spatial water circulation patterns in conjunction with SGD is critical for interpreting spatial and temporal variations in stressors on reefs and their relation to overall coral health (Storlazzi et al., 2004, 2009; Presto et al., 2006; Hoeke et al., 2013).
Wave, wind, and tidal forcing are commonly the dominant drivers of flows over fringing coral reefs (Storlazzi et al., 2004; Presto et al., 2006; Hench et al., 2008). Differences in reef morphology relative to the orientation of oceanographic and meteorological forcing can generate heterogeneous waves and currents over small spatial scales (tens of m) (Storlazzi et al., 2018). Hench et al. (2008) and Monismith (2014) have shown that current speeds over reefs typically scale linearly with the height of waves breaking on the reef crest. On the other hand, wind forcing can dominate shallow reefs protected from swell (Yamano et al., 1998; Presto et al., 2006). Tides affect both wind-driven currents by regulating water depth for wind–wave development (Presto et al., 2006) and wave-driven currents by controlling wave energy propagation onto the reef flat (Falter et al., 2004; Storlazzi et al., 2004). In wave-driven systems, flows over fringing reefs are controlled by bathymetry and are characterized by rapid, cross-shore flow near the shallow reef crest that slows moving shoreward and turns alongshore toward channels, where water returns seaward (Hench et al., 2008; Lowe et al., 2009; Wyatt et al., 2010; Storlazzi et al., 2018). Current speeds in wind-driven systems typically respond linearly with wind speed and direction, and are primarily directed downwind with cross-shore flow over the reef crest (Storlazzi et al., 2004; Presto et al., 2006; Monismith, 2014). In general, all water circulation regimes over reefs are controlled by their bathymetry and the annual distribution of episodic wave and wind events, as well as prevailing trade winds. Recent studies by Storlazzi et al. (2018) have shown that high-resolution reef circulation patterns can be measured with current drifters. Although these drifters can provide useful spatial coverage that measure flow patterns across spatially heterogeneous coral reefs, their application is generally limited in time (Falter et al., 2008; Wyatt et al., 2012) and, thus, it is important to put Lagrangian measurements into a temporally extensive Eularian context.
The Mākua (“Tunnels”) Reef to the west of Hanalei Bay on the north coast of Kaua‘i, Hawai‘i, United States, was noted by the US Coral Reef Task Force as a place of concern due to the outbreak of Black Band Disease (BBD) there and elsewhere on Kaua‘i (Aeby et al., 2015). Although BBD is prevalent in the Indo-Pacific (Antonius, 1985; Willis et al., 2004; Page and Willis, 2006; Sato et al., 2016), Kaua‘i is the only Hawaiian island known to be affected (Aeby et al., 2015). The disease, initially termed Montipora Banded Tissue Loss, because it affects mostly this species on Kaua‘i, was later identified as BBD, and has been monitored since 2012 (Runyon et al., 2015). BBD is characterized by a dark mat containing a microbial consortium of cyanobacteria and sulfur-cycling bacteria that lyses tissue as the mat moves across the coral surface (Ducklow and Mitchell, 1979; Sato et al., 2016) (Figure 1).
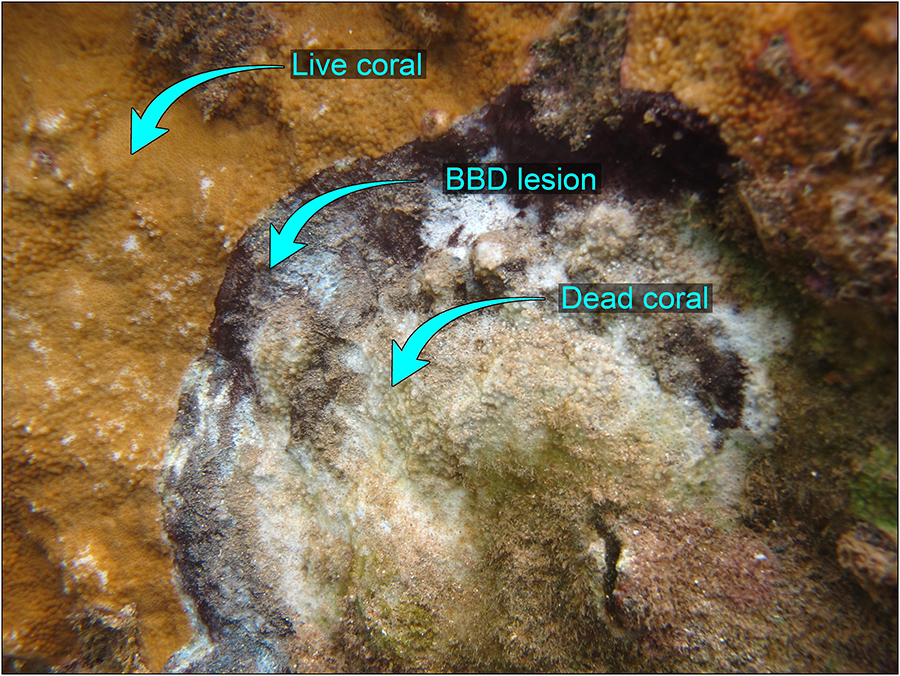
Figure 1. Black Band Disease observed on Montipora capitata coral at Mākua, 4 Aug. 2016 Kaua‘i.
The BBD outbreak on Kaua‘i followed one of the biggest rainfall years on record and the majority of BBD was found close to shore (Figure 2). One study in the vicinity (2 km west; Knee et al., 2008) showed that SGD nutrient flux was significantly greater than the nutrient flux associated with surface water runoff, and accounted for over 70% of the total coastal nutrient discharge. Similarly, a modeling study in the area (Delevaux et al., 2018) suggested that SGD is an essential terrestrial driver of coral reef health. With submarine groundwater discharging a given concentration of land-derived nutrients and contaminants, the water circulation acting on this source is the dominant control on the ultimate exposure of coral reefs to these stressors; as such, a better understanding of their patterns and relations to SGD may aid in the ongoing search for the causative factors of BBD that still remain largely unknown (Sato et al., 2016).
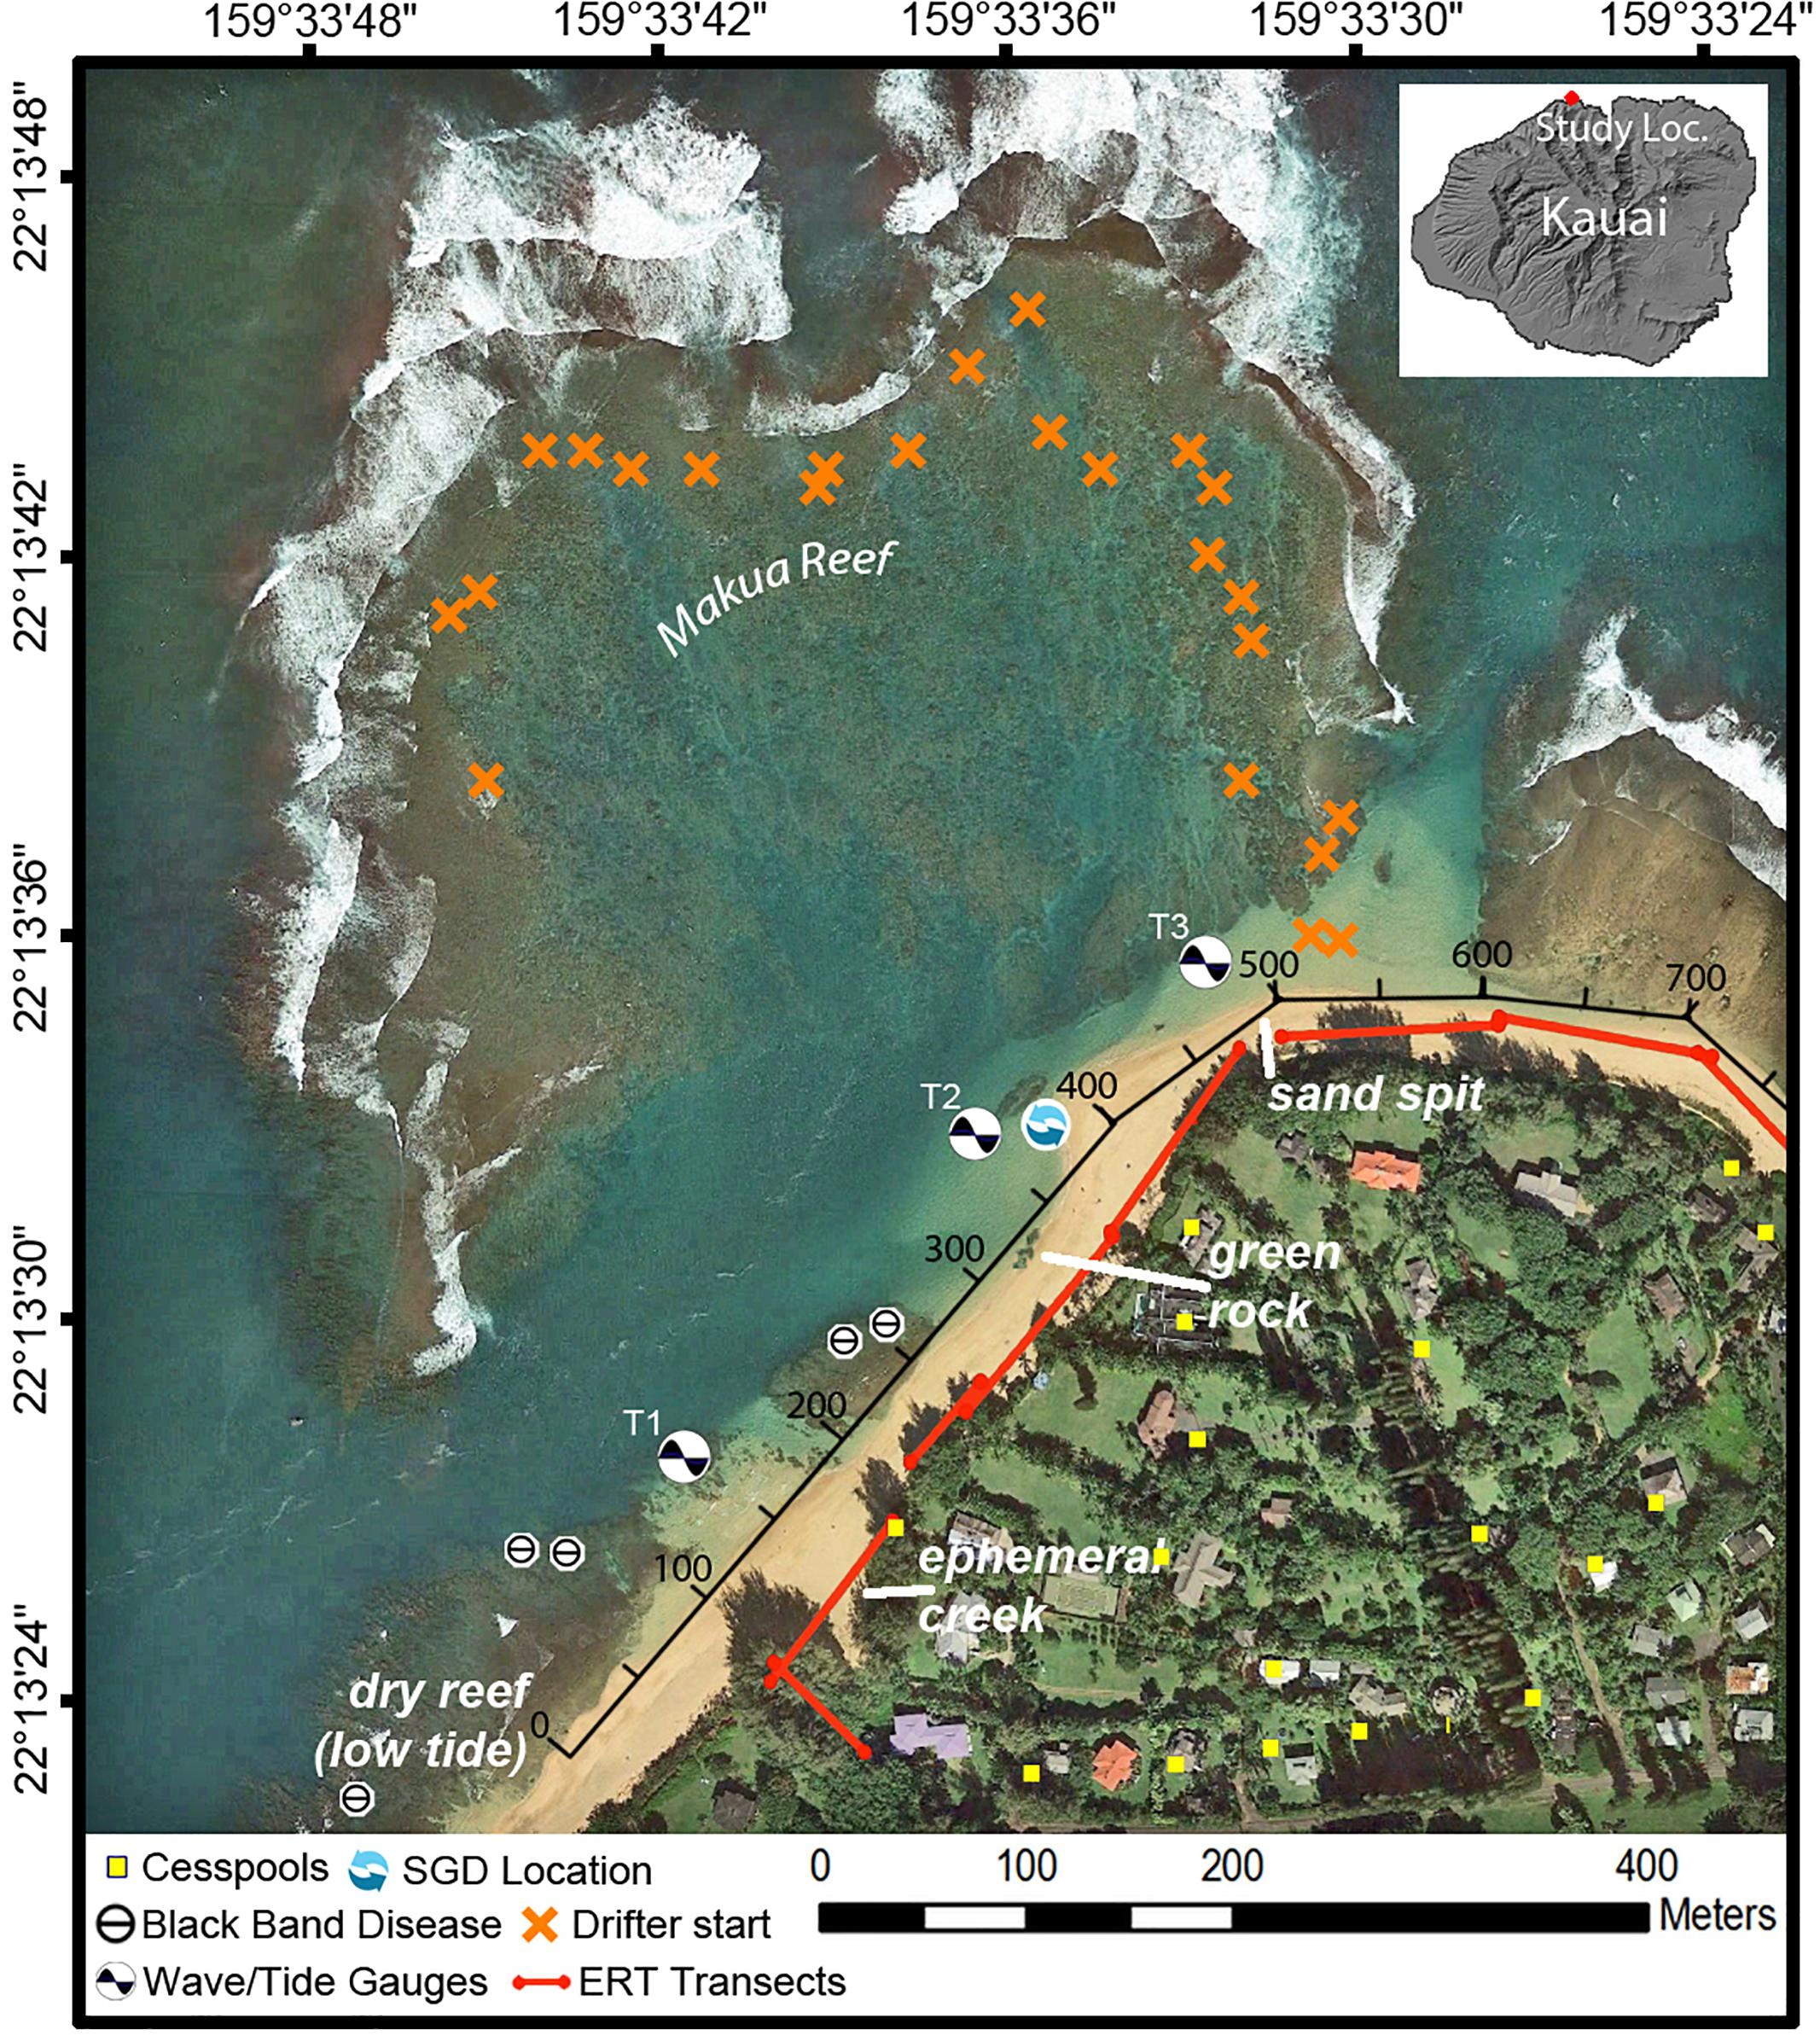
Figure 2. Map of Mākua Reef, Kaua‘i, Hawai‘i, including locations of instruments, cesspools (Department of Health [Doh], 2018), and points where coral Black Band Disease had been previously identified (Runyon et al., 2015), consistent with the identification points found during this study. The along-shore distance track (black axis along beach) indicates the along-shore distance (m) used in Figures 5–7, 9.
To try to address the potential linkages between SGD, land-based pollution, as well as circulation and residence time and exposure to BBD, the U.S. Geological Survey and the University of Hawai‘i conducted an interdisciplinary experiment at Mākua Reef in the summer of 2016. Temporally- and spatially-extensive oceanographic measurements were combined with SGD analysis and nutrient measurements to test the fundamental hypothesis that water residence times may influence the biophysical processes that shape coral reef health. The findings of this study at Mākua Reef are likely applicable to other places where BBD outbreaks have occurred adjacent to high human populations.
STUDY AREA
The north coast of Kaua‘i, Hawai‘i, United States, is composed of volcanic basalt. Although basalt is the dominant rock type on Kaua‘i’s north shore, unconsolidated sedimentary deposits also occur sporadically along the coast. These sedimentary deposits and underlying weathered volcanic rocks can consolidate to form a low-permeability confining unit (“caprock”), which can restrict the flow of groundwater discharge at the coast (Macdonald et al., 1960; Izuka et al., 2018). The shoreline is characterized mostly by fringing reef systems and embayments (Battista et al., 2007). The beaches tend to be steep and are composed of coarse-grained calcareous sand (Fletcher et al., 2012). All data were collected along the beach and in nearshore waters within the Mākua (“Tunnels”) Reef area to the west of Hanalei Bay on the north shore of Kaua‘i (Figure 2) from 30 July to 4 August 2016.
Within the study area, the beach has three dominant features: an ephemeral creek where beach access is located; a large macroalgae-covered caprock referred to by the locals as “green rock”; and a sand spit at the most northern extension of the study area (Figure 2). A number of the datasets of this study were collected along the shore of the study area and are thus indicated with an alongshore reference distance in meters (Figure 2).
The physical environment offshore of the reef during the summer was described in Storlazzi et al. (2009) and is briefly summarized here. The study area is exposed to large North Pacific swell in winter and northeast trade wind waves throughout the year. During the summer, trade winds generate wave heights of 1–3 m with periods of 5–8 s. The area has a mixed, semi-diurnal microtidal regime, with the mean daily tidal range ∼0.6 m and the minimum and maximum daily tidal ranges at 0.4 and 0.9 m, respectively. Offshore current speeds under trade-wind forcing are on the order of 0.1–0.2 m/s (Hoeke et al., 2013). The fringing/pseudo-barrier reef at Mākua ranges in depth from 0.5 m to ∼20 m and hosts coral communities that are considered relatively healthy (Battista et al., 2007).
Materials and Methods
From 30 July through 4 August 2016 oceanographic and SGD measurements were collected within Mākua Reef and along the shoreline. The suite of circulation observations included an array of fixed-point (Eulerian) instruments, as well as repetitive, high-spatial density, custom-made drifter (Lagrangian) deployments.
Eulerian Oceanographic Measurements
An array of three bottom-mounted instrument packages were deployed in an alongshore array within Mākua Reef (T1, T2, T3). Each of these instrument packages included an RBR solo D-wave pressure gauge, an upwards-looking Nortek Aquadopp acoustic Doppler profiler (ADP), and an Onset Computer HOBO Water Temperature v2 Pro logger. The T1 and T2 sites were at about 2 m water depth, whereas the T3 site was within a channel at about 7 m depth. An additional pressure gauge and temperature logger were deployed 1 km offshore and north of the reef at about 12 m water depth (T0).
Wave energy spectra S(f), peak period (Tp), peak period, (Tp) were calculated from wave pressure gauges using methodologies detailed in Cheriton et al. (2016). Tide levels were computed as the deviation in water level from the mean using the T0 hourly-averaged measurements.
The ADPs collected a vertical profile of current velocity every 20 min. These profiles were 1000 s (∼17 min) averages. Each profile consisted of 0.5 m vertical bins, with a 0.1 m blanking distance above the transducers, extending to within 10% of the surface. At T1 and T2, this resulted in 3–4 vertical bins of useable data, whereas at T3 there were 11–12 useable bins. The HOBO loggers measured temperature every 2 min. The current velocity components were rotated to align with the alongshore direction, which was also aligned with the channel axis.
Lagrangian Oceanographic Measurements
Fine-scale, Integrated Drifters for Oceanography (FIDO) were developed as an advancement upon the Lagrangian ocean surface current drifters detailed in Storlazzi et al. (2018). Instead of just internally-logging GPS units, new custom-made drifter subsurface bodies housed Garmin T5 GPS-enabled dog collar tracking units that could be tracked real-time via Garmin Astro-430 hand-held units. The plastic cruciform-shaped drifter bodies were produced by a 3-D printer and had 15 cm wide and 10 cm high polypropylene plastic fins attached. The Garmin T5 units were mounted vertically in the plastic body and capped with a 4 cm high, 15 cm diameter cylinder of closed-cell foam that, when fully constructed, resulted in the top of the foam floating at sea level; the GPS antenna was mounted horizontally on top of the foam cylinder and the MURS-frequency whip antenna was lashed vertically to a 25 cm tall fiberglass rod (Figure 3). In total, 20 FIDOs were constructed and tracked by two Garmin Astro-430 hand-held units on kayak, and a fixed base station connected to a PC laptop. The Garmin T5 units logged positions internally once every 5 s and transmitted their position every 5–10 s. The higher-resolution, internally recorded position data was downloaded from each unit after recovery. During each deployment, 7 FIDOs were released at 7 fixed sites across Mākua Reef and tracked until they exited the reef to the west and headed out of the study area. FIDO deployments occurred both during both high and low tide throughout the study period (see Figure 3C for deployment times).
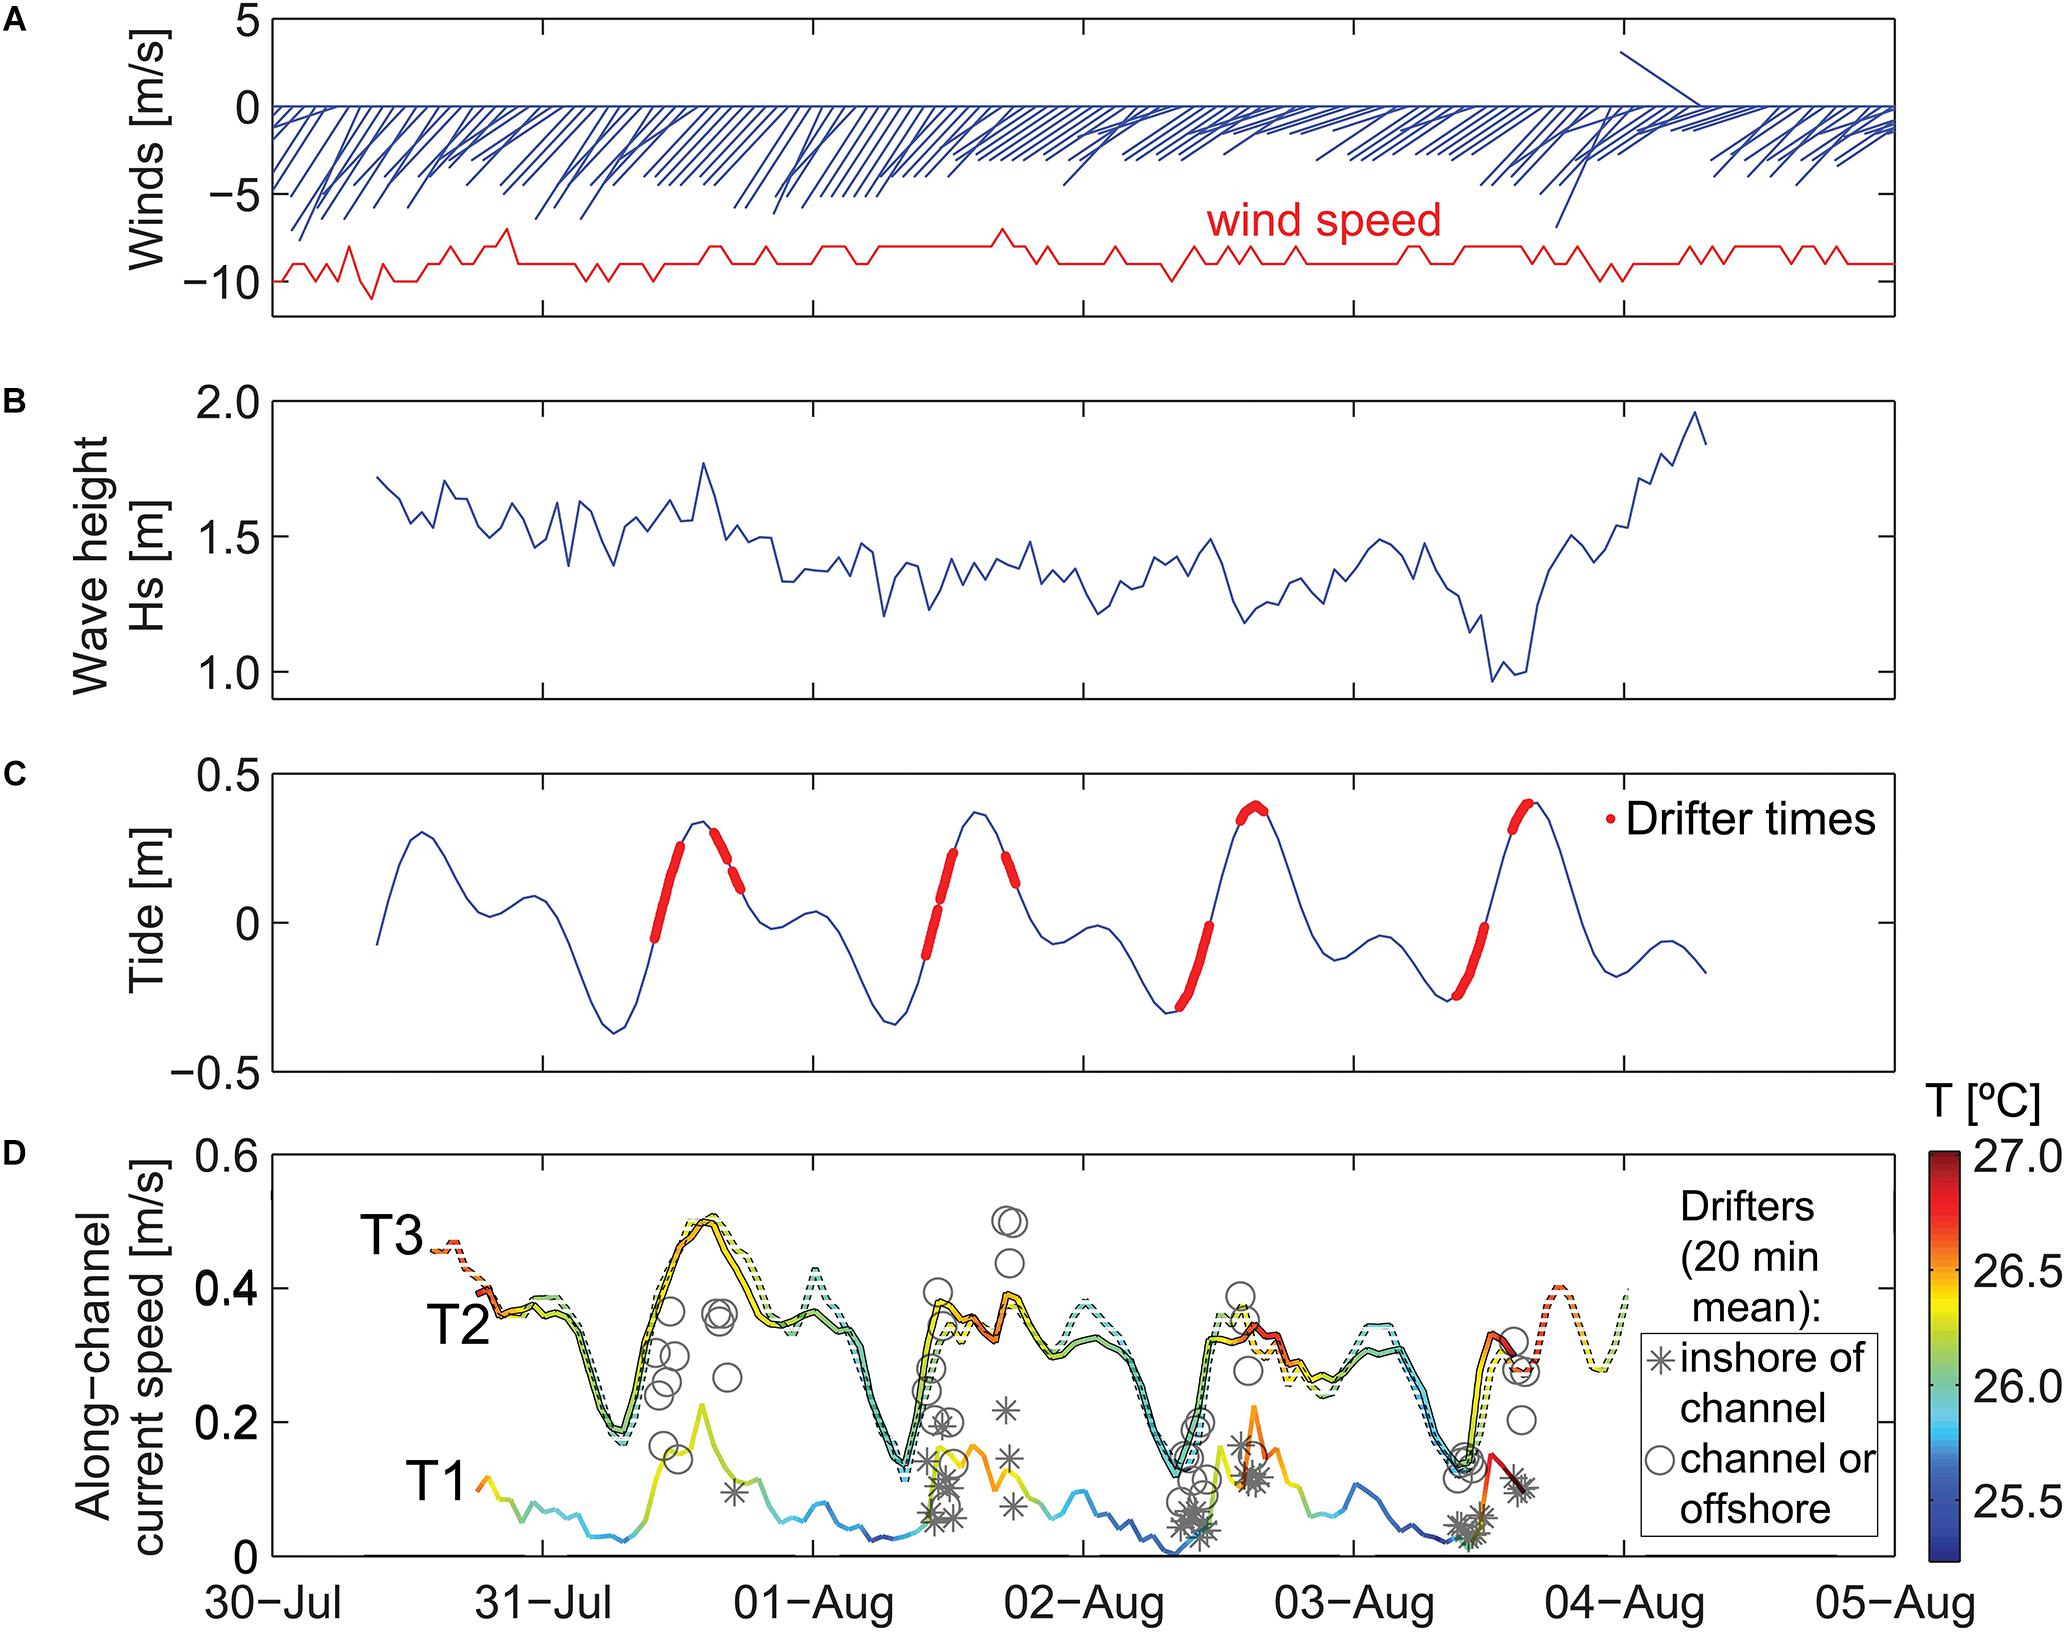
Figure 3. Time series of meteorological and oceanographic data used to define time periods of different forcing conditions. Scale is in local time (HST). (A) Wind speed and direction. (B) Offshore significant wave height. (C) Offshore tidal height. (D) Water temperatures on the reef and depth-averaged alongshore current speeds on the reef. Wind vectors denote direction “to” in degrees from true north. Note the temporal variability in waves and current speeds on the reef that indicate waves are smallest, temperature is lowest, and current speeds are slowest during low tides when the offshore waves are small.
Salinity and Temperature
Rainfall was measured at a gage located 6 km upslope of the study area as well as at the closest coastal gage 6 km east of the study area. Measurements of surface salinity over the study area were temporary offset from rainfall events by several hours to allow for mixing and flushing (see Meteorological Forcing Data for details). Groundwater in Hawai‘i generally is colder than nearshore ocean waters, so local reductions in salinity and temperature can be used to identify groundwater inputs. Because fresh water floats on salt water, surface water surveys were collected by towing a Castaway CTD System, which provided GPS-referenced temperature, salinity, and water depth measurements at 5 Hz. Surveys were performed by towing the unit ∼10 cm below the surface by foot or off of a kayak. All but one of the CTD surveys were carried out during low tide, when SGD volumes were expected to be at their maximum (Oberle et al., 2017). Near bed temperatures were also collected at the three wave tide gauges located within the study area (Figure 2).
Electrical Resistivity Tomography (ERT) Surveys
The utility of electrical resistivity to examine the dynamics and scales of the freshwater/saltwater interface in coastal groundwater is well established (Manheim et al., 2004; Swarzenski et al., 2006, 2007; Oberle et al., 2017). During the study period, time-series multichannel, electrical resistivity tomography (ERT) surveys were conducted along eight transects (Figure 2) during low tides. Transects were aligned parallel to the shoreline (except for the perpendicular transect near the ephemeral creek) and located ∼0.75 m above mean sea level. An AGI SuperSting R8 system was used to measure the electrical resistivity of the subsurface waters along a 56-electrode cable (electrodes spaced 2 m apart). Each electrode was pinned to the underlying sediment with a 35 cm stainless steel spike. The electrical resistivity measurements were acquired using a dipole-dipole array setting. The relative elevation of each electrode was carefully kept at a constant height. The primary aim of the ERT surveys was to identify SGD hotspots along the beachfront, so that SGD flux could then be calculated for these hotspots.
Submarine Groundwater Discharge (SGD) Measurements
The utility of 222Rn as a water mass tracer is well-proven to study rates of SGD due to its very short half-life (3.8 days) and its multifold enrichment in groundwater relative to surface water (Swarzenski, 2007). Durridge RAD7 radon detection systems were employed to measure Rn in air using a water/air exchanger. This setup allows for a near real-time calculation of the aqueous Rn concentration by measuring the air 222Rn concentration and knowing the temperature-dependent 222Rn partitioning coefficient (Burnett and Dulaiova, 2003; Burnett et al., 2003, 2006; Dulaiova et al., 2006; Swarzenski et al., 2006; Schubert et al., 2012). An additional onsite monitoring station was set up with a piezometer into a submerged spring at 1 m depth, ∼20 m upslope from the discharge area to establish a 222Rn groundwater endmember.
222Rn time-series measurements were taken every 30 min for 12 h. The 222Rn endmember value was established after measurements at peak values had fully leveled (n = 10). The results were compared with the endmember values established by Knee et al. (2008) for a well 1km west of the study site. For the 222Rn time-series, the surface- and bottom-waters were instrumented with Solinst LTC Leveloggers that continuously measured pressure, conductivity, and temperature of ambient seawater. A simple non-steady state radon mass-balance box model was then employed for calculations of SGD following methods developed by Burnett and Dulaiova (Burnett and Dulaiova, 2003; Burnett et al., 2006). In general, this box model accounts for radon sources from (a) total benthic fluxes via submarine groundwater discharge (SGD); (b) diffusion from sediments; and (c) production from dissolved 226Ra. Radon losses were calculated by including gas evasion, radioactive decay, and mixing with offshore radon-depleted water. In all cases, the excess inventory per time (i.e., differences between source and sink fluxes) was divided by radon concentration in groundwater (i.e., groundwater endmember) to calculate groundwater discharge. Site locations for these surface water time-series deployments (Figure 2) were strategically placed based on results from the ERT surveys and assumptions regarding gradients in oceanographic, geologic, and hydrologic controls.
Major Nutrients
Nutrients were sampled during high and low tide by two separate sampling teams and, as a result, sampling methodologies differed slightly. Low tide samples were taken from 10 nearshore locations spanning the entire distance of the study site (Figure 2) for possible linkage to SGD. Due to fieldwork time constraints high tide nutrient samples were only collected at two locations where high SGD was suspected and Black Band Disease had been identified (Figure 2).
Low tide nutrients were sampled on 1 August 2016 between 7:00 and 8:30 (all reported times in HST), as beach sediment and ambient water (pore water and overlying water). Samples were collected at 0.5–1.0 m (MLLW) water depth in polypropylene jars, stored in the dark, and frozen within 4 h of collection. Whole sediment and water samples were defrosted and decanted, and the liquid portion filtered through 0.2 μm pore size polyethersulfone syringe-tip filters. Filtered seawater was stored frozen until analysis. In low tide samples inorganic nutrients nitrate + nitrite (N), phosphate (P), and silicate (Si) were analyzed by flow-injection colorimtetry (Lachat QuikChem8000) at the University of California at Santa Cruz Institute of Marine Sciences. Standards and blanks were run every 10 samples to correct for instrument drift. The relative standard deviation of four in-run standards was less than 5% for all analyses, and detection limits, defined as three times the standard deviation of the blank, were less than 0.1 μmol/L for all analytes. Conductivity was measured with an Orion 3-Star portable conductivity meter. It is important to note that the freezing of whole seawater samples can cause plankton cells to rupture and add cytoplasmic nutrients to whole water samples. In order to capture this effect, N:P ratios were investigated and it was found that all but one sample had lower ratios than those typically found in coastal plankton in the region (median = 17, n = 4; Laws et al., 1984), an indication that cellular leakage of N and P did not have a large effect on the sampled nutrients.
High tide samples were collected from 1 to 3 August 2016 as subsamples from 10 l water samples obtained using a peristaltic pump and tubing from water just above the seafloor. All samples were collected at mid-day, between 11:50 a.m. and 12:50 p.m. local time, through a 0.8 μm inline filter. Temperature (±0.2°C), salinity (±1.0% of reading or 0.1 ppt, whichever was greater), and dissolved oxygen (±0.1 mg/l) were measured using a YSI multimeter in a bucket filled with pumped water after the subsample bottle was filled and sealed. Salinity was calculated within the multimeter based on conductivity (±1.0% of reading or 0.001 μS/cm, whichever was greater) and temperature measurements. The YSI multimeter was calibrated using 50,000 μS/cm ± 1% at 25°C conductivity standards from YSI. This calibration was done at the beginning of sampling at each study site and when batteries were changed. Twenty milliliter per site per day were filtered through a 0.20 μm syringe filter into a vial and immediately frozen until analysis. Samples were processed within an hour of collection. High tide water samples were analyzed for the dissolved nutrients nitrate [NO3–], ammonium [NH4+], phosphate [PO43–], and silicate [Si] at the Woods Hole Oceanographic Institution nutrient laboratory.
Meteorological Forcing Data
Hourly wind velocity and precipitation data were obtained from the MKAH1 station on Makaha Ridge (22.1298°N, 159.7224°W), located ∼19 km southwest of the study area. This weather station is maintained by the Bureau of Land Management, and the data were downloaded from the University of Utah’s MesoWest website1. Daily precipitation data were also obtained from the closest NOAA operated rain gauge in Princeville (station #5181652) and an upslope USGS maintained rain gauge (station #2209271593550013).
Coral Surveys
Field surveys for BBD were initiated by performing a rapid area survey following Aeby et al. (2015) where divers swam from shore out to the reef crest and all Montipora spp. colonies along an ∼6 m wide swath were examined. After this, point-intercept method (Hill and Wilkinson, 2004) was employed to characterize coral cover and BBD lesions. Coral colonies were counted by genera along replicate belt transects (25 m × 2 m) at 25 cm intervals. All corals with BBD lesions were identified along wider 25 × 6 m transects. Survey sites ranged in depth between 1 and 12 m and surveys were repeated each summer from July 2013 to September 2015. The outer reef was not surveyed due to high wave and current activities. Detailed results from these surveys on prevalence and BBD abundance have previously been published (Runyon et al., 2015) and showed, in brief, that BBD was identified each consecutive year. BBD locations were confirmed in September 2016 during this study and are shown in Figure 2. This research was conducted under Special Activity Permit No. 2013–16 issued by the Hawai‘i Division of Aquatic Resources.
Results
Meteorological and Oceanographic Forcing
During the study period, winds exhibited a trade-wind pattern, with sustained wind speed of ∼10 m/s out of the northeast (Figure 3A). Offshore wave heights were initially elevated, with Hs ∼ 1.8 m and Hmax up to 2.7 m, and then decreased slightly over the 4 days study period (Figure 3B). The tides at the study site were mixed semidiurnal, with two high and two low tides for each tidal day. During the study, the maximum tidal range was ∼0.8 m (Figure 3C).
Waves and Circulation
Waves inside Mākua Reef were strongly depth-limited, with larger Hs during high tides and smaller Hs at low tides. The current meter sites and drifter tracks were separated according to the 5 m isobath inshore of the channel. Depth-averaged flow at T1 and the drifter velocities measured inshore of this boundary were, on average, 3–4 times slower than those within the channel and farther offshore (Figure 3D). The inshore velocities were also more strongly correlated with water levels (R = 0.85 for T1, compared to R = 0.75 at T2 and R = 0.63 at T3). All three reef sites had depth-averaged flows that were consistently directed alongshore, out of the channel to the southwest. T2 and T3 had very similar current magnitudes, ranging from ∼0.2 m/s at low tide to 0.4–0.5 m/s at high tide, whereas T1, which was further from the channel, had much slower current speeds, ranging from <0.1 to 0.2 m/s (Figure 3D). The current speeds at T1 and T2 were faster at the beginning of the study, when offshore incident wave heights were larger. This pattern was likely a result of increased onshore transport of water into the reef from enhanced wave breaking over the reef crest. Bottom temperature measured at the current meters inside the reef also fluctuated with the surface tides, with warmer near-bed temperatures during high tides and the coolest temperatures at low tide.
The Lagrangian drifter tracks exhibited spatial patterns related to geomorphology and temporal patterns related to physical forcing (Figure 4). Under all forcing conditions, of the surface flow over the outer to mid-reef was toward shore (southward) and then closer to shore the flow turned shore-parallel, directed out the channel (southwestward). The fastest surface current speeds were over the outer reef flat, just inshore of the reef crest and in the southwest channel; whereas the slowest surface speeds were close to the shoreline (within 5 m horizontal distance) (Figures 4A,B). Using these circulation patterns as a proxy for local residence times, the shortest water residence times occurred in the outer to mid-reef flat and inside the channel, while the longest residence times were found inshore of the channel, along the shoreline (Figures 4C,D). Reef circulation current speeds increased with higher water levels (Figure 4) and under larger offshore wave forcing (Figure 3D), indicating that residence times would be longest under lower water levels and low-energy offshore wave conditions.
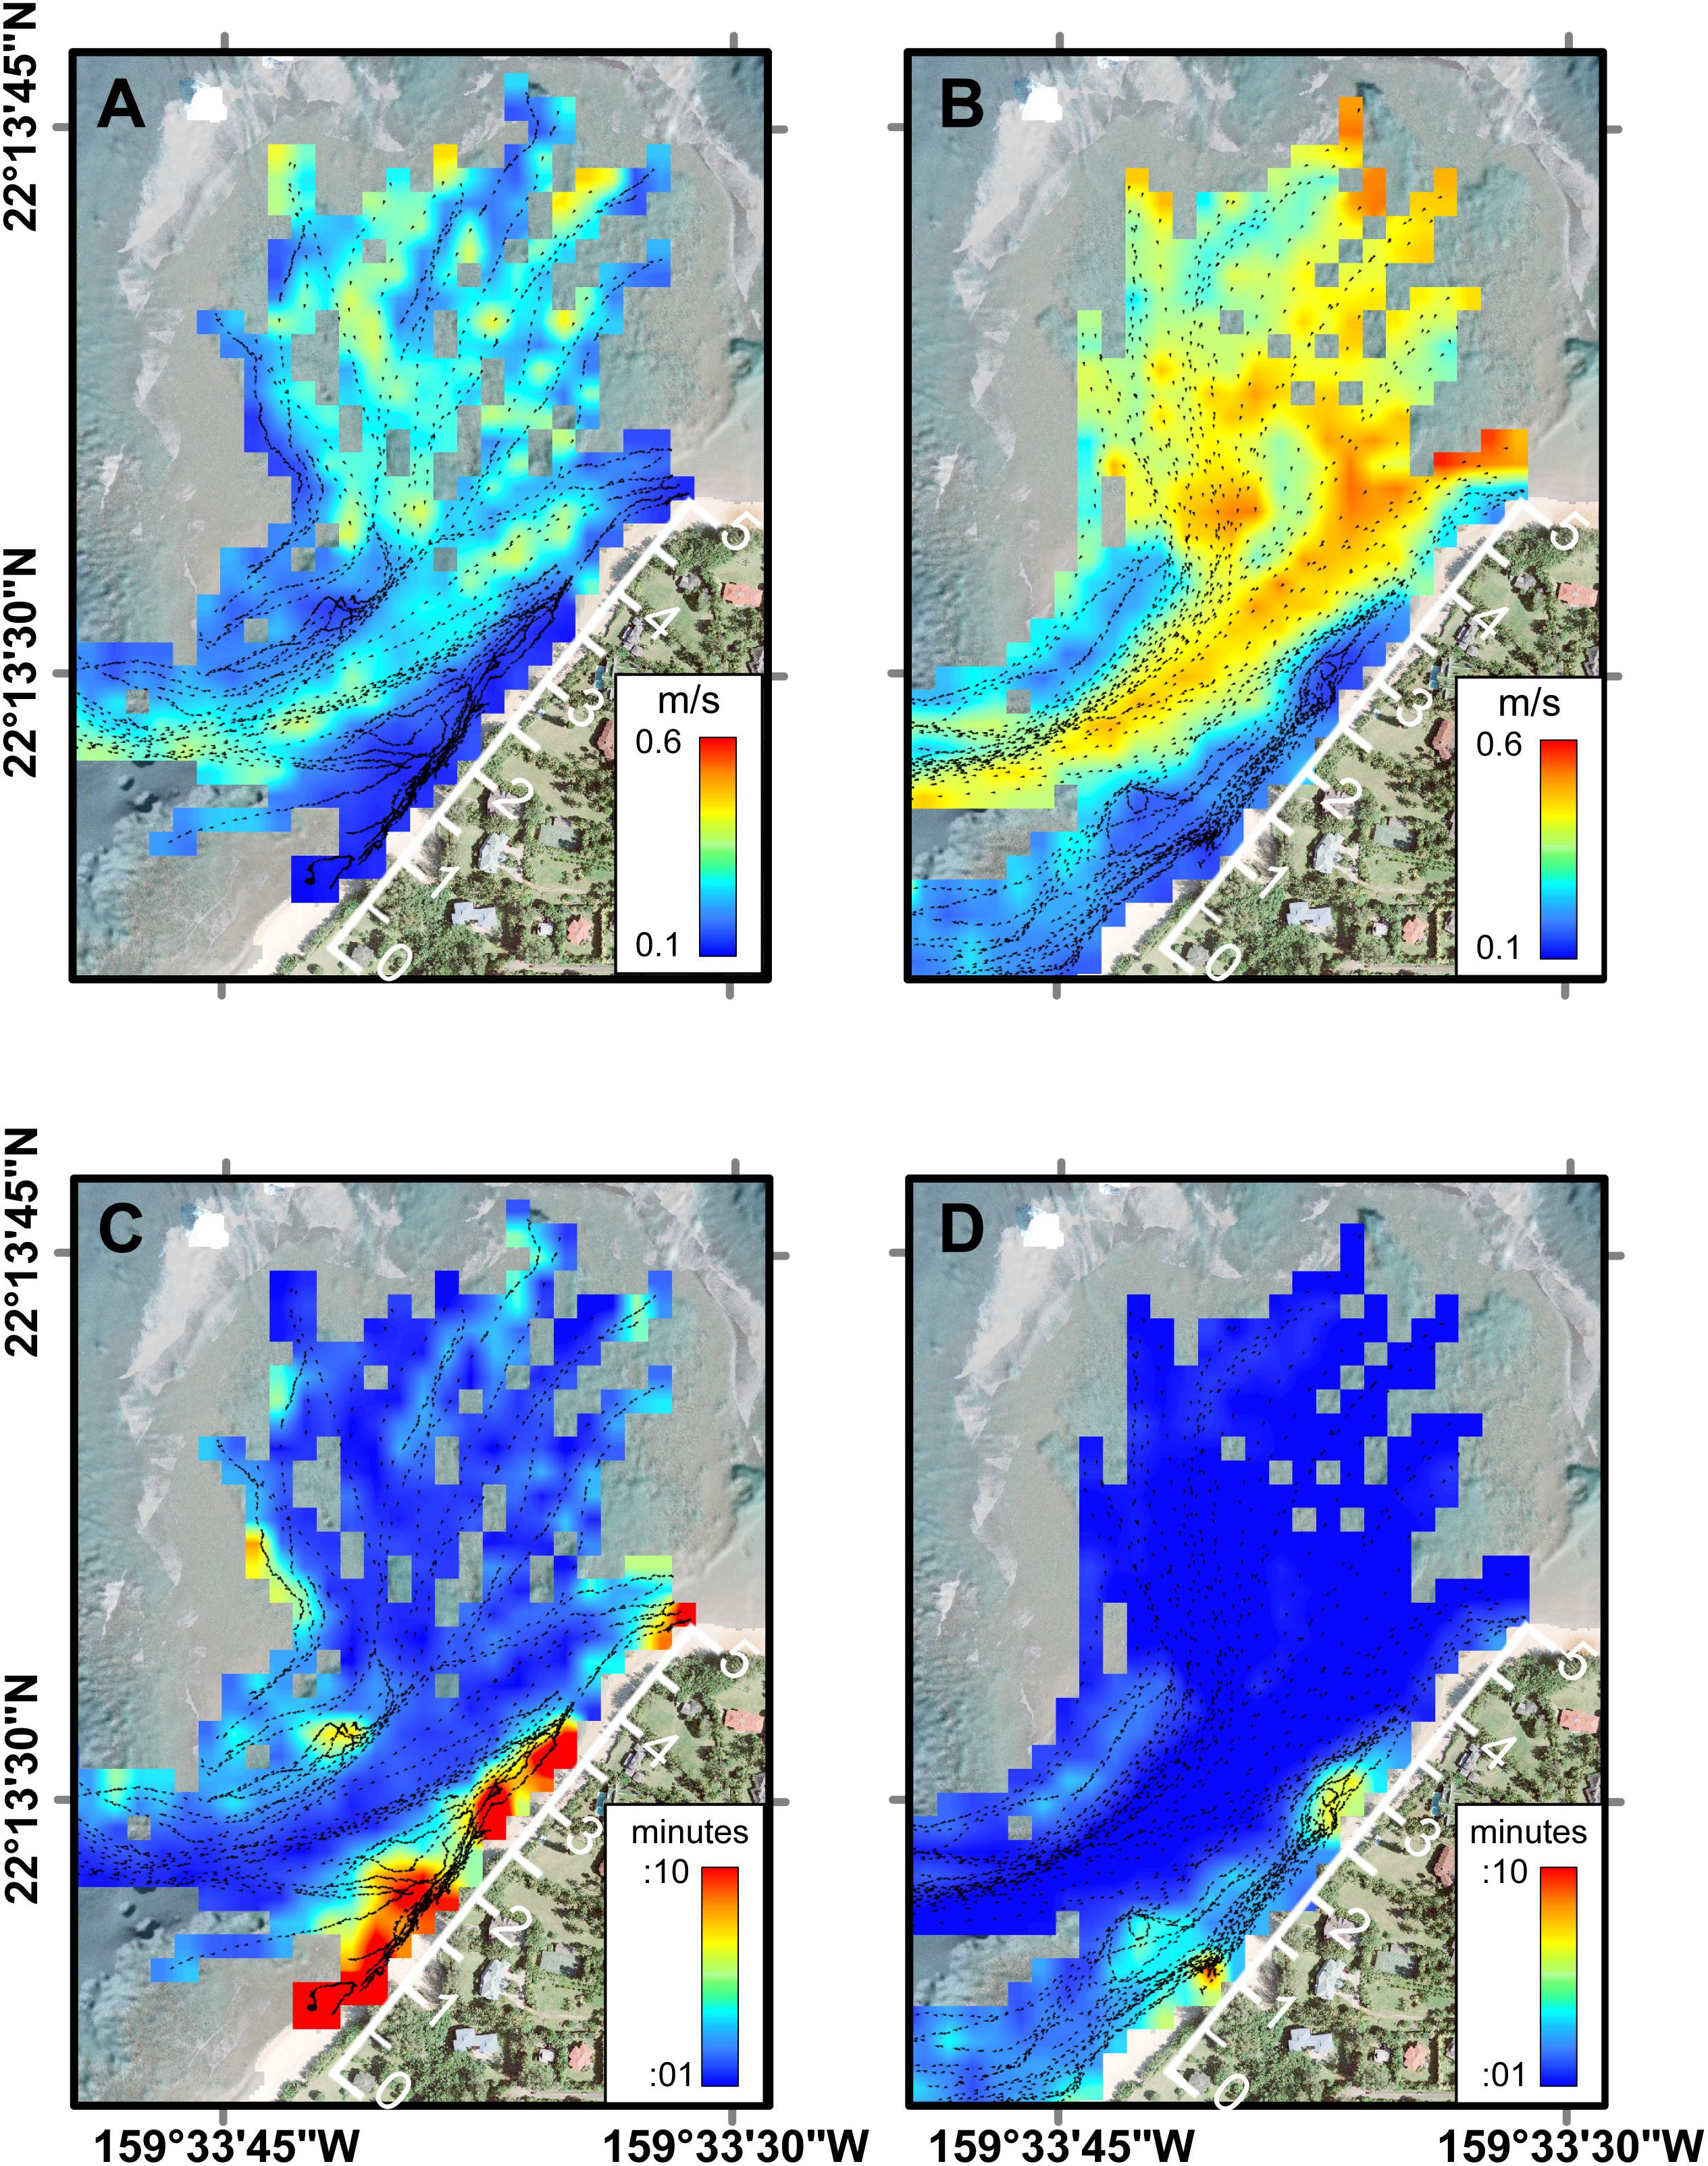
Figure 4. Average current speeds and residence times across Mākua Reef as a function of tidal level from FIDOs. (A) Current speeds at low tide. (B) Current speeds at high tide. (C) Residence times at low tide. (D) Residence times at high tide. Note the geomorphic and oceanographic controls on circulation and thus residence time, with the greatest residence times close to shore during low tides. The along-shore distance track (white axis along beach) indicates the along-shore distance in hundreds of meters (m).
Salinity
Heavy rains at the start of the survey period were followed by intermittent and occasionally heavy rain throughout the week. A gage located 6 km upslope of the study area measured total rain accumulation during the study of ∼20 cm. Within the study area rainfall accumulated to ∼10 cm during the study period (recorded at the coastal rain gauge 6 km east). The monthly rainfall for August was roughly twice as high (177%) during the study period compared to decadal averages. Runoff from Manoa Stream (∼1 km southwest from study area), appeared to remain west of the study area due to the prevailing winds and surface flow from the northeast. Runoff from Wainiha River (∼2.5 km east of study area) and Hanalei River (∼7 km east of study area) produced visibly muddy plumes offshore that did not reach the study site.
The spatial variability in nearshore salinity revealed hotspots of SGD (Figure 5). Salinity differences were generally fairly small, indicating either low discharge or high levels of mixing, but were consistent across multiple surveys. With the exception of one high-tide survey, these alongshore surveys were all performed during low tide when nearshore residence times were longest and groundwater discharge could be expected to be highest as well. Four areas of lower salinity stand out: one at ∼480 m alongshore near the sand spit, at ∼330–410 m (high tide signal) near the green algae-covered rocks, at ∼260 m and at ∼ 140–210 m near the ephemeral creek, close to the southwestern limit of the study area (Figure 5). The most dramatic and more widespread nearshore signal was in the very shallow area of the ephemeral creek (0–80 m) with salinities as low as 16 PSU. Two major alongshore hydrographic boundaries are reflected in the salinity patterns: a broad shallow reef platform at approximately x = 0 m that is exposed at low tide, impounding a shallow basin to the west, and a sand spit at ∼500 m that marks the northeastern limit of more sheltered nearshore waters. Waters offshore and east of the sandspit experience strong currents and surface mixing from water advecting across the offshore reef flats and through the offshore channel, just east of the sandspit and from the prevailing northeast trade winds.
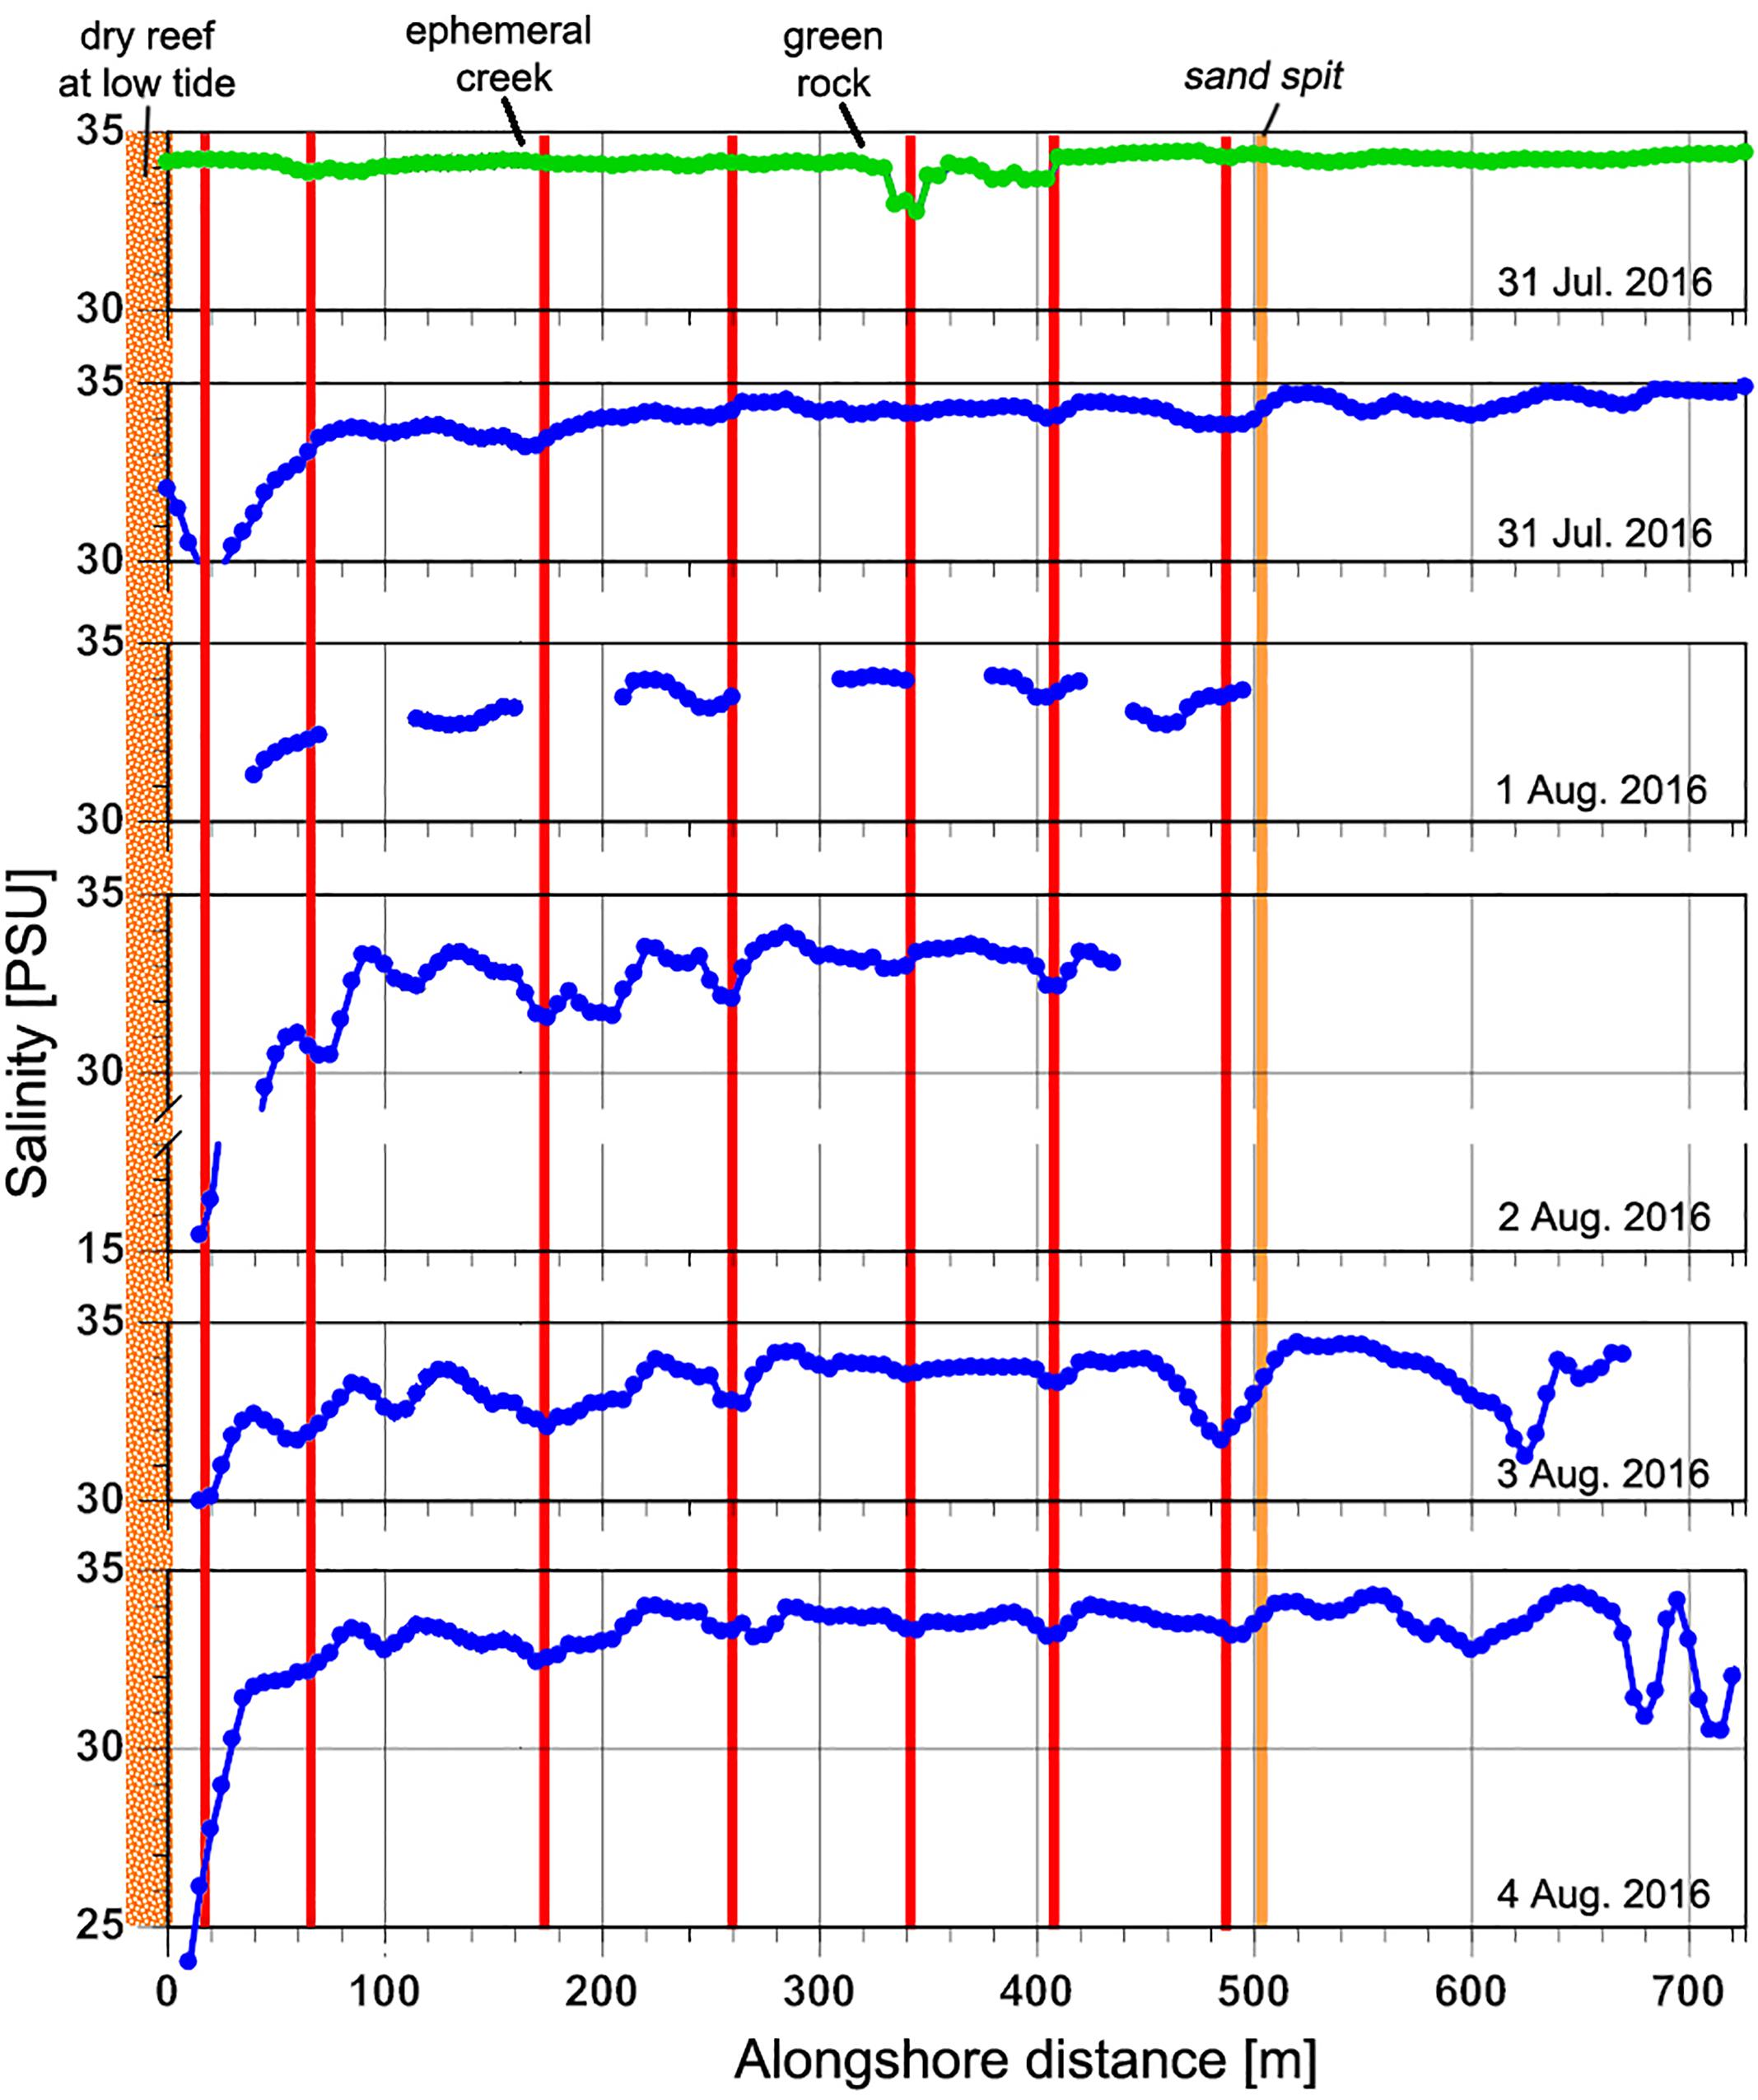
Figure 5. Alongshore near-surface salinity profiles relative to prominent geomorphic locations. Each horizontal panel is a single survey. Green line represents high-tide measurement; blue lines are low-tide measurements. Red vertical lines mark locations that show lower salinities across multiple surveys. Location names of orange vertical lines and alongshore distances are marked on Figure 2. SGD was measured at 390 m due to its lower salinity prevalence even during high tide conditions.
Nutrients
There was a notable difference in the mean nutrient concentrations observed during low and high tide (Figure 6), confirming the influence from the higher SGD rates during low-tide conditions. High tide nutrients were one to two orders of magnitude lower than low tide nutrients from comparable locations. Dissolved silicate, a weathering product of basaltic rock and volcanic ashes in Hawai‘i that gets transported to the coast by groundwater flow and SGD, was two to twelve times higher at low tide compared to high tide. Salinity levels in high tide nutrient samples represented near oceanic conditions, averaging 34.7 PSU, whereas low tide samples were approximately half the high-tide values at 17.4 PSU. Low tide salinity patterns in the nutrient samples exhibited an alongshore variability that is mirrored by the alongshore CTD salinity surveys (Figure 5). The highest freshwater concentrations were recorded just southwest of the ephemeral creek at 75 m. Although nutrient levels were high across the entire study area during low tide, highest levels were recorded in samples at 370 and 440 m in the vicinity of the algae-covered “green rock” (Figure 2).
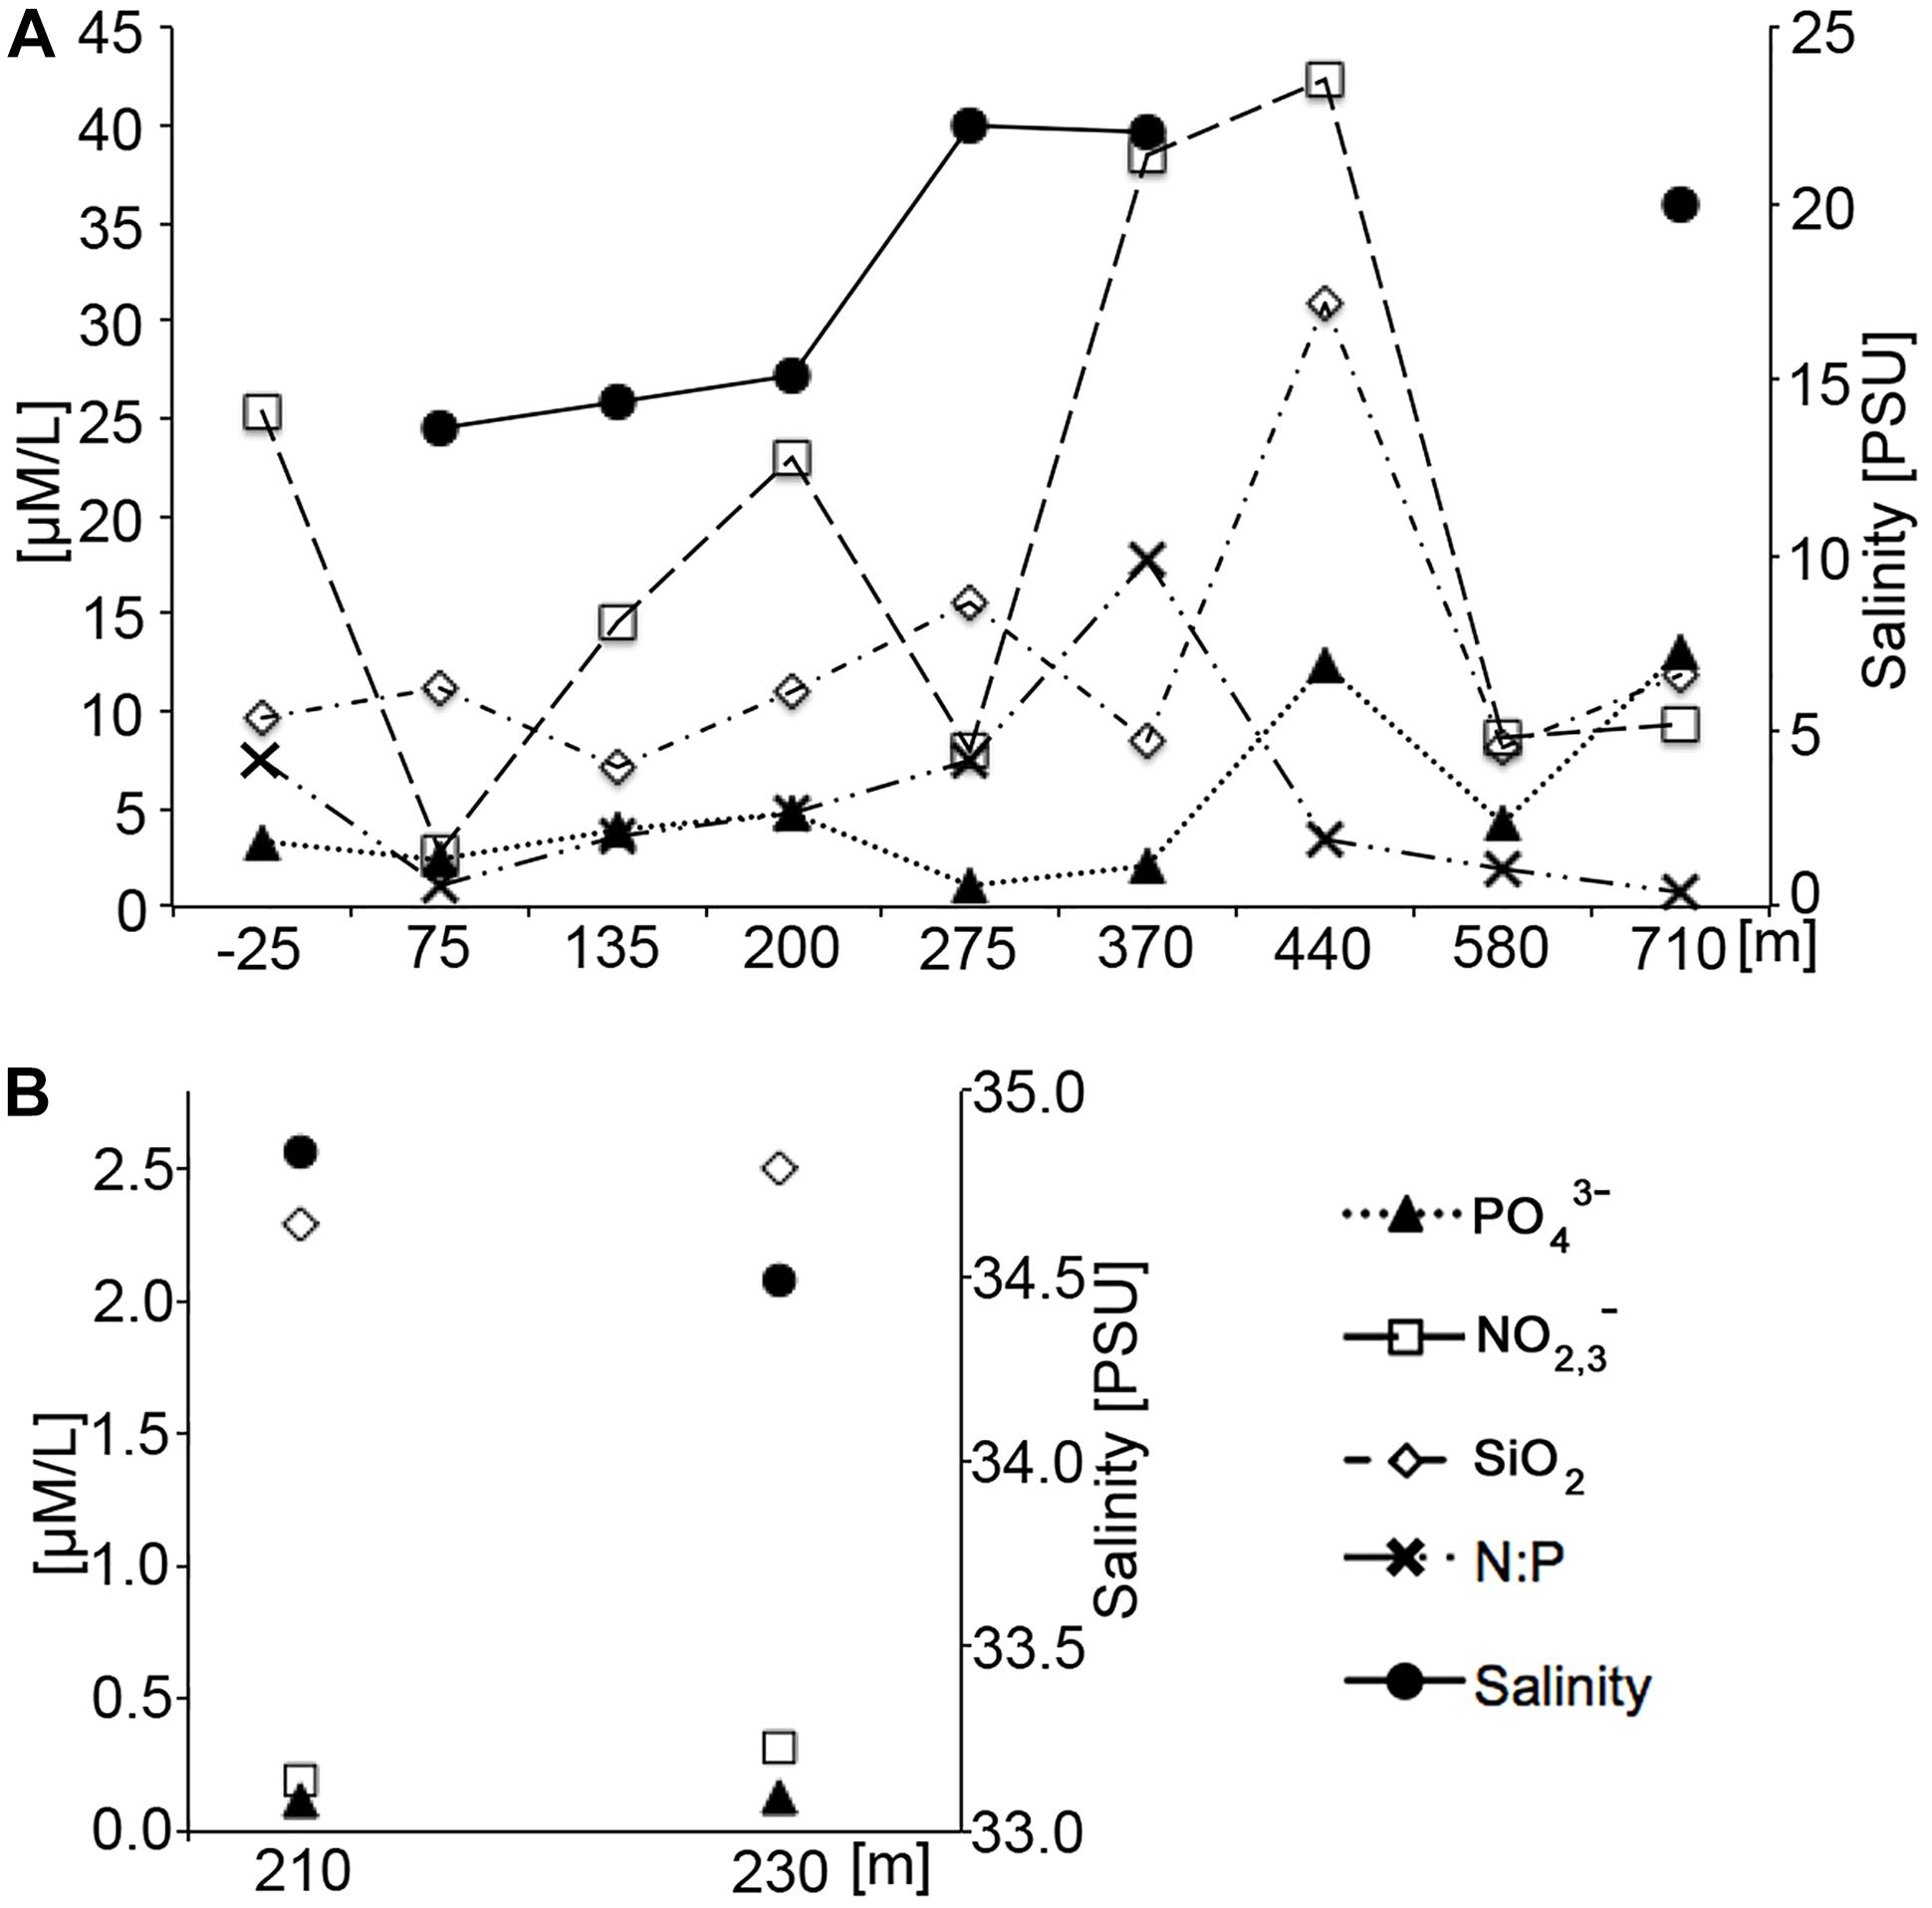
Figure 6. Nutrient and salinity values as a function of tide. (A) Low tide measurements. (B) High tide measurements. Note that differences in the y-axis values indicating that nutrient values were one order of magnitude higher at low tide than at high tide. Numerical data can be found in Supplementary Table S1.
Submarine Groundwater Discharge
The near-bed temperatures measured at current meters T1, T2, and T3 show a daily heating pattern (Figure 3D). However, the water at T1, being the most nearshore of the sensors, is generally cooler than the other sites. Especially during low tides T1 is on average, 0.5°C cooler than T2, despite T1 having considerably slower flow speeds (and, thus, longer residence times). This points to a pronounced influence of SGD at T1. Furthermore, conductivity measurements (representing salinity) taken in combination with SGD measurements had a strong tidal signature, with lower salinities during low tides and higher salinities during high tides (Figure 7). This type of salinity signature is strongly indicative of SGD influence.
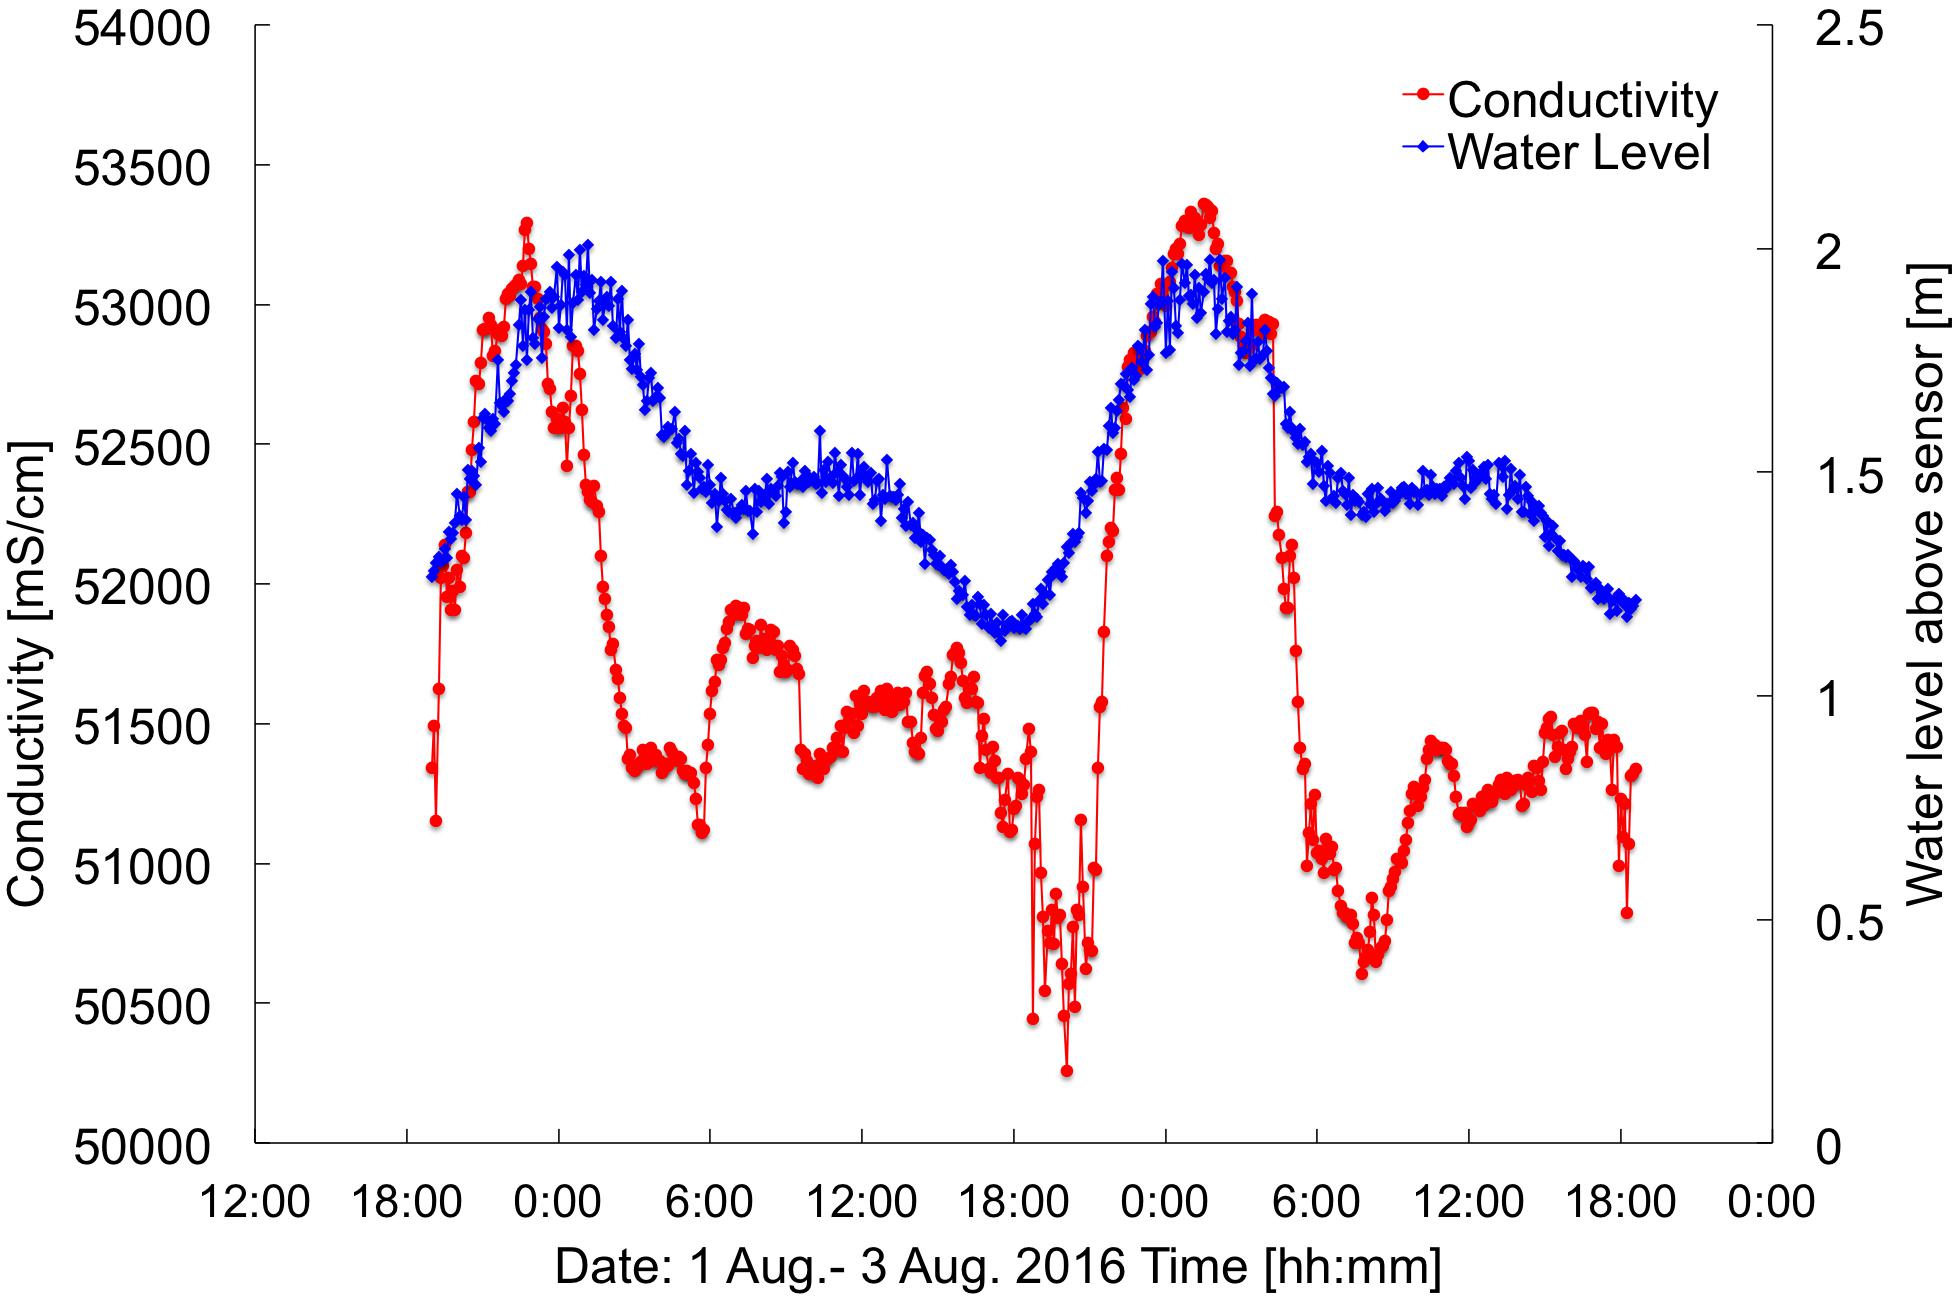
Figure 7. Water level and conductivity measured at the SGD intake. Location at ∼390 m alongshore (Figure 2). Times are HST.
Furthermore, the ERT profiles clearly identified a distinct freshwater layer in the nearshore environment and also recorded salinization with depth (Figure 8). The ERT freshwater layer was relatively uniform throughout the study area, with only a minor indication of a zone of higher SGD between 360 and 420 longshore meters. The high tide salinity profile (Figure 5) also indicated elevated discharge in the same stretch from 330–410 m. SGD was measured in this zone near “green rock” at 390 m alongshore (Figures 8, 9). SGD rates were on average ∼8 cm/d and varied between 1 and 25 cm/d. Higher SGD rates were observed shortly after low tide, whereas high tides caused a landward seawater hydraulic head gradient that reduced SGD. It is important to mention that groundwater endmember values within the study area have been shown to vary with distance from the shoreline and by season (Knee et al., 2008), as well as other parameters such as rainfall that were not addressed in this study. In an effort to minimize the uncertainty associated with endmember variability in our discharge calculations, we only used endmember values taken from a piezometer relatively close to shore (20 m), with the rationale that this water would best represent what was actually discharging.
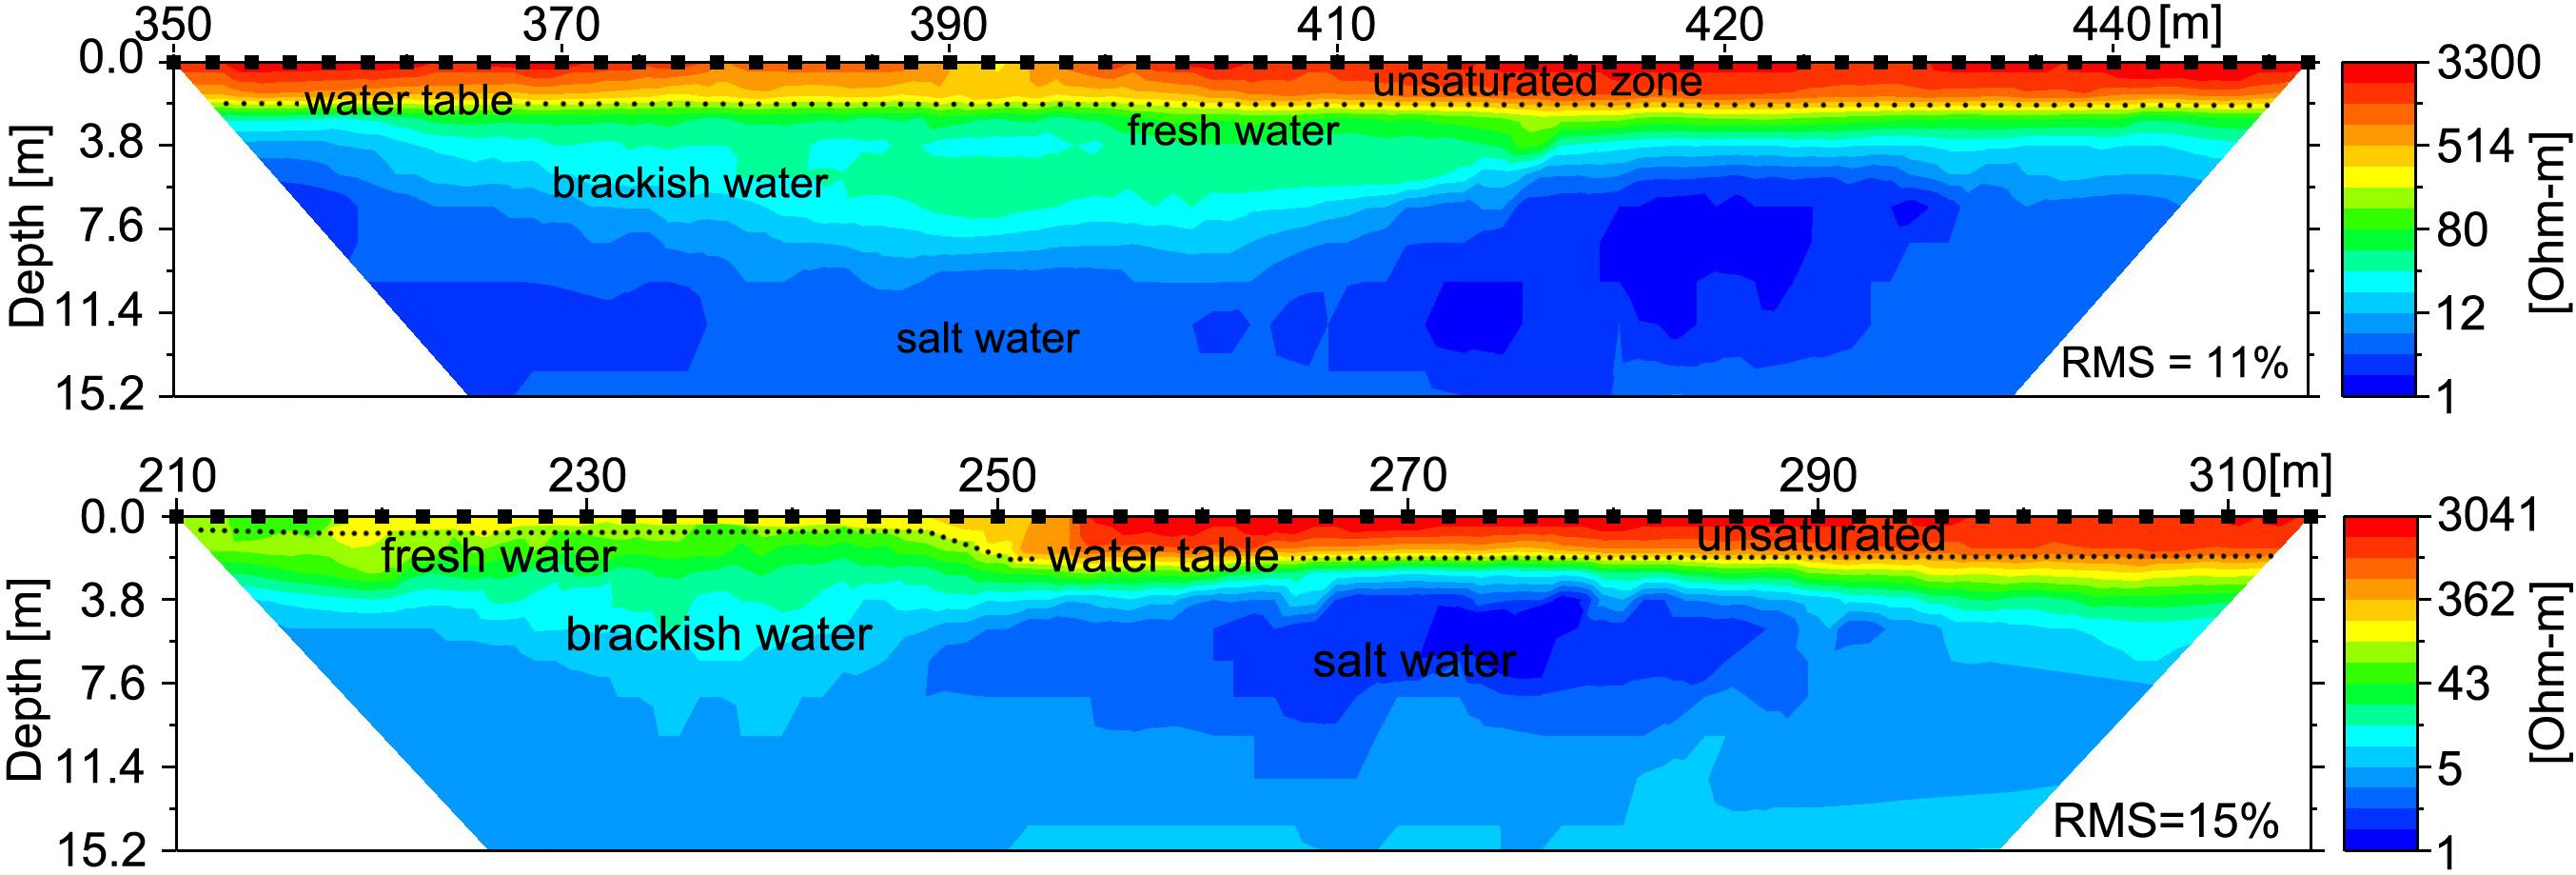
Figure 8. Electrical Resistivity Tomography (ERT) shore parallel profiles following the along-shore distance track (Figure 2) reveal the freshwater-saltwater interface. Upper profile was recorded 1 August, 2016 at 19:00 HST (∼mid tide) and includes the alongshore location where SGD was sampled (at 390 m); lower profile was recorded 3 August, 2016 at 20:30 HST (∼mid tide) and spans across most of the ephemeral creek (between 140 and 190 m). Lower values are indicative of saltwater, higher values indicates brackish to fresh water. The profiles show saltwater intrusion (blue) above a freshwater lens (green), underlying an elevated unsaturated sandy beach (yellow and red). Inferred water table is shown by dotted line.
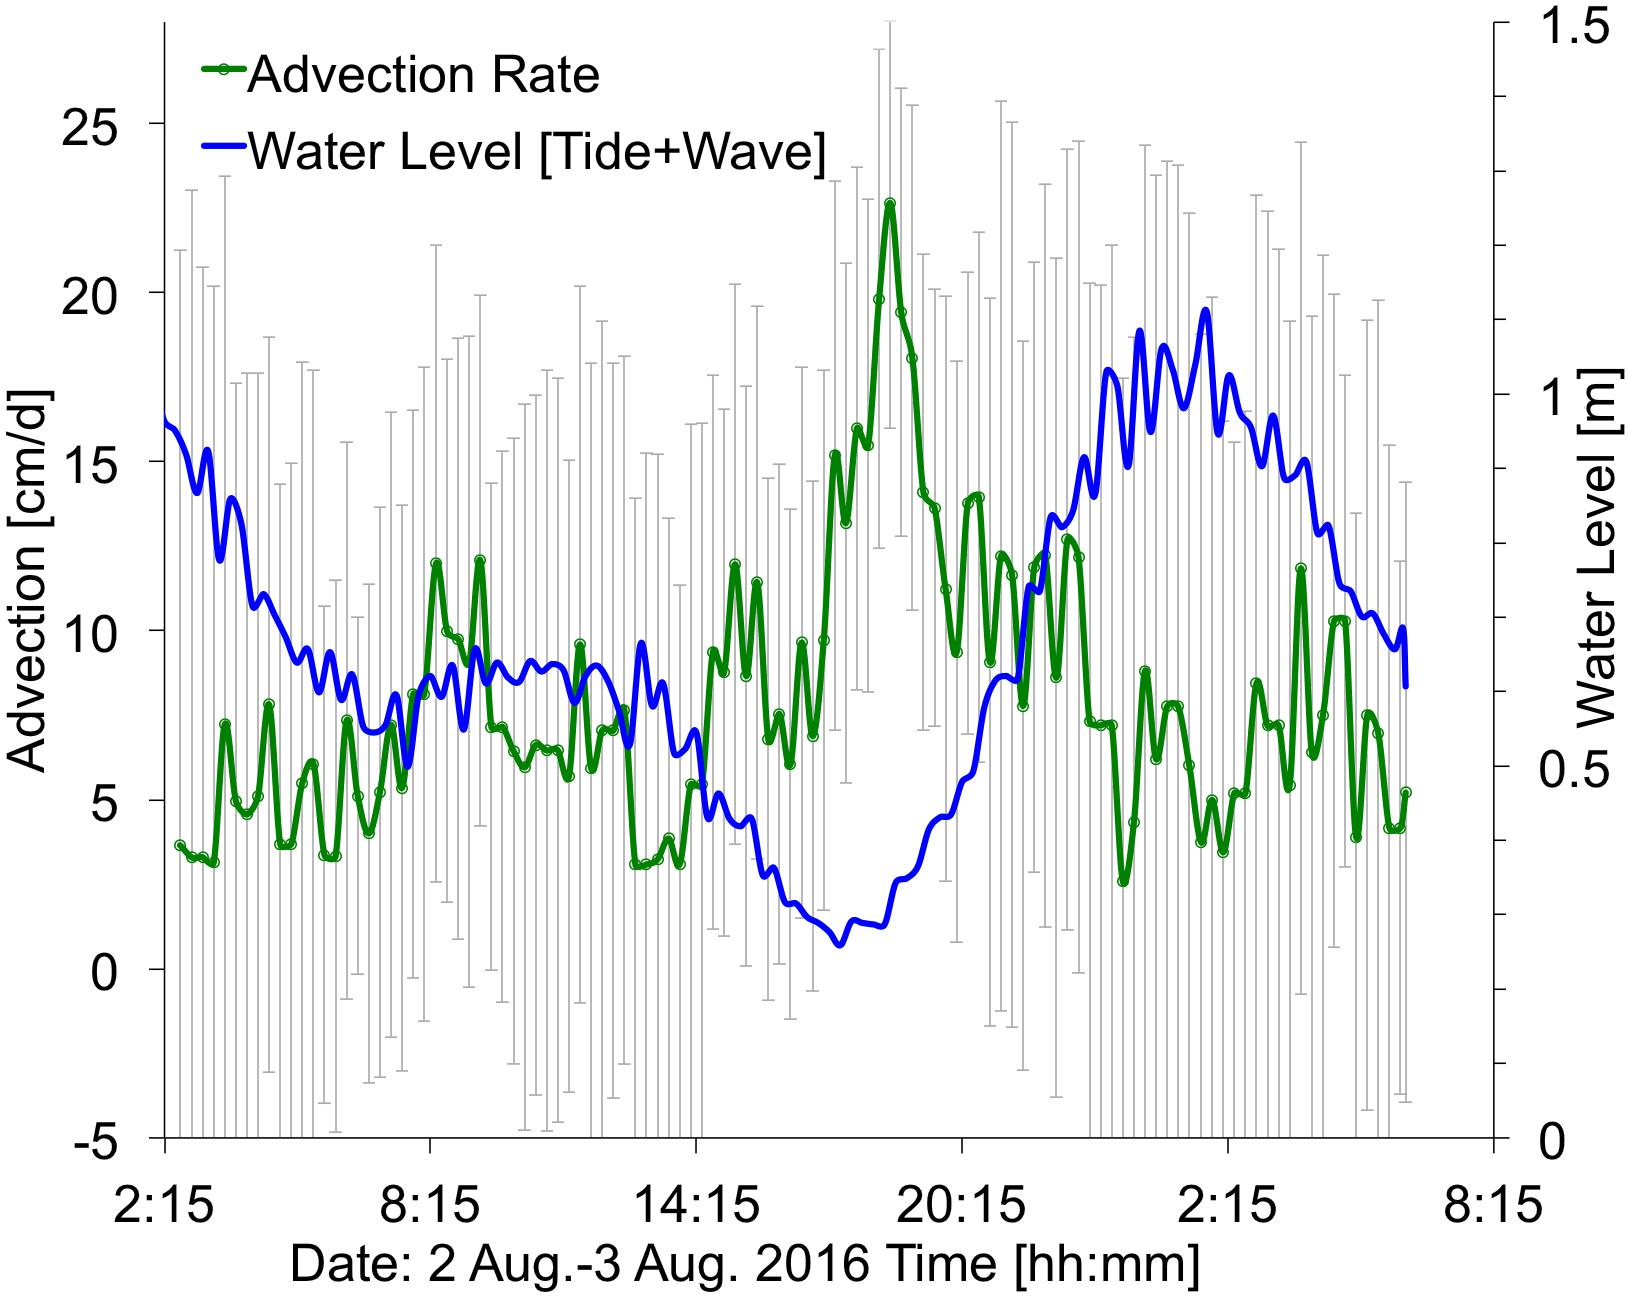
Figure 9. Time series showing ocean water levels (summation of tides plus wave-driven water levels, in blue) and the computed submarine groundwater discharge (SGD) advection rates (in green), with ±1 standard deviation (vertical gray bars). Average advection is 5 cm/d. Location at ∼390 m alongshore (Figure 2). Times are HST.
Discussion and Conclusion
Although there is increasing concern about the health of coral reefs worldwide, a modern understanding of the complex interactions between ocean, SGD and reef processes is still emergent.
Meteorological and Oceanographic Controls on Reef Circulation
Resolving circulation flow patterns at ecologically relevant spatial and temporal scales is difficult in coral reef environments due to the high biological and geomorphic heterogeneity (Monsen et al., 2002). Here, utilizing the sampling strategy outlined by Storlazzi et al. (2018) we combined frequent, high spatial-density Lagrangian drifter deployments with high temporal-resolution Eulerian current meters to resolve the complex flow patterns over different portions of the reef and examined how these patterns change under different water levels.
During the study period, waves and winds were consistently out of the northeast, which is the typical trade wind pattern that characterizes ∼75% of the annual conditions (Fletcher et al., 2002; Garza et al., 2012). As such, though our study duration was only 5 days, it can be considered representative of the dominant oceanographic and meteorological forcing regime for the area. Under sustained northeasterly trade winds, the bathymetry of the reef and the degree of wave breaking over the outer reef crest appear to exert the dominant control on circulation patterns on the Mākua Reef platform.
During the 4 days study period, winds and waves were relatively consistent, with a sustained trade-wind pattern (Figure 3A), and waves approaching the reef from the northeast. Significant wave heights were on average 1.4 m (± 0.17 m; Figure 3B), with an average peak period of 8.0 s (± 1.2 s). Thus, while wind and waves are strong drivers of reef circulation, because these forcings were relatively constant during our deployment, the primary control on reef flows was tides. Water levels also control the influence of waves, whereby higher water levels increase the effect of waves breaking over the reef. This coupled with the decreased bottom friction under higher water levels results in faster reef flows, which is seen in both the drifter and fixed current meter observations (Figure 3D). These spatial and temporal patterns in flow speeds and the resulting residence times are similar to those reported by Storlazzi et al. (2018) in a fringing reef-lined embayment.
In addition to incident offshore wave characteristics, the water levels (tides) also controlled the degree of wave-driven circulation over the reef. At low water levels (<0 m tide height), wave breaking occurred at, but not over the outer reef crest, while at higher water levels, wave breaking over the reef crest resulted in a crescent-shaped hydraulic head over the outer reef that accelerated flow from the outer- and mid-reef nearshore and into the channel (Figure 4). On average, water speeds over the reef platform, directly along the beach, and in the outflow channel were 122% faster during high tide than low tide. Low water levels resulted in stagnant water areas (>10 min residence time) along the beachfront (Figure 4C), while during high tide there were no stagnant water areas except for two small patches near the ephemeral creek (95 m) and the green rock at 250–300 m (Figures 2, 3).
SGD Source
ERT beach profiles reveal that a shallow freshwater lens is floating on intrusive saline water throughout the entire alongshore area. This indicates that some SGD occurs diffusely throughout the study area. However, the combined analysis of the alongshore salinity observations (Figure 6.) and ERT profiles (Figure 8) shows sites of concentrated flux spanning across the ephemeral creek and between 380 and 420 alongshore meters, which indicate SGD channeling or venting. This partially contradicts a previous hypothesis of widespread diffusive SGD release throughout the entire study area as shown in a modeling study (Delevaux et al., 2018).
Oceanographic and Geomorphic Controls on SGD Patterns
The observed flow speed of SGD at the plume location (Figure 2) showed variation associated with changes in water levels, with higher SGD rates (25 cm/d) shortly after low tide, and greatly reduced SGD rates (3 cm/d) at high tide (Figure 9), likely caused by a landward seawater hydraulic head gradient. Similarly, low SGD rates of average ∼3 cm/d were modeled (Delevaux et al., 2018) and observed (Knee et al., 2008) for the nearby Haena Beach and Haena State Park areas (1 km southwest and 2 km west, respectively). The bathymetry within the study area also controls water residence time, and, subsequently, freshwater related nutrient loading. In general, water moves faster over deeper areas of the reef complex (e.g., the channel) due to decreased friction. Some shallower areas such as the outer reef are effectively flushed by waves, but this is not true for the area shoreward of the channel, which is both shallow and sheltered from offshore wave breaking, resulting in slow current speeds and longer residence times (Figure 4). The reduced flushing of nearshore water can lead to stratification, whereby the nutrient rich, less saline water from the SGD plume floats atop the more saline marine waters. This could lead to alternating salinity and nutrient conditions for corals, depending on water levels: during high tide, corals would be exposed to mostly marine (high salinity/low nutrient) conditions, while during low tide corals could be bathed in high nutrient, brackish waters (Figure 10).
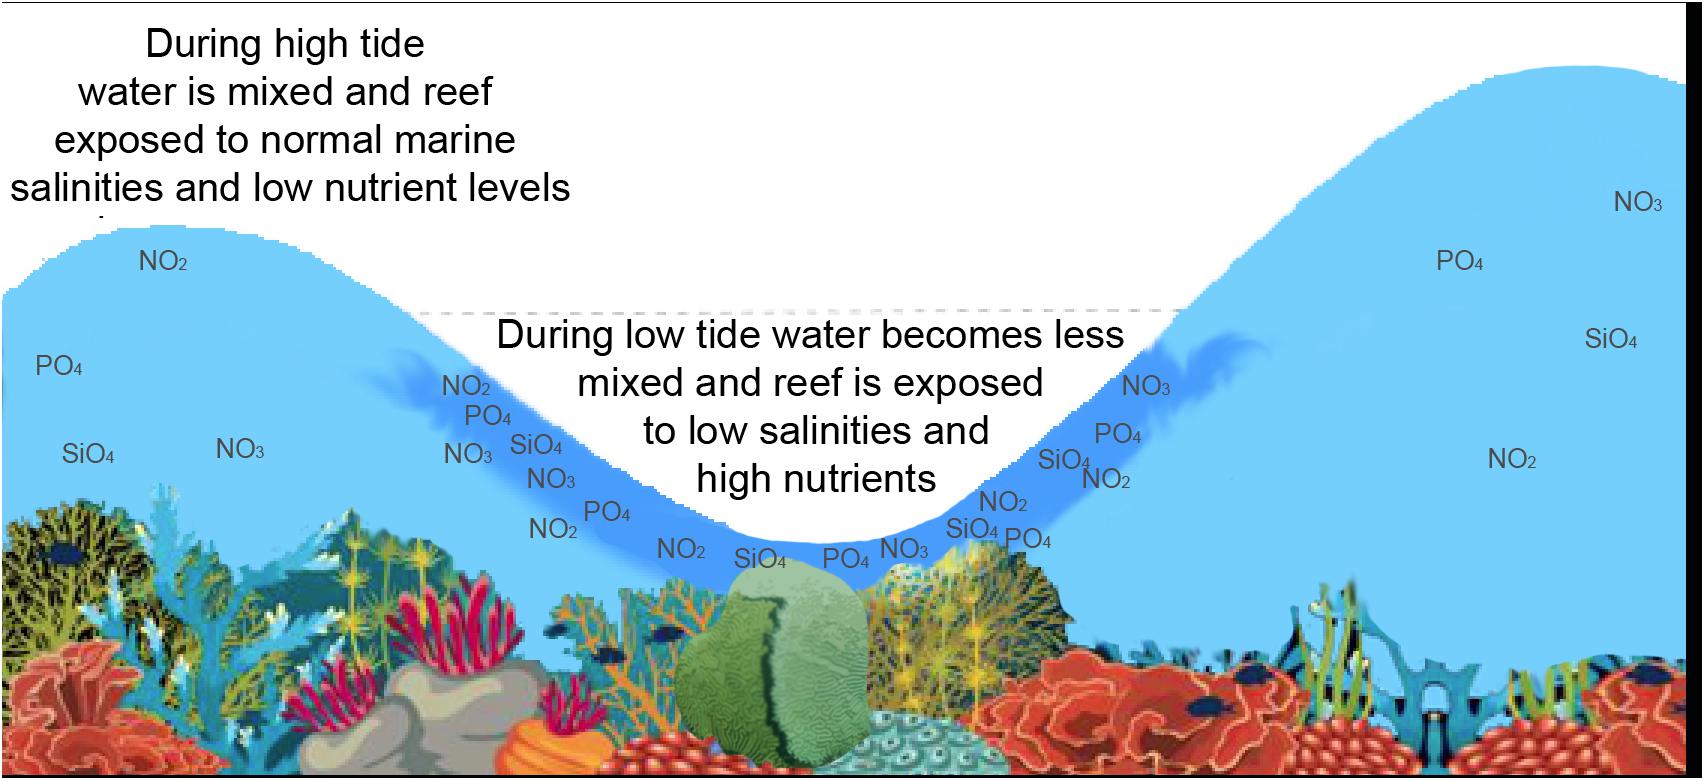
Figure 10. Conceptual drawing of semi-diurnal tide and fluctuating salinity conditions in a shallow reef environment. Dark blue water represents low salinities. The combined effect of tides, stagnant water circulation, SGD, and shallow bathymetry can cause corals to be exposed to potentially stressful high nutrient brackish water conditions.
Cesspools and SGD Nutrient Loading at Mākua Reef
There is strong evidence that the high nutrient concentrations associated with SGD along the shoreline of Mākua reef are sourced from local cesspools. The highest nutrient concentrations were found at a site co-located with a distinct SGD plume (Figure 9) that has a low-salinity signature identifiable at both high and low tide (Figure 5). ERT data (Figure 8) also coincides with nutrient data (Figure 6A) displaying a thicker freshwater lense in the zone where nutrient levels are highest (370–440 alongshore meters). In general, at low water levels, nearshore water samples showed freshwater influence and nutrient concentrations up to an order of magnitude greater than those measured during high tides (Figure 6). These high nutrient concentrations exceed the reported eutrophication thresholds for Pacific reefs (NO2,3– > 20 μmol/L and PO4 > 2 μmol/L; e.g., Bell et al., 2007), suggesting a nearby anthropogenic nutrient input. During the study period, the ephemeral creek was dry, and reported nutrient levels in the nearby but down-current Manoa Stream and off-shore directed Wainiha rivers are lower (<5 NO2,3– and < 0.5 PO43– μmol/L; Knee et al., 2008) than what was measured in the SGD plume. In addition, the plume discharge location is directly up-current of the heavily macroalgae-covered “green rock” location (Figure 2), further suggesting a heightened nutrient source at this location. Several recent studies have pointed to coastal cesspools as a likely anthropogenic source of nutrients to reefs (e.g., Derse et al., 2007; Dailer et al., 2010; Prouty et al., 2017). There are 24 known cesspools located within 0.5 km of Mākua Reef, including 3 that appear to be less than 100 m from the ocean along the studied stretch of coastline (Figure 2). A recent modeling study of the Mākua reef beach identified very high nutrient recharge levels in the adjacent inland areas (Delevaux et al., 2018), further underscoring the likely association of reef nutrient-loading with the presence of these nearby cesspools. Legislators have recognized the potential harmful effect of cesspools and under current legislation all cesspools in the state of Hawai‘i must be removed by 2050.
Coral Health
The complex nature of the BBD, based on the interactions of multiple microbes rather than a single pathogen, makes it difficult to isolate and predict the causative factors or to develop management strategies (Sato et al., 2016). At Mākua reef, we predict the corals most at risk for negative effects due to nutrient-laden SGD are those found in nearshore zones of relatively stagnant water that are also directly influenced by SGD. These zones can be identified by high water residence times which allow SGD driven nutrient levels, low salinities, and potential pathogens to reach peak levels, thus making reduced coral health and resilience more likely. Our results also show that SGD is advected in the alongshore environment putting corals toward the southwest corner of the study area at greatest risk. The sites that meet these criteria coincide with the locations where BBD has been identified in the study area (Figure 2). The herein presented combined analysis of reef circulation, SGD, and nutrient and/or pathogen loading provides reef managers with a predictive tool to identify reef zones subject to higher levels of stress to corals, and that thus may require higher levels of protection.
The State of Hawai‘i has recently recognized that the estimated 53 million gallons of untreated sewage that exit cesspools each day can threaten the health of coral reefs. As a consequence, the removal of all cesspools on Kaua‘i has started to be carried out in accordance to priority regions and completed by 2050 (Department of Health [Doh], 2018). The herin presented data may help city planners and reef managers in identifying a priority zone for cesspool removal that can directly benefit the Mākua Reef.
Data Availability
The datasets generated for this study are available on request to the corresponding author.
Author Contributions
FO, PS, and CS conceived and designed the experiments. FO, CS, OC, RT, DH, JL, CR, CK, and CJ performed the experiments. FO, CS, OC, RT, DH, JL, CR, CK, and PS analyzed the data. FO, OC, and CS wrote the manuscript. Authorship is limited to those who have contributed substantially to the work reported.
Disclaimer
Any use of trade, firm, or product names is for descriptive purposes only and does not imply endorsement by the U.S. Government.
Conflict of Interest Statement
The authors declare that the research was conducted in the absence of any commercial or financial relationships that could be construed as a potential conflict of interest.
Acknowledgments
This research was carried out as part of the U.S. Geological Survey’s Coral Reef Project in an effort to better understand the effects of geologic, oceanographic, and hydrological processes on coral reef systems in the United States and its trust territories and was supported by the USGS Coastal and Marine Geology Program. The IAEA is grateful for the support provided to its Environment Laboratories by the Government of the Principality of Monaco. A special thanks goes to the community of Hā‘ena Point for their continued support for scientific research. Data on which this manuscript is based are available for download at https://doi.org/10.5066/P9M2B3WB.
Supplementary Material
The Supplementary Material for this article can be found online at: https://www.frontiersin.org/articles/10.3389/fmars.2019.00552/full#supplementary-material
Footnotes
References
Abaya, L. M., Wegner, T. N., Beets, J. P., Colbert, S. L., Carlson, K. M., and Kramer, K. L. (2018). Spatial distribution of sewage pollution on a Hawaiian coral reef. Mar. Pollut. Bull. 130, 335–347. doi: 10.1016/j.marpolbul.2018.03.028
Aeby, G. S., Work, T. M., Runyon, C. M., Shore-Maggio, A., Ushijima, B., Videau, P., et al. (2015). First record of black band disease in the Hawaiian archipelago: response, outbreak status, virulence, and a method of treatment. PLoS One 10:1–38. doi: 10.1371/journal.pone.0120853
Andréfouët, S., Mumby, P., McField, M., Hu, C., and Muller-Karger, F. (2002). Revisiting coral reef connectivity. Coral. Reefs 21, 43–48. doi: 10.1007/s00338-001-0199-0
Antonius, A. (1985). Coral diseases in the indo-pacific: a first record. Mar. Ecol. 6, 197–218. doi: 10.1111/j.1439-0485.1985.tb00322.x
Battista, T. A., Costa, B. M., and Anderson, S. M. (2007). “Shallow-water benthic habitats of the main eight Hawaiian Islands,” in NOAA Techical. Memorandum. NOS NCCOS 61, (Maryland: NOAA).
Bell, P. R. F., Lapointe, B. E., and Elmetri, I. (2007). Reevaluation of ENCORE: support for the eutrophication threshold model for coral Reefs. AMBIO A J. Hum. Environ. 36, 416–424. doi: 10.1579/00447447
Bishop, R. C., Chapman, D. J., Kanninen, B. J., Krosnick, J. A., Leeworthy, B., and Meade, N. F. (2011). “Nonmarket valuation of coral reef ecosystem protection and restoration: applying the rank-orderedprobit model to internet panel data,” in Paper presented at the Association of Environmental and Resource Economists conference, (Seattle).
Bruno, J. F., Petes, L. E., Drew Harvell, C., and Hettinger, A. (2003). Nutrient enrichment can increase the severity of coral diseases. Ecol. Lett. 6, 1056–1061. doi: 10.1046/j.1461-0248.2003.00544.x
Burnett, W. C., Bokuniewicz, H., Huettel, M., Moore, W., and Taniguchi, M. (2003). Groundwater and pore water inpunts to the coastal zone. Biogeochemistry 66, 3–33. doi: 10.1023/b:biog.0000006066.21240.53
Burnett, W. C., and Dulaiova, H. (2003). Estimating the dynamics of groundwater input into the coastal zone via continuous radon-222 measurements. J. Environ. Radioact. 69, 21–35. doi: 10.1016/S0265-931X(03)00084-5
Burnett, W. C. C., Aggarwal, P. K. K., Aureli, A., Bokuniewicz, H., Cable, J. E. E., Charette, M. A. A., et al. (2006). Quantifying submarine groundwater discharge in the coastal zone via multiple methods. Sci. Total Environ. 367, 498–543. doi: 10.1016/j.scitotenv.2006.05.009
Cardenas, M. B., Zamora, P. B., Siringan, F. P., Lapus, M. R., Rodolfo, R. S., Jacinto, G. S., et al. (2010). Linking regional sources and pathways for submarine groundwater discharge at a reef by electrical resistivity tomography, 222 Rn, and salinity measurements. Geophys. Res. Lett. 37:L16401. doi: 10.1029/2010GL044066
Cheriton, O. M., Storlazzi, C. D., and Rosenberger, K. J. (2016). Observations of wave transformation over a fringing coral reef and the importance of low-frequency waves and offshore water levels to runup, overwash, and coastal flooding. J. Geophys. Res. Ocean. 121, 3121–3140. doi: 10.1002/2015JC011231
Cyronak, T., Santos, I. R., Erler, D. V., and Eyre, B. D. (2013). Groundwater and porewater as major sources of alkalinity to a fringing coral reef lagoon (Muri Lagoon. Cook Islands). Biogeosciences 10, 2467–2480. doi: 10.5194/bg-10-2467-2013
Dailer, M. L., Knox, R. S., Smith, J. E., Napier, M., and Smith, C. M. (2010). Using δ15N values in algal tissue to map locations and potential sources of anthropogenic nutrient inputs on the island of Maui. Hawai‘i, USA. Mar. Pollut. Bull. 60, 655–671. doi: 10.1016/j.marpolbul.2009.12.021
Delevaux, J. M. S. S., Whittier, R., Stamoulis, K. A., Bremer, L. L., Jupiter, S., Friedlander, A. M., et al. (2018). A linked land-sea modeling framework to inform ridge-to-reef management in high oceanic islands. PLoS One 13:e0193230. doi: 10.1371/journal.pone.0193230
Department of Health [Doh] (2018). Report to the Twenety-Ninth Legislature State of Hawaii 2018 Regular Session Relating to Cesspools, and Prioritization. (for)Replacement. San Lazaro: DOH.
Derse, E., Knee, K. L., Wankel, S. D., Kendall, C., Berg, C. J., and Paytan, A. (2007). Identifying sources of nitrogen to hanalei bay, kauai, utilizing the nitrogen isotope signature of macroalgae. Environ. Sci. Technol. 41, 5217–5223. doi: 10.1021/es0700449
Dollar, S. J., and Atkinson, M. J. (1992). Effects of nutrient subsidies from groundwater to nearshore marine ecosystems off the island of Hawaii. Estuar. Coast. Shelf Sci. 35, 409–424. doi: 10.1016/S0272-7714(05)80036-8
Ducklow, H. W., and Mitchell, R. (1979). Observations on naturally and artificially diseased tropical corals: a scanning electron microscope study. Microb. Ecol. 5, 215–223. doi: 10.1007/BF02013528
Dulaiova, H., Burnett, W. C., Chanton, J. P., Moore, W. S., Bokuniewicz, H. J., Charette, M. A., et al. (2006). Assessment of groundwater discharges into West Neck Bay, New York, via natural tracers. Cont. Shelf Res. 26, 1971–1983. doi: 10.1016/j.csr.2006.07.011
Erftemeijer, P. L. A., Riegl, B., Hoeksema, B. W., and Todd, P. A. (2012). Environmental impacts of dredging and other sediment disturbances on corals: A review. Mar. Pollut. Bull. 64, 1737–1765. doi: 10.1016/j.marpolbul.2012.05.008
Fabricius, K. E. (2005). Effects of terrestrial runoff on the ecology of corals and coral reefs: review and synthesis. Mar. Pollut. Bull. 50, 125–146. doi: 10.1016/j.marpolbul.2004.11.028
Falter, J. L., Atkinson, M. J., and Merrifield, M. A. (2004). Mass-transfer limitation of nutrient uptake by a wave-dominated reef flat community. Limnol. Oceanogr. 49, 1820–1831. doi: 10.4319/lo.2004.49.5.1820
Falter, J. L., Lowe, R. J., Atkinson, M. J., Monismith, S. G., and Schar, D. W. (2008). Continuous measurements of net production over a shallow reef community using a modified Eulerian approach. J. Geophys. Res. 113:C07035. doi: 10.1029/2007JC004663
Fletcher, C. H., Grossman, E. E., Richmond, B. M., and Gibbs, A. E. (2002). Atlas of Natural Hazards in the Hawaiian Coastal Zone. Reston: USGS,Google Scholar
Fletcher, C. H., Romine, B. M., Genz, A. S., Barbee, M. M., Dyer, M., Anderson, T. R., et al. (2012). National Assessment of Shoreline czange: Historical Shoreline Change in the Hawaiian Islands. Open-File Report No 2011–1051.Reston, VA: U.S. Geological Survey, doi: 10.3133/ofr20111051
Garrison, G. H., Glenn, C. R., and McMurtry, G. M. (2003). Measurement of submarine groundwater discharge in Kahana Bay, O’ahu, Hawai‘i. Limnol. Oceanogr. 48, 920–928. doi: 10.4319/lo.2003.48.2.0920
Garza, J. A., Chu, P.-S., Norton, C. W., and Schroeder, T. A. (2012). Changes of the prevailing trade winds over the islands of Hawaii and the North Pacific. J. Geophys. Res. Atmos 117, D11109. doi: 10.1029/2011JD016888
Gattuso, J. P., Hoegh-Guldberg, O., and Pörtner, H. O. (2014). “Cross-chapter box on coral reefs,” in Climate Change 2014: Impacts, Adaptation, and Vulnerability Part A: Global and Sectoral Aspects Contribution of Working Group II to the Fifth Assessment Report of the Intergovernmental Panel of Climate Change, eds C. B. Field, V. R. Barros, D. J. Dokken, K. J. Mach, M. D. Mastrandrea, T. E. Bilir, et al. (New York, NY: Cambridge University Press), 97–100.
Hearn, C. J. (2011). Perspectives in coral reef hydrodynamics. Coral Reefs 30, 1–9. doi: 10.1007/s00338-011-0752-4
Hench, J. L., Leichter, J. J., and Monismith, S. G. (2008). Episodic circulation and exchange in a wave-driven coral reef and lagoon system. Limnol. Oceanogr. 53, 2681–2694. doi: 10.4319/lo.2008.53.6.2681
Hill, J., and Wilkinson, C. (2004). Methods for Ecological Monitoring of Coral Reefs. (Glad: IUCN Publication), 1–117.
Hoeke, R. K., Storlazzi, C. D., and Ridd, P. V. (2013). Drivers of circulation in a fringing coral reef embayment: a wave-flow coupled numerical modeling study of Hanalei Bay. Hawaii. Cont. Shelf Res. 58, 79–95. doi: 10.1016/j.csr.2013.03.007
Hughes, T. P., Rodrigues, M. J., Bellwood, D. R., Ceccarelli, D., Hoegh-Guldberg, O., McCook, L., et al. (2007). Phase shifts, herbivory, and the resilience of coral reefs to climate change. Curr. Biol. 17, 360–365. doi: 10.1016/j.cub.2006.12.049
Izuka, S. K., Engott, J. A., Rotzoll, K., Bassiouni, M., Johnson, A. G., Miller, L. D., et al. (2018). Volcanic aquifers of Hawai‘i—Hydrogeology, water budgets, and conceptual models, Scientific Investigations Report NO 2015-5164. Reston, VA: USGS.
Kim, G. (2003). Large submarine groundwater discharge (SGD) from a volcanic island. Geophys. Res. Lett. 30:2098. doi: 10.1029/2003GL018378
Knee, K. L., Layton, B. A., Street, J. H., Boehm, A. B., and Paytan, A. (2008). Sources of nutrients and fecal indicator bacteria to nearshore waters on the north shore of Kaua‘i (Hawai‘i. USA). Estuaries Coasts 31, 607–622. doi: 10.1007/s12237-008-9055-6
Kwon, E. Y., Kim, G., Primeau, F., Moore, W. S., Cho, H.-M. M., DeVries, T., et al. (2014). Global estimate of submarine groundwater discharge based on an observationally constrained radium isotope model. Geophys. Res. Lett. 41, 8438–8444. doi: 10.1002/2014GL061574
Lapointe, B. E., Barile, P. J., Littler, M. M., and Littler, D. S. (2005). Macroalgal blooms on southeast florida coral reefs: II. Harmful Algae 4, 1106–1122. doi: 10.1016/j.hal.2005.06.002
Laws, E. A., Redalje, D. G., Haas, L. W., Bienfang, P. K., Eppley, R. W., Harrison, W. G., et al. (1984). High phytoplankton growth and production rates in oligotrophic Hawaiian coastal waters1. Limnol. Oceanogr. 29, 1161–1169. doi: 10.4319/lo.1984.29.6.1161
Lowe, R. J., and Falter, J. L. (2015). Oceanic Forcing of coral reefs. Ann. Rev. Mar. Sci. 7, 43–66. doi: 10.1146/annurev-marine-010814-015834
Lowe, R. J., Falter, J. L., Monismith, S. G., and Atkinson, M. J. (2009). Wave-driven circulation of a coastal reef–lagoon system. J. Phys. Oceanogr. 39, 873–893. doi: 10.1175/2008JPO3958.1
Macdonald, G. A., Davis, D. A., and Cox, D. C. (1960). Geology and ground-water resources of the island of Kauai. Hawaii: Hawaii Division of Hydrography Bulletin 212, 2.
Manheim, F. T., Krantz, D. E., and Bratton, J. F. (2004). Studying ground water under delmarva coastal bays using electrical resistivity. Ground Water 42, 1052–1068. doi: 10.1111/j.1745-6584.2004.tb02643.x
Monismith, S. G. (2007). Hydrodynamics of coral reefs. Annu. Rev. Fluid Mech. 39, 37–55. doi: 10.1146/annurev.fluid.38.050304.092125
Monismith, S. G. (2014). Flow through a rough, shallow reef. Coral Reefs 33, 99–104. doi: 10.1007/s00338-013-1107-0
Monsen, N. E., Cloern, J. E., Lucas, L. V., and Monismith, S. G. (2002). A comment on the use of flushing time, residence time, and age as transport time scales. Limnol. Oceanogr. 47, 1545–1553. doi: 10.4319/lo.2002.47.5.1545
Moore, W. S. (2010). The effect of submarine groundwater discharge on the ocean. Ann. Rev. Mar. Sci. 2, 59–88. doi: 10.1146/annurev-marine-120308-081019
Oberle, F. K. J., Swarzenski, P. W., and Storlazzi, C. D. (2017). Atoll groundwater movement and its response to climatic and sea-level fluctuations. Water 9:650. doi: 10.3390/w9090650
Page, C., and Willis, B. (2006). Distribution, host range and large-scale spatial variability in black band disease prevalence on the great barrier reef. Australia. Dis. Aquat. Organ. 69, 41–51. doi: 10.3354/dao069041
Paytan, A., Shellenbarger, G. G., Street, J. H., Gonneea, M. E., Davis, K., Young, M. B., et al. (2006). Submarine groundwater discharge: an important source of new inorganic nitrogen to coral reef ecosystems. Limnol. Oceanogr. 51, 343–348. doi: 10.4319/lo.2006.51.1.0343
Presto, M. K., Ogston, A. S., Storlazzi, C. D., and Field, M. E. (2006). Temporal and spatial variability in the flow and dispersal of suspended-sediment on a fringing reef flat. Molokai, Hawaii. Estuar. Coast. Shelf Sci. 67, 67–81. doi: 10.1016/j.ecss.2005.10.015
Prouty, N. G., Cohen, A., Yates, K. K., Storlazzi, C. D., Swarzenski, P. W., and White, D. (2017). Vulnerability of coral reefs to bioerosion from land-based sources of pollution. J. Geophys. Res. Ocean. 122, 9319–9331. doi: 10.1002/2017JC013264
Redding, J. E., Myers-Miller, R. L., Baker, D. M., Fogel, M., Raymundo, L. J., and Kim, K. (2013). Link between sewage-derived nitrogen pollution and coral disease severity in Guam. Mar. Pollut. Bull. 73, 57–63. doi: 10.1016/j.marpolbul.2013.06.002
Runyon, C., Aeby, G. S., and Callahan, S. M. (2015). Kauai Montipora Coral Disease Prevelence and Environmental Drivers. Honolulu: University of hawaii manon.
Sato, Y., Civiello, M., Bell, S. C., Willis, B. L., and Bourne, D. G. (2016). Integrated approach to understanding the onset and pathogenesis of black band disease in corals. Environ. Microbiol. 18, 752–765. doi: 10.1111/1462-2920.13122
Schubert, M., Paschke, A., Lieberman, E., and Burnett, W. C. (2012). Air–water partitioning of 222 rn and its dependence on water temperature and salinity. Environ. Sci. Technol. 46, 3905–3911. doi: 10.1021/es204680n
Shedrawi, G., Falter, J. L., Friedman, K. J., Lowe, R. J., Pratchett, M. S., Simpson, C. J., et al. (2017). Localised hydrodynamics influence vulnerability of coral communities to environmental disturbances. Coral Reefs 36, 861–872. doi: 10.1007/s00338-017-1576-7
Slomp, C. P., and Van Cappellen, P. (2004). Nutrient inputs to the coastal ocean through submarine groundwater discharge: controls and potential impact. J. Hydrol. 295, 64–86. doi: 10.1016/j.jhydrol.2004.02.018
Storlazzi, C., Ogston, A., Bothner, M., Field, M., and Presto, M. (2004). Wave- and tidally-driven flow and sediment flux across a fringing coral reef: southern Molokai, Hawaii. Cont. Shelf Res. 24, 1397–1419. doi: 10.1016/j.csr.2004.02.010
Storlazzi, C. D., Cheriton, O. M., Messina, A. M., and Biggs, T. W. (2018). Meteorologic, oceanographic, and geomorphic controls on circulation and residence time in a coral reef-lined embayment: Faga’alu Bay. American Samoa. Coral Reefs 37, 457–469. doi: 10.1007/s00338-018-1671-4
Storlazzi, C. D., Field, M. E., Bothner, M. H., Presto, M. K., and Draut, A. E. (2009). Sedimentation processes in a coral reef embayment: hanalei bay. Kauai. Mar. Geol. 264, 140–151. doi: 10.1016/j.margeo.2009.05.002
Storlazzi, C. D., van Ormondt, M., Chen, Y.-L., and Elias, E. P. L. (2017). Modeling fine-scale coral larval dispersal and interisland connectivity to help designate mutually-supporting coral reef marine protected areas: insights from maui nui. Hawaii. Front. Mar. Sci. 4:381. doi: 10.3389/fmars.2017.00381
Street, J. H., Knee, K. L., Grossman, E. E., and Paytan, A. (2008). Submarine groundwater discharge and nutrient addition to the coastal zone and coral reefs of leeward Hawai‘i. Mar. Chem. 109, 355–376. doi: 10.1016/j.marchem.2007.08.009
Swarzenski, P. W. (2007). U/Th series radionuclides as coastal groundwater tracers. Chem. Rev. 107, 663–674. doi: 10.1021/cr0503761
Swarzenski, P. W., Burnett, W. C., Greenwood, W. J., Herut, B., Peterson, R., Dimova, N., et al. (2006). Combined time-series resistivity and geochemical tracer techniques to examine submarine groundwater discharge at Dor Beach. Israel. Geophys. Res. Lett. 33, L24405. doi: 10.1029/2006GL028282
Swarzenski, P. W., Dulaiova, H., Dailer, M. L., Glenn, C. R., Smith, C. G., and Storlazzi, C. D. (2013). “A geochemical and geophysical assessment of coastal groundwater discharge at select sites in maui and O’ahu, Hawai‘i,” in Groundwater in the Coastal Zones of Asia-Pacific. Coastal Research Library, Vol. 7, ed. C. Wetzelhuetter (Dordrecht: Springer).
Swarzenski, P. W., Kruse, S., Reich, C., and Swarzenski, W. V. (2007). “Multi-channel resistivity investigations of the freshwater – saltwater interface: a new tool to study an old problem,” in A New Focus on Groundwater–Seawater Interactions, eds W. Sanford, C. Langevin, M. Polemio, and P. Povince, (Wallingforg: IAHS)), 1–7.
Taniguchi, M., Burnett, W. C., Cable, J. E., and Turner, J. V. (2002). Investigation of submarine groundwater discharge. Hydrol. Process. 16, 2115–2129. doi: 10.1002/hyp.1145
Tay, Y., Todd, P., Rosshaug, P., and Chou, L. (2012). Simulating the transport of broadcast coral larvae among the Southern Islands of Singapore. Aquat. Biol. 15, 283–297. doi: 10.3354/ab00433
Wang, G., Jing, W., Wang, S., Xu, Y., Wang, Z., Zhang, Z., et al. (2014). Coastal acidification induced by tidal-driven submarine groundwater discharge in a coastal coral reef system. Environ. Sci. Technol. 48, 13069–13075. doi: 10.1021/es5026867
Weijerman, M., Gove, J. M., Williams, I. D., Walsh, W. J., Minton, D., and Polovina, J. J. (2018). Evaluating management strategies to optimise coral reef ecosystem services. J. Appl. Ecol. 55, 1823–1833. doi: 10.1111/1365-2664.13105
Willis, B., Page, C., and Dinsdale, E. (2004). “Coral Disease on the Great Barrier Reef,” in Coral Health and Disease, eds E. Rosenberg, and Y. Loya, (Berlin: Springer).
Wyatt, A., Lowe, R., Humphries, S., and Waite, A. (2010). Particulate nutrient fluxes over a fringing coral reef: relevant scales of phytoplankton production and mechanisms of supply. Mar. Ecol. Prog. Ser. 405, 113–130. doi: 10.3354/meps08508
Wyatt, A. S. J., Falter, J. L., Lowe, R. J., Humphries, S., and Waite, A. M. (2012). Oceanographic forcing of nutrient uptake and release over a fringing coral reef. Limnol. Oceanogr. 57, 401–419. doi: 10.4319/lo.2012.57.2.0401
Yamano, H., Kayanne, H., Yonekura, N., Nakamura, H., and Kudo, K. (1998). Water circulation in fringing reef located in a monsoon area: kabira Reef, Ishigaki Island, Southwest Japan. Coral Reefs 17, 89–99. doi: 10.1007/s003380050101
Zektser, I. S., and Dzyuba, A. V. (2014). Submarine discharge into the barents and white seas. Environ. Earth Sci. 71, 723–729. doi: 10.1007/s12665-013-2474-0
Keywords: Black Band Disease, submarine groundwater discharge, residence time, circulation, Mākua Reef
Citation: Oberle FKJ, Storlazzi CD, Cheriton OM, Takesue RK, Hoover DJ, Logan JB, Runyon C, Kellogg CA, Johnson CD and Swarzenski PW (2019) Physicochemical Controls on Zones of Higher Coral Stress Where Black Band Disease Occurs at Mākua Reef, Kaua‘i, Hawai‘i. Front. Mar. Sci. 6:552. doi: 10.3389/fmars.2019.00552
Received: 31 May 2019; Accepted: 21 August 2019;
Published: 18 September 2019.
Edited by:
Hajime Kayanne, The University of Tokyo, JapanReviewed by:
Hideyuki Yamashiro, University of the Ryukyus, JapanWei Jiang, Guangxi University, China
Copyright © 2019 At least a portion of this work is authored by Ferdinand K. J. Oberle, Curt D. Storlazzi, Olivia M. Cheriton, Renee K. Takesue, Daniel J. Hoover, Joshua B. Logan, Christina A. Kellogg, Cordell D. Johnson on behalf of the U.S. Government and, as regards Dr. Oberle, Dr. Storlazzi, Dr. Cheriton, Dr. Takesue, Dr. Hoover, Dr. Logan, Dr. Kellogg, Dr. Johnson, and the U.S. Government, is not subject to copyright protection in the United States. Foreign and other copyrights may apply. This is an open-access article distributed under the terms of the Creative Commons Attribution License (CC BY). The use, distribution or reproduction in other forums is permitted, provided the original author(s) and the copyright owner(s) are credited and that the original publication in this journal is cited, in accordance with accepted academic practice. No use, distribution or reproduction is permitted which does not comply with these terms.
*Correspondence: Ferdinand K. J. Oberle, foberle@usgs.gov