Storm-Induced Predator-Prey Decoupling Promotes Springtime Accumulation of North Atlantic Phytoplankton
 Francoise Morison
 Elizabeth Harvey
 Gayantonia Franzè
 Susanne Menden-Deuer
- 1Graduate School of Oceanography, University of Rhode Island, Narragansett, RI, United States
- 2Skidaway Institute of Oceanography, University of Georgia, Savannah, GA, United States
We examined the response of North Atlantic plankton population dynamics to rapid re-stratification of surface waters following a deep mixing event during spring. Over the 4-day occupation of a station, we measured phytoplankton growth and grazer/virus-induced mortality rates in dilution assays conducted across a range of light intensities. Rates were estimated from changes in chlorophyll a and the abundance of three phytoplankton groups identified by flow cytometry. Initially, biological and physical water column properties were homogeneous down to >200 m, followed by rapid shoaling of the mixed layer to 20–30 m. Initial in situ chlorophyll a concentration was 0.4 μg L–1, and phytoplankton biomass accumulated at an average rate of 0.4 d–1 over the next 2 days. When mixed layer depth was maximal, there were no mortality losses and phytoplankton growth rates increased with increased light intensity. After shoaling, grazing rates increased, but never matched the magnitude of phytoplankton growth rates. When the mixed layer was shallowest, growth rates exceeded >1 d–1 at all non-dark light intensities. Chlorophyll a based grazing rates were consistent across light levels (∼0.3 d–1) and were highest on Synechococcus (0.3–0.6 d–1) and lowest on pico-eukaryotes (∼0.2 d–1). The delay with which grazing resumed resulted in growth exceeding losses and consumption of an average of 30% of primary production. Virus-induced mortality rates were minimal across all mixing profiles and light intensities. Overall, both chlorophyll a and group-specific phytoplankton accumulation rates predicted from the shipboard experiments matched those in situ, suggesting that incubation conditions faithfully captured the growth and loss processes governing in situ population dynamics. The observations made here indicate that transient deepening of the mixed layer followed by rapid stratification provided conditions under which phytoplankton escape protistan grazing and accumulate biomass. During the physically dynamic springtime in the North Atlantic, frequent ephemeral fluctuations in the depth of mixing may represent an important mechanism governing the formation and the magnitude of the North Atlantic spring bloom.
Introduction
In the subpolar North Atlantic, the phytoplankton spring bloom stands as a yearly spectacular event of a biomass climax so large it can be seen from space (McClain, 2009). The bloom provides critical support to the marine food web (Platt et al., 2003), and largely contributes to the export of fixed carbon from the ocean surface (Turner, 2002; Alkire et al., 2012), with implications for the removal of atmospheric CO2 (Takahashi et al., 2009). Due to its ecological importance, the bloom has been studied for decades, and has been the focus of several large-scale research programs including both the 1989–1990 JGOFS and the 2008 North Atlantic Bloom Experiment (Ducklow and Harris, 1993; Alkire et al., 2012), and the British Ocean Flux Study (Savidge et al., 1992). Many hypotheses investigating the factors responsible for the bloom trigger have been proposed. As summarized in publications about the bloom (e.g., Behrenfeld and Boss, 2014; Lindemann and St. John, 2014; Morison and Menden-Deuer, 2015), a large body of work has followed early studies by Gran and Braarud (1935) and Sverdrup (1953). These studies have generally focused on physical mechanisms contributing to ocean surface stratification, and the associated release of the light limitation exerted on phytoplankton growth during the subpolar winter conditions of low light and deep mixing.
Other views have stressed that blooms occur as the result of an imbalance between growth and losses (Evans and Parslow, 1985; Banse, 1994). It is well established that the most critical loss process of primary production in the ocean is grazing, principally by microzooplankton (Steinberg and Landry, 2017). It has also become clear that viruses represent important agents of phytoplankton mortality (Brussaard, 2004; Suttle, 2007; Mojica et al., 2016). Although losses due to viral lysis remain poorly quantified (Weitz and Wilhelm, 2012), estimates of the impact of viral mortality on primary production is dwarfed by the 10-fold larger microzooplankton grazing impact (Schmoker et al., 2013; Steinberg and Landry, 2017). Thus, most emphasis has been placed on microzooplankton when examining the role of predation losses in bloom formation. Within this framework, blooms are understood to result from grazers’ failure to control primary production, which has been attributed to several mechanisms: unpalatability of blooming species that inhibit predation (Irigoien et al., 2005; Franzè et al., 2018); cold water restraint on grazers’ growth rates but not phytoplankton’s (Rose and Caron, 2007); limited grazer biomass insufficient to prevent or limit blooms due to both bottom up (food limitation) and top down (predation) controls (Sherr and Sherr, 2009).
More recently, the importance of predator-induced losses was re-examined resulting in the Disturbance-Recovery Hypothesis (DRH) (Behrenfeld et al., 2013), which posits that the yearly cycle of phytoplankton biomass is governed by the influence of seasonal variations in mixing depths and light availability on the balance between phytoplankton growth and grazing losses (Behrenfeld, 2010; Behrenfeld and Boss, 2014). The DRH is supported by both satellite (Behrenfeld, 2010) and float data (Boss and Behrenfeld, 2010), however, the lack of in situ measurements of key contributing rate processes has limited an empirically based understanding of the relative responses of phytoplankton growth and predator-induced mortality rates to mixed layer dynamics.
A unique opportunity to make such measurements presented itself during the second field campaign of the North Atlantic Aerosols and Marine Ecosystems Study (NAAMES), when rapid shoaling of the mixed layer following a storm-mediated disturbance prompted prolonged occupation of a sampling station (Behrenfeld et al., 2019), during which we concurrently quantified rates of phytoplankton growth and losses due to grazing and viral lysis under quasi in situ and light manipulated incubation conditions.
Materials and Methods
Measurements of in situ water column physical and biological properties as well as phytoplankton growth and mortality rates were conducted aboard the R/V Atlantis during the second NAAMES field campaign (May–June 2016) at station 4 (47° 39.360 N, 39° 11.398 W), which was occupied from May 24 to 27. The station occupation followed a Lagrangian approach. The occupied water mass was tracked using a float and a drifter, and the ship was repositioned at regular intervals according to their location (see Graff and Behrenfeld, 2018, for details). Recent Lagrangian re-analysis suggests that on the last day of occupation, the R/V Atlantis drifted out of the core of the occupied anti-cyclonic eddy to its periphery (A. Dellapenna, pers. communication), with potentially significant implications for the distribution and process rates of the biological constituents (Chelton et al., 2011). Thus, the data presented here focus on the plankton population dynamics within the same water mass over the first 3 days at the station.
Hydrographic Data Collection and Mixed Layer Depth Estimation
On each day of the station occupation, hydrographic data were collected using a Seabird SBE911PlusCTD equipped with sensors of chlorophyll fluorescence (WET Labs ECO-AFL/FL), beam transmission (WET Labs C-Star), turbidity (WET Labs ECO), and oxygen (SBE 43).
Incident photosynthetically active radiation (PAR) was measured as described in Graff and Behrenfeld (2018), and data presented here were obtained from the SeaWiFS Bio-optical Archive and Storage System (SeaBASS)1.
Mixed layer depth (MLD) was estimated using multiple criteria previously described in Graff and Behrenfeld (2018). Additionally, we used the CTD fluorescence profiles to determine a biologically rooted estimate of MLD (hereafter referred to as BioMLD). CTD data were smoothed using 1 m bin averages. To calculate BioMLD, we used a fluorescence threshold criterion equal to one standard deviation of the mean of positive fluorescence values. In order to eliminate potential interference due to surface non-photochemical quenching, the reference used was the maximum value in the smoothed fluorescence profile. BioMLD was determined as the shallowest depth at which the decrease in fluorescence from the reference value exceeded the threshold.
Experimental Set-Up
Incubation Experiments
To estimate virus-induced mortality, microzooplankton grazing, and phytoplankton growth rates, we used a “modified dilution assay” (Evans et al., 2003; Kimmance and Brussaard, 2010; Staniewski and Short, 2018) using the 2-point method (Worden and Binder, 2003; Chen, 2015; Morison and Menden-Deuer, 2017) in a total of 11 experiments conducted at the station (Table 1). Water for the experiments was collected from the surface (5 m) using the CTD rosette sampler. Two consecutive casts were performed in order to collect the needed volume of water. Both casts were conducted within 2 h in order for the incubations to start before sunrise and to minimize changes in water characteristics. Water from the first cast was used to generate grazer-free filtered seawater (FSW) by direct gravity-filtration of the water from the CTD Niskin bottles through a membrane filter capsule (Pall) with a pore size of 0.45 μm (Mojica et al., 2016), which allows retention of large viruses (Evans et al., 2003; Staniewski and Short, 2018). Some of the FSW was further processed through a 30 kDa tangential flow filtration system (Millipore) to obtain the virus-free diluent (TFF). The second cast was used to collect mesozooplankton-free “whole” seawater (WSW) by gently transferring seawater from the Niskin bottles into 10–20 L carboys through a silicone tube with a 200 μm mesh at the end to exclude larger grazers.
Table 1. Daily rates (d–1) of phytoplankton growth (μ), and grazer- (g) and virus-induced (v) mortality for three consecutive days at station 4 during NAAMES II.
The two dilution levels used were 100% and 20% WSW treatments. The 20% WSW dilutions were prepared as a stock in a carboy by first adding the needed proportion of either FSW (for the microzooplankton grazing assay) or TFF (for the viral mortality assay), followed by gently siphoning in the needed proportion of WSW. Each dilution treatment was further gently siphoned through silicone tubing from the stock carboys into duplicate 1.2 L polycarbonate bottles.
To ensure that the dilution method’s assumption of density-independent phytoplankton growth was met (Landry and Hassett, 1982), macronutrients were added to TFF/FSW dilutions and WSW incubation bottles (six bottles total) to a final concentration of 10 μM of both nitrate and silicate, and 1 μM of phosphate. Additionally, a set of duplicate WSW bottles was prepared without adding nutrients to serve as nutrient control.
Light Treatments
In order to quantify the balance between phytoplankton growth and grazing/viral losses for the entire mixed layer, in which cells are exposed to varying light intensities, on the first and third day at the station incubations were performed at five light intensities representing a 0–100% gradient of incoming irradiance. On the second day, incubations were conducted at only one light level targeted to represent the average light for the mixed layer. Incubation bottles were placed in four separate deck-board incubators, three of which were covered with mesh screening to obtain light levels corresponding to 20, 40, and 65% of the irradiance in an unscreened 100% light level incubator. Incubations in the dark were conducted by placing the bottles in mesh bags lined with thick opaque black plastic inserts. Bottles were incubated for 24 h, covering the time span from pre-dawn to pre-dawn the following day, during which light intensity (lux) and temperature were recorded at 5 min intervals using a Hobo (Onset) data logger placed in each incubator. Incubations were maintained at ambient sea surface temperature with ship-supplied flow-through surface seawater.
Phytoplankton Growth and Mortality Rates
Rate estimates were based both on changes in total chlorophyll a (Chla), as well as cell abundances of groups identified through flow cytometry (FC). Samples for Chla and FC analyses were taken at the start and the end of each experiment to determine rates of phytoplankton growth and losses due to grazing and viral lysis.
Chla concentration was determined from triplicate 180 ml subsamples taken from each initial dilution stock and after 24 h from each incubation bottle. Chla extraction and determination followed Graff and Rynearson (2011), except that extraction took place in the dark at room temperature for 12 h in 96% ethanol (Jespersen and Christoffersen, 1987). Initial Chla concentrations were compared to those obtained from High Performance Liquid Chromatography (HPLC) analysis as described in Graff and Behrenfeld (2018). HPLC data were obtained from SeaBASS.
Cell abundances were determined from triplicate and single 200 μl aliquots from the dilution stock and each incubation bottle, respectively, analyzed live using a Guava Technologies easyCyte BG HT flow cytometer (EMD Millipore). Three major phytoplankton groups (i.e., Synechococcus sp., pico-, and nano-eukaryotes) were distinguished based on their forward scatter and red (695/50) emission characteristics with 488 nm excitation, and orange (620/52) emission parameters with 532 nm excitation. Instrument-specific easyCheck beads were used for quality control and all samples were run at 0.24 μl s–1 for three min.
The net rate of change in either Chla or abundance (k, d–1), often referred to as the “apparent” phytoplankton growth rate, was estimated using the equation k = 1/t ln (Pt − P0), in which t is the incubation time in days, and P0 and Pt are the Chla concentration or abundance of each phytoplankton group at the beginning and the end of the experiment, respectively. Rates (d–1) of total mortality (m = grazer (g) + virus (v)) and of grazer-induced mortality (g, d–1) were estimated using the equation m (or g) = (kd − k)/(1 − D), in which D represents the realized fraction of WSW in the diluted treatment, and Chla based and FC-based k values are used for Chla-based and group specific rates, respectively. Virus-induced mortality rates (v, d–1) were then calculated as the difference between m and g. To determine if total mortality and grazing rates were significantly different from zero and significantly different from each other, k in each of the dilution treatments were compared using one-way Analysis of Variance followed by a post hoc Tukey’s Honest Significant Difference test (α = 0.05). As is customary, non-significant mortality rates were set to zero (Calbet and Landry, 2004). Phytoplankton Chla-based instantaneous growth rates and group specific FC-based division rates (μ, d–1) were determined from the equation μ = m + k1, using the relevant k values. Negative values of mortality rates, which result when the phytoplankton apparent growth rate (k) is lower in the diluted than in the undiluted treatments, indicate a violation of a central assumption of the dilution method (Landry and Hassett, 1982). Thus in case of statistically significant negative mortality rates, losses were considered undetectable, and in the absence of a loss estimate, μ was equaled to k1.
Photoacclimation
Photoacclimation refers to the phenotypic responses of phytoplankton cells to irradiance changes (Graff and Behrenfeld, 2018 and references therein). Among these responses, adjustment in cellular pigment content and change in the Chla to carbon ratio are inherent and most relevant to incubations, as they can introduce unwanted artifacts in the estimation of phytoplankton growth rates based on changes in Chla (Gutiérrez-Rodríguez et al., 2010 and references therein). Thus we calculated a photoacclimation index (Phi) from FC measurements of red fluorescence (FLR) to forward scatter ratio (FLR:FSC), the latter used as a proxy for Chla:carbon. Initial and final ratios were obtained for each of the three major phytoplankton groups, weighted according to each group’s contribution to total FLR, and summed to obtain an overall ratio for the entire phytoplankton population. Phi was calculated as the ratio of the overall FLR:FSC in the final water samples to the corresponding initial FLR:FSC. In order to avoid artifacts due to changes in pigment content, Phi was applied in the calculation of k, using the equation k = 1/t × ln ([Pt/Phi]/P0). To estimate in situ photoacclimation, the same procedure was followed, except that Phi was calculated using the initial FLR:FSC ratios of consecutive days.
Experimentally Predicted vs. Observed Accumulation Rates
In order to assess how well the process rates measured in the incubations reflected the in situ dynamics, we compared the experimentally predicted accumulation rates with those based on in situ observations made on consecutive days at the station. For this comparison, when possible we used rates obtained under the incubation light intensity in which Phi was closest to in situ Phi, which we assumed to indicate that in situ and incubation light conditions were similar.
Plankton Species Composition and Particle Size Distribution
In addition to Chla and FC measurements, subsamples of WSW used in the dilution experiments were analyzed live using a benchtop B3 series FlowCAM (Fluid Imaging Techonologies, Inc.) to obtain a qualitative description of the larger (>6 μm) phytoplankton taxa not captured by flow cytometry. Large aliquots of source seawater (2–4 L) were concentrated three–sixfold over a 5-μm mesh. Volumes of 5–7 ml of the concentrated sample, of which between 5 and 9% was imaged, were analyzed at 10× or 20× magnification using a 100 or 50 μm standard flow cell in fluorescence trigger mode.
To characterize the species composition and biomass of the grazer community, well-mixed 500 ml subsamples of the initial WSW were preserved in a 2% acidified Lugol’s solution (Menden-Deuer et al., 2001). Back in the laboratory, samples were left to settle undisturbed for several weeks. At the time of analysis, samples were concentrated by gently siphoning out the top ∼350 ml, after which microzooplankton were enumerated using the Utermöhl (1958) method. Settled volumes of 10–25 ml were used, which corresponded to 20–100 ml of unconcentrated sample, and the entire surface area of the chamber was counted using an inverted microscope at 200× magnification. Microzooplankton were identified to major taxon following Dodge (1982) for dinoflagellates and Strüder-Kypke et al. (2002) for ciliates, and were sized using an eyepiece micrometer. All ciliates and >15 μm dinoflagellates were enumerated. Some dinoflagellates could not be assigned to specific taxa and were instead grouped into size categories. Few dinoflagellates have been found to be strictly heterotrophic. Many function as mixotrophs (Jeong et al., 2010; Flynn et al., 2013), and even chlorophyll and plastid containing dinoflagellates are capable of phagotrophy (Stoecker et al., 2017), thus all dinoflagellates were included in the counts as potentially herbivorous. Although heterotrophic nanoflagellates contribute to the grazing rates measured, they were not enumerated as the Utermöhl method underestimates their abundance (Davis and Sieburth, 1984). Microzooplankton biomass was estimated based on approximated geometric shapes and published volume to carbon conversion factors (Putt and Stoecker, 1989; Menden-Deuer and Lessard, 2000).
The abundance and size distribution of all particles were measured using a MultisizerTM 3 Coulter Counter® (Beckman Coulter). Source water used in the dilution experiments was sub-sampled into 10 ml aliquots, 2 ml of which were counted using a 100 μm aperture. The particle size abundance spectrum for counts ranged from 2.0 and 60 μm at a default bin width of 0.2 μm.
Results
Temporal Evolution of Physical Conditions
The first CTD cast at Station 4 on May 24, 2016 revealed a deeply mixed water column, with homogeneous profiles of physical and biological properties from the surface to ∼200 m, resulting from a storm system that affected the study region prior to our arrival (see Graff and Behrenfeld, 2018, for details). All but one approach to hydrologically defining MLD yielded MLD estimates of ≥189 m, including MLD based on a density gradient-criterion (194 m), which best agreed with profiles of buoyancy frequency obtained for the whole period at station (Graff and Behrenfeld, 2018). Differences often arise between hydrologically defined MLD and the depth to which phytoplankton are actually mixed (Brainerd and Gregg, 1995; Brody and Lozier, 2014; Franks, 2015; Lacour et al., 2017), yet in this case all estimates, including the BioMLD estimate, agreed and indicated a deep mixed layer (Figure 1), suggesting recent deep mixing of phytoplankton. All estimates of MLD also agreed that a significant shoaling of the ML occurred over the following days. According to the density gradient criterion, by the end of day 1 the ML had decreased to 11 m (Figure 1). During this same time period, BioMLD showed that phytoplankton were still homogeneously distributed down to 80 m (Figure 1), a ML shoaling of >150 m, and resulting in a substantial increase in the light available for photosynthesis. It is noteworthy that the rate of shoaling estimated by physical properties was much more rapid than the gradual shoaling in Chla fluorescence (Figure 1), reflecting the different time scales of biological and physical processes. In this case, the BioMLD probably provides a better reflection of the MLD as far as biological constituents and characteristics are concerned, and may be a superior metric for determining MLD for biological processes. By the middle of day 2 and until the end of the station occupation, all MLD estimates indicated a sustained period of water column stratification (Figure 1).
Figure 1. Evolution of mixed layer depth (m) based on density gradient (clear diamond symbols) and fluorescence threshold (BioMLD, solid dots). See section “Materials and Methods” for description of estimates.
On the first day, integrated incident PAR was 49 mol m–2 d–1, the highest recorded during the station occupation. The next days spent at S4 were generally overcast. As a result, integrated incident PAR decreased, with values of 21 and 28 mol m–2 d–1 for day 2 and day 3, respectively.
In situ Phytoplankton Community Dynamics
When the water column was deeply mixed, Chla concentration in the ML was 0.4 (±0.03) μg L–1. A regression of HPLC vs. shipboard extracted Chla for the entire May field campaign showed excellent agreement between the two measurements (R2 = 0.99, p < 0.0001). Overall S4 measurements of extracted Chla were on average within ±6% of Chla estimates from HPLC analysis (Figure 2A). The general agreement between measures of extracted Chla and FC total red fluorescence in all samples analyzed (R2 = 0.96, 0.98, and 0.93 for day 1, 2, and 3, respectively) indicates that in general, the FC analysis captured the bulk of the phytoplankton community, which was dominated by small cells. Among the phytoplankton groups distinguished by FC, picoeukaryotes made up the largest proportion of both total red fluorescence (75%; Figure 2A) and total cell abundance (89%; Figure 2B). Synechococcus represented 9% of total abundance. The low abundance of nanoeukaryotes puts relatively less confidence on the rate estimates of this group compared to the dominant picoeukaryotes. For phytoplankton >6 μm, FlowCAM analyses also showed highest abundance (68%) of cells in the smallest (6–10 μm) size range. Analysis of the abundance of all particles using the Coulter Counter showed trends similar to the other instruments, with particles <5 μm representing 94% of the total. Thus, all assessments performed agreed that small cells, primarily in the pico-size range, dominated phytoplankton biomass and abundance.
Figure 2. Characterization of the phytoplankton community during the occupation of station 4 during NAAMES II: (A) Contribution to total red fluorescence (stacked columns, left y-axis) by each of three phytoplankton populations distinguished by flow-cytometry (SYN, Synechococcus; PICO, Picoeukarytoes; NANO, Nanoeukaryotes), and chlorophyll a (line plots, right y-axis) from both pigment extraction and HPLC analysis. (B) Phytoplankton abundance per group (line plots, right y-axis) and contribution (%) of each group to total abundance (stacked columns, left y-axis).
As the ML shoaled, Chla concentration increased by ∼39 and ∼23% on day 2 and 3, respectively (Figure 2A). These changes in Chla concentration underestimated changes in biomass, since in situ phytoplankton photo-physiologically adjusted to ML shoaling and higher mixed layer irradiance, as was evident by the observed decrease in the FLR:FSC ratio. This resulted in Phi values of 0.85 and 0.8 for day 1–2 and day 2–3, respectively. When Phi was included in the estimation of accumulation rates on day 1 and day 2 rates were significantly higher than if photo-acclimation was ignored (0.49 vs. 0.32 d–1 and 0.42 vs. 0.19 d–1, respectively, p < 0.0001).
Concurrent to shoaling of the ML, the in situ mixed-layer abundance of the three phytoplankton groups increased, albeit not always at the same rate (Figure 2B). From day 1 to day 2, both Synechococcus and picoeukaryote in situ cell concentration increased at a rate of ∼0.5 d–1, whereas no increase in the abundance of nano-eukaryotes was measured. As the ML shoaled, however, all groups’ abundance increased at rates of 0.6, 0.8, and 1.3 d–1 for Synechococcus, pico-, and nanoeukaryotes, respectively. Differences in each phytoplankton group’s in situ accumulation rates resulted in small changes in the contribution of each group to total abundance (Figure 2B). Most notable was the constantly high proportion of picoeukaryotes (89–91%).
Microzooplankton Community Dynamics
The initial concentration of microzooplankton totaled 3590 cells L–1, the majority of which (69%) were <20 μm ESD (Figure 3A). Microzooplankton consisted of roughly equal proportions of 48% dinoflagellates, belonging mostly to the Gymnodinium and Gyrodinium genera, and of 52% ciliates, the most abundant (44%) of which was Lohmaniella oviformis. Microzooplankton biomass was 2.4 μg C L–1 (Figure 3B), and because of their larger size, the largest contribution to total biomass (56%) was from organisms >20 μm. Along with L. oviformis, most of the identified ciliates were considered heterotrophic, representing ≥96% of both ciliate abundance and biomass (Figure 3C). Similarly, the majority of dinoflagellates were heterotrophic species, representing 72% of both dinoflagellate abundance and biomass (Figure 3C).
Figure 3. Microzooplankton community composition during the first 3 days of occupation of station 4 during NAAMES II: Size distribution of ciliates and dinoflagellates in terms of (A) abundance (103 cells L–1); (B) biomass (μg C L–1); (C) Contribution (%) of ciliates and dinoflagellates as a function of their trophic mode (Mix, mixotrophy; Het, heterotrophy).
In the early stage of ML shoaling (day 1–day 2), there was minimal change in the abundance and biomass of microzooplankton, and in their group and size distribution (Figures 3A,B). Total concentration on day 2 was 11% lower than on day 1 (3185 L–1), whereas biomass increased by 6%, largely due to the appearance of >20 μm ciliates of the Strobilidium and Strombidium genera that were not recorded on day 1. On day 3, microzooplankton abundance had increased by 32% while biomass had increased by 67%, largely reflecting the increase in the abundance of >20 μm ciliates (Figure 3A). Although the increase in larger grazers might have been a response to the increase in larger prey (Figure 2B), it was also accompanied by a 28% increase in the proportion of species known to be mixotrophic, principally Strombidium spp. (Figure 3C).
Phytoplankton Growth and Mortality Rates
Growth and mortality rates from incubation experiments are presented in Table 1. The low abundance of nanoeukaryotes on the first two days (∼300 cells ml–1) precludes robust rate estimation, and thus rates for that group for days 1 and 2 are not reported. On the first day, phytoplankton collected from the deeply mixed water column showed the anticipated growth response to the gradient of light availability in the incubations, both at the community level and at the group level. Phytoplankton growth rates (μ) generally increased with increasing light intensity, with signs of photo-inhibition at the highest light intensity for Synechococcus. Based on Chla, μ ranged from 0.2 (±0.19) to 0.8 (±0.13) d–1 across the light gradient. Although many of the incubation light intensities likely exceeded in situ light availability in the deeply mixed water column, the growth response of phytoplankton to the gradient of light indicated phytoplankton’s potential to immediately exploit improved light conditions and in the absence of losses, accumulate at high rates. Based on the in situ and incubations photoacclimation response, average in situ light conditions were most similar to an incubation light level of ∼5% (Figure 4). Predicted in situ μ can be inferred from the growth to light relationship, which yields a community μ estimate of ∼0.4 d–1. Under deep mixing, Chla-based estimates indicated no grazing or viral lysis losses, corroborated by no losses of picoeukaryotes, except at the highest light intensity. For Synechococcus, loss rates were significantly negative except at the highest light intensity, indicating a violation of the method’s assumptions, and were thus considered undetectable. Due to this group’s minimal contribution to total Chla, however, its dynamics had limited influence on the overall community estimates. Thus in the absence of losses due to either grazing or viral lysis, and assuming absence of other potential loss processes not measured here, phytoplankton biomass was predicted to accumulate, in accord with in situ observations.
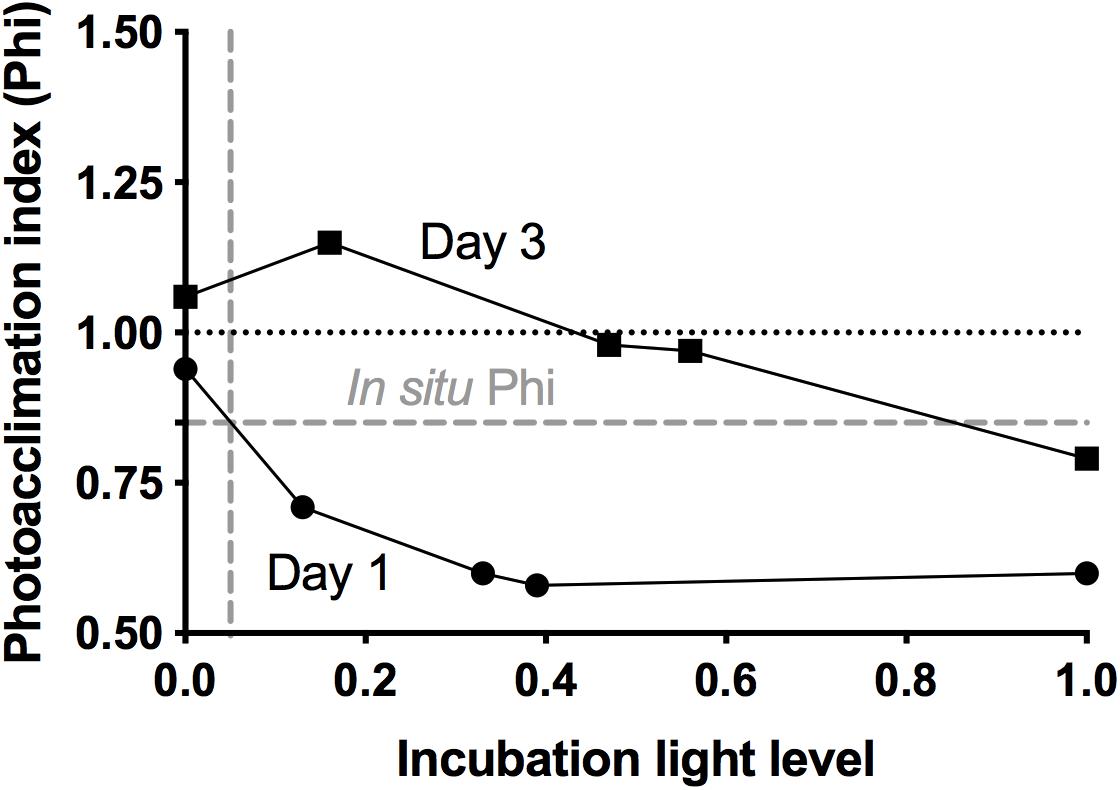
Figure 4. Photoacclimation index (Phi), calculated from flow cytometry measurements of 24 h changes in red fluorescence to forward scatter ratios, as a function of incubation light level, for day 1 and day 3 at station 4 (NAAMES II). Dashed gray lines show calculated in situ Phi and corresponding inferred in situ light level for day 1.
As the ML shoaled on day 2, rate measurements performed at a light intensity of ∼59%, yielded a community μ of 1.04 (±0.15) d–1, higher than any growth rate observed in the deep mixing phase, despite the decrease in incoming PAR. All groups divided at rates equivalent to ≥ one doubling per day. Phytoplankton growth rates continued to exceed mortality losses. Community-based grazing, presumably responding to the ongoing ML shoaling, was 0.44 ± 0.08 d–1, removing an estimated 42% of primary production. Undetectable grazing on Synechococcus and lack of grazing on picoeukaryotes suggests that Chla-based estimates resulted from grazing on larger cells, which would have been suitable prey for the increasingly abundant >20 μm ciliates. No virus-induced mortality was detected.
When MLD was shallowest, community μ increased relative to the previous days and exceeded 1.0 d–1 at all light intensities except in the dark. Division rates for pico- and nanoeukyotes were of similar magnitude. Division rates for Synechococcus were lower than for other groups, but still equivalent to ≥ one doubling per day. Even in the dark, Synechococcus division rate was 0.43 ± 0.08 d–1, a rate that may have resulted from a residual cell division fueled by prior days energy gains. Phytoplankton mortality rates lagged behind growth rates. Chla-based grazing rates were consistent (∼0.3 d–1) across all light intensities except 100%, at which no grazing was detected. At light intensity similar to in situ, grazing removed an average of 22% community primary production. Group-specific grazing rates and grazing impact on phytoplankton varied among groups. At light intensity similar to in situ, grazing removed 97% of Synechococcus primary production, whereas grazing impact on picoeukaryotes and nanoeukaryotes represented ∼16 and 30% of their production, respectively. No grazing was detected on any group in the dark, where instead viral mortality (0.5 ± 0.06 d–1) was the primary loss factor of Synechococcus. Other limited, group-specific viral losses were measured, but not maintained at all light intensities.
For the days when both incubation and in situ data are available, with few exceptions, the phytoplankton accumulation rates from the experiments compared well to the observed in situ phytoplankton biomass dynamics (Figure 5), both at the community level (Chla) and at the group level. There was no significant difference between predicted and observed estimates (paired t-test, p = 0.717), indicating that the in situ conditions where generally well characterized by the bottle incubations. Unlike on previous days, no comparison between experimental results and in situ phytoplankton dynamics was possible on day 3, because we failed to maintain a Lagrangian observation scheme, but experimental estimates of μ (Table 1) were of a magnitude that would have required high rates of mortality to reverse the biomass accumulation trend observed on the previous days.
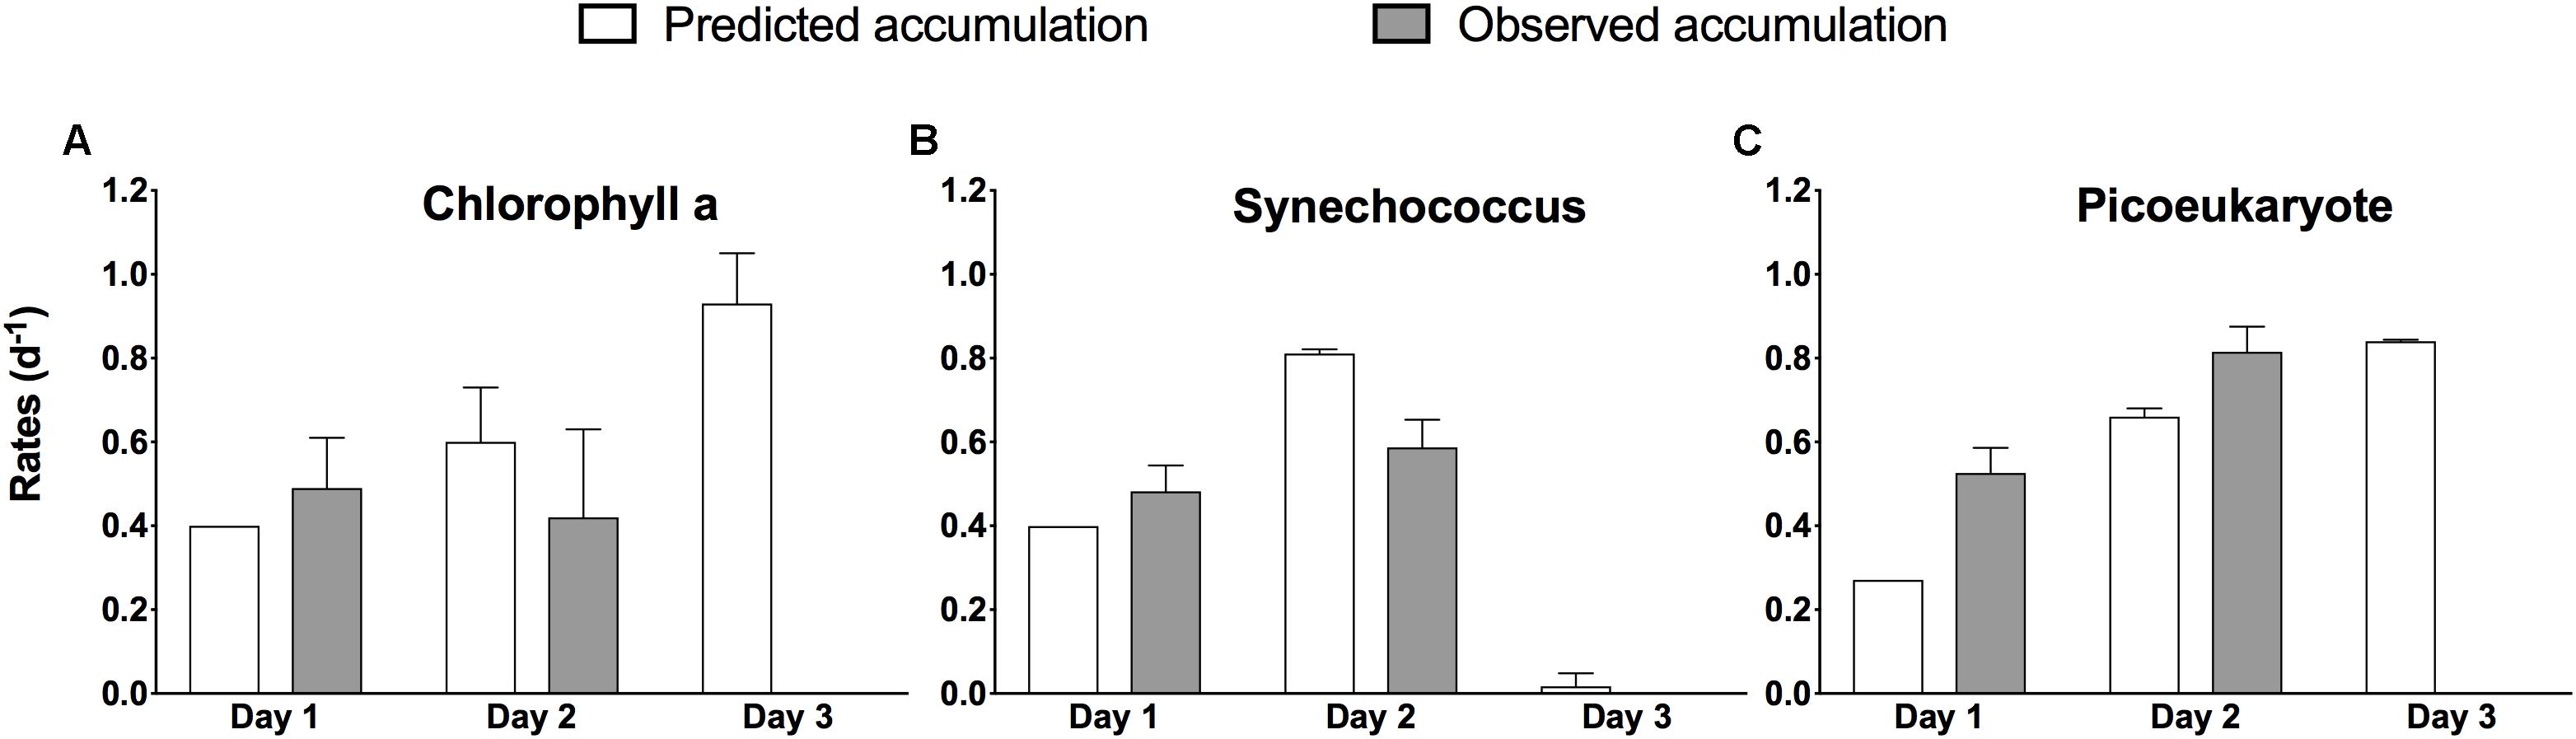
Figure 5. Comparison between accumulation rates predicted experimentally (white bars) and those observed in situ (gray bars) during the occupation of S4 during NAAMES II. Rates are based on change in total chlorophyll a (A) and based on change in abundance for Synechococcus (B), and pico-eukaryotes (C) and are given per day ±1 SD of the mean of duplicate experiments, except for Day 1 predicted rates (no error estimate). Nanoeukaryotes contributed <2% of total abundance and are omitted.
Discussion
Mixed layer shoaling has been hypothesized as a process that tightens trophic coupling (Evans and Parslow, 1985; Behrenfeld and Boss, 2014). However, empirical observations, the underlying mechanisms, and the time scale at which these processes may unfold are not well documented in situ. Here we provide a coherent, quantitative documentation of the spatial and temporal scales of rapid phytoplankton biomass accumulation induced by a deep mixing event, and reveal the underlying mechanism in the decoupling of production and predation loss. Phytoplankton’s capacity to rapidly exploit newly available light accelerates its recovery relative to grazing, resulting in growth exceeding losses.
The experimentally estimated population dynamics presented here were remarkably consistent with the changes in phytoplankton abundance observed in situ, suggesting that the incubations captured the dominant drivers and temporal scales of phytoplankton population dynamics for this system. It thus implies a minimal influence of loss factors other than the ones measured here on phytoplankton biomass dynamics, particularly losses due to potential grazing by copepods and other mesozooplankton. Although not simultaneous to the present study, we made several measurements of mesozooplankton grazing during the May 2016 NAAMES campaign (Morison et al., submitted), and found limited impact of mesozooplankton grazing on primary production across physically and biologically variable locations in the NAAMES region. Numerous previous North Atlantic studies have also shown under-utilization of phytoplankton biomass by mesozooplankton, with copepod grazing removing between 2.7% (Dam et al., 1993) and 13.7% (Halvorsen et al., 2001) of primary production. Thus phytoplankton losses due to mesozooplankton grazing during the deep mixing-restratification event described here were likely minimal.
As the mixed layer shoaled following a deep mixing event, a sustained period of largely positive phytoplankton accumulation rates was observed. These positive accumulation rates were driven by two concurrent mechanisms: First, a decoupling between microzooplankton consumption of phytoplankton, as indicated by either no grazing (day 1) or grazing rates lower than phytoplankton growth (day 2 and 3); second, improved light conditions as the mixed layer shoaled, likely accompanied by nutrient entrainment, resulting in high phytoplankton growth rates that often exceeded one division per day. Interestingly, while differences existed among phytoplankton groups in terms of the degree of coupling between division and loss rates, all three groups exhibited rapid growth rates in response to the shoaling of the mixed layer. While it has been suggested that small phytoplankton cells cannot profit from sporadic improved growth conditions (Irigoien et al., 2005), the results presented here indicate that small phytoplankton respond to the same physical improvement of growth conditions thought to favor growth of larger phytoplankton taxa, supporting the “rising tide idea” (Barber and Hiscock, 2006). Thus, the storm-induced deepening of the mixed layer followed by rapid shoaling universally impacted the decoupling of predator-prey interactions and enhancement of phytoplankton growth rates across phytoplankton size classes, highlighting the strong coupling between physics and biological dynamics.
Several factors may have influenced the delayed response of grazing relative to phytoplankton growth. Although microzooplankton can grow at rates similar to phytoplankton (Sherr et al., 2003), growth rates of microzooplankton exhibit a functional response to prey abundance (Sherr and Sherr, 2009). Initial microzooplankton biomass at S4 was low compared to global measurements (Irigoien et al., 2004, 2005), which likely contributed to the initial lack of predator-induced phytoplankton mortality (Sherr and Sherr, 2009). Interestingly, the increase in microzooplankton observed over the occupation of S4 was characterized by an increase in the proportion of grazers known to be mixotrophic. It has been argued that the presence of chloroplasts within mixotrophs can lead to an underestimate of Chla-based grazing rates by artificially increasing the apparent growth rate in the undiluted treatment (Landry et al., 1995). If such an effect occurred in our experiments, it could have magnified the imbalance between Chla-based growth and grazing rates, however, this is not supported by the group-specific dynamics, which show a very similar pattern in the positive accumulation rates.
Ramifications of the predator-prey decoupling induced by the deep mixing event likely continued to act even as the mixed layer shoaled. The physical disturbance diluted the plankton population and decreased the rates of encounter between microzooplankton and their prey (Landry and Hassett, 1982; Visser and Kiørboe, 2006; Behrenfeld, 2010), which may have imposed a period of starvation for grazers (Sherr and Sherr, 2009; Sherr et al., 2009). It has been demonstrated that, when feeding resumes following starvation, microzooplankton growth responses are delayed (Anderson and Menden-Deuer, 2017), contributing to low population-level grazing pressure. Further, it is well known that predators exhibit preference for certain prey types and/or sizes (Hansen et al., 1994, 1997) and that the nutritional value or palatability of the prey can influence feeding (Strom, 2002 and references within). Thus, grazing is not necessarily a function of total prey availability but rather of a suitable match between predator type and available prey (Menden-Deuer and Kiørboe, 2016), which the deep mixing event could have disrupted or rendered difficult. Thus, several independent processes all contributed to a decoupling of production and predation rates, facilitating the observed phytoplankton biomass accumulation as the mixed layer shoaled.
The measurements made here indicate that virus-induced mortality was largely absent over the course of the station occupation. The ability of the modified dilution method to detect viral lysis may have influenced the paucity of virus-induced mortality rates observed. Individual taxa likely experience different levels of viral mortality that, when averaged using bulk metrics such as Chl a, may result in undetectable rates, unless the most affected taxon dominates the phytoplankton community biomass. Host mortality due to viruses may not be captured if virus lytic cycles exceed the duration of the incubation period (24 h) used in the dilution experiment. Further, rates of viral mortality measured via the modified dilution experiment inevitably carry the cumulative uncertainties of each grazing rates and total mortality rates that are used in their calculation. Although the 2-point approach used here has been demonstrated as a valid alternative to a dilution series for estimating grazing rates (Chen, 2015; Morison and Menden-Deuer, 2017), such an approach for viral dilutions remains to be assessed. As demonstrated in a recent meta-analysis, the modified dilution method suffers from a weak statistical power, even when multiple dilutions are used (Staniewski and Short, 2018). Despite these caveats, the calculated accumulation rates presented here matched well with the rates observed in situ, suggesting that viral lysis negligibly contributed to overall phytoplankton mortality.
The physical disturbance introduced by the deep mixing event likely impacted viral mortality through the same decreases in encounter rate applicable to grazers, limiting rates of infection. While the impact of vertical mixing on virus-induced mortality dynamics has not been explicitly explored, decreases in viroplankton abundances and virus-induced mortality rates as the result of increased vertical mixing have been observed (Parsons et al., 2012; Mojica et al., 2016). Many viruses exert host specificity (Kimmance et al., 2007), and favorable host-virus pairings may have been disrupted during the deep mixing event. Thus, deep mixing events have the potential to not just decouple predator-prey interactions, but all interactions that require cell-cell encounters.
The observations presented here are akin to the dynamics described in the Dilution Recoupling Hypothesis (DRH): (1) the storm-mediated deep mixing acts as a re-set of the ecosystem to winter-like physical conditions with elimination of phytoplankton losses due to grazing, and (2) although shoaling of the mixed layer favors a recoupling between growth and losses, light-driven increases in phytoplankton growth exceed mixed-layer shoaling increase in protistan herbivory, maintaining a positive balance between the two process rates (Behrenfeld, 2010; Behrenfeld and Boss, 2014). As proposed for the DRH, the disruption of predator prey encounters and resumption of light availability are governed by successive phases of the seasonal cycle, whereas the dynamics observed at S4 occur on a time-scale reduced to a few days. Thus, both predator and prey abundance and physiology during this rapid event likely differs fundamentally from that of plankton transitioning from winter to spring. Despite these differences, the fundamental mechanism of mixing facilitating phytoplankton escape from grazing pressure contributes to phytoplankton biomass accumulation in the North Atlantic during spring. Although our observations were limited to a specific eddy, mesoscale eddies are ubiquitous features, particularly in the western North Atlantic (Gaube et al., 2014; McGillicuddy, 2016). Thus, we demonstrate that the dynamics suggested by the DRH can manifest in a spatially restricted and temporally accelerated mode that may well be exemplary of the formation of the North Atlantic spring bloom.
Conclusion
Short-term physical disturbances are frequent and widespread in the North Atlantic, especially in early spring, when passing storms and diel changes in convective mixing repeatedly interrupt the seasonal stratification process (Bishop et al., 1986; Brainerd and Gregg, 1995; Koeve et al., 2002; Waniek, 2003) and counteract physical factors promoting quiescence of the surface turbulent layer (Franks, 2015). Thus, during early spring, the dynamics observed at S4 are likely to be repeated many times at different locations. In contrast with the gradual process of thermally driven stratification that leads to the formation of a seasonal thermocline and a gradual increase of phytoplankton biomass, here we show that by decoupling predator-prey dynamics, short-lived episodes of deep mixing followed by rapid stratification can result in pulses of biomass accumulation. This biophysical process may contribute to the noted patchiness of the North Atlantic spring bloom (Robinson et al., 1993; Mémery et al., 2005). Importantly, the observations made here suggest that frequent alternate successions of deep mixing events and ephemeral stratification may represent an important mechanism governing the formation and the magnitude of the North Atlantic spring bloom.
Data Availability Statement
The datasets generated for this study are available on request to the corresponding author, and are also available on SeaBASS at https://dx.doi.org/10.5067/SeaBASS/NAAMES/DATA001.
Author Contributions
EH, SM-D, and FM together designed and conducted the shipboard experiments and analyses. EH and FM performed the data analysis. GF contributed her expertise in microzooplankton enumeration and identification. FM wrote the manuscript, with significant support and contributions from all co-authors.
Funding
This work was supported by National Aeronautics and Space Administration as part of the North Atlantic Aerosol and Marine Ecosystem Study (NAAMES) (Grant Number NNX15AL2G), and in part by the National Science Foundation EPSCoR Cooperative Agreement (Grant Number OIA-1655221).
Conflict of Interest
The authors declare that the research was conducted in the absence of any commercial or financial relationships that could be construed as a potential conflict of interest.
Acknowledgments
We would like to thank Captain A. Lund and the crew of the R/V Atlantis for their excellent support during the 2016 cruise AT34. We are grateful for the outstanding scientific teams of the NASA NAAMES campaign, in the air, on land, and at sea, and for the leadership of the Chief Scientist Mike Behrenfeld (Oregon State University). We also thank our many colleagues, including Peter Gaube and Alice Dellapenna (University of Washington Applied Physics Laboratory) for sharing their evaluation of the eddy field, Jason Graff (OSU) for contributing his expertise in flow cytometry and photoacclimation, and Kristina Mojica (OSU) and Kay Bidle (Rutgers University) for advice on experimental design. Thanks to the many helping hands, including Andreas Oikonomou, Kelsey McBeain, and Nils Haentjens, and to Amanda Montalbano for logistical support. This manuscript benefited from Heather McNair’s thoughtful feedback. We also thank the reviewers whose constructive comments and suggestions helped improve the manuscript.
Footnotes
References
Alkire, M. B., D’Asaro, E., Lee, C., Jane Perry, M., Gray, A., Cetinić, I., et al. (2012). Estimates of net community production and export using high-resolution, Lagrangian measurements of O2, NO3-, and POC through the evolution of a spring diatom bloom in the North Atlantic. Deep Sea Res. Part 1 Oceanogr. Res. Pap. 64, 157–174. doi: 10.1016/j.dsr.2012.01.012
Anderson, S. R., and Menden-Deuer, S. (2017). Growth, grazing, and starvation survival in three heterotrophic dinoflagellate species. J. Eukaryot. Microbiol. 64, 213–225. doi: 10.1111/jeu.12353
Banse, K. (1994). Grazing and zooplankton production as key controls of phytoplankton production in the open ocean. Oceanography 7, 13–20. doi: 10.5670/oceanog.1994.10
Barber, R. T., and Hiscock, M. R. (2006). A rising tide lifts all phytoplankton: growth response of other phytoplankton taxa in diatom-dominated blooms. Glob. Biogeochem. Cycles 20:GB4S03. doi: 10.1029/2006gb002726
Behrenfeld, M. J. (2010). Abandoning sverdrup’s critical depth hypothesis on phytoplankton blooms. Ecology 91, 977–989. doi: 10.1890/09-1207.1
Behrenfeld, M. J., and Boss, E. S. (2014). Resurrecting the ecological underpinnings of ocean plankton blooms. Annu. Rev. Mar. Sci. 6, 167–194. doi: 10.1146/annurev-marine-052913-021325
Behrenfeld, M. J., Doney, S. C., Lima, I., Boss, E. S., and Siegel, D. A. (2013). Annual cycles of ecological disturbance and recovery underlying the subarctic Atlantic spring plankton bloom. Global Biogeochem. Cycles 27, 526–540. doi: 10.1002/gbc.20050
Behrenfeld, M. J., Moore, R. H., Hostetler, C. A., Graff, J., Gaube, P., Russell, L. M., et al. (2019). The North Atlantic aerosol and marine ecosystem study (NAAMES): science motive and mission overview. Front. Mar. Sci. 6:122. doi: 10.3389/fmars.2019.00122
Bishop, J. K. B., Conte, M. H., Wiebe, P. H., Roman, M. R., and Langdon, C. (1986). Particulate matter production and consumption in deep mixed layers: observations in a warm-core ring. Deep Sea Res. A. 33, 1813–1841. doi: 10.1016/0198-0149(86)90081-6
Boss, E., and Behrenfeld, M. (2010). In situ evaluation of the initiation of the North Atlantic phytoplankton bloom. Geophys. Res. Lett. 37:L18603. doi: 10.1029/2010gl044174
Brainerd, K. E., and Gregg, M. C. (1995). Surface mixed and mixing layer depths. Deep Sea Res. Part 1 Oceanogr. Res. Pap. 42, 1521–1543. doi: 10.1016/0967-0637(95)00068-H
Brody, S. R., and Lozier, M. S. (2014). Changes in dominant mixing length scales as a driver of subpolar phytoplankton bloom initiation in the North Atlantic. Geophys. Res. Lett. 41, 3197–3203. doi: 10.1002/2014GL059707
Brussaard, C. P. D. (2004). Viral control of phytoplankton populations—a review. Eukaryotic Microbiol. 51, 125–138. doi: 10.1111/j.1550-7408.2004.tb00537.x
Calbet, A., and Landry, M. R. (2004). Phytoplankton growth, microzooplankton grazing, and carbon cycling in marine systems. Limnol. Oceanogr. 49, 51–57. doi: 10.4319/lo.2004.49.1.0051
Chelton, D. B., Gaube, P., Schlax, M. G., Early, J. J., and Samelson, R. M. (2011). The influence of nonlinear mesoscale eddies on near-surface oceanic chlorophyll. Science 334:328. doi: 10.1126/science.1208897
Chen, B. (2015). Assessing the accuracy of the “two-point” dilution technique. Limnol. Oceanogr. Methods 13, 521–526. doi: 10.1002/lom3.10044
Dam, H. G., Miller, C. A., and Jonasdottir, S. H. (1993). The trophic role of mesozooplankton at 47°N, 20°W during the North Atlantic bloom experiment. Deep Sea Res. Part 2 Top. Stud. Oceanogr. 40, 197–212. doi: 10.1016/0967-0645(93)90013-D
Davis, P. G., and Sieburth, J. M. (1984). Differentiation and characterization of individual phototrophic and heterotrophic microflagellates by sequential epifluorescence and electron microscopy. Trans. Am. Microsc. Soc. 103, 221–227. doi: 10.2307/3226182
Dodge, J. D. (1982). Marine Dinoflagellates of the British Isles. London: Her Majesty’s Stationery Office.
Ducklow, H. W., and Harris, R. P. (1993). Introduction to the JGOFS North Atlantic bloom experiment. Deep Sea Res. Part 2 Top. Stud. Oceanogr. 40, 1–8. doi: 10.1016/0967-0645(93)90003-6
Evans, C., Archer, S., Jacquet, J., and Wilson, W. (2003). Direct estimates of the contribution of viral lysis and microzooplankton grazing to the decline of a Micromonas spp. population. Aquat. Microb. Ecol. 30, 207–219. doi: 10.3354/ame030207
Evans, G. T., and Parslow, J. S. (1985). A model of annual plankton cycles. Biol. Oceanogr. 3, 327–347. doi: 10.1080/01965581.1985.10749478
Flynn, K. J., Stoecker, D. K., Mitra, A., Raven, J. A., Glibert, P. M., Hansen, P. J., et al. (2013). Misuse of the phytoplankton–zooplankton dichotomy: the need to assign organisms as mixotrophs within plankton functional types. J. Plankton Res. 35, 3–11. doi: 10.1093/plankt/fbs062
Franks, P. J. S. (2015). Has Sverdrup’s critical depth hypothesis been tested? Mixed layers vs. turbulent layers. ICES J. Mar. Sci. 72, 1897–1907. doi: 10.1093/icesjms/fsu175
Franzè, G., Pierson, J. J., Stoecker, D. K., and Lavrentyev, P. J. (2018). Diatom-produced allelochemicals trigger trophic cascades in the planktonic food web. Limnol. Oceanogr. 63, 1093–1108. doi: 10.1002/lno.10756
Gaube, P., McGillicuddy, D. J. Jr., Chelton, D. B., Behrenfeld, M. J., and Strutton, P. G. (2014). Regional variations in the influence of mesoscale eddies on near-surface chlorophyll. J. Geophys. Res. Oceans 119, 8195–8220. doi: 10.1002/2014jc010111
Graff, J. R., and Behrenfeld, M. J. (2018). Photoacclimation responses in subarctic Atlantic phytoplankton following a natural mixing-restratification event. Front. Mar. Sci. 5:209. doi: 10.3389/fmars.2018.00209
Graff, J. R., and Rynearson, T. A. (2011). Extraction method influences the recovery of phytoplankton pigments from natural assemblages. Limnol. Oceanogr. Methods 9, 129–139. doi: 10.4319/lom.2011.9.129
Gran, H. H., and Braarud, T. (1935). A quantitative study of the phytoplankton in the Bay of Fundy and the Gulf of maine (including observations on hydrography, chemistry and turbidity). J. Biol. Board Can. 1, 279–467. doi: 10.1139/f35-012
Gutiérrez-Rodríguez, A., Latasa, M., Estrada, M., Vidal, M., and Marrasé, C. (2010). Carbon fluxes through major phytoplankton groups during the spring bloom and post-bloom in the Northwestern Mediterranean Sea. Deep Sea Res. Part 1 Oceanogr. Res. Pap. 57, 486–500. doi: 10.1016/j.dsr.2009.12.013
Halvorsen, E., Hirst, A. G., Batten, S. D., Tande, K. S., and Lampitt, R. S. (2001). Diet and community grazing by copepods in an upwelled filament off the NW coast of Spain. Prog. Oceanogr. 51, 399–421. doi: 10.1016/S0079-6611(01)00077-5
Hansen, B., Bjornsen, P. K., and Hansen, P. J. (1994). The size ratio between planktonic predators and their prey. Limnol. Oceanogr. 39, 395–403. doi: 10.4319/lo.1994.39.2.0395
Hansen, P. J., Bjørnsen, P. K., and Hansen, B. W. (1997). Zooplankton grazing and growth: scaling within the 2-2,000-μm body size range. Limnol. Oceanogr. 42, 687–704. doi: 10.4319/lo.1997.42.4.0687
Irigoien, X., Flynn, K. J., and Harris, R. P. (2005). Phytoplankton blooms: a ‘loophole’ in microzooplankton grazing impact? J. Plankton Res. 27, 313–321. doi: 10.1093/plankt/fbi011
Irigoien, X., Huisman, J., and Harris, R. P. (2004). Global biodiversity patterns of marine phytoplankton and zooplankton. Nature 429, 863–867. doi: 10.1038/nature02593
Jeong, H. J., Yoo, Y. D., Kim, J. S., Seong, K. A., Kang, N. S., and Kim, T. H. (2010). Growth, feeding and ecological roles of the mixotrophic and heterotrophic dinoflagellates in marine planktonic food webs. Ocean Sci. J. 45, 65–91. doi: 10.1007/s12601-010-0007-2
Jespersen, A. M., and Christoffersen, K. (1987). Measurements of chlorophyll a from phytoplankton using ethanol as extraction solvent. Archiv fuer Hydrobiologie 109, 445–454.
Kimmance, S. A., and Brussaard, C. P. D. (2010). “Estimation of viral-induced phytoplankton mortality using the modified dilution method,” in Manual of Aquatic Viral Ecology, eds S. W. Wilhelm, M. Weinbauer, and C. A. Suttle, (Waco, TX: American Society of Limnology and Oceanography), 65–73. doi: 10.4319/mave.2010.978-0-9845591-0-7.65
Kimmance, S. A., Wilson, W. H., and Archer, S. D. (2007). Modified dilution technique to estimate viral versus grazing mortality of phytoplankton: limitations associated with method sensitivity in natural waters. Aquat. Microb. Ecol. 49, 207–222. doi: 10.3354/ame01136
Koeve, W., Pollehne, F., Oschlies, A., and Zeitzschel, B. (2002). Storm-induced convective export of organic matter during spring in the northeast Atlantic Ocean. Deep Sea Res. Part 1 Oceanogr. Res. Pap. 49, 1431–1444. doi: 10.1016/S0967-0637(02)00022-5
Lacour, L., Ardyna, M., Stec, K. F., Claustre, H., Prieur, L., Poteau, A., et al. (2017). Unexpected winter phytoplankton blooms in the North Atlantic subpolar gyre. Nat. Geosci. 10:836. doi: 10.1038/ngeo3035
Landry, M. R., Constantinou, J., and Kirshtein, J. (1995). Microzooplankton grazing in the central equatorial Pacific during February and August, 1992. Deep Sea Res. Part 2 Top. Stud. Oceanogr. 42, 657–671. doi: 10.1016/0967-0645(95)00024-K
Landry, M. R., and Hassett, R. P. (1982). Estimating the grazing impact of marine micro-zooplankton. Mar. Biol. 67, 283–288. doi: 10.1007/bf00397668
Lindemann, C., and St. John, M. A. (2014). A seasonal diary of phytoplankton in the North Atlantic. Front. Mar. Sci. 1:37. doi: 10.3389/fmars.2014.00037
McClain, C. R. (2009). A decade of satellite ocean color observations. Annu. Rev. Mar. Sci. 1, 19–42. doi: 10.1146/annurev.marine.010908.163650
McGillicuddy, D. J. Jr. (2016). Mechanisms of physical-biological-biogeochemical interaction at the oceanic mesoscale. Annu. Rev. Mar. Sci. 8, 125–159. doi: 10.1146/annurev-marine-010814-015606
Mémery, L., Reverdin, G., Paillet, J., and Oschlies, A. (2005). Introduction to the POMME special section: Thermocline ventilation and biogeochemical tracer distribution in the northeast Atlantic Ocean and impact of mesoscale dynamics. J. Geophys. Res. 110:C07S01. doi: 10.1029/2005JC002976
Menden-Deuer, S., and Kiørboe, T. (2016). Small bugs with a big impact: linking plankton ecology with ecosystem processes. J. Plankton Res. 38, 1036–1043. doi: 10.1093/plankt/fbw049
Menden-Deuer, S., and Lessard, E. J. (2000). Carbon to volume relationships for dinoflagellates, diatoms, and other protist plankton. Limnol. Oceanogr. 45, 569–579. doi: 10.4319/lo.2000.45.3.0569
Menden-Deuer, S., Lessard, E. J., and Satterberg, J. (2001). Effect of preservation on dinoflagellate and diatom cell volume and consequences for carbon biomass predictions. Mar. Ecol. Prog. Ser. 222, 41–50. doi: 10.3354/meps222041
Mojica, K. D. A., Huisman, J., Wilhelm, S. W., and Brussaard, C. P. D. (2016). Latitudinal variation in virus-induced mortality of phytoplankton across the North Atlantic Ocean. ISME J. 10:500. doi: 10.1038/ismej.2015.130
Morison, F., and Menden-Deuer, S. (2015). Early spring phytoplankton dynamics in the subpolar North Atlantic: the influence of protistan herbivory. Limnol. Oceanogr. 60, 1298–1313. doi: 10.1002/lno.10099
Morison, F., and Menden-Deuer, S. (2017). Doing more with less? Balancing sampling resolution and effort in measurements of protistan growth and grazing-rates. Limnol. Oceanogr. Methods 15, 794–809. doi: 10.1002/lom3.10200
Parsons, R. J., Breitbart, M., Lomas, M. W., and Carlson, C. A. (2012). Ocean time-series reveals recurring seasonal patterns of virioplankton dynamics in the northwestern Sargasso Sea. ISME J. 6:273. doi: 10.1038/ismej.2011.101
Platt, T., Fuentes-Yaco, C., and Frank, K. T. (2003). Spring algal bloom and larval fish survival. Nature 423, 398–399. doi: 10.1038/423398b
Putt, M., and Stoecker, D. K. (1989). An experimentally determined carbon: volume ratio for marine “oligotrichous” ciliates from estuarine and coastal waters. Limnol. Oceanogr. 34, 1097–1103. doi: 10.4319/lo.1989.34.6.1097
Robinson, A. R., McGillicuddy, D. J., Calman, J., Ducklow, H. W., Fasham, M. J. R., Hoge, F. E., et al. (1993). Mesoscale and upper ocean variabilities during the 1989 JGOFS bloom study. Deep Sea Res. Part 2 Top. Stud. Oceanogr. 40, 9–35. doi: 10.1016/0967-0645(93)90004-7
Rose, J. M., and Caron, D. A. (2007). Does low temperature constrain the growth rates of heterotrophic protists? Evidence and implications for algal blooms in cold waters. Limnol. Oceanogr. 52, 886–895. doi: 10.4319/lo.2007.52.2.0886
Savidge, G., Turner, D. R., Burkill, P. H., Watson, A. J., Angel, M. V., Pingree, R. D., et al. (1992). The BOFS 1990 spring bloom experiment: temporal evolution and spatial variability of the hydrographic field. Prog. Oceanogr. 29, 235–281. doi: 10.1016/0079-6611(92)90005-K
Schmoker, C., Hernández-León, S., and Calbet, A. (2013). Microzooplankton grazing in the oceans: impacts, data variability, knowledge gaps and future directions. J. Plankton Res. 35, 691–706. doi: 10.1093/plankt/fbt023
Sherr, E. B., and Sherr, B. F. (2009). Capacity of herbivorous protists to control initiation and development of mass phytoplankton blooms. Aquat. Microb. Ecol. 57, 253–262. doi: 10.3354/ame01358
Sherr, E. B., Sherr, B. F., and Hartz, A. J. (2009). Microzooplankton grazing impact in the Western Arctic Ocean. Deep Sea Res. Part 2 Top. Stud. Oceanogr. 56, 1264–1273. doi: 10.1016/j.dsr2.2008.10.036
Sherr, E. B., Sherr, B. F., Wheeler, P. A., and Thompson, K. (2003). Temporal and spatial variation in stocks of autotrophic and heterotrophic microbes in the upper water column of the central Arctic Ocean. Deep Sea Res. Part 1 Oceanogr. Res. Pap. 50, 557–571. doi: 10.1016/S0967-0637(03)00031-1
Staniewski, M. A., and Short, S. M. (2018). Methodological review and meta-analysis of dilution assays for estimates of virus- and grazer-mediated phytoplankton mortality. Limnol. Oceanogr. Methods 16, 649–668. doi: 10.1002/lom3.10273
Steinberg, D. K., and Landry, M. R. (2017). Zooplankton and the ocean carbon cycle. Annu. Rev. Mar. Sci. 9, 413–444. doi: 10.1146/annurev-marine-010814-015924
Stoecker, D. K., Hansen, P. J., Caron, D. A., and Mitra, A. (2017). Mixotrophy in the marine plankton. Annu. Rev. Mar. Sci. 9, 311–335. doi: 10.1146/annurev-marine-010816-060617
Strom, S. (2002). Novel interactions between phytoplankton and microzooplankton: their influence on the coupling between growth and grazing rates in the sea. Hydrobiologia 480, 41–54. doi: 10.1023/a:1021224832646
Strüder-Kypke, M. C., Kypke, E. R., Agatha, S., Warwick, J., and Montagnes, D. J. S. (2002). The User-Friendly Guide to Coastal Planktonic Ciliate. Available at: http://www.zooplankton.cn/ciliate/ (accessed September 6, 2019).
Suttle, C. A. (2007). Marine viruses — major players in the global ecosystem. Nat. Rev. Microbiol. 5:801. doi: 10.1038/nrmicro1750
Sverdrup, H. U. (1953). On Conditions for the Vernal Blooming of Phytoplankton. ICES J. Mar. Sci. 18, 287–295. doi: 10.1093/icesjms/18.3.287
Takahashi, T., Sutherland, S. C., Wanninkhof, R., Sweeney, C., Feely, R. A., Chipman, D. W., et al. (2009). Climatological mean and decadal change in surface ocean pCO2, and net sea–air CO2 flux over the global oceans. Deep Sea Res. Part 2 Top. Stud. Oceanogr. 56, 554–577. doi: 10.1016/j.dsr2.2008.12.009
Turner, J. T. (2002). Zooplankton fecal pellets, marine snow and sinking phytoplankton blooms. Aquat. Microb. Ecol. 27, 57–102. doi: 10.3354/ame027057
Utermöhl, H. (1958). Zur Vervollkommnung der quantitativen Phytoplankton-Methodik. Mitt. Int. Ver. Theor. Angew. Limnol 9, 1–38. doi: 10.1080/05384680.1958.11904091
Visser, A. W., and Kiørboe, T. (2006). Plankton motility patterns and encounter rates. Oecologia 148, 538–546. doi: 10.1007/s00442-006-0385-4
Waniek, J. J. (2003). The role of physical forcing in initiation of spring blooms in the northeast Atlantic. J. Mar. Syst. 39, 57–82. doi: 10.1016/S0924-7963(02)00248-8
Weitz, J. S., and Wilhelm, S. W. (2012). Ocean viruses and their effects on microbial communities and biogeochemical cycles. F1000 Biol. Rep. 4:17. doi: 10.3410/B4-17
Keywords: phytoplankton, growth, microzooplankton, grazing, viral lysis, North Atlantic, spring bloom, NAAMES
Citation: Morison F, Harvey E, Franzè G and Menden-Deuer S (2019) Storm-Induced Predator-Prey Decoupling Promotes Springtime Accumulation of North Atlantic Phytoplankton. Front. Mar. Sci. 6:608. doi: 10.3389/fmars.2019.00608
Received: 15 June 2019; Accepted: 11 September 2019;
Published: 25 September 2019.
Edited by:
Kristina Dee Anne Mojica, Oregon State University, United StatesReviewed by:
Michael R. Stukel, Florida State University, United StatesYuyuan Xie, Northeast Fisheries Science Center (NOAA), United States
Copyright © 2019 Morison, Harvey, Franzè and Menden-Deuer. This is an open-access article distributed under the terms of the Creative Commons Attribution License (CC BY). The use, distribution or reproduction in other forums is permitted, provided the original author(s) and the copyright owner(s) are credited and that the original publication in this journal is cited, in accordance with accepted academic practice. No use, distribution or reproduction is permitted which does not comply with these terms.
*Correspondence: Francoise Morison, fmorison@uri.edu
†Present address: Elizabeth Harvey, Department of Biological Sciences, University of New Hampshire, Durham, NH, United States; Gayantonia Franzè, Institute of Marine Research, Bergen, Norway