Seine Plastic Debris Transport Tenfolded During Increased River Discharge
 Tim van Emmerik1,2*
  Romain Tramoy3
  Caroline van Calcar1,4
  Soline Alligant3
  Robin Treilles3
  Bruno Tassin3
  Johnny Gasperi3
- 1The Ocean Cleanup, Rotterdam, Netherlands
- 2Hydrology and Quantitative Water Management Group, Wageningen University and Research, Wageningen, Netherlands
- 3LEESU, Université Paris-Est Créteil, Créteil, France
- 4Department of Geoscience and Remote Sensing, Delft University of Technology, Delft, Netherlands
Rivers transport land-based plastic waste into the ocean. Current efforts to quantify riverine plastic emission come with uncertainty as field observations are scarce. One of the challenging aspects is the lack of consistent measurement methods that allow for comparing rivers over space and time. Recent studies have shown that simple visual observations provide a robust first-order characterization of floating and superficially suspended plastic transport, both in quantity, spatiotemporal distribution and composition. For this study, we applied this method to the river Seine, France, to provide new insights in the spatiotemporal variation in riverine plastic transport. First, we studied the response of plastic flow to increased river discharge by comparing measurements taken during low flow and high flow periods. Second, we investigated the variation of riverine plastic transport over the river length to improve our understanding of the origin and fate of riverine plastics. We demonstrate that during a period with higher river discharge, plastic transport increased up to a factor ten at the observation point closest to the river mouth. This suggests that the plastic emission into the ocean from the Seine may also be considerably higher during increased discharge. Upstream of Paris plastic transport increased only with a factor 1.5, suggesting that most plastics originate from Paris or areas further downstream. With this paper we aim to shed additional light on the seasonal variation in riverine plastic transport and its distribution along the river length, which may benefit future long-term monitoring efforts and plastic pollution mitigation strategies.
Introduction
Land-based plastics, mostly conveyed through rivers, are considered one of the main sources of marine plastic pollution (Jambeck et al., 2015; Lebreton et al., 2017). Current model estimations of plastic emission (Lebreton et al., 2017; Schmidt et al., 2017) are highly uncertain, mainly due to a lack of field data. Although it is expected that most riverine plastics are emitted in Southeast Asia (Lebreton et al., 2017; Schmidt et al., 2017), several European rivers, such as the Danube (Lechner et al., 2014), Thames (Morritt et al., 2014), and Rhine (Mani et al., 2015) are also found to contribute significantly to marine plastics pollution. Marine plastic litter has hazardous effects, such as plastic ingestion by marine fauna (Thompson et al., 2004; O Conchubhair et al., 2019), which has recently also been observed in the North and Baltic seas (Rummel et al., 2016). A better understanding of the origin and fate of plastics are necessary to effectively implement prevention and mitigation strategies.
One of the unknowns to date is the spatiotemporal variation of riverine plastic transport. Most studies focused on assessing plastic transport in specific river cross-sections (Crosti et al., 2018; van Emmerik et al., 2018) or the emission from complete river systems (Tramoy et al., 2019). Observations in the Saigon River in Vietnam, for example, demonstrated that riverine plastic transport may exhibit strong variations over the cross-section (van Emmerik et al., 2018). However, the variation of river plastic transport along the river remains unknown. Such data may shed additional light on the sources, sinks and (natural) accumulation zones of river systems. The temporal variation of river plastic transport also remains understudied. Sampling in the Los Angeles rivers suggested that there might be a considerable difference in plastic transport in different times of the year (Moore et al., 2011). Recent work on Asian rivers demonstrated that mean monthly plastic transport can vary up to an order of magnitude (van Emmerik et al., 2019a, b). However, in this specific case plastic transport was mainly related to the presence of organic material (entrapment in water hyacinths) rather than the river’s hydrological regime.
Several efforts have been made to study riverine plastic pollution in the river Seine, France. The Seine runs through the megacity of Paris and is one of the few rivers equipped with debris collection infrastructure, consisting of a network of 26 floating debris collection booms. Gasperi et al. (2014) analyzed data from the collected debris for a first regional assessment of floating debris in a river system. Further work focused on quantifying microplastics in the Seine, showing that microplastics are present in surface waters (Dris et al., 2018). Recently, Tramoy et al. (2019) used data from extracted riverine plastic waste and a conceptual model to estimate the yearly emission from the Seine into the ocean. However, in this approach the seasonal river dynamics were not taken into account. High discharge events are important drivers of material transport from river systems into the oceans. For the Seine, Chen et al. (2014) showed that 20% of the annual material flow (not including plastics) was transported by a single high discharge event. For plastics, the 2015/2016 floods in the United Kingdom were found to transport around 70% of the microplastics stored on the riverbanks (Hurley et al., 2018). In the seine, microplastic concentrations were found to be up to 15 times higher during high flow compared to low flow periods (Treilles et al., 2018). Although macroplastic debris may behave differently than sediment or microplastic transport, annual macroplastic debris transport may also be strongly influenced by high discharge events. We therefore hypothesize that increased river discharge results in increased river plastic transport.
In this paper we present the results from two multi-day field assessments: one during low discharge in September 2018, and one during high discharge in March 2019. During each assessment, the plastic transport and plastic composition were measured at three locations along the Seine. We focus on studying the variation between the measurement locations and between the two measurement periods. In this paper we aim to provide additional insight in (1) plastic transport along a river and (2) the variation in plastic transport in response to increased river discharge. This can be used for both optimizing mitigation strategies and designing long-term monitoring approaches, for the Seine River and beyond.
Materials and Methods
Study Site
The river Seine [32,000 km2 catchment area; 350 m/s mean discharge (Gasperi et al., 2014)] is a 777 km long river located in Northern France, that flows into the English Channel at Le Havre. It traverses the megacity of Paris at around 300 km from the river mouth. The basin is under heavy anthropogenic influence and has around 16.7 million inhabitants, of which 12.5 million live in Paris alone (Tramoy et al., 2019). Four measurements locations were selected for the plastic transport measurements (see Table 1 and Figure 1): Rouen (113 km upstream), Meulan-en-Yvelines (260 km upstream; only for during low discharge conditions), Triel-sur-Seine (268 km upstream; only during high discharge conditions), and Villeneuve-le-Roi (367 km upstream). The locations were selected to cover (1) a location upstream and a location downstream of Paris and (2) the location closest to the river mouth, which includes tidal influence on plastic transport. As the used methods depend on accessible bridges, Rouen was the most downstream location during this campaign. We will refer to Villeneuve-le-Roi as upstream, Meulan-en-Yvelines, and Triel-sur-Seine as middle and Rouen as downstream. Discharge was measured at Vernon (203 km upstream from river mouth) and Austerlitz (382 km upstream from river mouth), and was obtained from the French Ministry of Ecology, Sustainable Development and Energy1. Precipitation at Paris-Montsouris and Rouen-Boos was obtained from Infoclimat2.
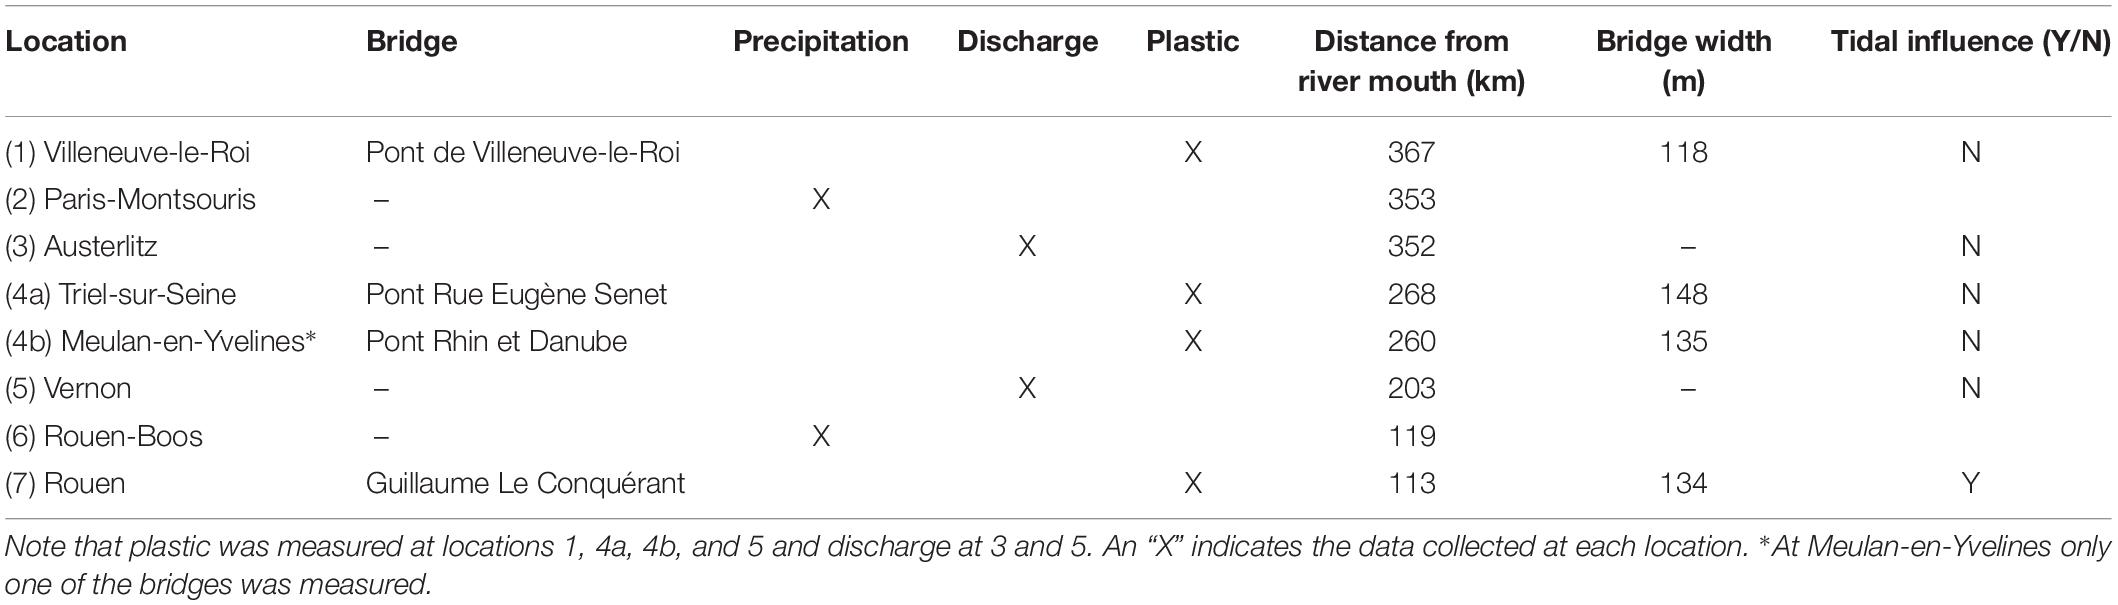
Table 1. Details of measurement locations along the Seine.
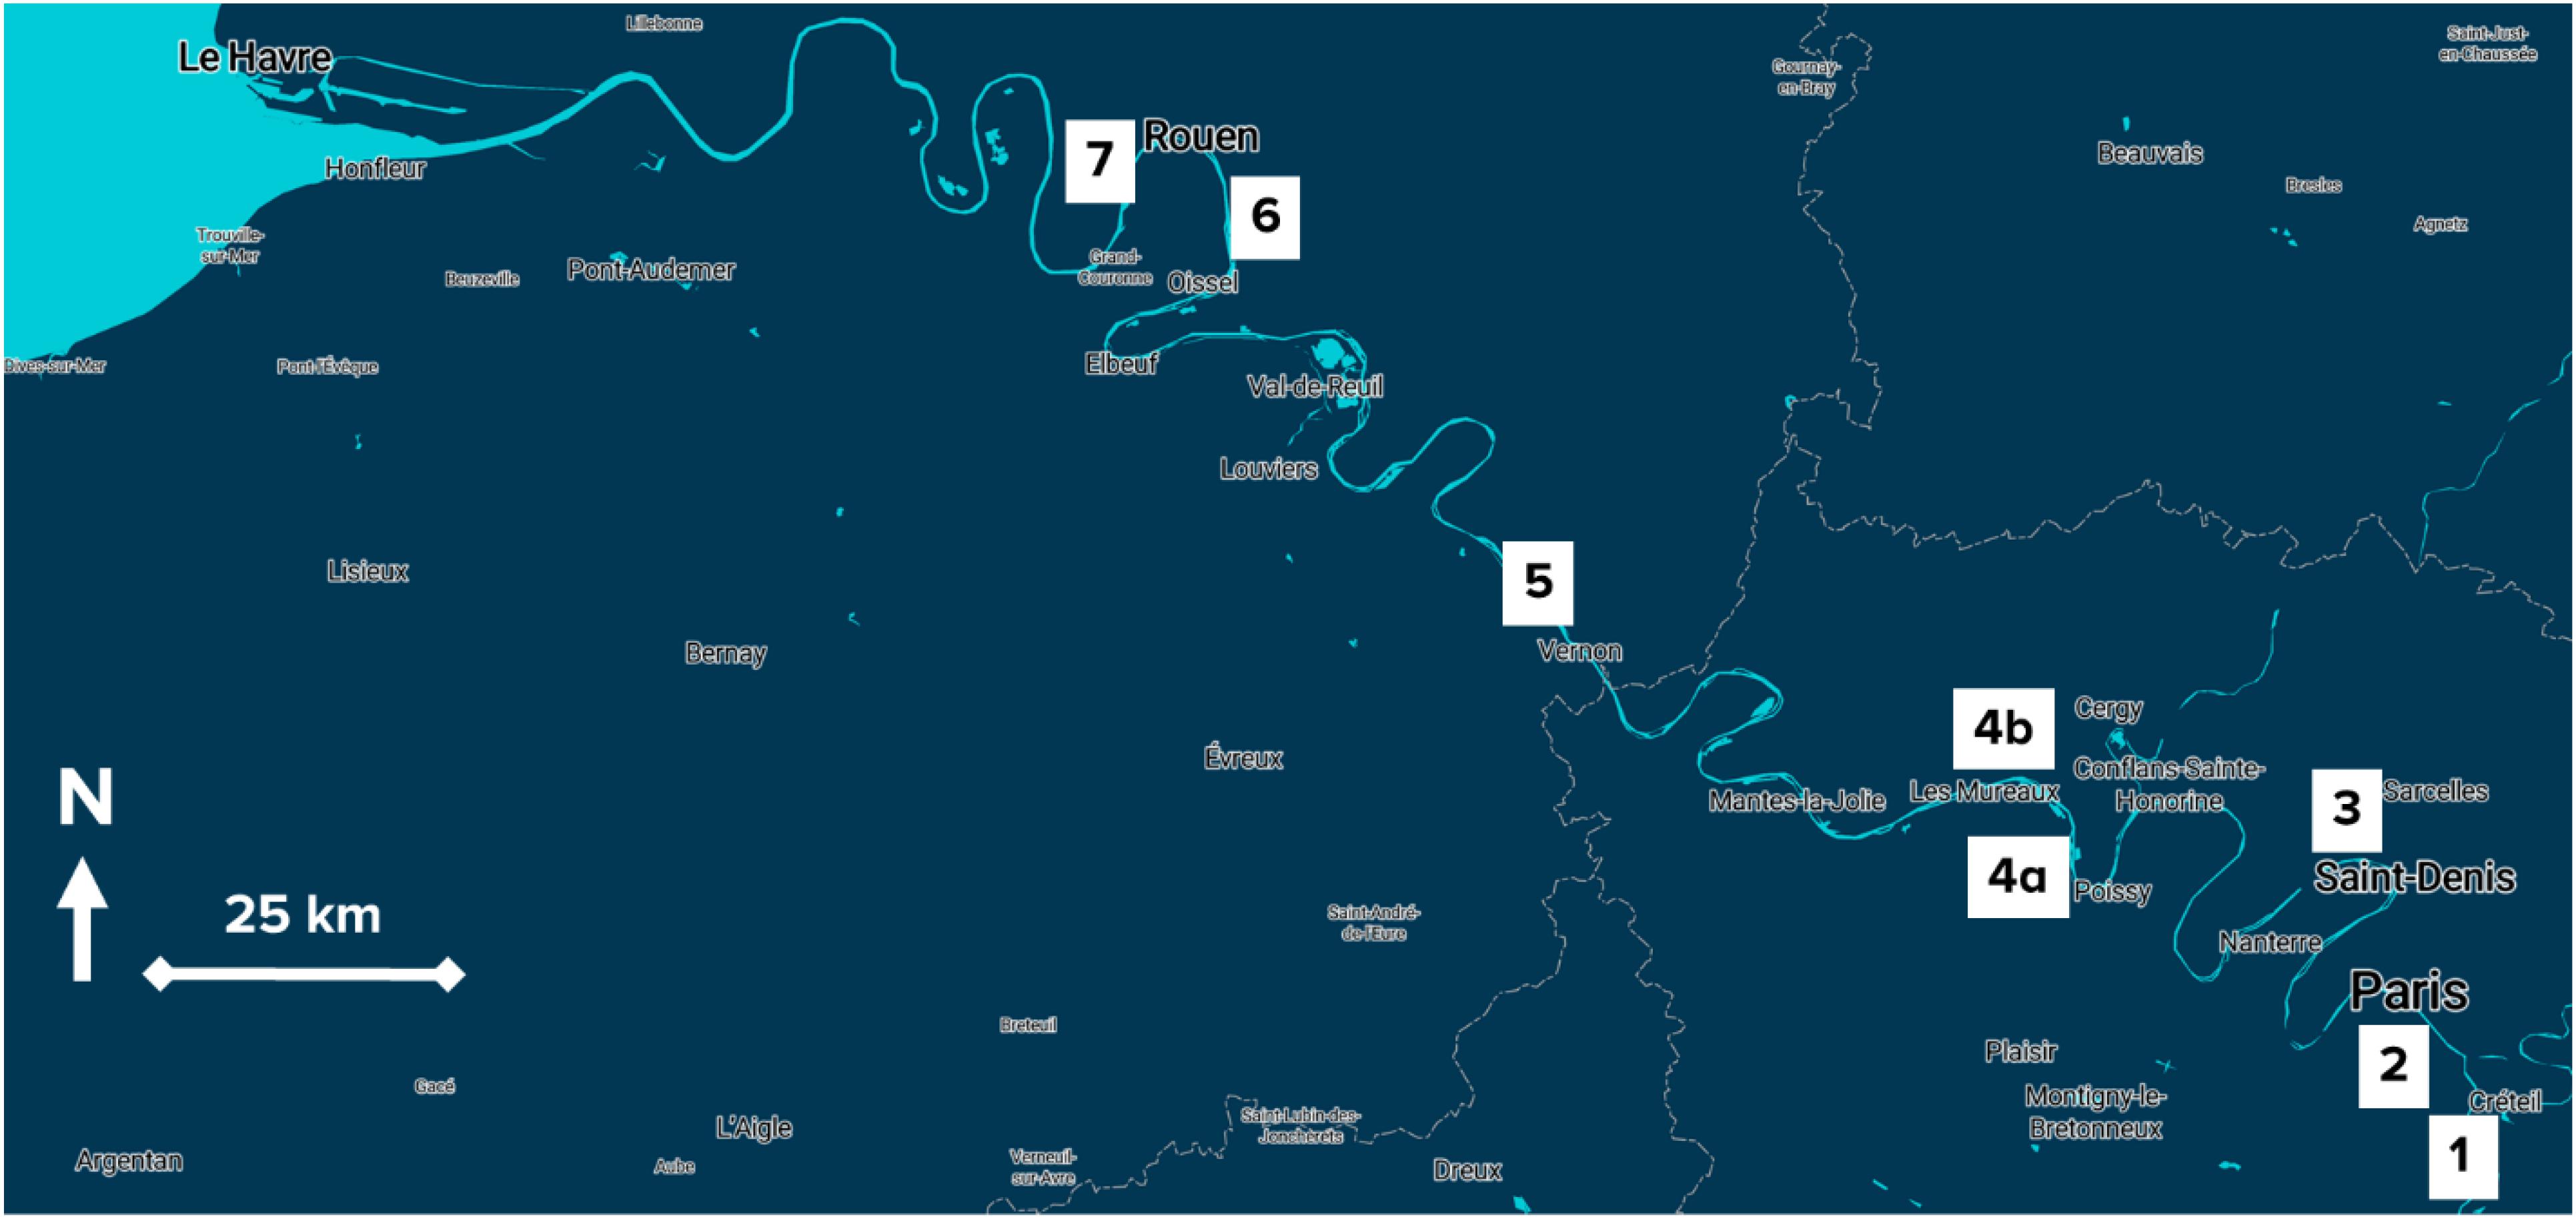
Figure 1. Overviewof measurement locations, and locations with additional precipitation and discharge data along the Seine. Numbers 1–7 indicate the locations were data was collected for this study. Note that 4a and 4b are very close to each other (8 km) and are later both considered as the location downstream of Paris.
Plastic Transport Measurements
This study focuses on floating macroplastic debris transport. To determine the plastic transport, visual counting of plastic debris (based on the approach presented by González-Fernández and Hanke (2017) was done from 17th to 21st September 2018 (low discharge and low tidal coefficients in Rouen) and 21st to 23rd March 2019 (high discharge and high tidal coefficients in Rouen). During each sampling day, hourly profiles were made between 09:00 and 17:00. Each bridge was divided into three sections with equal width. During each measurement, one observer counted all plastic items passing through the respective sections for a period between 15 and 20 min. Counting was done facing downstream, as we could identify plastic pieces more accurately. The vertical distance from the bridge to the water was on average 12 m, with maximum fluctuations of around 3 m. Each floating and superficially submerged plastic piece that was visible was counted, independent of its size. Based on visual inspection, it was estimated that the clearness of the water was stable during the measurement period, and that the first 20 cm of the water column was visible. The minimum observed debris size was estimated to be 1 cm. If the debris type was uncertain, it was not counted as plastic. For subsequent analysis, the plastic debris counts were normalized over time and distance and expressed in total number of plastic items per hour, either per section or summed to total plastic items per hour for the whole cross-section.
Estimating Net Plastic Transport
The upstream and middle locations are outside the tidal influence. For these locations, the average transport in items per hour was used to estimate the hourly transport. For Rouen, the tidal influence was taken into account through assessing the flow direction. Flow direction was derived from flow velocity, determined using water level data3 at Petit-Couronne (10 km downstream of Rouen) and Oissel (14 km upstream of Rouen):
With flow velocity v (m/s), Chezy coefficient C (m1/2/s), hydraulic radius R (m), and hydraulic gradient i (m/m). In this case we assume that the hydraulic gradient is equal to the difference in water level divided by the distance between Petit-Couronne and Oissel (24 km). As we are only interested in the direction of the flow, we do not consider the Chezy coefficient. From the flow direction, we determine the mean relative duration of each direction for both the high and low discharge measurement periods. During the low flow period, the flow was directed toward the ocean 72% of the time. During the high flow period this was 86%. This ratio was multiplied with the average hourly plastic transport rate (items/hour) to estimate the total net transport at Rouen. To assess the net transport, the hypothesis was tested that the mean of the absolute transport is equal in both directions. A two-paired t-test was used to test the null hypothesis for the population of transport measurements (items/hour) in each direction. There is no significant difference in the mean of the transport at Rouen for the different flow directions (95% confidence level, p = 0.88).
At Meulan-en-Yvelines, only 60% of the river width was monitored. For that reason, the measurement location was relocated 8 km upstream to Triel-sur-Seine during the high discharge measurements. The measurements taken at Meulan-en-Yvelines during the low flow period was scaled based on river width, to correct for the unobserved section.
Results and Discussion
Plastic Transport
Discharge of the Seine was two to three times higher at Vernon and Paris, respectively, in March 2019 compared to September 2018 (Figure 2A). Precipitation increased after September 2018 both at Paris and Rouen, though the large peak in December was only measured at Rouen (Figure 2B). A considerably higher plastic transport was measured during the high flow sampling period (Figure 3). Upstream of Paris at Villeneuve-le-Roi, the average plastic transport was 1.5 times larger in March 2019 (165 items/hour) than in September 2018 (111 items/hour). Directly downstream of Paris at Meulan-en-Yvelines/Triel-sur-Seine, the plastic transport was almost four times larger during higher flow (160 items/hour in September, 2018, 602 items/hour in March, 2019). At Rouen, the location closest to the river mouth, the average net plastic transport was measured to be ten times higher in March 2019 (1056 items/hour) than in September 2018 (106 items/hour). The additional plastic transport can be caused by several factors. First, increased rainfall rates after September 2018 may have mobilized more land-based plastics that can reach the water system. Second, (temporarily) accumulated plastics on (urban) riverbanks and on the riverbed can be remobilized through the increased flow velocity and water level. In several river systems plastics were found to be abundant on riverbanks (e.g., Rech et al., 2015; Kiessling et al., 2019), and the Seine is no exception (Tramoy et al., 2019).
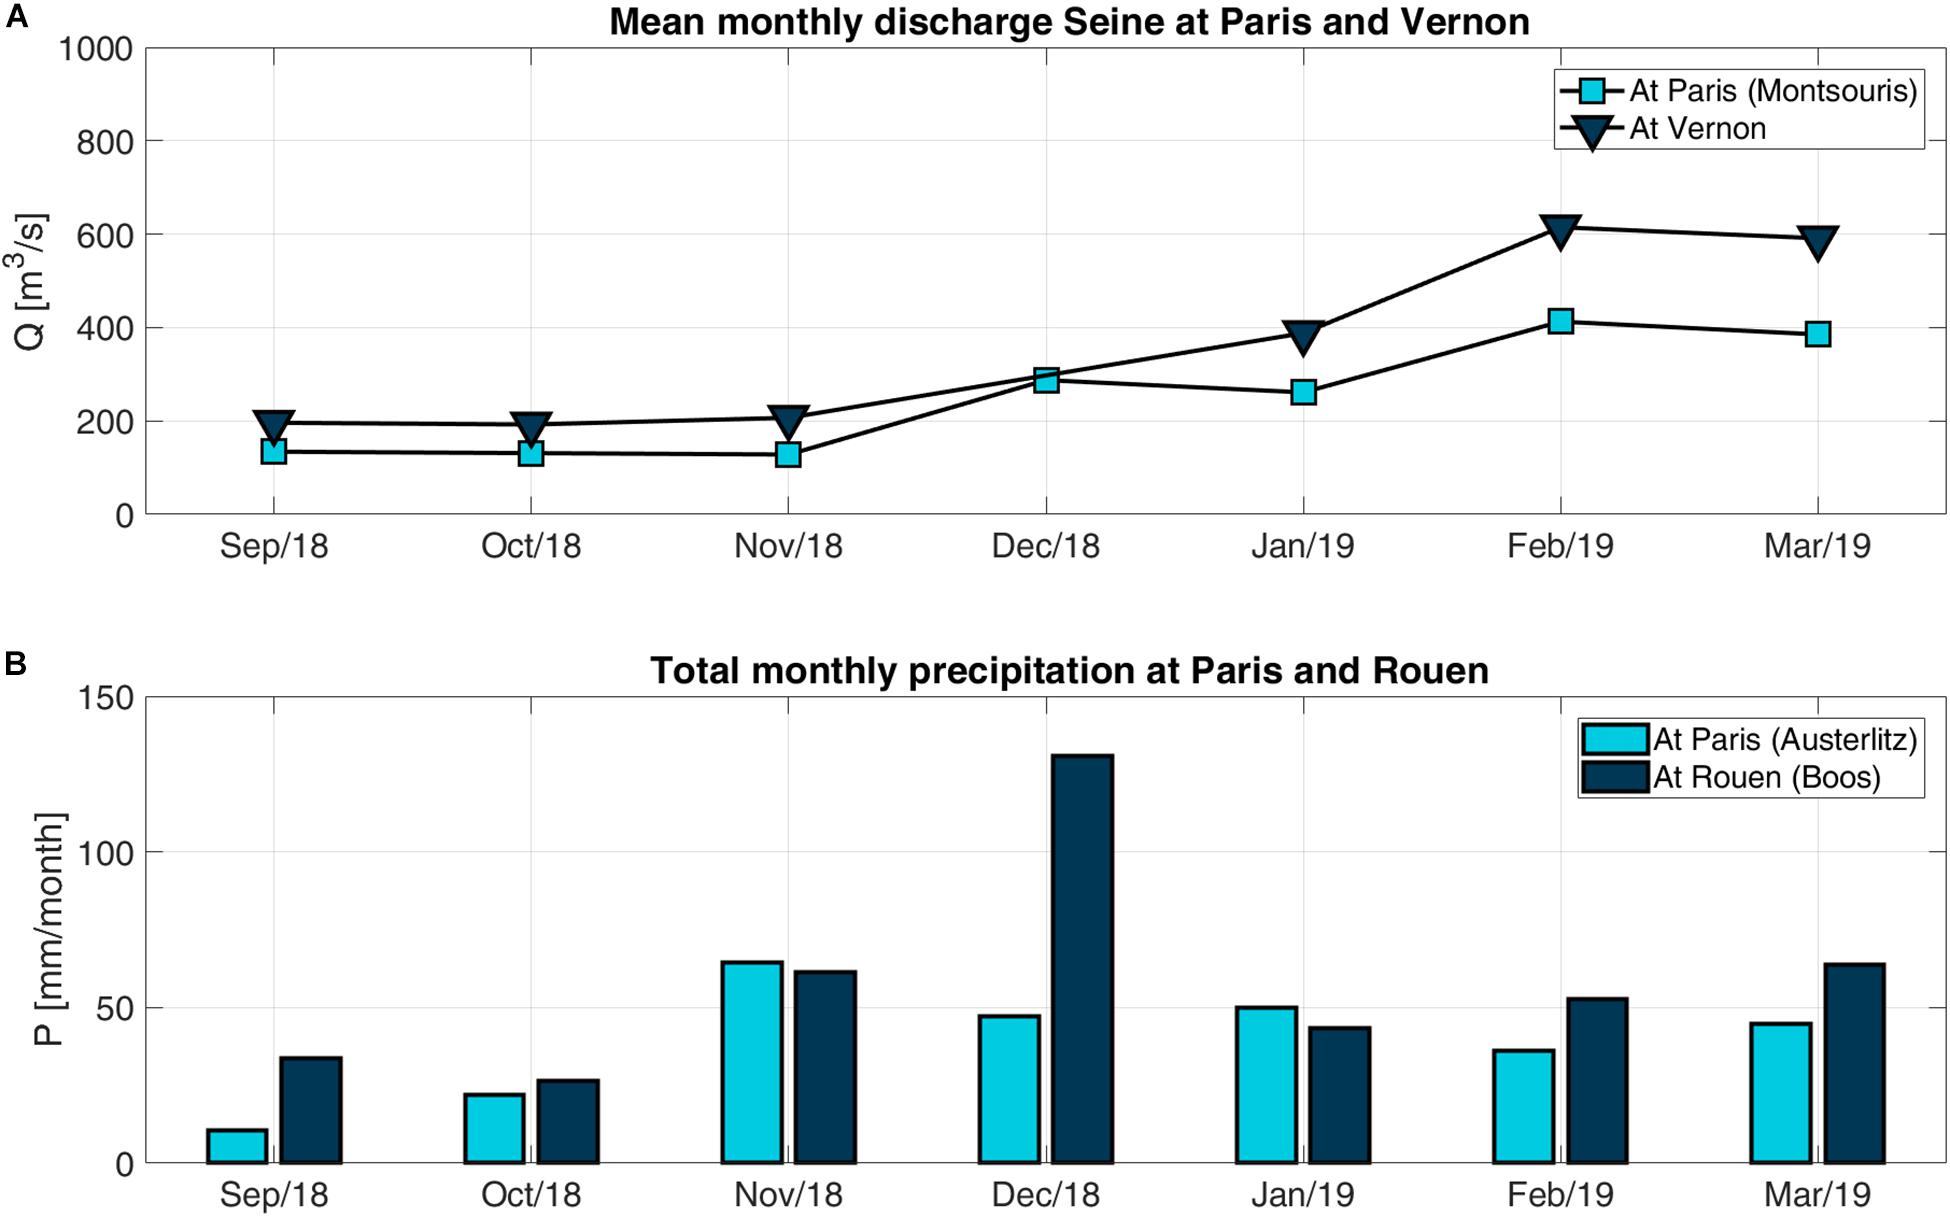
Figure 2. (A) Mean monthly discharge of the Seine measured at Paris and Vernon and (B) total monthly precipitation at Paris and Rouen.
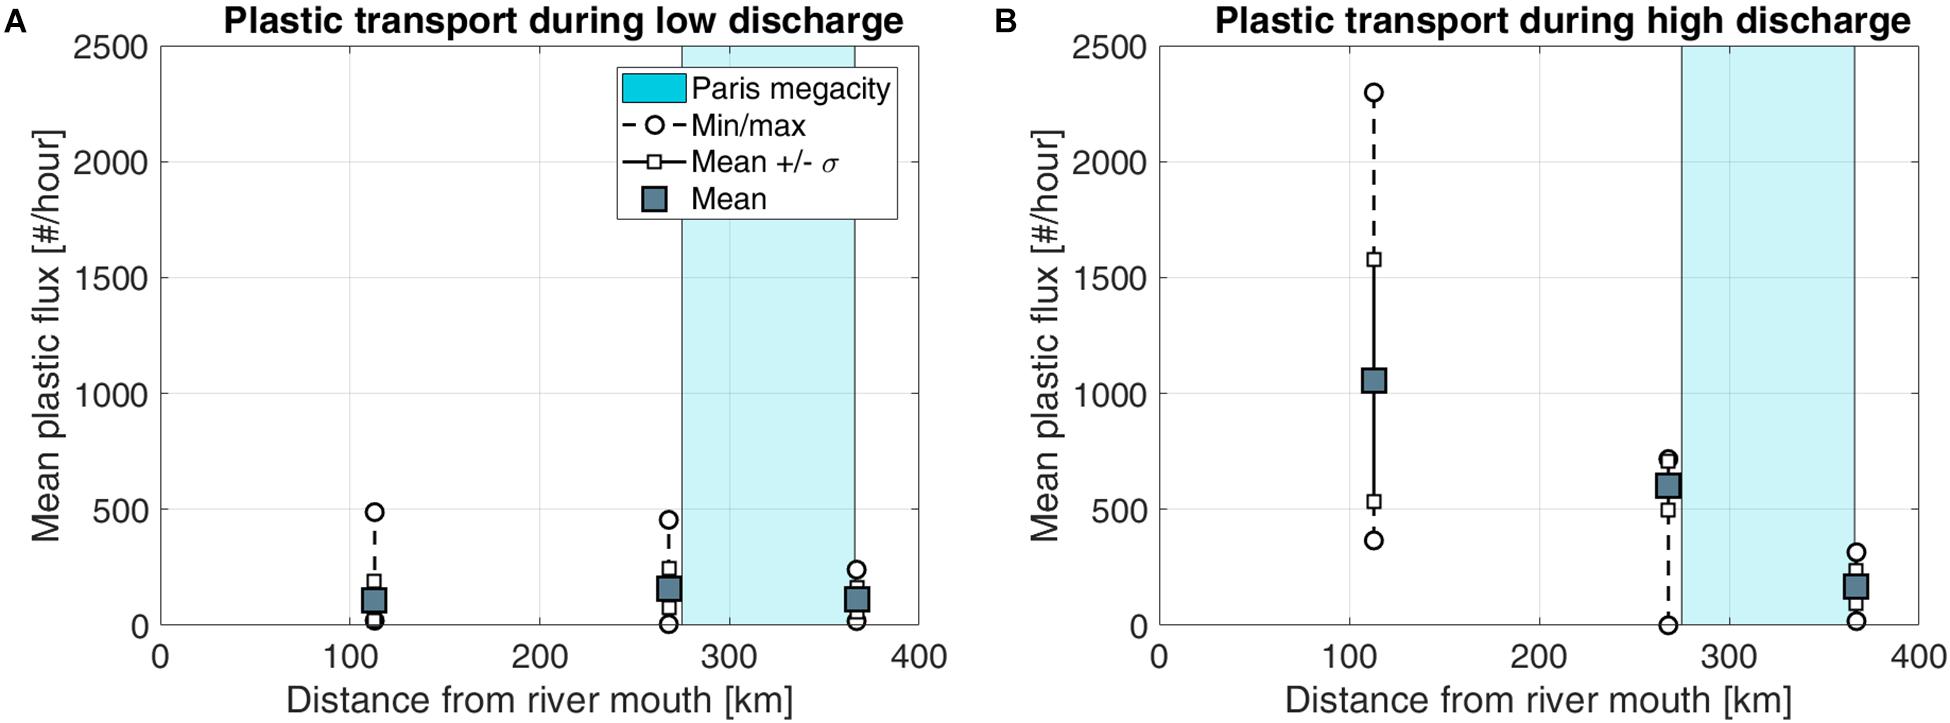
Figure 3. Mean plastic flow during (A) low discharge (September 2018) and (B) high discharge (March 2019), including standard deviation and minimum and maximum value per measurement location.
Figure 3 also clearly demonstrates the spatial variation in plastic transport. At the upstream measurement location, the plastic transport is around ten times lower than at the downstream location during high discharge. The expected main source of plastic pollution, the city of Paris, is located around 300 km from the river mouth, and therefore does not contribute to the upstream plastic transport, such as measured at Villeneuve-le-Roi. However, during high flow more plastic may be introduced from Paris, explaining the increase in plastic flux at the middle measurement location. Note that extensive floating debris collection infrastructure (Gasperi et al., 2014) is located between the upstream (Villeneuve-le-Roi) and middle (Meulan-en-Yvelines/Triel-sur-Seine) measurement locations. Also, the riverbank geometry and material may influence the introduction, transport and accumulation of plastic debris. In urban areas such as Paris and Rouen, the riverbanks are smooth and canalized, whereas in less densely populated areas the riverbanks mainly consist of vegetated surfaces. Such areas may act as temporary sinks of plastic debris during low flow, before remobilization during high flow.
The response to high flow is the clearest at Rouen, where the plastic transport was measured to be highest. Increased discharge and flow velocity can flush the system, and plastic accumulated throughout the year may be mobilized again during this period. The variation in time at Rouen during the high flow period was higher than at the other locations, which might have two explanations. First, the discharge and flow velocity may have varied. Second, as the highest plastic transport was measured on 21st March, most of the mobilized plastics was flushed out of the system into the ocean, and no new plastics were introduced or remobilized from 22nd to 23rd March. Also recall from Figure 2B that the precipitation between September 2018 and March 2019 was higher (especially in December 2018) than in Paris, which may have resulted in more localized introduction of new plastic debris or remobilization of accumulated plastics closer to Rouen. Finally, Rouen is located in the Seine estuary, meaning that there is bidirectional flow. This may result in additional accumulation in this section of the river.
The variation of plastic transport over the cross-section may give important insights for potential prevention and mitigation strategies. Figure 4 illustrates the variation in plastic transport along the river width. The cross-sectional variation in river transport is mainly influenced by the flow velocity profile and navigation activities. The upstream location is less intensively used than the other locations. The upstream measurement site was located in a river bend, with higher flow velocities at the right side, which may explain the similar profile in plastic flux. At the middle location less plastics were observed on the left side, which may also have been caused by the river geometry. At Rouen most plastics were observed at the left side. This is surprising as the measurement location was located on a straight, canalized stretch of the river. However, this part of the river is more heavily navigated and experiences strong tidal influence. Also, wind speed and direction may influence the spatial distribution of plastic. These factors may explain the observed variation plastic transport.
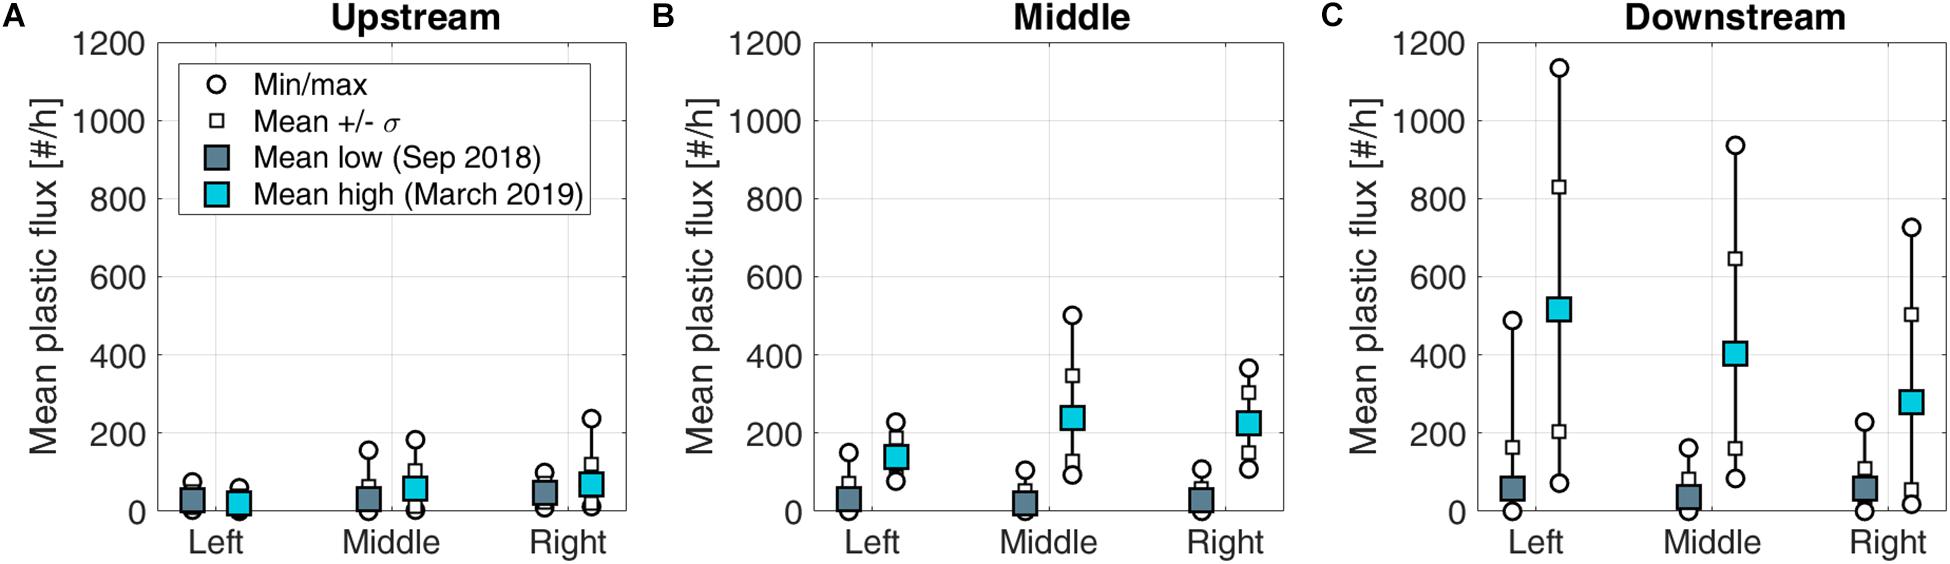
Figure 4. Distribution of plastic transport over the river cross section at (A) the upstream location Villeneuve-le-Roi, (B) the middle location Meulen-en-Yvelines/Triel-sur-Seine and (C) the downstream location Rouen. Note that for the Middle location, low flow measurements were taken at Meulan-en-Yvelines and the high flow measurements were taken at Triel-sur-Seine. Left, middle, and right are used in downstream facing direction.
Outlook
This study provides new observational evidence that plastic debris transport may depend strongly on the hydrological flow regime, which is in line with previous work on the Los Angeles rivers (Moore et al., 2011). We also found that the daily variation in transport closest to the river mouth was the highest of all observation points, highlighting the importance of consistent long-term plastic monitoring. Continuous monitoring would allow to better quantify the evolution of plastic transport over time, which would increase the general understanding of how much plastic is transported in how much time. Monitoring efforts may also be expanded with riverbank plastic monitoring, which can be used to better attribute the increase of plastic transport to either increased introduction of new plastics or the remobilization of accumulated plastics. Work on Chilean (Rech et al., 2015) and German rivers (Kiessling et al., 2019) showed that this can be facilitated through citizen science campaigns, which may be facilitated through implementation of river plastic measurement modules in citizen science apps such as CrowdWater (Seibert et al., 2019). Other ways forward include using unmanned aerial vehicles (UAV) for monitoring floating plastics or plastics on riverbanks (e.g., Geraeds et al., 2019).
To date, most assessments of the Seine (Gasperi et al., 2014; Tramoy et al., 2019) focused on floating macroplastic debris. Since most plastic studies in aquatic environments are biased toward microplastics and marine plastic pollution (Blettler et al., 2018), such studies are much needed to improve our understanding of riverine plastic transport. We encourage, however, to also include plastics that are suspended in the water column or are transported over the riverbed in future assessments. Measuring plastics at deeper layers is challenging, but observations suggest that they can account for a considerable portion of total plastic debris transport in rivers (Morritt et al., 2014; Hohenblum et al., 2015).
For the considered period from September 2018 to March 2019, neither the maximum monthly mean discharge nor the maximum total mean precipitation occurred in March 2019. Therefore, the annual maximum plastic transport is likely to have occurred in a different month as well. It is yet unclear whether maximum riverine plastic debris occurs at the peak discharge, or during the “first flush” of a river system. Furthermore, the role of river geometry needs to be explored further. This emphasizes the urgent need for longer-term monitoring efforts to quantify the seasonal variation of plastic debris flow and understand its driving mechanisms. Not only for the Seine, but for rivers across the world.
The observations presented in this study suggest that river discharge conditions may be a governing factor driving the temporal distribution of plastic transport. Future work on the effect of extreme events, such as floods, may shed additional light on the relation between river discharge and plastic transport. For the Nakdong River, it was estimated that 5% of the total yearly plastic transport occurred during floods (Jang et al., 2014). A study on lakes in the Bistrita river catchment in Romania demonstrated that plastic transport from rural areas into rivers and lakes was also mainly driven by floods (Mihai, 2018). With the available global flood risk models (e.g., Ward et al., 2015), future work should focus on global assessments of plastic transport as a result of flood events.
Conclusion
Plastic transport at the most downstream location was on average ten times higher during high flow period than during low flow, suggesting that transport is strongly related to river discharge and flow velocity. These results also highlight that a large amount of annual plastic debris may be transported during a very limited timeframe, similar to transport of other materials, such as sediment.
Plastic transport increased considerably over the river length and may be linked to population density, behavior, riverbank design, and industrial areas along the river. At Rouen, the measurement location closest to the river mouth, the plastic transport was ten times higher than upstream of Paris during the high flow period. However, during low flow conditions the plastic transport was relatively similar along the river.
Variation of the plastic flux over the cross-section is influenced by both natural factors (such as river geometry, flow velocity profile, and wind) and anthropogenic factors (such as infrastructure, behavior and navigation). Variation along the river width was observed, but especially due to anthropogenic factors this remains difficult to predict.
With this paper, we demonstrate that plastic transport varies considerably during low and high flow conditions. The 10-folded amount of plastic transport at the most downstream location suggests a similar ratio might apply to plastic emission from the Seine, and other rivers around the world, into the ocean.
Data Availability Statement
The plastic transport dataset is available as Supplementary Material. All other data can be retrieved from their respective sources.
Author Contributions
TE and RTa designed the study. RTe, JG, BT, and TE organized the data collection. CC and TE analyzed the data and wrote the first version of the manuscript. TE prepared the final version of the manuscript. All authors contributed to the data collection and writing.
Conflict of Interest
TE and CC were employed by The Ocean Cleanup.
The remaining authors declare that the research was conducted in the absence of any commercial or financial relationships that could be construed as a potential conflict of interest.
Acknowledgments
We would like to thank the donors of The Ocean Cleanup who helped fund this study. We thank Paul Vriend, Colin van Lieshout, Henning Lagemann, Kees van Oeveren, Michelle Loozen, Lourens Meijer, Marlein Geraeds, Jelle Kaptein from The Ocean Cleanup, Mohamed Saad from LEESU, Université Paris-Est Créteil, and Charlotte Verburg from the University of Twente for their hard work during the data collection. We thank Boyan Slat, Colin van Lieshout, Lourens Meijer, and the three reviewers for their valuable suggestions that helped to improve this paper.
Supplementary Material
The Supplementary Material for this article can be found online at: https://www.frontiersin.org/articles/10.3389/fmars.2019.00642/full#supplementary-material
Footnotes
References
Blettler, M. C. M., Abrial, E., Khan, F. R., Sivri, N., and Espinola, L. A. (2018). Freshwater plastic pollution: recognizing research biases and identifying knowledge gaps. Water Research 143, 416–424. doi: 10.1016/j.watres.2018.06.015
Chen, J., Bouchez, J., Gaillardet, J., and Louvat, P. (2014). Behaviors of major and trace elements during single flood event in the Seine River, France. Proc. Earth Planet. Sci. 10, 343–348. doi: 10.1016/j.proeps.2014.08.034
Crosti, R., Arcangeli, A., Campana, I., Paraboschi, M., and González-Fernández, D. (2018). ‘Down to the river’: amount, composition, and economic sector of litter entering the marine compartment, through the Tiber river in the Western Mediterranean Sea. Rendiconti Lincei. Scienze Fisiche e Naturali 29, 859–866. doi: 10.1007/s12210-018-0747-y
Dris, R., Johnny, G., and Bruno, T. (2018). “Sources and fate of microplastics in urban areas: a focus on Paris Megacity,” in Freshwater Microplastics The Handbook of Environmental Chemistry, eds M. Wagner, and S. Lambert, (Cham: Springer), 69–83. doi: 10.1007/978-3-319-61615-5_4
Gasperi, J., Dris, R., Bonin, T., Rocher, V., and Tassin, B. (2014). Assessment of floating plastic debris in surface water along the Seine River. Environ. Pollut. 195, 163–166. doi: 10.1016/j.envpol.2014.09.001
Geraeds, M., van Emmerik, T., de Vries, R., and Shahrizal bin Ab Razak, M. (2019). Riverine plastic litter monitoring using unmanned aerial vehicles (UAVs). Remote Sens. 11:2045. doi: 10.3390/rs11172045
González-Fernández, D., and Hanke, G. (2017). Toward a harmonized approach for monitoring of riverine floating macro litter inputs to the marine environment. Front. Mar. Sci. 4:86. doi: 10.3389/fmars.2017.00086
Hohenblum, P., Frischenschlager, H., Reisinger, H., Konecny, R., Uhl, M., Mühlegger, S., et al. (2015). Plastik in der Donau–Untersuchung zum Vorkommen von Kunststoffen in der Donau in Österreich. Im Auftrag des Bundesministeriums für Land-und Forstwirtschaft, Umwelt-und Wasserwirtschaft und der Ämter der Landesregierungen Oberösterreich Report 0547. Wien: Niederösterreich und Wien.
Hurley, R., Woodward, J., and Rothwell, J. J. (2018). Microplastic contamination of river beds significantly reduced by catchment-wide flooding. Nat. Geosci. 11, 251–257. doi: 10.1038/s41561-018-0080-1
Jambeck, J. R., Geyer, R., Wilcox, C., Siegler, T. R., Perryman, M., Andradym, A., et al. (2015). Plastic waste inputs from land into the ocean. Science 347, 768–771. doi: 10.1126/science.1260352
Jang, Y. C., Lee, J., Hong, S., Mok, J. Y., Kim, K. S., Lee, Y. J., et al. (2014). Estimation of the annual flow and stock of marine debris in South Korea for management purposes. Mar. Pollut. Bull. 86, 505–511. doi: 10.1016/j.marpolbul.2014.06.021
Kiessling, T., Knickmeier, K., Kruse, K., Brennecke, D., Nauendorf, A., and Thiel, M. (2019). Plastic Pirates sample litter at rivers in Germany–Riverside litter and litter sources estimated by schoolchildren. Environ. Pollut. 245, 545–557. doi: 10.1016/j.envpol.2018.11.025
Lebreton, L. C. M., van der Zwet, J., Damsteeg, J. W., Slat, B., Andrady, A., and Reisser, J. (2017). River plastic emissions to the world’s oceans. Nat. Commun. 8:15611. doi: 10.1038/ncomms15611
Lechner, A., Keckeis, H., Lumesberger-Loisl, F., Zens, B., Krusch, R., Tritthart, M., et al. (2014). The Danube so colourful: a potpourri of plastic litter outnumbers fish larvae in Europe’s second largest river. Environ. Pollut. 188, 177–181. doi: 10.1016/j.envpol.2014.02.006
Mani, T., Hauk, A., Walter, U., and Burkhardt-Holm, P. (2015). Microplastics profile along the Rhine River. Sci. Rep. 5:17988. doi: 10.1038/srep17988
Mihai, F. (2018). Rural plastic emissions into the largest mountain lake of the Eastern Carpathians. R. Soc. Open Sci. 5:172396. doi: 10.1098/rsos.172396
Moore, C. J., Lattin, G. L., and Zellers, A. F. (2011). Quantity and type of plastic debris flowing from two urban rivers to coastal waters and beaches of Southern California. J. Integr. Coast. Zone Manag. 11, 65–73. doi: 10.5894/rgci194
Morritt, D., Stefanoudis, P. V., Pearce, D., Crimmen, O. A., and Clark, P. F. (2014). Plastic in the Thames: a river runs through it. Mar. Pollut. Bull. 78, 196–200. doi: 10.1016/j.marpolbul.2013.10.035
O Conchubhair, D., Fitzhenry, D., Lusher, A., Kin, A. L., van Emmerik, T., Lebreton, L., et al. (2019). Joint effort among research infrastructures to quantify the impact of plastic debris in the ocean. Environ. Res. Lett. 14:065001. doi: 10.1088/1748-9326/ab17ed
Rech, S., Macaya-Caquilpán, V., Pantoja, J. F., Rivadeneira, M. M., Campodónico, C. K., and Thiel, M. (2015). Sampling of riverine litter with citizen scientists—findings and recommendations. Environ. Monit. Assess. 187:335. doi: 10.1007/s10661-015-4473-y
Rummel, C., Löder, M. G., Fricke, N. F., Lang, T., Griebeler, E. M., Janke, M., et al. (2016). Plastic ingestion by pelagic and demersal fish from the North Sea and Baltic Sea. Mar. Pollut. Bull. 102, 134–141. doi: 10.1016/j.marpolbul.2015.11.043
Schmidt, C., Krauth, T., and Wagner, S. (2017). Export of plastic debris by rivers into the Sea. Environ. Sci. Technol. 51, 12246–12253. doi: 10.1021/acs.est.7b02368
Seibert, J., Barbara, S., Simon, E., Philipp, H., and van Meerveld, H. J. (2019). Virtual staff gauges for crowd-based stream level observations. Front. Earth Sci. 7:70. doi: 10.3389/feart.2019.00070
Thompson, R. C., Olsen, Y., Mitchell, R. P., Davis, A., Rowland, S. J., John, A. W. G., et al. (2004). Lost at sea: where is all the plastic? Science 304:838. doi: 10.1126/science.1094559
Tramoy, R., Gasperi, J., Dris, D., Colasse, L., Fisson, C., Sananes, S., et al. (2019). Assessment of the plastic input from the Seine basin to the sea using statistical and field approaches. Front. Mar. Sci. 6:151. doi: 10.3389/fmars.2019.00151
Treilles, R., Gasperi, J., Tramoy, R., Rocher, V., and Tassin, B. (2018). “Microplastic concentrations in freshwater during a flood event, a case study of the Seine river catchment,” in Proceedings of the Micro 2018 Fate and Impact of Microplastics: Knowledge, Actions and Solutions, Arrecife.
van Emmerik, T., Kieu-Le, T.-C., Loozen, M., van Oeveren, K., Strady, E., Bui, X.-T., et al. (2018). A methodology to characterize riverine macroplastic emission into the ocean. Front. Mar. Sci. 5:372. doi: 10.3389/fmars.2018.00372
van Emmerik, T., Loozen, M., van Oeveren, K., Buschman, F., and Prinsen, G. (2019a). Riverine plastic emission from Jakarta into the ocean. Environ. Res. Lett. 14:084033. doi: 10.1088/1748-9326/ab30e8
van Emmerik, T., Strady, E., Kieu-Le, T.-C., Nguyen, L., and Gratiot, N. (2019b). Seasonality of riverine macroplastic transport. Sci. Rep. 9:13549. doi: 10.1038/s41598-019-50096-1
Keywords: plastic pollution, plastic pollution monitoring, hydrology, marine plastic debris, river plastic, France, Seine
Citation: van Emmerik T, Tramoy R, van Calcar C, Alligant S, Treilles R, Tassin B and Gasperi J (2019) Seine Plastic Debris Transport Tenfolded During Increased River Discharge. Front. Mar. Sci. 6:642. doi: 10.3389/fmars.2019.00642
Received: 25 May 2019; Accepted: 01 October 2019;
Published: 16 October 2019.
Edited by:
Hrissi Kassiani Karapanagioti, University of Patras, GreeceReviewed by:
Giuseppe Bonanno, University of Catania, ItalyAndré Ricardo Araújo Lima, Federal University of Pernambuco, Brazil
Hans Uwe Dahms, Kaohsiung Medical University, Taiwan
Copyright © 2019 van Emmerik, Tramoy, van Calcar, Alligant, Treilles, Tassin and Gasperi. This is an open-access article distributed under the terms of the Creative Commons Attribution License (CC BY). The use, distribution or reproduction in other forums is permitted, provided the original author(s) and the copyright owner(s) are credited and that the original publication in this journal is cited, in accordance with accepted academic practice. No use, distribution or reproduction is permitted which does not comply with these terms.
*Correspondence: Tim van Emmerik, tim.vanemmerik@wur.nl