Sustainability Status of Data-Limited Fisheries: Global Challenges for Snapper and Grouper
 Patrícia Amorim
 Pedro Sousa
 Ernesto Jardim
 Gui M. Menezes
- 1Department of Oceanography and Fisheries (DOP), University of the Azores, Horta, Portugal
- 2Marine and Environmental Sciences Centre (MARE), Institute of Marine Research (IMAR), Azores, Portugal
- 3Sustainable Fisheries Partnership Foundation (SFP), Honolulu, HI, United States
- 4European Commission, Joint Research Centre (JRC), Directorate for Sustainable Resources, Water and Marine Resources Unit, Ispra, Italy
Snapper and grouper are important fisheries resources, with high commercial value and an important role in the livelihoods and food security of many local communities worldwide. However, the status of many snapper and grouper fisheries is unknown, particularly in the cases of small-scale fisheries in developing countries. The main goals of this work are to provide an overview of the current status and trends of these resources and to find alternative sources of information that could be used to determine the status of snapper and grouper fisheries, as well as other data-limited fisheries. Several complementary approaches were explored, including determination of the status of snapper and grouper fisheries based on FAO assessment criteria, analysis of landings time-series trends, and investigation of whether other variables could be used as proxies for fishery status. About half of these fisheries were classified as overexploited, 30% as non-fully exploited and 19% as fully exploited. The FAO landings data indicated that the number of overexploited fisheries has been increasing over the years and that the majority of these fisheries are in transition between the fully exploited and overexploited statuses. The Human Development Index emerged as a potential proxy for the status of the biomass. The multinomial modeling approach explained about 44% of the variability observed in the biomass stock status classification data and indicated a high level of correspondence between original and estimated status, which makes this approach very attractive for application to other data-limited fisheries.
Introduction
Marine fisheries play an important role in global food security and also provide job opportunities and livelihoods for many coastal communities. With the rise in consumption of animal protein in developing countries and the rapidly increasing human population, demand for seafood production is expected to increase over the next decade (Ye and Cochrane, 2011; Watson et al., 2015). Given the economic and ecological importance of fisheries, evaluating their sustainability based on the best available data is vital for improved management and conservation (Mora et al., 2009; Ye and Cochrane, 2011; Hilborn and Ovando, 2014). However, effective management of many species is often challenged by the limited quantity and quality of information available (Anticamara et al., 2011; Carruthers et al., 2014; Chrysafi and Kuparinen, 2016). Life-history information, fishery-independent data, and species-specific catch data are very expensive and time-consuming to obtain (Heyman et al., 2014; Arnold and Heppell, 2015; Robinson et al., 2015), and a large number of commercially exploited stocks lack quantitative assessments and reliable estimates of stock status (Costello et al., 2012; Jardim et al., 2015). The increasingly sophisticated stock assessment methodologies are not always suited to data-poor fisheries (Bentley, 2014) and are only applied to a limited number of intensively studied stocks in developed countries (Ricard et al., 2012). To address these challenges, the development of alternative methods to increase knowledge about data-limited fisheries has been a major topic of research in recent years. Chrysafi and Kuparinen (2016) compiled the most common assessment methods for data-limited fisheries, and other recent studies have been presenting new methods to evaluate the status of fisheries (Thorson et al., 2013; Rosenberg, 2014; Dowling et al., 2015; Geromont and Butterworth, 2015; Anderson et al., 2017; Froese et al., 2017; Rosenberg et al., 2017; Carruthers, 2018). However, some of these methods still require some basic knowledge of the life-history of the species.
Data-availability problems tend to be more prominent in areas with high species diversity and where fisheries play a crucial role in food security, particularly in tropical areas and low-income countries in Africa, Asia, Oceania, and the Caribbean (Vasconcellos and Cochrane, 2005). This is often the case for snapper and grouper fisheries, which are valuable resources with high commercial value and high demand in major international markets (Cawthorn and Mariani, 2017). These fisheries also support the livelihoods and food security of many local, small-scale fishing communities worldwide (Martinez-Andrade, 2003; Teh et al., 2005; Sadovy de Mitcheson et al., 2013; Heyman et al., 2014; Kittinger et al., 2015). Commonly, the “snapper” designation refers to species of the family Lutjanidae, while “grouper” are usually defined as species of the subfamily Epinephelinae. Despite their importance, the status of many snapper and grouper fisheries is unknown, particularly in the cases of small-scale fisheries in developing countries where the reporting system is absent or insufficient (Robinson et al., 2015; Cawthorn and Mariani, 2017). A recent study categorized 70% of global snapper and grouper fisheries at a low knowledge outcome, with only 2% of fisheries at a high knowledge outcome (Amorim et al., 2018). The life-history characteristics of these species (e.g., slow-growing, late-maturing, seasonal spawning aggregations), combined with external threats (such as nursery habitat destruction, juvenile extraction, use of destructive fishing gear, and illegal, unreported, and unregulated (IUU) fisheries) make them particularly susceptible to overexploitation (Sadovy de Mitcheson and Erisman, 2012; Bailey and Sumaila, 2015; Robinson et al., 2015; Erauskin-Extramiana et al., 2017; Erisman et al., 2017).
According to the most recent assessment available from the Red List of Threatened Species of the International Union for Conservation of Nature (IUCN), 12% of the total global grouper species (Epinephelinae subfamily – 163 species) were classified in threatened categories (Critically Endangered, Endangered, and Vulnerable), 13% were considered to be Near Threatened, and 44% of Least Concern, while 30% of the species were considered as Data Deficient, preventing adequate evaluation (Sadovy de Mitcheson et al., 2013). Red List status assessments for snapper species (Lutjanidae family – 88 species) revealed that this group of species is dominantly classified as Least Concern (82%), but still, nearly 13% of the species are listed as Data Deficient (International Union for Conservation of Nature [IUCN], 2018). Although these results are based on global species trends, they underpin the urgent need for a better global evaluation of the sustainability status of these fishing resources.
Very few fully quantitative stock assessments have been conducted on snapper and grouper fisheries, and those that have mainly focus on North America (United States management areas) (Amorim et al., 2018). For snapper and grouper fisheries, as well as for most of the world’s data-limited fisheries, independent survey estimates of fish abundance are not available, and reported landings are often the main, and in many cases the only, source of information for those resources (e.g., Carruthers, 2018). Catch-based methods have been developed, but these methods require additional assumptions, information, and further methodological procedures to estimate stock status (Rosenberg, 2014), which has made their application much debated (Anderson et al., 2012; Pauly et al., 2013).
This study combines different sources of information to obtain a comprehensive understanding of the sustainability status of global snapper and grouper fisheries. The main goals are to provide an overview of the current status and trends of these resources based on the most recent data available, identify the main regions and/or countries where improved management and/or research actions are crucial, and find alternative sources of information that can be used to inform the status of snapper and grouper fisheries.
Materials and Methods
Three main approaches were applied to gain an understanding of the sustainability status of snapper and grouper fisheries worldwide (Figure 1). First, the fishery status of the snapper and grouper species was determined by applying existing criteria for the classification of stock status and fishing pressure to the sources of information compiled. Second, time-series data on snapper and grouper landings reported to the Food and Agriculture Organization of the United Nations (FAO) were analyzed so as to understand trends over time. Third, research was conducted on alternative sources of information that could be used as proxies for the status of the fisheries.
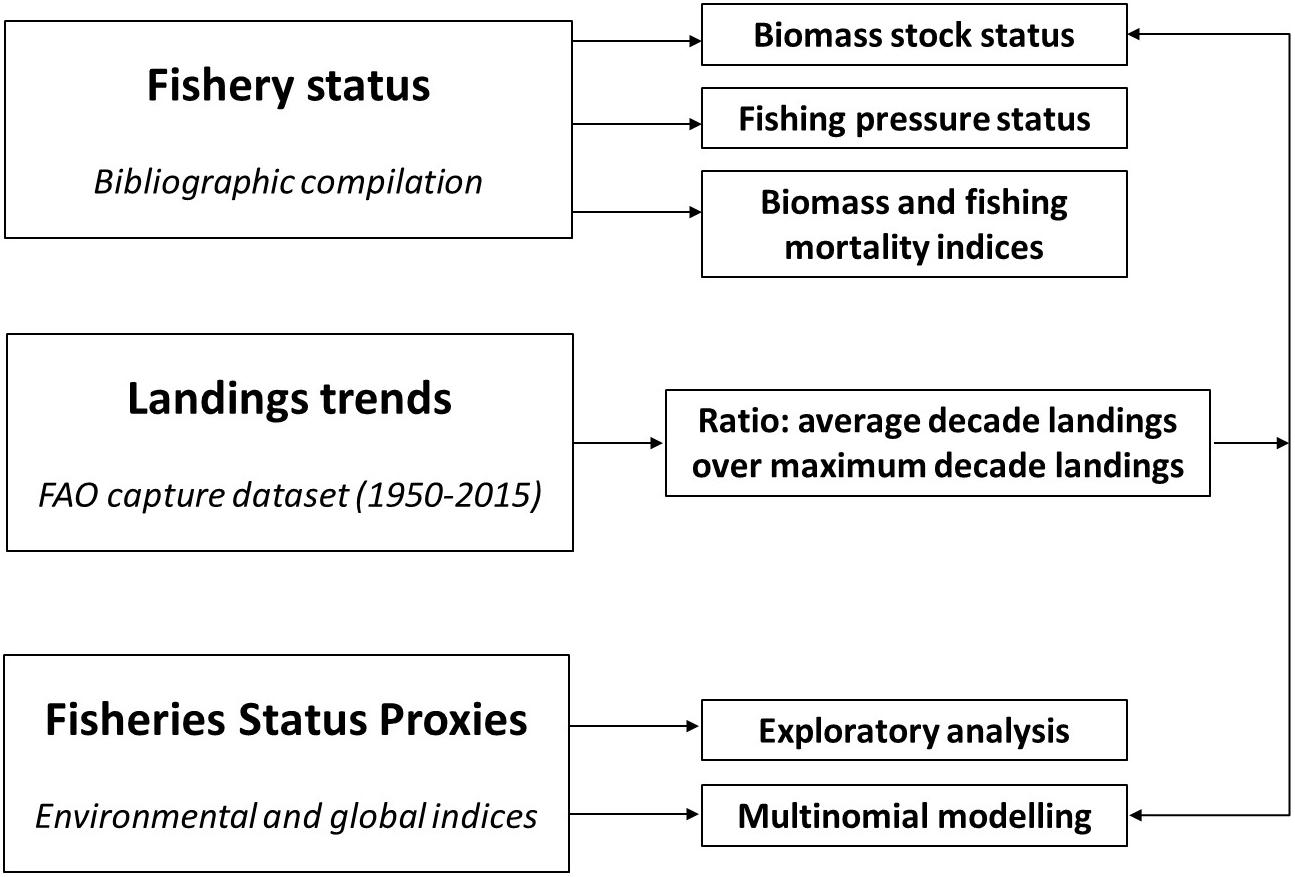
Figure 1. Schematic representation of the methods applied in this study to investigate the sustainability status of snapper and grouper fisheries worldwide.
As some countries (e.g., Angola, Australia, China, Nigeria) report grouper landings to the FAO using combined data for the entire family (Serranidae), data for groupers at the family rather than the subfamily level was used in many of the analyses.
Fisheries Status
An exhaustive data compilation of publicly available stock assessment reports and other bibliographic references documenting the state of the snapper and grouper fisheries was carried out. A comprehensive database was developed, including information on any type of stock status assessment, biological descriptors, current fishing status, reference points, and any qualitative information on the stock status and/or the level of fishing pressure, where available. The level of detail in the database (e.g., number of records by region/country, level of species aggregation) varied, because the available information was inconsistent. For those countries where no published information was found, the database was completed with fisheries that represented at least 1% of the total global landings of snapper or grouper reported to the FAO. In order to simplify the terminology used, the term “fishery” was adopted as the unit of analysis, based on the combination of species descriptors with countries included in the database, although each observation could be defined at different levels of resolution (e.g., biological stock, country management unit).
Biomass Stock Status and Fishing Pressure Categories
The biomass status classification was determined based on criteria developed by the FAO, which classifies the biomass status of fisheries resources into three categories: non-fully exploited, fully exploited, and overexploited (Ye, 2011). This classification represents a simplified version of the FAO’s former classification system, which included the underexploited, moderately exploited, fully exploited, overexploited, depleted, and recovering categories. In order to reduce uncertainty in assessments, overexploited, recovering, and depleted were aggregated into the category overexploited, and the categories of moderately exploited and underexploited were combined into the single group non-fully exploited (Ye, 2011). While the FAO classification generally uses criteria based on the stock biomass, other types of data (e.g., spawning potential, catch trend, size composition data) can also be combined when no reliable estimates of biomass exist. The FAO’s stock abundance criteria is based on the current levels of biomass compared to the estimated levels of biomass prior to exploitation (virgin biomass – B0). However, the relation of the assumed level of BMSY, the biomass level expected to maximize yield in the long term, to B0 varies widely depending on the biological characteristics of stocks and species, with estimated ranges of 20–50% of B0 (Hilborn, 2010) or even above 50% of B0 (Dick and MacCall, 2011).
Assuming that MSY occurs at 50% of the virgin biomass (Schaefer model) (Ye, 2011), and considering that “fully exploited” (equivalent to BMSY) is about 40–60% of B0, Hilborn and Ovando (2014) derived the following breakpoints: >120% BMSY (underexploited), between 120 and 80% BMSY (fully exploited), and <80% BMSY (overexploited) (see the Supplementary Material for more information). Based on the above, the criteria adopted in this study for the classification of snapper and grouper stock status are summarized in Table 1. For some fisheries, the sources of information (Die and Casariego, 2016; FAO, 2017a; WIOFish, 2017) only included the categorical classification of the stock status, without the associated quantitative information. Such information was included in the database, since it followed the FAO’s criteria for stock-status classification. Fisheries for which the biomass stock status was undetermined, undefined, or uncertain were reclassified into a single “unknown” category.
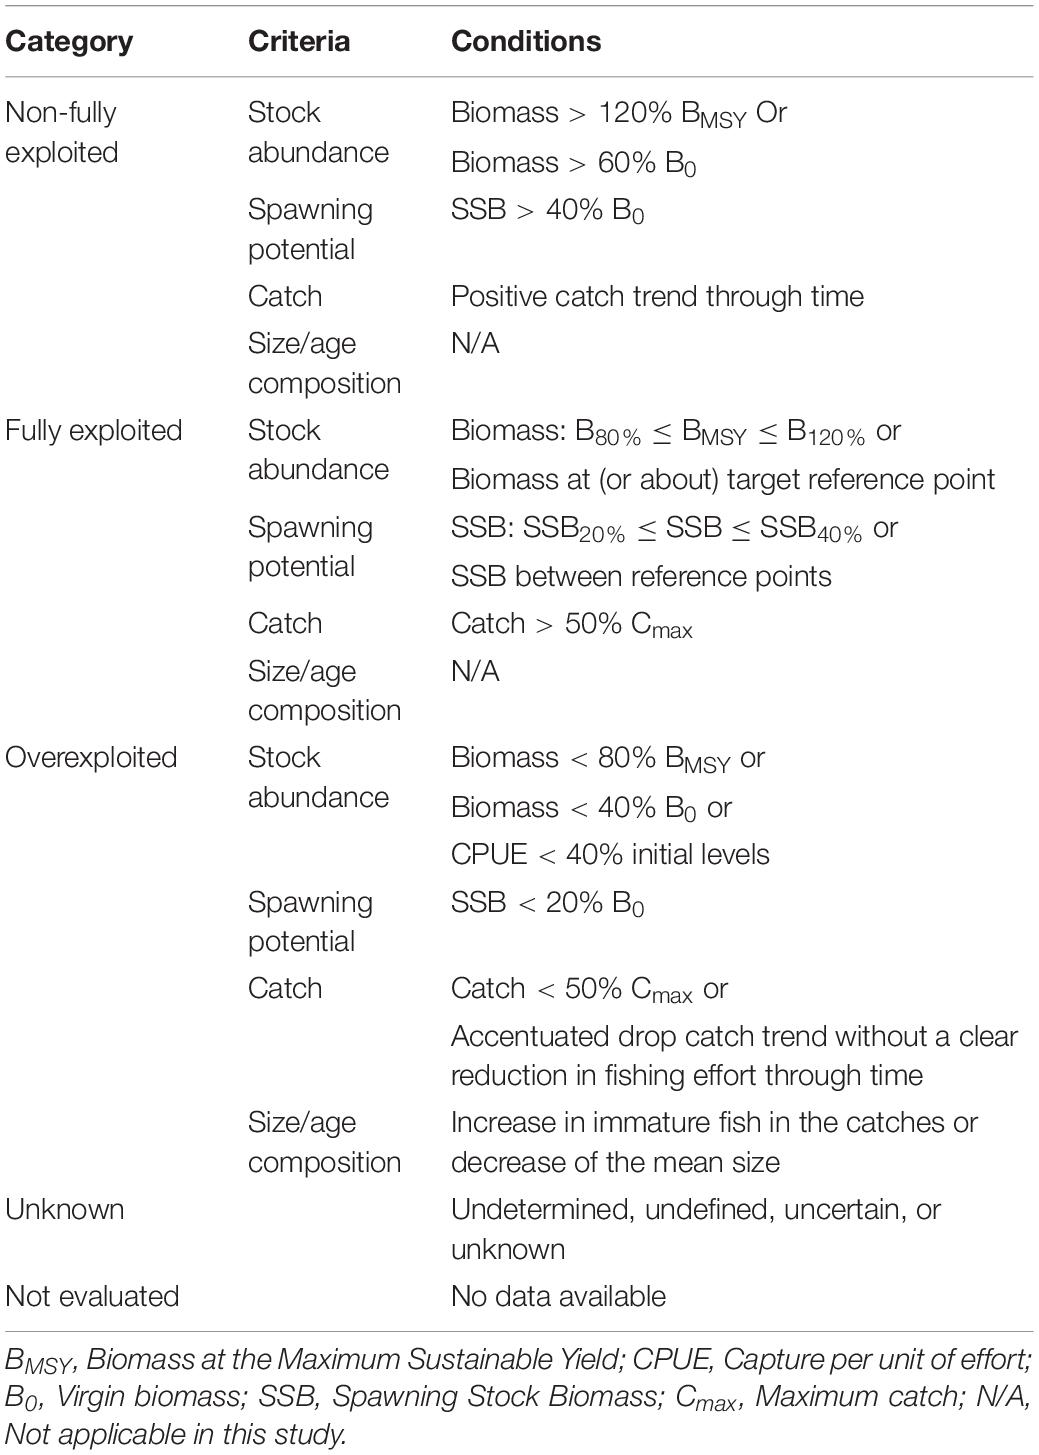
Table 1. Biomass stock status categories and criteria, with respective conditions, used in this study to classify the biomass status of snapper and grouper stocks/fisheries (adapted from the FAO classification (Ye, 2011).
For the purposes of this paper, fishing pressure was measured as the ratio between the fishing mortality levels [F, Exploitation ratio (E)] and the respective reference points (e.g., FMSY, Eopt/max) or as the value of catch versus MSY (NMFS, 2013).
Given the large variability in the type and quality of information available across countries and species, the following levels of confidence for biomass status and fishing pressure categories were derived in this study: high – status derived from formal stock assessment and/or quantitative data; intermediate – status derived from quantitative trend analysis; and low – status derived from qualitative data, size/age trends, or classifications from other databases without any additional data (WIOFish, 2017; NOAA, 2018).
Biomass and Fishing Mortality Indices
Indices of biomass stock status and fishing pressure were calculated using the most recent data for fisheries that had quantitative assessments. The biomass index (Bindex) was calculated based on the current spawning stock biomass (SSB or a proxy) and the biomass reference point according to the following formula: (SSB−SSBMSY)/SSBMSY. The fishing pressure index (Findex) was calculated based on the current value of fishing mortality (F or proxies) in relation to the fishing mortality reference point as (F−FMSY)/FMSY. When the Bindex is positive, this indicates that the stock is in good condition, while a positive Findex score indicates that overfishing is occurring. This approach allows a standardized comparison among the different regions, species, and data/proxies used. These indices were adapted from the methodology used by the Marine Strategy Framework Directive for evaluation of its Descriptor 3 – Commercial fish and shellfish (ICES, 2014).
FAO Landings Trends Analysis
The Global Fishery and Aquaculture Production Statistics (v2017.1.0) provided by the FAO were used to analyze global landings trends for snapper and grouper. The global capture fisheries dataset (1950–2015) contains capture fisheries data reported by country or territory, species item, country economic class (least developed, other developing, and developed), and FAO major fishing area (FAO, 2017a; Garibaldi, 2012). The data were extracted through the FishStatJ application (FAO, 2017b, version 3.03.0), and the database was searched for all Lutjanidae and Serranidae records. Data on a total of 499 fisheries were compiled, representing 121 countries or territories and 92 different species or aggregated species (34 Lutjanidae and 58 Serranidae). In this study, analysis of landings trends was undertaken based on the approach developed by Froese and Kesner-Reyes (2002). The use of the catch-based method assumes that trends in catches can be translated directly into trends in fishery status, assuming that the catch is initially low, increases over time, and declines after having reached its maximum (Froese and Kesner-Reyes, 2002; Branch et al., 2011). This approach has been applied in several studies with modifications (Anderson et al., 2012; Ghosh et al., 2015; Kleisner and Pauly, 2015). Some modifications were also made in this study, in particular regarding the number of fish stock status categories, to ensure consistency with the current FAO classification criteria (Ye, 2011). A 5 years moving average was applied to the landings time series for each fishery. Decadal average landings were then calculated: 1950–1959, 1960–1969, 1970–1979, 1980–1989, 1990–1999, 2000–2009, and 2010–2015. Decadal average data were used as the temporal unit to avoid potential problems caused by the influence of any unusual years upon the classification of the following years (Chrysafi and Kuparinen, 2016). In the subsequent analysis, decade average landings for each fishery were only considered when four or more years of data were available for each decade, with the exception of the most recent period of time (2010–2015), in which two years or more of available data were considered valid. Additionally, zero decadal average values were removed from the analysis. Finally, three levels of exploitation status (non-fully exploited, fully exploited, and overexploited) were defined, based on the percentage of landings average for each decade (Cdecade) compared to the average landings of the decade with the highest value of landings (Cmax, used as an acronym in the current study to avoid confusion with that for maximum length) (Table 2).
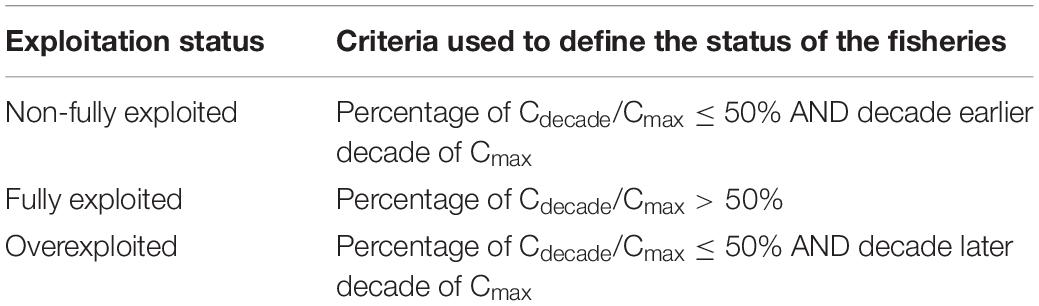
Table 2. Criteria used to classify the exploitation status of the fisheries in three categories: non-fully exploited, fully exploited, and overexploited (adapted from Froese and Kesner-Reyes, 2002) (Cdecade, average landings by decade; Cmax, average landings of the decade with the highest value landings).
Alternative Sources of Information on Fisheries Status
In order to investigate whether other sources of information could be used as proxies for fishery status, two approaches were developed: (1) exploratory analysis of possible relationships between the several variables included in the database, and (2) testing of biomass status categories against life-history/ecological variables and indices of development. To that end, several additional variables were added to the database (Appendix Table A1). Vulnerability index, trophic level (based on food items), and other life-history variables (maximum length recorded for the species (Lmax, cm), k VBGF growth coefficient parameter from the von Bertalanffy growth curve (year–1), mean length at first maturity (Lm, cm), and mean age at first maturity (tm, years) by species were extracted from the FishBase (v2.0)1 using the “rfishbase” R interface to Fishbase (Boettiger et al., 2012, 2016). For fisheries defined as a group of species or at the family/genera level, it was not possible to generate some species-specific information (e.g., vulnerability). Species richness for snappers (Lutjanidae) and groupers (Serranidae), as a measure of the total number of different species by family present in each country, was calculated in a GIS environment (ArcGIS) based on the data extracted from Aqua Maps, an online tool that produces standardized maps based on a model distribution of marine species (Kaschner et al., 2016). The database was then completed with several indices of development at the country level (all available online), with the aim of relating the environmental and human development of the countries targeting snapper and grouper fisheries and the status of those fisheries. The indices included in the database were: Environmental Performance Index – EPI and the respective Fisheries Score (Hsu and Zomer, 2016), the Ocean Health Index – OHI, the Human Development Index – HDI (UNDP, 2016), food (fish, seafood) supply quantity (FAO, 2017c), Gross Domestic Production (GDP) per capita (annual growth percentage and current USD) (The World Bank, 2018a), total population average (The World Bank, 2018a), and governance (The World Bank, 2018b). The average of the Cumulative Human Impacts to Marine Ecosystems score (Halpern et al., 2015) was also calculated for each country using ArcGIS. A more detailed description of the variables included in the database is presented in Appendix Table A1.
Exploratory boxplots were created of the categorical variables (family, FAO major fishing area, biomass stock status, and fishing pressure categories) against other variables compiled (ecological, life-history, and development indices). Some of the relationships between the variables were tested for significance following a non-parametric approach (Mann-Whitney and Kruskal-Wallis tests) with a significance level (α) of 0.05. When significant differences were found between more than two categories, post hoc tests (after Conover) were used to identify the group or groups that were significantly different (Pohlert, 2016). Pearson correlation coefficients were also calculated between all quantitative variables.
Multinomial regression models were used to determine if the variability of snapper and grouper biomass status could be significantly explained by life-history/ecological variables and development indices selected from the database. The multinomial regression allowed for fitting models using the categorical biomass stock status (non-fully exploited, fully exploited, overexploited) as the dependent variable and the following independent variables: FAO major fishing area, economic class, vulnerability, trophic level, length, serranid richness, lutjanid richness, fisheries score of the EPI, OHI, HDI, fish supply, GDP (annual% growth), total population, and cumulative human impacts. First and second (interaction) relationships were tested. All models were built by forward stepwise selection of variables, adding the significant terms (α < 0.05) sequentially, according to the Akaike Information Criteria (AIC) (Fox and Weisberg, 2011).
Results
Fisheries Status
The fisheries database included 65 species of the Lutjanidae family and 111 species of the Serranidae family, a total of 176 different species, from 73 different countries. These countries, in aggregate, represented 95% of the global reported landings (by weight) of snapper and grouper in 2015 (FAO, 2017b). For about 18% of the fisheries, no species-specific information was found. In these cases, the fisheries were aggregated by genera or family. For 62% of the 719 fisheries included in the database (293 lutjanids and 426 serranids), the stock structure is unknown (Supplementary Table S1). The number of fisheries by country included in the database was very variable (Supplementary Table S2). Indonesia, India, Mexico, and the United States are the countries with the highest number of fisheries included in the database.
Biomass Stock Status and Fishing Pressure Categories
About 68% of the 719 fisheries in the database (490 fisheries) were classified as “not evaluated” due to a lack of data. For the 229 snapper and grouper fisheries that had information (32%), based on the application of the FAO’s stock-status classification criteria, 23% were considered non-fully exploited (53 fisheries), 14% fully exploited (33 fisheries), 38% overexploited (88 fisheries), and 24% unknown (55 fisheries). A final sample of n = 174 fisheries with a classification of stock status was thus obtained by excluding the “not evaluated” fisheries and those for which an “unknown” status was assigned. This final sample represented about 24% of the 719 fisheries in the database.
From an exploratory approach, no differences were found in the stock biomass status categories by family, although the Serranidae family exhibits a higher percentage of fisheries not evaluated than the Lutjanidae family (Supplementary Figure S1).
The biomass status by country is presented in Figure 2 (Supplementary Table S2 includes detailed information). For the majority of countries, there is a lack of information on fisheries stock status or, in some cases, the status is set as unknown/undefined. This finding holds true across the top 10 producing countries (based on the FAO reported landings) of both groups of species: Indonesia, China, the Philippines, Mexico, Malaysia, Brazil, Pakistan, Nigeria, the United Arab Emirates, and the United States (Supplementary Table S2). The vast majority of the fisheries where it was possible to determine the biomass stock status were classified as overexploited; exceptions included Madagascar, Sri Lanka, and Bangladesh, where the majority of the fisheries were classified as non-fully exploited, and Hawaii, where they were mainly fully exploited. For the United States, Puerto Rico, Kenya, Indonesia, and Australia, only about one-quarter of the fisheries analyzed were classified as non-fully exploited or fully exploited.
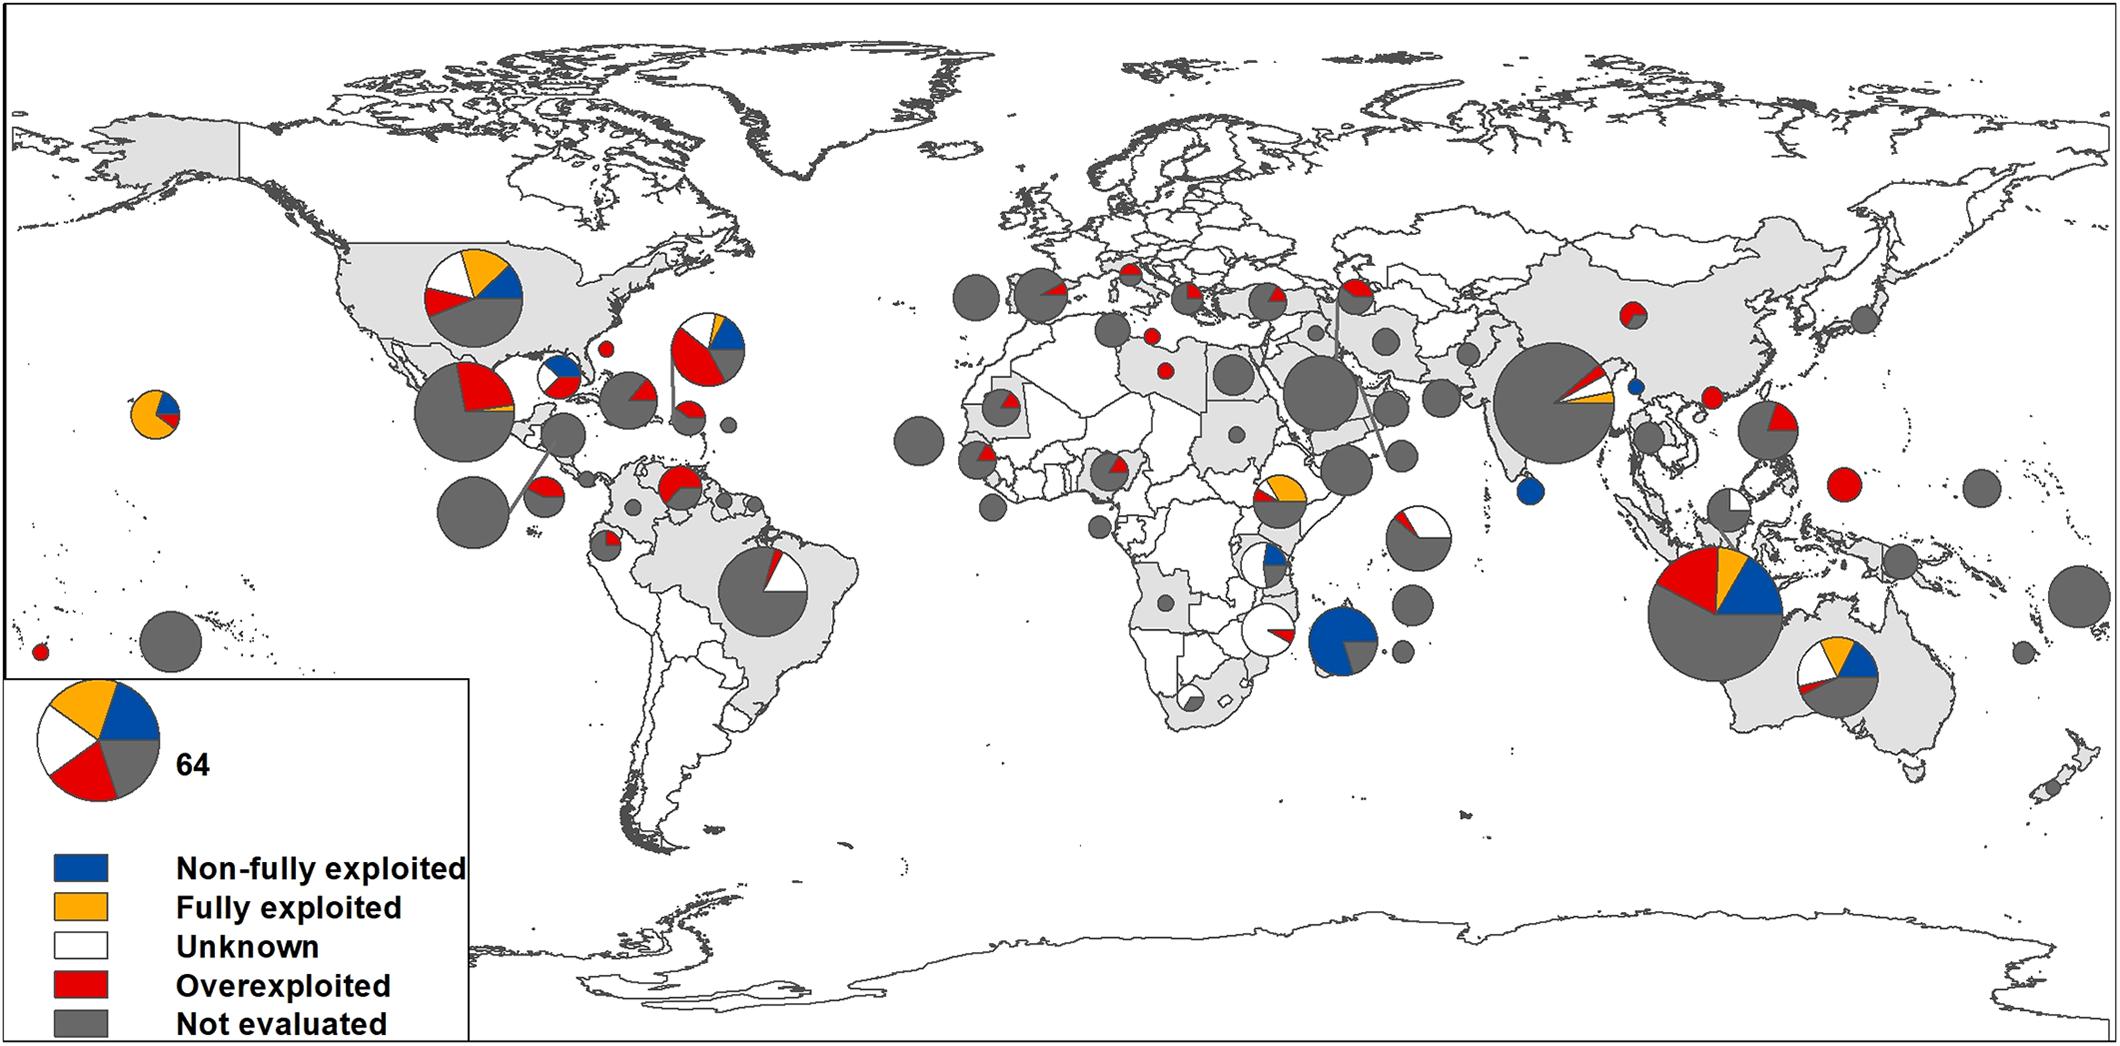
Figure 2. Biomass status classification of snapper and grouper fisheries by country. The shaded countries are those considered in this study, and the sizes of the pie charts are proportional to the number of fisheries by country included in the database.
The majority of the fisheries (89%) lacked information for classifying the level of fishing pressure. The remaining fisheries (n = 81) were classified into the following categories: no overfishing (59%), overfishing (31%), and unknown (10%). The Serranidae family has a higher percentage of not evaluated fisheries, as previously noted for stock status (Supplementary Figure S1). Fishing pressure in snapper and grouper fisheries is, at the global scale, not known (Figure 3 and Supplementary Table S2). For Tonga, Hawaii, Mexico, the United States, and Brazil, the larger part of the evaluated fisheries were classified as no overfishing. For the United States and Brazil, overfishing is taking place in some of the fisheries. Although India, the Middle East, and Cuba, all had small sample sizes (just a few fisheries evaluated), the fishing pressure status of snapper and grouper fisheries in those areas suggests that overfishing is occurring. In Australia, the fisheries were classified in the category of no overfishing or as undefined, but there are also many fisheries that have no information available at this level.
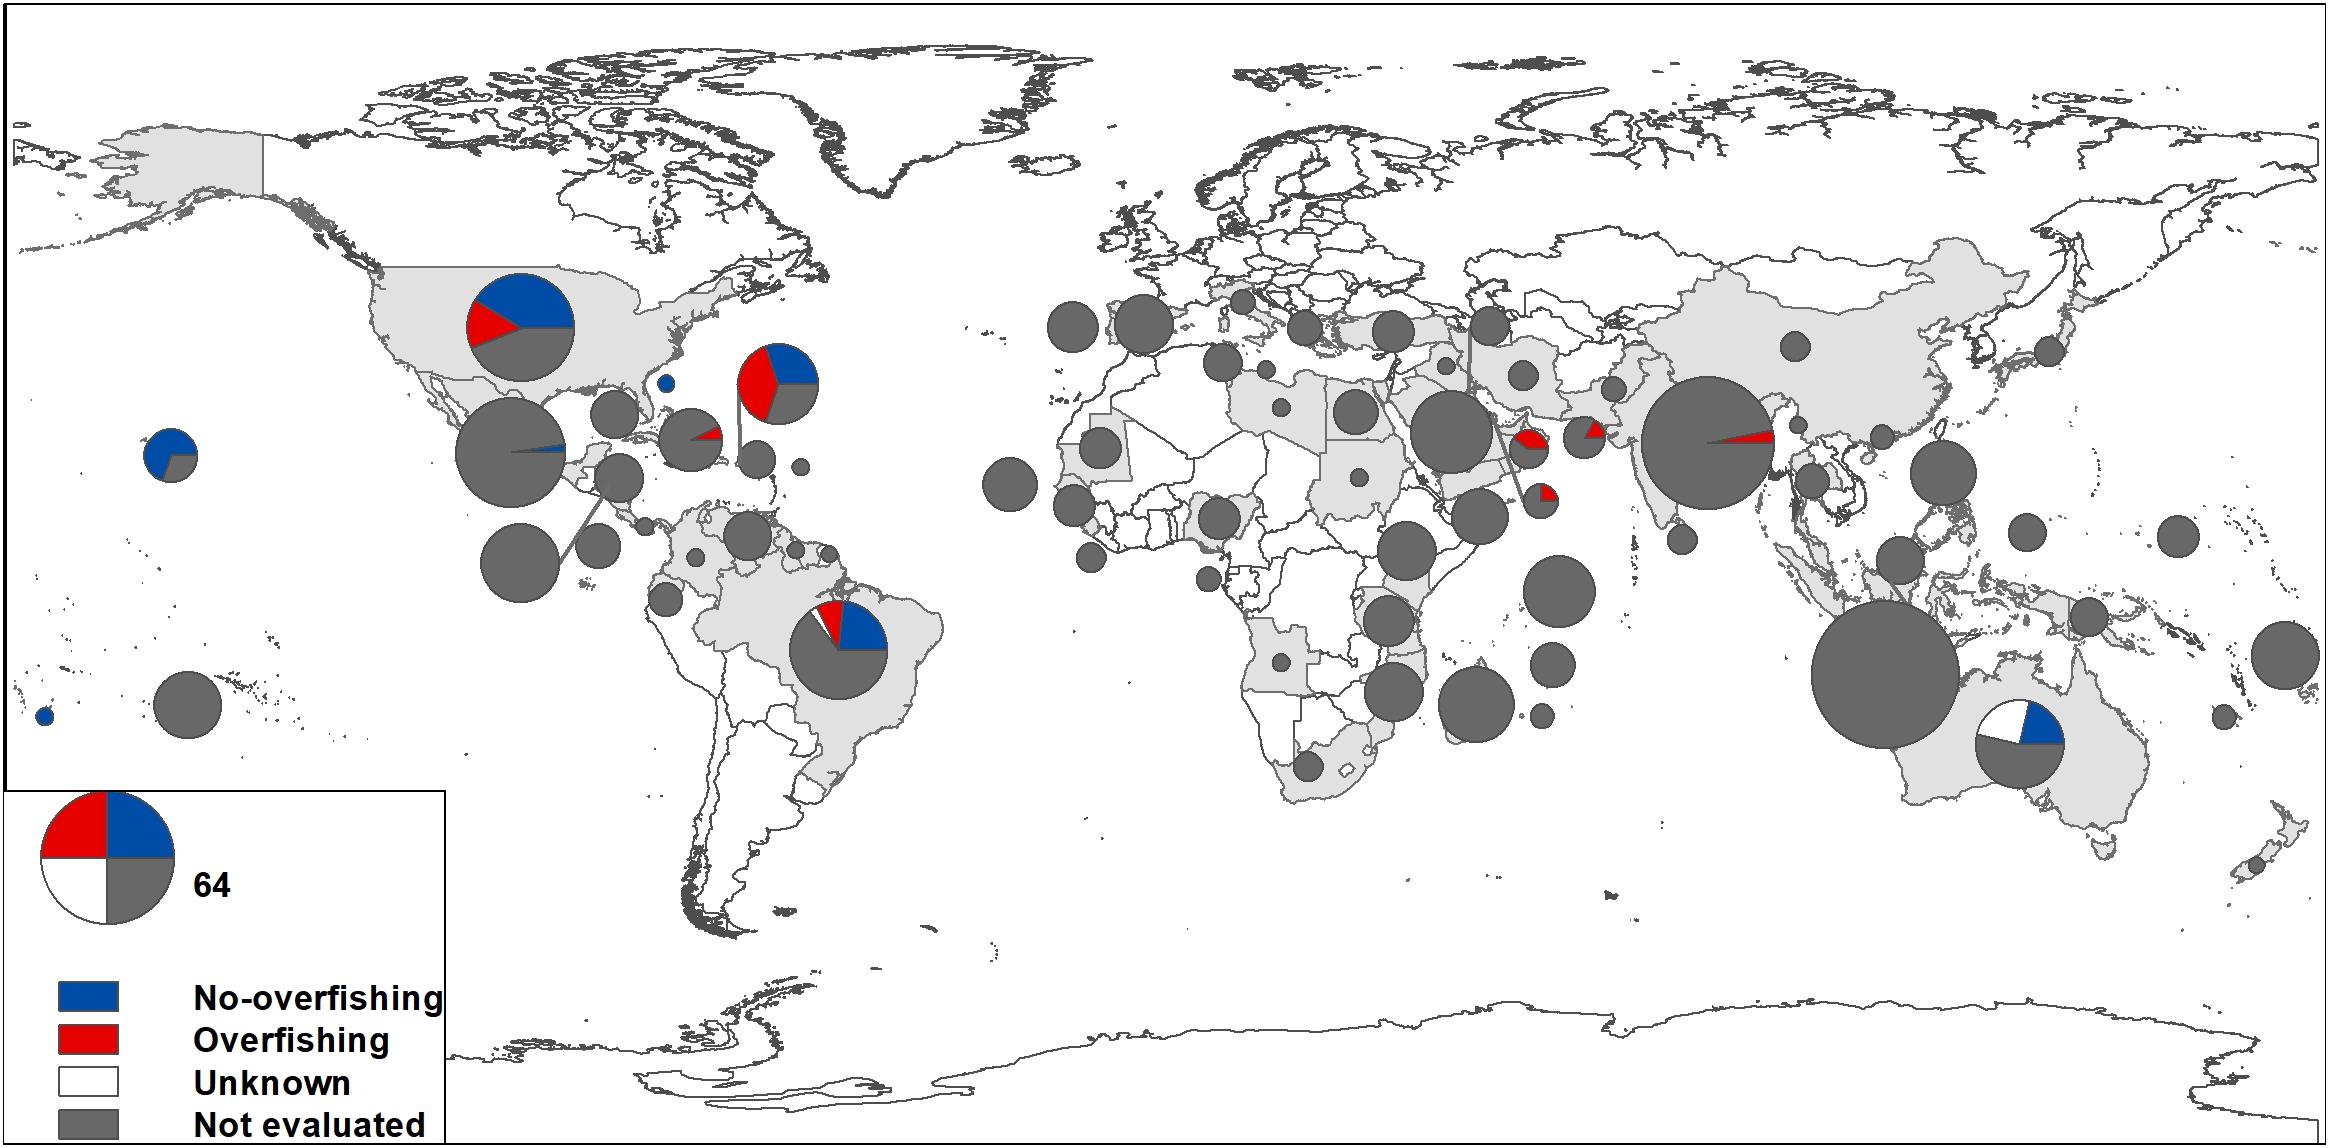
Figure 3. Fishing pressure classification of snapper and grouper fisheries by country: overfishing (if a resource has been fished above the reference level, ratio >1) and no overfishing (fishing level is below the reference level, ratio <1). The shaded countries are those considered in this study, and the sizes of the pie charts are proportional to the number of fisheries by country included in the database.
The level of confidence in the classification of the biomass stock status for fisheries considered non-fully exploited is usually low, while the fully exploited fisheries have a higher level of confidence (Figure 4). Overexploited fisheries presented a wider range of confidence, from high to low. Confidence levels for fishing pressure are comparatively higher, with the majority of the fisheries classified at the high-confidence level (Figure 4). The fishing pressure classification was determined for fewer fisheries than the biomass status and is derived from only one criterion, fishing mortality, which is usually only available for fisheries with a higher level of knowledge. The confidence level of the biomass and fishing pressures categories by country can be found in Supplementary Figure S2.
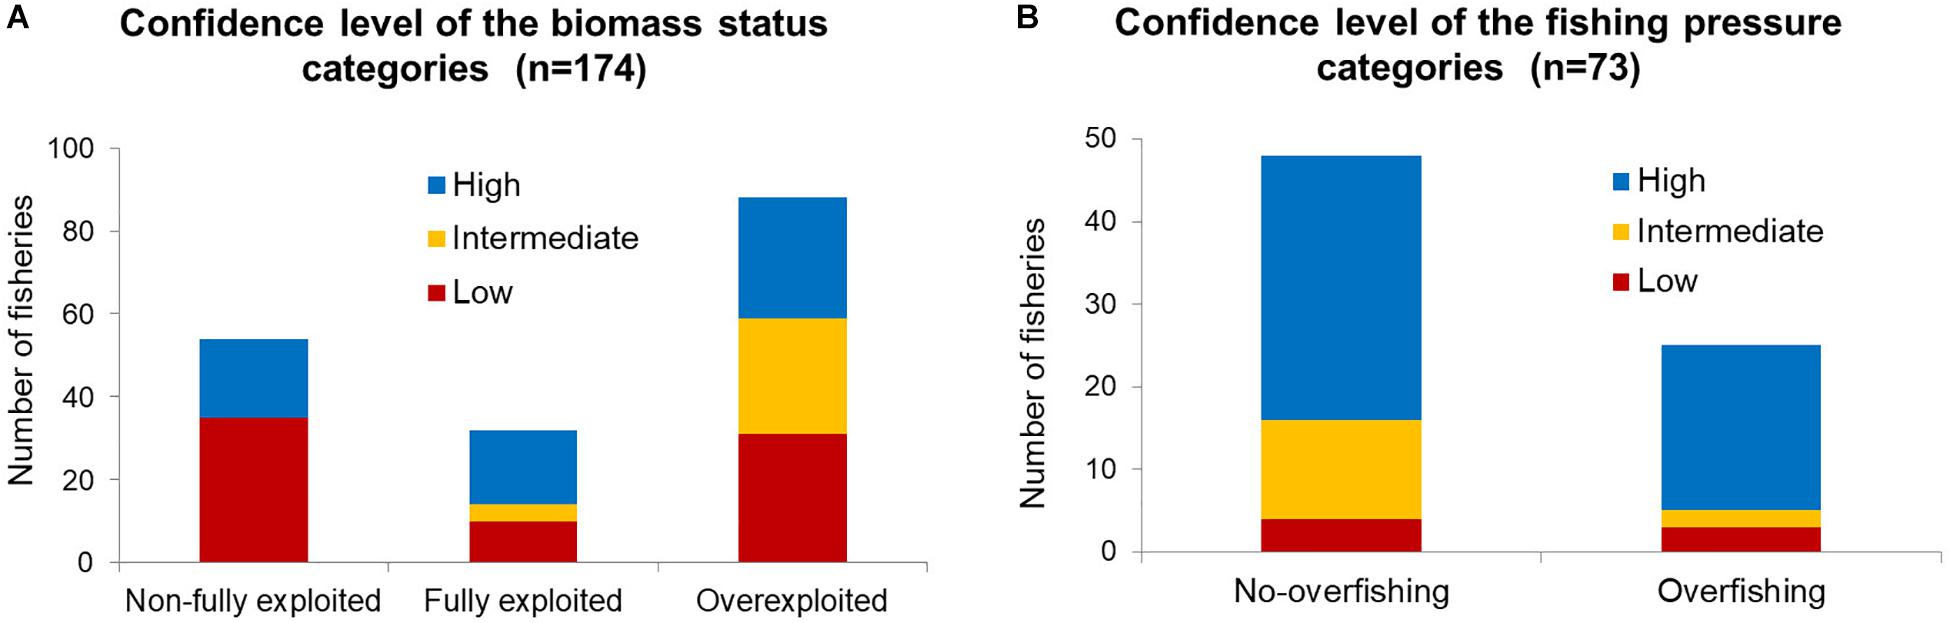
Figure 4. Confidence level of the biomass stock status (A) and the fishing pressure (B) categories assigned to the snapper and grouper fisheries evaluated in this study.
Biomass and Fishing Mortality Indices
For the fisheries with quantitative information, the Bindex (n = 41) and Findex (n = 53) were calculated based on the most recent estimates of biomass and fishing mortality (or proxies) in relation to their reference points (Figure 5). Both groups of species, Lutjanidae and Serranidae, present average Bindex values that are slightly below zero, suggesting that, in general, the biomass of those resources is slightly below their biological reference points. As for the Findex, both families show signs of overfishing (Findex > 0), although the Serranidae family presented a higher dispersion of Findex values (more details in Supplementary Material).
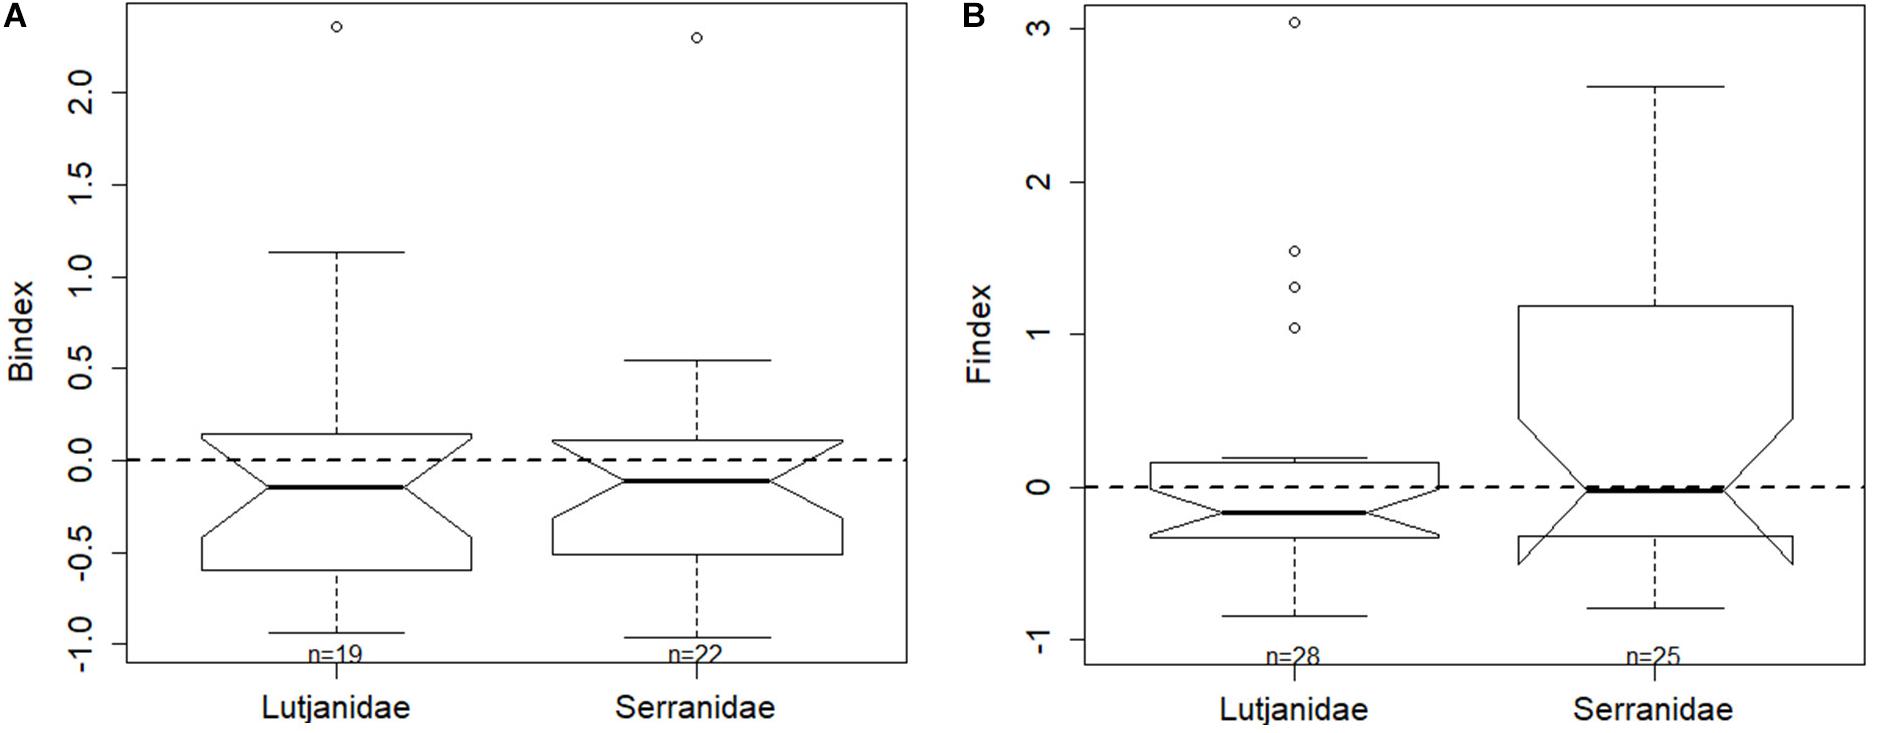
Figure 5. Distribution of biomass and fishing mortality indices by family. (A) The biomass index (Bindex) was calculated based on the current biomass value (spawning stock biomass or other biomass proxies) in relation to the reference point [(SSB−SSBMSY)/SSBMSY], and (B) the fishing pressure index (Findex) was calculated based on the current fishing mortality value (F or proxies) in relation to the reference point [(F−FMSY)/FMSY]. The Findex y-axis is limited (5 outliers above limit = 3: yellowtail snapper Ocyurus chrysurus – NE Brazil, coney Cephalopholis fulva and vermillion snapper Rhomboplites aurorubens – Puerto Rico, orange-spotted grouper Epinephelus coioides – Oman and United Arab Emirates). Extreme high values for Bindex are from yellowtail snapper Ocyurus chrysurus (Northern Gulf of Mexico and Western Central Atlantic) and peacock hind Cephalopholis argus (Hawaii), while the highest Findex value is from gray snapper Lutjanus griseus (Puerto Rico) fisheries.
Figure 6 presents the Bindex values and Findex values for the FAO areas with a higher number of fisheries. Western Central Atlantic (FAO 31) fisheries are, in general, overfished, with moderate dispersion, with two notable exceptions, yellowtail snapper (Ocyurus chrysurus) from the northern Gulf of Mexico and Western Central Atlantic and mahogany snapper (Lutjanus mahogoni) from Puerto Rico. The distribution of the Findex values in this area (FAO 31) is positively skewed, with a median below zero, indicating that no overfishing is taking place overall but that some fisheries are pushing the distribution forward. The fisheries where overfishing is occurring are vermillion snapper (Rhomboplites aurorubens), coney (Cephalopholis fulva), and gray snapper (Lutjanus griseus) in the eastern Caribbean/Puerto Rico. All fisheries analyzed for the Western Central Pacific (FAO 71) are overfished (Bindex < 0), although the sample size is very small (n = 6). For the Eastern Central Pacific (FAO 77), the sample size was even smaller (n = 4); the variation of status across these four fisheries was very high, but mostly above the non-overfished threshold (Bindex > 0). All of the few fisheries in the Western Indian Ocean (FAO 51) that were analyzed (n = 4) are severely overfished (more details in Supplementary Material).
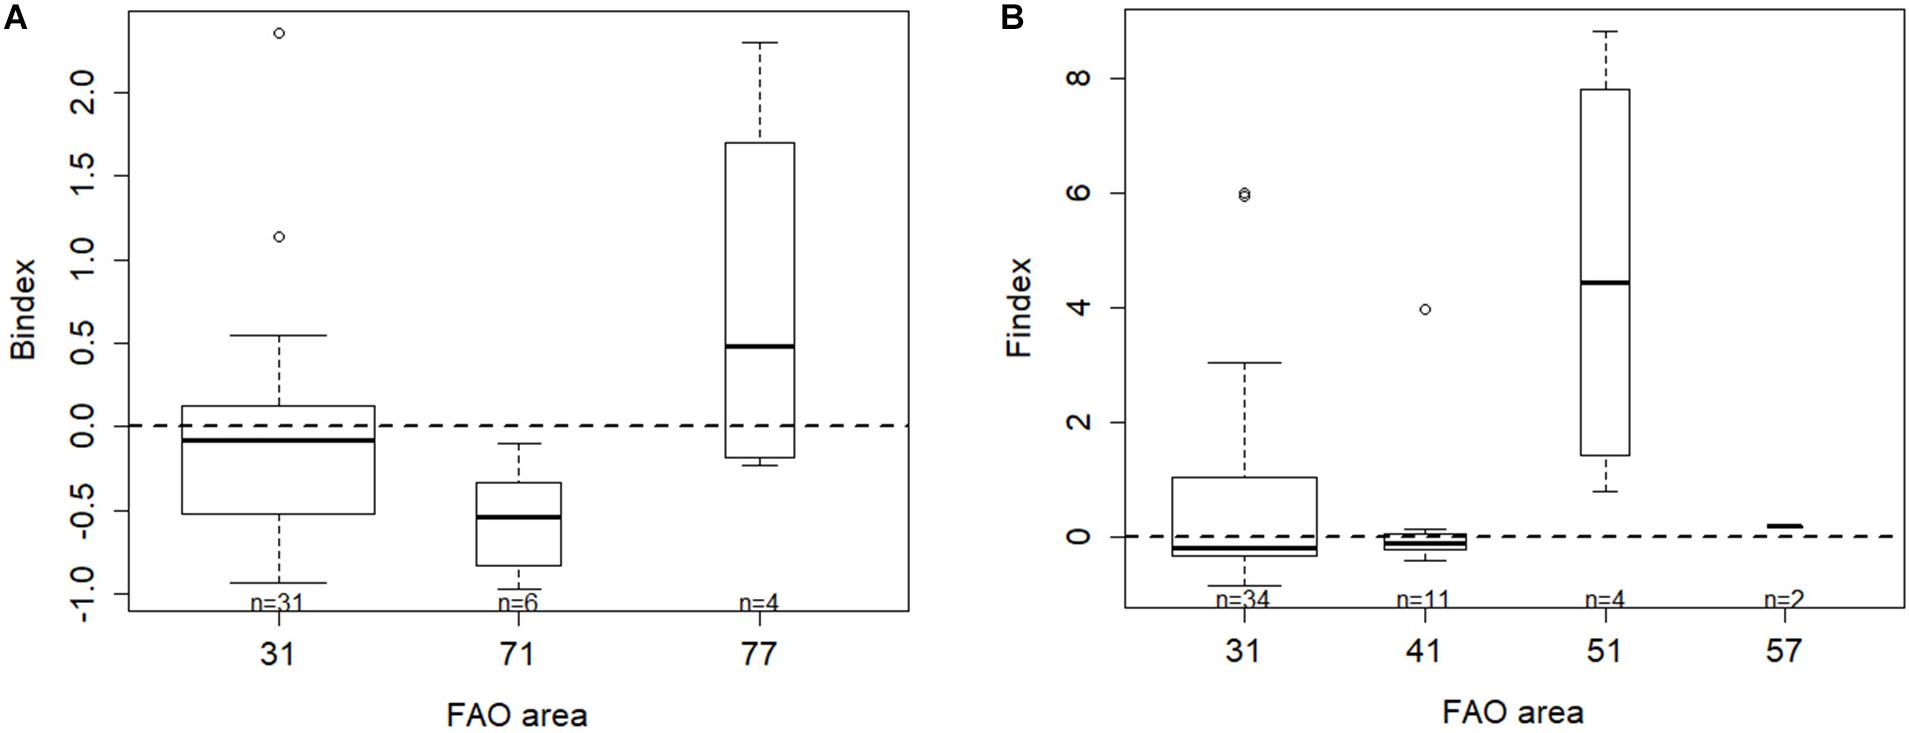
Figure 6. Bindex (A) and Findex (B) values obtained for the FAO areas with a higher number of fisheries data available in the database. FAO major fishing areas: 31, Western Central Atlantic; 41, Southwest Atlantic; 51, Western Indian Ocean; 57, Eastern Indian Ocean; 71, Western Central Pacific; and 77, Eastern Central Pacific.
FAO Landings Trend Analysis
According to the FAO’s global capture fisheries dataset (1950–2015), snapper and grouper contributed over 678,000 tones to reported landings in 2015, representing an increase of about 37% in relation to the average landings in the previous decade (2000–2009) and more than double the landings reported in the 1980s (Figure 7). Although the total reported landings showed an increasing trend over time, it should be noted that the number of countries reporting has also been increasing through the years, as has the quality of data reported (e.g., number of species reported). The number of fisheries by decade that attained their maximum value of landings (Cmax) has also been increasing continuously over the decades, except between the 1980s and 1990s, when the number of fisheries that reached their Cmax almost stagnated.
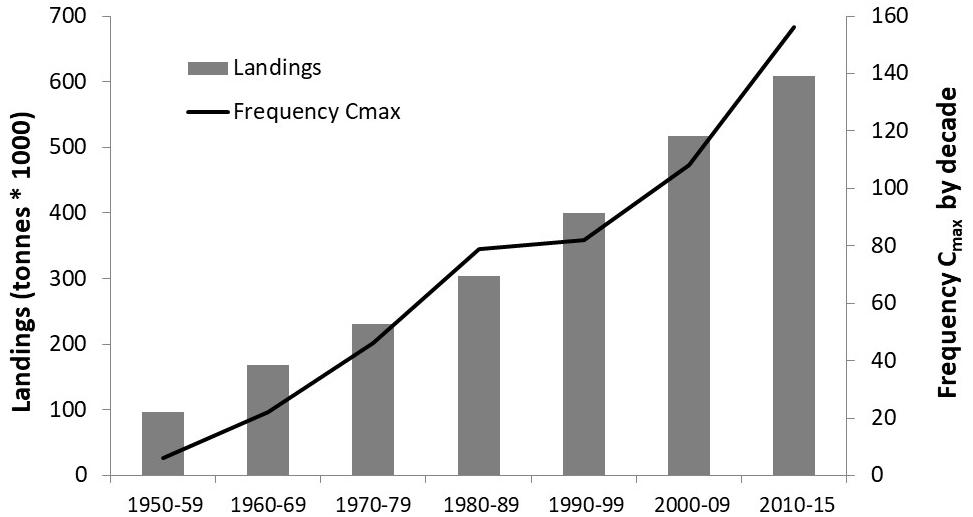
Figure 7. Total landings by decade (average values by fishery) and frequency of fisheries (n = 499) that achieved their maximum landings (Cmax) in each decade between 1950 and 2015.
According to the FAO’s global capture fisheries dataset, the ten top countries producing snapper and grouper are Indonesia, China, the Philippines, Mexico, Malaysia, Brazil, Pakistan, Nigeria, the United Arab Emirates, and the United States. These countries represent more than 83% of the total landings for the period 2010–2015 (Supplementary Figure S3).
Our trend analysis of the FAO snapper and grouper landings data suggests that the number of non-fully exploited fisheries continually decreased in past decades, while the number of overexploited fisheries increased (Figure 8). It should be noted that the method used does not allow for classification of fisheries as overexploited in the first decade (1950–1959) or as non-fully exploited in the most recent period of time considered (2010–2015). The number of fisheries analyzed over the decades also increased, from 68 fisheries in the decade 1950–1959 to about 402 fisheries in 2010–2015.
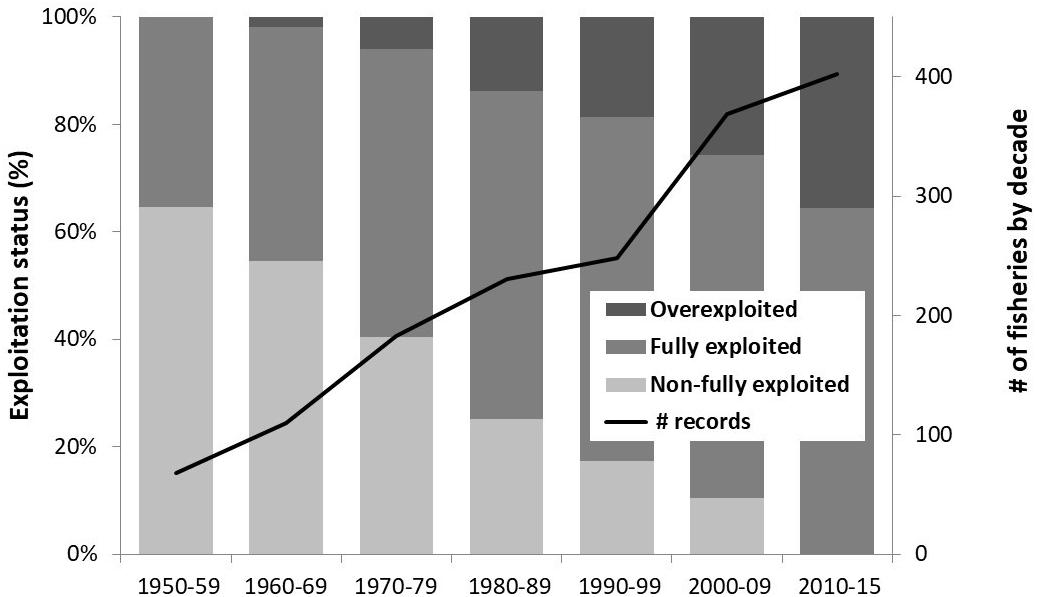
Figure 8. Exploitation status evolution of snapper and grouper fisheries and number of fisheries considered over the decades based on the FAO’s global capture fisheries dataset (FAO, 2017a).
The comparison of the exploitation status determined for the same snapper and grouper fisheries between 2000–2009 and 2010–2015 suggests that all fisheries classified as non-fully exploited shifted to fully exploited status, and almost half of the fully exploited fisheries in the first period shifted to overexploited status. Only a small part of the overexploited fisheries shifted back to fully exploited status (Supplementary Figure S4).
The classification of the exploitation status of snapper and grouper fisheries for the most recent period of data available (2010–2015) suggests that the Serranidae family has a higher percentage of overexploited fisheries than does the Lutjanidae. Higher percentages of overexploited fisheries are observed in the Americas (FAO Major Fishing Area 34 – Western Central Atlantic) and in Europe (FAO Major Fishing Area 37 – Mediterranean). Although it has fewer snapper and grouper fisheries reported, the Eastern Indian Ocean (FAO Major Fishing Area 57) had a higher percentage of fully exploited fisheries (Supplementary Figure S5).
Alternative Sources of Information on Fisheries Status
Our results indicate significant differences in trophic levels between species of the families Serranidae and Lutjanidae in general (Figure 9). Significant differences were also found in vulnerability and trophic levels between some FAO areas (see the Supplementary Material for significance test details). An overview of the geographic behavior of the variables used in this analysis (vulnerability, trophic level, serranid species richness, lutjanid species richness, and the global development indices) is presented in Supplementary Figure S6.
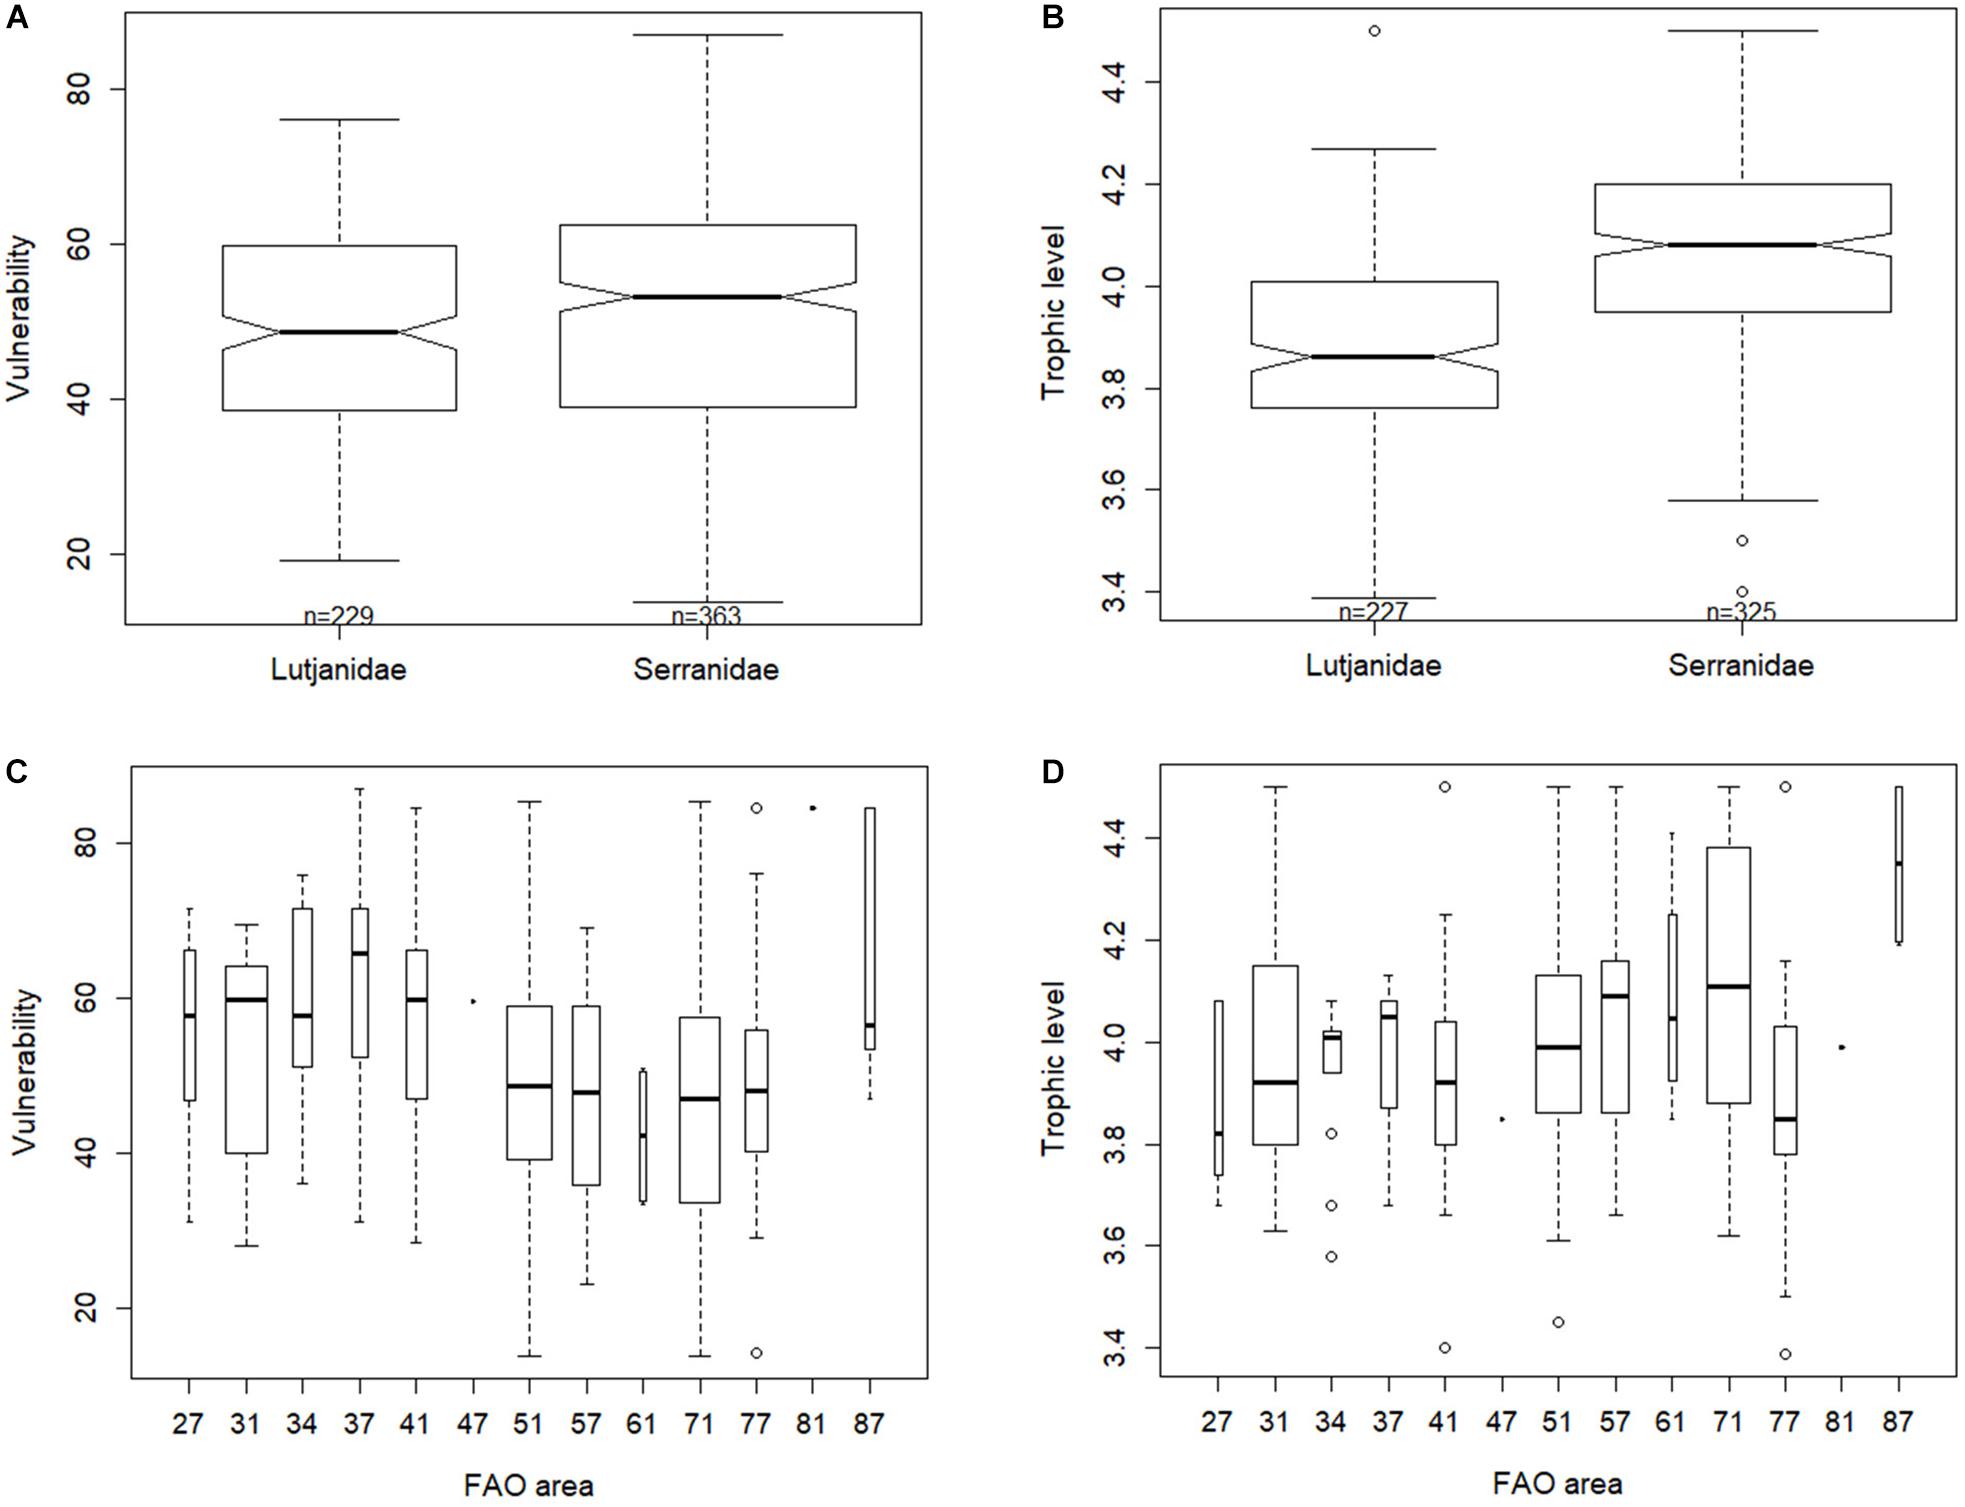
Figure 9. Vulnerability and trophic level by family (A,B) (Lutjanidae and Serranidae) and FAO major fishing area (C,D), considering the fisheries included in the database compiled for this study. FAO major fishing areas: 27, Northeast Atlantic; 31, Western Central Atlantic; 34, Eastern Central Atlantic; 37, Mediterranean; 41, Southwest Atlantic; 47, Southeast Atlantic; 51, Western Indian Ocean; 57, Eastern Indian Ocean; 61, Northwest Pacific; 71, Western Central Pacific; 77, Eastern Central Pacific; 81, Southwest Pacific; and 87, Southeast Pacific (Vulnerability and Trophic level source data: Fishbase).
Figure 10 presents the average values of the different variables by biomass status category. Only the variables whose distribution suggested any kind of relationship with the biomass stock status or fishing pressure status were tested for significance (significance tests are in Supplementary Material). Snapper and grouper fisheries classified as non-fully exploited were mainly distinguished from the other categories (fully exploited and overexploited) by their lower values of EPI, HDI, and GDP per capita (current USD). Fully exploited fisheries presented higher values of governance and lower values of cumulative human impacts than the other biomass stock categories. The overexploited category is characterized by higher values for the vulnerability of these resources (Figure 10 and Supplementary Figure S7).
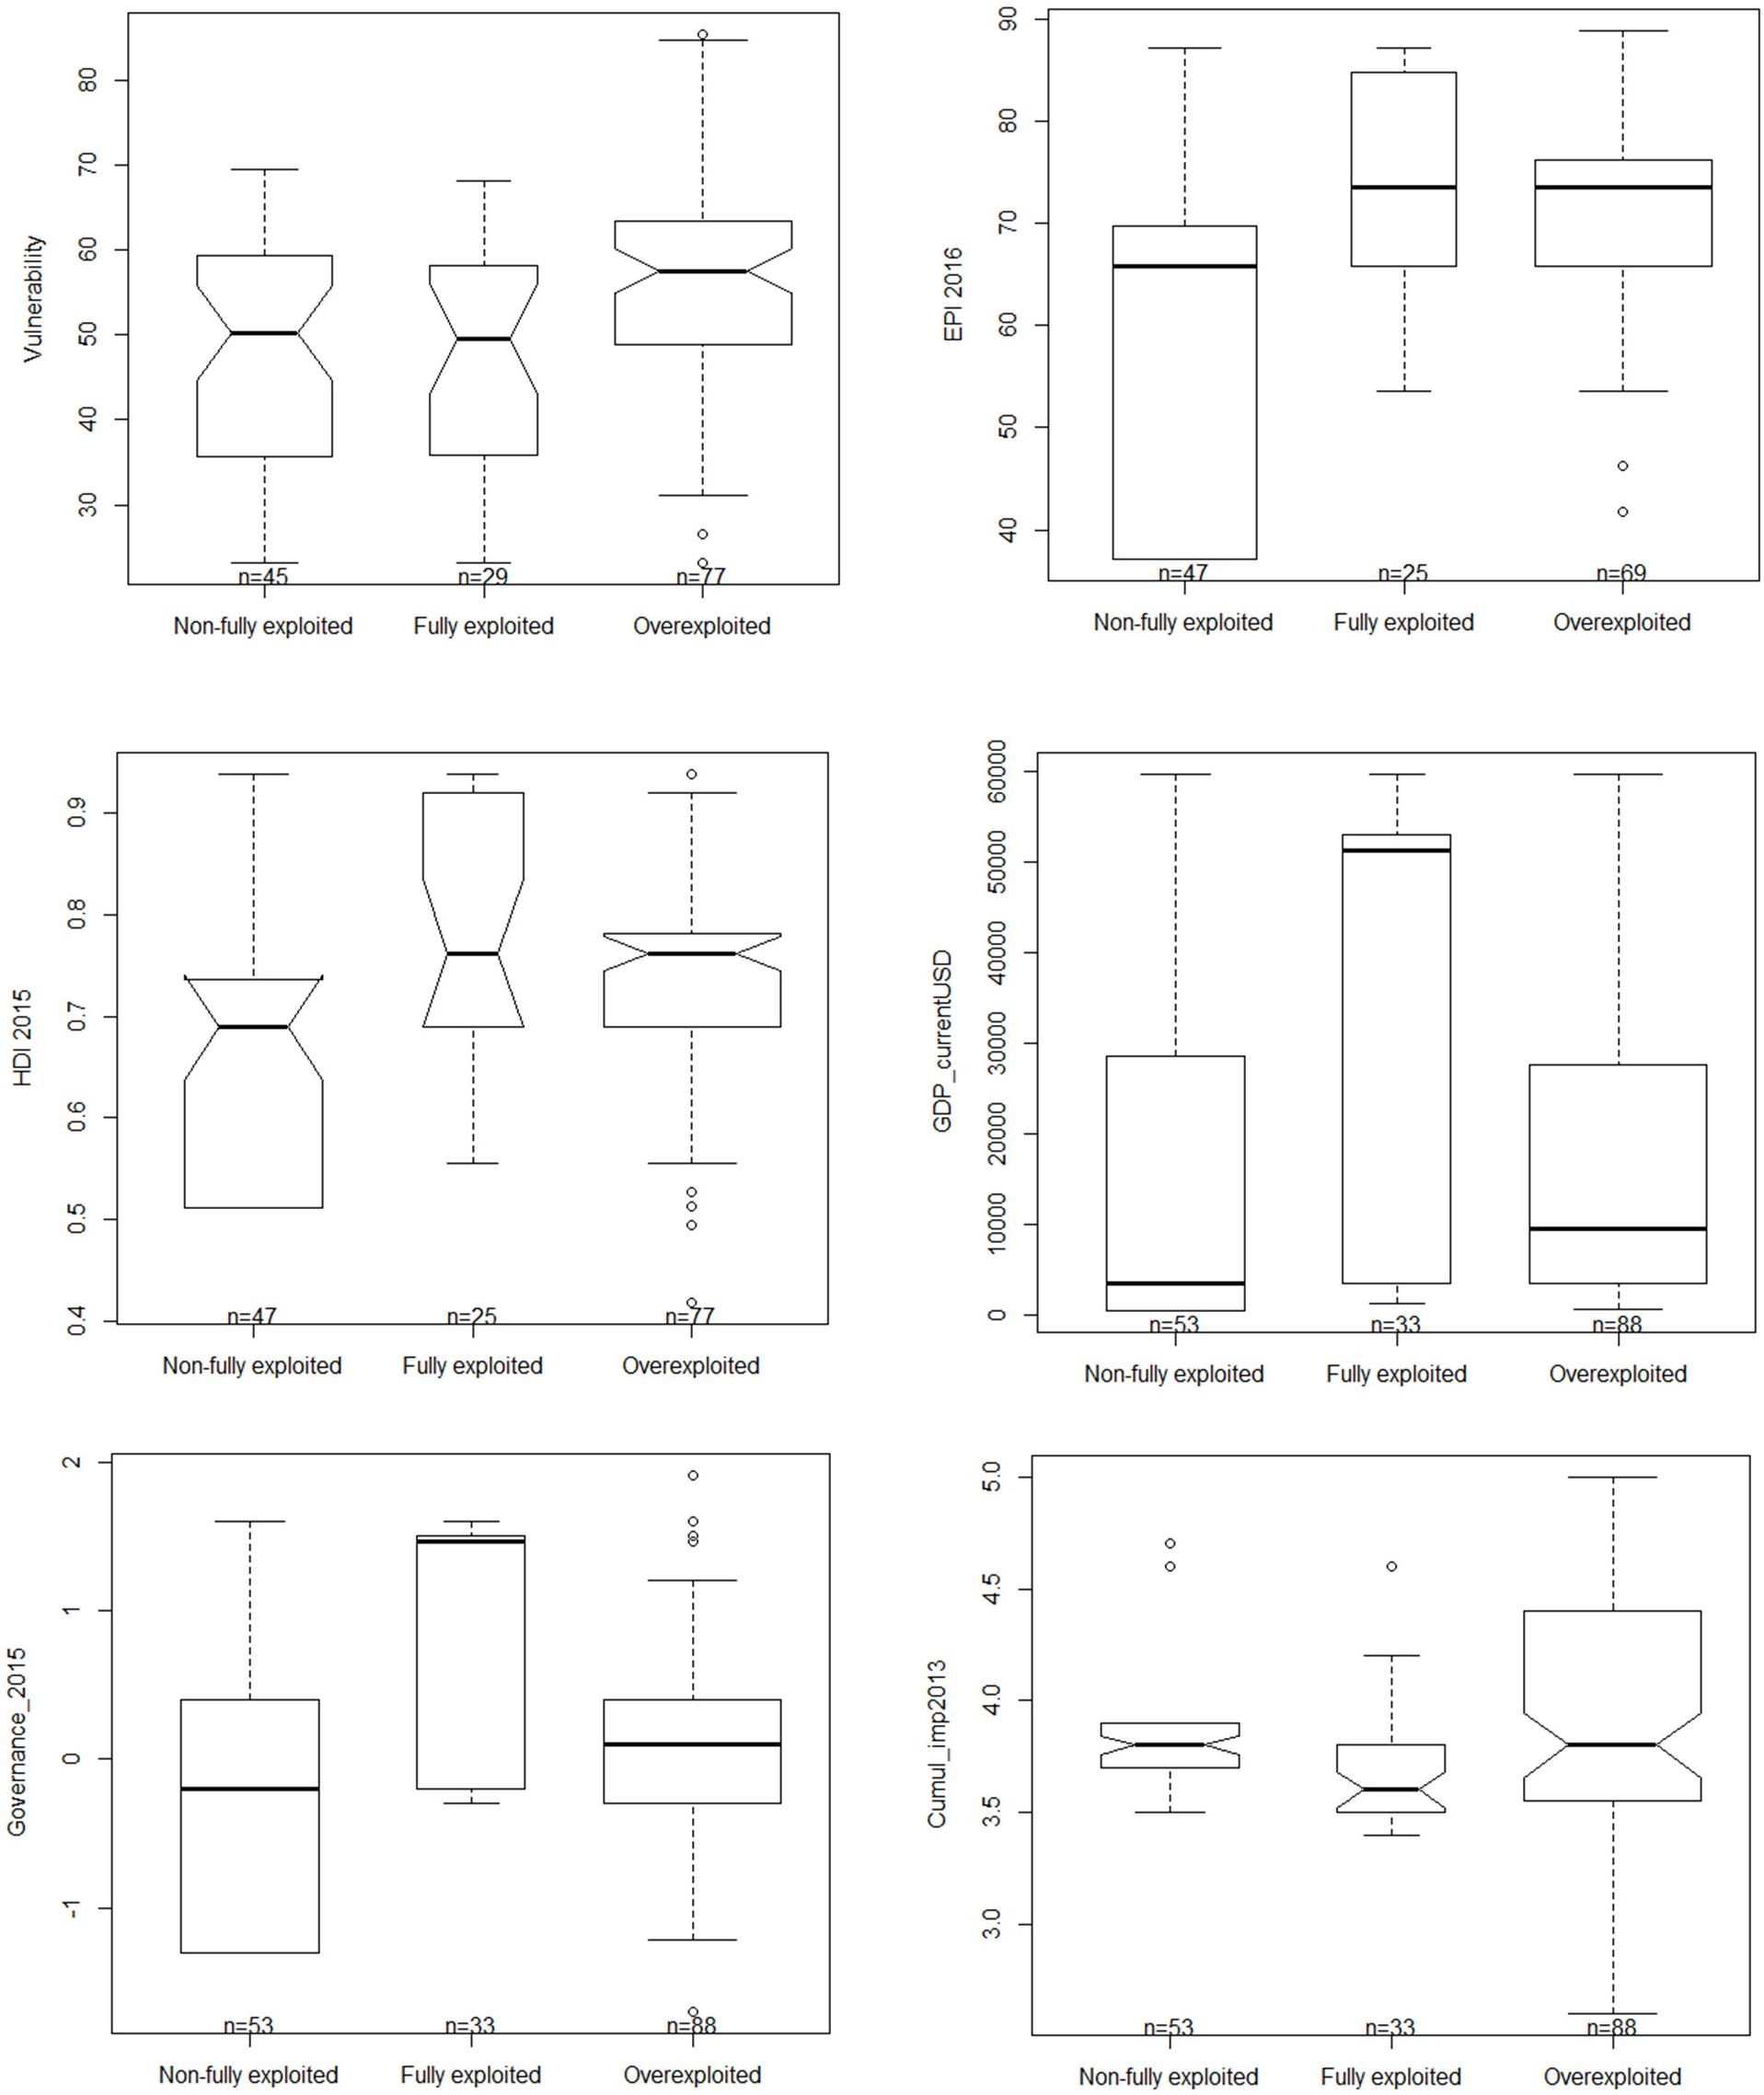
Figure 10. Distributions of the biomass stock status categories (non-fully exploited, fully exploited, and overexploited) in relation to the variables that distinguish one category of biomass from the other two (significant differences p < 0.05). Notches were omitted when the confidence interval for the median was found to be greater than the interquartile range. EPI, Environmental Performance index; HDI, Human Development index; GDP_currentUSD, Gross Domestic Production per capita (current USD); Cumul_Imp, Cumulative Human Impacts to Marine Ecosystems score.
Fisheries classified as no overfishing presented significantly higher values of EPI than fisheries classified as overfishing. None of the other variables presented significant differences between the fishing pressure categories (Supplementary Figure S8).
Pearson correlation coefficient results indicated strong and significant correlation coefficients among some variables (Supplementary Figure S9). As such, to avoid multicollinearity in the model, some variables were not included in the modeling phase: k, Lm, Environmental Performance Index (EPI), GDP per capita (current USD), and governance. The FAO major fishing area and economic class variables were included in the models.
The multinomial modeling approach explained about 44% of the variability observed in the biomass stock status classification data. The variables that best explained such variability were: FAO economic class, HDI (polynomial), and the average value of serranid richness. According to the model results (more detailed information in Supplementary Material), the probability of observing non-fully exploited fisheries is higher in developed and in least-developed countries, whereas the probability of observing overexploited fisheries is higher in other developing countries or territories. The probability of observing fully exploited fisheries is higher in other developing countries and very low in least-developed countries or territories (Figure 11 and Supplementary Material). The biomass stock categories showed a significant quadratic relationship with the HDI, with non-fully exploited fisheries presenting a higher probability of occurrence between 0.7 and 0.8 of HDI. The probability of occurrence of overexploited fisheries decreased as the value of serranid richness increased, being unlikely at serranid richness values higher than 20. The opposite effect is observed for non-fully exploited fisheries, presenting a higher probability of occurrence at serranid richness values higher than 20.
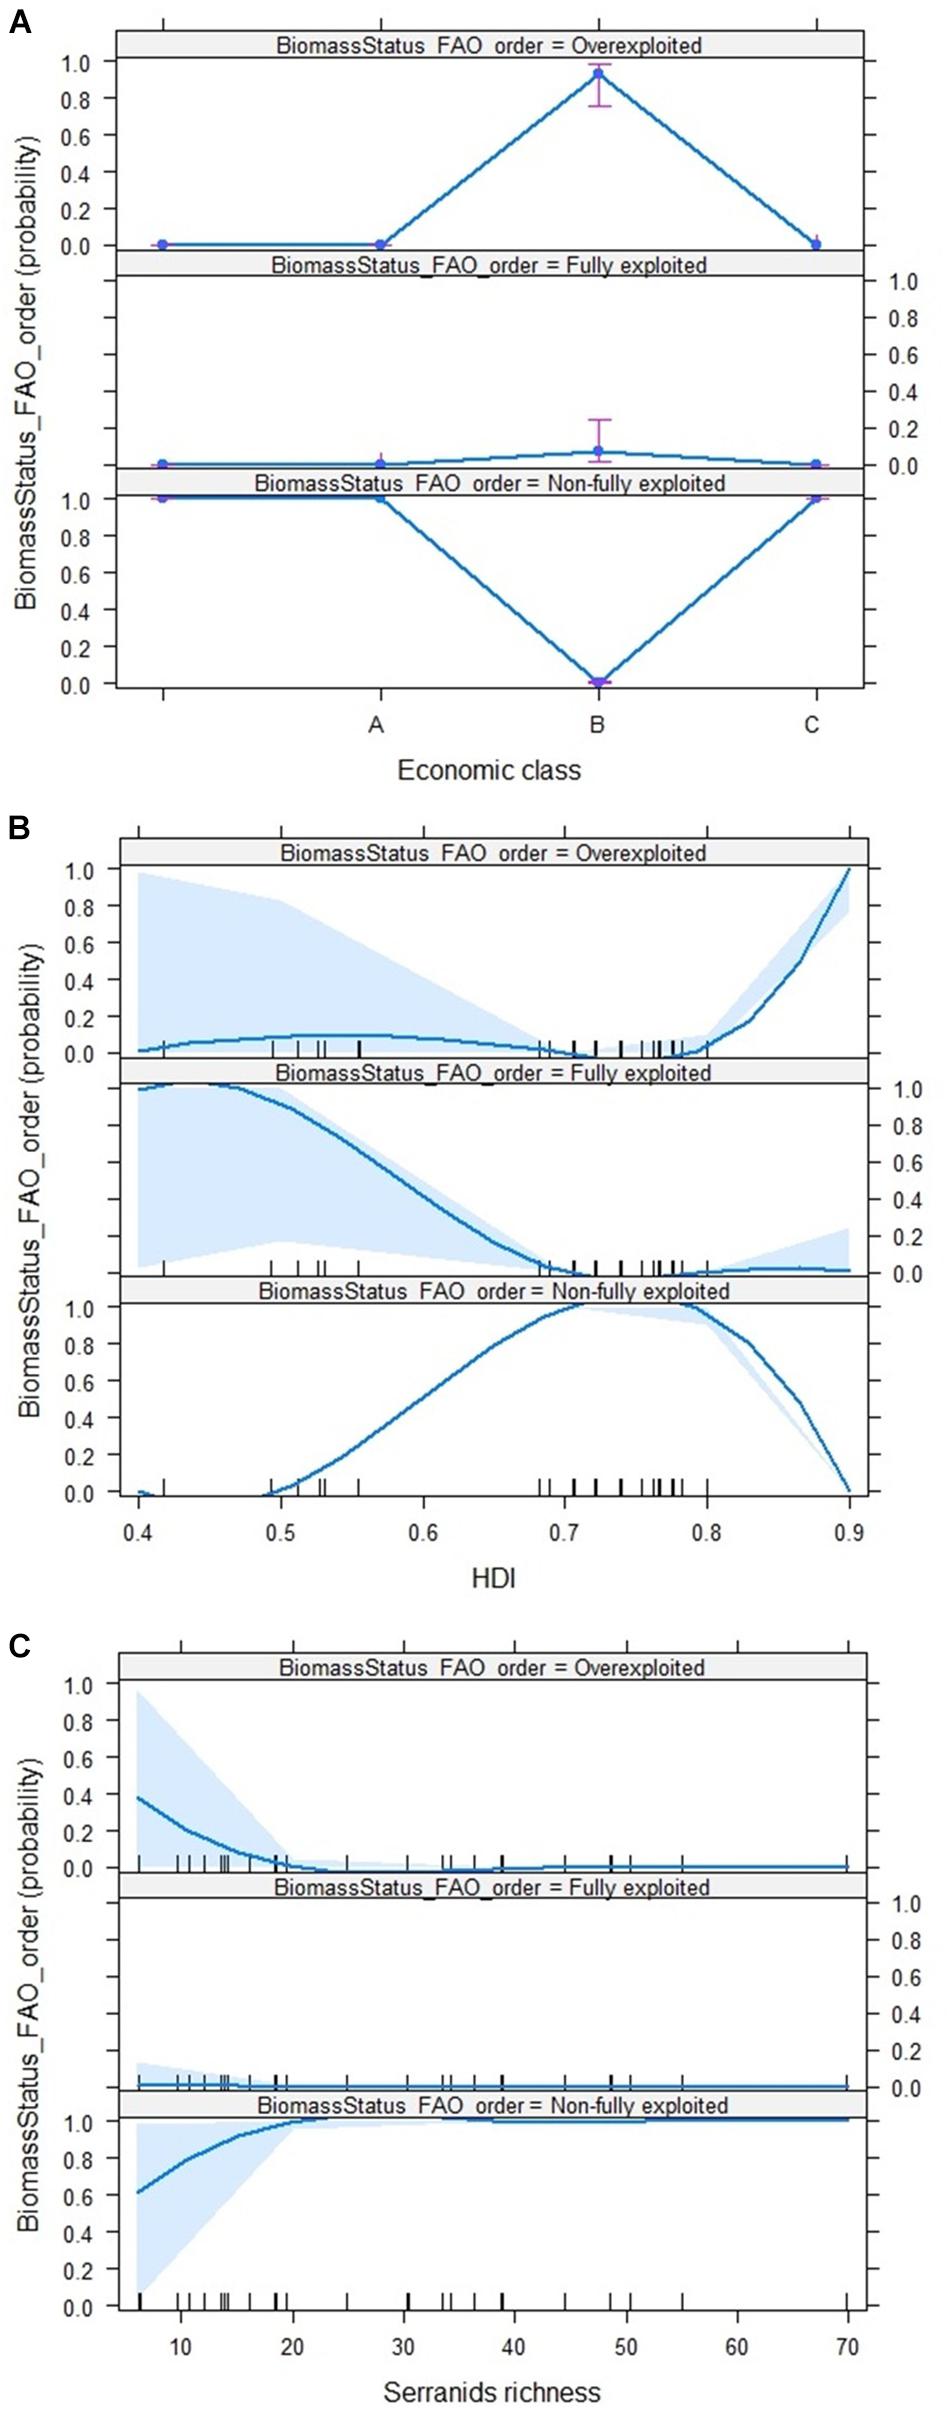
Figure 11. Simulation models of the effect of each significant explanatory variable on the biomass stock category (response), as detected by the multinomial model. (A) Economic classes (A – Least developed, B – Other developing and, C – Developed); (B) Human Development Index (HDI), and (C) serranid richness.
The correspondence classification calculated between the original and predicted categories of the biomass stock status presented a higher percentage of accuracy for non-fully exploited (82%) (Table 3). Nevertheless, the overall accuracy rate was 72%. The incorrect classifications were mostly due to misclassification of fisheries as non-fully exploited: 40% of the fully-exploited and 22% of the overexploited fisheries.
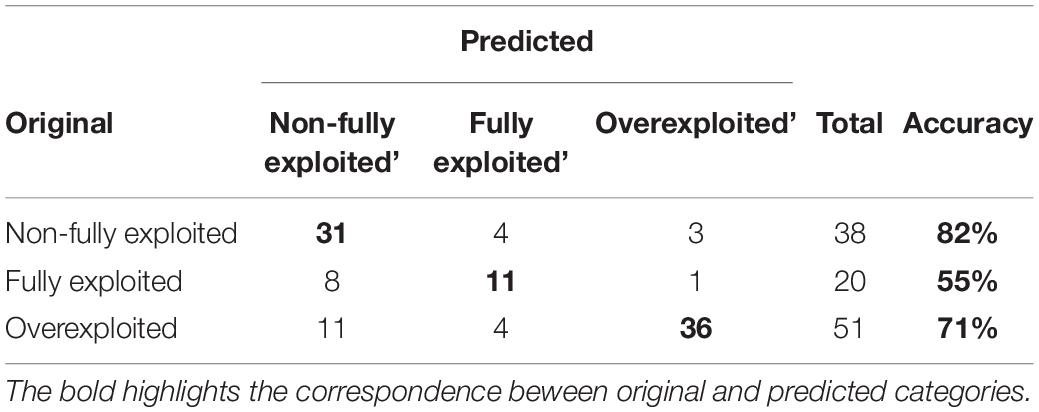
Table 3. Correspondence between the original classification of the biomass status categories and the predicted categories obtained through the multinomial model with best fit (Biomass Status ∼ Economic_class + poly (HDI, 2) + Serranid richness), and the percentage of accuracy of the prediction model by biomass status category.
Global Overview of Snapper and Grouper
Table 4 summarizes the main results obtained in this study. The correspondence between the results obtained from biomass status classification (174 fisheries for which a classification could be made out a total of 719 fisheries in the database) and FAO landings data (2010–2015, n = 499 fisheries) was not easy (only 129 fisheries matching). Furthermore, some of the paired comparisons were not made at a species level, since FAO landings for snapper and grouper are often reported at the family level instead of being species-specific. Based on the FAO’s classification of stock status, about half of the snapper and grouper fisheries were classified as overexploited, while the same fisheries were mostly classified as fully exploited based on FAO landings trend analysis. However, the comparison between the FAO landings trends from the two most recent periods of time (2000–2009 and 2010–2015) showed an increase in fisheries classified as overfished over time (Table 4). Furthermore, for fully exploited fisheries, the percentage of landings in relation to the value of maximum landings (Cmax) by decade increased between 2000–2009 and 2010–2015, suggesting that in recent years those resources experienced a higher level of exploitation, transitioning in some cases to overexploited fisheries (e.g., the Western Central Pacific, FAO 71). A summary of the main results by FAO major fishing area can be found in Supplementary Material.
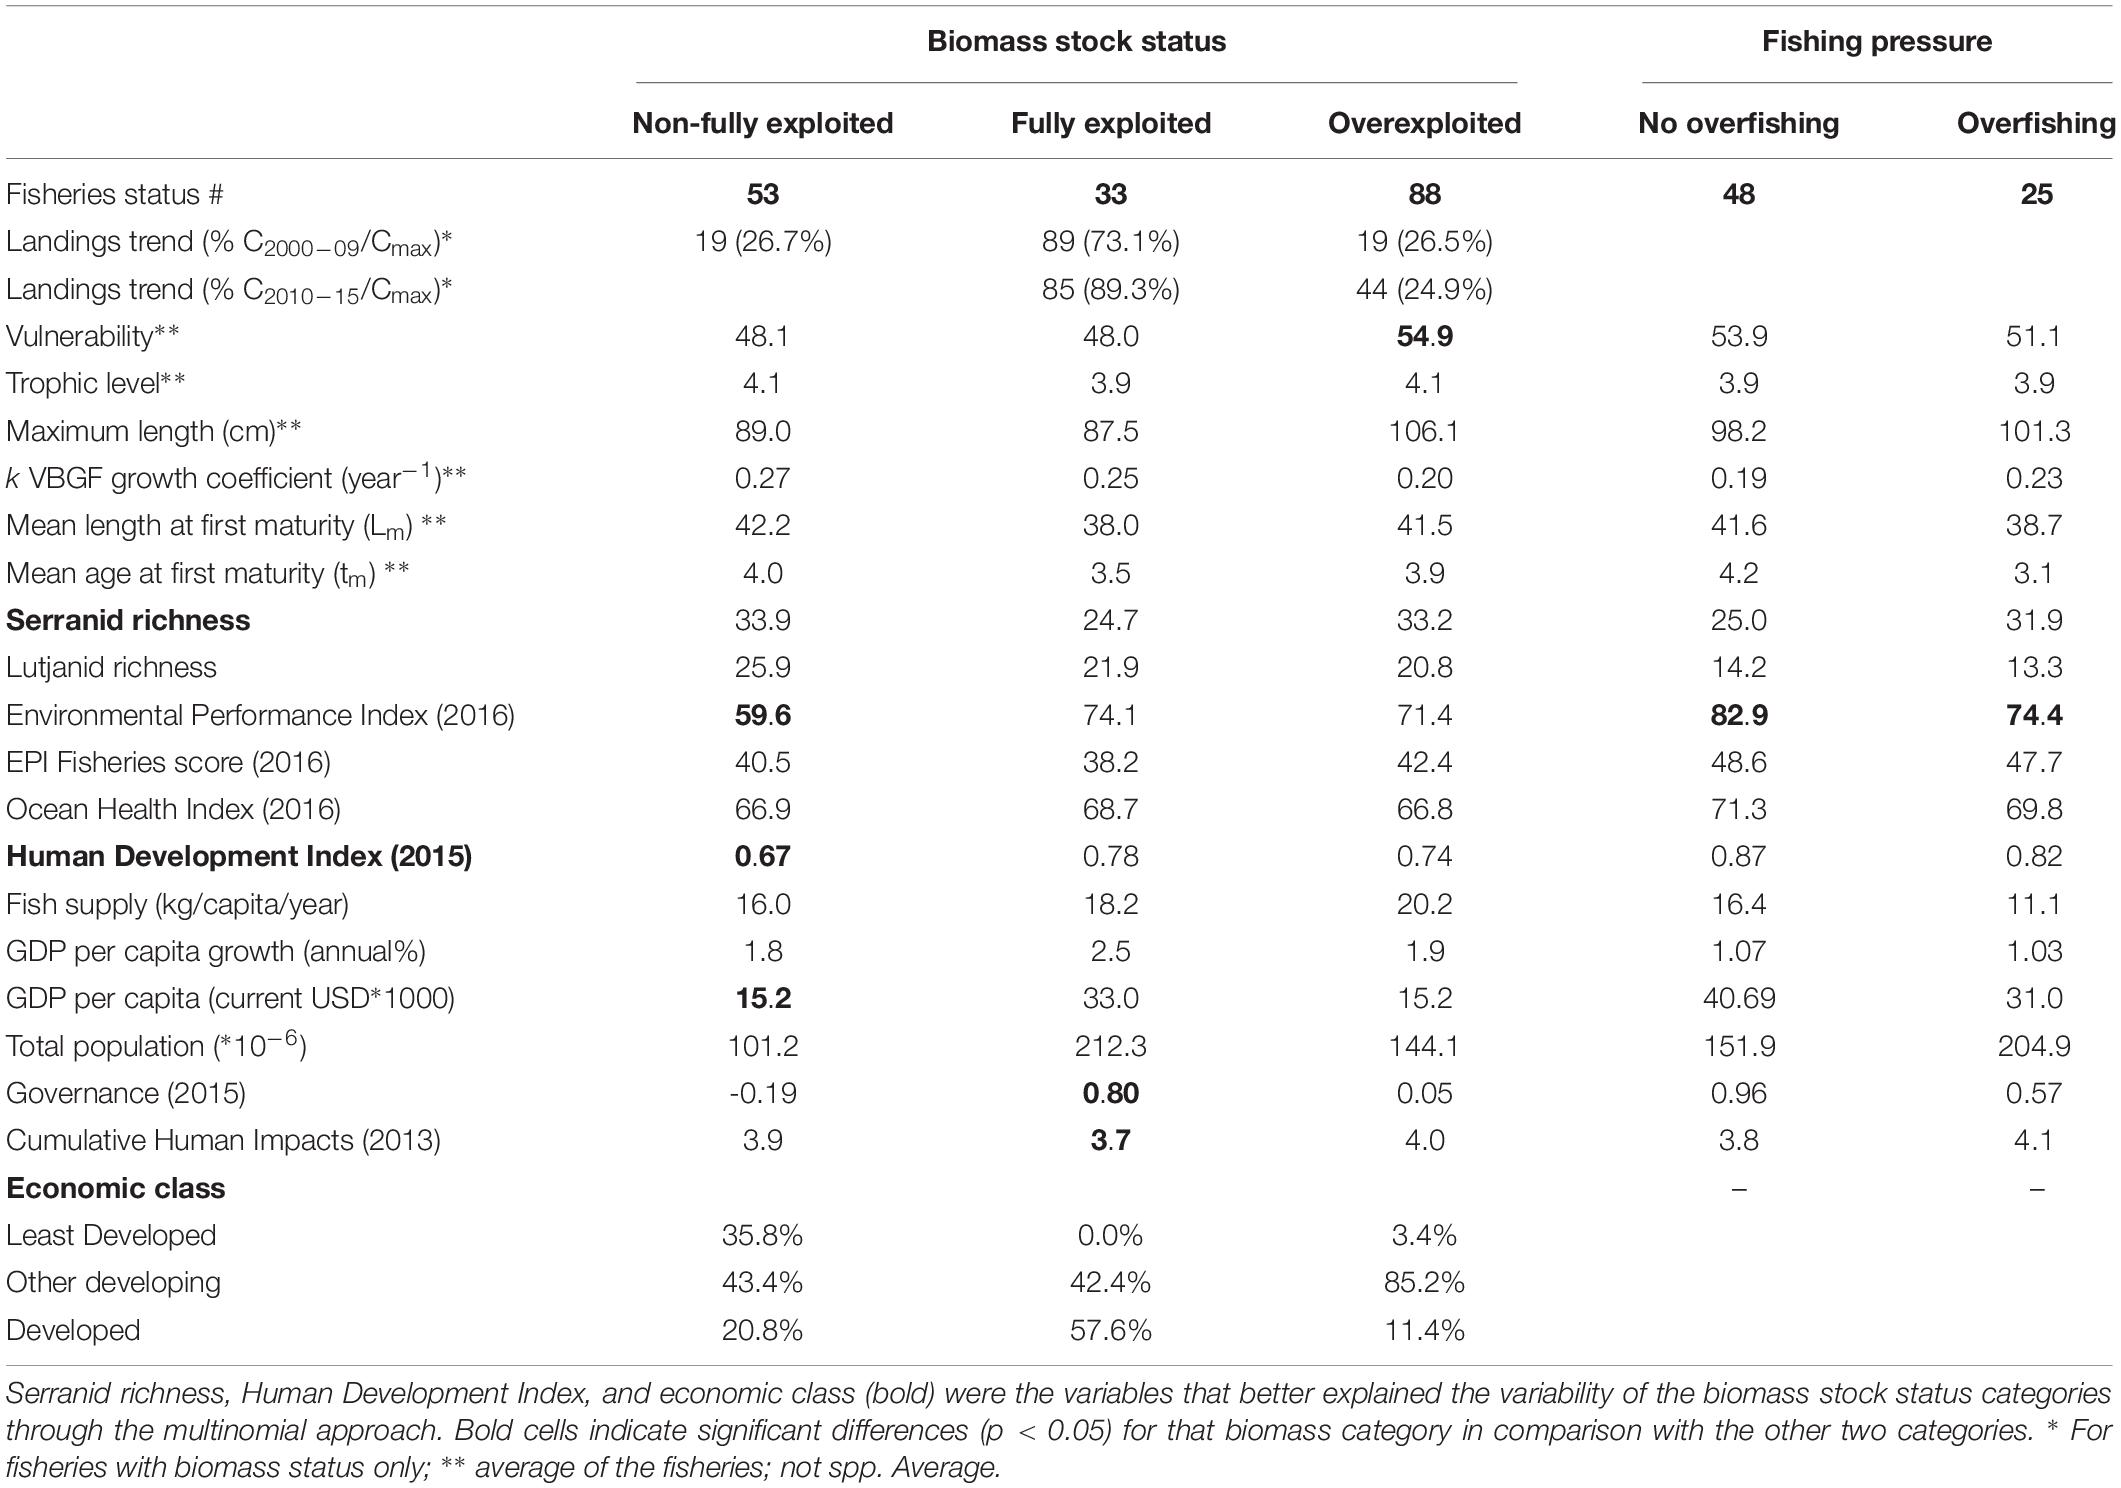
Table 4. Summary of the statuses of snapper and grouper fisheries (biomass stock status and fishing pressure categories), FAO landings data trend classification (2000–2009 and 2010–2015), and exploitation status (% landings by decade versus landings of the decade with the highest value of landings, Cmax), and average values of each variable calculated by biomass stock status category (non-fully exploited, fully exploited, and overexploited), considering the snapper and grouper fisheries compiled in this study.
The classification of the biomass stock status was explained by serranid biodiversity richness, HDI, and the FAO’s economic class variables, although other indices (vulnerability, EPI, GDP per capita, governance, and cumulative human impacts) also helped to distinguish one category from the other two categories (Table 4 and section Alternative Sources of Information on Fisheries Status). The lutjanid richness and k VBGF growth coefficient variables also showed significant differences between non-fully exploited and overexploited fisheries. Although fish supply mean values show an increasing trend from non-overexploited to overexploited fisheries, no significant differences were found between stock biomass categories (Supplementary Material).
Discussion
Snapper and Grouper Fisheries
For the majority of the countries, including the ten top producers, the snapper and grouper fisheries analyzed have no information on the sustainability status of these important resources, or, in some cases, the status is unknown or undefined. From the total of the snapper and grouper fisheries included in this study (n = 719), only for 24% (n = 174) was it possible to classify their biomass stock status based on the FAO classification (categories: non-fully exploited, fully exploited, and overexploited). About half of these fisheries were classified as overexploited, 30% as non-fully exploited, and 19% as fully exploited. Non-fully exploited fisheries presented a low confidence level as to their status when compared with other categories. In general, quantitative data is limited, but the few biomass indices calculated for snapper and grouper fisheries indicated that the current biomass of the stocks is slightly below the biomass reference points, reinforcing the perception that these stocks are mostly fully or overexploited. Furthermore, knowledge about fishing pressure in snapper and grouper fisheries worldwide is very limited: about 90% of the fisheries for which data were compiled have no fishing mortality information available. For the few fisheries with data on fishing pressure, the no overfishing category was more frequent than was overfishing. However, the average values of the Findex show signs of overfishing (Findex > 0) for both families, in particular for serranid fisheries, as also highlighted by the FAO landings trend analysis. This finding, associated with the life-history characteristics of this group of species, could easily lead to the overexploitation of these resources, as has been mentioned by other authors (Sadovy de Mitcheson and Erisman, 2012). Although focused on a restricted group of deep-water snapper species (genera Aphareus, Etelis, and Pristipomoides), a study undertaken in the Indo-Pacific region noted that these species have low production potential and suggested that sustainable exploitation rates and potential yields should be low (Newman et al., 2016). Globally, there is a lack of previous studies on snapper and grouper sustainability status. However, the global trends of the world’s marine fish stocks indicated that the level of overfished fishery resources in 2015 was around 33% (less than for snapper and grouper) but that the level of underfished resources was about 7%, well below the level observed for the snapper and grouper fisheries (FAO, 2018). These results reinforce the idea that those resources are easily overexploited.
Although the methodology of the FAO is flexible enough to classify the status of fish stocks without analytical assessment (Ye, 2011), this study shows that, for data-limited fisheries, the application of the FAO’s approach still leaves out fisheries where only landings data is available. In addition, the results of the trend analysis of FAO landings data were not consistent with the biomass stock status classification method. The trend analysis identified fisheries in transition from being fully exploited to being overexploited, which results from low temporal resolution. In future studies, a higher temporal resolution (e.g., 2 years; see Anderson et al., 2012) of landings data should be considered, at least for recent years. Furthermore, these results might be related to the level of commercial interest, i.e., highly valuable fisheries (which are more likely to be subjected to assessments) are more likely to be exposed to higher exploitation rates over longer periods of time and will thus have higher propensities for overexploitation.
The approach applied in the trend analysis of FAO landings data is limited in that it allows stocks to be classified as “developing” only in the years preceding the maximum catch of the time series and as “overexploited” only in the years after this maximum catch (Branch et al., 2011). In spite of its limitations (Rosenberg, 2014), this approach has been partially applied in previous studies (see Anderson et al., 2012; Ghosh et al., 2015; Kleisner and Pauly, 2015). To improve on these results, however, they should be combined with other relevant information, e.g., (1) considering that snappers and groupers are targeted by their fisheries during their spawning aggregations, thus leading to potentially misleading interpretations (Erisman et al., 2010; Newman et al., 2016), (2) accounting for the quality of the underlying catch data (Walsh et al., 2018), and (3) accounting for the method used to set catch limits (see example on US South Atlantic snapper-grouper fisheries; Newman et al., 2015).
The results achieved in this study facilitate a comparative analysis among countries or territories, identifying the regions where the sustainability of these resources is at higher risk and highlighting the geographic areas where there is more uncertainty about the status of snapper and grouper stocks and associated fisheries. These results provide a tangible pathway for developing snapper and grouper fishery improvement strategies.
Alternative Proxies of the Status of the Fisheries
One of the major outcomes of this study is the identification of alternative sources of information that might provide inferences on the status of these resources. Our results highlight the importance of correct classifications, i.e., misclassification, notably for non-fully exploited fisheries, might lead to overestimation of the biomass status of snapper and grouper fisheries in developing and least developed countries, where information on the fisheries status is usually limited. Our results corroborate those of similar catch-based studies (see Free et al., 2017; Zhou et al., 2017).
In addition, our results suggest that HDI, vulnerability, EPI, GDP per capita, governance, and cumulative impacts may be used to infer the biomass status of snapper and grouper fisheries. Of these, HDI seems to be highly correlated with the exploitation categories, suggesting that countries with low HDI tend to have snapper and grouper fisheries that are in the non-fully exploited category. Note, that snapper and grouper stocks predominantly dwell in tropical and sub-tropical oceans, are relatively coastal, and are associated, typically, with highly diverse coral reefs. That is, these species are found mostly in developing countries, where they are typically targeted by small-scale fisheries (Stuart-Smith et al., 2013; Ault et al., 2014). This might suggest that snapper and grouper habitats are not conducive to the gear typically employed by industrial fishing fleets in high HDI countries. However, more information and analysis would be required to understand which factors are most influential over the trend found in this study and how any regionally observed exceptions can be interpreted from the data. Similarly to HDI, low EPI showed a slight correlation with the non-fully exploited fisheries category, fully-exploited fisheries are associated with higher governance and low cumulative human impact values, and, as expected, overexploited fisheries are common for highly vulnerable species. Conversely, OHI, life-history parameters, trophic level, and total human population did not present significant relationships with the biomass status categories or with fishing pressure. Alternative approaches may be used to identify and understand changes when formal scientific data on the history of a fishery are lacking (Cheung and Sadovy, 2005). In general, indicators used for assessment of data-limited fisheries would need to reflect the status of the stock, i.e., whether the stock is in an acceptable or unacceptable state or whether it is in an intermediate state (Dowling et al., 2015). The need to explore alternative possibilities regarding data-limited fishery assessment has been discussed extensively (see Geromont and Butterworth, 2015).
Our study applied three approaches that are complementary and require data that are relatively easy to obtain. This methodology depends heavily on data availability across the spectrum of variables for the same species or stocks and thus should not replace a more robust analysis when data are available. However, it provides an alternative and more feasible method than the average suite of methodologies designed for data-rich fisheries and may generate impactful inferences for fisheries managers.
Author Contributions
PA, PS, EJ, and GM designed the study and wrote the manuscript. PA collected and processed most of the data. PA conducted most of the analyses with guidance from PS and EJ.
Funding
PA supported by a grant from the Portuguese Foundation for Science and Technology (FCT doctoral grant SFRH/BD/103504/2014). The authors acknowledge funds provided by the Fundação para a Ciência e a Tecnologia (FCT) through the strategic project (FCT/UID/MAR/04292/2013) granted to MARE. Publication fees were supported by the Sustainable Fisheries Partnership Foundation (SFP) and the Frontiers fee-waiver program.
Conflict of Interest
The authors declare that the research was conducted in the absence of any commercial or financial relationships that could be construed as a potential conflict of interest.
Acknowledgments
We are thankful to the Sustainable Fisheries Partnership Foundation (SFP) and its teams for the support provided to this work. We thank Amy Sweeting (SFP) for copyediting the manuscript. We also thank the reviewers and editor, whose comments and suggestions greatly improved the manuscript.
Supplementary Material
The Supplementary Material for this article can be found online at: https://www.frontiersin.org/articles/10.3389/fmars.2019.00654/full#supplementary-material
Footnotes
References
Amorim, P., Sousa, P., Westmeyer, M., and Menezes, G. M. (2018). Generic Knowledge Indicator (GKI): a tool to evaluate the state of knowledge of fisheries applied to snapper and grouper. Mar. Policy 89, 40–49. doi: 10.1016/j.marpol.2017.11.030
Anderson, S. C., Branch, T. A., Ricard, D., and Lotze, H. K. (2012). Assessing global marine fishery status with a revised dynamic catch-based method and stock-assessment reference points. ICES J. Mar. Sci. 69:fss105. doi: 10.1093/icesjms/fss105
Anderson, S. C., Cooper, A. B., Jensen, O. P., Minto, C., Thorson, J. T., Walsh, J. C., et al. (2017). Improving estimates of population status and trend with superensemble models. Fish Fish. 18, 732–741. doi: 10.1111/faf.12200
Anticamara, J. A., Watson, R., Gelchu, A., and Pauly, D. (2011). Global fishing effort (1950–2010): trends, gaps, and implications. Fish. Res. 107, 131–136. doi: 10.1016/j.fishres.2010.10.016
Arnold, L. M., and Heppell, S. S. (2015). Testing the robustness of data-poor assessment methods to uncertainty in catch and biology: a retrospective approach. ICES J. Mar. Sci. 72, 243–250. doi: 10.1093/icesjms/fsu077
Ault, J. S., Smith, S. G., Browder, J. A., Nuttle, W., Franklin, E. C., Luo, J., et al. (2014). Indicators for assessing the ecological dynamics and sustainability of southern Florida’s coral reef and coastal fisheries. Ecol. Indic. 44, 164–172. doi: 10.1016/j.ecolind.2014.04.013
Bailey, M., and Sumaila, U. R. (2015). Destructive fishing and fisheries enforcement in eastern Indonesia. Mar. Ecol. Prog. Ser. 530, 195–211. doi: 10.3354/meps11352
Bentley, N. (2014). Data and time poverty in fisheries estimation: potential approaches and solutions. ICES J. Mar. Sci. 72, 186–193. doi: 10.1093/icesjms/fsu023
Boettiger, C., Chamberlain, S., Lang, D. T., Wainwright, P., and Boettiger, M. C. (2016). Package Rfishbase. Available at: ftp://cran.wu-wien.ac.at/pub/R/web/packages/rfishbase/rfishbase.pdf (accessed August 31, 2017).
Boettiger, C., Lang, D. T., and Wainwright, P. C. (2012). rfishbase: exploring, manipulating and visualizing fishbase data from R. J. Fish Biol. 81, 2030–2039. doi: 10.1111/j.1095-8649.2012.03464.x
Branch, T. A., Jensen, O. P., Ricard, D., Ye, Y., and Hilborn, R. (2011). Contrasting global trends in marine fishery status obtained from catches and from stock assessments. Conserv. Biol. 25, 777–786. doi: 10.1111/j.1523-1739.2011.01687.x
Carruthers, T. R. (2018). A multispecies catch-ratio estimator of relative stock depletion. Fish. Res. 197, 25–33. doi: 10.1016/j.fishres.2017.09.017
Carruthers, T. R., Punt, A. E., Walters, C. J., MacCall, A., McAllister, M. K., Dick, E. J., et al. (2014). Evaluating methods for setting catch limits in data-limited fisheries. Fish. Res. 153, 48–68. doi: 10.1016/j.fishres.2013.12.014
Cawthorn, D.-M., and Mariani, S. (2017). Global trade statistics lack granularity to inform traceability and management of diverse and high-value fishes. Sci. Rep. 7:12852. doi: 10.1038/s41598-017-12301-x
Cheung, W. W. L., and Sadovy, Y. (2005). Retrospective evaluation of data-limited fisheries: a case from Hong Kong. Rev. Fish. Biol. Fish. 14, 181–206. doi: 10.1007/s11160-004-5422-y
Chrysafi, A., and Kuparinen, A. (2016). Assessing abundance of populations with limited data: lessons learned from data-poor fisheries stock assessment. Environ. Rev. 24, 25–38. doi: 10.1139/er-2015-2044
Costello, C., Ovando, D., Hilborn, R., Gaines, S. D., Deschenes, O., and Lester, S. E. (2012). Status and solutions for the world’s unassessed fisheries. Science 338, 517–520. doi: 10.1126/science.1223389
Dick, E. J., and MacCall, A. D. (2011). Depletion-Based Stock Reduction Analysis: a catch-based method for determining sustainable yields for data-poor fish stocks. Fish. Res. 110, 331–341. doi: 10.1016/j.fishres.2011.05.007
Die, D., and Casariego, J. R. (2016). Western Central Atlantic Fishery Comission (WECAFC). Review of the State of Fisheries in the WECAFC region. Sixteen Session: Guadeloupe, 20-24 June 2016. Available at: http://www.fao.org/fi/static-media/MeetingDocuments/WECAFC16/2e.pdf (accessed June 28, 2018).
Dowling, N. A., Dichmont, C. M., Haddon, M., Smith, D. C., Smith, A. D. M., and Sainsbury, K. (2015). Empirical harvest strategies for data-poor fisheries: a review of the literature. Fish. Res. 171, 141–153. doi: 10.1016/j.fishres.2014.11.005
Erauskin-Extramiana, M., Herzka, S. Z., Hinojosa-Arango, G., and Aburto-Oropeza, O. (2017). An interdisciplinary approach to evaluate the status of large-bodied serranid fisheries: the case of magdalena-almejas bay lagoon complex, baja california sur, mexico. Ocean Coast. Manag. 145, 21–34. doi: 10.1016/j.ocecoaman.2017.05.005
Erisman, B., Heyman, W., Kobara, S., Ezer, T., Pittman, S., Aburto-Oropeza, O., et al. (2017). Fish spawning aggregations: where well-placed management actions can yield big benefits for fisheries and conservation. Fish Fish. 18, 128–144. doi: 10.1111/faf.12132
Erisman, B., Mascarenas, I., Paredes, G., Sadovy de Mitcheson, Y., Aburto-Oropeza, O., and Hastings, P. (2010). Seasonal, annual, and long-term trends in commercial fisheries for aggregating reef fishes in the Gulf of California, Mexico. Fish. Res. 106, 279–288. doi: 10.1016/j.fishres.2010.08.007
FAO (2017a). Global Capture Production 1950-2015 (FishstatJ). Available at: http://www.fao.org/fishery/statistics/globalcapture-production/en (accessed October 13, 2017).
FAO (2017b). Fisheries and Aquaculture Software. FishStatJ - Software for Fishery Statistical Time Series. Available at: http://www.fao.org/fishery/statistics/software/fishstatj/en (accessed October 19, 2017).
FAO (2017c). FAOSTAT: Food Balance Sheets. Available at: http://www.fao.org/faostat/en/#data/FBS (accessed July 9, 2018).
FAO, (ed.) (2018). The State of World Fisheries and Aquaculture 2018 -Meeting the Sustainable Development Goals. Rome: Food and Agriculture Organization.
Fox, J., and Weisberg, S. (2011). An R Companion to Applied Regression, 2nd Edn. Washington, DC: Sage.
Free, C. M., Jensen, O. P., Wiedenmann, J., and Deroba, J. J. (2017). The refined ORCS approach: a catch-based method for estimating stock status and catch limits for data-poor fish stocks. Fish. Res. 193, 60–70. doi: 10.1016/j.fishres.2017.03.017
Froese, R., Demirel, N., Coro, G., Kleisner, K. M., and Winker, H. (2017). Estimating fisheries reference points from catch and resilience - appendix 4. Fish Fish. 18, 506–526. doi: 10.1111/faf.12190
Froese, R., and Kesner-Reyes, K. (2002). Impact of Fishing on the Abundance of Marine Species In (ICES Council Meeting Report CM), 12. Available at: http://www.ices.dk/sites/pub/CM%20Doccuments/2002/L/L1202.pdf (accessed December 5, 2017).
Garibaldi, L. (2012). The FAO global capture production database: a six-decade effort to catch the trend. Mar. Policy 36, 760–768. doi: 10.1016/j.marpol.2011.10.024
Geromont, H. F., and Butterworth, D. S. (2015). Complex assessments or simple management procedures for efficient fisheries management: a comparative study. ICES J. Mar. Sci. 72, 262–274. doi: 10.1093/icesjms/fsu017
Ghosh, S., Muktha, M., Rao, M. V. H., and Behera, P. R. (2015). Assessment of stock status of the exploited fishery resources in northern Bay of Bengal using landed catch data. Indian J. Fish. 62, 23–30.
Halpern, B. S., Frazier, M., Potapenko, J., Casey, K. S., Koenig, K., Longo, C., et al. (2015). Spatial and temporal changes in cumulative human impacts on the world’s ocean. Nat. Commun. 6:7615. doi: 10.1038/ncomms8615
Heyman, W., Kobara, S., Pittman, S. J., and Nemeth, R. (2014). “Caribbean reef fish spawning aggregations: biogeography, future research and management needs arrecifes del caribe peces agregaciones de desove: biogeografía, investigaciones futuras y necesidades de gestión agrégations de frai des poissons de récif,” in Proceedings of the 66th Gulf and Caribbean Fisheries Institute November 4 – 8, 2013, Corpus Christi, TX.
Hilborn, R. (2010). Pretty good yield and exploited fishes. Mar. Policy 34, 193–196. doi: 10.1016/j.marpol.2009.04.013
Hilborn, R., and Ovando, D. (2014). Reflections on the success of traditional fisheries management. ICES J. Mar. Sci. 71, 1040–1046. doi: 10.1093/icesjms/fsu034
Hsu, A., and Zomer, A. (2016). Environmental Performance Index. New York, NY: American Cancer Society.
ICES (2014). 1.6.2.1. Special request, Advice March 2014. EU Request on Draft Recommendations for the Assessment of MSFD Descriptor 3. Copenhagen: ICES.
International Union for Conservation of Nature [IUCN] (2018). The IUCN Red List of Threatened Species. Version 2017-3. Available at: www.iucnredlist.org (accessed June 28, 2018).
Jardim, E., Azevedo, M., and Brites, N. M. (2015). Harvest control rules for data limited stocks using length-based reference points and survey biomass indices. Fish. Res. 171, 12–19. doi: 10.1016/j.fishres.2014.11.013
Kaschner, K., Kesner-Reyes, K., Garilao, C., Rius-Barile, J., Rees, T., and Froese, R. (2016). AquaMaps: Predicted Range Maps for Aquatic Species. World Wide Web Electronic Publication, Version 08/2016. Available at: www.aquamaps.org (accessed December 6, 2017).
Kittinger, J. N., Teneva, L. T., Koike, H., Stamoulis, K. A., Kittinger, D. S., Oleson, K. L. L., et al. (2015). From reef to table: social and ecological factors affecting coral reef fisheries, artisanal seafood supply chains, and seafood security. PLoS One 10:e0123856. doi: 10.1371/journal.pone.0123856
Kleisner, K., and Pauly, D. (2015). Stock-Status Plots (SSPs). Available at: http://www.seaaroundus.org/stock-status-plots-method/ (accessed March 21, 2017).
Martinez-Andrade, F. (2003). A comparison of Life Histories and Ecological Aspects Among Snappers (Pisces: Lutjanidae). Available at: http://agris.fao.org/agris-search/search.do?recordID=XF2015014247 (accessed December 10, 2016).
Mora, C., Myers, R. A., Coll, M., Libralato, S., Pitcher, T. J., Sumaila, R. U., et al. (2009). Management effectiveness of the world’s marine fisheries. PLoS Biol. 7:e1000131. doi: 10.1371/journal.pbio.1000131
Newman, D., Berkson, J., and Suatoni, L. (2015). Current methods for setting catch limits for data-limited fish stocks in the United States. Fish. Res. 164, 86–93. doi: 10.1016/j.fishres.2014.10.018
Newman, S. J., Williams, A. J., Wakefield, C. B., Nicol, S. J., Taylor, B. M., and O’Malley, J. M. (2016). Review of the life history characteristics, ecology and fisheries for deep-water tropical demersal fish in the Indo-Pacific region. Rev. Fish Biol. Fish. 26, 537–562. doi: 10.1007/s11160-016-9442-9441
NMFS, (2013). Description of Methodology for Determining Overfishing and Overfished Status. Available at: ftp://ftp.library.noaa.gov/noaa_documents.lib/NMFS/status_of_stocks/2013/2013_methodology.pdf (accessed November 16, 2018).
NOAA, (2018). Fish Stock Sustainability Index. Status of U.S. Fisheries NOAA Fisheries. Silver Spring, MD: NOAA.
Pauly, D., Hilborn, R., and Branch, T. A. (2013). Fisheries: does catch reflect abundance? Nature 494:303. doi: 10.1038/494303a
Pohlert, T. (2016). The Pairwise Multiple Comparison of Mean Ranks Package (PMCMR). Available at: http://CRAN.R-project.org/package=PMCMR (accessed July 9, 2018).
Ricard, D., Minto, C., Jensen, O. P., and Baum, J. K. (2012). Examining the knowledge base and status of commercially exploited marine species with the RAM legacy stock assessment database. Fish Fish. 13, 380–398. doi: 10.1111/j.1467-2979.2011.00435.x
Robinson, J., Graham, N. A. J., Cinner, J. E., Almany, G. R., and Waldie, P. (2015). Fish and fisher behaviour influence the vulnerability of groupers (Epinephelidae) to fishing at a multispecies spawning aggregation site. Coral Reefs 34, 371–382. doi: 10.1007/s00338-014-1243-1241
Rosenberg, A. A. (ed.) (2014). Developing New Approaches to Global Stock Status Assessment and Fishery Production Potential of the Seas. Rome: Food and Agriculture Organization of the United Nations.
Rosenberg, A. A., Kleisner, K. M., Afflerbach, J., Anderson, S. C., Dickey-Collas, M., Cooper, A. B., et al. (2017). Applying a new ensemble approach to estimating stock status of marine fisheries around the world: estimating global fisheries status. Conserv. Lett. 11, 1–9. doi: 10.1111/conl.12363
Sadovy de Mitcheson, Y., Craig, M. T., Bertoncini, A. A., Carpenter, K. E., Cheung, W. W. L., Choat, J. H., et al. (2013). Fishing groupers towards extinction: a global assessment of threats and extinction risks in a billion dollar fishery. Fish Fish. 14, 119–136. doi: 10.1111/j.1467-2979.2011.00455.x
Sadovy de Mitcheson, Y., and Erisman, B. (2012). “Fishery and biological implications of fishing spawning aggregations, and the social and economic importance of aggregating fishes,” in Reef Fish Spawning Aggregations: Biology, Research and Management, eds Y. Sadovy de Mitcheson, and P. L. Colin, (Dordrecht: Springer), 225–284. doi: 10.1007/978-94-007-1980-4_8
Stuart-Smith, R. D., Bates, A. E., Lefcheck, J. S., Duffy, J. E., Baker, S. C., Thomson, R. J., et al. (2013). Integrating abundance and functional traits reveals new global hotspots of fish diversity. Nature 501, 539–542. doi: 10.1038/nature12529
Teh, L., Cabanban, A. S., and Sumaila, U. R. (2005). The reef fisheries of pulau banggi, sabah: a preliminary profile and assessment of ecological and socio-economic sustainability. Fish. Res. 76, 359–367. doi: 10.1016/j.fishres.2005.07.009
The World Bank, (2018a). DataBank - World Development Indicators. Available at: http://databank.worldbank.org/data/home.aspx (accessed July 9, 2018).
The World Bank, (2018b). Worldwide Governance Indicators (WGI). Available at: http://info.worldbank.org/governance/wgi/index.aspx#home (accessed July 9, 2018).
Thorson, J. T., Minto, C., Minte-Vera, C. V., Kleisner, K. M., and Longo, C. (2013). A new role for effort dynamics in the theory of harvested populations and data-poor stock assessment. Can. J. Fish. Aquat. Sci. 70, 1829–1844. doi: 10.1139/cjfas-2013-2280
UNDP, (2016). Human Development Report 2016 - Technical Notes. Available at: http://www.wiofish.org (accessed May 10, 2018).
Vasconcellos, M., and Cochrane, K. (2005). “Overview of world status of data-limited fisheries: inferences from landings statistics,” in Fisheries Assessment and Management in Data-Limited Situations, eds G. H. Kruse, V. F. Gallucci, D. E. Hay, R. I. Perry, R. M. Peterman, T. C. Shirley, et al. (Fairbanks, AK: Alaska Sea Grant), 1–20.
Walsh, J. C., Minto, C., Jardim, E., Anderson, S. C., Jensen, O. P., Afflerbach, J., et al. (2018). Trade-offs for data-limited fisheries when using harvest strategies based on catch-only models. Fish Fish. 19, 1130–1146. doi: 10.1111/faf.12316
Watson, R. A., Green, B. S., Tracey, S. R., Farmery, A., and Pitcher, T. J. (2015). Provenance of global seafood. Fish Fish. 17, 585–595. doi: 10.1111/faf.12129
WIOFish (2017). WIOFish Western Indian Ocean Fisheries Database. Available at: http://www.wiofish.org/ (accessed June 28, 2018).
Ye, Y. (2011). Appendix – Assessment methodology in Review of the State of World Marine Fishery Resources FAO fisheries and Aquaculture Technical Paper. Rome: Food and Agriculture Organization of the United Nations, 327–334.
Ye, Y., and Cochrane, K. (2011). Global Overview of Marine Fishery Resources Review of the State of World Marine Fishery Resources FAO Fisheries and Aquaculture Technical Paper. Rome: Food and Agriculture Organization of the United Nations, 3–18.
Zhou, S., Punt, A. E., Ye, Y., Ellis, N., Dichmont, C. M., Haddon, M., et al. (2017). Estimating stock depletion level from patterns of catch history. Fish Fish. 18, 742–751. doi: 10.1111/faf.12201
Appendix
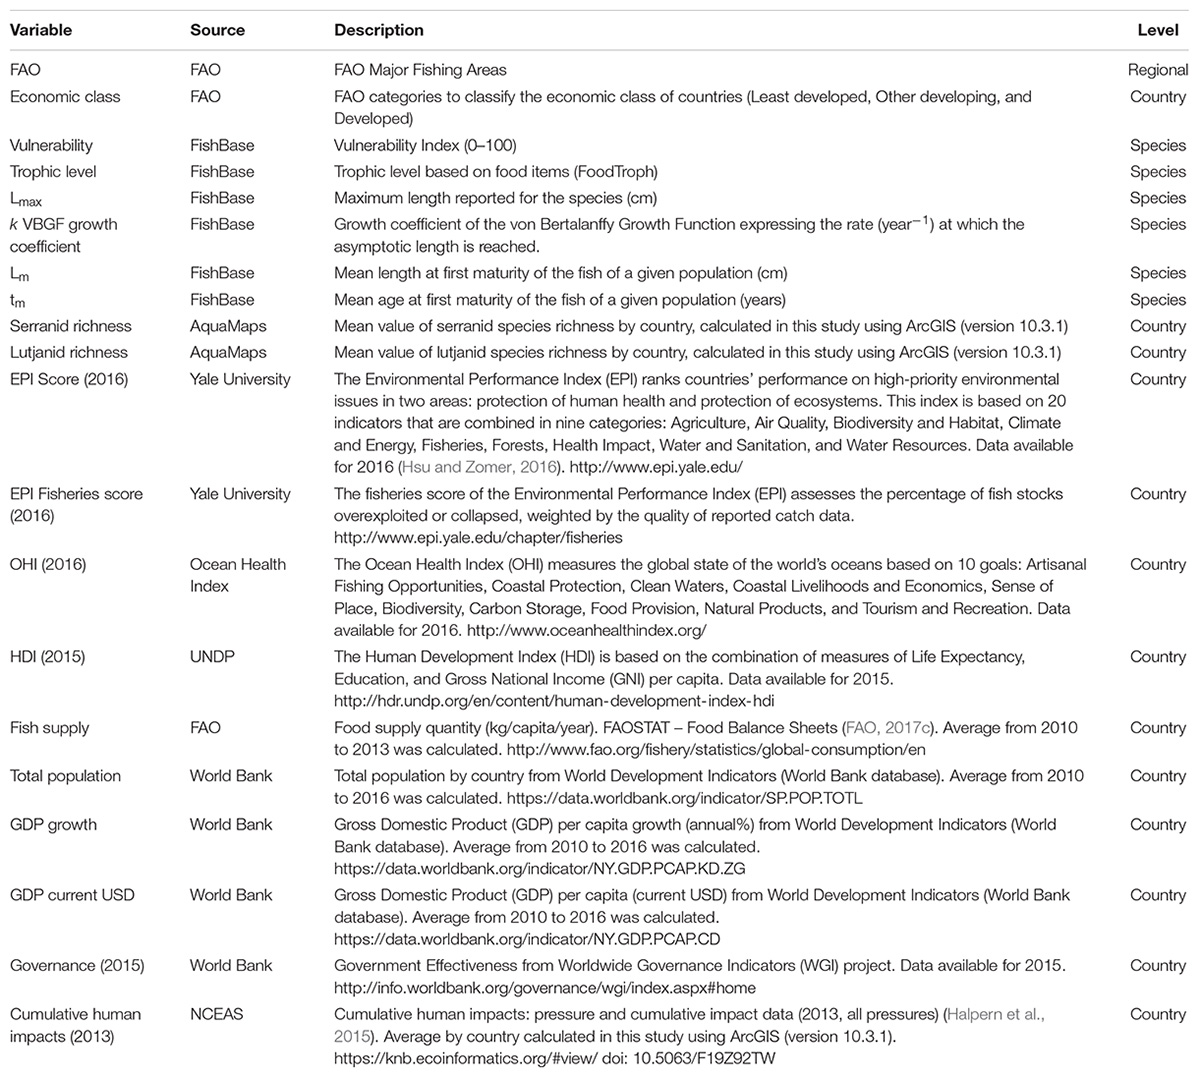
Table A1. Description of the variables included in the database and used for the modeling.
Keywords: data-limited fisheries, indices, grouper, snapper, stock status
Citation: Amorim P, Sousa P, Jardim E and Menezes GM (2019) Sustainability Status of Data-Limited Fisheries: Global Challenges for Snapper and Grouper. Front. Mar. Sci. 6:654. doi: 10.3389/fmars.2019.00654
Received: 23 November 2018; Accepted: 07 October 2019;
Published: 23 October 2019.
Edited by:
Maria Lourdes D. Palomares, University of British Columbia, CanadaReviewed by:
Athanassios C. Tsikliras, Aristotle University of Thessaloniki, GreeceNazli Demirel, Istanbul University, Turkey
Copyright © 2019 Amorim, Sousa, Jardim and Menezes. This is an open-access article distributed under the terms of the Creative Commons Attribution License (CC BY). The use, distribution or reproduction in other forums is permitted, provided the original author(s) and the copyright owner(s) are credited and that the original publication in this journal is cited, in accordance with accepted academic practice. No use, distribution or reproduction is permitted which does not comply with these terms.
*Correspondence: Patrícia Amorim, amorim.patricia@gmail.com