Differential Activity of Coexisting Prochlorococcus Ecotypes
 Anne W. Thompson
 Kathleen Kouba
- 1Department of Biology, Portland State University, Portland, OR, United States
- 2College of Earth, Ocean, and Atmospheric Sciences, Oregon State University, Corvallis, OR, United States
The abundance and widespread distribution of the unicellular cyanobacterium Prochlorococcus is attributed to its extensive genetic diversity. At least twelve distinct clades, or ecotypes, of Prochlorococcus have been discovered so far, and follow distinct distribution patterns over horizontal and vertical gradients in the oligotrophic ocean. However, multiple ecotypes (and sub-ecotypes) of Prochlorococcus always coexist in varying proportions. While laboratory experiments and genomic analysis suggest that ecotypes contribute differently to biogeochemical cycles, no studies have tested the differential activity of coexisting ecotypes in natural assemblages of Prochlorococcus. Here, we performed DNA stable isotope probing (DNA-SIP) experiments in on-deck incubations of oceanic microbial communities with 13C-labeled bicarbonate to identify ecotypes actively assimilating carbon. In addition, we identified cells in G1 and G2 phases of the cell cycle to determine the ecotypes engaged in cell division. We found that closely related ecotypes and sub-ecotypes could exhibit differential activity in carbon assimilation and cell division. In the case of cell division, the most actively dividing ecotype was among the most abundant ecotypes. In the case of carbon assimilation, both a rare OTU and an abundant OTU were the most active. We discuss how intrinsic genomic characteristics, acclimation state, microbial interactions, and physical dynamics of the ocean could contribute to these patterns of activity. Together, these experiments suggest that Prochlorococcus community structure is an important facet of Prochlorococcus contributions to the ocean ecosystem that should be studied further to predict the influence of Prochlorococcus on global processes.
Introduction
The picocyanobacterium Prochlorococcus is the numerically dominant photosynthetic microorganism in the Earth’s subtropical ocean gyres and by extension the most abundant photosynthetic cell on Earth (Partensky et al., 1999; Flombaum et al., 2013; Biller et al., 2015). Prochlorococcus is a key component in the transfer of carbon and energy through open ocean food webs (Berthelot et al., 2019). The abundance and global distribution of Prochlorococcus is attributed to its affinity for warm oligotrophic waters and its extensive genetic diversity that spans at least 12 distinct lineages (dubbed ecotypes) that partition into numerous distinct sub-ecotypes (Martiny et al., 2009a,b; Rusch et al., 2010; Huang et al., 2011; Biller et al., 2015; Kent et al., 2016; Larkin et al., 2016, 2019).
Prochlorococcus ecotypes and sub-ecotypes have distinct abundance and distribution patterns, which relate to light (Moore and Chisholm, 1999), temperature (Johnson et al., 2006), nutrients (Moore et al., 2002; Larkin et al., 2019), and physical oceanographic dynamics (Johnson et al., 2006; Zinser et al., 2007; Malmstrom et al., 2010; Thompson et al., 2018). However, multiple ecotypes or sub-ecotypes always coexist. In some cases one ecotype or sub-ecotype dominates the population by orders of magnitude, for example the dominance of ecotype HLII over all other ecotypes in the surface mixed layer at Station ALOHA (Malmstrom et al., 2010). In other cases, several ecotypes or sub-ecotypes coexist at similar numerical abundances, for example within the upper thermocline at Station ALOHA (Malmstrom et al., 2010). It remains unclear whether coexistence of ecotypes and sub-ecotypes is the result of niche partitioning, susceptibility to top-down factors such as predation and viral infection, competition, or physical processes, such as vertical and horizontal mixing, that coalesce communities containing cells of different recent history and physiological state.
Currently, ecosystem models treat all Prochlorococcus ecotypes as equal from an ecological standpoint (Grossowicz et al., 2017; Lange et al., 2018). However, genomic analyses (Kettler et al., 2007; Kashtan et al., 2014), laboratory physiology experiments (Moore et al., 1998, 2002; Sher et al., 2011; Thompson et al., 2011; Berube et al., 2015), and the distribution of ecotypes or functional genes relative to physical and chemical ocean parameters (Johnson et al., 2006; Malmstrom et al., 2010; Larkin et al., 2016, 2019; Thompson et al., 2018) suggest that distinct Prochlorococcus ecotypes and sub-ecotypes could differentially influence biogeochemical cycles, primary productivity, and microbial community structure. Understanding to what extent community structure impacts the contributions of the Prochlorococcus collective to the ecosystem will be important toward estimating and predicting the importance of Prochlorococcus to local and global processes. In addition, determining how ecotypes function individually and in combination will advance our understanding of the ecology of this massively abundant cyanobacterium, which is projected to increase in abundance as oligotrophic ocean regions expand (Flombaum et al., 2013).
Here, we address the link between genetic diversity and ecosystem function in Prochlorococcus. We examined Prochlorococcus operational taxonomic units (OTUs) from well-characterized populations at the open ocean Station ALOHA for any differential contributions to primary productivity. First, we examined the representation of OTUs in the G1 and G2 stages of cell division to determine if all ecotypes proceed through cell division synchronously. Next, we incubated diverse populations with “heavy” 13C-bicarbonate in DNA stable isotope probing (DNA-SIP) experiments to determine which ecotypes were more active in assimilation of carbon. We found that even closely related Prochlorococcus OTUs exhibited differential cell division patterns and carbon assimilation activity. These results suggest that the diversity and community structure of Prochlorococcus may be important toward estimating Prochlorococcus ecosystem contributions globally.
Materials and Methods
Oceanographic Context and Sampling
Prochlorococcus populations were sampled from Hawaii Ocean Time-series (HOT) cruises to the oceanographic Station ALOHA (22°45′N, 158°00′W) (Karl and Lukas, 1996) in the North Pacific Subtropical Gyre (NPSG) in April 2016 (HOT283) and November 2016 (HOT288). Seawater samples were collected by 12 L Niskin bottles mounted on a rosette. Depth profiles of temperature, salinity, dissolved oxygen, and chlorophyll a fluorescence were obtained by profiling with a CTD package (Sea-Bird SBE 911Plus). Oceanographic data is available through the HOT program website1 for cast numbers specified below.
Flow Cytometric Cell Cycle Analysis
Flow cytometric analysis and cell sorting was performed to enumerate cells in each stage of the cell cycle and to separate cells in G1 (single genome) and G2 (doubled genome) for sequence analysis. Samples were collected from 100 meters spanning sunset on two consecutive days when Prochlorococcus cells were expected to divide synchronously (Vaulot et al., 1995; Ribalet et al., 2015). On November 26th 2016 (HOT288), cells were sampled at 13:36 (cast 2), 19:00 (cast 4), and 22:05 (cast 5) hours and on November 27th at 12:30 (cast 10), 18:45 (cast 12), and 21:30 (cast 13).
Immediately upon collection, samples were fixed with a final concentration of 0.125% glutaraldehyde, incubated for 10 min in the dark at room temperature, then flash frozen in liquid nitrogen. Samples were transported and archived at −80°C. To measure DNA content per cell and patterns of cell cycle, samples were thawed at room temperature in the dark, DNA was stained with 2X SYBR Green I Nucleic Acid Stain (Thermo Fisher Scientific) for 6 min, then cells were analyzed by flow cytometry for green fluorescence.
A Becton Dickinson Influx cytometer fit with a 488 nm laser and a small particle detector was used for detection of forward scattered light (FSC), side scattered light (SSC), red fluorescence (692/40 nm bandpass filter), and SYBR Green I fluorescence (520/30 nm bandpass filter). Data collection of all parameters was triggered on FSC. Sheath fluid was prepared from concentrated BioSure 8X Sheath fluid (BioSure, Grass Valley, CA, United States) diluted to 1X concentration and filtered through a 0.2 μm pore size Sterivex (Millipore, Billerica, MA, United States) filter placed in line with the Influx sheath line. Ultra-rainbow beads (3.8 μm) (Spherotech Inc., Lake Forest, IL, United States) were spiked into each sample as alignment indicators and as negative controls during cell sorting and sequencing.
Prochlorococcus G1 and G2 populations were identified as follows. First, Prochlorococcus cells were identified using FSC vs. red fluorescence bivariate plots. Next, we examined histograms of Prochlorococcus green fluorescence (DNA staining) across each time-course to identify G1 and G2 populations. The major peak during daylight hours was identified as G1 and the minor peak to the right of G1 was identified as G2 as in Vaulot et al. (1995). As SYBR staining presents a small amount of red fluorescence, which causes small non-pigmented cells (i.e., heterotrophic bacteria) to fluoresce red and overlap with dim (i.e., surface) Prochlorococcus, cell cycle analysis and sorting was restricted to 100 m depths where Prochlorococcus red fluorescence was intense enough to be distinct from SYBR-stained non-pigmented cells.
Flow Cytometric Cell Sorting and Amplification
From Prochlorococcus-specific sort gates around G1 and G2 cell populations, 10,000 cells were sorted into 0.2 mL PCR tubes. Beads spiked into each sample were sorted similarly as negative controls for molecular steps. Multiple displacement amplification (MDA) was used to amplify whole genomes of sorted cells and beads in triplicate using the RepliG Mini kit (Qiagen, Hilden, Germany), following manufacture protocols with a 10 h linear amplification step. MDA product was diluted 100-fold with nuclease-free water, quantified by Qubit (Thermo Fisher Scientific), and analyzed by gel electrophoresis to assess quality and size distribution of MDA product prior to PCR amplification with cyanobacterial-specific primers.
13C Bicarbonate on-Deck Incubation Experiments
Identification of differential carbon assimilation in coexisting Prochlorococcus ecotypes was carried out by incubating cells with 13C-bicarbonate in a DNA-stable isotope probing experiment. Seawater was collected by CTD-rosette from 133 m depth (coincident with the deep chlorophyll maximum) and divided into twelve replicate acid-cleaned 2 L polycarbonate bottles. Bottles were spiked with 13C-Sodium bicarbonate (Cambridge Isotope Laboratories) (13C-experimental) to a final concentration 0.125 mM (approximately 10% of expected in situ DIC concentrations) or left unamended (12C-unlabeled control). Bottles were incubated in an on-deck incubator, cooled to surface seawater temperatures with flow seawater, and shaded to approximate in situ light levels with black mesh. After 24 h incubation, DNA samples were collected by filtering duplicate 2 L bottles onto 0.2 μm Sterivex Filter Units (MilliporeSigma) and archived at −80°C.
DNA Extraction and Fractionation
DNA from the 12C control and 13C experimental incubations was extracted from Sterivex Filter Units as previously described (Wright et al., 2009). Extracted DNA was quantified by Qubit Fluorometric Quantification (Thermo Fisher Scientific). Cesium-chloride (CsCl) gradients were used to fractionate DNA samples following protocols described previously (Lueders et al., 2004; Neufeld et al., 2007; Bartram et al., 2009; Coyotzi et al., 2016). Briefly, a CsCl solution was mixed with 500 ng of DNA from each sample to a final density of 1.68 g/mL and centrifuged at 55,000 rpm for 64 h at 20°C. At least 12 fractions were collected from each sample using a syringe pump loaded with bromium blue dyed water to displace each CsCl fraction. The refractive index of each fraction was measured. DNA was precipitated from CsCl fractions with linear polyacrylamide (LPA) (Bartram et al., 2009) and quantified by Qubit Fluorometric Quantification.
Barcoded ITS PCR and Sequencing
Prochlorococcus ecotype identity was determined by sequencing the cyanobacterial 16S-23S rRNA intergenic transcribed (ITS) region as described previously (Ahlgren et al., 2019). For sorted cells, DNA template in PCR was 5 ng of diluted MDA product. For DNA-SIP experiments, DNA template in PCR was 5 ng of DNA precipitated from each CsCl gradient fraction. PCR primers were linked to Illumina adaptor sequences, unique barcodes, and index sequences. Barcoded PCR products were purified with AxygenTM AxyPrep MagTM PCR Clean-up Kits (Axygen Scientific), quantified by Qubit and by qPCR targeting Illumina adaptors (Kapa Biosystems), then pooled to create the multiplexed sample library for sequencing. No PCR products were obtained from negative controls of sorted beads. Sequencing of PCR products was by Illumina MiSeq (2 × 250 bp paired end reads). Due to read lengths too short for robust overlap of 16S-23S rRNA ITS fragments, only reverse reads were used for calling OTUs as previously (Ahlgren et al., 2019). QIIME 1 (Caporaso et al., 2010) was used to quality filter sequence reads and call OTUs de novo at 97% similarity using Uclust in the pick_de_novo_otus.py script. A representative sequence from each OTU was identified using BLASTn (Altschul et al., 1990) against a database of Prochlorococcus and Synechococcus 16S-23S rRNA ITS sequences. Sequence data has been deposited to GenBank under BioProject ID PRJNA558395.
Detecting Differential Abundance in Cell Cycle Analysis and DNA-SIP Experiment
To account for differences in sequencing depths across samples, OTU read counts were rarefied as recommended for microbiome analyses (Weiss et al., 2017). Rarefication was implemented in R (version 3.5.2) using the package “vegan” (Oksanen et al., 2019) to the sample with the lowest number of sequences (10,000 for SIP experiments and 8,000 for cell cycle experiments). To detect differences in the compositional balance of OTUs between conditions the Analysis of Composition of Microbiomes (ANCOM 2.0) framework (Mandal et al., 2015) was used in R (version 3.5.2) with R Studio (version 1.0.153). The ANCOM statistical framework implements a linear model without making assumptions about data distribution and has been shown to control false discovery rate effectively for microbiome analyses in comparison to other methods (Weiss et al., 2017). Using the ANCOM framework, zeros as OTU counts were replaced with a pseudo count. OTUs with a proportion of zeros greater than 90% were excluded from analysis. Differential OTUs were detected with taxa-wise multiple correction and a false discovery rate below 0.05 (cell cycle experiment) and 0.10 (SIP experiment). For all OTUs the ANCOM W-statistic (number of times the null hypothesis of pairwise tests was rejected) is presented in Supplementary Figure S9. For the cell cycle analysis experiments, differential OTU abundance was determined from comparison between samples from triplicate G1 and G2 population sorts from the two time-points, November 26th and 27th 2016. For DNA-SIP experiments, fractions with refractive index greater than 1.400 (approximately 1.720 g/cm3) were considered “heavy.” Heavy fractions were compared for the replicate 12C- control and 13C-experimental treatments for each OTU. Differentially abundant OTUs were considered “responders.” We define responders as OTUs with evidence for assimilation of 13C-bicarbonate into DNA during the course of the 24 h incubation. For the DNA-SIP experiments, we also compared peaks in OTU counts for HLII and LLI ecotypes (Supplementary Figure S1) to investigate positive correlation between DNA density and %GC (Youngblut and Buckley, 2014). The representative sequences of differentially abundant OTUs for both experiments are listed in Supplementary Table S1.
Results
Oceanographic Conditions
Seawater collected for the on-deck DNA-SIP experiment on cruise HOT283 (April 2016) was sampled from 133 m within the stratified thermocline, which was coincident with the deep chlorophyll maximum (Supplementary Figure S2). Conditions were consistent with historical conditions at Station ALOHA (Malmstrom et al., 2010; Karl and Church, 2017) for this time of year. Samples for determining ecotype representation in different stages of the cell cycle were collected during HOT288 (November 2016) over the course of two consecutive 24 h periods. Over the 2 days time-course of sampling for cell cycle, depth of the mixed layer varied over a range of approximately 40 m, however all sampling depths remained within the stratified thermocline (Supplementary Figure S3).
Cell Cycle Time-Course
Cell cycle analysis of Prochlorococcus over two consecutive days matched previous works that documented synchronous cell division in Prochlorococcus (Vaulot et al., 1995; Mann and Chisholm, 2000; Ribalet et al., 2015). Samples taken in mid-afternoon (12:30–14:00 h) revealed a single G1 peak (Supplementary Figure S4). At sunset (18:00–19:00 h) both G1 and G2 peaks were apparent, with 32–45% of cells in the G2 phase (Supplementary Figures S4, S5). After dark (22:00 h), the G2 peak remained present but with diminished abundance relative to the G1 peak (Supplementary Figure S4).
Analysis of cyanobacterial 16S-23S rRNA ITS community structure in unsorted whole seawater samples prior to cell division (12:30–14:00 h) when all cells were in G1, were similar between replicates and on the two consecutive days (Figure 1A). 349 OTUs were detected, which best matched Prochlorococcus in reference to a Synechococcus and Prochlorococcus 16S-23S rRNA ITS sequence database. The cyanobacterial community was dominated by HLII and LLI ecotypes at approximately equal read abundances (Figure 1A). The highest number of unique OTUs belonged to the LLI ecotype (Supplementary Figure S6). About 50% of the reads belonged to the 10 most abundant OTUs. These patterns of community structure at 100 m depth mirrored previous work on Prochlorococcus ecotypes structure at this depth (Zinser et al., 2007; Malmstrom et al., 2010).
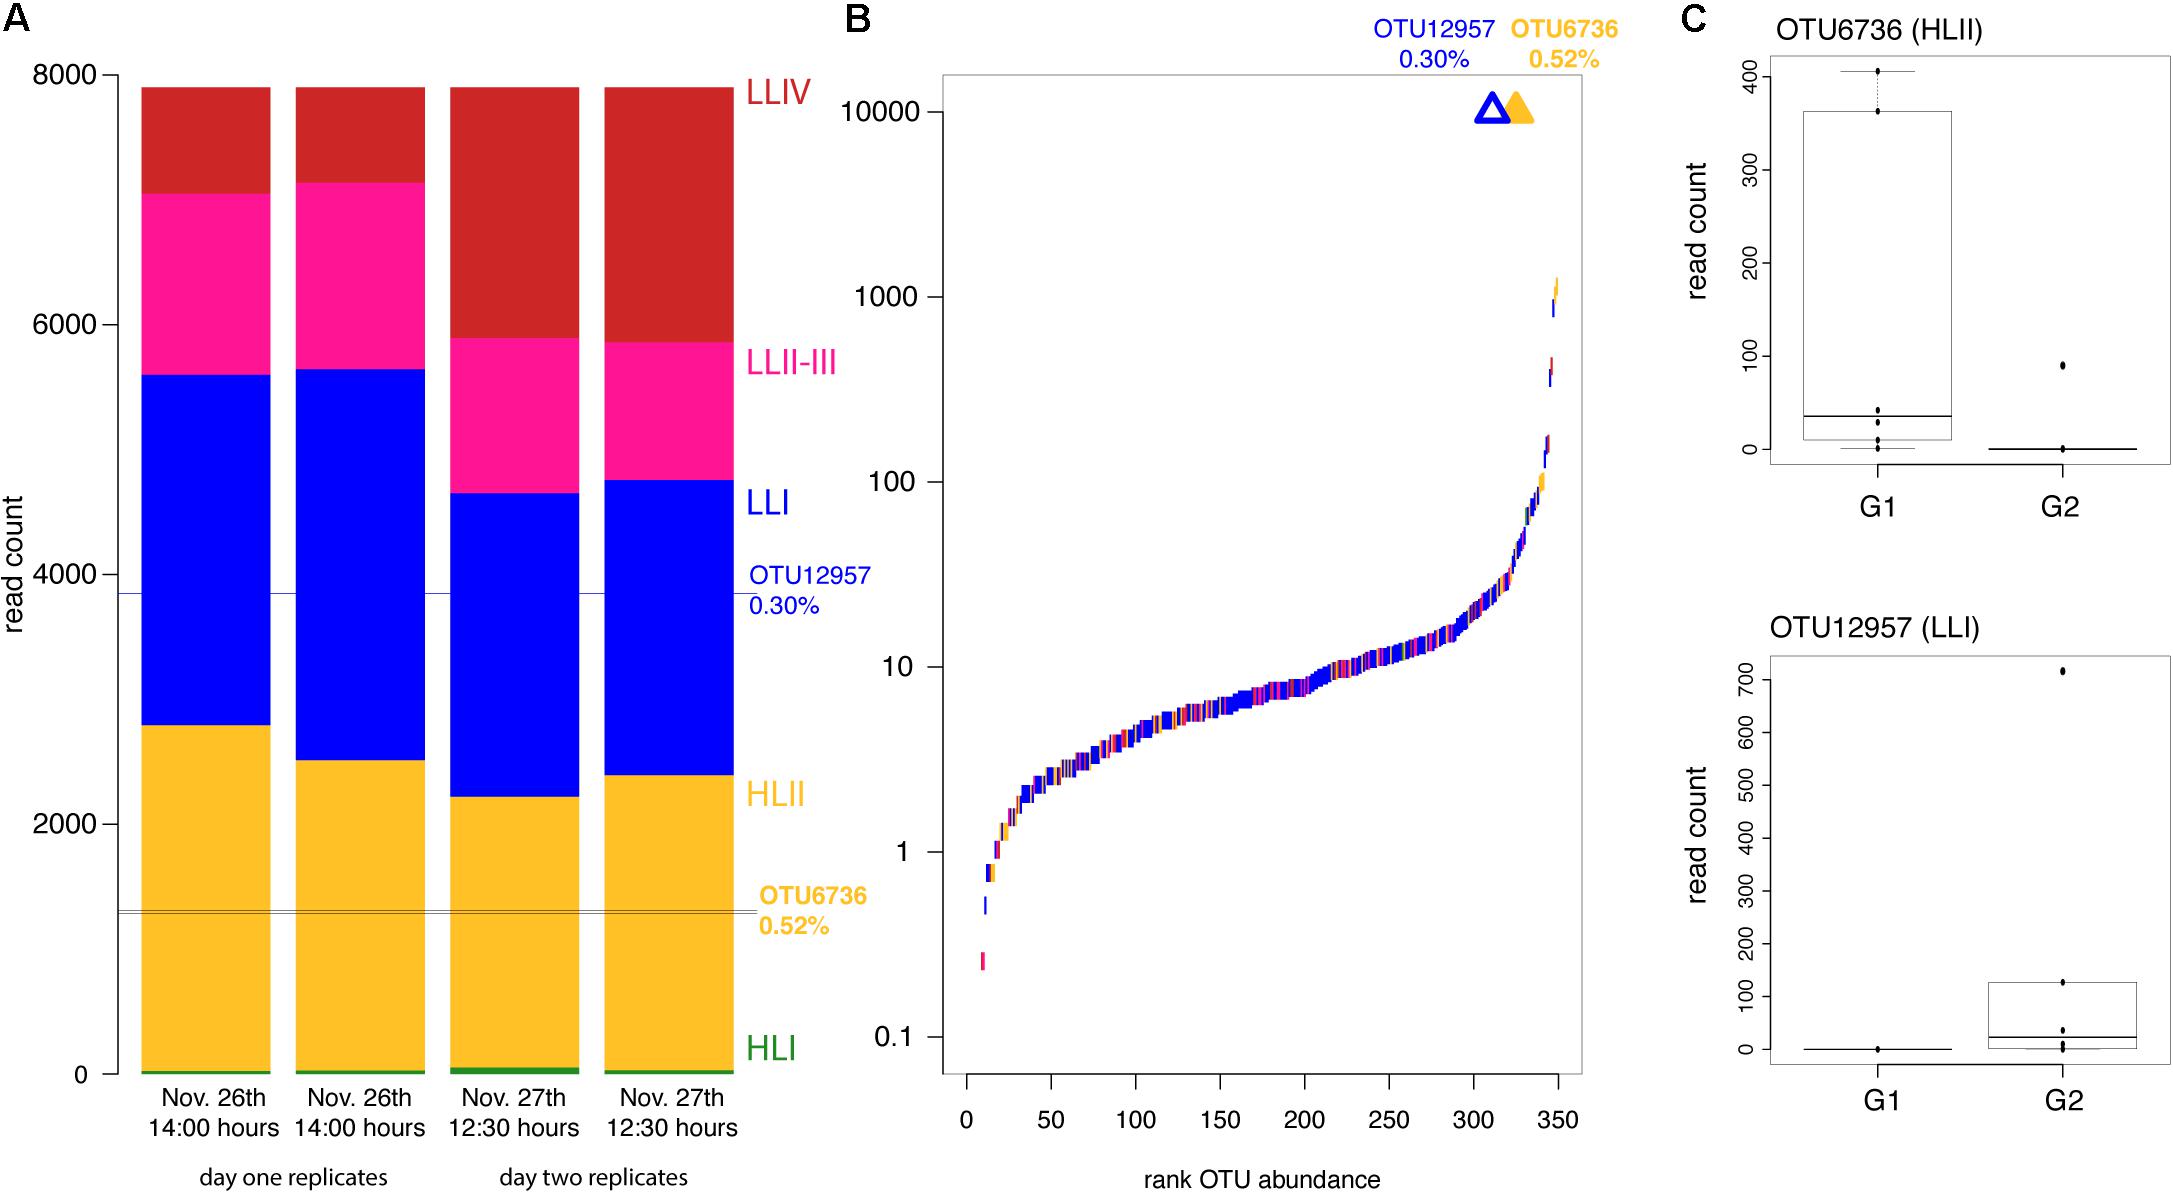
Figure 1. Prochlorococcus ecotype and OTU abundance during the cell cycle analysis experiment. (A) Ecotype composition of replicate whole seawater samples from the two time-points (November 26th and 27th) prior to cell division at 12:30–14:00 h, when all cells were present in the G1 phase. (B) Rank abundance of OTUs across the time-course with OTUs enriched (open) or depleted (filled) in the G2 phase marked by triangles matched to their rank abundance. Colors indicate the ecotype identity of each OTU according to colors in (A). (C) Boxplots of read counts from replicate samples from G1 and G2 populations for the differentially abundant OTUs.
Ecotype Representation in G1 vs. G2 Phases of the Cell Cycle
At the peak of cell division, approximately sunset 18:00–19:00 h, sequences derived from G1 and G2 sorted populations were compared to identify any of the 349 OTUs present that were either enriched or depleted in the G2 phase of cell division relative to G1. We discovered two OTUs that were significantly differentially abundant in G1 and G2 cell populations at sunset (Table 1).
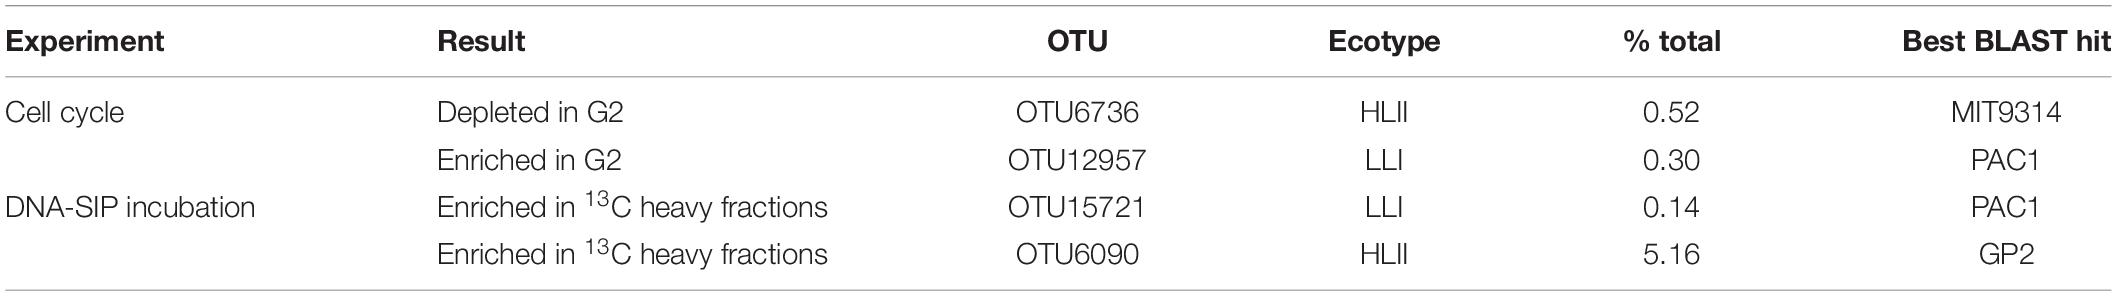
Table 1. Ecotype identity and percent total sequences of differentially abundant OTUs for the cell cycle and DNA-SIP incubation experiments.
OTU6736 was depleted in the G2 phase of the cell cycle and best matched HLII strain MIT9314 (Table 1 and Figures 1A–C). Reads belonging to OTU6736 made up 0.52% of the total Prochlorococcus reads and it was one of the twenty most abundant OTUs of the 349 detected (Figure 1B). In contrast, OTU12957 was enriched in the G2 phase of the cell cycle and best matched LLI strain PAC1 (Table 1 and Figures 1A–C). Reads belonging to OTU12957 made up 0.30% of the total Prochlorococcus reads and it was also one of the twenty most abundant OTUs of the 349 detected (Figure 1B). All remaining 347 OTUs detected in the cell cycle experiment were not significantly differentially abundant between the G1 and G2 populations (Supplementary Figure S9).
DNA-SIP Incubation Conditions
Phytoplankton community structure, as determined by flow cytometry, was typical of open ocean samples after the 24 h on-deck incubation for the DNA-SIP experiment (Supplementary Figure S7). Specifically, Prochlorococcus populations visualized by flow cytometry maintained integrity as demonstrated by the absence of chlorotic (or dying) Prochlorococcus cells before and after 24 h incubations (Supplementary Figure S7). The time-zero samples exhibited a Prochlorococcus “double population,” where two populations of cells with distinct chlorophyll and FSC properties co-existed (Supplementary Figure S7), as sometimes observed in the upper thermocline (Campbell and Vaulot, 1993; van den Engh et al., 2017; Thompson et al., 2018). A total of 375 OTUs were detected from unfractionated DNA from replicates of the 12C and 13C incubations. All OTUs were best matched to Prochlorococcus upon comparison to the reference database. Prochlorococcus community structure was similar between both control (12C) and experimental (13C) incubations and across replicates (Figure 2A). The community was dominated by OTUs that best matched LLI and HLII ecotypes in a pattern typical of Station ALOHA at 133 m depth in April (Malmstrom et al., 2010). The most abundant OTU belonged to the HLII ecotype (Figure 2B). The highest number of unique OTUs belonged to the HLII ecotype followed closely by the LLI ecotype (Supplementary Figure S8). The 10 most abundant OTUs accounted for about 50% of the population.
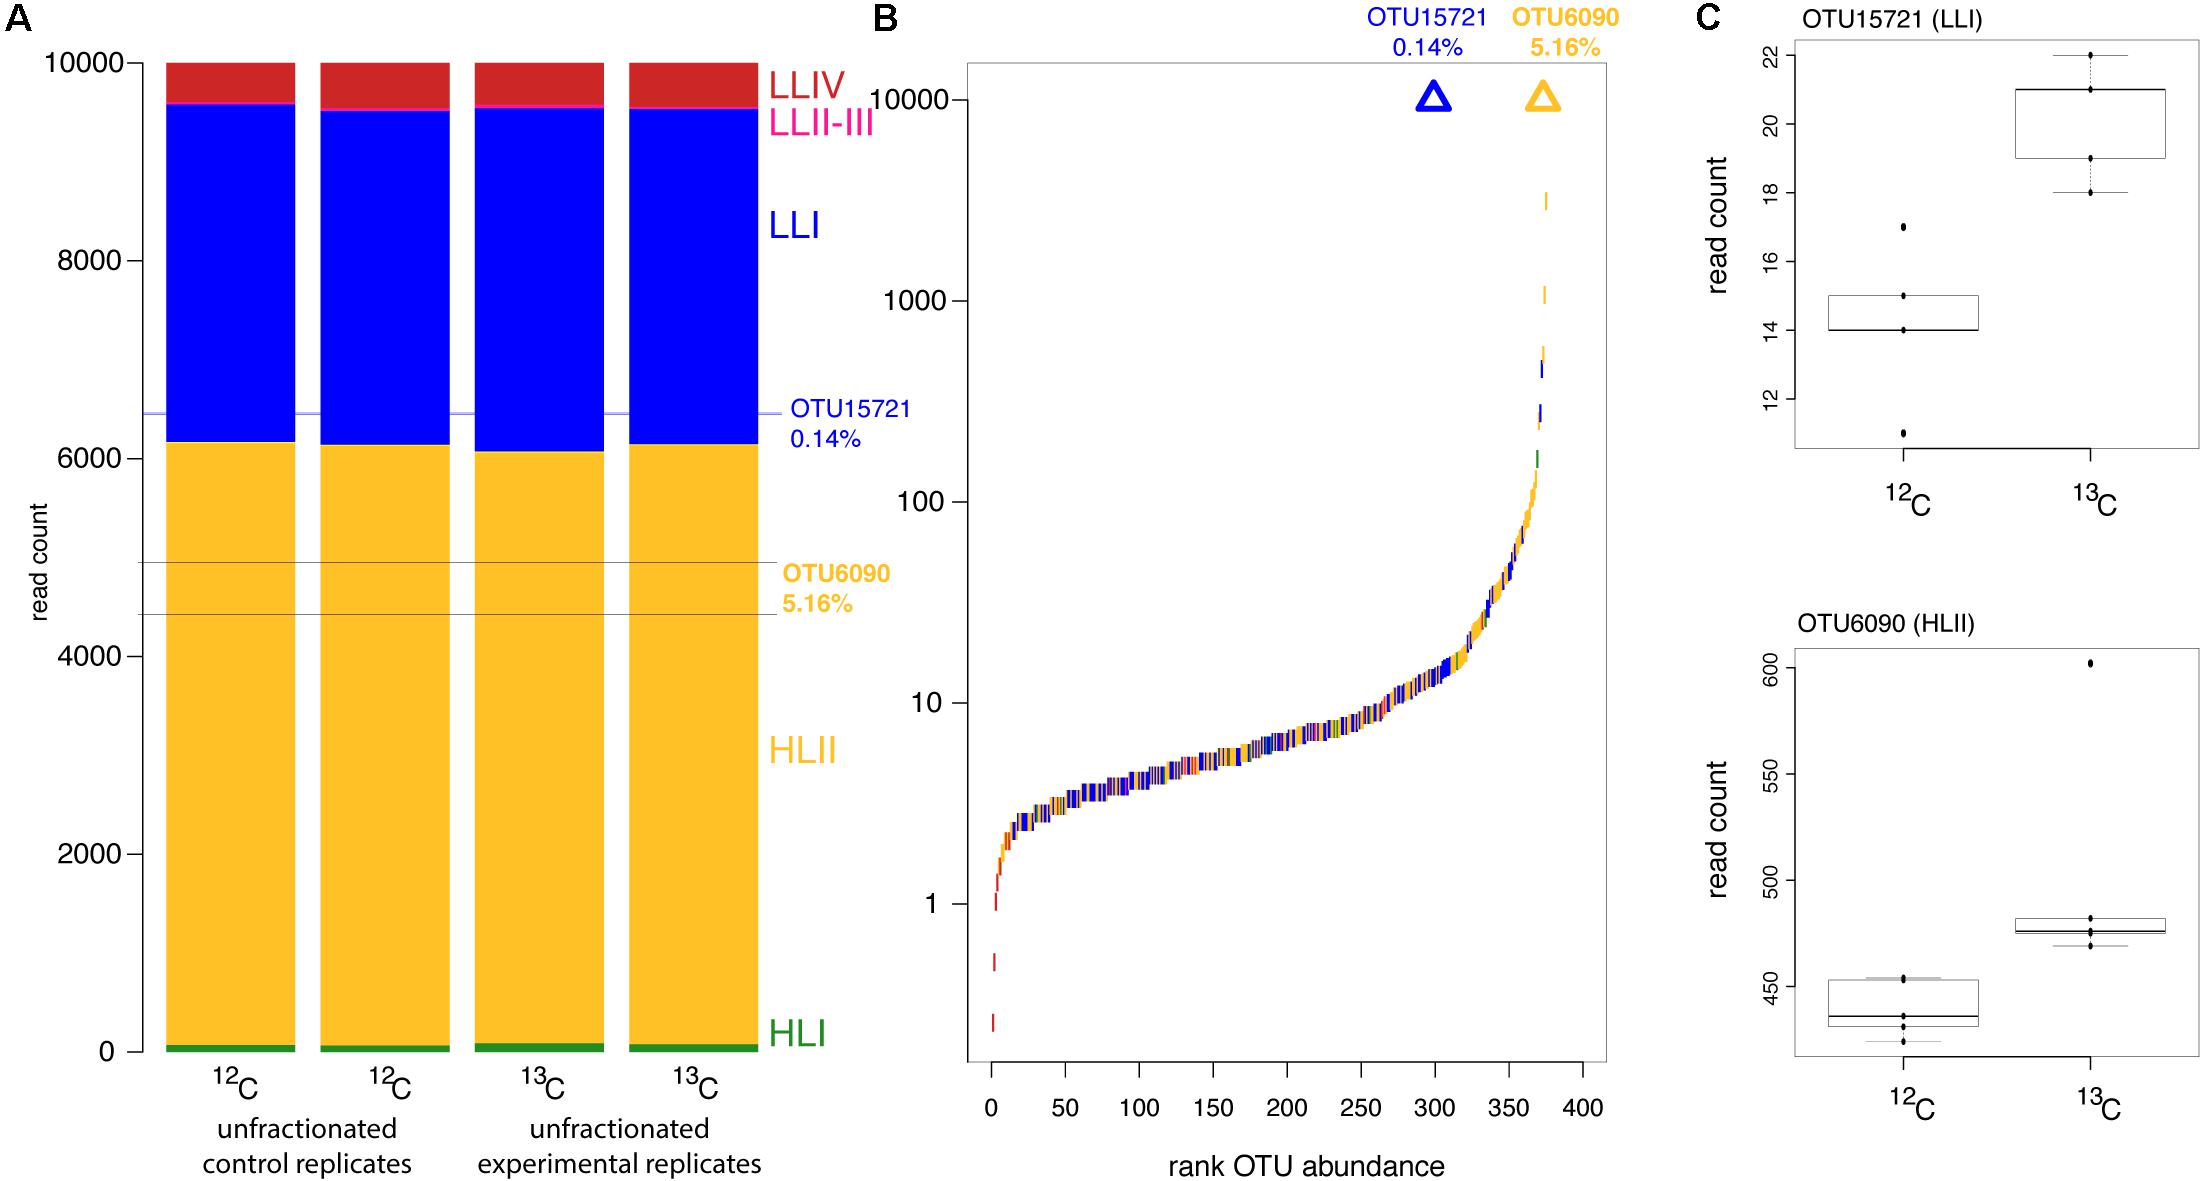
Figure 2. Prochlorococcus ecotype and OTU abundance during the DNA-SIP incubation experiment. (A) Ecotype composition of replicate unfractionated DNA samples with the proportion of reads made up by responder OTUs marked with horizontal lines. (B) Rank abundance of OTUs in unfractionated samples with responder OTUs marked by triangles aligned to their rank abundance. Colors indicate the ecotype identity of each OTU according to colors in (A). (C) Boxplots of read counts from replicate samples from 12C control and 13C experimental heavy fractions for the responder OTUs.
Ecotypes Enriched in Heavy DNA From the 13C Incubations
Cyanobacterial community structure from “heavy” DNA fractions of the 12C control 13C experimental treatment were compared to identify “responders,” OTUs which assimilated 13C from 13C-bicarbonate in the 24 h incubation. Two responder OTUs were detected out of 375 OTUs present in the unfractionated DNA (Table 1 and Figure 2C). One of the responders (OTU15721) belonged to the LLI ecotype, best matching strain PAC1. OTU15721 accounted for 0.14% of the Prochlorococcus reads at intermediate rank abundance (Figures 2A,B). The second responder (OTU6090) belonged to the HLII ecotype, best matching strain GP2. In contrast to the low abundance of LLI responder OTU15721, OTU6090 was the third most abundant OTU and represented 5.16% of the sequence reads.
Discussion
Expansive diversity has become known as a defining characteristic of the Prochlorococcus lineage (Biller et al., 2015). Genetically cohesive ecotypes and sub-ecotypes follow well-characterized patterns with respect to depth, light, temperature, and nutrient concentration on the global scale (Malmstrom et al., 2010; Huang et al., 2011; Kent et al., 2016; Larkin et al., 2016, 2019). However, at the local scale, these functionally diverse ecotypes and sub-ecotypes always coexist at varying levels of abundance. Many lines of evidence suggest that these coexisting groups could occupy distinct niches and contribute differently to the open ocean ecosystem, however the relative role of coexisting ecotypes in ecosystem function has not been tested.
This study examined whether coexisting Prochlorococcus OTUs contributed differentially to primary productivity at the open ocean Station ALOHA. DNA-SIP on-deck incubation experiments identified differential carbon assimilation among coexisting OTUs. One lowly abundant OTU and one highly abundant OTU were more active with respect to carbon assimilation in the 24 h time-course than other OTUs. Comparison of ecotype composition in G1 and G2 populations of Prochlorococcus determined that not all OTUs followed the same pattern of cell division. One OTU was enriched in the G2 phase of cell division, while one OTU was depleted in the G2 phase. Together, these experiments provide novel insights into the potential importance of community structure in determining the contributions of Prochlorococcus populations to the ocean ecosystem.
Differential Patterns of Cell Division
Growth and mortality of Prochlorococcus drives ecosystem processes in the oligotrophic ocean. Estimates of cell division and mortality rates across latitudes suggest that up to 75% of the organic carbon production the surface open ocean comes from Prochlorococcus (Ribalet et al., 2015; Berthelot et al., 2019). Prochlorococcus cell mortality may contribute a pulse of organic carbon to the ecosystem 6 h after peak cell division (Ribalet et al., 2015), which is quickly consumed and recycled by coevolved microbial partners (Braakman et al., 2017; Becker et al., 2019). Understanding how coexisting ecotypes contribute to this population-level phenomenon is essential for estimating Prochlorococcus ecosystem contributions across dynamic oceanic conditions and distinct gradients in community structure.
We found that over 99% of Prochlorococcus OTUs were not differentially represented in G1 and G2 populations. This result suggests that most coexisting Prochlorococcus taxa have subsets of cells that exist in G1 and G2 phases of the cell cycle at any time during the window of peak cell division (dusk). Thus, cells of the same OTU may follow different patterns of cell division within the window of peak division. This observation is consistent with heterogeneity detected in growth rates among Prochlorococcus single cells using carbon isotope based measurements (Berthelot et al., 2019) as well as with other observations including the persistence of numerous cells in the G1 phase across the temporal peak in cell division at dusk (Supplementary Figure S4) as well as relatively low growth rates (∼0.2 day –1) (Vaulot et al., 1995) in the thermocline, meaning that not all coexisting cells divide each day.
While most OTUs were equally represented in G1 and G2 populations, we identified two OTUs that were either enriched or depleted in G2 (Figure 1 and Table 1) suggesting that against a background of single cell heterogeneity in cell division patterns, some entire OTUs (genetically similar groups of cells) are dividing more rapidly or more slowly than the rest. OTU12957 was enriched in the G2 phase of the cell cycle relative to G1 (Table 1 and Figure 1C). Enrichment in G2 may indicate that more cells from this OTU were proceeding through cell division, possibly contributing more to population-level growth than other coexisting OTUs. This interpretation is consistent with this G2-enriched OTU being among the most abundant OTUs in the sample prior to cell division (Figure 1B) and with other work where the abundance of cells in G2 is used to estimate population-level growth rates (Sosik et al., 2003; Ribalet et al., 2015). Interestingly, the G2-enriched OTU belonged to the LLI ecotype, which has been shown to thrive under the dynamic light availability within the stratified thermocline (Malmstrom et al., 2010). However, other closely-related coexisting LLI ecotypes were not overrepresented in the G2 phase of the cell cycle.
In contrast, one HLII OTU (OTU6736) was depleted in the G2 phase of the cell cycle relative to G1, suggesting that this OTU had fewer cells proceeding through cell division than other OTUs. Interestingly, OTU6736 was one of the more abundant OTUs in the sample prior to cell division despite arrest in the G1 phase. Other closely related HLII OTUs were not differentially abundant between the two cell cycle phases (Figure 1B and Table 1), suggesting that closely related ecotypes may exhibit different patterns of cell division. See below for further discussion on possible mechanisms by which closely related coexisting ecotypes exhibit differential activity.
Differential Patterns of Carbon Assimilation
Our results suggest that coexisting ecotypes and sub-ecotypes may be differentially active in assimilation of inorganic carbon. During a 24 h incubation of water from the stratified thermocline we identified two “responder” OTUs that assimilated 13C from bicarbonate into DNA to a greater degree than the remaining 373 coexisting OTUs. Responders belonged to the numerically dominant ecotypes in the water samples, LLI and HLII, though ranged from very abundant to not abundant. These results suggest that within a diverse assemblage of Prochlorococcus, not all ecotypes contribute equally to carbon cycling. This result is consistent with recent single cell analysis that suggest that while all Prochlorococcus within the thermocline are active, there is cell-to-cell heterogeneity in nutrient assimilation (Berthelot et al., 2019; Roth-Rosenberg et al., 2019). Interestingly, both responder OTUs belonged to ecotypes (HLII and LLI) that have been shown to thrive in dynamic light intensities as the cells would experience in the shift from thermocline to an on-deck incubation during the experimental setup.
Activity and Abundance of Coexisting Prochlorococcus Ecotypes
In marine microbial systems, results have been conflicting on whether rare or abundant taxa are the most active (Campbell et al., 2011). Likely much depends on the metrics and definitions of “active,” the suite of resources available, the dynamics of the environment, and the specific microbial assemblages present. In our experiment, the OTU enriched in the G2 phase of cell division was among the most abundant OTUs. OTUs depleted in the G2 phase were also among the most abundant OTUs. However, there were many abundant and rare OTUs that were equally represented in the G1 and G2 phases. Likewise, in the DNA-SIP experiment, responder OTUs ranged from low abundance to high abundance. Some of the most abundant OTUs were not identified as responders in our short time-course. Thus, our results suggest no relationship between abundance and activity that applies to all coexisting Prochlorococcus taxa. These results are consistent with previous work in a coastal marine system where about 20% of marine microbial taxa were highly active when they were rare (Campbell et al., 2011).
Mechanisms for Differential Activity Among Closely Related Prochlorococcus
Our data suggest that Prochlorococcus OTU abundance and ecotype identity do not predict cell division or carbon assimilation patterns within the thermocline. We hypothesize three non-exclusive mechanisms that could account for these results. The first mechanism relates to the expansive genetic diversity for which Prochlorococcus is known (Biller et al., 2015). All Prochlorococcus share a core genome of approximately 1,000 genes. However, ecotypes, sub-ecotypes, and even single cells contain unique sets of non-core functional genes, many of which are of unknown function (Kashtan et al., 2014, 2017). It is possible that the “responders” from the DNA-SIP experiment and the OTU enriched in the G2 phase of cell division contained unique complements of functional genes that allowed them to take advantage of conditions in the on-deck incubations (light shock) or water column, respectively, for improved growth rates or competition for nutrient and light resources. This mechanism is consistent with the idea that the “combinatorial nature” of Prochlorococcus diversity provides dynamic niche partitioning with population-level stability as an emergent property (Biller et al., 2015).
The second mechanism to explain the activity and cell division patterns observed here involves differential interactions with other organisms. Prochlorococcus can be inhibited (Sher et al., 2011) and enhanced (Morris et al., 2011) by interactions with heterotrophic microbes, consumed by grazers (Frias-lopez et al., 2009), and lysed by viruses (Sullivan et al., 2003). There is evidence that individual laboratory Prochlorococcus strains react differently to coculture with specific heterotrophic microbes (Sher et al., 2011), however, ecotype-level patterns are unknown. We do not know of studies showing that Prochlorococcus taxa are differentially susceptible to grazing. There is evidence of differential susceptibility to viral infection at the strain level (Sullivan et al., 2003) and single cell level (Malmstrom et al., 2013; Kashtan et al., 2014; Biller et al., 2015). Thus, even OTUs from the same sub-ecotype could be differentially susceptible to viral lysis, or could devote different levels of resources to defense relative to growth and carbon metabolism, leading to complex relationships between abundance and activity for Prochlorococcus.
The third mechanism involves physical processes that bring together water masses containing cells of divergent recent history (acclimation state) and could explain differences in OTU activity with respect to carbon assimilation and cell division, especially with respect to very closely related OTUs that were differently active. In the two experiments presented here, samples were collected from within the stratified thermocline where depth profiles did not reveal strong density anomalies that would suggest recent mixing events (Supplementary Figures S2, S3). However, flow cytometry analysis revealed that the time-zero DNA-SIP incubation contained a Prochlorococcus “double population.” Our previous work suggested that a “double population” could be a sign of the recent mixing of two water masses containing two populations of cells photo-acclimated to different light intensities (van den Engh et al., 2017; Thompson et al., 2018). Possibly, recent coalescence of two communities acclimated to slightly different conditions (i.e., light intensity) produced the results of the DNA-SIP experiments presented here, meaning a subset of the population was physiologically poised to assimilate carbon more efficiently at the time of the experiment. “Double” populations were not observed for the cell cycle experiments, despite similar ecotype community structure as the DNA-SIP samples. Another physical mechanism relates to settling of particles (including phytoplankton) out of the mixed layer. Settling could introduce surface-acclimated cells to the thermocline as either whole cells or cells incorporated into aggregates (Durkin et al., 2016). We hypothesize that the HLII OTU depleted in the G2 phase of cell division (OTU6736) could have settled from the surface mixed layer and entered a dormant or deceased state within the light-limited thermocline, remaining in G1 and not proceeding through cell division due to suboptimal growth conditions. One study has examined a similar situation where Prochlorococcus HLII ecotypes were exposed to extended darkness (Coe et al., 2016). Many HLII strains were capable of surviving 35 h of darkness and maintained cell integrity (Coe et al., 2016), despite massive changes in metabolic state (Biller et al., 2018). If such laboratory conditions are relevant to open ocean conditions, we would expect to have detected and sorted settling dark-stressed HLII ecotype cells along with cells originating from the thermocline in the cell cycle analysis experiment. If this hypothesis is correct, in that some deep-dwelling HLII sub-ecotypes are not dividing, it would suggest that HLII ecotypes present in the thermocline are contributing less to primary productivity than their abundance would suggest and could have global relevance as HLII Prochlorococcus deep within the thermocline have been documented widely (DeLong et al., 2006; Jiao et al., 2014; Shibl et al., 2014; Coe et al., 2016).
Future Directions
This study is one of a very few to investigate differential activity of coexisting Prochlorococcus cells (Berthelot et al., 2019; Roth-Rosenberg et al., 2019) or genotypes (Fernández-Pinos et al., 2015; De Martini et al., 2018). Now that the expansive diversity of this lineage is well established, determining the implications of this diversity to the ocean ecosystem is a needed next step. Beyond the results presented here, additional experiments with other nutrients, temperature and light conditions, or initial community structures could reveal more about how Prochlorococcus community structure impacts the contributions of the Prochlorococcus “collective” to the ocean ecosystem.
Nitrogen metabolism is a strong factor in niche partitioning of coexisting ecotypes (Moore et al., 2002; Martiny et al., 2009a,b; Berube et al., 2015). Further, single cell heterogeneity among Prochlorococcus is greater for some forms of nitrogen (i.e., NO3–) than it is for carbon (Berthelot et al., 2019). DNA-SIP experiments with nitrogen compounds could be very informative toward determining differential contributions of Prochlorococcus ecotypes to nitrogen biogeochemical cycles. Likewise, even closely related strains have different iron metabolisms (Thompson et al., 2011; Malmstrom et al., 2013), suggesting that community structure of Prochlorococcus could determine the dynamics of iron biogeochemical cycles.
The experiments presented here involved Prochlorococcus communities from within the stratified thermocline. These depths were used to guarantee ecotype diversity and ensure distinction between SYBR-stained Prochlorococcus and heterotrophic bacteria. However, use of Prochlorococcus communities from the surface mixed layer would be a valuable extension as surface populations outweigh thermocline populations in global abundance (Johnson et al., 2006; Malmstrom et al., 2010). One interesting question surrounds the LL ecotypes that are often present in the surface mixed layer at low abundances. Are LL ecotypes actively metabolizing and dividing to maintain their abundance in the surface mixed layer? Or, have they been entrained upwards from the thermocline by mixing? Similarly, investigating differential activity among coexisting Prochlorococcus at other latitudes, where Prochlorococcus ecotype structure is distinct from Station ALOHA (Johnson et al., 2006; Ribalet et al., 2015; Larkin et al., 2016), would help expand understanding of the importance of Prochlorococcus community structure to the ocean ecosystem.
Finally, the experiments presented here followed a short time-course (24 h) to minimize cross-feeding of 13C between primary producers and other microbes (Coyotzi et al., 2016). Longer incubation times could yield heavier labeling of DNA and also allow tracking of inorganic carbon assimilated by Prochlorococcus into to specific lineages of heterotrophs, thus capturing information on how Prochlorococcus community structure impacts on trophic transfer of carbon.
Conclusion
Diversity in microbial activity levels is an important dimension of marine microbial community function. For the abundant cyanobacterium Prochlorococcus, diversity in metabolic potential among coexisting ecotypes is well documented, however, the implications of this genetic diversity toward microbial activity levels is unclear. Here, we examined whether coexisting Prochlorococcus OTUs contribute differently to primary production in the open ocean. Results suggest that coexisting ecotypes and sub-ecotypes contribute differently to patterns of cell division and carbon assimilation, which was not related to OTU abundance or ecotype identity. Future work will identify the mechanisms behind this heterogeneity toward robust prediction of Prochlorococcus contributions to global processes.
Data Availability Statement
The datasets generated for this study can be found in the GenBank under BioProject ID PRJNA558395. Oceanographic data is available through the HOT program http://hahana.soest.hawaii.edu/hot/hot-dogs/interface.html.
Author Contributions
AT designed and performed the experiments and analyzed the results. KK performed the experiments and analyzed the results. AT wrote the manuscript with contributions from KK.
Funding
The National Science Foundation provided funding to AT (OCE-1646709).
Conflict of Interest
The authors declare that the research was conducted in the absence of any commercial or financial relationships that could be construed as a potential conflict of interest.
Acknowledgments
We thank the officers, crew, and scientists of the R/V Ka‘imikai-O-Kanaloa (HOT283) and the R/V Sikuliaq (HOT288) especially Tara Clemente, Susan Curless, and Fernando Santiago-Mandujano. We also thank Allison Cusick for the assistance with sampling and experiments during HOT283.
Supplementary Material
The Supplementary Material for this article can be found online at: https://www.frontiersin.org/articles/10.3389/fmars.2019.00701/full#supplementary-material
Footnotes
References
Ahlgren, N. A., Perelman, J. N., Yeh, Y., and Fuhrman, J. A. (2019). Multi-year dynamics of fine-scale marine cyanobacterial populations are more strongly explained by phage interactions than abiotic, bottom-up factors. Environ. Microbiol. 21, 2948–2963. doi: 10.1111/1462-2920.14687
Altschul, S. F., Gish, W., Miller, W., Myers, E. W., and Lipman, D. J. (1990). Basic local alignment search tool. J. Mol. Biol. 215, 403–410. doi: 10.1016/S0022-2836(05)80360-2
Bartram, A. K., Poon, C., and Neufeld, J. D. (2009). Nucleic acid contamination of glycogen used in nucleic acid precipitation and assessment of linear polyacrylamide as an alternative co-precipitant. BioTechniques 47, 1019–1022. doi: 10.2144/000113276
Becker, J. W., Hogle, S. L., Rosendo, K., and Chisholm, S. W. (2019). Co-culture and biogeography of Prochlorococcus and SAR11. ISME J. 13, 1506–1519. doi: 10.1038/s41396-019-0365-4
Berthelot, H., Duhamel, S., L’Helguen, S., Maguer, J.-F., Wang, S., Cetinić, I., et al. (2019). NanoSIMS single cell analyses reveal the contrasting nitrogen sources for small phytoplankton. ISME J. 13, 651–662. doi: 10.1038/s41396-018-0285-8
Berube, P. M., Biller, S. J., Kent, A. G., Berta-Thompson, J. W., Roggensack, S. E., Roache-Johnson, K. H., et al. (2015). Physiology and evolution of nitrate acquisition in Prochlorococcus. ISME J. 9, 1195–1207. doi: 10.1038/ismej.2014.211
Biller, S. J., Berube, P. M., Lindell, D., and Chisholm, S. W. (2015). Prochlorococcus: the structure and function of collective diversity. Nat. Rev. Microbiol. 13, 13–27. doi: 10.1038/nrmicro3378
Biller, S. J., Coe, A., Roggensack, S. E., and Chisholm, S. W. (2018). Heterotroph Interactions alter prochlorococcus transcriptome dynamics during extended periods of darkness. mSystems 3, e40–e18. doi: 10.1128/mSystems.00040-18
Braakman, R., Follows, M. J., and Chisholm, S. W. (2017). Metabolic evolution and the self-organization of ecosystems. Proc. Natl. Acad. Sci. U.S.A. 114, E3091–E3100. doi: 10.1073/pnas.1619573114
Campbell, B. J., Yu, L., Heidelberg, J. F., and Kirchman, D. L. (2011). Activity of abundant and rare bacteria in a coastal ocean. Proc. Natl. Acad. Sci.U.S.A. 108, 12776–12781. doi: 10.1073/pnas.1101405108
Campbell, L., and Vaulot, D. (1993). Photosynthetic picoplankton community structure in the subtropical north pacific ocean near hawaii (station ALOHA). Deep Sea Res. Part I Oceanogr. Res. Papers 40, 2043–2060.
Caporaso, J. G., Kuczynski, J., Stombaugh, J., Bittinger, K., Bushman, F. D., and Costello, E. K. (2010). QIIME allows analysis of high-throughput community sequencing data. Nat. Methods 7, 335–336.
Coe, A., Ghizzoni, J., LeGault, K., Biller, S., Roggensack, S. E., and Chisholm, S. W. (2016). Survival of Prochlorococcus in extended darkness. Limnol. Oceanogr. 61, 1375–1388.
Coyotzi, S., Pratscher, J., Murrell, J. C., and Neufeld, J. D. (2016). Targeted metagenomics of active microbial populations with stable-isotope probing. Curr. Opin. Biotechnol. 41, 1–8. doi: 10.1016/j.copbio.2016.02.017
De Martini, F., Neuer, S., Hamill, D., Robidart, J., and Lomas, M. W. (2018). Clade and strain specific contributions of Synechococcus and Prochlorococcus to carbon export in the Sargasso Sea. Limnol. Oceanogr. 63, S448–S457. doi: 10.1002/lno.10765
DeLong, E. F., Preston, C. M., Mincer, T., Rich, V., Hallam, S. J., Frigaard, N.-U., et al. (2006). Community genomics among stratified microbial assemblages in the ocean’s interior. Science 311, 496–503.
Durkin, C. A., Van Mooy, B. A. S., Dyhrman, S. T., and Buesseler, K. O. (2016). Sinking phytoplankton associated with carbon flux in the Atlantic Ocean. Limnol. Oceanogr. 61, 1172–1187. doi: 10.1002/lno.10253
Fernández-Pinos, M.-C., Casado, M., Caballero, G., Zinser, E. R., Dachs, J., and Piña, B. (2015). Clade-specific quantitative analysis of photosynthetic gene expression in Prochlorococcus. PLoS One 10:e0133207. doi: 10.1371/journal.pone.0133207
Flombaum, P., Gallegos, J. L., Gordillo, R. A., Rincón, J., Zabala, L. L., Jiao, N., et al. (2013). Present and future global distributions of the marine Cyanobacteria Prochlorococcus and Synechococcus. Proc. Natl. Acad. Sci.U.S.A. 110, 9824–9829. doi: 10.1073/pnas.1307701110
Frias-lopez, J., Thompson, A., Waldbauer, J., and Chisholm, S. W. (2009). Use of stable isotope-labelled cells to identify active grazers of picocyanobacteria in ocean surface waters. Environ. Microbiol. 11, 512–525. doi: 10.1111/j.1462-2920.2008.01793.x
Grossowicz, M., Marques, G. M., and van Voorn, G. A. K. (2017). A dynamic energy budget (DEB) model to describe population dynamics of the marine cyanobacterium Prochlorococcus marinus. Ecol. Modell. 359, 320–332.
Huang, S., Wilhelm, S. W., Harvey, H. R., Taylor, K., Jiao, N., and Chen, F. (2011). Novel lineages of Prochlorococcus and Synechococcus in the global oceans. Isme J. 6:285. doi: 10.1038/ismej.2011.106
Jiao, N., Luo, T., Zhang, R., Yan, W., Lin, Y., Johnson, Z. I., et al. (2014). Presence of Prochlorococcus in the aphotic waters of the western Pacific Ocean. Biogeosciences 11, 2391–2400.
Johnson, Z. I., Zinser, E. R., Coe, A., McNulty, N. P., Woodward, E. M. S., and Chisholm, S. W. (2006). Niche partitioning among prochlorococcus ecotypes along ocean-scale environmental gradients. Science 311, 1737–1740.
Karl, D. M., and Church, M. J. (2017). Ecosystem structure and dynamics in the north pacific subtropical gyre: new views of an old ocean. Ecosystems 20, 433–457.
Karl, D. M., and Lukas, R. (1996). The hawaii ocean time-series (hot) program: background, rationale and field implementation. DeepSea Res. Part II Top. Stud. Oceanogr. 43, 129–156.
Kashtan, N., Roggensack, S. E., Berta-Thompson, J. W., Grinberg, M., Stepanauskas, R., and Chisholm, S. W. (2017). Fundamental differences in diversity and genomic population structure between Atlantic and Pacific Prochlorococcus. Isme J. 11:1997. doi: 10.1038/ismej.2017.64
Kashtan, N., Roggensack, S. E., Rodrigue, S., Thompson, J. W., Biller, S. J., Coe, A., et al. (2014). Single-Cell genomics reveals hundreds of coexisting subpopulations in wild prochlorococcus. Science 344, 416–420. doi: 10.1126/science.1248575
Kent, A. G., Dupont, C. L., Yooseph, S., and Martiny, A. C. (2016). Global biogeography of Prochlorococcus genome diversity in the surface ocean. ISME J. 10:1856. doi: 10.1038/ismej.2015.265
Kettler, G. C., Martiny, A. C., Huang, K., Zucker, J., Coleman, M. L., Rodrigue, S., et al. (2007). Patterns and Implications of Gene Gain and Loss in the Evolution of Prochlorococcus. PLoS Genet. 3:e231. doi: 10.1371/journal.pgen.0030231
Lange, P. K., Brewin, R. J. W., Dall’Olmo, G., Tarran, G. A., Sathyendranath, S., Zubkov, M., et al. (2018). Scratching beneath the surface: a model to predict the vertical distribution of prochlorococcus using remote sensing. Remote Sens. 10:847.
Larkin, A. A., Blinebry, S. K., Howes, C., Lin, Y., Loftus, S. E., Schmaus, C. A., et al. (2016). Niche partitioning and biogeography of high light adapted Prochlorococcus across taxonomic ranks in the North Pacific. ISME J. 10, 1555–1567. doi: 10.1038/ismej.2015.244
Larkin, A. A., Garcia, C. A., Ingoglia, K. A., Garcia, N. S., Baer, S. E., and Twining, et al. (2019). Subtle biogeochemical regimes in the Indian Ocean revealed by spatial and diel frequency of Prochlorococcus haplotypes. Limnol. Oceanogr. doi: 10.1002/lno.11251
Lueders, T., Manefield, M., and Friedrich, M. W. (2004). Enhanced sensitivity of DNA- and rRNA-based stable isotope probing by fractionation and quantitative analysis of isopycnic centrifugation gradients. Environ. Microbiol. 6, 73–78.
Malmstrom, R. R., Coe, A., Kettler, G. C., Martiny, A. C., Frias-Lopez, J., Zinser, E. R., et al. (2010). Temporal dynamics of Prochlorococcus ecotypes in the Atlantic and Pacific oceans. ISME J. 4, 1252–1264. doi: 10.1038/ismej.2010.60
Malmstrom, R. R., Rodrigue, S., Huang, K. H., Kelly, L., Kern, S. E., Thompson, A., et al. (2013). Ecology of uncultured Prochlorococcus clades revealed through single-cell genomics and biogeographic analysis. ISME J. 7, 184–198. doi: 10.1038/ismej.2012.89
Mandal, S., Van Treuren, W., White, R. A., Eggesbø, M., Knight, R., and Peddada, S. D. (2015). Analysis of composition of microbiomes: a novel method for studying microbial composition. Microb. Ecol. Health Dis. 26:27663. doi: 10.3402/mehd.v26.27663
Mann, E. L., and Chisholm, S. W. (2000). Iron limits the cell division rate of Prochlorococcus in the eastern equatorial Pacific. Limnol. Oceanogr. 45, 1067–1076.
Martiny, A. C., Kathuria, S., and Perube, P. M. (2009a). Widespread metabolic potential for nitrite and nitrate assimilation among Prochlorococcus ecotypes. Proc. Natl. Acad. Sci. U.S.A. 106, 10787–10792. doi: 10.1073/pnas.0902532106
Martiny, A. C., Tai, A. P. K., Veneziano, D., Primeau, F., and Chisholm, S. W. (2009b). Taxonomic resolution, ecotypes and the biogeography of Prochlorococcus. Environ. Microbiol. 11, 823–832. doi: 10.1111/j.1462-2920.2008.01803.x
Moore, L. R., and Chisholm, S. W. (1999). Photophysiology of the marine Cyanobacterium : ecotypic differences among cultured isolates. Limnology and Oceanography 44, 628–638. doi: 10.4319/lo.1999.44.3.0628
Moore, L. R., Post, A. F., Rocap, G., and Chisholm, S. W. (2002). Utilization of different nitrogen sources by the marine cyanobacteria Prochlorococcus and Synechococcus. Limnology and Oceanography 47, 989–996.
Moore, L. R., Rocap, G., and Chisholm, S. W. (1998). Physiology and molecular phylogeny of coexisting Prochlorococcus ecotypes. Nature 393, 464–467.
Morris, J. J., Johnson, Z. I., Szul, M., Prochlorococcus, J., Keller, M., and Zinser, E. R. (2011). Dependence of the Cyanobacterium Prochlorococcus on hydrogen peroxide scavenging microbes for growth at the ocean’s surface. PLoS One 6:e16805. doi: 10.1371/journal.pone.0016805
Neufeld, J. D., Vohra, J., Dumont, M. G., Lueders, T., Manefield, M., Friedrich, M. W., et al. (2007). DNA stable-isotope probing. Nature Protocols 2:860.
Oksanen, E., Jari Blanchet, F. G., Friendly, M., Kindt, R., Legendre, P., McGlinn, D., et al. (2019). Vegan: Community Ecology Package. R Package Version. R Package Version 2.5-6.
Partensky, F., Hess, W. R., and Vaulot, D. (1999). Prochlorococcus, a marine photosynthetic prokaryote of global significance. Microbiol. Mol. Biol. Rev. 63, 106–127.
Ribalet, F., Swalwell, J., Clayton, S., Jimenez, V., Sudek, S., Lin, Y., et al. (2015). Light-driven synchrony of Proclorococcus growth and mortality in the subtropical Pacific gyre. Proc. Natl. Acad. Sci.U.S.A. 112, 8008–8012. doi: 10.1073/pnas.1424279112
Roth-Rosenberg, D., Aharonovich, D., Luzzatto-Knaan, T., Vogts, A., Zoccarato, L., Eigemann, F., et al. (2019). <em>Prochlorococcus</em> Rely on Microbial Interactions Rather than on Chlorotic Resting Stages to Survive Long-Term Stress. BioRxiv. [Preprint].
Rusch, D. B., Martiny, A. C., Dupont, C. L., Halpern, A. L., and Venter, J. C. (2010). Characterization of <em>Prochlorococcus</em> clades from iron-depleted oceanic regions. Proc. Natl. Acad. Sci.U.S.A. 107, 16184–16189.
Sher, D., Thompson, J. W., Kashtan, N., Croal, L., and Chisholm, S. W. (2011). Response of Prochlorococcus ecotypes to co-culture with diverse marine bacteria. ISME J. 5, 1125–1132. doi: 10.1038/ismej.2011.1
Shibl, A. A., Thompson, L. R., Ngugi, D. K., and Stingl, U. (2014). Distribution and diversity of Prochlorococcus ecotypes in the red sea. FEMS Microbiol. Lett. 356, 118–126. doi: 10.1111/1574-6968.12490
Sosik, H., Olson, R. J., Neubert, M., and Shalapyonok, A. (2003). Growth rates of coastal phytoplankton from time-series measurements with a submersible flow cytometer. Limnol. Oceanogr. 48, 1756–1765. doi: 10.4319/lo.2003.48.5.1756
Sullivan, M. B., Waterbury, J. B., and Chisholm, S. W. (2003). Cyanophages infecting the oceanic cyanobacterium Prochlorococcus. Nature 424, 1047–1051.
Thompson, A. W., Huang, K., Saito, M. A., and Chisholm, S. W. (2011). Transcriptome response of high- and low-light-adapted Prochlorococcus strains to changing iron availability. ISME J. 5, 1580–1594. doi: 10.1038/ismej.2011.49
Thompson, A. W., van den Engh, G., Ahlgren, N. A., Kouba, K., Ward, S., Wilson, S. T., et al. (2018). Dynamics of Prochlorococcus diversity and photoacclimation during short-term shifts in water column stratification at station ALOHA. Front. Mar. Sci. 5:488. doi: 10.3389/fmars.2018.00488
van den Engh, G. J., Doggett, J. K., Thompson, A. W., Doblin, M. A., Gimpel, C. N. G., and Karl, D. M. (2017). Dynamics of Prochlorococcus and Synechococcus at station ALOHA revealed through flow cytometry and high-resolution vertical sampling. Front. Mar. Sci. 4:359. doi: 10.3389/fmars.2017.00359
Vaulot, D., Marie, D., Olson, R. J., and Chisholm, S. W. (1995). Growth of Prochlorococcus, a photosynthetic prokaryote, in the equatorial pacific ocean. Science 268, 1480–1482.
Weiss, S., Xu, Z. Z., Peddada, S., Amir, A., Bittinger, K., Gonzalez, A., et al. (2017). Normalization and microbial differential abundance strategies depend upon data characteristics. Microbiome 5:27. doi: 10.1186/s40168-017-0237-y
Wright, J. J., Lee, S., Zaikova, E., Walsh, D. A., and Hallam, S. J. (2009). DNA extraction from 0.22 μm sterivex filters and cesium chloride density gradient centrifugation. J. Visual. Exp. 31:1352.
Youngblut, N. D., and Buckley, D. H. (2014). Intra-genomic variation in G + C content and its implications for DNA stable isotope probing. Environ. Microbiol. Rep. 6, 767–775. doi: 10.1111/1758-2229.12201
Keywords: Prochlorococcus, stable isotope probing, ecotype, carbon assimilation, cell cycle
Citation: Thompson AW and Kouba K (2019) Differential Activity of Coexisting Prochlorococcus Ecotypes. Front. Mar. Sci. 6:701. doi: 10.3389/fmars.2019.00701
Received: 09 August 2019; Accepted: 31 October 2019;
Published: 21 November 2019.
Edited by:
Anne Michelle Wood, University of Oregon, United StatesReviewed by:
Lisa R. Moore, Macquarie University, AustraliaLuke Thompson, Atlantic Oceanographic and Meteorological Laboratory (NOAA), United States
Copyright © 2019 Thompson and Kouba. This is an open-access article distributed under the terms of the Creative Commons Attribution License (CC BY). The use, distribution or reproduction in other forums is permitted, provided the original author(s) and the copyright owner(s) are credited and that the original publication in this journal is cited, in accordance with accepted academic practice. No use, distribution or reproduction is permitted which does not comply with these terms.
*Correspondence: Anne W. Thompson, anne.w.thompson@gmail.com