Strategy for Detection and High-Resolution Characterization of Authigenic Carbonate Cold Seep Habitats Using Ships and Autonomous Underwater Vehicles on Glacially Influenced Terrain
 Terje Thorsnes
 Shyam Chand
 Harald Brunstad3
 - 1Marine Geology, Geological Survey of Norway, Trondheim, Norway
- 2Centre for Arctic Gas Hydrate, Environment and Climate, University of Tromsø, Tromsø, Norway
- 3Lundin Norway AS, Oslo, Norway
- 4Norwegian Defence Research Establishment, Kjeller, Norway
Cold seep habitats with authigenic carbonates and associated chemosynthetic communities in glacially influenced terrains constitute an important part of the benthic ecosystems, but they are difficult to detect in large-scale seabed surveys. The areas they occupy are normally small, and survey platforms and sensors allowing high-resolution spatial characterization are necessary. We have developed a cold seep habitat mapping strategy that involves both ship and autonomous underwater vehicle (AUV) as platforms for multibeam echosounder, synthetic aperture sonar (SAS) and a digital photo system. Water column data from the shipborne multibeam echosounder data are initially used to detect gas flares resulting from fluid flow from the seabed. The next phase involves mapping of flare areas by SAS, mounted on an AUV. This yields an acoustic image with a resolution up to 2 cm over a swath of c. 350 m, allowing detection of seep-related features on the seabed. The last phase involves digital photographing of the seabed, with the AUV moving close to the seabed, allowing recognition of bubble streams, seep-related features and giving a first order documentation of the fauna. The strategy was applied to a 3775 km2 large area on the continental shelf, northern Norway. This is a passive continental margin, with thick deposits of oil- and gas-bearing sedimentary rocks. Extensive faulting and tilting of layers provide potential conduits for fluid flow. The seabed is glacially influenced with a highly variable backscatter reflectivity. More than 200 gas flares have been identified, and a similar number of cold seep habitats have been characterized in high spatial detail. Two case studies are shown. In the first area, there is a close spatial relation between active gas seepage and carbonate crust fields. The second case study shows that carbonate crust fields are not necessarily spatially associated with currently active seeps, but represent dormant or formerly active gas expulsion. An important finding is that the bathymetric resolution of shipborne multibeam echosounders will often be too low to detect cold seep habitats. This means that a nested multi-resolution approach involving a multitude of platforms and sensors is required to provide the full picture.
Introduction
Cold seeps are found ubiquitously at oceanic margins and are characterized by the transport of fluids including dissolved compounds to the ocean through sediments (Campbell, 2006; Hovland, 2007; Suess, 2014). The compounds provide the bioactive reductants sulfide, methane and hydrogen, sustaining ecosystems (Suess, 2014). The surficial expression of cold seeps at the seafloor varies considerably, reflecting differences in mechanisms generating the fluids, the fluid migration pathways, and sedimentary and hydrodynamic conditions at the seafloor (Naudts et al., 2006; Klaucke et al., 2008, 2010). Cold seeps are commonly associated with areas with sub-seafloor hydrocarbon reservoirs (Hovland et al., 1993; Milkov and Sassen, 2003). Numerous cold seeps occur on the Norwegian continental shelf (Bünz et al., 2012; Crémière et al., 2016; Andreassen et al., 2017; Chand et al., 2017; Panieri et al., 2017). Pockmarks, mud diapirs, bacterial mats and methane-derived carbonates are commonly associated with cold seeps (Hovland and Judd, 1988). Pockmark formation depends on the fluid flow to be sufficiently strong through a sufficiently fine-grained sediment (Cathles et al., 2010). Precipitation of methane-derived authigenic carbonates is caused by elevated carbonate alkalinity due to anaerobic oxidation of methane (Aloisi et al., 2002; Naehr et al., 2007). The authigenic carbonates form at or near the surface (Greinert et al., 2001), and are exposed due to subsequent erosion. They may form three-dimensional rock structures, creating a unique habitat (Levin et al., 2015).
Acoustic characteristics of cold seeps and methods for mapping have been described by e.g., Orange et al., 2002; Johnson et al., 2003; Naudts et al., 2008; Wagner et al., 2013; Mitchell et al., 2018, and Paull et al., 2015. These studies are from non-glaciated areas where relatively fine-grained sediments with low backscatter reflectivity surround seep-related features with either high backscatter reflectivity or topographically rough seabed. This is in contrast to this study, where the seabed is characterized by highly variable backscatter reflectivity and rough topography.
Many studies rely upon surface-based single beam or multibeam bathymetry/backscatter in combination with side-scan sonars, and ROVs or video sleds for finding and studying cold seep habitats. In this paper, we want to demonstrate that the combination of shipborne bathymetry, backscatter and water column data, in combination with AUV-mounted very high resolution synthetic aperture sonar (SAS) data and optical sensors provide unprecedented possibilities to screen large areas, find objects of interest, and give a detailed characterization of cold seep habitats in an effective way.
Geological Setting
The study area (northern part of Nordvestbanken, the Håkjerringdjupet glacial trough and the southern part of Fugløybanken – Figure 1) is located in the southwestern part of the Barents Sea (Eldholm et al., 1984). Mesozoic and Cenozoic sedimentary rocks, hydrocarbon-bearing in some strata, accumulated in intracratonic basins, with deposition shifting to the continental margin in the west following the early Eocene opening of the Norwegian Sea (Spencer et al., 1984). The seafloor morphology of the Barents Sea is shaped by repeated glaciations since the late Pliocene and during the Pleistocene. The thickness of the ice sheet has been modeled to be 750–1000 m during the Last Glacial Maximum (Siegert et al., 2001). The ice sheet retreated from the region c. 18,000–20,000 years ago. The ice sheets have extended beyond the shelf edge in the south western Barents Sea several times (Vorren et al., 1991; Laberg et al., 2010, 2012) and formed many erosional channels.
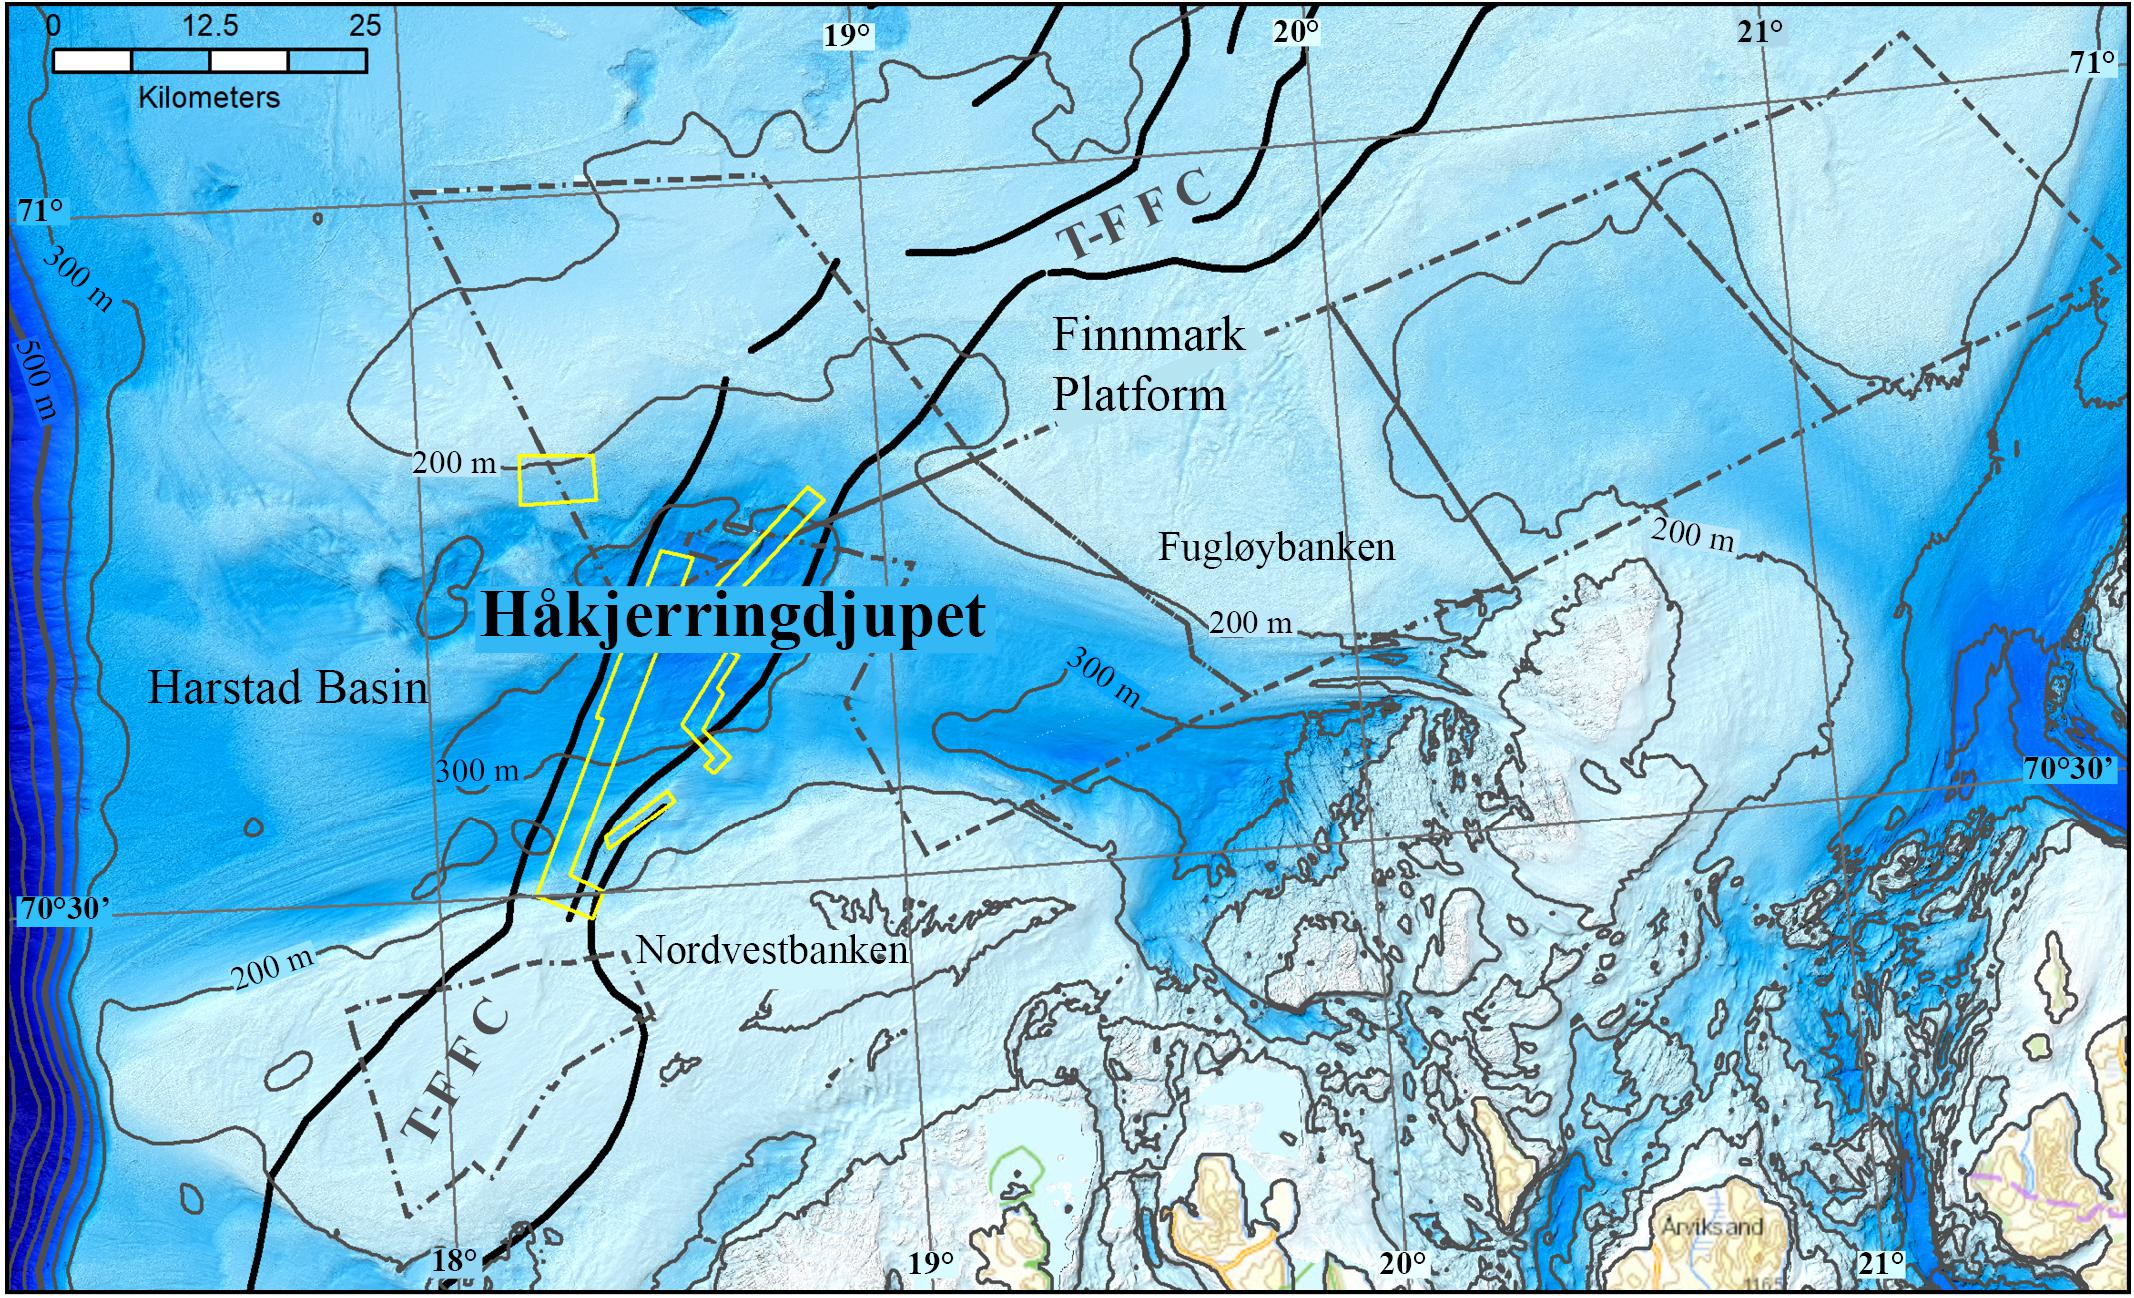
Figure 1. The Håkjerringdjupet study area. Black lines – faults within the Troms-Finnmark Fault Complex (T-F F C). Stippled gray lines – extent of MAREANO multibeam data. Yellow lines – extent of other multibeam data.
The Håkjerringdjupet trough is one of these large channels (Figure 1). The trough is c. 100 km long, 20–40 km wide, average depth is c. 300 m and the deepest part is c. 410 m. The trough is located between two major banks – the Nordvestbanken bank in the south, and the Fugløybanken bank in the northwest. Extensive glacitectonism occurred during glacial advances in the Håkjerringdjupet trough (Winsborrow et al., 2016).
Jurassic to Eocene sedimentary rocks subcrop under the Quaternary deposits in the central parts of the trough, while Precambrian basement rocks, and Paleozoic to Triassic sedimentary rocks subcrop in the eastern, innermost parts, and Pliocene sedimentary rocks subcrop in the western, outermost parts (Sigmond, 1992). Oil and gas reservoirs have been found in these sequences north of this area. The Troms-Finnmark Fault Complex crosses the area, separating the structural domains of Harstad Basin in the west and the Finnmark Platform in the east. The fault systems in combination with dipping sedimentary strata provide conduits for gas leaking from underlying gas bearing sedimentary rocks (Crémière et al., 2018). Gas flares fueled from these conduits are abundant. Dating of methane-derived carbonate crusts associated with these flares shows ages between 13.8 ± 0.8 and 0.99 ± 0.3 kyr, with an apparent clustering between 7 and 13 kyr (Crémière et al., 2018). These ages are consistent with the model proposed by Crémière et al. (2016), where crust formation is associated with gradual dissociation of methane hydrates following the deglaciation after the collapse of the Scandinavian Ice Sheet at around 16–17 kyr BP.
Materials and Methods
This study benefited from data sets collected by the MAREANO programme1 in 2010 and data sets collected in a cooperation project between Lundin Norway, the Geological Survey of Norway, and the Norwegian Defence Research Establishment during two cruises in 2013 and 2014 (Chand et al., 2015). Ships, an AUV and a remotely operated vehicle (ROV) were used as platforms for a variety of acoustic, optical and chemical sensors in different cruises. The results from the ROV investigations have been reported by Crémière et al. (2018).
The majority of the shipborne multibeam echosounder data (bathymetry, backscatter, water column) were collected by the MAREANO programme (see text footnote 1), while smaller data sets were collected later by the Norwegian Defence Research Establishment. Prior to the acquisition of the MAREANO dataset (performed by the company FOSAE) a patch test was performed which fulfilled the technical specifications of the Norwegian Hydrographic Service (responsible within the MAREANO programme for bathymetry, backscatter, water column and sub bottom profiler data acquisition). Sound velocity profiles were taken regularly. As an example, 85 SVPs were collected from one of the survey areas, where a total of 323 line segments were collected to cover 567 km2. No backscatter calibration was performed. During all surveys the Kongsberg Maritime EM710 multibeam echosounder was used. This echosounder has an operating frequency of 70–100 kHz. The bathymetry data was processed to a grid size of 2 m, and the backscatter data was processed to a grid size of 0.9 m. Water column data was processed using Fledermaus Midwater software. Available echosounder data with water column registrations are shown in Figure 1, covering an area of 3775 km2.
Additional data sets were collected with the HUGIN HUS AUV, produced by Kongsberg Maritime2. The deployed one-of-a-kind experimental research AUV was equipped with non-standard sensors and has the possibility to change the angle of the HiSAS 1030 RX array (see below for description of the HiSAS 1030). The AUV is 5.6 m long, with a diameter of 0.75 m, a dry weight of 1000 kg and can operate down to 3000 m water depth. The AUV is normally launched from the stern of the ship (Figure 2), where it is stored and maintained in a dedicated container. It is equipped with inertial navigation and HiPap positioning (an USBL system from Kongsberg Maritime) from the mothership.
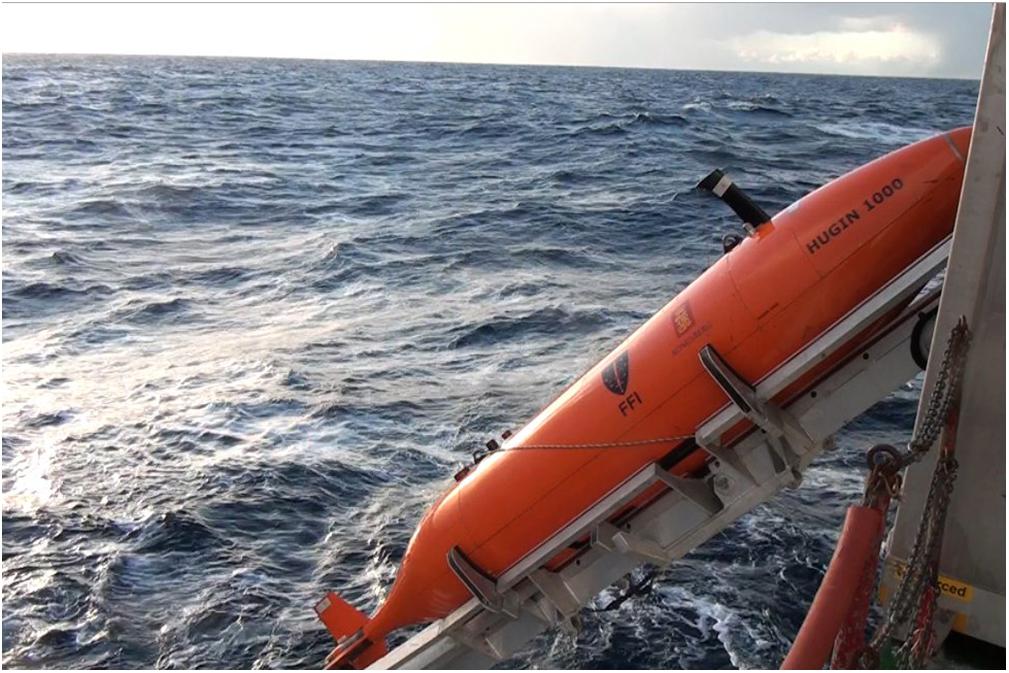
Figure 2. Launch of the HUGIN HUS AUV from the aft of the ship.
The HUGIN AUV was equipped with the following payloads: (1) An EdgeTech 2200 high resolution 2–12 kHz chirp sub-bottom profiler (SBP), (2) high-resolution interferometric SAS (HiSAS 1030), (3) Methane Sniffer, (4) Temperature, turbidity and salinity sensors, (5) B&W digital photo camera.
The HISAS 1030 is a high resolution interferometric SAS system capable of providing very high-resolution imagery and detailed micro-bathymetry of the seabed. The sensor is a wideband SAS sonar with frequency range of 70–100 kHz with 30 kHz bandwidth. The system has a range-independent resolution of approximately 3 × 3 cm out to a distance of 200 m from both sides of the AUV at a speed of 2 m/s (see text footnote 2). The flight height was typically 40 ± 10 m. The SAS data were processed onboard using the Kongsberg FOCUS software, with a grid size of 20 cm for the bathymetry, and 5 cm for the imagery. For an overview of principles and processing steps for the SAS data, please see Ødegård et al. (2018), who used the same equipment for archeological investigations in the North Sea. Onboard processed high-resolution mosaics in geotiff format were available for inspection in the Kongsberg Reflection and/or ESRI ArcMap softwares within 10 h of HUGIN recovery. Micro-bathymetry data from Area 1 was available after 24 h.
The TFish B&W camera provided very high resolution images (pixel size 6–8 mm) and photo mosaics (pixel size 10 mm) of the seafloor. The flight height for the AUV was typically 5–7 m, with photos taken every second. The TFish images were available co-registered with the SAS data within hours through the Reflection software system on-board HU Sverdrup. A georeferenced photomosaic was also available.
Results
Interpretation of the water column data from a total of 3775 km2 resulted in identification of 210 gas flares (Chand et al., 2017; Crémière et al., 2018). Figure 3A shows a subsection of this area, with 103 flare observations in an area of 370 km2. In some of the locations, there are several gas flares grouped together as a cluster, so the number of 210 is a minimum estimate. The distinction between single gas flares and gas flare clusters is based on the distance between individual flares. If gas flares occur within a distance of c. 30 m or less of each other, they are considered to form a cluster (Figure 3B). The average density is about 55 gas flares pr. 1.000 km2, but the distribution is uneven, and groups of gas flares and/or gas flare clusters are commonly found (Figure 3A). Some of the flare groups tend to be aligned with the direction of the regional faults in the Troms-Finnmark Fault Complex, while other flares do not show such alignment.
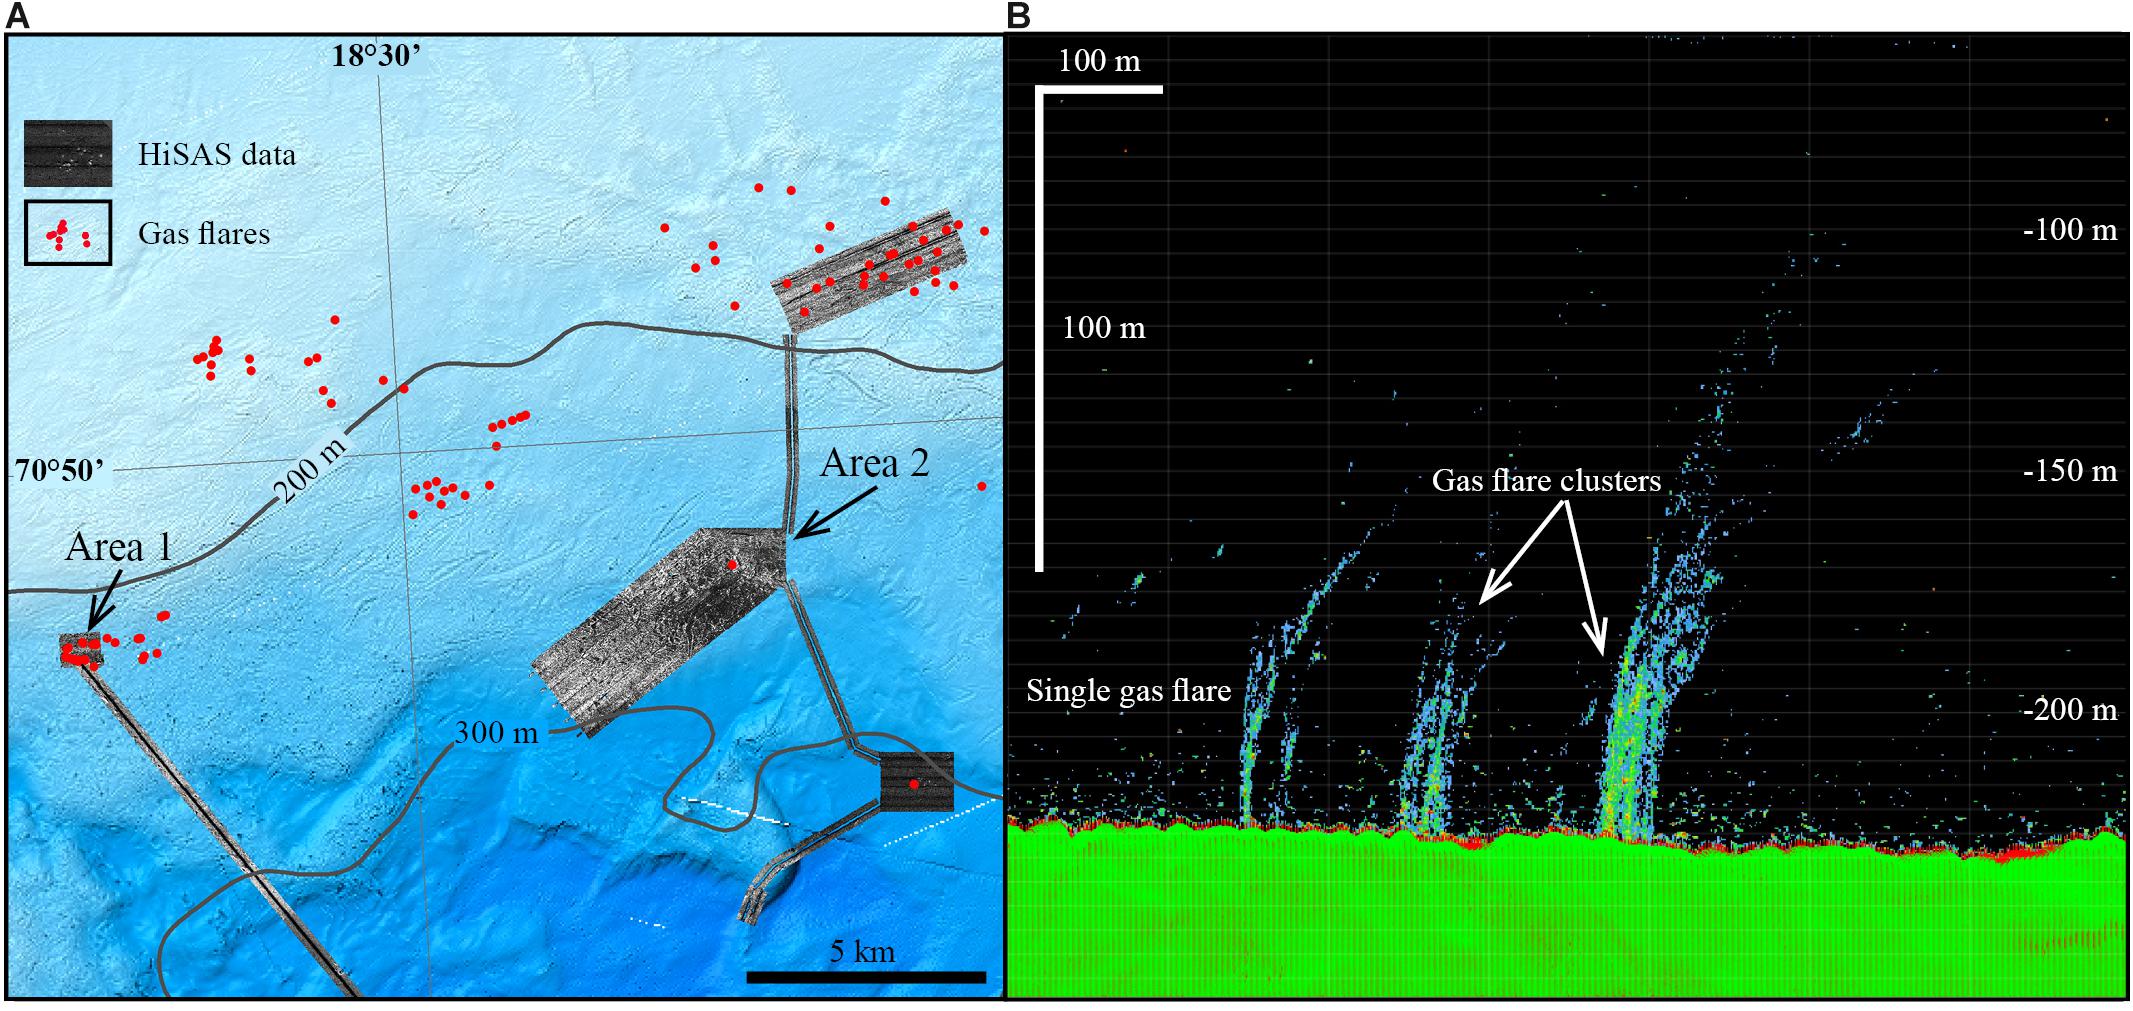
Figure 3. (A) Gas flares and synthetic aperture sonar data. (B) Side view of multibeam echosounder line showing a single gas flare and two gas flare clusters. The gas flare clusters correspond to the two carbonate crust fields shown in Figure 5.
Selection of areas for surveying the seabed with SAS was guided by the distribution of the gas flares. An example of this is shown in Figure 3A, where four sites with a total area of 20.2 km2 were surveyed. Data were also collected from the connection lines, giving an additional 9.2 km2 sonar coverage. The following description focusses on Area 1 and Area 2, highlighting different aspects of how authigenic carbonate cold seep habitats occur.
Area 1 – Carbonate Crust Fields Associated With Numerous Gas Flares
Area 1 is located north of the Håkjerringdjupet trough (Figure 3A) at a water depth c. 230 m. The shipborne bathymetry data from Area 1 and the surrounding area shows an irregular seabed, with numerous iceberg ploughmarks. The ploughmarks are up to 100 m wide, and at least 3 km long. Numerous semi-circular to elongated depressions up to 200 m long and 10 m deep occur. These were probably formed when icebergs tipped over and indented the seabed (Chand et al., 2016). The backscatter data from the multibeam echosounder show highly variable reflectivity, with low reflectivity in the bottom of the iceberg ploughmarks, and the highest reflectivity associated with the berms of the ploughmarks. The overall reflectivity in the area is medium to high, indicating the presence of coarse seabed sediments. This is in line with the interpretation of Bellec et al. (2012) who mapped this area as “gravelly sand.”
Step one in the search for cold seep habitats associated with authigenic carbonate crust pavements was to analyze the water column data, showing that there were eight gas flares, grouped in two clusters which were c. 130 m apart.
Step two involved inspection of the shipborne bathymetry data and backscatter data. No anomalies could be detected in the bathymetry or backscatter data (Figures 4A,B).
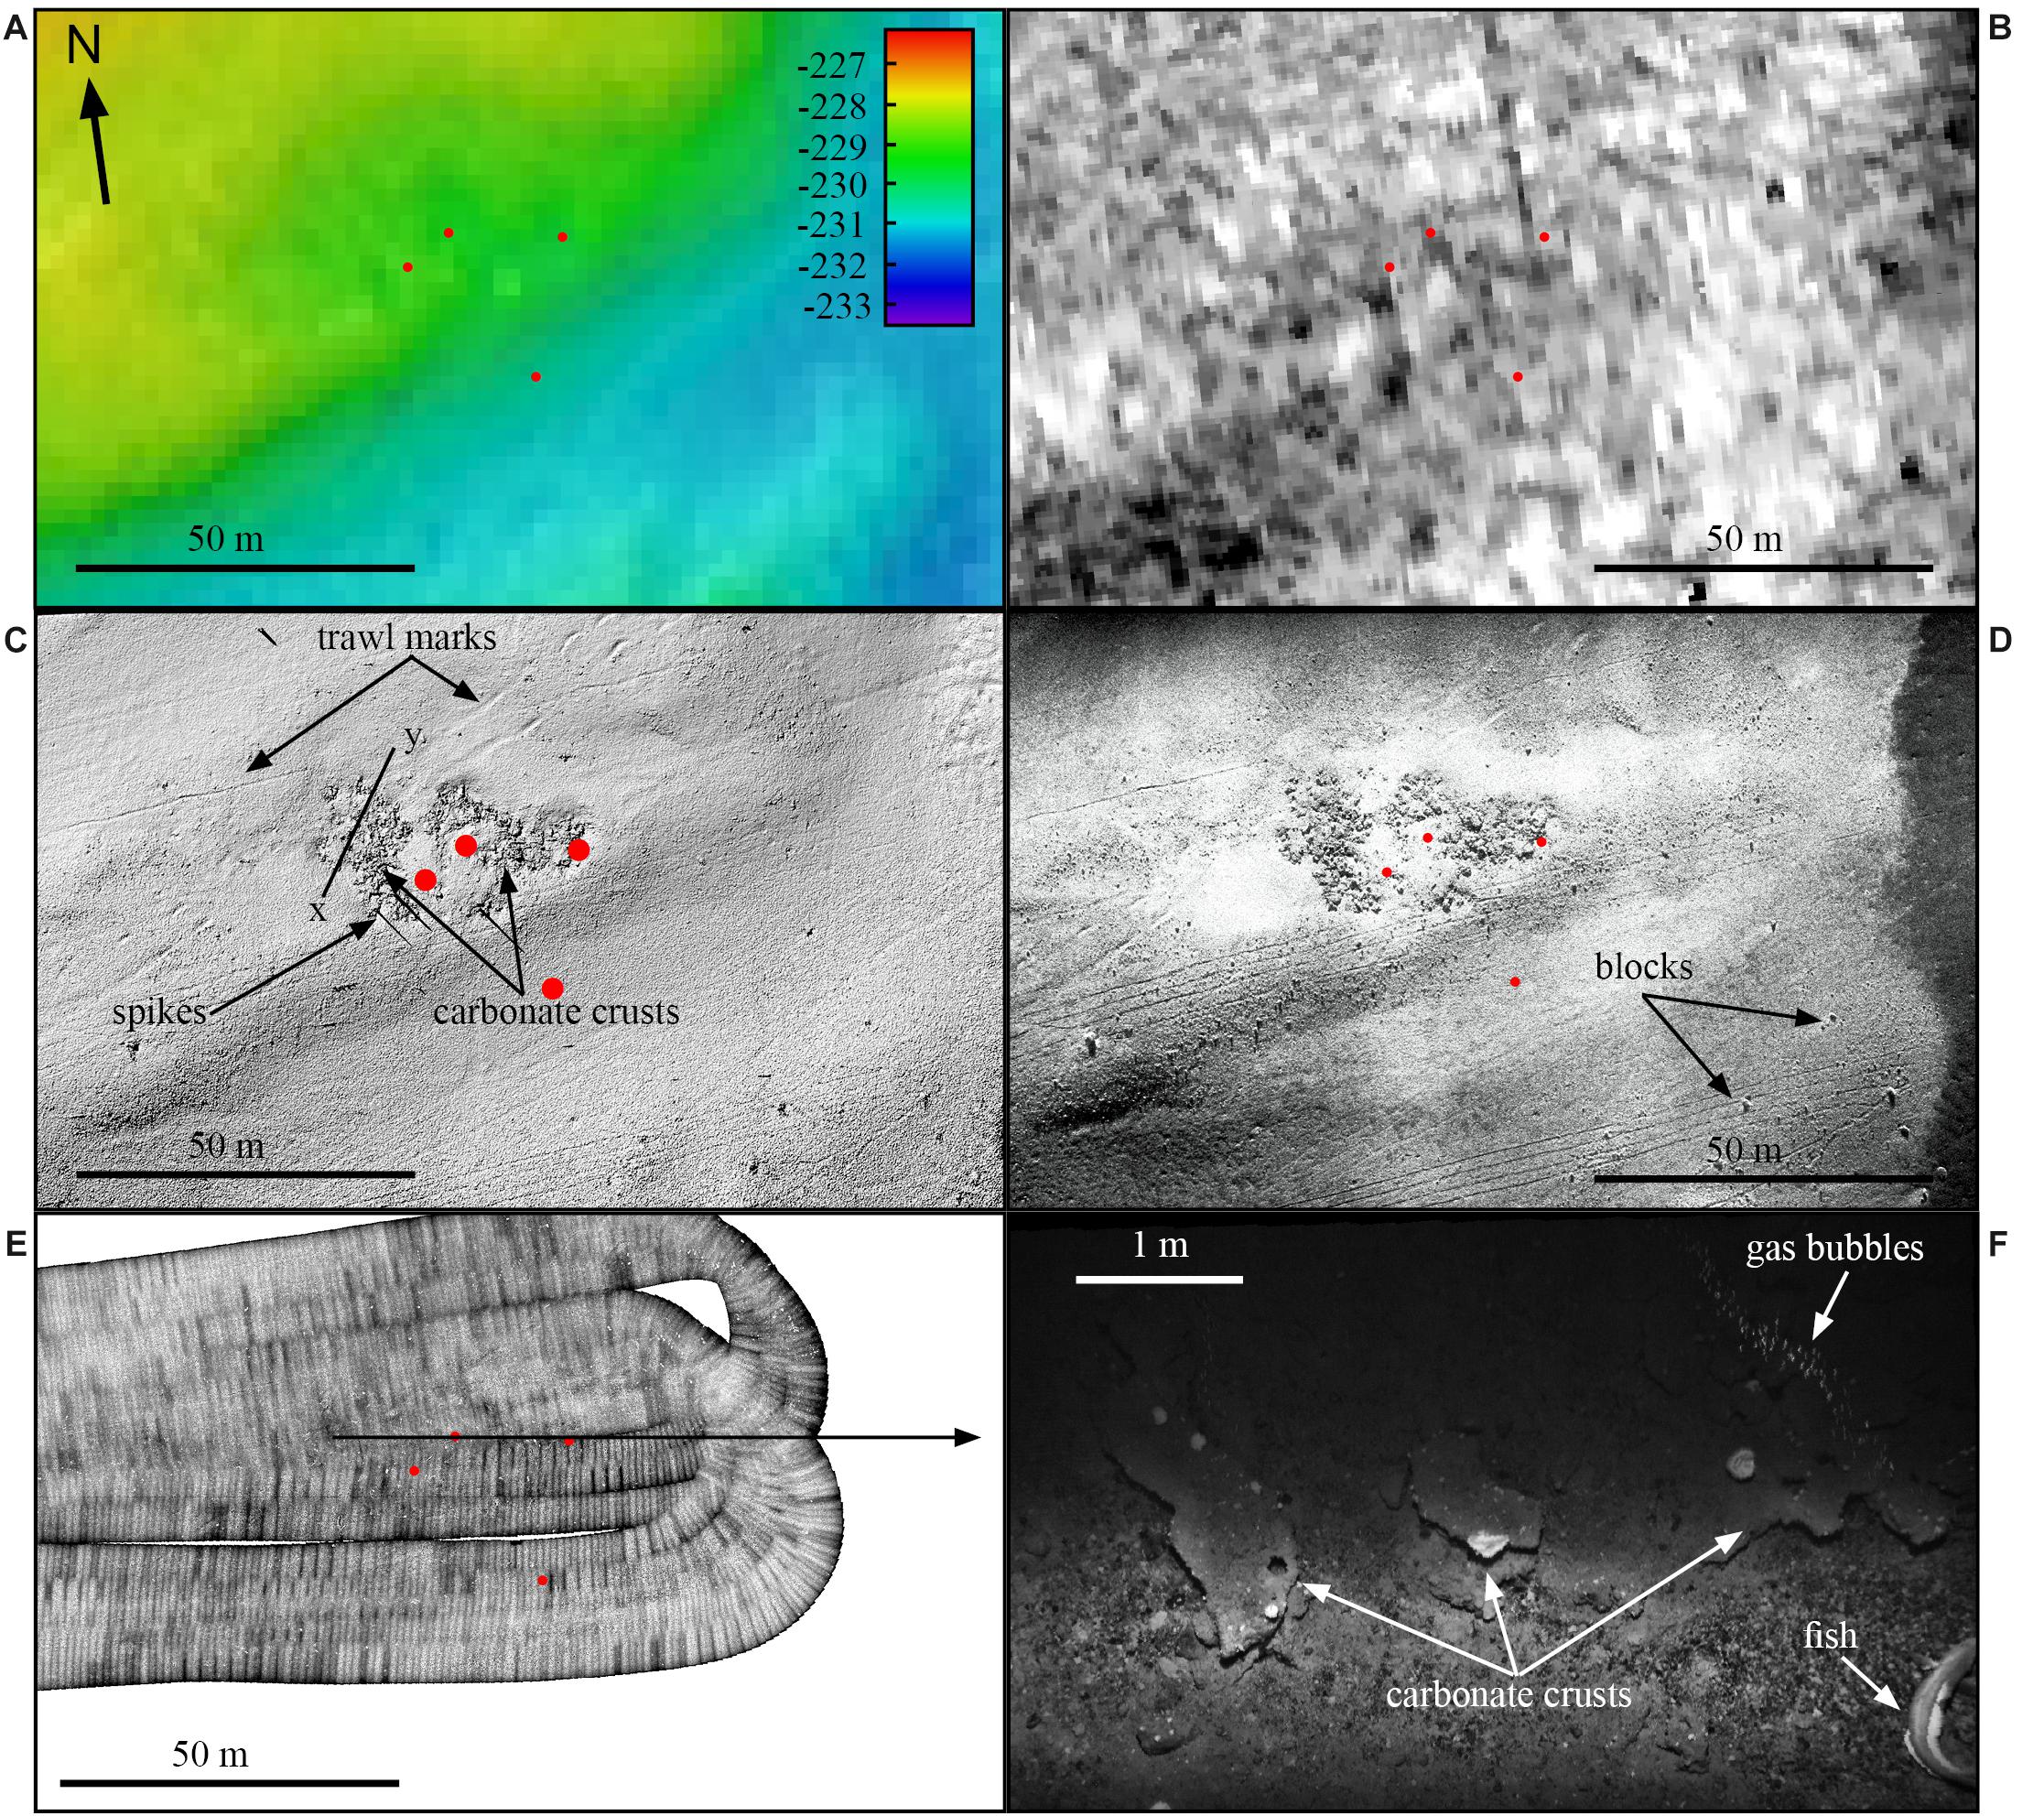
Figure 4. Examples of different sensors from a subsection in Area 1 – see Figure 5 for location. (A) Ship-based multibeam bathymetry. Red dots show gas flares. (B) Ship-based backscatter. High backscatter – lighter tones, low backscatter – darker tones. (C) Hillshade image, based on AUV SAS micro-bathymetry, with profile line (x–y) for Figure 6. (D) AUV-based SAS imagery. (E) AUV-based photo mosaic. Striping is due to level differences between individual photos. (F) Single photo from AUV. Note carbonate crusts and gas bubbles.
Step three involved collection and inspection of SAS data with the HUGIN HUS AUV. The SAS micro-bathymetry revealed two areas with irregular relief (Figure 5), where the easternmost area overlaps with the cluster of three flares (Figure 4C). The size of the area was c. 25 m × 50 m. Close inspection of the micro-bathymetry shows that the carbonate field is located in a depression which is up to 40 cm deep, and forms a broad, irregular pockmark (Figure 6). Integration of the micro-bathymetry and the imagery data shows that the irregular relief is caused by uneven flat-lying slabs, being up to 2 m in diameter and with a local relief in the order of 10–20 cm. The western (left) crust field also forms a broad pockmark (depression), and has several small pockmarks within it, forming a composite pockmark (Figure 5). Small circular to slightly elongated pockmarks (less than 5 m wide, and less than 1 m deep) are found in the low-reflectivity soft sediments filling in an iceberg ploughmark (Figure 5, right).
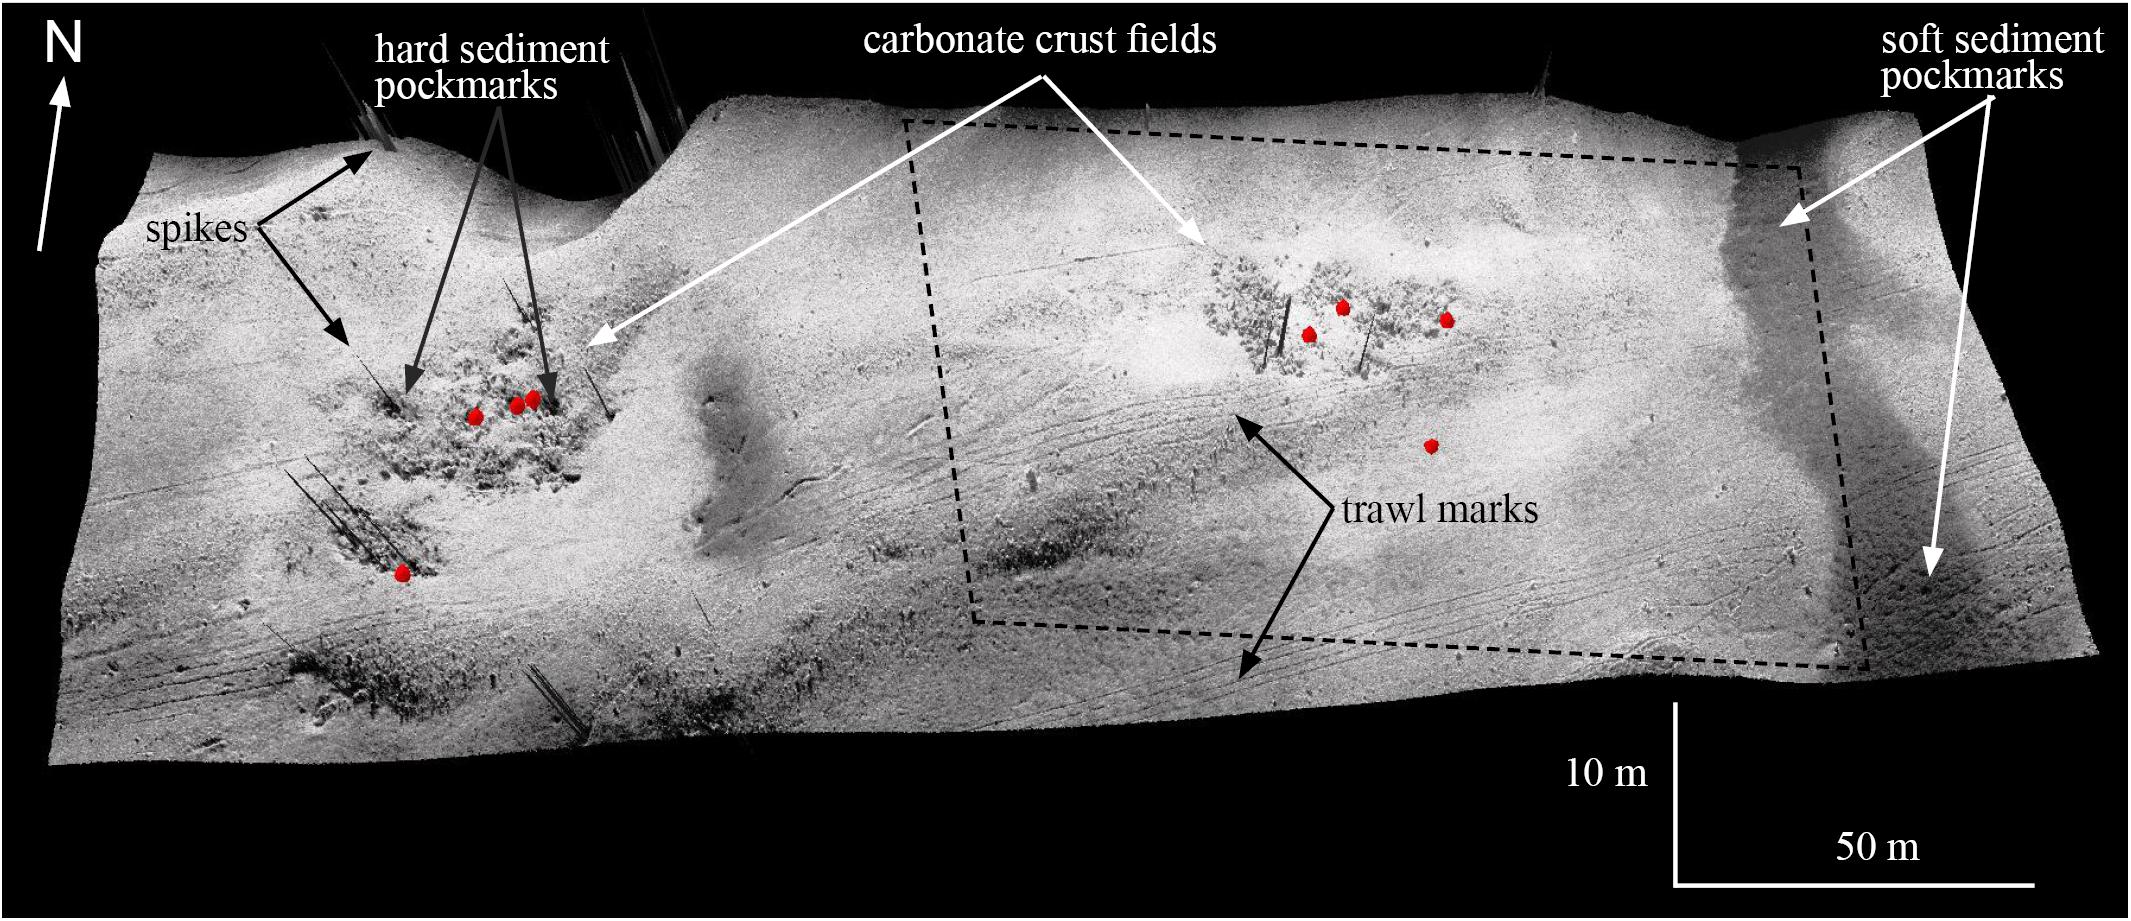
Figure 5. 3D model of a subsection from Area 1, with SAS imagery (high backscatter – lighter tones, low backscatter – darker tones) draped over SAS micro-bathymetry. Carbonate crust fields, gas flares (red dots), trawl marks and pockmarks are evident. Stippled lines show the extent of Figures 4A–E. Vertical exaggeration 5×. Water depth –233 to –227 m.
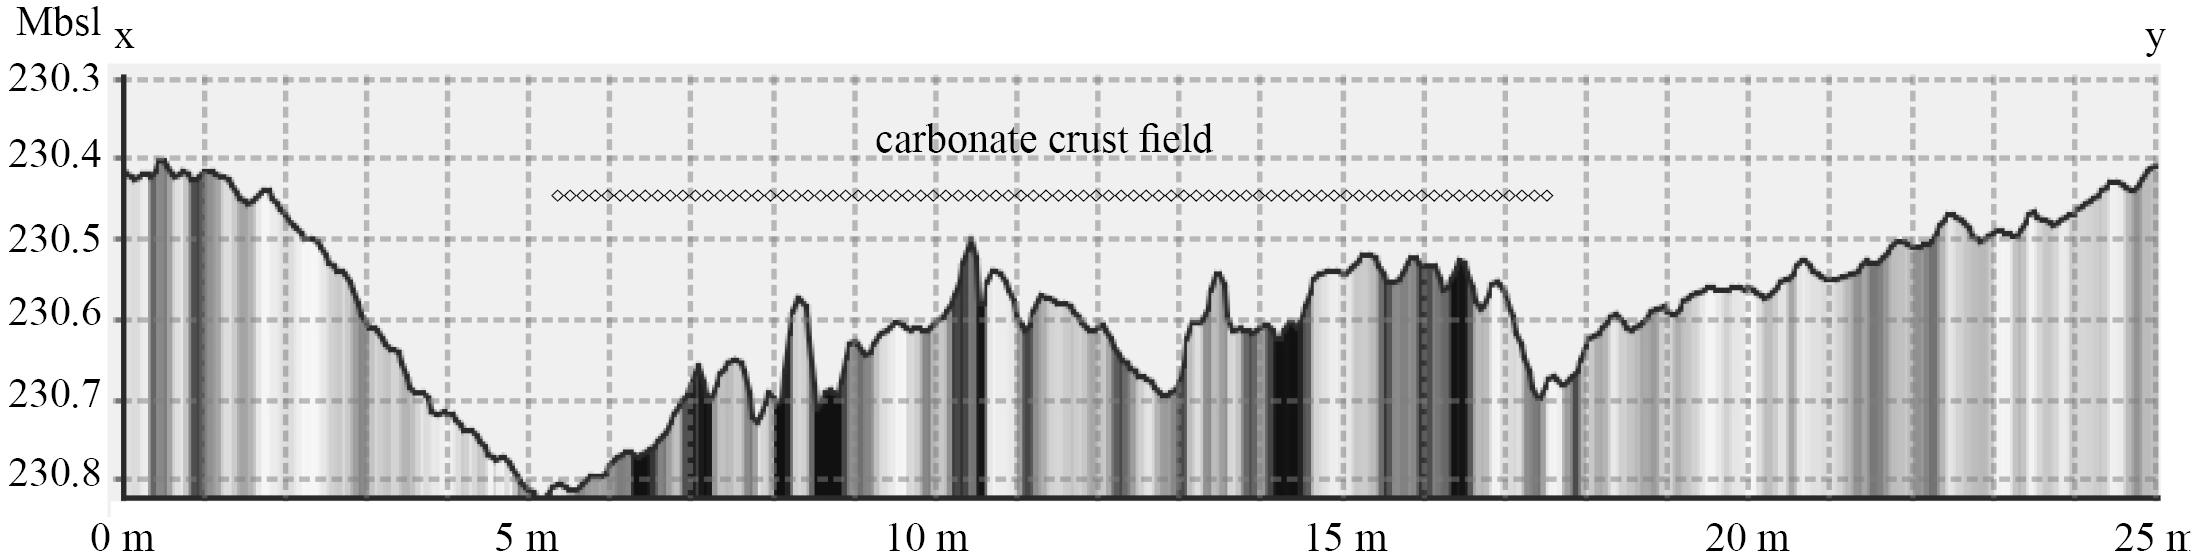
Figure 6. Bathymetric profile across the eastern carbonate crust field in subsection of Area 1 (profile line x–y is shown in Figure 4C). Vertical exaggeration: 10×.
Linear depressions which are more than 150 m long, up to 1 m wide and 15 cm deep can be observed, and are attributed to trawl marks (Figure 4C). Some of the trawl marks are only 2–3 cm deep, but can still be visualized using shaded relief techniques.
The SAS imagery (Figure 4D) shows the authigenic carbonate crust field and the trawl marks, but with a considerably sharper appearance. Individual blocks with a diameter down to 20–30 cm can be observed. An area of low reflectivity can be seen in the right part of the panel, considered to be fine-grained sediments having accumulated in an iceberg ploughmark.
The final stage involved collection of black and white photos using the TFish system, and a mosaic of all photos is shown in Figure 4E. The photos (e.g., Figure 4F) allowed identification of seabed sediments, authigenic carbonate crusts, gas bubbles and fauna (fish, benthic/sessile macrofauna, i.e., sea anemones etc.). Bacteria mats encrusting rocks, and pipe-shaped stones likely representing past fluid flow conduits that have been filled and lithified by authigenic carbonates (Campbell, 2006) were observed in a several places (Figure 7).
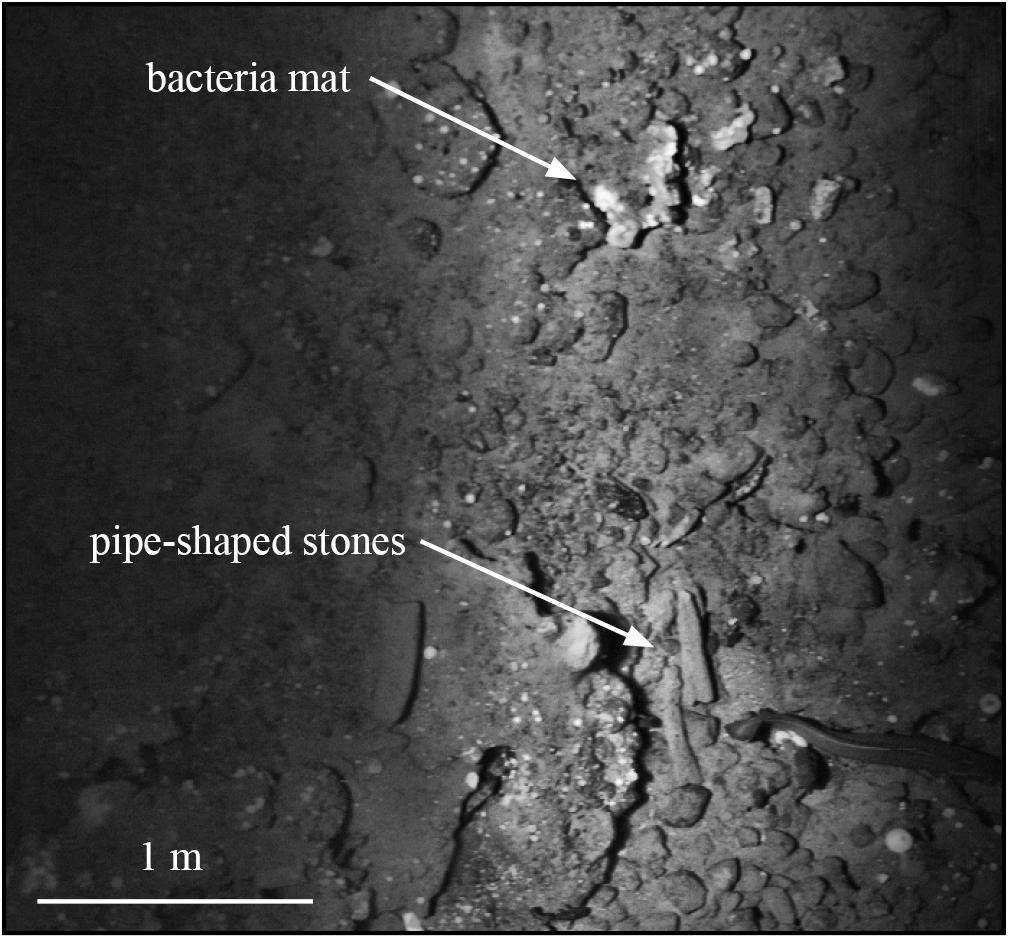
Figure 7. TFish photo showing bacteria mats and pipe-shaped stones likely representing past fluid flow conduits.
Area 2 – Carbonate Crust Fields With Nearly No Gas Flares
Area 2 is located north of the Håkjerringdjupet trough (Figure 3) at water depths between 245 and 305 m. The shipborne bathymetry data from Area 2 and the surrounding area shows an irregular seabed, with numerous iceberg ploughmarks. The ploughmarks are up to 150 m wide, and at least 4 km long. As in Area 1, numerous semi-circular to elongated depressions, up to 200 m long, and 10 m deep were found. These were probably formed when icebergs tipped over and indented the seabed. The backscatter data show highly variable reflectivity, with low reflectivity in the bottom of the iceberg ploughmarks, and the highest reflectivity associated with the berms of the ploughmarks. The overall reflectivity in the area is medium to high, except for an area in the central part, where the reflectivity is low (Figure 8A). According to Bellec et al. (2012), the areas with high reflectivity are dominated by sandy gravel to gravelly sand, while the low reflectivity area is dominated by muddy sand and sandy mud.
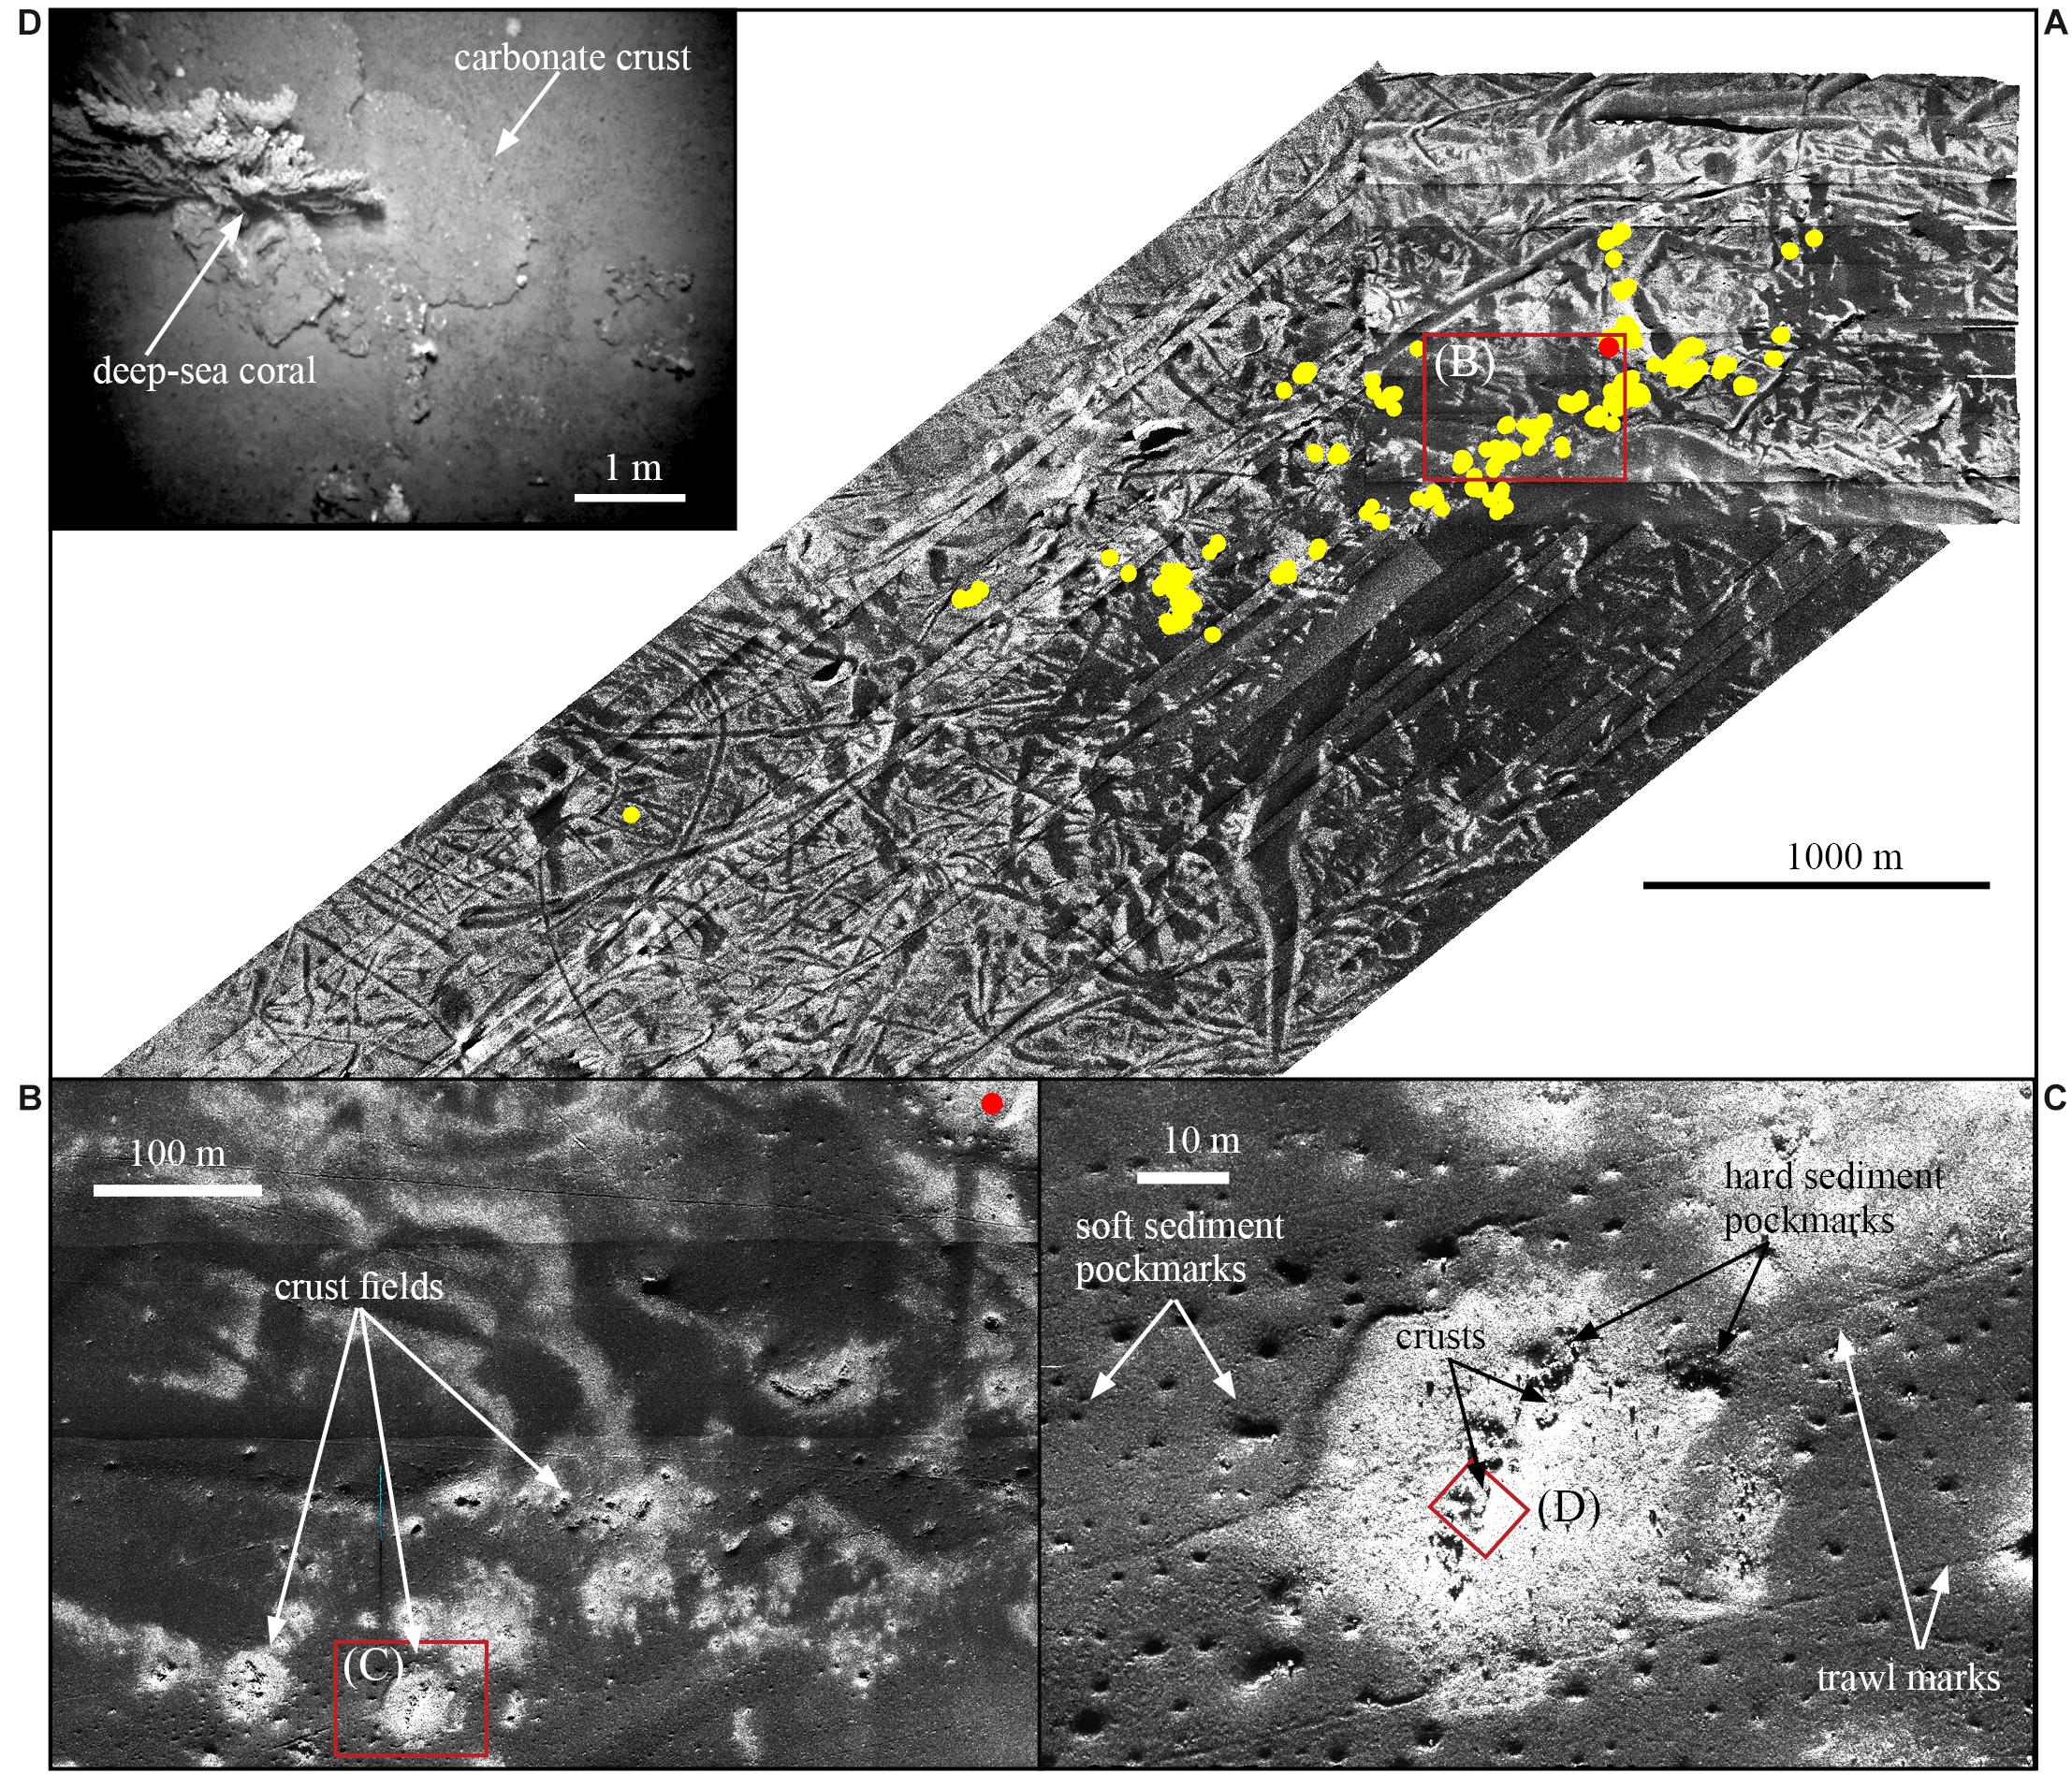
Figure 8. (A) SAS imagery of Area 2 with one gas flare (red dot), carbonate crust fields (yellow dots). High backscatter – light tones, low backscatter – darker tones. Red rectangle shows inset map B. (B) SAS imagery showing carbonate crust fields. Red rectangle shows inset map C. (C) Zoomed in map showing individual crusts, pockmarks and trawl marks. Red rectangle shows photo D. (D) TFish photo of carbonate crusts and a deep-sea coral (possibly Paragorgia).
Only one gas flare was observed in Area 2, while in excess of 100 carbonate crust fields are identified from the SAS imagery (Figure 8A). These fields occur along a WSW-ENE belt which is nearly 3 km long, and up to 500 m wide. The appearance of the carbonate crust fields varies according to the seabed sediments surrounding them. In some places, the carbonate crust fields are developed where soft (muddy) sediments with low reflectivity overlie coarser sediments with high reflectivity, thus forming broad, irregular pockmarks (Figure 8C). Smaller pockmarks developed in hard, high-reflectivity sediments are present. In such places, characteristic sub-circular to irregular high reflectivity zones up to 50–100 m in diameter occur around the carbonate crusts (Figures 8B,C). Soft sediment pockmarks up to 10 m in diameter are commonly found in the soft, low-reflectivity sediments surrounding the carbonate crust fields (Figure 8C). Photos of the seabed (Figure 8D) verify that the interpretation of the occurrence of carbonate crusts is correct.
In areas where the substrate is more coarse-grained and the reflectivity is higher, there is little or no acoustic contrast between areas with crusts, and areas without crusts. This is e.g., the case in the northern part of Area 2 (Figure 8A).
The photos from the TFish system reveal that there is locally a high abundance of fish in association with carbonate crusts. Particularly ling cod was abundant, with sizes up to 1.4 m (Figure 9). A number of deep-sea corals were observed, possibly Paragorgia. Sponges and sea anemones were abundant, while no bacteria mats could be identified with certainty. Nor were gas bubbles observed.
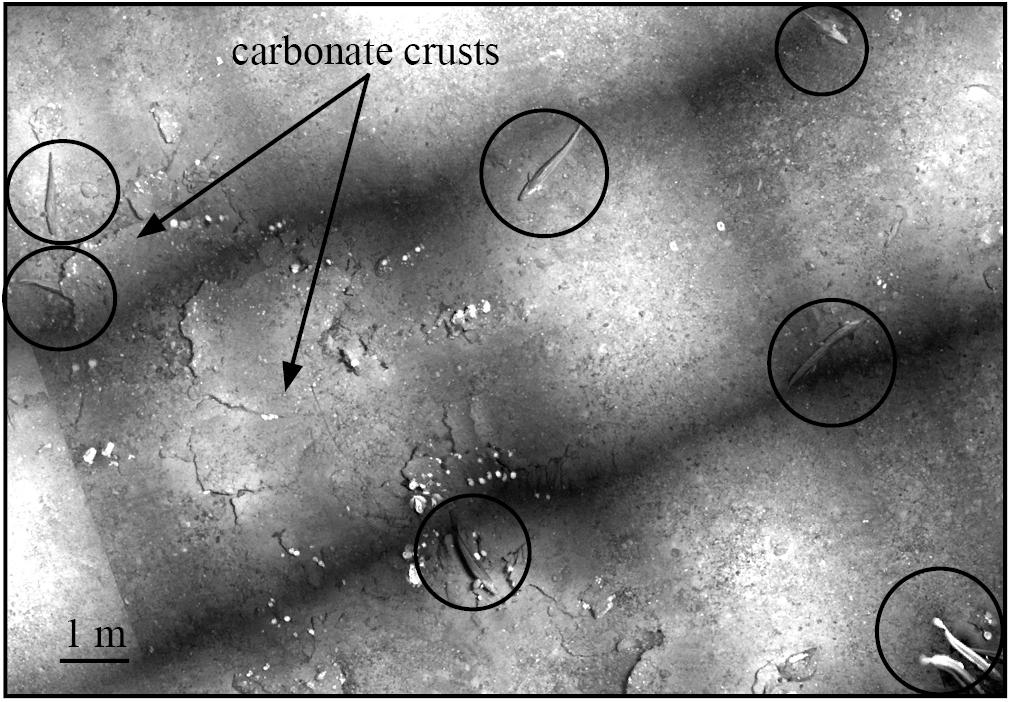
Figure 9. TFish photo mosaic showing carbonate crusts and ling cod up to 1.4 m (in circles).
Discussion
Cold seeps may form distinct geomorphic features on the seabed, and may modify their physical environment by supporting chemosynthetic communities, forming methane-derived authigenic carbonate crusts and displacing sediment due to fluid expulsion (Fisher et al., 2007; León et al., 2007; Paull et al., 2015).
The cold seeps are often associated with a distinctive, anomalous backscatter ‘fingerprint’ on multibeam echosounder data (Johnson et al., 2003), with medium to high backscatter areas often coinciding with pockmarks (Naudts et al., 2008). Similar patterns were recognized by Mitchell et al., 2018, noting that seafloor seeps often appear as anomalous bright red “bloodspots” surrounded by relatively lower backscatter. This “classic” kind of signature is often explained by the occurrence of hard carbonate crusts and/or chemosynthetic fauna, surrounded by fine-grained seafloor sediments (Orange et al., 2002).
This “classic” acoustic signature is not fully representative for the cold seeps reported in this study. In both Area 1 and 2, we noted that the seeps did not make up geomorphic features that could be detected using shipborne multibeam echosounders. Nor was it possible to observe the bright spots commonly observed in deeper waters with muddy sediments. This can be explained by the higher backscatter variation commonly found in areas where the seabed has been sculptured by glacial processes, and partly covered by hemipelagic sediments in post-glacial times.
Pockmarks are abundant in both areas. Relatively small pockmarks, less than 10 m wide, are found in low-reflectivity soft sediments. This kind of pockmark is commonly found in the Barents Sea (Chand et al., 2016). Pockmarks developed in hard, high-reflectivity sediments are far less common. We observe them in conjunction with the carbonate crust fields, forming broad irregular depressions, with smaller pockmarks inside them. These composite pockmarks are interpreted to indicate substantial gas expulsion.
Micro-bathymetry from Area 1 indicates that substantial volumes of sediments have been removed since the formation of the crusts. The SAS imagery shows a 0–20 m wide zone of higher reflectivity around the carbonate crusts. We interpret this to indicate that diffuse flow occurred and removed the more fine-grained part of the sediment, increasing the reflectivity of the sediment. Alternatively, it could be due to cementation of the sediment caused by a diffuse flow which was not sufficiently strong to produce discrete carbonate crusts. The occurrence of pipe-shaped stones in the crust field, interpreted to represent mineralized fluid conduits in the uppermost plumbing system (e.g., Campbell, 2006; Zwicker et al., 2015), indicates a focused fluid flow regime.
In Area 2, we observe two acoustic signatures associated with the carbonate crusts. In the first case, carbonate crusts are found in the central parts of pockmarks surrounded by sub-circular to irregular high reflectivity zones, with a sharp or gradual transition to surrounding fine-grained low reflectivity sediments. In this case no crusts have been observed in this high-reflectivity zone outside the central parts, and the reflectivity is equivalent to or slightly higher than the coarse-grained sediments not associated with carbonate crusts. We interpret this mainly to be a result of focused fluid flow in the central parts, and diffuse fluid flow in the remaining part, removing a thin layer of fine-grained low reflectivity sediments. Removal of finer sediment particles and/or cementation as in Area 1 may also have contributed to this signature. The second case is found in the northern parts of Area 2 where there are little or no fine-grained sediments. There is hardly any contrast with respect to reflectivity between the crusts and the surrounding sediments. Since the crusts and the surrounding sediments have nearly the same reflectivity, backscatter cannot be used as a guide for locating the carbonate crusts.
Whitish mats of putative sulfide oxidizing bacteria are frequently observed on the TFish photos from Area 1, indicating that seepage is a continuous or at least semi-continuous process. Furthermore, four gas flares were detected overlapping or in close vicinity of the small carbonate crust field. In contrast, only one gas flare was detected in Area 2 where over 100 carbonate crust fields in a comparable size are found. This can be result of diurnal seepage variations since the area was surveyed only once. However, no bacteria mats were observed in the TFish photos from Area 2, suggesting that seepage has largely ceased in this area.
Seabed with high rugosity and hard grounds associated with cold seeps is known to influence the habitat suitability for sessile fauna (Wilson et al., 2007; Barrie et al., 2011; Levin et al., 2015). Abundant ling cod, anemones, sponges and deep-sea corals are found in both areas. We have not done a systematic recording of the fauna within and outside the crust fields. However, our impression is that the abundance is significantly higher within the crust fields. Furthermore, we do not observe any obvious difference in terms of fauna abundance between Area 1 and 2 except for the bacteria mats present in Area 1, and absent in Area 2. This indicates that the 3D hard ground structure provided by the carbonate crusts plays an important role as habitat, and has an important ecological function, regardless of the fluid flow.
Conclusion
A nested approach for detecting and describing cold seep habitats associated with authigenic carbonate crusts has been successfully applied in the Håkjerringdjupet region on the continental shelf in the southwestern part of the Barents Sea. More than 210 gas flares from an area of 3775 km2 were identified from analysis of water column data using a shipborne multibeam echosounder. Application of the HiSAS 1030 SAS mounted on a HUGIN AUV yielded imagery and micro-bathymetry data sets which allowed detection of carbonate crust fields based on expert pattern recognition. The presence of carbonate crust was verified by TFish photos from selected locations.
The study demonstrates that cold seep habitats with carbonate crusts may be associated with active gas flares as in Area 1, or may represent extinct or dormant gas seepage fields as in Area 2. In both cases, the main phase of crust formation likely took place shortly after the last deglaciation.
The “classic” acoustic signature of cold seeps reported from many previous studies is not fully representative for the cold seeps considered here. It is evident that the nature of the sediments hosting the carbonate crusts have a strong influence on the acoustic signature. In regions where the seabed has been formed by a complex interplay between glacial processes and hemipelagic sedimentation, the resulting seabed will often have a highly variable backscatter intensity and irregular morphology. In such areas, it is necessary to combine shipborne water column data with very high-resolution sensors on autonomous or remotely operated vehicles to detect and to provide a spatial documentation of cold seep carbonate crust habitats.
Data Availability Statement
The datasets generated for this study are available upon request to the corresponding author, with the exception of data collected by AUV for the PL 695 area (eastern part of Area 2).
Author Contributions
TT wrote the article and participated in data collection and interpretation. SC, HB, and AL participated in data collection and interpretation, and have contributed to the manuscript. PL was in charge of data collection and processing, and has contributed to the manuscript.
Funding
This work was supported by the Research Council of Norway through its Centre of Excellence funding scheme for CAGE (grant number 223259). The data used for this publication comes from a cooperative project between the Geological Survey of Norway, Lundin Norway AS and the Norwegian Defence Research Establishment. The project was co-funded by Lundin Norway AS and the Geological Survey of Norway.
Conflict of Interest
HB was employed by company Lundin Norway AS.
The remaining authors declare that the research was conducted in the absence of any commercial or financial relationships that could be construed as a potential conflict of interest.
Acknowledgments
The Norwegian Mapping Authority is thanked for making the multibeam echosounder data available through the MAREANO programme. The reviewers are thanked for their constructive comments.
Footnotes
References
Aloisi, G., Bouloubassi, I., Heijs, S. K., Pancost, R. D., Pierre, C., Sinninghe Damsté, J. S., et al. (2002). CH4-consuming microorganisms and the formation of carbonate crusts at cold seeps. Earth Planet. Sci. Lett. 203, 195–203. doi: 10.1016/S0012-821X(02)00878-6
Andreassen, K., Hubbard, A., Winsborrow, M., Patton, H., Vadakkepuliyambatta, S., Plaza-Faverola, A., et al. (2017). Massive blow-out craters formed by hydrate-controlled methane expulsion from the arctic seafloor. Science 356, 948–953. doi: 10.1126/science.aal4500
Barrie, J. V., Cook, S., and Conway, K. (2011). Cold seeps and benthic habitat on the Pacific margin of Canada. Cont. Shelf Res. 31, S85–S92. doi: 10.1016/j.csr.2010.02.013
Bellec, V., Picard, K., Bøe, R., Thorsnes, T., Rise, L., Dolan, M., et al. (2012). Geologisk havbunnskart, Kart 70301800. Trondheim: Norges geologiske.
Bünz, S., Polyanov, S., Vadakkepuliyambatta, S., Consolaro, C., and Mienert, J. (2012). Active gas venting through hydrate-bearing sediments on the vestnesa ridge, offshore w-svalbard. Mar. Geol. 33, 189–197. doi: 10.1016/j.margeo.2012.09.012
Campbell, K. A. (2006). Hydrocarbon seep and hydrothermal vent paleoenvironments and paleontology: past developments and future research directions. Palaeogeogr. Palaeoclimatol. Palaeoecol. 232, 362–407. doi: 10.1016/j.palaeo.2005.06.018
Cathles, L. M., Su, Z., and Chen, D. (2010). The physics of gas chimney and pockmark formation, with implications for assessment of seafloor hazards and gas sequestration. Mar. Pet. Geol. 27, 82–91. doi: 10.1016/j.marpetgeo.2009.09.010
Chand, S., Crémière, A., Lepland, A., Thorsnes, T., Brunstad, H., and Stoddart, D. (2017). Long-term fluid expulsion revealed by carbonate crusts and pockmarks connected to subsurface gas anomalies and palaeo-channels in the central North Sea. Geo-Mar. Lett. 37, 215–227. doi: 10.1007/s00367-016-0487-x
Chand, S., Thorsnes, T., Lepland, A., and Crémière, A. (2015). Pockmarks, gas flares and carbonate crusts and their relation to the tectonic and stratigraphic evolution of the Alvheim and Utsira High areas (North Sea) and the Harstad Basin (SW Barents Sea). NGU Report. 2015 024. Patan: NGU.
Chand, S., Thorsnes, T., Rise, L., Brunstad, H., and Stoddart, D. (2016). “Pockmarks in the SW Barents Sea and their links with iceberg ploughmarks,” in Atlas of Submarine Glacial Landforms:Modern, Quaternary and Ancient, Vol. 46, eds J. A. Dowdeswell, M. Canals, M. Jakobsson, B. J. Todd, E. K. Dowdeswell, and K. A. Hogan (London: Geological Society), 295–296. doi: 10.1144/M46.23
Crémière, A., Chand, S., Sahy, D., Thorsnes, T., Martma, T., Noble, S. R., et al. (2018). Structural controls on seepage of thermogenic and microbial methane since the last glacial maximum in the harstad basin, southwest barents sea, mar. Pet. Geol. 98, 569–581. doi: 10.1016/j.marpetgeo.2018.07.010
Crémière, A., Lepland, A., Chand, S., Sahy, D., Condon, D. J., Noble, S. R., et al. (2016). Timescales of methane seepage on the norwegian margin following collapse of the scandinavian ice sheet. Nat. Commun. 7:11509. doi: 10.1038/ncomms11509
Eldholm, O., Sundvor, E., Myhre, A. M., and Faleide, J. I. (1984). “Cenozoic evolution of the continental margin off Norway and western Svalbard,” in Petroleum Geology of the North European Margin, ed. A. M. Spencer (Berlin: Springer), 3–18. doi: 10.1007/978-94-009-5626-1_2
Fisher, C., Roberts, H., Cordes, E., and Bernard, B. (2007). Cold seeps and associated communities of the gulf of mexico. Oceanography 20, 69–79. doi: 10.5670/ocean
Greinert, J., Bohrmann, G., Suess, E., Paull, C. K., and Dillon, P. W. (2001). “Gas hydrate-associated carbonates and methane-venting at hydrate ridge: classification, distribution and origin of authigenic lithologies,” in Natural Gas Hydrates Occurrence, Distribution and Detection. Geophys. Monogr, Vol. 124, (Washington, DC: AGU), 99–113. doi: 10.1029/gm124p0099
Hovland, M. (2007). Discovery of prolific natural methane seeps at Gullfaks, northern North Sea. Geo-Mar. Lett. 27, 197–201. doi: 10.1007/s00367-007-0070-6
Hovland, M., and Judd, A. (1988). Seabed Pockmarks and Seepages: Impact on Geology, Biology, and the Marine Environment. London: Graham and Trotman.
Hovland, M., Judd, A. G., and Burke, R. A. (1993). The global flux of methane from shallow submarine sediments. Chemosphere 26, 559–578. doi: 10.1016/0045-6535(93)90442-8
Johnson, J. E., Goldfinger, C., and Suess, E. (2003). Geophysical constraints on the surface distribution of authigenic carbonates across the hydrate ridge region. Cascadia Margin. Mar. Geol. 202, 79–120. doi: 10.1016/s0025-3227(03)00268-8
Klaucke, I., Masson, D. G., Petersen, C. J., Weinrebe, W., and Ranero, C. R. (2008). Multifrequency geoacoustic imaging of fluid escape structures offshore costa rica: implications for the quantification of seep processes. Geochem. Geophys. Geosyst. 9:Q04010. doi: 10.1029/2007GC001708
Klaucke, I., Weinrebe, W., Petersen, C. J., and Bowden, D. (2010). Temporal variability of gas seeps offshore New Zealand: multi-frequency geoacoustic imaging of the wairarapa area. Hikurangi margin. Mar. Geol. 272, 49–58. doi: 10.1016/j.margeo.2009.02.009
Laberg, J. S., Andreassen, K., Knies, J., Vorren, T. O., and Winsborrow, M. (2010). Late pliocene–pleistocene development of the barents sea ice sheet. Geologica 38, 107–110. doi: 10.1130/G30193.1
Laberg, J. S., Andreassen, K., and Vorren, T. O. (2012). Late cenozoic erosion of the high-latitude southwestern barents sea shelf revisited. Geol. Soc. Am. Bull. 124, 77–88. doi: 10.1130/b30340.1
León, R., Somoza, L., Medialdea, T., González, F. J., Díaz-del-Río, V., Fernández-Puga, M. C., et al. (2007). Sea-floor features related to hydrocarbon seeps in deepwater carbonate-mud mounds of the Gulf of Cádiz: from mud flows to carbonate precipitates. Geo-Mar. Lett. 27, 237–247. doi: 10.1007/s00367-007-0074-2
Levin, L. A., Mendoza, G. F., Grupe, B. M., Gonzalez, J. P., Jellison, B., Rouse, G., et al. (2015). Biodiversity on the rocks: macrofauna inhabiting authigenic carbonate at costa rica methane seeps. PLoS One 10:e0131080. doi: 10.1371/journal.pone.0131080
Milkov, A. V., and Sassen, R. (2003). Two-dimensional modeling of gas hydrate decomposition in the northwestern gulf of Mexico: significance to global change assessment. Glob. Planet. Change 36, 31–46. doi: 10.1016/s0921-8181(02)00162-5
Mitchell, G. A., Orange, D. L., Gharib, J. J., and Kennedy, P. (2018). Improved detection and mapping of deepwater hydrocarbons seeps: optimizing multibeam echosounder seafloor backscatter acquisition and processing techniques. Mar. Geophys. Res. 39, 323–347. doi: 10.1007/s11001-018-9345-8
Naehr, T. H., Eichhubl, P., Orphan, V. J., Hovland, M., Paull, C. K., and Ussler, W. III. et al. (2007). Authigenic carbonate formation at hydrocarbon seeps in continental margin sediments: a comparative study: Deep Sea Res. Part II: Top. Stud. Oceanogr. 54, 1268–1291. doi: 10.1016/j.dsr2.2007.04.010
Naudts, L., Greinert, J., Artemov, Y., Beaubien, S. E., Borowski, C., and De Batist, M. (2008). Anomalous sea-floor backscatter patterns in methane venting areas. Dnepr paleodelta, NW Black Sea. Mar. Geol. 251, 253–267. doi: 10.1016/j.margeo.2008.03.002
Naudts, L., Greinert, J., Artemov, Y., Staelens, P., Poort, J., Van Rensbergen, P., et al. (2006). Geological and morphological setting of 2778 methane seeps in the Dnepr paleo-delta, northwestern Black Sea. Mar. Geol. 227, 177–199. doi: 10.1016/j.margeo.2005.10.005
Ødegård, Ø, Hansen, R. E., Singh, H., and Maarleveld, T. J. (2018). Archaeological use of synthetic aperture sonar on deepwater wreck sites in skagerrak. J. Archaeol. Sci. 89, 1–13. doi: 10.1016/j.jas.2017.10.005
Orange, D. L., Yuna, Y., Maher, N., Barry, J., and Greene, G. (2002). Tracking California seafloor seeps with bathymetry. Cont. Shelf Res. 22, 2273–2290. doi: 10.1016/S0278-4343(02)00054-7
Panieri, G., Bünz, S., Fornari, D. J., Escartin, J., Serov, P., Jansson, P., et al. (2017). An integrated view of the methane system in the pockmarks at vestnesa ridge, 79°N. Mar. Geol. 390, 282–300. doi: 10.1016/j.margeo.2017.06.006
Paull, C. K., Caress, D. W., Thomas, H., Lundsten, E., Anderson, K., Gwiazda, R., et al. (2015). Seafloor geomorphic manifestations of gas venting and shallow subbottom gas hydrate occurrences. Geosphere 11, 491–513. doi: 10.1130/ges01012.1
Siegert, M. J., Dowdeswell, J. A., Hald, M., and Svendsen, J. I. (2001). Modelling the eurasian ice sheet through a full (Weichselian) glacial cycle. Glob. Planet. Change 31, 367–385. doi: 10.1016/s0921-8181(01)00130-8
Sigmond, E. M. O. (1992). Bedrock Map. Norway and Adjacent Ocean Areas. Scale 1: 3 Mill. Trondheim: Norges geologiske undersøkelse.
Spencer, A. M., Home, P. C., and Berglund, L. T. (1984). “Tertiary structural development of western barents shelf: troms to svalbard,” in Petroleum Geology of the North European Margin, ed. A. M. Spencer (London: Graham and Trotman), 199–210. doi: 10.1007/978-94-009-5626-1_14
Suess, E. (2014). Marine cold seeps and their manifestations: geological control, biogeochemical criteria and environmental conditions. Int. J. Earth Sci. 103, 1889–1916. doi: 10.1007/s00531-014-1010-0
Vorren, T. O., Richardsen, G., Knutsen, S. M., and Henriksen, E. (1991). Cenozoic erosion and sedimentation in the western Barents Sea. Mar. Pet. Geol. 8, 317–340. doi: 10.1016/0264-8172(91)90086-g
Wagner, J. K. S., McEntee, M. H., Brothers, L. L., German, C. R., Kaiser, C. L., Yoerger, D. R., et al. (2013). Cold-seep habitat mapping: high-resolution spatial characterization of the blake ridge diapir seep field. Top. Stud. Oceanogr. 92, 183–188. doi: 10.1016/j.dsr2.2013.02.008
Wilson, M. F. J., O’Connell, B., Brown, C., Guinan, J. C., and Grehan, A. J. (2007). Multiscale terrain analysis of multibeam bathymetry data for habitat mapping on the continental slope. Mar. Geol. 30, 3–35. doi: 10.1080/01490410701295962
Winsborrow, M., Andreassen, K., Hubbard, A., Plaza-Faverola, A., Gudlaugsson, E., and Patton, H. (2016). Regulation of ice stream flow through subglacial formation of gas hydrates. Nat. Geosci. 9, 370–374. doi: 10.1038/ngeo2696
Keywords: cold seep habitat, authigenic carbonate crusts, high-resolution, autonomous underwater vehicle, synthetic aperture sonar, water column backscatter data, gas flares
Citation: Thorsnes T, Chand S, Brunstad H, Lepland A and Lågstad P (2019) Strategy for Detection and High-Resolution Characterization of Authigenic Carbonate Cold Seep Habitats Using Ships and Autonomous Underwater Vehicles on Glacially Influenced Terrain. Front. Mar. Sci. 6:708. doi: 10.3389/fmars.2019.00708
Received: 16 June 2019; Accepted: 04 November 2019;
Published: 26 November 2019.
Edited by:
Vincent Lecours, University of Florida, United StatesReviewed by:
Garrett Mitchell, Fugro, United StatesVeerle Ann Ida Huvenne, National Oceanography Centre, United Kingdom
Copyright © 2019 Thorsnes, Chand, Brunstad, Lepland and Lågstad. This is an open-access article distributed under the terms of the Creative Commons Attribution License (CC BY). The use, distribution or reproduction in other forums is permitted, provided the original author(s) and the copyright owner(s) are credited and that the original publication in this journal is cited, in accordance with accepted academic practice. No use, distribution or reproduction is permitted which does not comply with these terms.
*Correspondence: Terje Thorsnes, terje.thorsnes@ngu.no