 Jean-David Grattepanche
 Laura A. Katz
- 1Department of Biological Sciences, Smith College, Northampton, MA, United States
- 2Program in Organismic and Evolutionary Biology, University of Massachusetts, Amherst, MA, United States
The availability of high-throughput sequencing (HTS) has transformed our understanding of the diversity of microbial eukaryotes (i.e., protists) across diverse habitats. Yet relating this biodiversity to function remains a challenge, particularly in the context of microbial food webs. Here we perform a set of microcosm experiments to evaluate the impact of changing predator and prey concentrations on a marine protist community, focusing on SAR (Stramenopila, Alveolata, and Rhizaria) lineages. We combine an estimate of taxonomic diversity through analysis of SSU-rDNA amplicons with metatranscriptomics, a proxy for function. We assess changes in a community sampled from New England waters with varying concentrations of predators (copepods) and prey (phytoplankton <15 μm in size). The greatest impact observed is on the diversity and function of the small plankton (2–10 μm, nanoplankton) community in the presence of high prey abundance (i.e., bloom conditions). Many SAR taxa in the nanosized fraction decrease with increasing phytoplankton abundance, while ciliates (from both the nano- and microsized fractions) increase. A large number of transcripts and function estimates in the nanoplankton decreased during our simulated phytoplankton bloom. We also find evidence of an interaction between increasing phytoplankton and copepod abundances on the microsized planktonic community, consistent with the hypothesis that phytoplankton and copepods exert bottom-up control and top-down control on the microsized protists, respectively. Together our analyses suggest that community function [i.e., diversity of gene families (GFs)] remains relatively stable, while the functions at the species level (i.e., transcript diversity within GFs) show a substantial reduction of function under bloom conditions. Our study demonstrated that interactions within plankton food webs are complex, and that the relationships between diversity and function for marine microeukaryotes remain poorly understood.
Introduction
Microbes dominate biodiversity and are responsible for key ecosystem functions. They can function as heterotrophs, autotrophs, or mixotrophs, and they can be free-living, parasitic (detrimental for host), or mutualistic (beneficial for host). Thus, microbes have critical roles for other organisms including humans (e.g., microbiome, including gut flora), other animals (e.g., coral), and plants (e.g., mycorrhiza). While we know that microbes are important, we still have only limited knowledge about eukaryotic microbes and their functions (e.g., what are the main factors driving their diversity). This is in contrast to the many tools that have been developed and used to explore the diversity and function of bacteria. Here, we use some of these tools, including metatranscriptomics, and amplicon analyses, to look at the marine planktonic food web and the roles of eukaryotic microbes.
In marine food webs, the importance of microbes for transfer of energy from bacteria to higher trophic levels is well-established [reviewed in Azam et al. (1983), Fenchel (1988), Worden et al. (2015), Edgcomb (2016), and Menden-Deuer and Kiørboe (2016)]. Several studies have characterized the marine plankton diversity on a large scale (e.g., Tara Ocean for plankton in the photic zone, Malaspina for the aphotic zone and others; Irigoien et al., 2004; de Vargas et al., 2015; Pernice et al., 2016) and show a geographical distribution of the plankton related to oceanic basins. Other studies have looked at patterns on a smaller scale (from meters to kilometers; e.g., Grattepanche et al., 2014, 2016a,b; Mousing et al., 2016) and find that distance alone does not explain the patterns of diversity. One of the likely reasons for the mismatch is that these studies assess different processes: studies at smaller scales tend to be more directly impacted by species-specific interactions and functions expressed by each member of the community, while the larger scale studies are designed to look at overall ecosystem processes such as the impact of climate change.
Other studies have looked at species-specific relationships between prey and predators, such as between microzooplankton and phytoplankton or between copepods and microzooplankton. These studies show that microzooplankton such as ciliates and dinoflagellates are efficient grazers of phytoplankton of small size (<10 μm for ciliates and <100 μm for dinoflagellates; e.g. Calbet, 2008; Grattepanche et al., 2011b; Martínez et al., 2017; Schoener and McManus, 2017). Microzooplankton have been described as a better food source for copepods than phytoplankton (Berk et al., 1977; Calbet and Saiz, 2005). The fact that microzooplankton are strongly controlled by copepods (and other mesozooplankton) provides a possible explanation for phytoplankton spring blooms as preferential grazing on microzooplankton by copepods may allow dramatic increase in phytoplankton abundance (e.g., dilution-recoupling hypothesis; Irigoien et al., 2005; Behrenfeld, 2010; Kuhn et al., 2015).
The relationships between phytoplankton, microheterotrophs, and other parts of the community have been studied particularly during bloom events (Rosetta and McManus, 2003; Grattepanche et al., 2011a; Monchy et al., 2012). Based on these analyses, microheterotrophs are assumed to be the primary consumers of phytoplankton of small size, with bacteria playing a negligible role (García-Martín et al., 2017). While still subject to debate, phytoplankton spring blooms have been assumed to be linked to an excess in nutrients at the end of the winter (remineralization by bacteria and upwelling), combined with a lack of control by predators that include heterotrophic protists and higher trophic levels. On the other hand, microheterotrophs are efficient grazers when blooms start to decline (Laws et al., 1988; Archer et al., 2000). As such, questions remain concerning how the community structure and functions change in relation to increasing phytoplankton abundance.
Metatranscriptomics has mainly been deployed to study bacterial functions such as the microbiomes of organisms as diverse as humans (Franzosa et al., 2014) and termites (Tartar et al., 2009), or in marine systems (Gifford et al., 2011) and in response to environmental changes such as oil spills (Mason et al., 2012; Rivers et al., 2013). The studies looking at eukaryotic metatranscriptomes are rare. One reason for this lack of studies is the paucity of databases of eukaryotic gene functions. Current databases contain mainly bacterial functions or functions related to diseases, which result in the majority of the environmental eukaryotic transcripts not being annotated (sometimes >80% of the transcripts cannot be annotated; Damon et al., 2012; Lesniewski et al., 2012; Cooper et al., 2014). To study eukaryotic metatranscriptomes, given the paucity in available microbial eukaryote genomes (reviewed in del Campo et al., 2014), authors have focused on clades with reference genomes such as diatoms (Alexander et al., 2015) and fungi (Bailly et al., 2007).
Here, we use a microcosm approach and high-throughput molecular tools, combining amplicon and metatranscriptomic analyses, to assess the impact of phytoplankton (prey) and copepods (predators) on the rest of the planktonic community. To study protist diversity, we use primers designed to amplify the SAR (Stramenopila, Alveolata, Rhizaria; Grattepanche et al., 2018; Sisson et al., 2018) community as this includes many major marine clades such as dinoflagellates, diatoms, and ciliates. We added phytoplankton (i.e., prey) at three concentrations (5 × 10², 5 × 10³, and 5 × 10⁴ cells mL–1, which mimics marine bloom conditions) and copepods (i.e., predators) at two abundances (5 and 10 copepod L–1). We predict that the microsized heterotrophic plankton (microheterotrophs thereafter) will consume added phytoplankton, resulting in an increase of their contribution (relative abundance), and that copepods will regulate this increase. One part of the community generally ignored in the phytoplankton–microheterotrophs–copepods link are the nanosized plankton. We therefore specifically address the impact of microheterotrophs on small plankton (2–10 μm) and expect (1) strong competition as we add phytoplankton and (2) absence of an impact of copepods on nanosized plankton because they are too small to be efficiently captured.
Materials and Methods
Starting Materials: Community, Phytoplankton, Copepods
The experiments conducted here used a community of microbes sampled in the open water of the Long Island sound in front of the University of Connecticut – Avery Point Campus (41.30° N, 72.06° W) on 15 March 2016. We collected in situ water in four 20 L carboys, filtering first through an 80-μm mesh to remove predators and other large organisms, enabling us to focus on the protist community.
To perform our microcosm experiment, we used four cultures: three phytoplankton (prey) cultures Tetraselmis chui, Isochrysis galbana, and Phaeodactylum tricornutum; and a culture of Acartia tonsa (copepod, predators). The species of phytoplankton used are common in aquaculture application, represented various size, shape, pigment composition, and lineages, and have been used successfully in the past (McManus et al., 2004, 2012; Grattepanche et al., 2019). All phytoplankton were from the culture collection of the National Marine Fisheries Service Laboratory in Milford, CT, United States, and were grown in F/2 medium prior to experiments. The copepods were picked from cultures maintained at the University of Connecticut Department of Marine Sciences. In order to achieve the final concentration of phytoplankton for our microcosm experiment, we concentrated the combined phytoplankton by centrifugation at 3.9 × g to create a stock concentration of 5 × 10⁷ cells mL–1 with the three algae within the same order of magnitude (P. tricornutum was added at 1/5 of the concentration of the two other species). We estimated the culture concentrations under a light microscope.
Experimental Set-Up
We used dialysis tubing to perform our microcosm experiment and incubated samples in a sea table with circulating water from collections sites to minimize impact of isolation, following the approach of Grattepanche et al. (2019). The dialysis tubing is composed of a cellulose membrane that is pervious to molecules <12,000 molecular weight (product D9402, Sigma), allowing for exchange of nutrients during incubation in sea tables. Each microcosm (tied-off dialysis tubing) contained 1 L and was floated in a sea table with continuous in situ seawater circulation as recommended by Capriulo (1982).
To test impact of varying levels of predators and food resources we first pooled our four in situ water samples together, and then divided them back into four carboys of 20 L to which we added: (1) nothing (control; p0), or phytoplankton at (2) 5 × 10² cells mL–1 (p1), (3) 5 × 10³ cells mL–1 (p2), and (4) 5 × 10⁴ cells mL–1 (p3) in final concentration. For each of the carboys, we filled nine microcosms with 1 L of the seawater with (or without) phytoplankton added. For each of the phytoplankton abundance conditions, including controls, we added zero (z0), 5 (z1), or 10 copepods (z2) to triplicate microcosm for each treatment (three sets of dialysis tubing per phytoplankton/zooplankton combination). Based on insights from a preliminary study (Grattepanche et al., 2019), the microcosms were incubated for 3 days and then the total contents of each bag were collected for nucleic acids extractions. We used a 3-day incubation to minimize cascade effects and maximize nano- and microsized plankton impact based on insights from Grattepanche et al. (2019). We also collected duplicates of the initial in situ water sample and the in situ sample plus high phytoplankton abundance added (t0p3) at the beginning of the experiment.
Sampling and Nucleic Acids Extraction
Prior to isolation of nucleic acids, each sample was passed through serial filtration at 80 μm (to remove predators and larger organisms to focus on small protists and avoid some PCR inhibitors) and then collected on 10 (referred to throughout as the microsized fraction) and 2 μm (referred to throughout as the nanosized fraction) filters. We isolated organisms of the entire content of each dialysis bag on polycarbonate filters after size-fractionation, cut filters in two, and isolated DNA and RNA using appropriate kits. The filters do not exactly line up with current definitions of nano- and microplankton, as some have argued picoplankton are up to 3 μm in diameter (Vaulot et al., 2008) while nanoplankton can include species up to 20 μm (Sieburth et al., 1978). We use the terms “microsize” and “nanosize” as the bulk of the lineages caught on our filters likely fall in these sizes classes, the plasticity of species and the irregularity of some body plans all confound the efficiency of filtering.
For the nucleic acid extraction, we cut the resulting filters in half, storing one half for DNA (DNA prep buffer; 100 mM NaCl, Tris-EDTA at pH 8, and 0.5% of SDS) and the other half for RNA [RLT lysis buffer (Qiagen, Germany) plus 10 μL of beta mercaptoethanol per milliliter of RLT lysis buffer as recommended by the manufacturer]. DNA and RNA were extracted using Zymo Research soil extraction kit (Zymo Research, CA, United States) and Qiagen RNeasy (Qiagen, Germany) kits following the manufacturers’ instructions. For the RNA prep, residual DNA was removed using the Turbo DNA-free kit (Invitrogen, CA, United States). This approach (both filtration and extraction) was tested on previous samples and resulted in good DNA/RNA quality (Tucker et al., 2017; Sisson et al., 2018; Grattepanche et al., 2019).
Amplicon Sequencing for Community Composition
The amplicon analyses followed protocols from Grattepanche et al. (2016b) and Sisson et al. (2018). In short, we used a primer set specific of the SSU-rDNA gene of the SAR lineages, which amplified a 150-bp fragment of the hypervariable region V3, to amplify DNAs extracted from filters. As discussed in Grattepanche et al. (2019), these primers amplify almost all known SAR lineages, excepted the highly divergent Foraminifera, which are also removed by our prescreening on 80 μm mesh). The amplification was done with the Q5 polymerase enzyme (NEB, MA, United States) following manufacture’s protocol. PCR products were cleaned using Agencourt AMPure XP beads (Beckman Coulter, CA, United States) and sent to University of Rhode Island Genomics and Sequencing Center for sequencing on an Illumina MiSeq sequencer (2 × 150 cycles). This resulted in a dataset of 7,207,909 reads. The raw reads are available from NCBI under the BioProject PRJNA550423 and the Sequence Read Archive SRP212194.
The Amplicon dataset was analyzed using a pipeline combining third party tools and custom python scripts (Sisson et al., 2018; Grattepanche et al., 2019). We first generated paired-end reads using Paired-End reAd mergeR (Zhang et al., 2013), refined the sequences (removed unpaired sequences; sequences without primers), created an OTU library using SWARM (v 2.1.9; Mahe et al., 2015), refined the OTUs (removed chimeric OTUs, outgroup OTUs, and OTUs with <10 reads), and then assigned taxonomy by tree using a curated SAR SSU-rDNA gene database1. The final step corresponds to the rarefaction, i.e., subsampling a fixed number of reads for each sample to enable comparison. This resulted in a total of 1,148 OTUs corresponding to 3,400,000 rarefied reads (50,000 reads per sample).
To compare the effect of experimental conditions on diversity (i.e., taxonomy), only the OTUs present in two replicates of the same treatment and the same size fraction, and with >5 reads were kept. The reported number of reads for each treatment and size corresponds to the average of the read number among the three replicates, resulting in a total of 277 OTUs. We used this set of OTUs to assess changes between the control and the treatments.
Metatranscriptome for Analyses of Community Function
To characterize expressed eukaryotic genes (i.e., those with polyA tails) we constructed mRNA libraries using TruSeq Stranded mRNA Sample Prep (Illumina, CA, United States) following manufacturer’s protocol. In summary, we isolated RNA using oligo-dT beads, fragmented the transcripts, and synthesized first and second strands of DNA (cDNA). The 3′-end of the fragments was adenylated to avoid ligation to another fragment, the adapters were ligated, and the fragments were amplified using specific PCR (see TruSeq protocol). DNA purifications were performed between each of these steps using Agencourt(r) AMPure XP beads (Beckman Coulter, CA, United States). The remainder of the protocol was performed at the University of Maryland, Baltimore Institute for Genome Sciences. This included library quantification and quality checking with an Agilent Technologies 2100 Bioanalyzer, pooling, and sequencing with an Illumina HiSeq 4000. We used a similar depth of sequencing for all our samples. While this depth of sequencing does not allow access to the lowly expressed transcripts, the use of similar depth of sequencing across samples allowed us to better compare these different samples. This resulted in a dataset of 783,472,526 reads, which are available from NCBI under the BioProject PRJNA550423 and the Sequence Read Archive SRP212194.
The metatranscriptome libraries were assembled using rnaSPAdes (version 3.10.1 with default parameters; Bankevich et al., 2012). We assembled the libraries in three ways: (1) each library independently (replicate set), (2) each triplicate by size fraction (nano- and microsized fractions, separately; treatment set); and (3) all libraries together in order to create a reference database for read number and RPKM calculation (Reads Per Kilobase Million = Reads Per Kilobase of transcript, per Million mapped reads, which is a proxy for gene expression).
As the reference genomes of microbial eukaryotes are still rare (del Campo et al., 2014), we looked at the pattern of conserved gene families (GFs) using PhyloToL (Cerón-Romero et al., 2019), which relies on the classification of GFs determined in OrthoMCL (Li et al., 2003; Chen et al., 2006). The resulting 1,485,323 transcripts were then refined using the “GF assessment for taxa” part of the PhyloToL pipeline (Cerón-Romero et al., 2018, 2019; Maurer-Alcala et al., 2018). In summary, we removed transcripts <200 bp (77,230 transcripts <200 bp), ribosomal DNA (5,699 transcripts matching rDNA gene references), and bacterial (38,305 transcripts matching reference bacterial genomes) contamination, and then binned the remaining sequences in orthologous groups (hereafter OG; proxy for GFs) using OrthoMCL (Li et al., 2003; Chen et al., 2006) as reference (990,632 transcripts did not match our reference GFs).
At this stage, the dataset was composed of 373,457 transcripts. We considered only the transcripts matching an OG with an E-value cutoff of 1e–50 and a coverage of 10 (coverage as calculated by rnaSPAdes; 18,599 transcripts were discarded). This results in a reference dataset composed of 86,951 transcripts representing 5,258 conserved eukaryotic GFs (i.e., OGs from OrthoMCL; Chen et al., 2006) plus a large number of lineage-specific genes. We then decided to remove transcripts from the phytoplankton we added. For this purpose, we isolated transcripts from the added phytoplankton: we removed transcripts that were present in the in situ sample plus high phytoplankton abundance (t0p3) but absent from the in situ samples without added phytoplankton (t0). In this way, we identified 5,159 transcripts from the phytoplankton we added. We also removed the transcripts that were 10 times more expressed in t0p3 than in t0, leading to an additional 158 transcripts. Of the original reference transcripts (generated by combining mRNAs from all treatments), we removed 5,317 transcripts that represent genes expressed by the added phytoplankton, resulting in a refined reference dataset of 81,634 transcripts. We then used Blast2GO to assign gene ontology (GO; Conesa et al., 2005) and eggNOG (Huerta-Cepas et al., 2018) to assign clusters of orthologous groups (COG; Tatusov et al., 2000) and Kyoto Encyclopedia of Genes and Genomes (KEGG) orthology (KO; Kanehisa et al., 2015).
To assess gene expression for the two sets (replicate and treatment sets), we mapped back the reads of each metatranscriptome to the refined reference (all libraries pooled together and refined using PhyloToL) using Seal (Sequence Expression AnaLyzer, version 35.92) implemented in BBmap (Bushnell, 2016). In short, each read was mapped to our reference using a Kmer of 31, and the count was transformed in RPKM to take into account the depth of sequencing for each sample. This software and a custom python script produced a table with the RPKM (read number or gene expression) of each reference transcript present in each of our samples (similar to an “OTU table”).
Statistics
To assess the effect of each treatment on the community composition, we used the Unifrac dissimilarity index (Hamady et al., 2009; Lozupone et al., 2011) and principal coordinates analysis (PCoA). The analyses were performed in R using the Phyloseq (McMurdie and Holmes, 2013) and vegan packages (Oksanen et al., 2007, 2016). We tested the significance of the PCoA axis and factor (phytoplankton or predators) using envfit implemented in vegan, in which the data were randomly permuted 999 times (total of 1,000 datasets) and the random data were compared to the experimental data generated through a fitted regression model. Under the null hypothesis of no relationship between the ordination “axis” scores and the environmental variable, the observed R2-value should be a value among the permuted R2-values. However, if the observed R2 is extreme compared to the permutation distribution of R2 then we can reject the null hypothesis. The proportion of times a randomized R2 from the distribution is equal to or greater than the observed R2 is a value known as the permutation p-value. The same analysis was performed for the metatranscriptomics data using Canberra dissimilarity index (Lance and Williams, 1967).
Differential gene expression was calculated as (1) difference of read number between control and treatment or (2) ratio of RPKM between control and treatment. If the ratio was >1, the transcript was upregulated in the treatment compared to the control; if the ratio was <1, the transcript was downregulated, and we inverted the ratio (e.g., a ratio of 0.5 becomes −2). To be conservative, we only consider up/downregulation when the ratio was larger (or smaller) than 2 (or −2 for downregulation). In addition, we also assessed the OTUs and transcripts significantly up- or down-regulated (log2 fold change with p < 0.05) using DESeq2 package (Love et al., 2014). The transcripts significantly up- and downregulated assessed with DESeq2 matched with our estimates.
Results
Top-Down and Bottom-Up Impact on Community Composition
The diversity of SAR lineages remained relatively constant despite increasing predation pressure and food availability (Figure 1 and Supplementary Figure S1). Because the three replicates were similar overall (Supplementary Figure S1), we pooled replicates to evaluate the impact of treatment and considered only the OTUs (i.e., species) as described in the section “Materials and Methods.” We observed that the number of abundant OTUs (i.e., OTUs with more than 10 reads) varied between 63 and 125 (Figure 1A), and up to 239 OTUs when including the rare (Figure 2). The richness of abundant OTUs showed no clear pattern in response to phytoplankton abundance or copepod density (Supplementary Figure S1). In other words, the perturbations (adding prey and/or predators) did not have a strong impact on the overall diversity of SAR lineages.
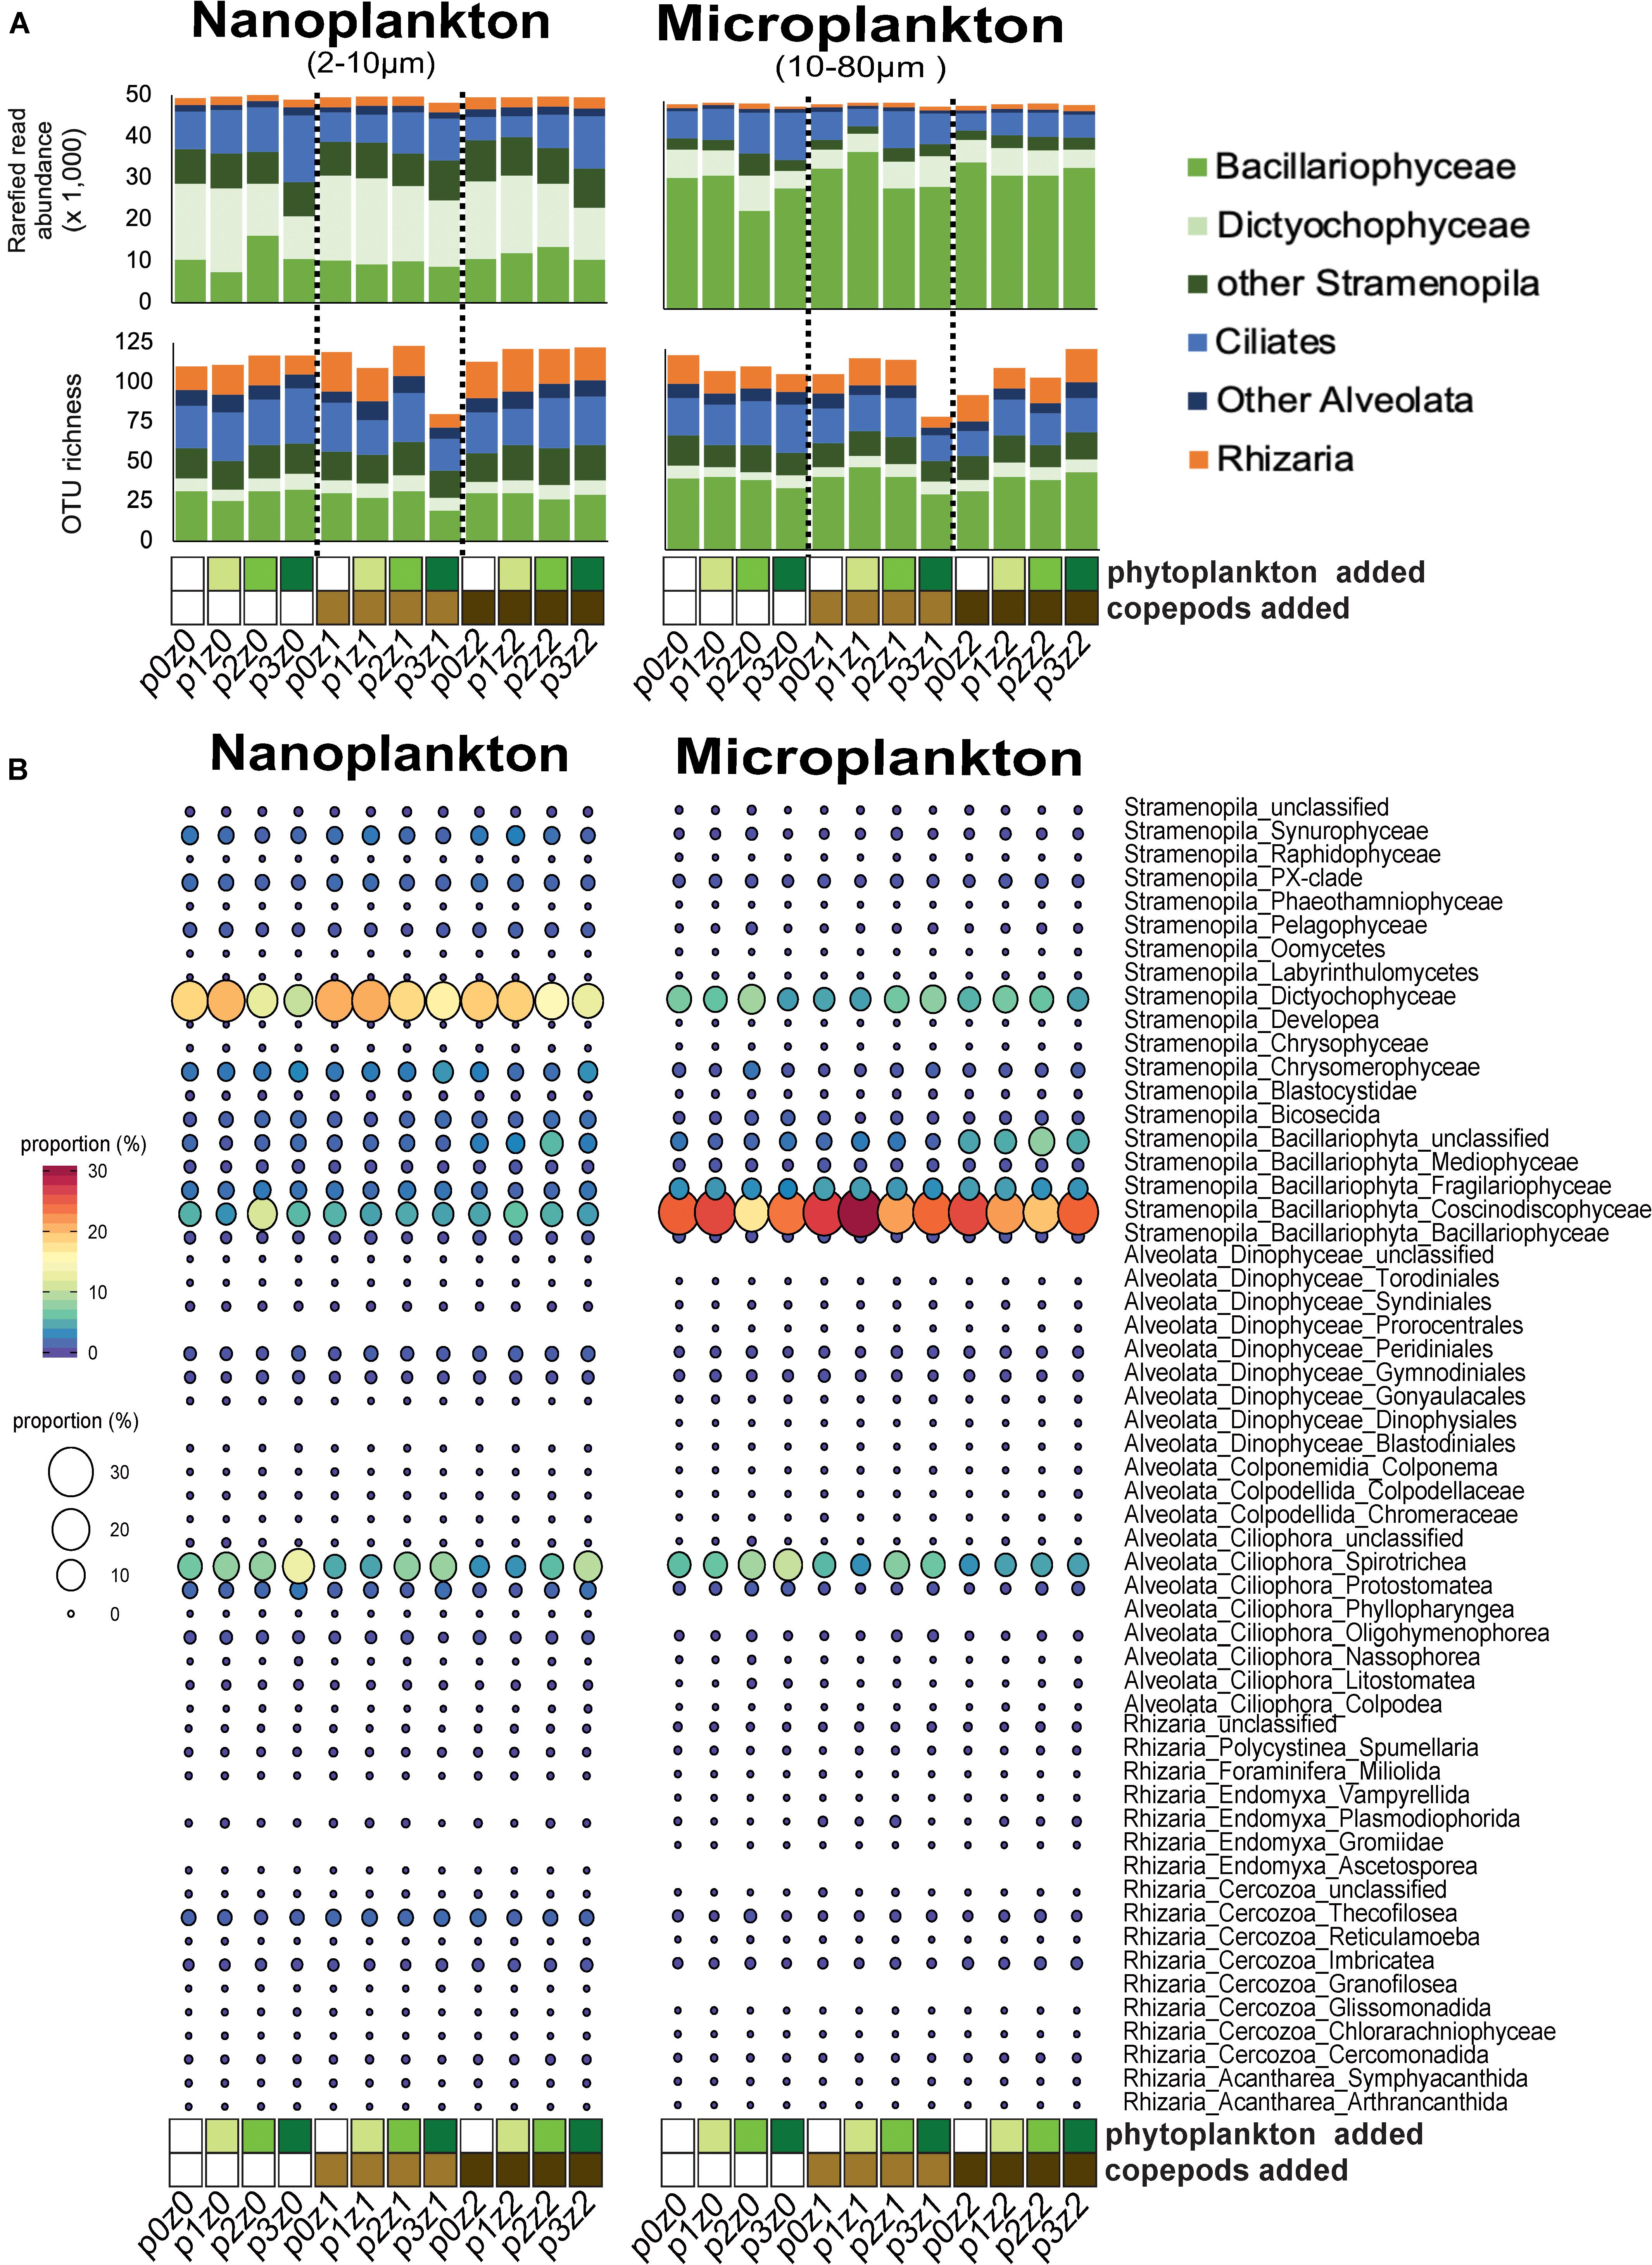
Figure 1. Comparison of community composition based on amplicon analyses (A,B) across treatments within our microcosms. (A) Read and abundant OTU (>10 reads) distributions of SAR (Stramenopila, Alveolata, and Rhizaria) lineages within each treatment show a dominance in different stramenopiles lineages by size fraction (Dictyochophyceae in the nanosize and Bacillaryophyceae in the microsize) and also an high proportion of ciliates and other SAR lineages in both sizes. (B) Proportions of reads at a “family-level” show an increase of spirotrich ciliates with phytoplankton bloom. For all panels, the letter “p” in the sample label represents the abundance of phytoplankton added: none for p0 (white), 5⋅102 cells mL– 1 for p1 (yellow–green); 5⋅103 cells mL– 1 for p2 (light green), and 5⋅104 cells mL– 1 in final concentration for p3 (green). The letter “z” in the label represents the number of copepods added: none for z0 (white), 5 per liter for z1 (light brown), and 10 per liter for z2 (dark brown). For example, p0z0 has no copepods and no phytoplankton added and represents our control; p3z0 was incubated without copepods but in phytoplankton bloom condition.
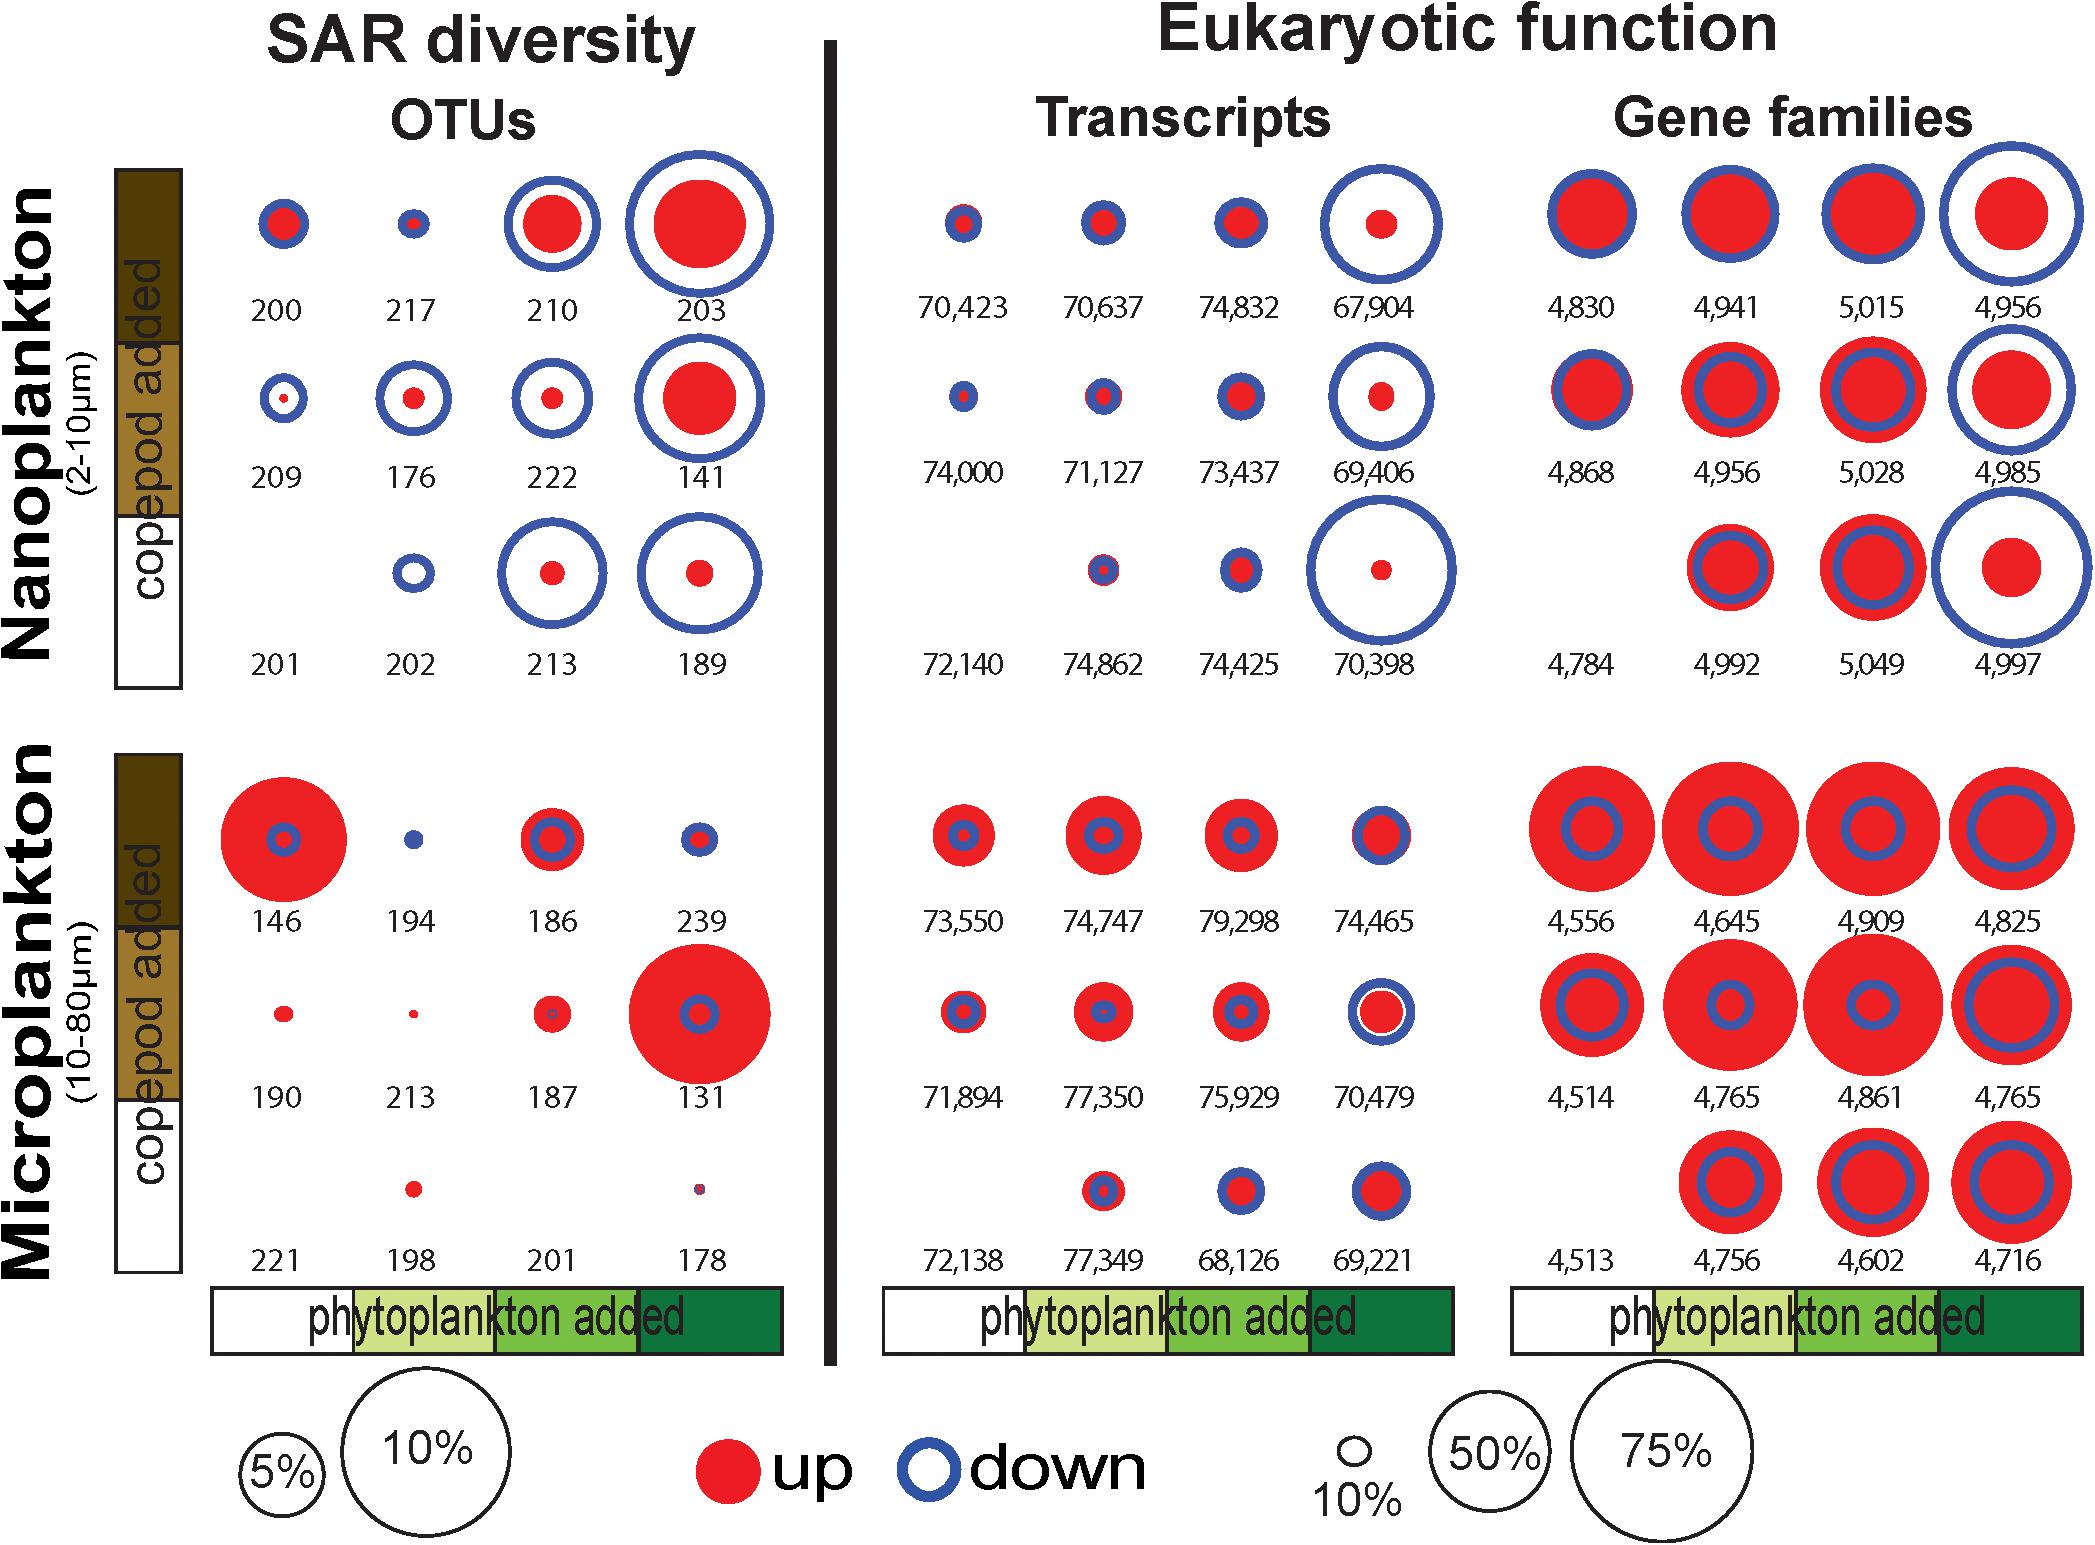
Figure 2. Proportion of OTUs, transcripts, and conserved gene families (GFs) significantly increasing (up) or decreasing (down) in response to the incubation conditions show a large proportion of transcripts and GFs downregulated (up to 70% of the transcripts and GFs) in the nanoplankton with the phytoplankton bloom treatments. OTU, transcripts and GFs were identified with DESeq2 (Love et al., 2014). The numbers represent the total number of OTUs, transcripts, and GFs in the samples.
While the overall diversity did not change within our microcosm, the community composition did respond to the various treatments (i.e., food availability and predation pressure). Overall, up to 10% of the nanosized OTUs significantly decreased in read number with increasing phytoplankton abundance, and up to 5% of the OTUs significantly increased in read number with increasing predation pressure (copepods, Figure 2). By comparison, the microsized plankton community showed a more neutral/stochastic response, with no clear relation with increasing phytoplankton and/or copepods (Figure 2). We also observed that 81% of the community variability is explained by differences between the nanosized and microsized plankton (R2 = 0.7894, p < 0.0001; Supplementary Figure S2).
Among the nanosized community, the contribution of ciliates relative to stramenopiles increased with increasing phytoplankton (i.e., p0z0 vs. p1z0 vs. p2z0 vs. p3z0 showed an increasing contribution of ciliates; Figures 1A,B). The pattern among microsized species was more complex. For instance, ciliates, especially within Spirotrichea, increased with increasing phytoplankton in the absence of predators (Figure 1). However, this effect appears buffered by the increasing copepods as the ciliate contribution was almost constant when incubated with high predation pressure (i.e., 10 copepods L–1) regardless of the concentration of phytoplankton (Figure 1). This suggests that while microsized ciliates responded to the increase of food, the copepod predation was able to keep them at a constant abundance. By comparison, we only observed a slight impact of copepods on nanociliates (Figure 1). In addition, we observed a slight decrease of phytoplankton (mainly Dictyochophyceae and Coscinodiscophyceae; Figure 1B) with increasing phytoplankton and a more mixed response with increasing copepods (Figure 1 and Supplementary Material).
Only a few OTUs, our proxy for species, responded repeatedly and similarly to all treatments. The control [no copepod and no phytoplankton added (p0z0)], the high predation pressure [high copepod abundance and no phytoplankton added (p0z2)], and the phytoplankton bloom incubations [high phytoplankton abundance and no copepods added (p3z0)] shared a quarter of the total OTUs (56 of the 212 OTUs observed in p0z0, in p3z0, and in p0z2; Supplementary Figure S3). The dominant OTUs did not show clear response to our treatments (see Supplementary Material; Supplementary Figure S2). A few OTUs increased or decreased significantly with food availability including OTU302 (closely related to the stramenopile Rhizochromulina) and OTU74 (likely an oligotrich ciliate) or with both food availability and predation pressure such as OTU94 (closely related to the euglyphid Cyphoderia major; Supplementary Figure S4). In the same way, only a third of the OTUs are specific to a size fraction and treatment (70 OTUs; Supplementary Figure S3), and these OTUs represented <1% of the community based on read number.
To assess changes in the overall community, we used PCoA with UniFrac index, which considers phylogenetic relationships among OTUs. Overall, these analyses indicate that predators impacted the microsized SAR community while the phytoplankton changed the nanosized SAR community. Adding copepods significantly impacted the microsized community (phytoplankton R2 = 0.3689, p = 0.2238; copepods R2 = 0.3726, p < 0.05 by envfit test, Figure 3), while phytoplankton addition had a significant impact on nanoplankton (phytoplankton R2 = 0.6446, p < 0.05; copepods R2 = 0.2976, p = 0.1638; Figure 3). Looking at lower taxonomic levels, we observed that Ciliophora, Stramenopila, and within Stramenopila, Dictyochophyceae in the nanosized fraction showed a significant response to phytoplankton treatments, while none of the microsized fraction showed significant response with increasing phytoplankton (Table 1). The copepods seemed to have only impacted the Bacillariophyceae from both nano- and microsized fractions (Table 1).
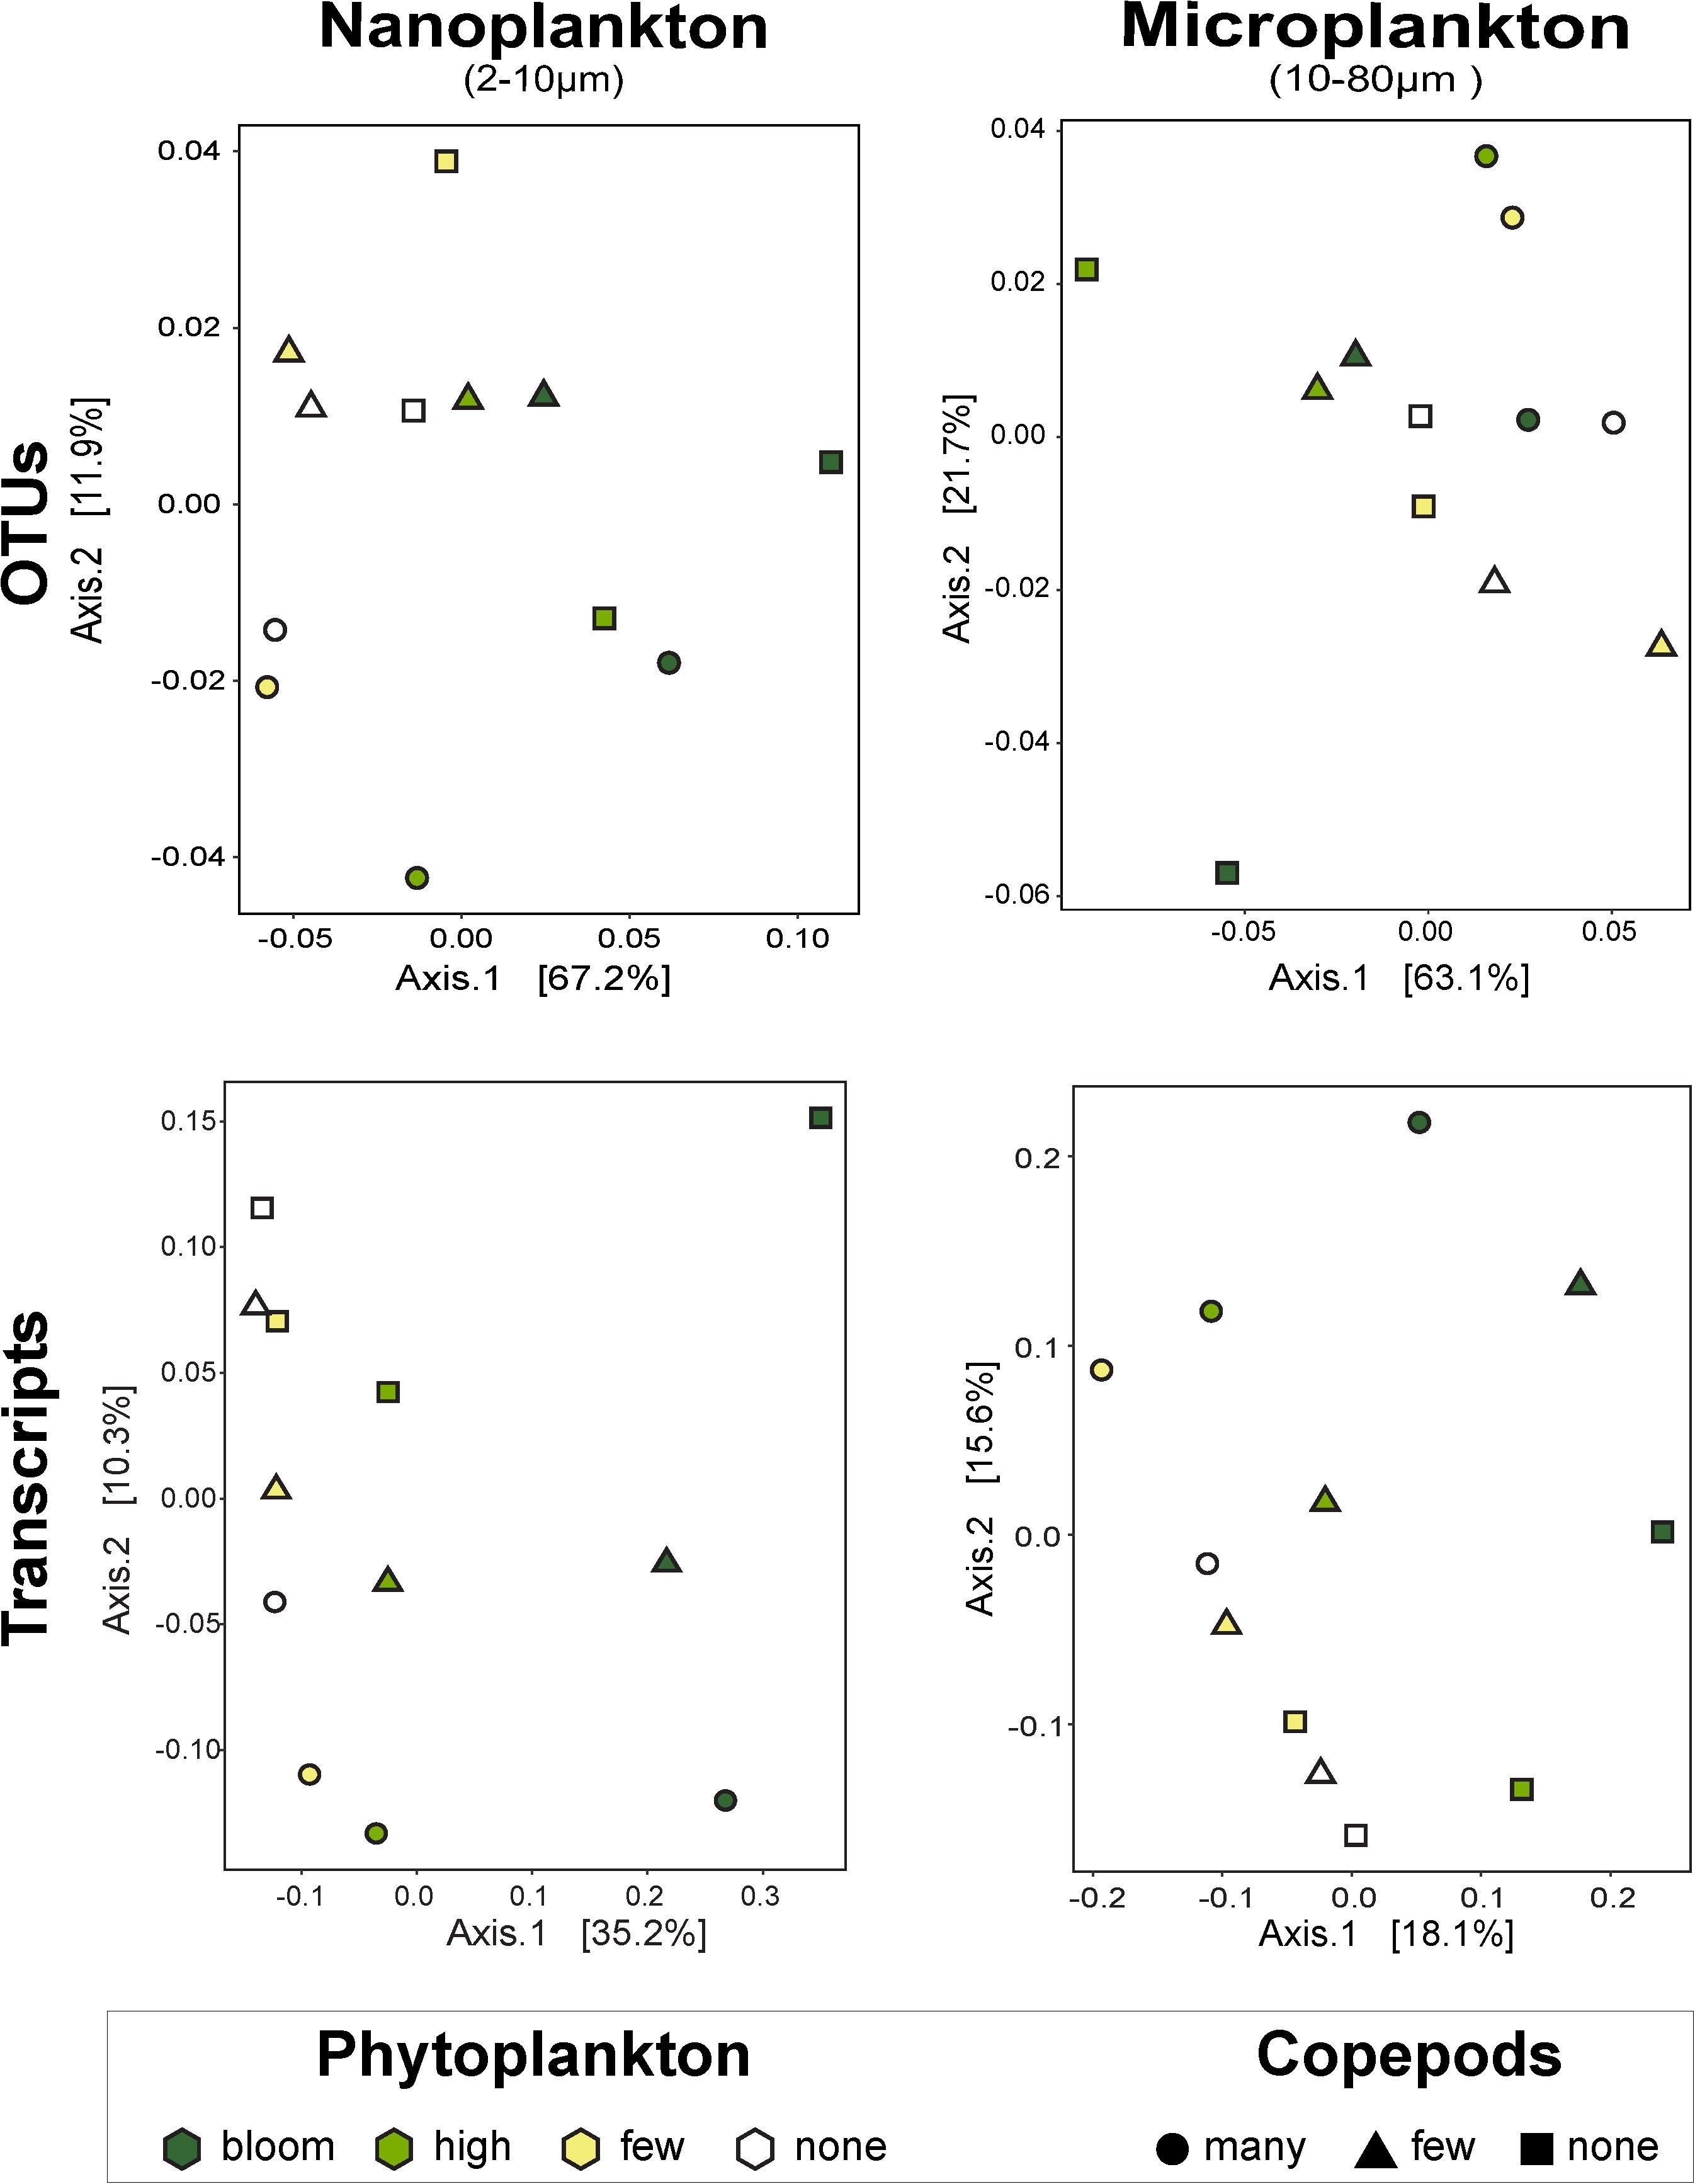
Figure 3. Principal coordinates analysis by size fractions of the impact of phytoplankton and copepods abundance on community composition (i.e., OTUs) and on function (i.e., transcripts). The nanophytoplankton added had the strongest impact on nanosized community. Except for the microsize community composition, there is a clear response to the added phytoplankton, notably at high and bloom abundance. The addition of predators did not show a clear trend. UniFrac dissimilarity index was used for the OTUs and the Canberra dissimilarity index for the metatranscriptome data. The percentages on the axes represent the variability represented by each axis.
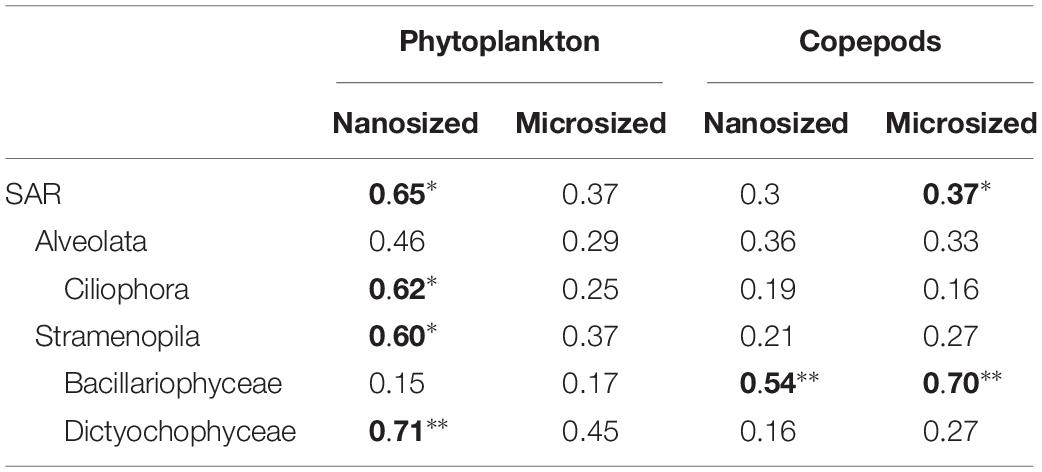
Table 1. Correlation analyses show a significant impact of phytoplankton on nanosized community, while Copepods impacted microsized plankton, and the Bacillariophyceae (significant correlation is in bold: ∗p < 0.05; ∗∗p < 0.01).
Community Function by Metatranscriptomics
Our metatranscriptomics analysis focused on a dataset composed of 81,634 transcripts that match conserved eukaryotic GFs, and represent 13,029 GO terms, 5,176 conserved eukaryotic GFs, and 3,699 KO terms. We evaluated the impact of our treatment on community function using the number of conserved GFs and transcripts at three levels of expression: present, expressed, and highly expressed (>0, >10, and >1,000 as gene expression estimated by RPKM, respectively). The nano- and microsized fractions were composed of a similar number of expressed transcripts (40,667 and 41,369 transcripts, respectively) with half shared in both sizes (21,940 transcripts; see Supplementary Material).
Differential expression profiles showed a clear contrast between the two size fractions, and more intriguingly, a large number of transcripts were downregulated in the nanosized community incubated with phytoplankton at bloom conditions (Figure 4). The nanosized plankton showed up to seven times more downregulated transcripts when incubated in phytoplankton bloom conditions (Figure 4). In addition to transcript number, we also evaluated the impact of our treatments on the community function using three metrics: the number of conserved GFs, GO, and KEGG orthology (KO) terms associated with up- or down-regulated transcripts (Figure 2 and Supplementary Figure S5). Using all of these measures, we again saw a substantial change in nanosized plankton functions (up to 70% of transcripts and conserved GFs were downregulated in bloom conditions; Figures 2, 4 and Supplementary Figure S5), while the impact on microsized plankton was less marked (Figures 2, 4 and Supplementary Figure S5).
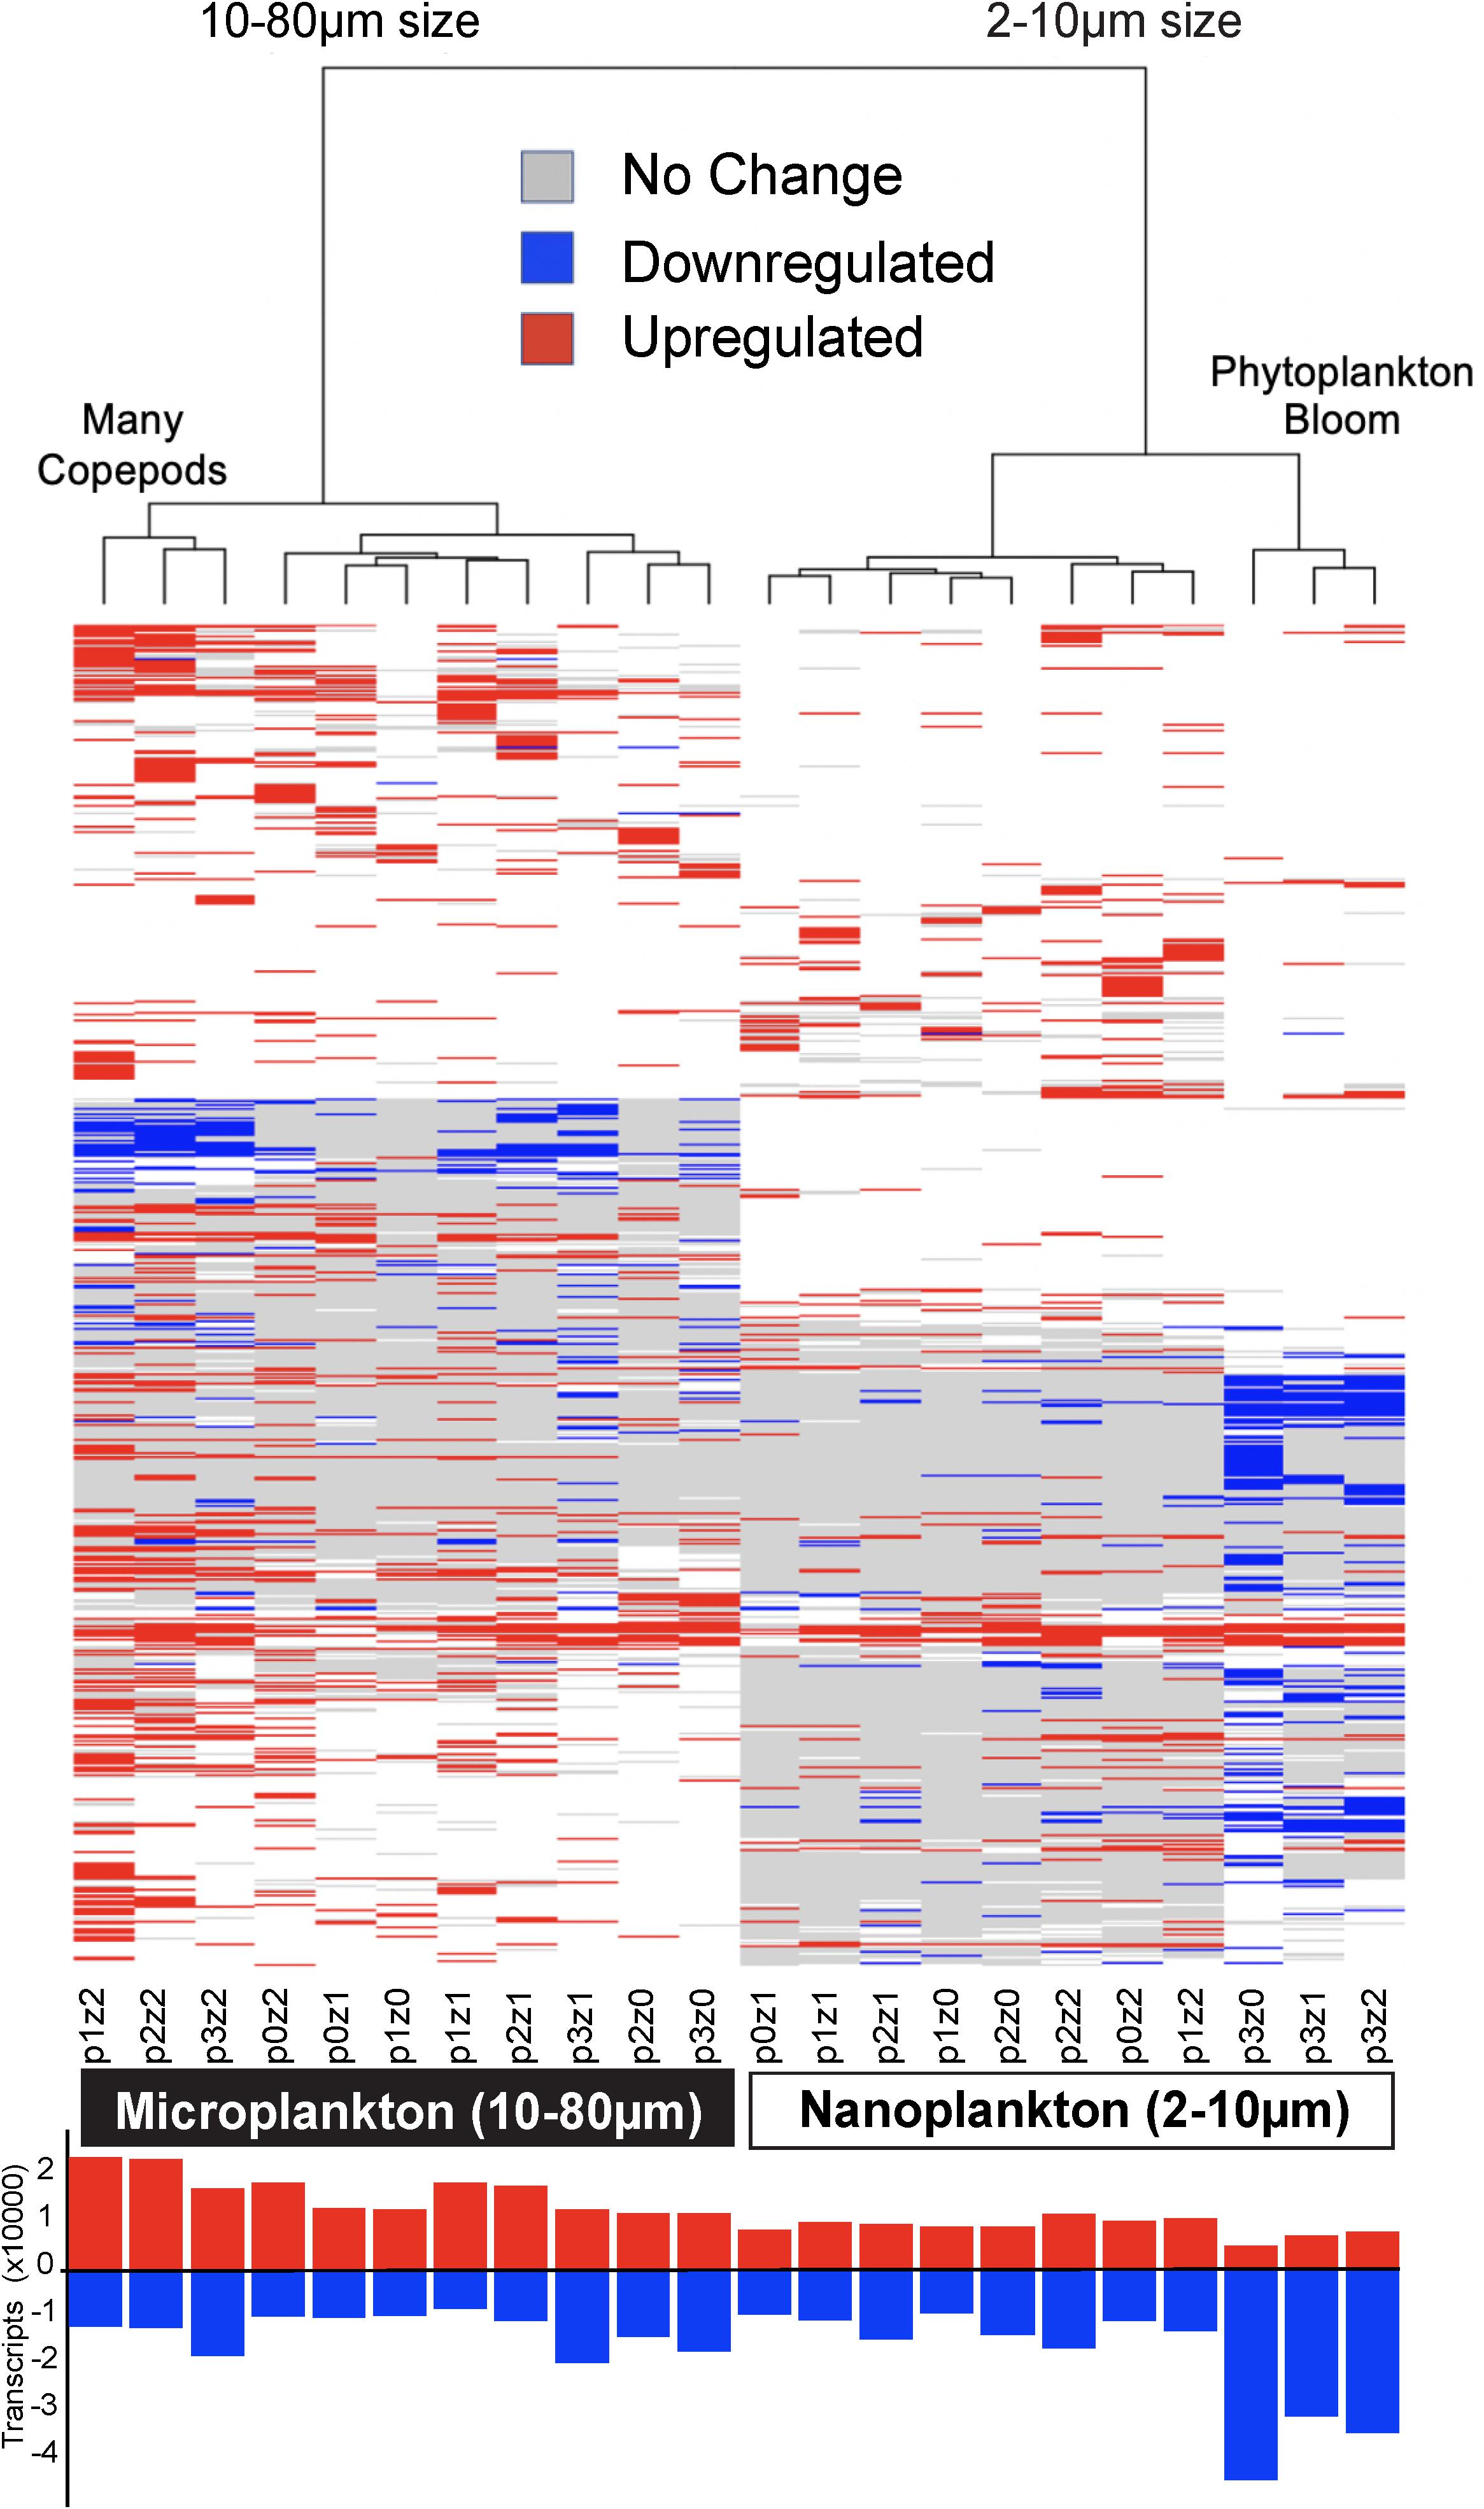
Figure 4. Heatmap of differential gene expression for each of the 81,634 transcripts matching gene families (rows) across treatments (columns). The highest downregulation was in nanosized communities in phytoplankton bloom conditions, while the greatest upregulation was in microplankton with the most copepods. The clustering of the samples is based on Euclidean distance and WardD algorithm. The bar graph at the bottom shows the number of transcripts up or down-regulated (absolute difference to the control higher than log2). See Figure 1 for details about sample labels.
In comparison to the impact of prey abundance (i.e., phytoplankton), the impact of predator density on function was in agreement with our expectations: negligible for the nanosized fraction and leading to an increase in upregulated function in the microsized fraction (Figures 2, 4 and Supplementary Figure S5). Looking in detail at the interactions between phytoplankton bloom and high predation pressure, the increase in copepods density tended to increase the proportion of differentially expressed transcripts (Figures 2, 4 and Supplementary Figure S5). The number of upregulated functions in the microsized plankton increased with the increasing copepod abundance (Figure 2 and Supplementary Figure S5). For both sizes (nano- and microsize), the copepods tended to reduce the proportion of downregulated transcripts and GFs during the phytoplankton bloom incubations (Figures 2, 4 and Supplementary Figure S5). In other words, the impact of copepods seemed to counterbalance the effect of a phytoplankton bloom on the community function and vice versa.
Overall patterns of transcripts assessed by PCoA with a Canberra distance metric showed the same pattern as the SAR amplicon sequencing, i.e., samples grouped firstly by size fraction (nano- and microsized) and then by phytoplankton abundance for the nanosized community (35% of the variance expression; Figure 3). The expression within the microsized community was similarly impacted by phytoplankton and copepods (18 vs. 16% of the variance, Figure 3). This again suggested that while the nanosized plankton was primarily impacted by the change in phytoplankton abundance, the microsized plankton expression profile was a result of interactions between phytoplankton and copepod abundances.
To further assess community function, we assigned transcripts into functional categories using COG. One-third of the gene expression (as measured by RPKM) and one-fifth of the number of transcripts were involved in translation (category COG J). Another 40% of the transcript expression and transcript number was represented by transcripts from post-translational modification and protein turnover (COG O), unknown function (COG S), cytoskeleton (COG Z), energy production and conversion (COG C), and carbohydrate metabolism and transport (COG G). The unknown functions (COG S) included transcripts related to fucoxanthin chlorophyll a/c (55% of the reads for this study) and chlorophyll a/b binding proteins (6% of the read) by similarity.
To evaluate the main functions impacted during our experiments, we pooled the transcripts by COGs and estimated the differential expression in each treatment relative to the control. We observed a downregulation in cytoskeleton mRNA (COG Z in Figure 5) and a slight upregulation in mRNAs involved in translation in the nanosized communities incubated in phytoplankton bloom condition (COG J in Figure 5). The microsized community incubated with many copepods experienced an upregulation of transcripts of unknown function (mainly transcripts related to fucoxanthin chlorophyll a/c by similarity; COG S in Figure 5) and a downregulation of transcripts involved in translation (COG J in Figure 5). The other treatments showed only slight differences and no pattern was discernable between COG and incubation condition.
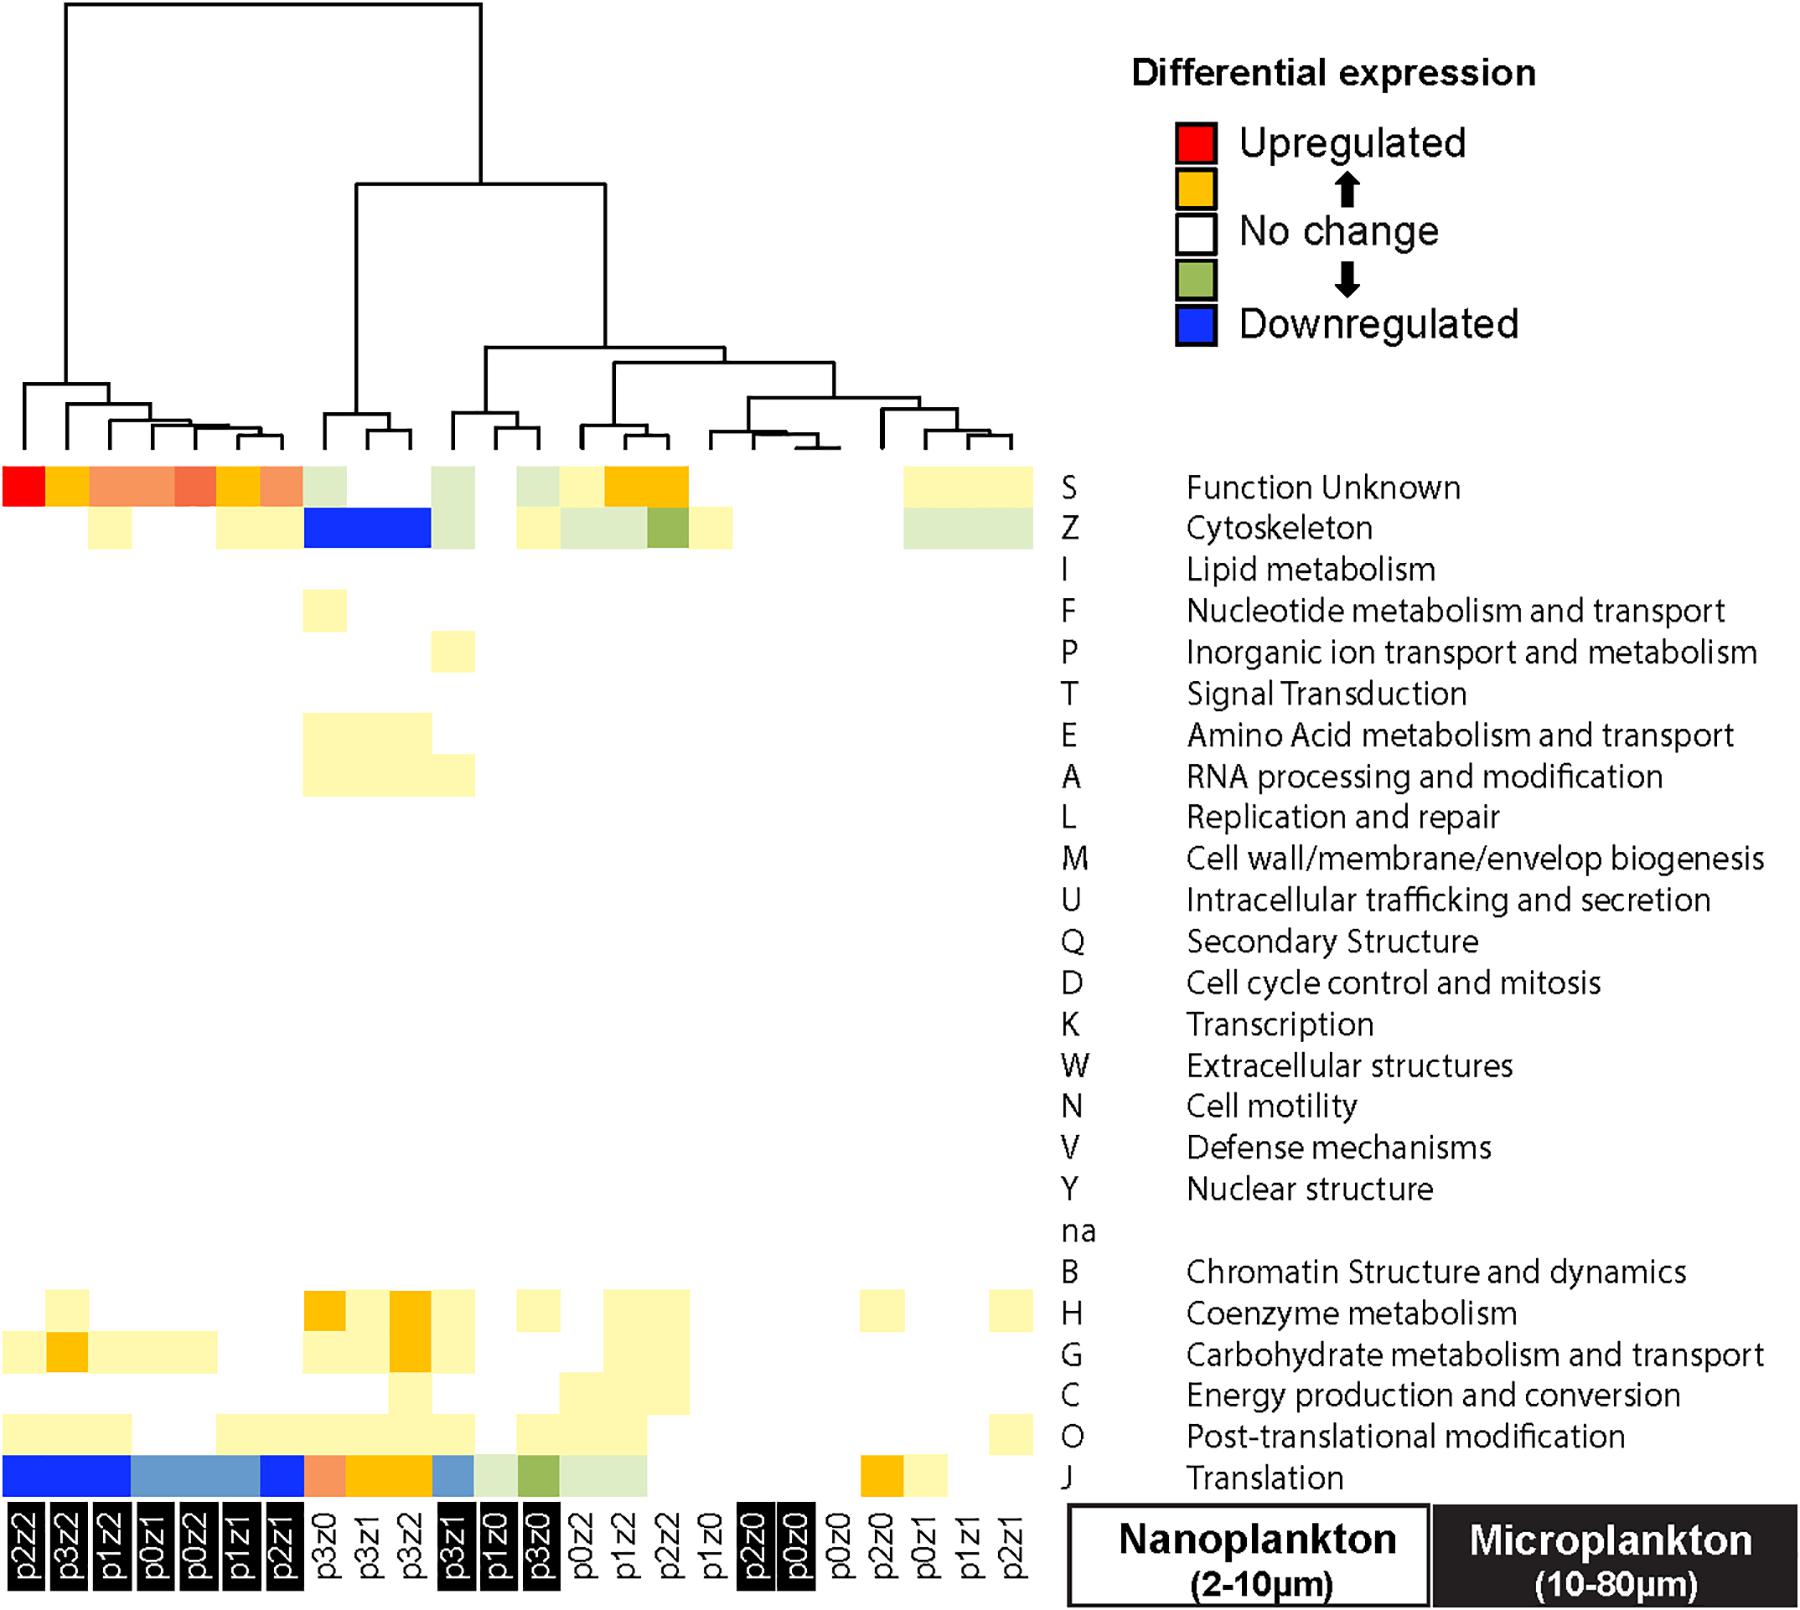
Figure 5. Heatmap of differential gene expression of the transcripts grouped by clusters of orthologous groups (COG) indicates downregulation of transcript expression related to translation (GOG J) in the microsized plankton incubated with copepods, while nanosized plankton show a downregulation of cytoskeleton (COG Z) function incubated with phytoplankton bloom. The microsized plankton show an upregulation of protein with unknown function (COG S, almost all involved in fucoxanthin chlorophyll a/c pathway in our data). The clustering of the samples is based on Euclidean distance and WardD algorithm. See Figure 1 for details about sample labels.
Function and Taxonomy
Phylogenomic analyses indicated that transcripts strongly impacted in our microcosm were from SAR lineages and other phytoplankton (e.g., chlorophyte, cryptophyte, and haptophyte). We generated phylogenies for 11 exemplar genes that showed high diversity (within the top 10 genes for the number of transcripts) and/or high expression (among the top 10 gene for the RPKM), and were annotated in reference databases (e.g., three ribosomal proteins, α and β tubulins, actin, HSP70, chlorophyll a/b binding proteins, and glyceraldehyde-3-phosphate dehydrogenase; Supplementary Figure S6). For each of these genes, SAR represented almost 70% of the transcripts; Stramenopila, Alveolata, and Rhizaria representing approximately 45, 40, and 10% of the highly expressed transcripts, respectively. Other algae (e.g., chlorophytes, haptophytes, and cryptophytes) comprised ∼25% of the highly expressed transcripts, while Opisthokonta, Amoebozoa, and Excavata were represented by <6% of the highly expressed genes (Supplementary Figure S6).
While ciliates clearly responded to increased phytoplankton abundance in amplicon analyses (Figure 1), our taxonomic analyses of some GFs did not find evidence of their impact on the community function. Ciliates contributed up to 30% to some genes including eEF1α (Supplementary Figure S6). However, ciliates did not show any strong response to treatments for this set of genes except a more important contribution to the actin expression in our phytoplankton bloom treatment (Supplementary Figure S6). Other cytoskeleton proteins, such as α-tubulin and β-tubulin, did not show this pattern. We looked at other genes involved in phagosome formation such as ARP complex and RAC as a proxy of phagotrophy (Yutin et al., 2009) and the proteins identified by Burns et al. (2018), but again we did not observe a clear pattern across treatments (Supplementary Figure S7). While this was surprising, it is important to remember that many transcripts (almost 1 million) were not considered here as they were not annotated in databases and instead might represent lineage-specific genes. In other words, the change in function of ciliates may be through lineage-specific genes that lack annotated homologs in current databases.
Discussion
Contrary to our expectation that increasing phytoplankton would have the greatest impact on the microsized heterotrophs (i.e., the potential predators of added phytoplankton), the nanosized community showed the greatest response to bloom levels: we observed an increase of ciliate community members with increasing phytoplankton abundance (Figure 1) and a decrease in community function (i.e., transcript number and expression levels) among the nanosized plankton incubated in bloom condition (Figure 4). The microsized community did respond as predicted, ciliates increased with increasing phytoplankton abundance (i.e., bottom-up control) and the microsized plankton were impacted by increasing copepods (i.e., top-down control). We also demonstrate the power of combining amplicon and metatranscriptomics in microcosm experiments to characterize changes in microeukaryotic communities in response to environmental changes.
Bloom of Phytoplankton and Impact on Other Small Plankton
The nanosized plankton (i.e., 2–10 μm) response to increasing phytoplankton (three species ranging in size from 4 to 15 μm) was unexpected. We added small sized phytoplankton expecting to see an impact on their predators within the microsized (i.e., 10–80 μm) heterotrophs and saw a small increase of microsized ciliates with increasing phytoplankton (Figure 1). In other in situ studies, microheterotroph biomass increased with phytoplankton and nanoplankton were responding to bacteria (Irigoien et al., 2005; Grattepanche et al., 2011a). So, we did not expect to observe an increase of nanosized lineages, assessed by SAR amplicon analyses, incubated in bloom conditions (Figure 1). This suggests that either nanosized lineages (i.e., ciliates) were able to consume prey of similar to their own size or that their response is indirect. For example, it is possible that phytoplankton exudate caused increased growth of bacteria, which are in turn grazed by nanosized ciliates (i.e., more food leading to increased abundance) (Fenchel, 1987). Another possibility is that predators of nanosized ciliate fed selectively on the same size phytoplankton, and therefore relieved predation pressure on these small ciliates (i.e., fewer predators leading to increased abundance).
We evaluate the possibility of lineage-specific changes in predation among nanosized community members by looking at genes involved in phagocytosis. While we observed an upregulation of actin for the nanosized ciliates in bloom condition (Supplementary Figure S6), we did not see an increase in expression for phagotrophic genes such as the ARP complex and RAC GF identified by Yutin et al. (2009) and a longer list of genes identified in two other studies (Burns et al., 2018; McKie-Krisberg et al., 2018; Supplementary Figure S7). These analyses are consistent with an indirect response of nanosized ciliates rather than an increase in grazing in response to added phytoplankton. However, this conclusion needs to be taken with caution as the mechanism of phagotrophy for microbial eukaryotes is still poorly understood (Yutin et al., 2009) and many lineage-specific GFs are likely missing from our database (Cerón-Romero et al., 2019).
Phytoplankton Blooms Reduce Community Function
The transcript number and expression levels for communities incubated in bloom conditions strongly decreased for the nanosized fraction (Figure 4 and Supplementary Figure S5). A decrease of functional diversity is expected when just a few species dominate the ecosystem (i.e., in bloom conditions), but the observed impact on nanosized and not on the microsized plankton is surprising. One possibility is that changes in ecological niche (abiotic and biotic factors) in the phytoplankton bloom conditions might have selected for only a subset of the nanosized species present at the beginning of incubation, resulting in a decrease of expressed function. A decrease of diversity and function has been documented during bloom events for bacterioplankton (Teeling et al., 2012; Wemheuer et al., 2014), but not yet for eukaryotes.
We did see patterns in changes of genes related to photosynthesis and stress. For example, we saw a reduction in expression of transcripts related to photosynthesis (COG S, Figure 5; chlorophyll a/b binding protein; Supplementary Figure S6). In addition, stress-related proteins (e.g., HPS90, HSP70), particularly of phytoplankton groups (e.g., Archaeplastida, Supplementary Figure S6), increased with increased phytoplankton. This suggests a stress among phytoplankton in response to bloom conditions. This is consistent with the observed decrease of SAR phytoplankton (mainly Dictyochophyceae and Coscinodiscophyceae) observed with the increase abundance of added phytoplankton (Figure 1).
The addition of varying levels of phytoplankton impacted the diversity and function of both the nanoplankton and, to a lesser extent, the microsized plankton. As expected for bloom conditions, we observed an amplification of changes in both up- and downregulated transcripts with increasing phytoplankton (Figure 2). However, none of these genes are directly related to phytoplankton blooms based on findings in previous studies (e.g., proteins involved in nutrient metabolism or carbohydrate metabolism; Zhang et al., 2019). We hypothesize that the change in community function is related to changes in metabolism during the extreme conditions generated by the bloom.
Phytoplankton Bloom Is Enhanced by Copepods
The species composition (i.e., OTUs) of the microsized community was impacted by top–down control, but not the functions of the microsized community. We had expected microsized ciliates to increase with phytoplankton concentration as we selected three phytoplankton species (T. chui, I. galbana, and P. tricornutum) considered to be “good” food resources for ciliates (Verity and Villareal, 1986; Stoecker et al., 1988; Christaki and Van Wambeke, 1995; McManus et al., 2012; Schoener and McManus, 2012). Instead, we only observed top–down control of ciliates by copepods, as ciliates represent a superior food resource for copepods and may be selectively grazed (Calbet and Saiz, 2005). Our data are a direct illustration that copepod grazing on microheterotrophs (i.e., ciliates) reduced top–down controls, allowing phytoplankton to increase (Irigoien et al., 2005; Behrenfeld, 2010; Kuhn et al., 2015). While this has been hypothesized from microscopic observations of in situ samples (Irigoien et al., 2005; Leising et al., 2005), here we showed, in our closed system, that ciliates were not able to control the amplitude of a phytoplankton bloom because of the predation pressure from zooplankton (copepods).
Copepods did have a significant impact on microsized phytoplankton community function as photosynthetic activities (e.g., chlorophyll a/b binding proteins) increased with increasing copepod abundance (Figure 5 and Supplementary Figure S6). Copepods have been reported to release dissolved organic carbon and inorganic nutrients through sloppy feeding and fecal pellets (Saba et al., 2011), which may increase phytoplankton production. Together these factors (increase in nutrients and release of predation pressure by feeding on microciliates) may explain the functional changes in microsized community members observed across our experiments.
Conclusion
This work combines experimental microcosms and ’omics approaches (both amplicon and metatranscriptomics) to reveal: (1) phytoplankton blooms strongly decrease gene expression within the nanosized community and (2) copepods control microsized heterotrophs when phytoplankton abundance is low, reducing predation pressure on phytoplankton. We acknowledge a major caveat in interpreting functions within these communities: of the 1.5 million transcripts, we were able to assign taxonomy and function to <25% because of the lack of knowledge about eukaryotic microorganisms. Hence, we anticipate that future studies will be able to further refine insights on functional responses through analyses of specific genes. Nevertheless, the strong decrease of transcript diversity showed the impact of phytoplankton blooms and zooplankton grazing at the species level, while the overall community functions (i.e., number of GFs, KO, and GO) remained unchanged. This illustrates the resilience of the community in maintaining ecosystem functions. Finally, these analyses show the power of combining amplicon and metatranscriptomics approaches to better understand processes driving microeukaryotic diversity and function in marine systems.
Data Availability Statement
The datasets generated for this study can be found in the NCBI under the BioProject PRJNA550423 and the Sequence Read Archive SRP212194.
Author Contributions
J-DG and LK conceived and designed the experiments, and wrote the manuscript. J-DG performed the experiments and analyzed the data.
Funding
This work was supported by the National Science Foundation (OCE-1436003, OCE-1924570 and DEB-1541511 to LK) and Blakeslee Funds at Smith College.
Conflict of Interest
The authors declare that the research was conducted in the absence of any commercial or financial relationships that could be construed as a potential conflict of interest.
Acknowledgments
We thank the University of Rhode Island Genomics and Sequencing and the IGS Genome Resource Center at the University of Maryland for MiSeq and HiSeq4000 sequencing; the National Marine Fisheries Service Lab (NOAA) in Milford, CT, United States, for algal cultures, and the Dam Lab at UCONN for copepods. We also thank George B. McManus (University of Connecticut) for the help with the experimental setup.
Supplementary Material
The Supplementary Material for this article can be found online at: https://www.frontiersin.org/articles/10.3389/fmars.2019.00818/full#supplementary-material
Footnotes
References
Alexander, H., Jenkins, B. D., Rynearson, T. A., and Dyhrman, S. T. (2015). Metatranscriptome analyses indicate resource partitioning between diatoms in the field. Proc. Natl. Acad. Sci. U.S.A. 112, E2182–E2190. doi: 10.1073/pnas.1421993112
Archer, S. D., Verity, P. G., and Stefels, J. (2000). Impact of microzooplankton on the progression and fate of the spring bloom in fjords of northern Norway. Aquat. Microb. Ecol. 22, 27–42. doi: 10.3354/ame022027
Azam, F., Fenchel, T., Field, J. G., Gray, J. S., Meyerreil, L. A., and Thingstad, F. (1983). The ecological role of water-column microbes in the Sea. Mar. Ecol. Prog. Ser. 10, 257–263. doi: 10.3354/meps010257
Bailly, J., Fraissinet-Tachet, L., Verner, M.-C. C., Debaud, J.-C. C., Lemaire, M., Wésolowski-Louvel, M., et al. (2007). Soil eukaryotic functional diversity, a metatranscriptomic approach. ISME J. 1, 632–642. doi: 10.1038/ismej.2007.68
Bankevich, A., Nurk, S., Antipov, D., Gurevich, A. A., Dvorkin, M., Kulikov, A. S., et al. (2012). SPAdes: a new genome assembly algorithm and its applications to single-cell sequencing. J. Comput. Biol. 19, 455–477. doi: 10.1089/cmb.2012.0021
Behrenfeld, M. J. (2010). Abandoning sverdrup’s critical depth hypothesis on phytoplankton blooms. Ecology 91, 977–989. doi: 10.1890/09-1207.1
Berk, S. G., Brownlee, D. C., Heinle, D. R., Kling, H. J., and Colwell, R. R. (1977). Ciliates as a food source for marine planktonic copepods. Microb. Ecol. 4, 27–40. doi: 10.1007/bf02010427
Burns, J. A., Pittis, A. A., and Kim, E. (2018). Gene-based predictive models of trophic modes suggest Asgard archaea are not phagocytotic. Nat. Ecol. Evol. 2, 697–704. doi: 10.1038/s41559-018-0477-7
Bushnell, B. (2016). BBMap Short Read Aligner. Available at: http://sourceforge.net/projects/bbmap (accessed July 04, 2018).
Calbet, A. (2008). The trophic roles of microzooplankton in marine systems. ICES J. Mar. Sci. 65, 325–331. doi: 10.1093/icesjms/fsn013
Calbet, A., and Saiz, E. (2005). The ciliate-copepod link in marine ecosystems. Aquat. Microb. Ecol. 38, 157–167. doi: 10.3354/ame038157
Capriulo, G. M. (1982). Feeding of field collected tintinnid micro-zooplankton on natural food. Mar. Biol. 71, 73–86. doi: 10.1007/bf00396994
Cerón-Romero, M. A., Maurer-Alcalá, X. X., Grattepanche, J.-D., Yan, Y., Fonseca, M. M., and Katz, L. A. (2019). PhyloToL: a taxon/gene-rich phylogenomic pipeline to explore genome evolution of diverse eukaryotes. Mol. Biol. Evol. 36, 1831–1842. doi: 10.1093/molbev/msz103
Cerón-Romero, M. A., Nwaka, E., Owoade, Z., and Katz, L. A. (2018). PhyloChromoMap, a tool for mapping phylogenomic history along chromosomes, reveals the dynamic nature of karyotype evolution in Plasmodium falciparum. Genome Biol. Evol. 10, 553–561. doi: 10.1093/gbe/evy017
Chen, F., Mackey, A. J., Stoeckert, C. J., and Roos, D. S. (2006). OrthoMCL-DB: querying a comprehensive multi-species collection of ortholog groups. NAR 34, D363–D368. doi: 10.1093/nar/gkj123
Christaki, U., and Van Wambeke, F. (1995). Simulated phytoplankton bloom input in top-down manipulated microcosms: comparative effect of zooflagellates, ciliates and copepods. Aquat. Microb. Ecol. 9, 137–147. doi: 10.3354/ame009137
Conesa, A., Gotz, S., Garcia-Gomez, J. M., Terol, J., Talon, M., and Robles, M. (2005). Blast2GO: a universal tool for annotation, visualization and analysis in functional genomics research. Bioinformatics 21, 3674–3676. doi: 10.1093/Bioinformatics/Bti610
Cooper, E. D., Bentlage, B., Gibbons, T. R., Bachvaroff, T. R., and Delwiche, C. F. (2014). Metatranscriptome profiling of a harmful algal bloom. Harmful Algae 37, 75–83. doi: 10.1016/j.hal.2014.04.016
Damon, C., Lehembre, F., Oger-Desfeux, C., Luis, P., Ranger, J., Fraissinet-Tachet, L., et al. (2012). Metatranscriptomics reveals the diversity of genes expressed by eukaryotes in forest soils. PLoS One 7:e28967. doi: 10.1371/journal.pone.0028967
de Vargas, C., Audic, S., Henry, N., Decelle, J., Mahe, F., Logares, R., et al. (2015). Eukaryotic plankton diversity in the sunlit ocean. Science 348:1261605. doi: 10.1126/science.1261605
del Campo, J., Sieracki, M. E., Molestina, R., Keeling, P., Massana, R., and Ruiz-Trillo, I. (2014). The others: our biased perspective of eukaryotic genomes. Trends Ecol. Evol. 29, 252–259. doi: 10.1016/j.tree.2014.03.006
Edgcomb, V. P. (2016). Marine protist associations and environmental impacts across trophic levels in the twilight zone and below. Curr. Opin. Microbiol. 31, 169–175. doi: 10.1016/j.mib.2016.04.001
Fenchel, T. (1988). Marine plankton food chains. Annu. Rev. Ecol. Syst. Biodivers. 19, 19–38. doi: 10.1146/annurev.ecolsys.19.1.19
Franzosa, E. A., Morgan, X. C., Segata, N., Waldron, L., Reyes, J., Earl, A. M., et al. (2014). Relating the metatranscriptome and metagenome of the human gut. Proc. Natl. Acad. Sci. U.S.A. 111, E2329–E2338. doi: 10.1073/pnas.1319284111
García-Martín, E. E., Daniels, C. J., Davidson, K., Lozano, J., Mayers, K. M. J., McNeill, S., et al. (2017). Plankton community respiration and bacterial metabolism in a North Atlantic Shelf Sea during spring bloom development (April 2015). Prog. Oceanogr. 177:101873. doi: 10.1016/j.pocean.2017.11.002
Gifford, S. M., Sharma, S., Rinta-Kanto, J. M., and Moran, M. A. (2011). Quantitative analysis of a deeply sequenced marine microbial metatranscriptome. ISME J. 5, 461–472. doi: 10.1038/ismej.2010.141
Grattepanche, J.-D., Breton, E., Brylinski, J.-M., Lecuyer, E., and Christaki, U. (2011a). Succession of primary producers and micrograzers in a coastal ecosystem dominated by Phaeocystis globosa blooms. J. Plankton Res. 33, 37–50. doi: 10.1093/plankt/fbq097
Grattepanche, J.-D., Vincent, D., Breton, E., and Christaki, U. (2011b). Microzooplankton herbivory during the diatom-Phaeocystis spring succession in the eastern English channel. J. Exp. Mar. Bio. Ecol. 404, 87–97. doi: 10.1016/j.jembe.2011.04.004
Grattepanche, J.-D., Juarez, D. L., Wood, C. C., McManus, G. B., and Katz, L. A. (2019). Incubation and grazing effects on spirotrich ciliate diversity inferred from molecular analyses of microcosm experiments. PLoS One 14:e0215872. doi: 10.1371/journal.pone.0215872
Grattepanche, J.-D., McManus, G. B., and Katz, L. A. (2016a). Patchiness of ciliate communities sampled at varying spatial scales along the New England shelf. PLoS One 11:e0167659. doi: 10.1371/journal.pone.0167659
Grattepanche, J.-D., Santoferrara, L. F., McManus, G. B., and Katz, L. A. (2016b). Unexpected biodiversity of ciliates in marine samples from below the photic zone. Mol. Ecol. 25, 3987–4000. doi: 10.1111/mec.13745
Grattepanche, J.-D., Santoferrara, L. F., Andrade, J., Oliverio, A. M., McManus, G. B., and Katz, L. A. (2014). Distribution and diversity of Oligotrich and choreotrich ciliates assessed by morphology and DGGE in temperate coastal waters. Aquat. Microb. Ecol. 64, 51–71. doi: 10.3354/ame01675
Grattepanche, J.-D., Walker, L. M., Ott, B. M., Paim Pinto, D. L., Delwiche, C. F., Lane, C. E., et al. (2018). Microbial diversity in the eukaryotic SAR clade: illuminating the darkness between morphology and molecular data. Bioessays 40:e1700198. doi: 10.1002/bies.201700198
Hamady, M., Lozupone, C., and Knight, R. (2009). Fast UniFrac: facilitating high-throughput phylogenetic analyses of microbial communities including analysis of pyrosequencing and PhyloChip data. ISME J. 4, 17–27. doi: 10.1038/ismej.2009.97
Huerta-Cepas, J., Szklarczyk, D., Heller, D., Hernández-Plaza, A., Forslund, S. K., Cook, H., et al. (2018). eggNOG 5.0: a hierarchical, functionally and phylogenetically annotated orthology resource based on 5090 organisms and 2502 viruses. Nucleic Acids Res. 47, D309–D314. doi: 10.1093/nar/gky1085
Irigoien, X., Flynn, K. J., and Harris, R. P. (2005). Phytoplankton blooms: a ‘loophole’in microzooplankton grazing impact? J. Plankton Res. 27, 313–321. doi: 10.1093/plankt/fbi011
Irigoien, X., Huisman, J., and Harris, R. P. (2004). Global biodiversity patterns of marine phytoplankton and zooplankton. Nature 429, 863–867. doi: 10.1038/Nature02593
Kanehisa, M., Sato, Y., Kawashima, M., Furumichi, M., and Tanabe, M. (2015). KEGG as a reference resource for gene and protein annotation. Nucleic Acids Res. 44, D457–D462. doi: 10.1093/nar/gkv1070
Kuhn, A. M., Fennel, K., and Mattern, J. P. (2015). Model investigations of the North Atlantic spring bloom initiation. Prog. Oceanogr. 138, 176–193. doi: 10.1016/j.pocean.2015.07.004
Lance, G. N., and Williams, W. T. (1967). Mixed-data classificatory programs i - agglomerative systems. Aust. Comput. J. 1, 15–20.
Laws, E. A., Bienfang, P. K., Ziemann, D. A., and Conquest, L. D. (1988). Phytoplankton population dynamics and the fate of production during the spring bloom in Auke Bay. Alaska 1. Limnol. Oceanogr. 33, 57–67. doi: 10.4319/lo.1988.33.1.0057
Leising, A. W., Pierson, J. J., Halsband-Lenk, C., Horner, R., and Postel, J. (2005). Copepod grazing during spring blooms: can Pseudocalanus newmani induce trophic cascades? Prog. Oceanogr. 67, 406–421. doi: 10.1016/j.pocean.2005.09.009
Lesniewski, R. A., Jain, S., Anantharaman, K., Schloss, P. D., and Dick, G. J. (2012). The metatranscriptome of a deep-sea hydrothermal plume is dominated by water column methanotrophs and lithotrophs. ISME J. 6:2257. doi: 10.1038/ismej.2012.63
Li, L., Stoeckert, C. J. Jr., and Roos, D. S. (2003). OrthoMCL: identification of ortholog groups for eukaryotic genomes. Genome Res. 13, 2178–2189. doi: 10.1101/gr.1224503
Love, M. I., Huber, W., and Anders, S. (2014). Moderated estimation of fold change and dispersion for RNA-seq data with DESeq2. Genome Biol. 15:550.
Lozupone, C., Lladser, M. E., Knights, D., Stombaugh, J., and Knight, R. (2011). UniFrac: an effective distance metric for microbial community comparison. ISME J. 5, 169–172. doi: 10.1038/ismej.2010.133
Mahe, F., Rognes, T., Quince, C., de Vargas, C., and Dunthorn, M. (2015). Swarm v2: highly-scalable and high-resolution amplicon clustering. PeerJ 3:e1420. doi: 10.7717/peerj.1420
Martínez, R. A., Calbet, A., and Saiz, E. (2017). Effects of small-scale turbulence on growth and grazing of marine microzooplankton. Aquat. Sci. 80:2. doi: 10.1007/s00027-017-0558-8
Mason, O. U., Hazen, T. C., Borglin, S., Chain, P. S. G., Dubinsky, E. A., Fortney, J. L., et al. (2012). Metagenome, metatranscriptome and single-cell sequencing reveal microbial response to Deepwater Horizon oil spill. ISME J. 6:1715. doi: 10.1038/ismej.2012.59
Maurer-Alcala, X. X., Yan, Y., Pilling, O., Knight, R., and Katz, L. A. (2018). Twisted Tales: insights into Genome Diversity of Ciliates Using Single-Cell ’omics.”. Genome Biol. Evol. 10, 1927–1939. doi: 10.1093/gbe/evy133
McKie-Krisberg, Z. M., Sanders, R. W., and Gast, R. J. (2018). Evaluation of mixotrophy-associated gene expression in two species of polar marine algae. Front. Mar. Sci. 5:273. doi: 10.3389/fmars.2018.00273
McManus, G. B., Schoener, D., and Haberlandt, K. (2012). Chloroplast symbiosis in a marine ciliate: ecophysiology and the risks and rewards of hosting foreign organelles. Front. Microbiol. 3:321. doi: 10.3389/fmicb.2012.00321
McManus, G. B., Zhang, H., and Lin, S. J. (2004). Marine planktonic ciliates that prey on macroalgae and enslave their chloroplasts. Limnol. Oceanogr. 49, 308–313. doi: 10.4319/lo.2004.49.1.0308
McMurdie, P. J., and Holmes, S. (2013). phyloseq: an R package for reproducible interactive analysis and graphics of microbiome census data. PLoS One 8:e61217. doi: 10.1371/journal.pone.0061217
Menden-Deuer, S., and Kiørboe, T. (2016). Small bugs with a big impact: linking plankton ecology with ecosystem processes. J. Plankton Res. 38, 1036–1043. doi: 10.1093/plankt/fbw049
Monchy, S., Grattepanche, J.-D., Breton, E., Meloni, D., Sanciu, G., Chabé, M., et al. (2012). Microplanktonic community structure in a coastal system relative to a Phaeocystis bloom inferred from morphological and tag pyrosequencing methods. PLoS One 7:e39924. doi: 10.1371/journal.pone.0039924
Mousing, E. A., Richardson, K., Bendtsen, J., Cetiniæ, I., and Perry, M. J. (2016). Evidence of small-scale spatial structuring of phytoplankton alpha- and beta-diversity in the open ocean. J. Ecol. 104, 1682–1695. doi: 10.1111/1365-2745.12634
Oksanen, J., Blanchet, F. G., Kindt, R., Legendre, P., Minchin, P. R., and O’hara, R. B. (2016). vegan: Community Ecology Package. R package version 2.3-4 [WWW document].
Oksanen, J., Kindt, R., Legendre, P., O’Hara, B., Stevens, M. H. H., Oksanen, M. J., et al. (2007). The vegan package. Commun. Ecol. Packag. 10, 631–637.
Pernice, M. C., Giner, C. R., Logares, R., Perera-Bel, J., Acinas, S. G., Duarte, C. M., et al. (2016). Large variability of bathypelagic microbial eukaryotic communities across the world’s oceans. ISME J. 10, 945–958. doi: 10.1038/ismej.2015.170
Rivers, A. R., Sharma, S., Tringe, S. G., Martin, J., Joye, S. B., and Moran, M. A. (2013). Transcriptional response of bathypelagic marine bacterioplankton to the Deepwater Horizon oil spill. ISME J. 7:2315. doi: 10.1038/ismej.2013.129
Rosetta, C. H., and McManus, G. B. (2003). Feeding by ciliates on two harmful algal bloom species, Prymnesium parvum and prorocentrum minimum. Harmful Algae 2, 109–126. doi: 10.1016/s1568-9883(03)00019-2
Saba, G. K., Steinberg, D. K., and Bronk, D. A. (2011). The relative importance of sloppy feeding, excretion, and fecal pellet leaching in the release of dissolved carbon and nitrogen by Acartia tonsa copepods. J. Exp. Mar. Bio. Ecol. 404, 47–56. doi: 10.1016/j.jembe.2011.04.013
Schoener, D. M., and McManus, G. B. (2012). Plastid retention, use, and replacement in a kleptoplastidic ciliate. Aquat. Microb. Ecol. 67, 177–187. doi: 10.3354/ame01601
Schoener, D. M., and McManus, G. B. (2017). Growth, grazing, and inorganic C and N uptake in a mixotrophic and a heterotrophic ciliate. J. Plankton Res. 39, 379–391. doi: 10.1093/plankt/fbx014
Sieburth, J. M., Smetacek, V., and Lenz, J. (1978). Pelagic ecosystem structure: heterotrophic compartments of the plankton and their relationship to plankton size fractions 1. Limnol. Oceanogr. 23, 1256–1263. doi: 10.4319/lo.1978.23.6.1256
Sisson, C., Gulla-Devaney, B., Katz, L. A., and Grattepanche, J.-D. (2018). Seed bank and seasonal patterns of the eukaryotic SAR (Stramenopila, Alveolata and Rhizaria) clade in a New England vernal pool. J. Plankton Res. 40, 376–390. doi: 10.1093/plankt/fby020
Stoecker, D. K., Silver, M. W., Michaels, A. E., and Davis, L. H. (1988). Obligate mixotrophy in Laboea strobila, a ciliate which retains chloroplasts. Mar. Biol. 99, 415–423. doi: 10.1007/bf02112135
Tartar, A., Wheeler, M. M., Zhou, X., Coy, M. R., Boucias, D. G., and Scharf, M. E. (2009). Parallel metatranscriptome analyses of host and symbiont gene expression in the gut of the termite Reticulitermes flavipes. Biotechnol. Biofuels 2:25. doi: 10.1186/1754-6834-2-25
Tatusov, R. L., Galperin, M. Y., Natale, D. A., and Koonin, E. V. (2000). The COG database: a tool for genome-scale analysis of protein functions and evolution. Nucleic Acids Res. 28, 33–36. doi: 10.1093/nar/28.1.33
Teeling, H., Fuchs, B. M., Becher, D., Klockow, C., Gardebrecht, A., Bennke, C. M., et al. (2012). Substrate-controlled succession of marine bacterioplankton populations induced by a phytoplankton bloom. Science 336, 608–611. doi: 10.1126/science.1218344
Tucker, S. J., McManus, G. B., Katz, L. A., and Grattepanche, J.-D. (2017). Distribution of abundant and active planktonic ciliates in coastal and slope waters offNew England. Front. Microbiol. 8:2178. doi: 10.3389/fmicb.2017.02178
Vaulot, D., Eikrem, W., Viprey, M., and Moreau, H. (2008). The diversity of small eukaryotic phytoplankton (= 3 μm) in marine ecosystems. FEMS Microbiol. Rev. 32, 795–820. doi: 10.1111/j.1574-6976.2008.00121.x
Verity, P. G., and Villareal, T. A. (1986). The relative food value of diatoms, dinoflagellates, flagellates, and cyanobacteria for tintinnid ciliates. Arch. Protistenkde 131, 71–84. doi: 10.1016/s0003-9365(86)80064-1
Wemheuer, B., Güllert, S., Billerbeck, S., Giebel, H.-A., Voget, S., Simon, M., et al. (2014). Impact of a phytoplankton bloom on the diversity of the active bacterial community in the southern North Sea as revealed by metatranscriptomic approaches. FEMS Microbiol. Ecol. 87, 378–389. doi: 10.1111/1574-6941.12230
Worden, A. Z., Follows, M. J., Giovannoni, S. J., Wilken, S., Zimmerman, A. E., and Keeling, P. J. (2015). Rethinking the marine carbon cycle: factoring in the multifarious lifestyles of microbes. Science 347:1257594. doi: 10.1126/science.1257594
Yutin, N., Wolf, M. Y., Wolf, Y. I., and Koonin, E. V. (2009). The origins of phagocytosis and eukaryogenesis. Biol. Direct 4:9. doi: 10.1186/1745-6150-4-9
Zhang, J., Kobert, K., Flouri, T., and Stamatakis, A. (2013). PEAR: a fast and accurate Illumina Paired-End reAd mergeR. Bioinformatics 30, 614–620. doi: 10.1093/bioinformatics/btt593
Keywords: protists, phytoplankton bloom, copepods, gene expression, nanoplankton, microplankton
Citation: Grattepanche J-D and Katz LA (2020) Top-Down and Bottom-Up Controls on Microeukaryotic Diversity (i.e., Amplicon Analyses of SAR Lineages) and Function (i.e., Metatranscriptome Analyses) Assessed in Microcosm Experiments. Front. Mar. Sci. 6:818. doi: 10.3389/fmars.2019.00818
Received: 01 July 2019; Accepted: 18 December 2019;
Published: 21 January 2020.
Edited by:
Iliana B. Baums, Pennsylvania State University (PSU), United StatesReviewed by:
Yongyu Zhang, Qingdao Institute of Bioenergy and Bioprocess Technology (CAS), ChinaAdriana Lopes Dos Santos, Nanyang Technological University, Singapore
Copyright © 2020 Grattepanche and Katz. This is an open-access article distributed under the terms of the Creative Commons Attribution License (CC BY). The use, distribution or reproduction in other forums is permitted, provided the original author(s) and the copyright owner(s) are credited and that the original publication in this journal is cited, in accordance with accepted academic practice. No use, distribution or reproduction is permitted which does not comply with these terms.
*Correspondence: Laura A. Katz, bGthdHpAc21pdGguZWR1
†Present address: Jean-David Grattepanche, Department of Biology, Temple University, Philadelphia, PA, United States