Use of Geospatial, Hydrologic, and Geochemical Modeling to Determine the Influence of Wetland-Derived Organic Matter in Coastal Waters in Response to Extreme Weather Events
 Jacob C. Rudolph1*
  Carli A. Arendt1
  Alexandria G. Hounshell2,3
  Hans W. Paerl2
  Christopher L. Osburn1,4
- 1Department of Marine, Earth, and Atmospheric Sciences, North Carolina State University, Raleigh, NC, United States
- 2Institute of Marine Sciences, The University of North Carolina at Chapel Hill, Morehead City, NC, United States
- 3Department of Biological Sciences, Virginia Polytechnic Institute and State University, Blacksburg, VA, United States
- 4Center for Geospatial Analytics, North Carolina State University, Raleigh, NC, United States
Flooding from extreme weather events (EWE), such as hurricanes, exports large amounts of dissolved organic matter (DOM) to both estuaries and coastal waters globally. Hydrologic connectivity of wetlands to adjacent river channels during flood events can potentially have a major control on the DOM exported to coastal waters after EWEs. In this study, a geographic information system based flood model was used to: (1) determine the volume of flooded wetlands in a river corridor following Hurricane Matthew in 2016; (2) compute the resulting volume fluxes of DOM to the Neuse River Estuary-Pamlico Sound (NRE-PS), in eastern North Carolina and (3) use the flood model to quantify the wetland contribution to DOM export. The flood model-derived contributions were validated with a Bayesian Monte Carlo mixing model combining measurements of DOM quality: specific UV Absorbance at 254 nm (SUVA254), spectral slope ratio (SR), and stable isotope ratios of dissolved organic carbon (δ13C-DOC). Results indicated that (1) hydrologic connectivity of the freshwater riparian wetlands caused the wetlands to become the primary source of organic matter (OM) that was exported into the NRE-PS after Matthew and (2) this source lingered in these coastal waters in the months after the storm. Thus, in consideration of the pulse-shunt concept, EWE such as Hurricane Matthew cause pulses of DOM from wetlands, which were the primary source of the OM shunted from the terrestrial environment to the estuary and sound. Wetlands constituted ca. 48% of the annual loading of DOC into the NRE and 16% of DOC loading into the PS over a period of 30 days after Hurricane Matthew. Results were consistent with prior studies in this system, and other coastal ecosystems, that attributed a high reactivity of DOM as the underlying reason for large CO2 releases following EWE. Adapting the pulse-shunt concept to estuaries requires the addition of a “processing” step to account for the DOM to CO2 dynamics, thus a new pulse-shunt process is proposed to incorporate coastal waters. Our results suggest that with increasing frequency and intensity of EWE, strengthening of the lateral transfer of DOM from land to ocean will occur and has the potential to greatly impact coastal carbon cycling.
Introduction
The frequency of extreme weather events (EWE), such as tropical cyclones, has increased in the southeastern United States (US) in recent decades (Paerl et al., 2018) and since the mid-1990s the coast of North Carolina has experienced many such events. Paerl et al. (2018) classified EWEs occurring over the past 20 years in eastern NC into three categories (dry and windy, wet and calm, and wet and windy) and compared each category to non-storm conditions to show how different types of storms would affect the Neuse River Estuary (NRE), the main tributary to Pamlico Sound (PS), 2nd largest estuarine complex in the United States. Hurricane Matthew, which occurred in October 2016, struck eastern North Carolina and its coastal waters as a Category 1 storm causing ca. $1.6 billion in damage and 28 deaths in North Carolina alone (Stewart, 2017). In their analysis, Paerl et al. (2018) found that “wet and windy” storms, such as Matthew, showed statistical differences in carbon (C) and inorganic nitrogen concentrations, partial pressure of carbon dioxide (pCO2), and pH in the NRE, indicating such EWEs have major impacts on estuarine and coastal water biogeochemistry in the weeks to months after the storms.
Precipitation from EWE is projected to rise by ca. 7% with each degree Celsius of warming in the future (Prein et al., 2017). Flooding from heavy precipitation associated with EWE can result in a flushing of terrestrial dissolved organic matter (DOM) from land to coastal waters where substantial biogeochemical processing can occur returning CO2 to the atmosphere (Bianchi et al., 2013). Depending on the residence time of floodwater in receiving waters such as estuaries and large river plumes, DOM degradation can persist for weeks to months following these events (Osburn et al., 2019a). Thus, these episodic large storm events can be significant, yet poorly constrained, influences on coastal C budgets, via terrestrial DOM’s transport to coastal waters (Raymond et al., 2016).
For DOM, changes to its sources following EWEs can influence its biogeochemical processing in coastal waters (Osburn et al., 2012; Bianchi et al., 2013). In part, DOM’s importance in the coastal C cycle arises from its central role in providing a basal resource to the “microbial loop”. Results from Hurricane Floyd in 1999 indicated increased microbial respiration following floodwaters from the Cape Fear River in eastern NC exported into Onslow Bay (Avery et al., 2004). Bianchi et al. (2013) found a consistent post-flood result in shelf waters of the northern Gulf of Mexico, and suggested that soil-sourced DOM was rapidly lost to the atmosphere as CO2 via photochemical and microbial processing. As a result of high rates of carbon sequestration and sediment trapping, wetlands are major C sinks that store between 350–535 Gt C (Gorham, 1995; IPCC, 2001; Mitra et al., 2005). Wetlands likely play major role in the passive pipe scenario used to describe rivers in the pulse-shunt concept (PSC; Raymond et al., 2016), which builds on earlier concepts of how floods can influence biogeochemistry (Vannote et al., 1980; Junk et al., 1989). While the pulse-shunt concept was initially only applied to upland streams and did not account for wetlands, estuaries or coastal waters, recent work suggests that estuaries may act in similar fashion (Hounshell et al., 2019). Delineating between wetland and upland DOM will be important to evaluate the reactivity and cycling of DOM transported to coastal waters following EWEs. Here we posit that flooding from EWEs mobilizes DOM stored in wetlands into coastal waters where it can be processed back into CO2.
The complexity of doing so requires a means to assess when hydrologic-connectivity occurs between water from a river and water from wetlands, via either surface waters, groundwater, or both (Pringle, 2003). During floods, an isolated wetland’s hydrological-connection to a river’s main channel allows the flushing of its accumulated recalcitrant OM and nutrients (Tockner et al., 1999; Wolf et al., 2013). However, recalcitrant OM in one system may become labile in another system (Boyd and Osburn, 2004); microorganisms in coastal waters are poised to break down the recalcitrant wetland OM to CO2, returning stores of terrestrial carbon to the atmosphere (Bauer et al., 2013).
Because wetlands are important reservoirs of OM in coastal watersheds that can become OM sources following EWEs, their contribution to the terrestrial DOM flux must therefore be determined. Osburn et al. (2019a) used geochemical proxies for organic matter (light absorption and stable C isotopes) to posit that wetlands constituted a significant fraction of the terrestrial DOM exported into Pamlico Sound via the Neuse River Estuary following Hurricane Matthew. The main objective of this study was to validate their supposition with a quantitative model. We hypothesized that the hydrologic-connectivity of the lower Neuse River to its adjacent riparian wetlands resulted in wetlands as a dominant source of DOM transported in floodwaters from extreme precipitation events, such as Hurricane Matthew. Here, the hydrologic-connectivity of riparian wetlands to a major coastal river in eastern NC was determined by a relative elevation flood model used to determine the extent of flooding that occurred in response to Hurricane Matthew in 2016. Fluxes of DOM to the NRE from its watershed were determined using concentrations of DOC from the river and wetlands and volumetric estimates of each of these two sources. This geospatial approach to compute DOM sources was validated by comparison to a Bayesian Monte Carlo mixing model (Arendt et al., 2015). Sources of OM in this system were determined with bulk carbon stable isotopes of DOC (δ13C-DOC), specific UV absorbance at 254 nm (SUVA254), and spectral slope ratio (SR), analyses that characterize different fractions of OM and have varying rates of source specificity (Bianchi and Canuel, 2011). By implementing the coupled geospatial-geochemical model and these analyses, the change in quality and quantity of OM from the wetlands to the NRE-PS resulting from Matthew’s floodwaters was quantified. Previous studies of biogeochemical cycling and past extreme events in the NRE-PS provided important context for this study (e.g., Paerl et al., 2018; Osburn et al., 2019a).
Materials and Methods
Study Site and Sample Collection
This study was conducted in the main-stem of the Neuse River in the Coastal Plain of North Carolina, United States (Figure 1; Osburn et al., 2019a). Along the lower reach of the river above the head of tides, abundant freshwater riparian wetlands fringe the main channel of the river, before it flows southeast into the NRE-PS (NC-DEQ, 2018). The Neuse River Estuary is the largest tributary to the Pamlico Sound (Paerl et al., 2018). The Pamlico Sound is the larger portion of the Albemarle-Pamlico Estuarine System (APES), which is the second largest estuarine complex in the continental United States (NC-DEQ, 2018). Characteristics of each system are summarized in Supplementary Table S1. Both the NRE and PS are relatively shallow (average depths are ca. 3 and 5 m, respectively). There is little tidal effect (0.3–0.6 m; Giese et al., 1985) in this microtidal estuarine complex due to embayment by the barrier islands off the coast of NC (NC-DEQ, 2018). Mixing in the system is strongly affected by winds (Dixon et al., 2014). Moreover, the Neuse River’s discharge can vary greatly over the course of a year (ca. 17 to 1400 m3 s–1 for 2016). The embayment of this lagoonal system under low to modest river flow causes the NRE-PS to generally have long water residence times; however, during high flow events like Hurricane Matthew, the residence time can decrease greatly (Supplementary Table S1).
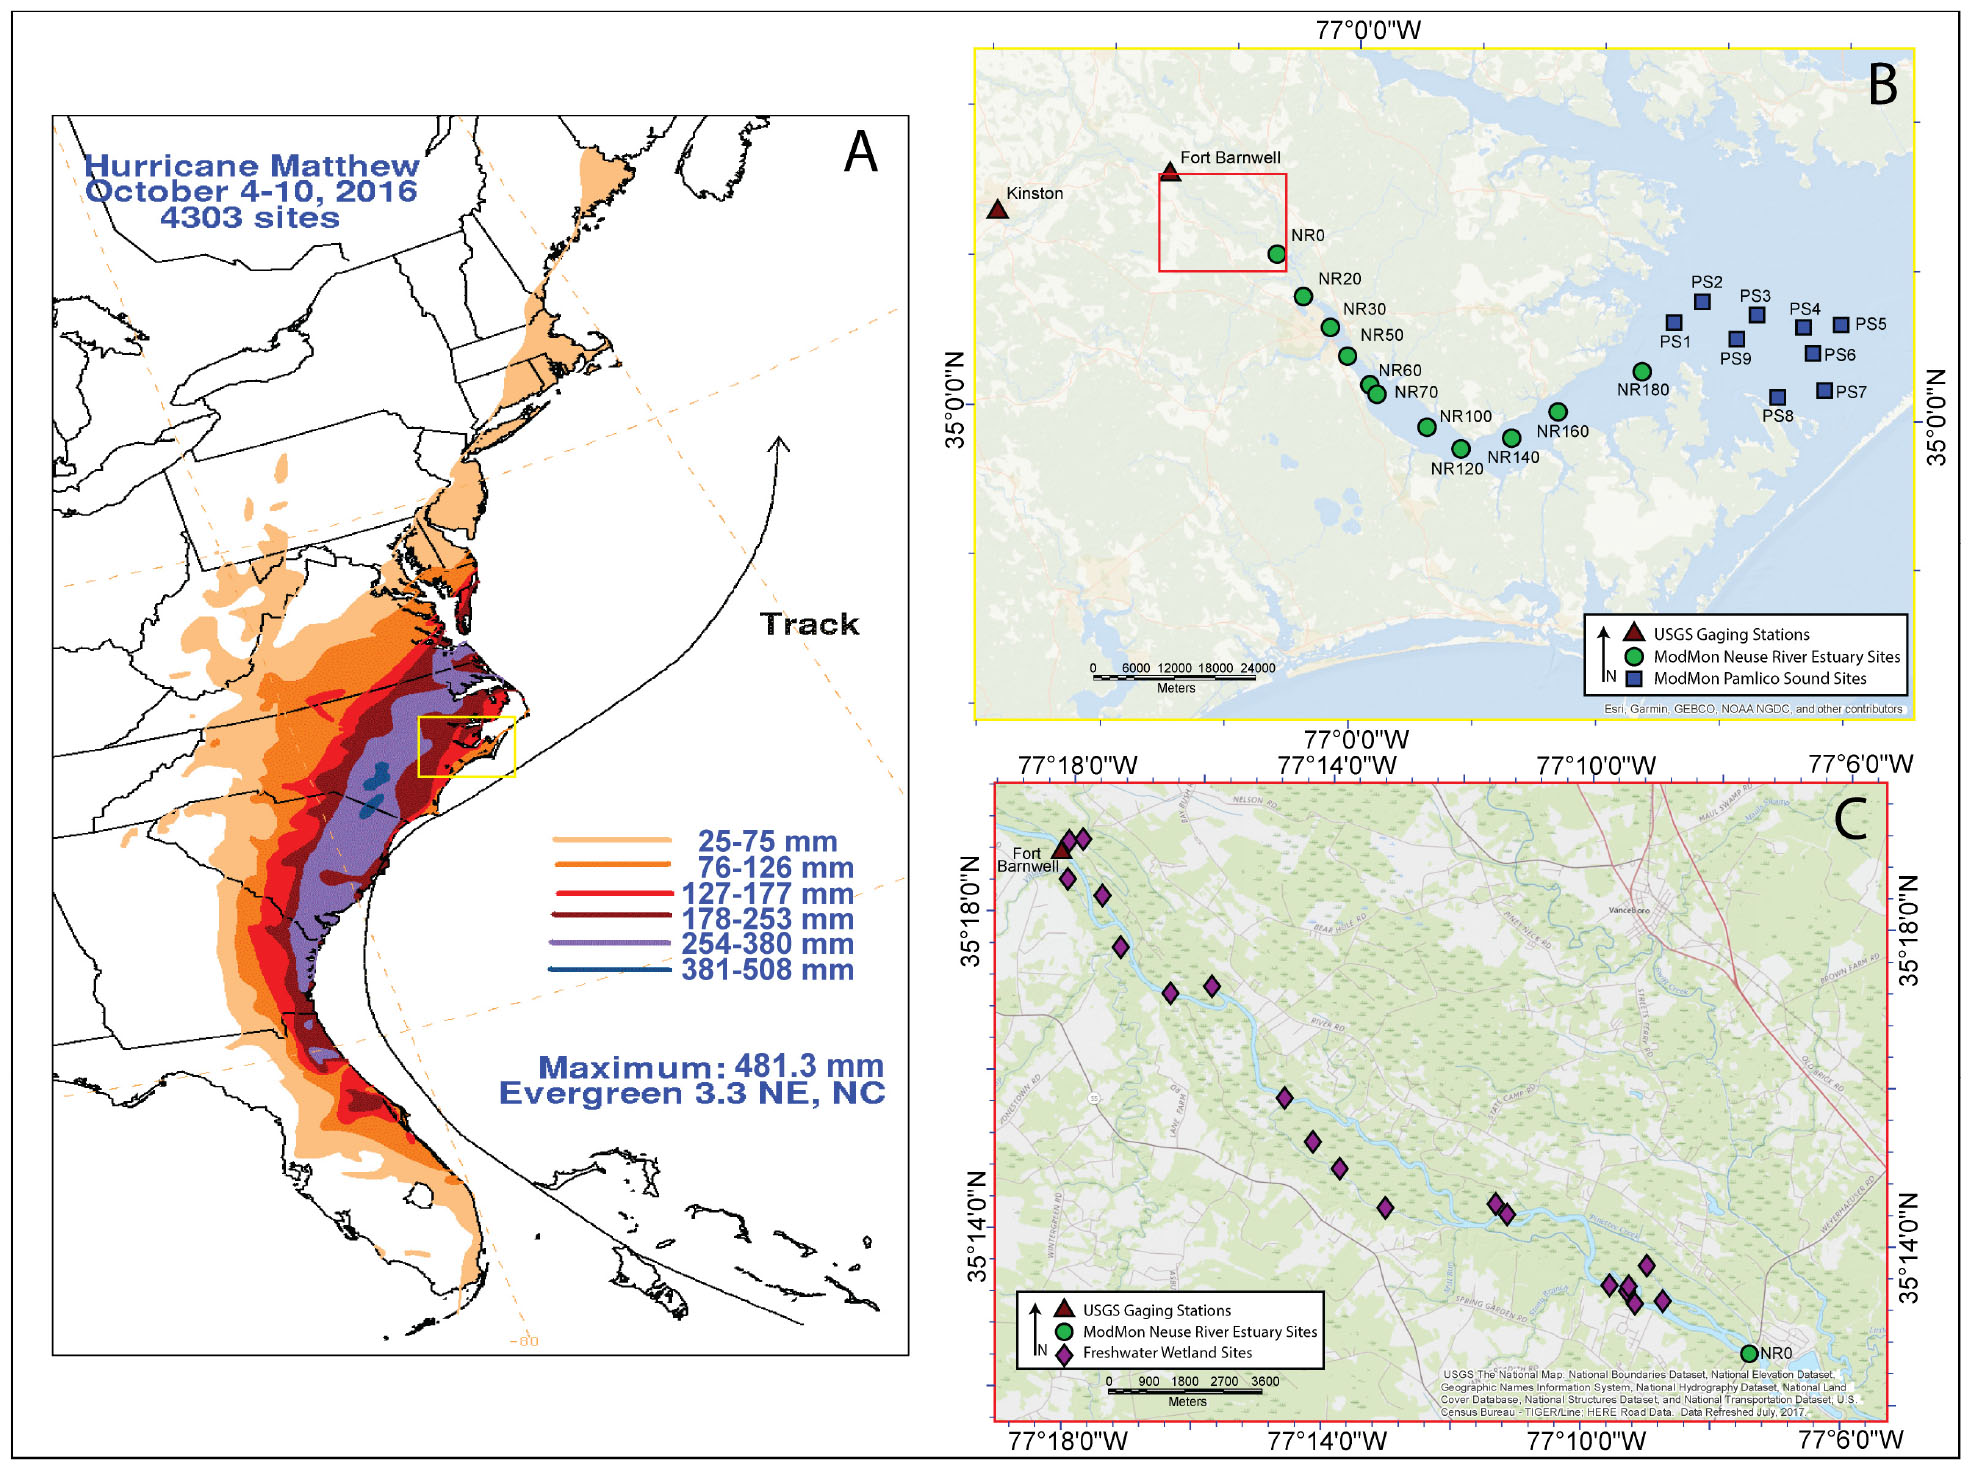
Figure 1. (A) Map from Stewart (2017) showing the rainfall totals and path of Hurricane Matthew during the period of 4–10 October 2016; (B) Map of sampling locations in the Neuse River watershed and Pamlico Sound, NC; (C) Map of freshwater riparian wetlands along the lower Neuse River, NC. (Modified from Osburn et al., 2019a with permission from John Wiley and Sons, Inc.).
Access to a long-term geochemical dataset from routine monitoring of the NRE-PS (the Neuse River Estuary Modeling and Monitoring Project, “ModMon”) provided a long-term record against which we compare the system’s response to the storm. Surface water samples were collected at sites along the main axis of the Neuse River and NRE-PS over a period of 3 months, between October and December 2016, following the passage of Hurricane Matthew on October 9, 2016 (Figures 1A,B). Sampling was conducted ca. weekly across the NR, NRE, and PS sites (Supplementary Table S2). Using a bucket riverine samples were collected in 1 L brown HDPE bottles, from bridge overpasses along the main-stem of the NR at United States Geological Survey (USGS) gauged locations (Clayton, Smithfield, Goldsboro, Kinston, and Fort Barnwell; Figure 1B).
Estuarine and sound samples were collected during ModMon surveys of the NRE-PS by pumping water using a peristaltic pump from the surface, stored in 1 L opaque HDPE bottles and frozen for shipment to North Carolina State University (Figure 1B). Collection bottles were cleaned in a detergent bath, rinsed profusely with Milli-Q ultrapure water, and left to air dry before sampling. Additional surface water sampling was completed in an area of freshwater riparian wetlands between the last riverine site on the NR near Fort Barnwell, NC, United States and head-of-tide for the estuary at the Street’s Ferry Bridge crossing near Vanceboro, NC, United States in March and October 2017 (Figure 1C).
Sample Processing and Optical Analyses
Surface water samples were thawed at room temperature, and a measured volume of water was filtered through pre-combusted (at 450°C for 5 h) 0.7 μm Whatman glass fiber filters (GF/F) via vacuum. Prior to sample filtration, 150 mL of Milli-Q water was used to rinse each filter. The filtrate was collected into 60 mL polycarbonate bottles (detergent-washed and rinsed thoroughly with Milli-Q water) for optical analyses and 40 mL amber-tinted borosilicate glass vials (detergent-washed, rinsed thoroughly with Milli-Q water, and combusted at 450°C for 5 h) for DOC concentration [(DOC)] and stable carbon isotope (δ13C-DOC, see below) analyses. Filtrate was stored at 4°C until optical measurements were made, generally within 48 h of thaw. Filtrate for DOC analysis was acidified to a pH of 2 with 85% phosphoric acid (H3PO4), then stored at 4°C until measurements were completed.
Absorbance measurements were made with a Varian Cary 300UV spectrophotometer in 1 cm quartz cuvettes, over a range of wavelengths (200–800 nm), and then blank corrected using Milli-Q ultrapure water. The Napierian absorption coefficient (a) was determined using the formula:
where a is absorption coefficient (m–1), λ is the wavelength (nm), A is the absorbance measured on the spectrophotometer, and L is pathlength of the quartz cuvette (m) (Kirk, 1994; Osburn and Morris, 2003). Helms et al. (2008) suggested that an absorption coefficient at 254 nm (a254) could be used as a proxy for DOC concentration, due to high correlation of DOC concentration and a254. The spectral slope ratio (SR) was calculated by dividing the natural log of the slope of the absorbance spectra between 275 and 295 nm by the natural log of the slope of the absorbance spectra between 350 and 400 nm. SR is a qualitative indicator of molecular weight of a sample, with larger values indicating lower molecular weight and smaller values having higher molecular weights (Helms et al., 2008). The specific UV absorbance at 254 nm (SUVA254), which is the ratio of the decadic UV absorption at 254 nm divided by the DOC concentration, has been found to be useful in estimating DOM quality parameters such as: the aromaticity of DOM (Weishaar et al., 2003), the molecular weight (Chowdhury, 2013), and the source of DOM and type of environmental degradation (Hansen et al., 2016).
Dissolved Organic Carbon and Stable Carbon Isotope Analyses
For measurement of (DOC), samples were first sparged with ultrapure Argon gas for 20 min to remove dissolved inorganic carbon (DIC). Sparged samples were analyzed on an OI Analytical 1030D Aurora total organic carbon analyzer, using wet chemical oxidation, coupled to a Thermo Delta V Plus isotope ratio mass spectrometer (IRMS) to determine stable isotope values, expressed as the standard delta notation, δ13C-DOC, using Equation 2:
where δ13C is the stable isotope ratio of carbon in parts per thousand, Rsample is the ratio of 13C to 12C for the unknown sample, and Rstandard is the ratio of 13C to 12C for the known standard (Osburn and St-Jean, 2007).
(DOC) measurements were blank-corrected for ultra-pure Milli-Q water, then calculated using a linear regression curve of known caffeine standards with concentrations from 1 to 20 mg C L–1. δ13C-DOC values were blank corrected and referenced to the Vienna Pee Dee Belemnite (VPDB) scale via a linear regression of six caffeine (IAEA-600, −27.7 ± 0.04‰) and two sucrose (IAEA-C6, −10.8 ± 0.03‰) International Atomic Energy Agency (IAEA) standards. Precision for (DOC) and δ13C-DOC values were ± 0.4‰ based on reproducibility and calibration to sucrose standard. Milli-Q blanks were run every 10 samples for quality control. DOC stable isotope values for different sources of natural OM from previous studies were tabulated for reference (Supplementary Table S3).
Geospatial Wetland Flood Model
The area and type of freshwater wetlands that were flooded in response to Hurricane Matthew were determined using Esri’s ArcMap 10.5.1. Input variables included: (1) a high-resolution Light Detection and Ranging (LiDAR) digital elevation model (DEM) raster dataset with 6.3 cm vertical accuracy and 1 m horizontal accuracy downloaded from the NOAA Digital Coast data viewer (OCM Partners, 2017), (2) USGS gauge height and discharge rates, and (3) a coastal wetland GIS polygon vector dataset (Sutter, 1999). The relative elevation model (REM) tool within the Riparian Topography Toolbox (Wall, pers. comm.; Dilts et al., 2010) was used for removal of the slope trend of the floodplain from the DEM. Removal of slope trend of the floodplain from the REM was required because the slight slope of the ground to coastal water surface (1:1.8 m over the area of our survey) would cause the lower wetlands to become more flooded than the upper wetlands. Once removed, the water surface at base flow in the river and upper estuary was set to 0 m (REM) to flood an otherwise linear surface.
The study area (Figure 1C) was extracted from the DEM using the Spatial Analyst toolbox (ESRI, 2011). The extracted wetland DEM was also processed by the REM toolbox to remove the slope trend from the surface water using kernel density with a search radius set to 3000 meters; this search radius was tested and found to be dependent on the size of the floodplain. The 3D Analyst toolbox (ESRI, 2011) was used to determine six surfaces of the flooded area and volume of the detrended freshwater riparian zone during Hurricane Matthew: relative 0 m, National Weather Service (NWS) flood stage, moderate flood stage, major flood stage, and maximum gauge height. A surface was also determined for mean gauge height over the period of October-December 2016, after the storm. Gauge height and discharge rates were obtained from the USGS gauging station on the Neuse River near Fort Barnwell, NC, United States (#02091814) (Supplementary Table S4). The value from the DEM at Ft. Barnwell (1.770 m) was removed from the gauge height values to account for removal of slope trend in the REM. In ArcMap, a constant planer raster layer was created (Spatial Analyst toolbox; ESRI, 2011) using the gauge height value, then the Cut Fill tool (3D Analyst toolbox; ESRI, 2011) was used to subtract the constant layer from the DEM. The Cut Fill raster layer was then extracted by attributes (Spatial Analyst toolbox; ESRI, 2011) where the volume was negative, to obtain the volume (VT) and area (AT) of the total flooded surface. An ArcMap model builder workflow plot indicates the processes that were used to determine the flood model (Supplementary Figure S1).
Next, North Carolina’s Department of Coastal Management spatial wetland mapping layer (Sutter, 1999) was overlain on the flooded surface and extracted by mask (Spatial Analyst toolbox; ESRI, 2011) to determine the area (AW) and volume (VW) of wetlands present during various flood stages. The cell size of the DEM was 1.5 × 1.5 m. AW was calculated by multiplying the cell area (2.25 m2) by the cell count of the total wetland flooded area from the attribute table in ArcMap.
DOC mass loading (L) to the NRE from the Neuse River Watershed was calculated from the volumes determined in the ArcGIS flood model (Supplementary Figure S1) by first subtracting the VW from the VT (Eq. 3) to obtain the volume of the non-wetland area (VnW), then the DOC mass loading from the wetlands (LDOCW) was determined by multiplying the flooded volume of the wetlands by the DOC concentration from the wetlands (CW) and dividing by 1000 to get units of kg C (Eq. 4). Next, riverine DOC mass loading (LDOCR) was calculated by multiplying the DOC concentration from Fort Barnwell, NC, United States (riverine site; CFB) by the non-wetland flooded volume and dividing by 1000 to value in units of kg C (Eq. 5). Finally, total DOC mass loading (LDOCT) was determined by adding the DOC mass loads of the wetlands and the river and then converting to Gg C (eq. 6).
Bayesian Monte Carlo Mixing Model
A Bayesian Monte Carlo (BMC) three end-member mixing model was used to validate the geospatial model created during this study (Arendt et al., 2015). BMC has been shown to be useful in determining fractional contributions of unique end-members to bulk samples in many different Earth surface systems, including glacial meltwaters (Bhatia et al., 2011; Arendt et al., 2015), soil nutrients (Chadwick et al., 1999), and stable and radiogenic isotopes in seawater (Pichler, 2005; Rickli et al., 2010). Within our estuarine and sound system, we identified the possible contributing end-member sources as wetland, river, and ocean water. We assumed that there were no other major end-members for this study. Therefore, the sum of the fractional contribution (f) of wetland (w), river (r), and ocean (o) for our estuary and sound samples is given in Eq. 7.
To determine the relative contribution of our unique end members (w, r, or o) to the bulk water (NRE or PS), we initially identified both SUVA254 and δ13C-DOC as geochemical parameters with ranges specific to our end-members. However, due to linearity between SUVA254 and δ13C-DOC values (Osburn et al., 2019a), a third component (SR) was used to properly constrain the model. Thus, the combination of SUVA254, δ13C-DOC, and SR geochemical components allow us to define unique end-member geochemical compositions based on measurements from wetland (n = 22), river (n = 4), and ocean (n = 2; values from Atar, 2017) samples. End-member compositions are defined as mean SUVA254, δ13C-DOC, and SR values ± the standard deviation for each end member: where the wetland end-member composition is −29.41 ± 0.73‰, 4.94 ± 0.50 L mg C–1m–1, and 0.83 ± 0.06; the river end-member composition is −25.77 ± 0.10‰, 3.64 ± 0.61 L mg C–1m–1, and 0.88 ± 0.06; and the ocean end-member composition is −23. 01 ± 0.50‰, 1.40 ± 0.50 L mg C–1m–1, and 1.82 ± 0.50, respectively. The incorporation of standard deviations within each end-member composition allows the model to account for natural variability and uncertainty associated with these end-member compositions.
Once the end members were geochemically defined, the BMC model was fit to our raw sample SUVA254, δ13C-DOC, and SR data from Neuse River Estuary (NRE; n = 70) and Pamlico Sound (PS; n = 52) samples were input to our BMC model to ascertain the fw, fr, and fo for each sample. Intuitively, the NRE and PS samples differ in SUVA254, δ13C-DOC, and SR compositions, with mean values ± standard deviations of −28.56 ± 1.13‰, 4.12 ± 0.53 L mg C–1m–1, and 0.84 ± 0.06 for all NRE samples, and −27.46 ± 0.89‰, 3.62 ± 0.32 L mg C–1m–1, and 0.99 ± 0.08 for all PS samples. The BMC model is able to provide further insight to these differences and calculate the most likely relative fractional contribution of each end member (fw, fr, fo) to the NRE and PS samples based on the unique 3-component end-member geochemical compositions and associated uncertainties we defined. The BMC model uses prior and posterior probability density functions based on the known (end-member compositions and bulk NRE and PS compositions) and the unknown (relative contributions from each end member to the bulk samples) to determine the likelihood of any fractional contribution outcome. Each outcome is accompanied by a known uncertainty that places constraints on how likely each outcome is. The likelihood of a model prediction was calculated by Eq. 8.
Where subscripts p and o are the predicted and observed measurements of each variable, while σ is the measurement of uncertainty. One hundred million prior and posterior samples were tested for each bulk water sample and three standard deviations of the data for the bulk samples were used. The model was run separately for the NRE and the PS using the same defined end-member ranges. Models were run separately due to spatial and source differences between the NRE and PS, with NRE generally being more terrestrial sourced and PS more marine sourced. Average acceptance rates of the mixing model were determined via the ratio of prior samples to accepted posterior samples (see Eq. 8) and these rates were used to ascertain our confidence in the model fit.
Results
Summary of DOM Quality
δ13C-DOC
Mean δ13C-DOC values in the Neuse River Estuary initially were more enriched during October sampling dates, shortly after the storm (17 October: −27.8 ± 0.8‰; 24 October: −27.8 ± 0.4‰; Supplementary Figure S2A) when compared to early November NRE values (01 November: −29.4 ± 0.5‰; 08 November: −29.5 ± 1.1‰; 15 November: −29.2 ± 0.4‰), although more depleted than the Neuse River sites over the entire study period (−25.9 ± 0.4‰). When compared to the range of river values from November (−25.9 ± 0.1 to −25.5 ± 0.4‰), mean δ13C-DOC values in the estuary in October were depleted by ca. 4‰. In late November there was an increase in mean δ13C-DOC values to −27.3 ± 0.9‰, but then in the December, the estuary experienced another decrease in mean δ13C-DOC values to −29.4 ± 1.0‰ (Supplementary Figure S2A). These δ13C-DOC values for the NRE oscillated between the mean values for riparian wetlands (−29.4 ± 0.7‰). Similar to the NRE, mean δ13C-DOC values in Pamlico Sound were bounded between the Neuse River and riparian wetland values. Mean δ13C-DOC values for the sound were depleted relative to those for the river, while PS values were enriched relative to mean values for the wetlands. Also, ranges of mean δ13C-DOC values in PS (−28.0 ± 0.2 to −26.7 ± 0.3‰) were slightly enriched compared to the NRE values (−29.5 ± 1.1 to −27.3 ± 0.9‰; Supplementary Figure S2A). Attenuation of the flood pulse appeared to create less variability (about 1‰) in the δ13C-DOC values of the sound over the sampling period, with exception of the 09 November and 08 December when ranges in the sound were 2–3‰.
SUVA254
Mean SUVA254 values in the Neuse River Estuary decreased from a high value of 4.9 ± 0.3 L mg C–1 m–1 (17 October) in late October and throughout November before increasing slightly on 13 December (4.1 ± 0.3 L mg C–1 m–1; Supplementary Figure S2B); NRE values were larger than all of the river samples throughout the period following the hurricane. The range of wetland SUVA254 values (3.8–5.4 L mg C–1 m–1) spanned the full range of estuarine values (3.2–5.3 L mg C–1 m–1), while the range of wetlands was larger than all river and sound sampling dates. Mean SUVA254 values for PS, like δ13C-DOC values, were less than riparian wetland values but greater than all river sample values (Supplementary Figure S2B).
SR
Mean daily SR values in the NRE increased from a low value of 0.77 ± 0.02 (17 October) to a maximum mean daily value of 0.90 ± 0.05 on 28 November, before decreasing slightly to 0.86 ± 0.09 on 13 December (Supplementary Figure S2C). NRE mean daily SR values were initially smaller than the mean river and wetland values (0.88 ± 0.06 and 0.83 ± 0.06, respectively), however, as the discharge began to decrease and wetland connectivity decreased the SR values became larger than the river and wetland values (Supplementary Figure S2C). Mean SR values for the PS were lowest on 02 November (0.94 ± 0.05) before increasing to ca. 1 on 09 November and stayed at 1 for the rest of the sampling dates. The PS mean SR values were almost half of the coastal ocean SR values throughout the study [1.82 ± 0.50; Atar (2017)].
Flooding of Wetlands in the Lower Neuse River Watershed in Response to Hurricane Matthew
Hurricane Matthew’s rainfall was localized well upstream of the NRE-PS, yet caused major flooding in the river’s lower watershed above head-of-tide, its estuary, and the Pamlico Sound. Heavy precipitation from Hurricane Matthew in the Neuse River watershed occurred over a 2-day period from 08 October to 10 October (e.g., maximum of 419 mm at Kinston, NC, United States) (Figure 1A; Stewart, 2017). The precipitation associated with the storm caused extensive flooding throughout the watershed (Musser et al., 2017; Stewart, 2017). Flooding was most prevalent in the mid to lower Neuse River watershed, with flood recurrence intervals ranging from ca. 100 to 500 years (Musser et al., 2017).
The USGS gauging station on the Neuse River at Fort Barnwell recorded gauge heights above the US National Weather Service (NWS) flood stage from October 9 through October 22, 2016 (Figure 2). NWS major flood stage was recorded from October 12 through October 18, 2016 (Figure 2). Flood stage coincided with extremely high discharge at Fort Barnwell (1399 m3 s–1, Matthew; U.S. Geological Survey [USGS], 2018). After Matthew’s floodwaters moved downstream, there was a release of water from the Falls Lake Reservoir into the NR, indicated by the flat area on the mean gauge height curve, from October 30 to November 7, 2016 (Figure 2). This secondary flood pulse was followed by a return to base flow, due to a lack of measurable precipitation in the months after Hurricane Matthew (National Weather Service [NWS], 2016; U.S. Geological Survey [USGS], 2018).
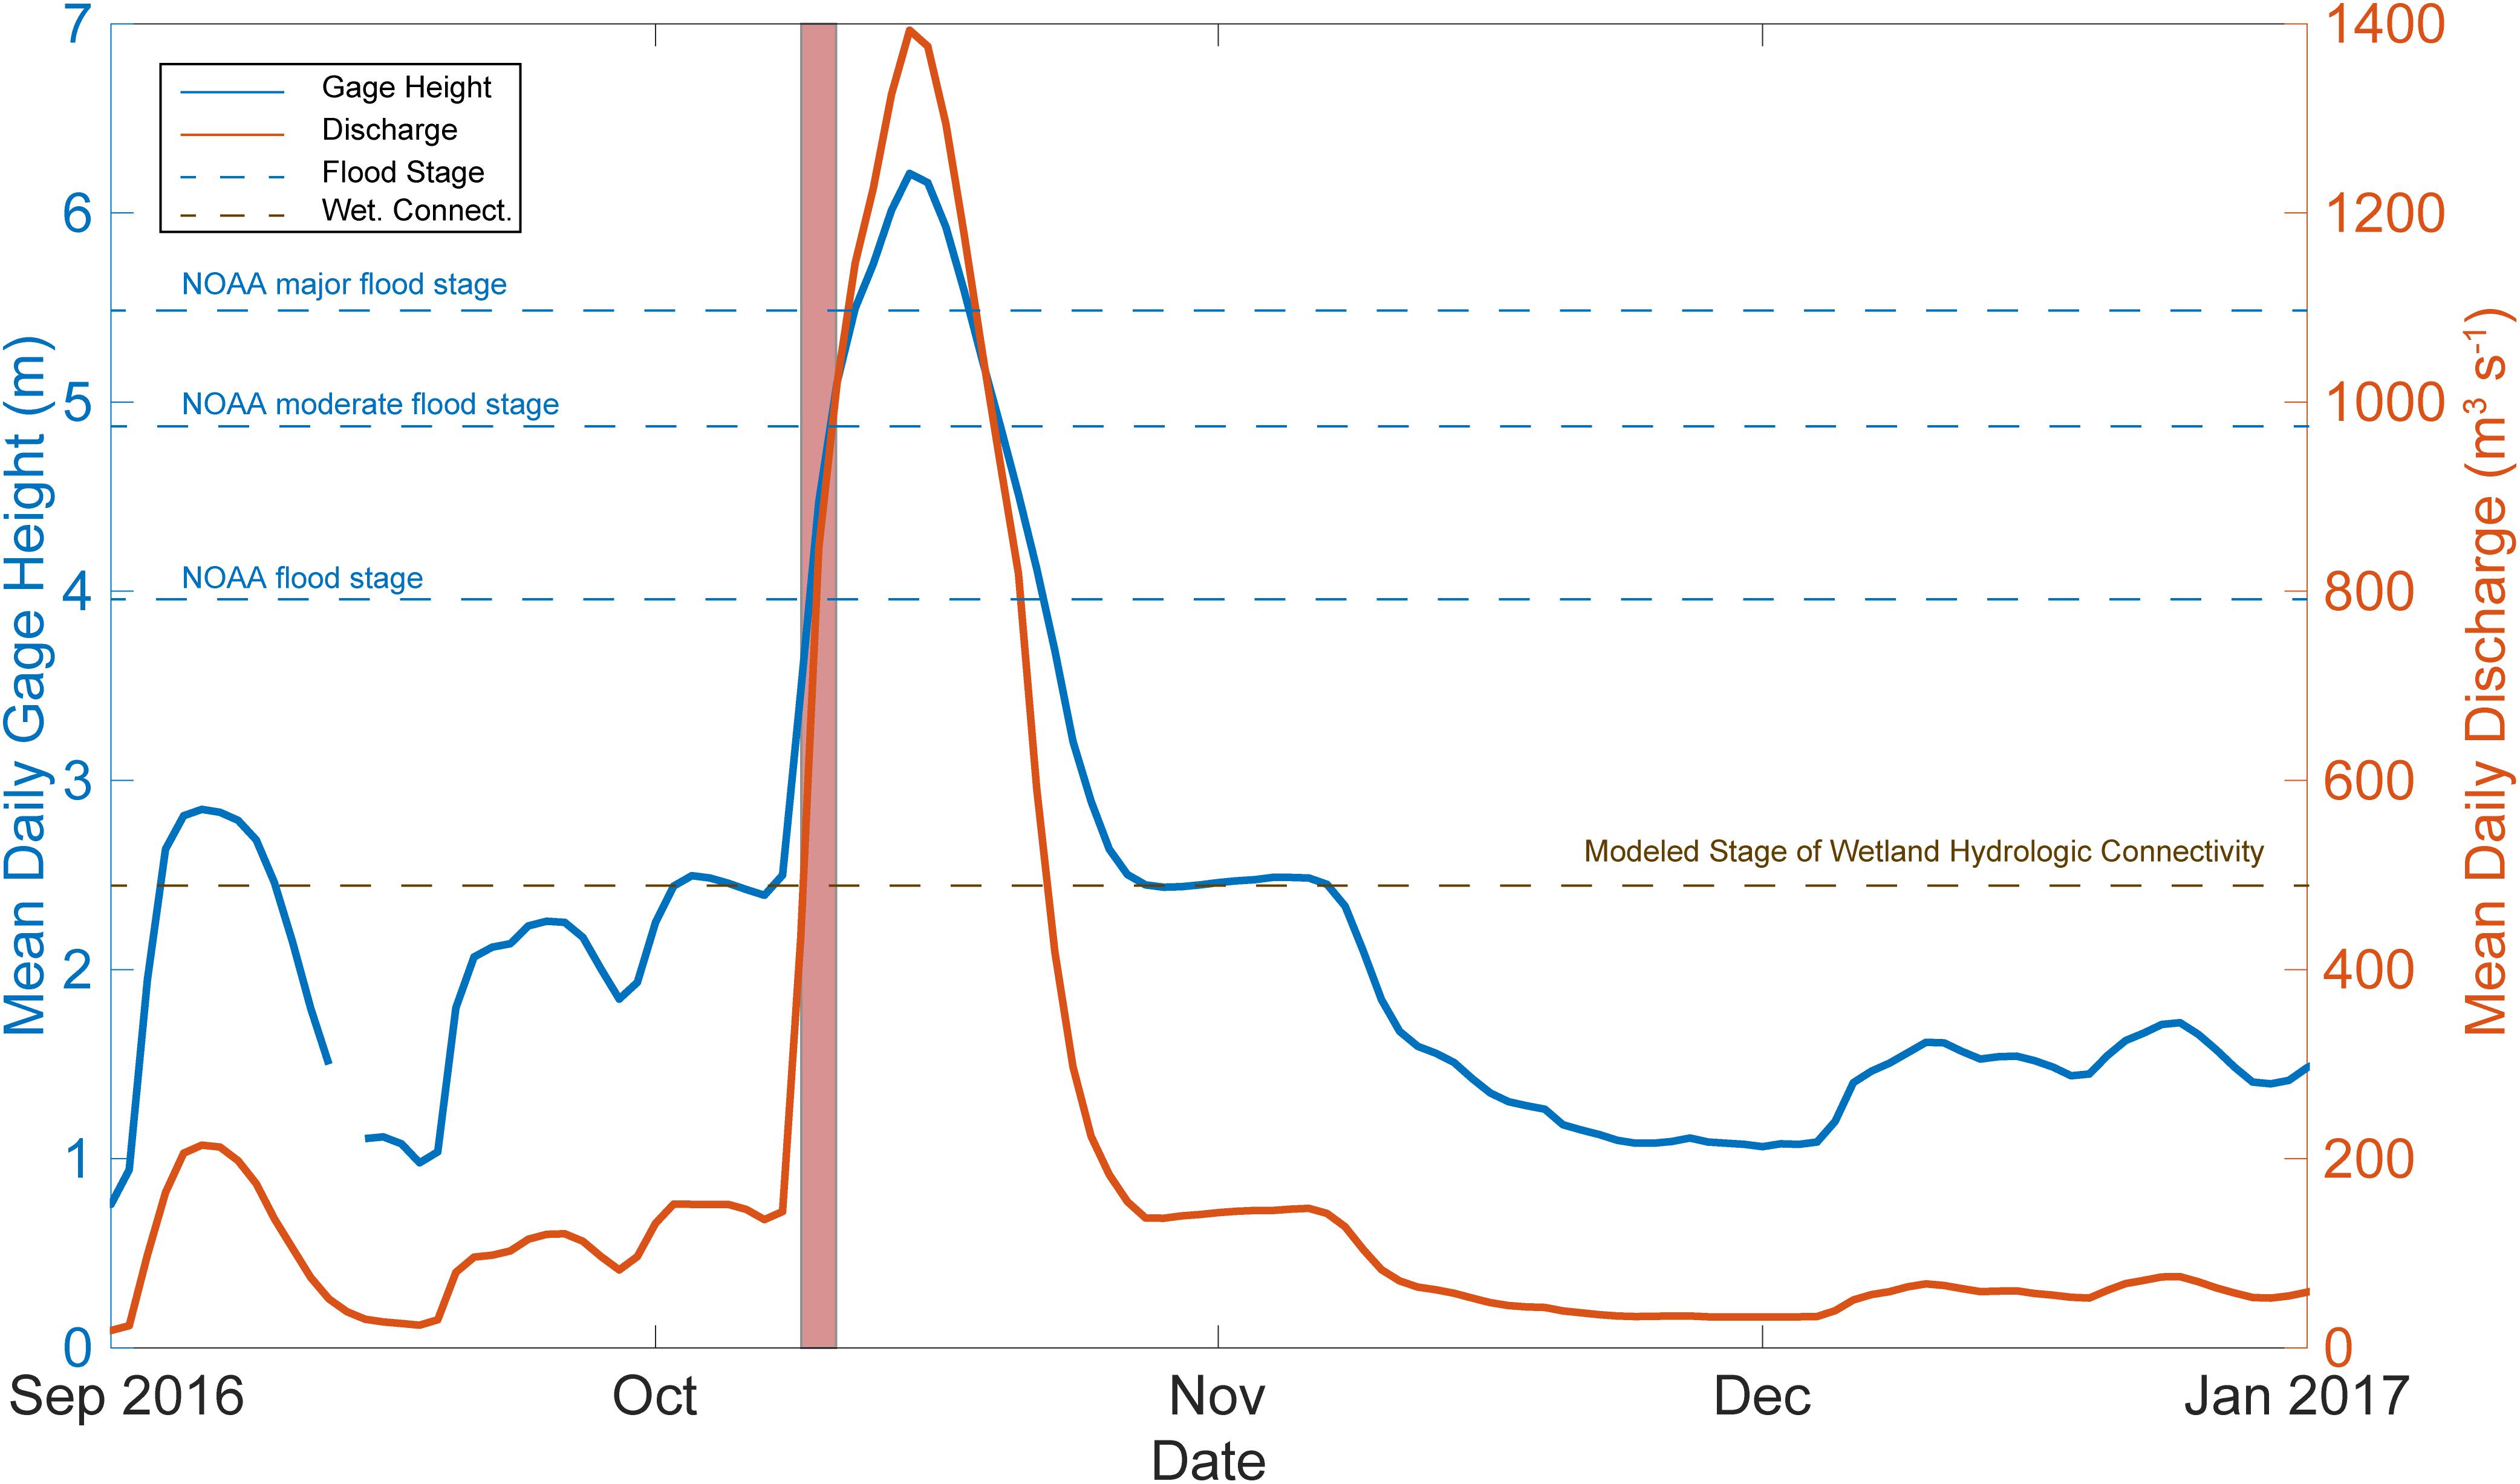
Figure 2. Hydrograph. Mean daily gauge height and mean daily discharge from USGS gauging station 02021814 near Fort Barnwell, NC prior to and after Hurricane Matthew (September 2016-January 2017). NWS flood stage, moderate flood stage, and major flood stage are plotted in blue dotted lines. Limit of wetland hydrologic connectivity from geospatial model plotted in brown dotted line. Red shaded box indicates period of Hurricane Matthew in North Carolina (08–10 October, 2016).
Flooding of semi-disconnected to disconnected freshwater wetlands adjacent to the Neuse River’s main channel between Fort Barnwell and ModMon sampling station NR0 at Streets Ferry Bridge was evident in satellite imagery comparing May and October 2016 (Figure 3). At low gauge height and low discharge, the wetlands were inundated with water; however, they were not connected via surface water to the Neuse River (Figure 3A). Groundwater connectivity was assumed, but not known, and is not considered in this study. During the high gauge height and discharge associated with Matthew’s rainfall, these wetlands became hydrologically connected to the Neuse River, which allowed for flushing of the water and OM present in these wetlands downstream into the NRE-PS (Figure 3B). This connectivity was apparent when examining results of the REM flood model (Figures 4, 5). During base flow and low gauge height conditions (0 m, REM) some wetlands were inundated (brown areas); however, the river was not connected via surface flow to these areas. The total area and volume that was flooded during base flow was 1.88 × 10⁷ m2 and 2.11 × 10⁶ m3, respectively, while the flooded wetland area and volume were 1.55 × 10⁷ m2 and 1.76 × 10⁶ m3. As the gauge height at Fort Barnwell, NC, United States increased, the areal and volumetric extent of wetlands that were inundated also increased. NWS flood stage (3.598 and 1.828 m; actual and relative gauge height, respectively) is the gauge height at which hydrologic connectivity of the wetlands to the Neuse River occurred (Supplementary Figure S3). AT and VT were 2.7 and 33.8 times larger during NWS flood stage than at base flow (5.03 × 10⁷ m2 and 7.12 × 10⁷ m3, respectively). Similarly, increases in the AW and VW were present during NWS flood stage (2.6 and 35.3 times larger than base flow, respectively). AT, VT, AW, and VW all increased similarly in the moderate and major flood stage models as they did in the flood stage model (Table 1). The VT and VW for the major flood stage were two orders of magnitude higher than at relative base flow (Table 1). Moderate and major flood stage models also had more areas of inundated ground surface that was not classified as wetlands (Supplementary Figures S4, S5).
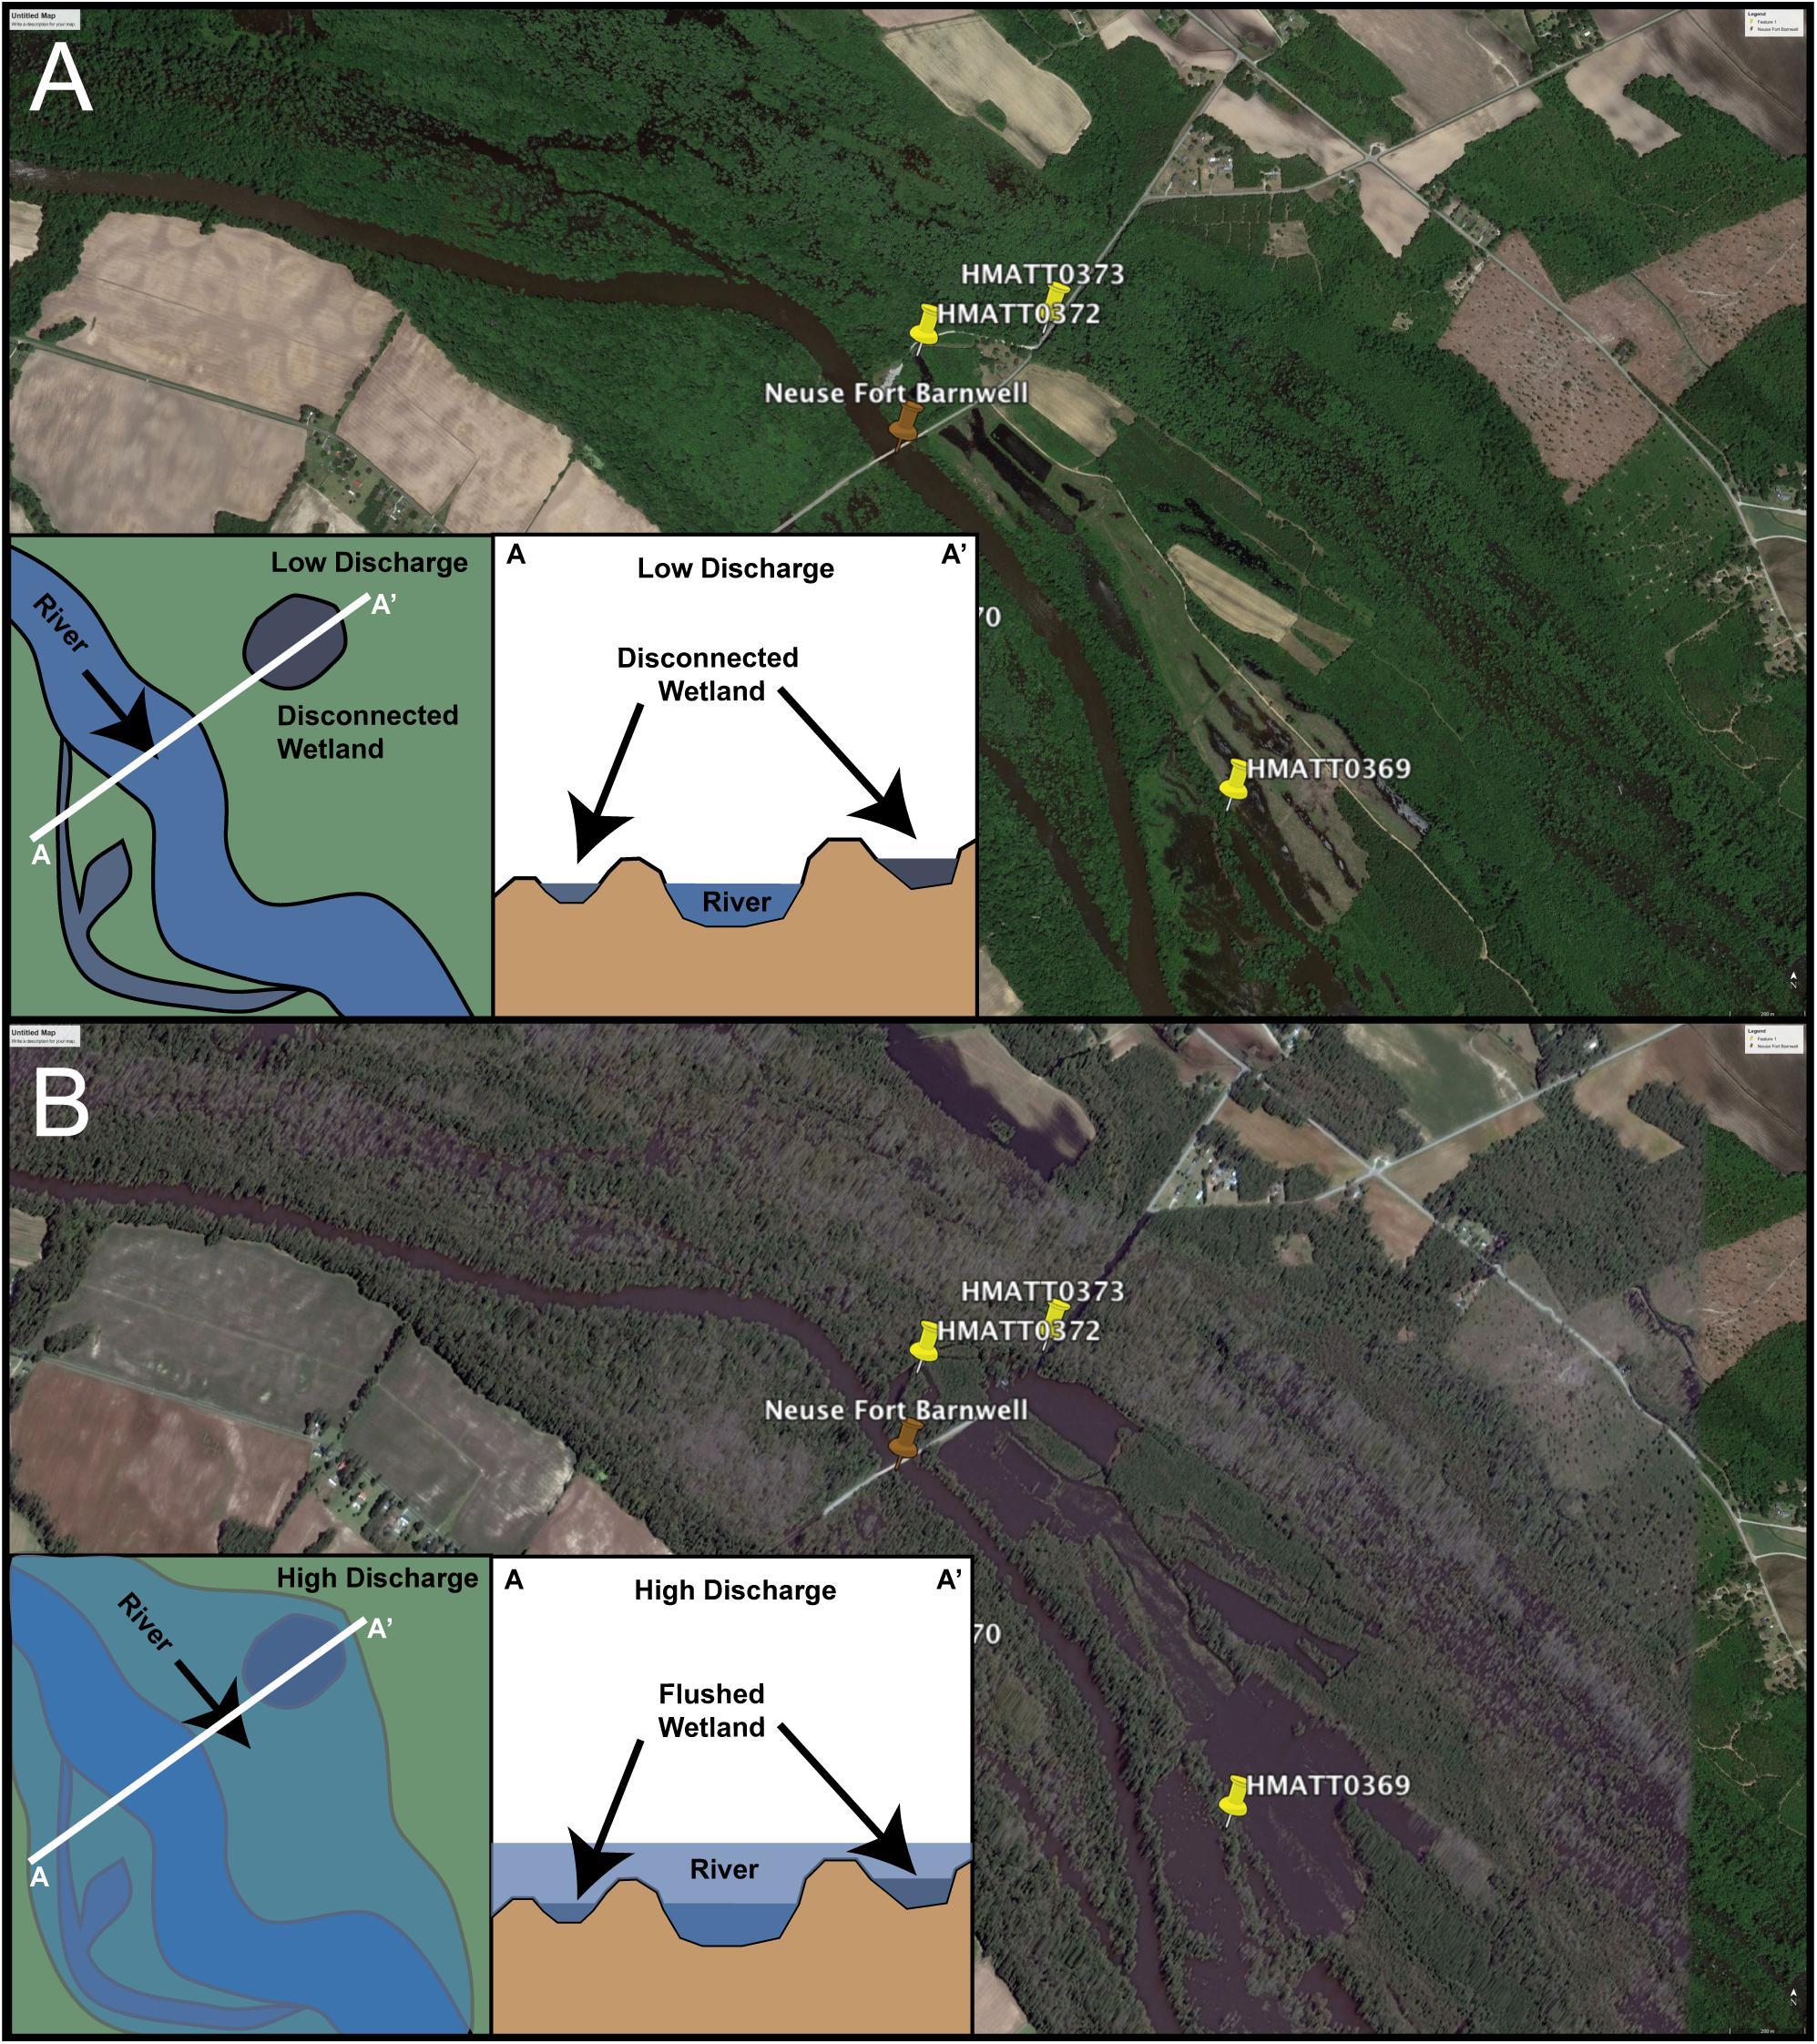
Figure 3. Conceptual diagram and Google Earth Imagery of flow conditions along the Neuse River riparian wetlands during (A) low discharge (base flow) and (B) high discharge (flood stage). Insets show conceptual model of (A) disconnected and (B) hydrologically connected wetlands. Map view is depicted in the left inset, while the right inset shows the cross-section line (A–A’). Image Data Source: 2019 Google, Maxar Technologies.
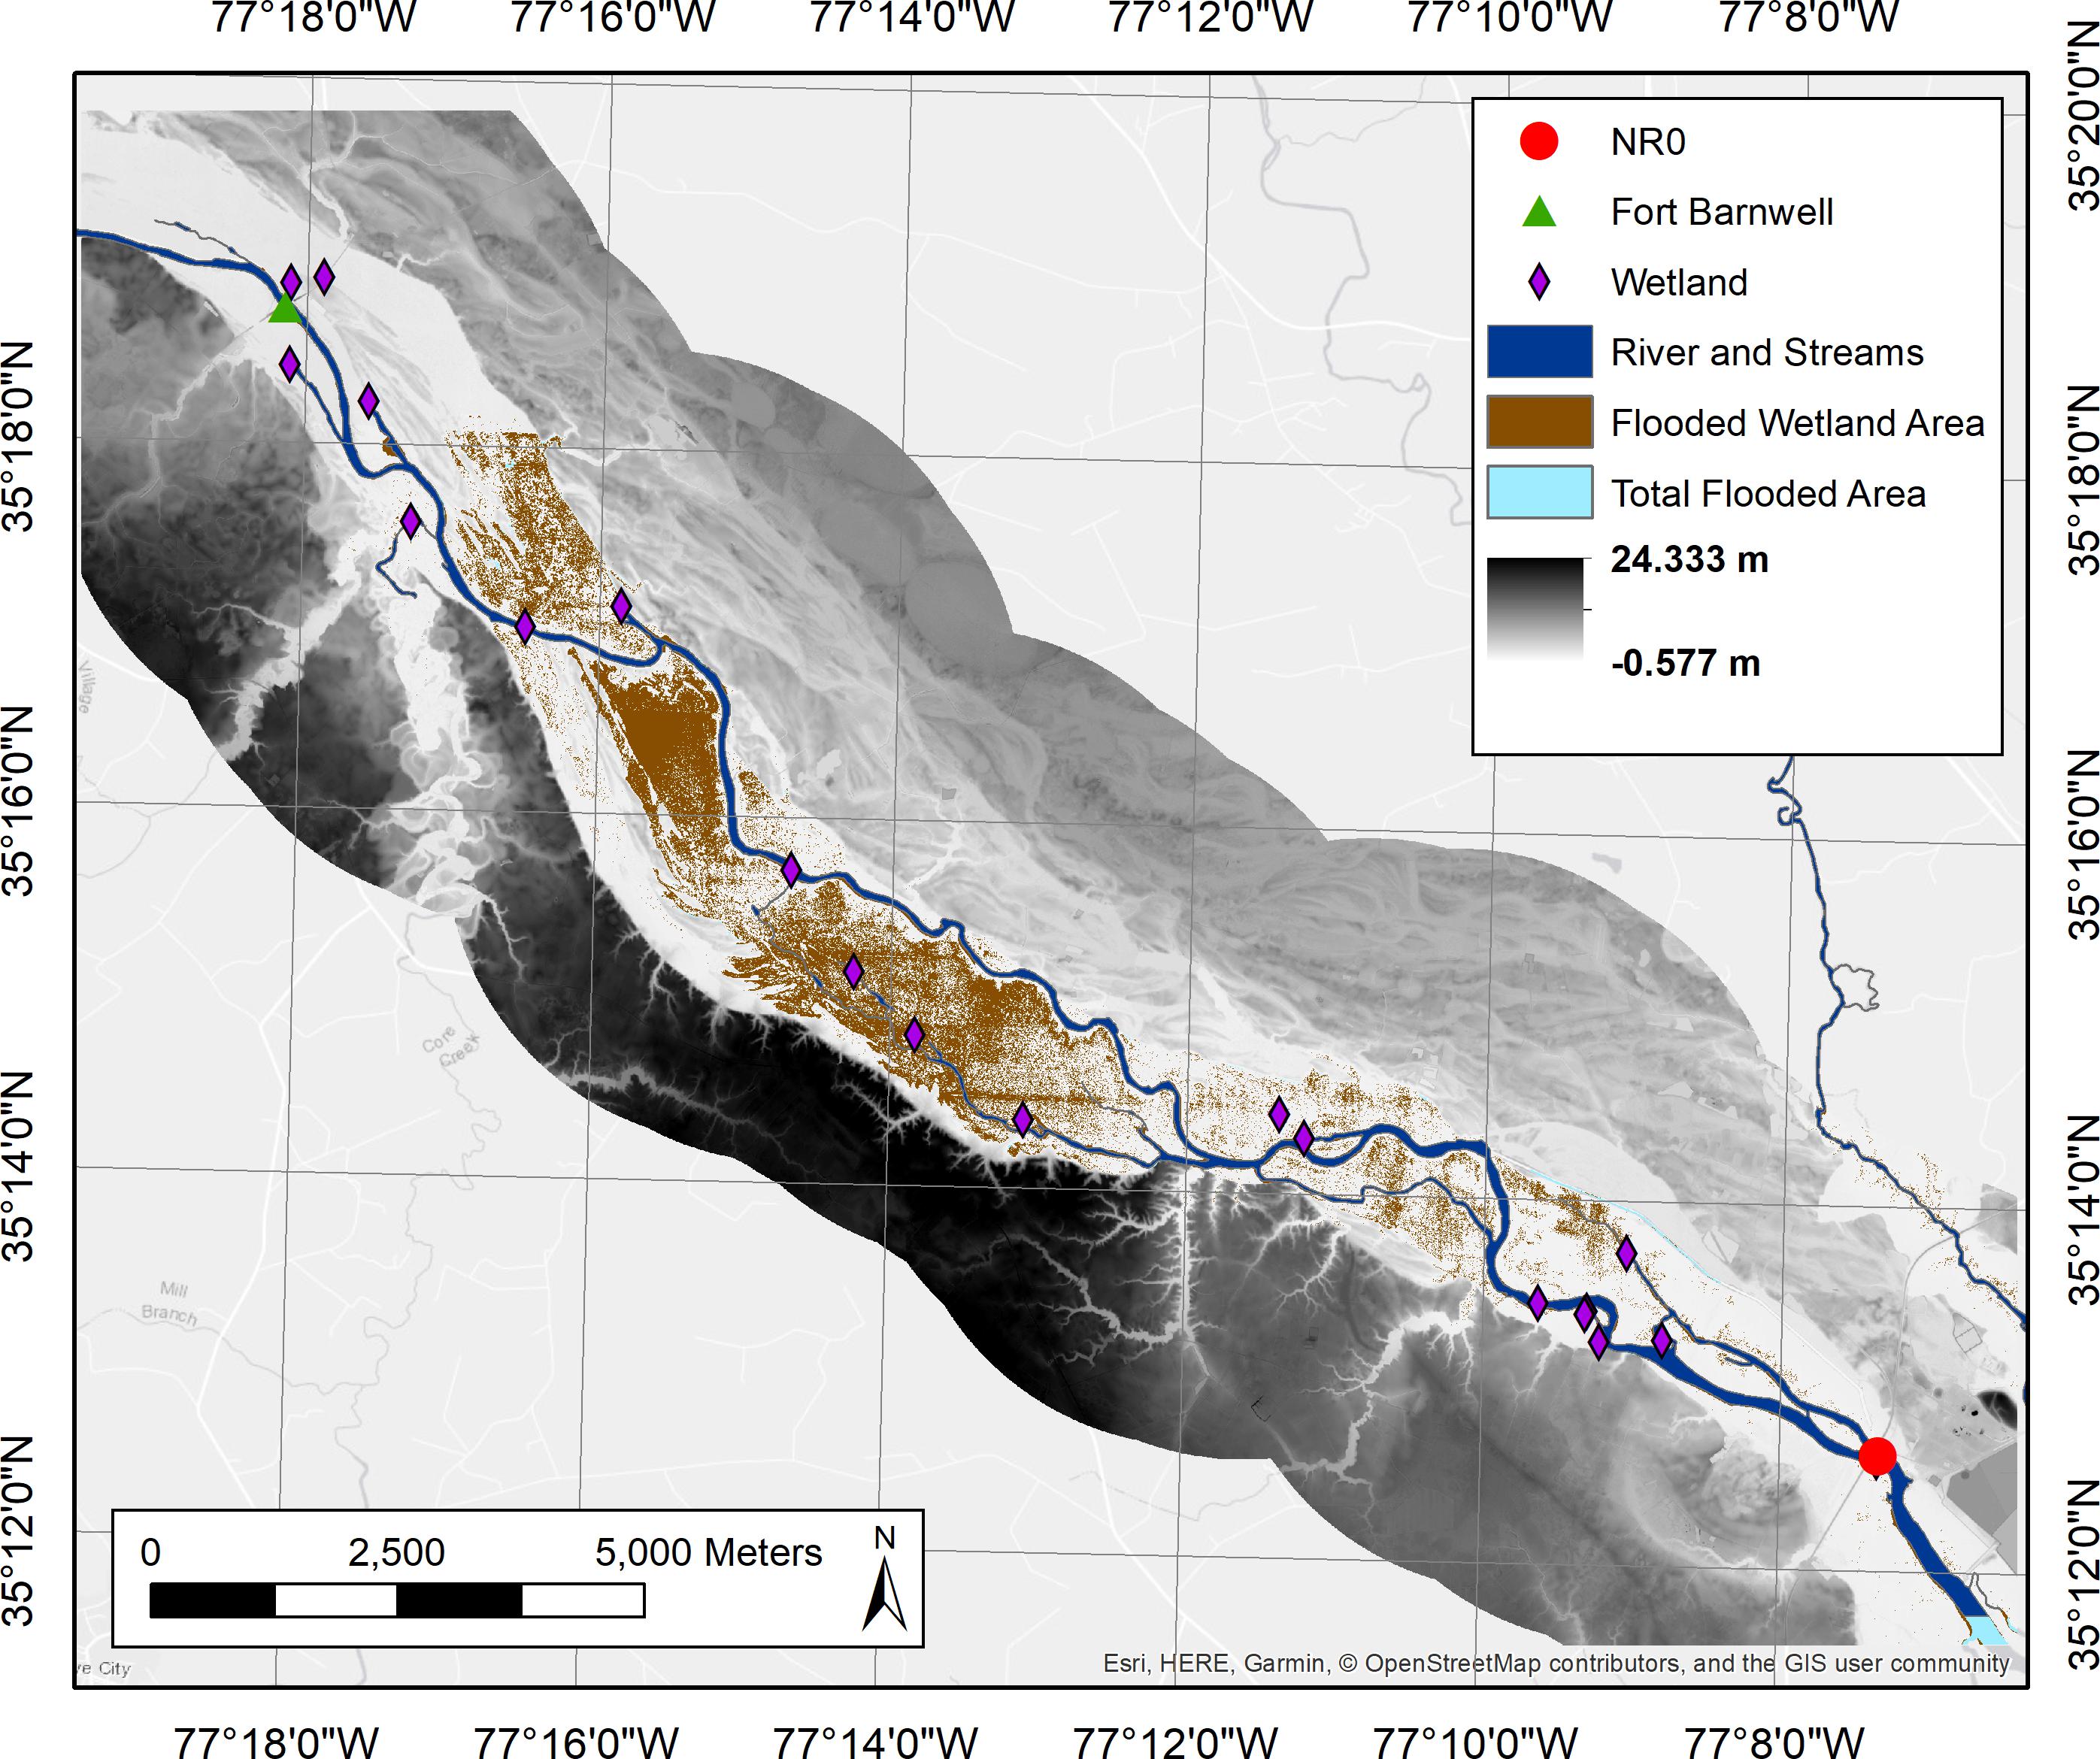
Figure 4. Map showing base flow gauge height at USGS gaging station 02021814 near Fort Barnwell, NC of freshwater wetlands with DEM (Black and White), flooded area (light blue), and wetland flooded area (brown).
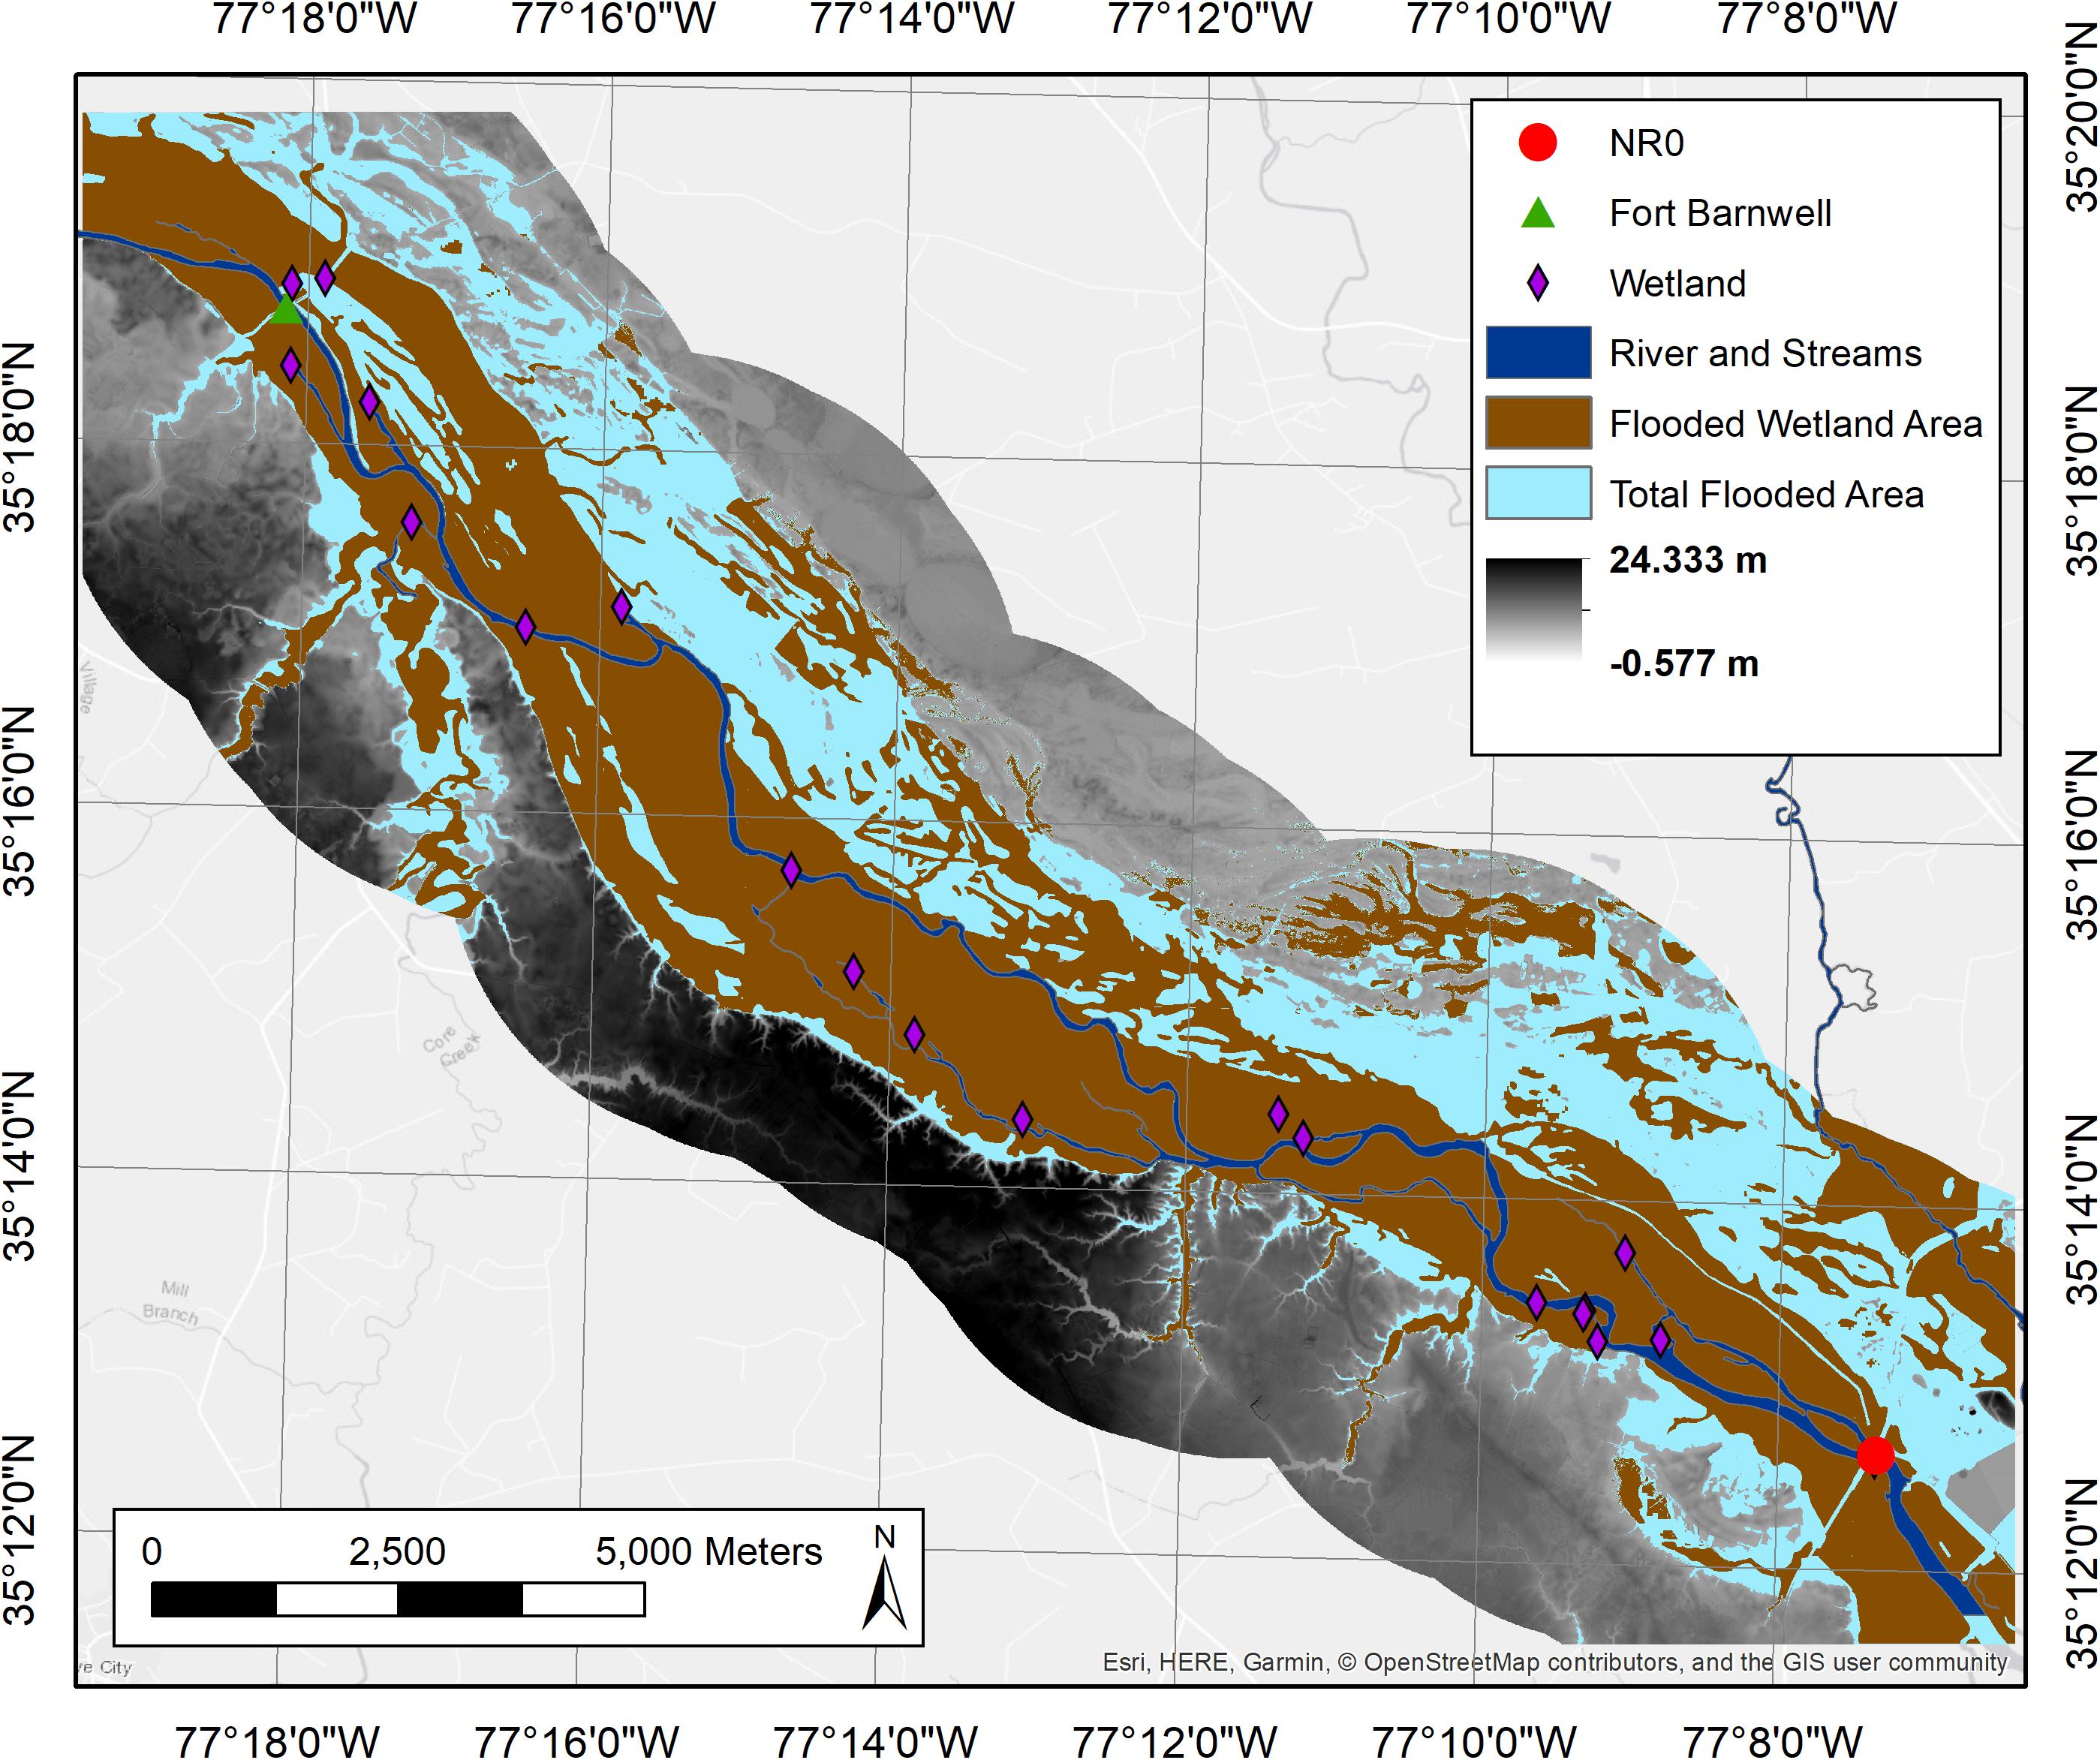
Figure 5. Map showing maximum gauge height (5.844 m) from 16 October 2016 at USGS gaging station 02021814 near Fort Barnwell, NC of freshwater wetlands with DEM (Black and White), flooded area (light blue), and wetland flooded area (brown).
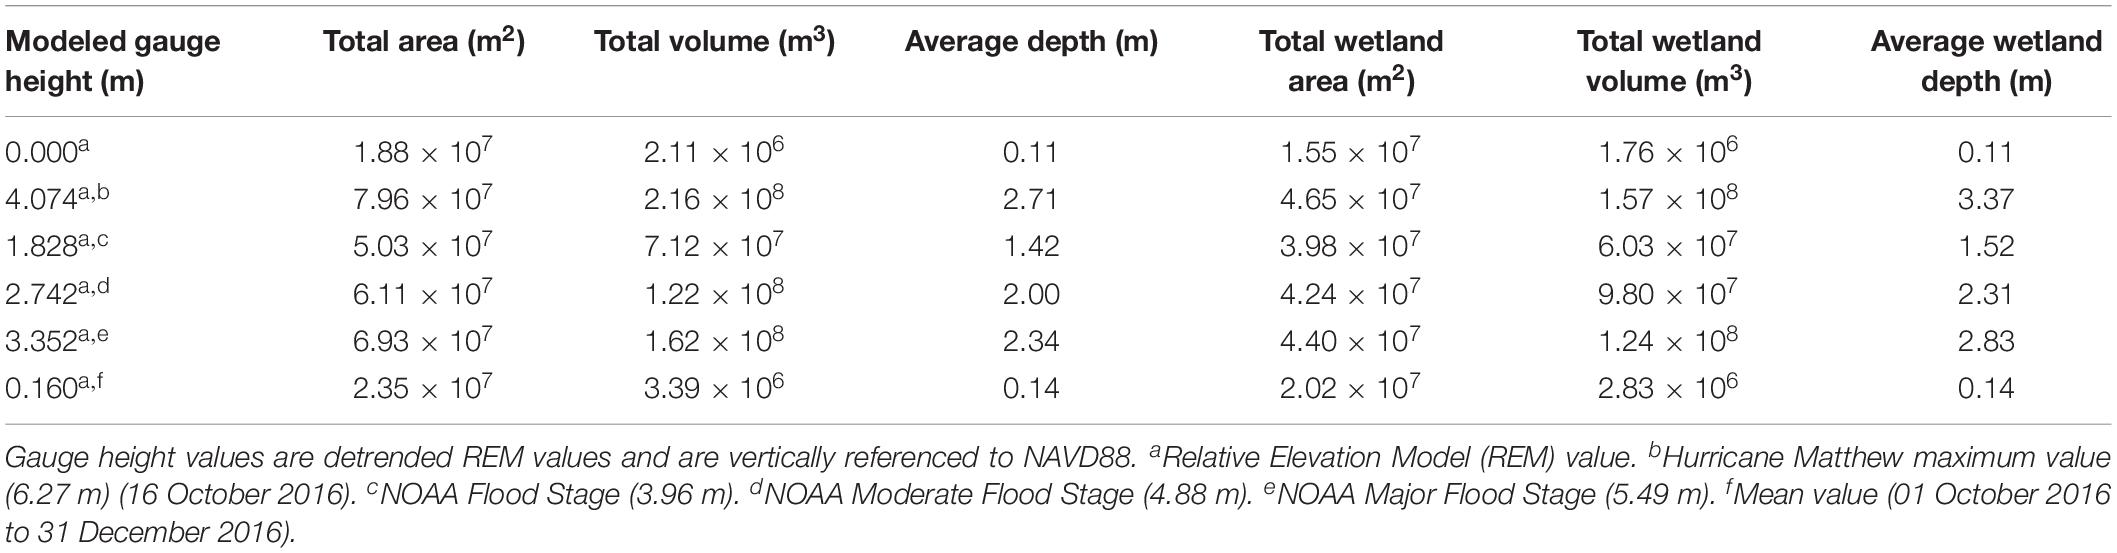
Table 1. Total flooded area, volume, and average depth for the total area and wetland area from geospatial flood model.
Following the passage of Hurricane Matthew over eastern NC, the peak of the flood pulse on 16 October 2016 caused the most flooding of the wetlands. The AT was 4.4 times greater than base flow, while the VT was two orders of magnitude higher than base flow (Table 1 and Figures 4, 5). Likewise, the AW (4.65 × 10⁷ m2) was ca. 3 times larger than base flow, and the VW (1.57 × 10⁸ m3) was two orders of magnitude greater than base flow (1.55 × 10⁷ m2 and 1.76 × 10⁶ m3, respectively). Also, the area of flooded land that was not considered wetlands was greatest at this gauge height (Figure 5). Comparatively, the AT, VT, Aw, and VW at the mean gauge height from 01 October to 31 December (1.930 m, actual; 0.160 m, REM; Supplementary Figure S6) was more similar to base flow than during the flood pulse (Table 1).
Model Estimates of DOC Fluxes Due to Hurricane Matthew
Flooding following the passage of Hurricane Matthew caused hydrologic connectivity of the riparian wetlands in the Neuse River’s floodplain with the main channel, and substantial export of DOC from the riparian wetlands into the lower Neuse River downstream and into the NRE and PS.
Once volumes were determined for the AT and the AW, the estimated DOC fluxes from the riparian wetlands and from the river into the NRE and PS were calculated using Eq. 3–6 (Table 2). Carbon mass loading from the wetlands was assumed to occur from the start of wetland connectivity until the wetlands became disconnected after the flood pulse had passed. This period was ca. 31 days (08 October through 08 November 2016). Connectivity was determined to occur at a gauge height above 0.7 m on the REM (actual gauge height 2.47 m). The gauge height at each day was matched with the model from different flood stages (2-days, maximum flood stage; 5-days, major flood stage; 3-days, moderate flood stage; 3-days, flood stage; 18-days, 0.7 m REM). These values were summed to determine the total DOC loading to the NRE.
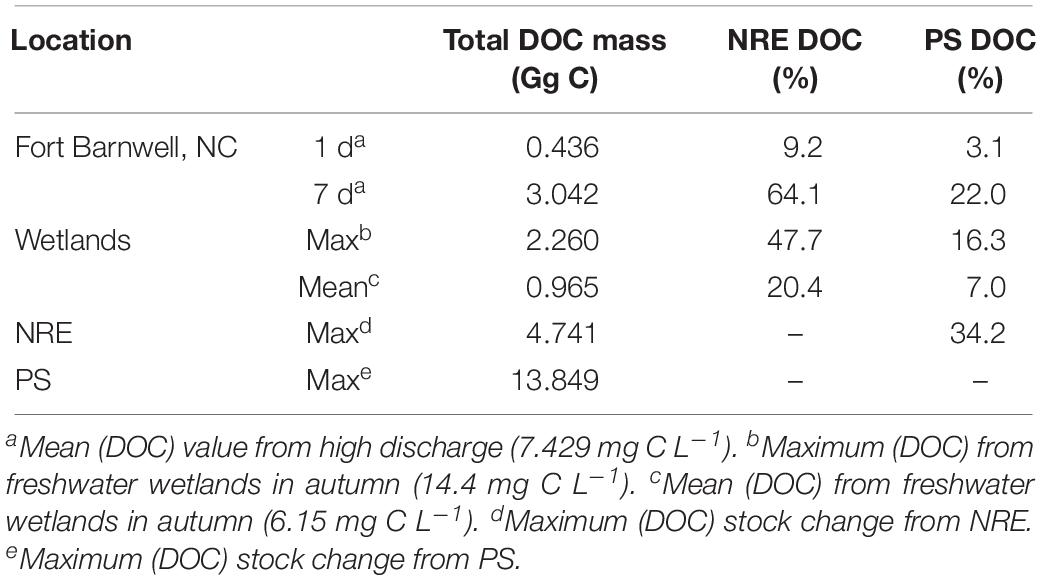
Table 2. DOC mass loading from Neuse River and freshwater wetlands into the NRE-PS, during hydrologic connectivity, in response to Hurricane Matthew.
The LDOCR was determined to be 3.76 Gg C, while the LDOCW was 12.65 Gg C, thus the total LDOCT was 16.41 Gg C (Table 3). Osburn et al. (2019a) determined the DOC stock change from the storm in the estuary using only concentrations and volume estimates was 4.74 Gg C. Therefore, the modeled LDOCT was ca. 12 Gg greater than the previously calculated DOC stock change. However, this discrepancy in DOC mass loading can be explained by the calculations for the DOC stock change from Osburn et al. (2019a) only covering 1 week of the sample period, while the LDOCT computed here using the flood model was done over the entire connectivity period (31-days), once that duration was known. Multiplying the DOC stock change in the NRE by 4 gives a value comparable to our modeled number (18.96 vs. 16.41 Gg C, respectively). For context with annual loads in this system, the hydrologic load estimator model, LOADEST (Runkel et al., 2004) was used to determine the estimated annual DOC load from the Neuse River during 2016 (51.32 Gg C) by using discharge data from Fort Barnwell combined with DOC concentrations throughout the year. Combined, LDOCR and LDOCW were a large proportion (ca. 32%) of the annual estimated load (7.3 and 24.6%, respectively; Table 3). It was clear from these model calculations that wetlands supplied the bulk of the DOC exported to the NRE-PS as a result of Hurricane Matthew.
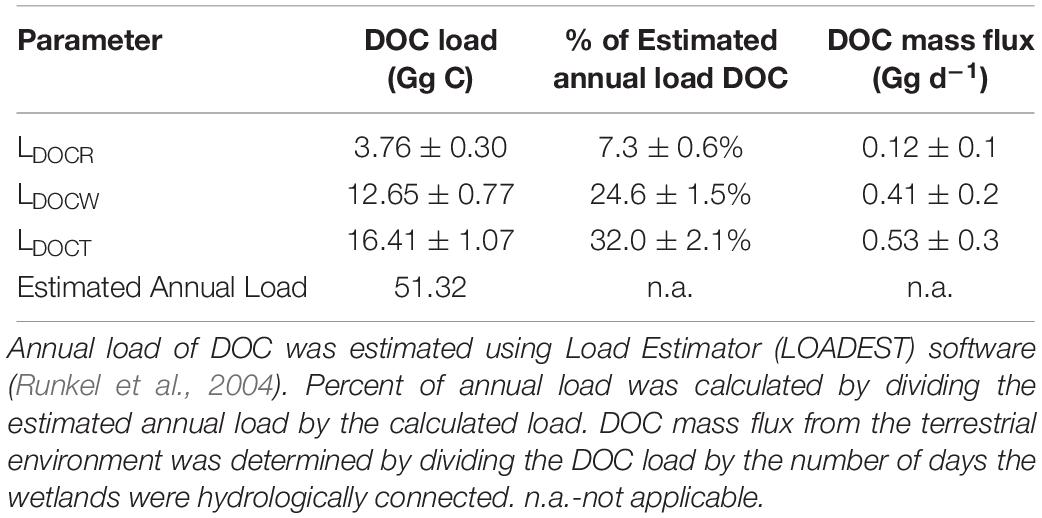
Table 3. Calculated load of DOC exported by Hurricane Matthew’s floodwaters for the Neuse River, wetlands, and the NRE.
Bayesian Monte Carlo Mixing Model of DOM Sources
The NRE was assessed both spatially and temporally using the BMC mixing model. The acceptance rates for our three end-member BMC mixing models ranged from 0.15 to 0.48 for the NRE and 0.31 to 0.49 for the PS. The average acceptance rates of each model were 0.30 and 0.41 (NRE and PS, respectively), which indicated that the PS model performed better than the NRE model (Table 4). Rosenthal (2011) suggested that BMC mixing models would provide accurate results if the average acceptance rates were between 0.1 and 0.6, while Lunn et al. (2009) indicated that average acceptance rates should be between 0.2 and 0.4, with 0.4 being optimal.
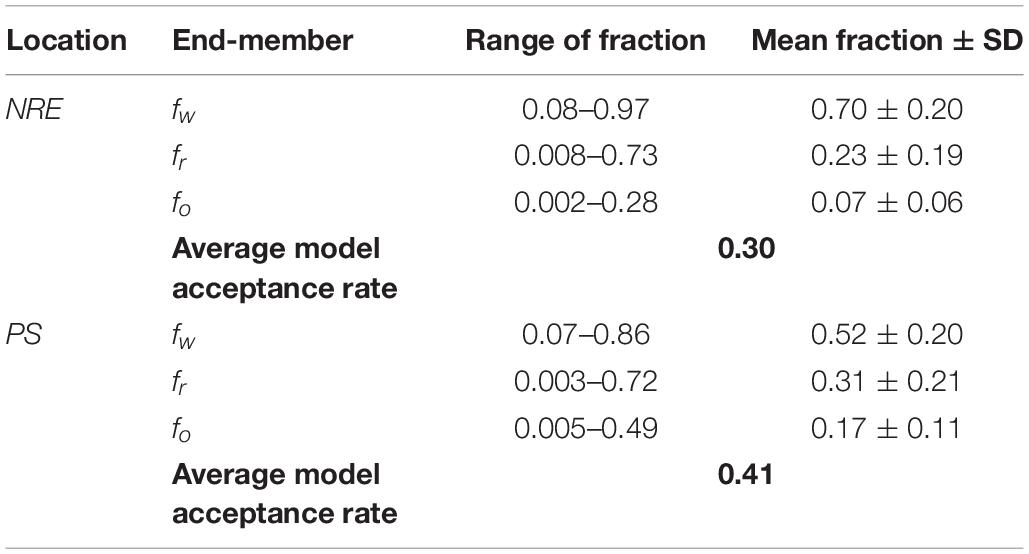
Table 4. Results of the best model output of fractional contributions from the BMC mixing model in the NRE and PS.
Similar to results from our geospatial model, the BMC geochemical mixing model showed that the wetlands were the largest contributor of DOC to the NRE and PS following Hurricane Matthew. Spatially across the entire NRE, the mixing model indicated the fw of DOC was the dominant contributor at ca. 40–90%, followed by the fr (10–50%), with the ocean end-member generally contributing the least (Figure 6A). Temporally, throughout the period of wetland hydrologic connectivity (08 October through 08 November), the source of DOC to the NRE was wetland dominated (Figures 2, 6). Once the river returned to baseflow in late November, there was a transition to a more mixed water source with the river source dominating the DOC (Figures 2, 6).
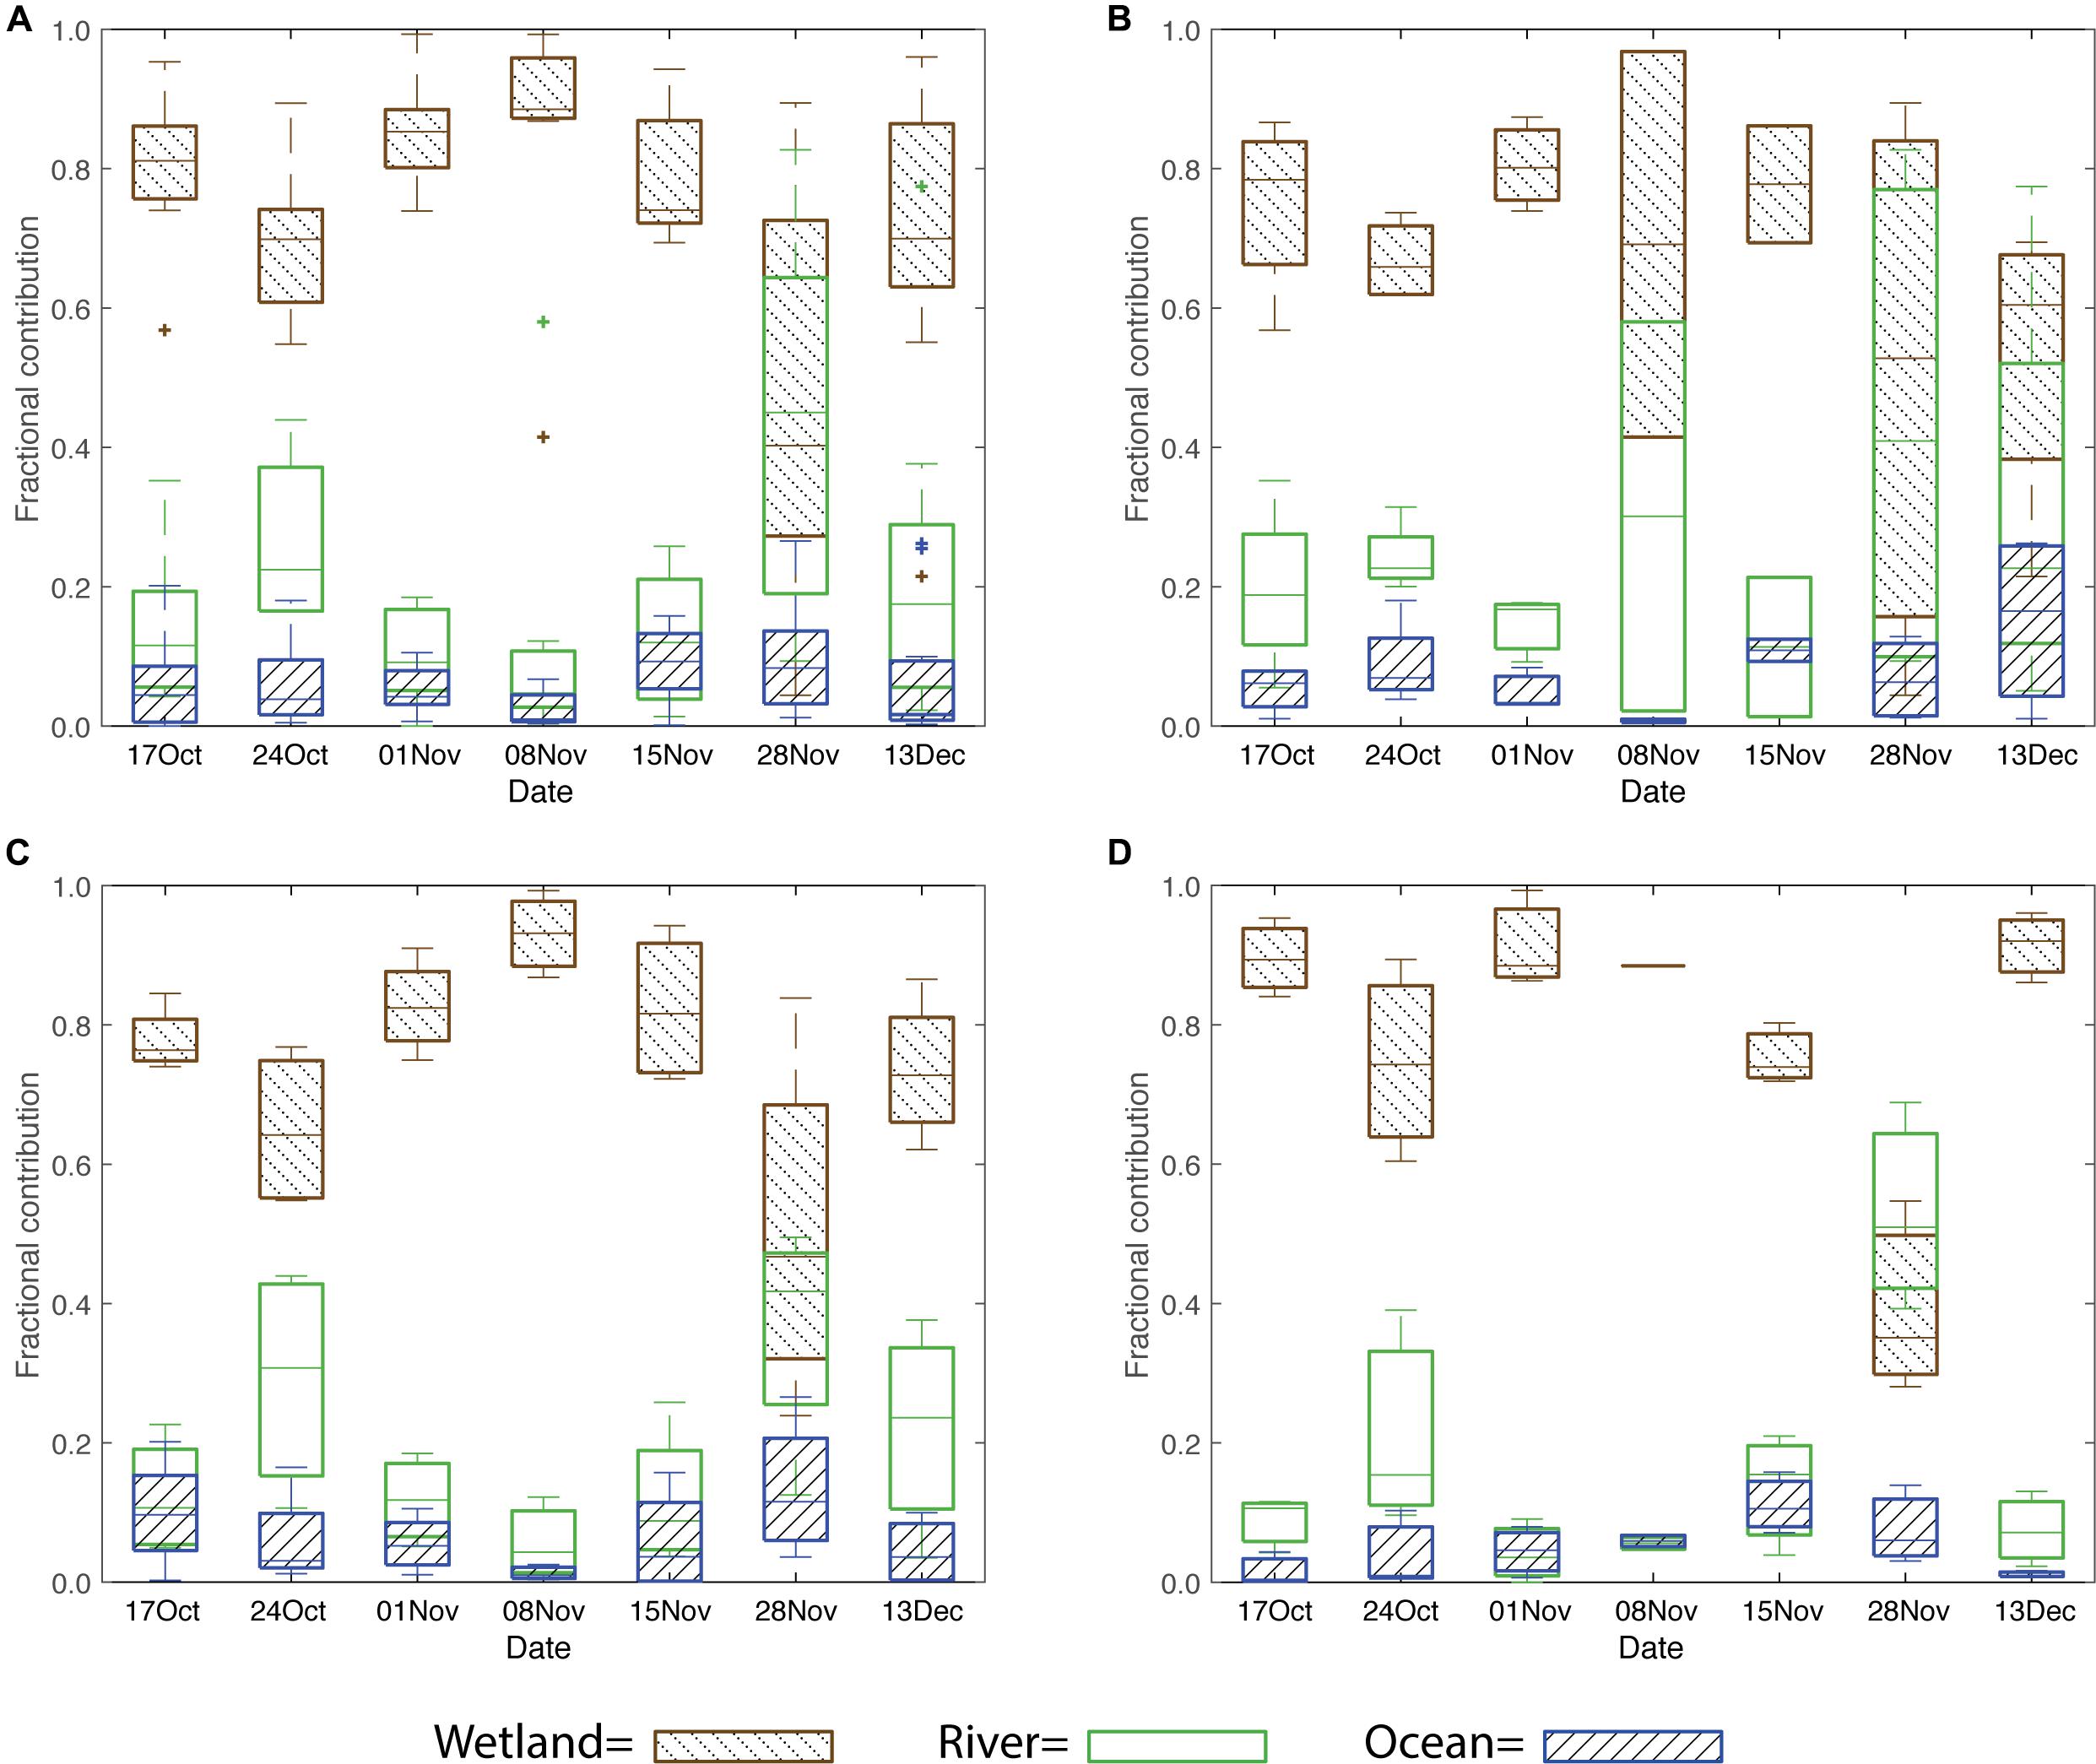
Figure 6. Best fit calculated fw, fr and fs for (A) the entire NRE, (B) upper NRE, (C) middle NRE and (D) lower NRE in October through December 2016. On each boxplot: colored line is median, lower and upper extent of box refers to 25th and 75th percentiles, respectively, the whiskers on ends of box are range of samples, not considered outliers, and colored (+) are outliers.
Examining the source fraction contributions to the estuary spatially showed how the wetland source decreased downstream (Figure 6). The estuary sites were spatially divided into upper, middle and lower sections. The upper section included sites NR0-NR50, while the middle section included sites NR60-120 just before the bend in the estuary (Figure 1B). The lower section included the remaining sites downstream of the bend in the estuary into southern Pamlico Sound (NR140-NR180). The fw was predominant in each section of the estuary with few exceptions. In the upper section, there were two sample dates where the river and wetland contribution indicated mixing (28 November and 13 December), after hydrologic connectivity occurred (Figure 6B). For all spatial sections of the estuary, the fr and fw overlapped on 28 November during the lowest flow of the sampling period (Figures 2, 6B–D).
The fractional contribution of wetlands, river, and ocean for PS sites were only examined temporally, due to the spatial proximity of the PS sampling sites (Figure 1B). Within the PS, the fw ranged from ca. 35–65%, which was lower than fractions in the estuary, due to continued dilution of this source from the upstream wetlands. During the initial sample day (27 October) ca. 3 weeks after the storm, the fr was the largest contributor to the PS (Figure 7). However, once the initial flood pulse reached the PS (02 November) the wetland became the larger contributor. On 09 November mixing of these three sources was apparent due to overlap between the fr, fw, and fo. The remaining sampling period indicated that wetland DOM was dominant in the PS (Figure 7).
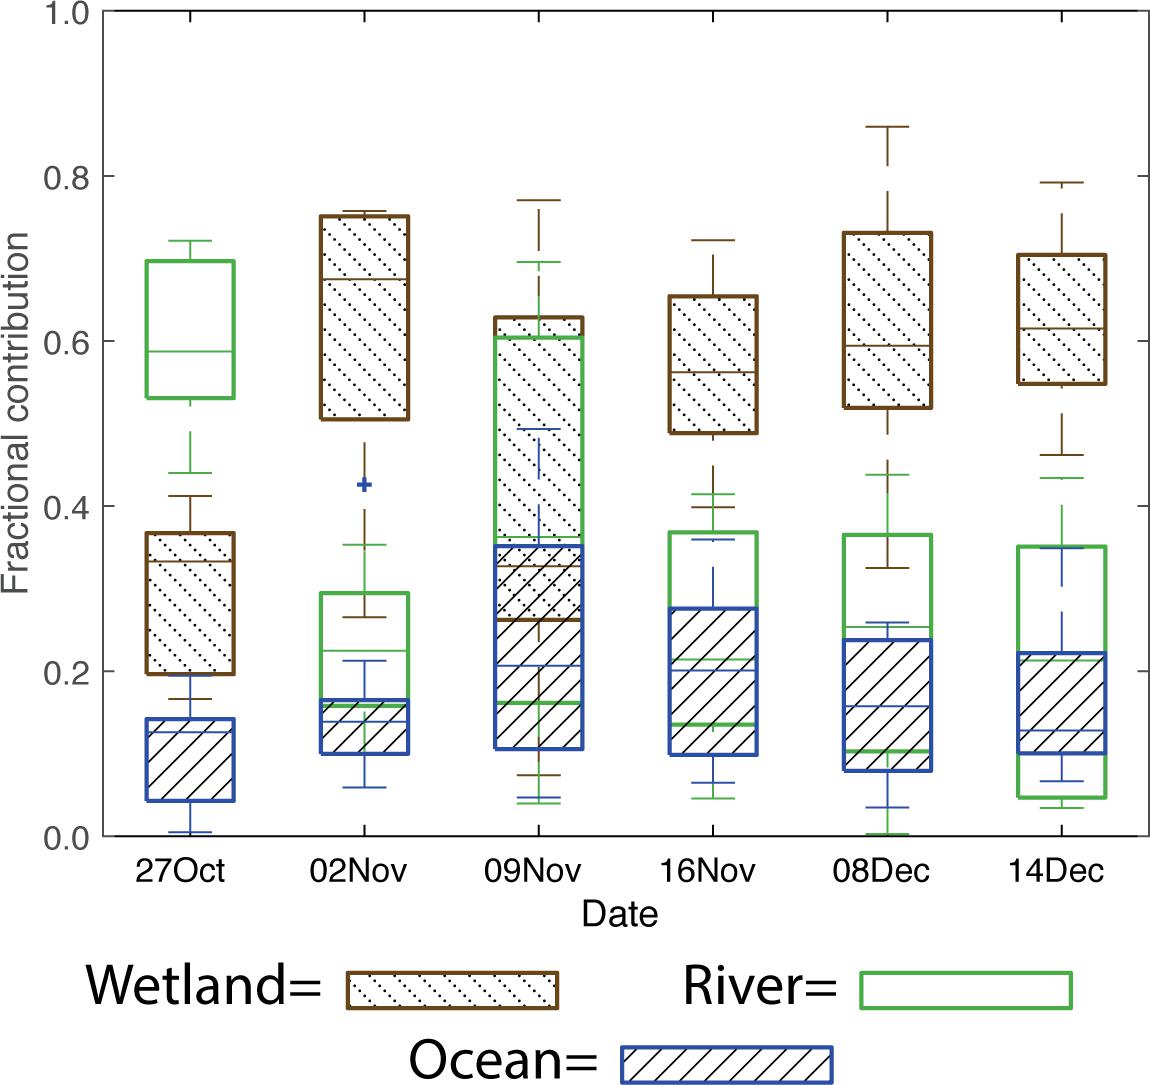
Figure 7. Best fit calculated fw, fr and fs for the entire PS in October through December 2016. Colored line is median, lower and upper extent of box refers to 25th and 75th percentiles, respectively, the whiskers on ends of box are range of samples, not considered outliers, and colored (+) are outliers.
Because the BMC mixing model accounts for natural variance in end-member compositions, measurement uncertainty, and factors in the variance and covariance of geochemical indicators, it produces uncertainties associated with each most likely fraction contribution of each end member. The uncertainties associated with the estimated fractional contributions are represented as error bars in Figures 6, 7 and decrease with the degree to which the end-member geochemical compositions are distinguishable from one another. For NRE and PS samples with overlapping end-member fraction contribution estimations, Figures 6, 7 still show the most-likely fraction contribution but overlapping error bars indicate there is a much less-likely possibility that the fractions exist within the overlapping space. However, the observed fraction contribution trends for our NRE and PS samples and findings from our geospatial model strongly indicate the BMC most likely contributions are likely valid.
Discussion
The main hypothesis of this study was that flooding of freshwater riparian wetlands surrounding the Neuse River, would become a major component of DOM in the NRE-PS due to hydrological connectivity. This hypothesis was confirmed in two ways. First, by expanding on an existing flood model to quantify the areal extent and volume of flooded wetlands via their hydrological connectivity to the main stem of the river, we determined the volume of water (and then using concentrations, DOC) exported from the wetlands to the NRE-PS (Table 4 and Figures 4, 5, Supplementary Figures S3–S6). Second, this study combined stable C isotope, SUVA254, and SR values in a Bayesian Monte Carlo mixing model to determine estimates of the wetlands’ contribution to DOM in both the NRE and PS (Figures 6, 7).
This study revealed the substantial contribution of riparian wetlands to the DOC flux from a coastal watershed into receiving waters following a major hurricane. Within the context of the Pulse-Shunt concept, we discuss how our new combination of geospatial and geochemical modeling provides solid estimates on not only the magnitude of DOC fluxes from extreme events but also insight into where the DOC originates. Combined, these modeling approaches offer a key means to track source and fate of DOC delivered to coastal waters after an extreme event. Implications of the exported DOC in coastal waters are discussed.
Pulse: Wetlands as a Primary Source of DOC to Coastal Waters Following an Extreme Weather Event
Applying the PSC to our results, the change in DOM quality in the estuary and sound was attributable to the pulse of wetland DOM caused by their flooding and hydrological-connectivity to the Neuse River. Using the flood model, it was determined that initial connectivity of the wetlands to the main channel of the Neuse River occurs between a gauge height of 2.274–2.774 m (0.5–1.0 m, REM), though the exact level is variable between the upper and lower wetlands. For context, mean annual gauge height at Fort Barnwell has ranged from 1.32 to 1.98 m over the past 17 years, while mean annual discharge at Fort Barnwell has ranged from 50 m3 s–1 to 181 m3 s–1 over the past 21 years (U.S. Geological Survey [USGS], 2018). Therefore, the increase in downstream export of wetland OM could occur prior to NWS flood stage at Fort Barnwell (3.598 m). This metric is important to establish for coastal rivers with respect to wetland pulses in terrestrial DOC export. Spencer et al. (2013) showed very strong correlation (R2 = 0.81) between export of CDOM as a marker for terrestrial DOC, and the percent of wetland in a watershed. Hanley et al. (2013) found high positive correlation (R2 = 0.91) of watershed %wetland cover with SUVA254 values in coastal rivers. The watershed% wetland in the Neuse River watershed is 13% (Osburn et al., 2016), which is comparable to the wetland-rich eastern North American rivers (e.g., the Edisto and the Androscoggin) which export substantial amounts of CDOM to the ocean (Spencer et al., 2013).
Geochemical results from this study further indicated a substantial impact on DOM quality in the estuary and sound from wetlands. Ranges of wetland DOM δ13C and SUVA254 values after Matthew (−29.4 ± 0.7‰ and 4.94 ± 0.5 L mg C–1 m–1, respectively; Supplementary Figure S8) overlapped with NRE and PS values after the storm (Osburn et al., 2019a). By contrast, mean (± SD) δ13C-DOC values for the NRE during a low flow period in 2010–2011 was −25.4 ± 2‰, while mean SUVA254 values were 2.9 ± 0.7 L mg C–1 m–1 (Osburn et al., 2016). Marine-sourced DOM generally has enriched δ13C-DOC values, ca. −20 to −23‰ (Supplementary Table S3; Raymond and Bauer, 2001), and SUVA254 values <2.0 L mg C–1 m–1 (Helms et al., 2008) when compared to terrestrial organic matter. Coastal plain wetland DOM is −27 to −29‰ (Opsahl, 2005; Vähätalo and Wetzel, 2008) while SUVA254 values typically are greater than 3.0 L mg C–1 m–1 (e.g., Hall et al., 2008). Mean δ13C-DOC and SUVA254 values of the NRE after Hurricane Matthew (−28.5 ± 1.1‰, 4.1 ± 0.6 L mg C–1 m–1; Supplementary Figure S8) were strikingly similar to those of the freshwater reach of the nearby Newport River Estuary which drains a Cypress swamp (−28.5 ± 1.0‰ and 5.3 ± 0.4 L mg C–1 m–1; Osburn et al., 2019b; Supplementary Figure S8). This means that an increasing wetland influence on DOM results in its characteristics having high SUVA254 and depleted δ13C-DOC values.
Hence our results strongly suggest the influence of wetlands in the DOM characteristics of the Neuse River, its estuary, and Pamlico Sound. While the range of our riverine δ13C-DOC values (−25.9 ± 0.6‰) were similar to results reported from other rivers in the literature including the Tar (NC) and Santa Clara (CA) Rivers (Supplementary Table S3), the relatively depleted estuarine δ13C-DOC values and high SUVA254 values were consistent with observations of the riparian wetlands. This shift to depleted isotope values is consistent with flooding: in the lower Mississippi River, where for example, δ13C-DOC values decreased from −25.5 to −27‰ as discharge increased (Cai et al., 2015).
Finally, comparing the flood and geochemical modeling approaches revealed similar estimates of wetland contributions to DOC in the estuary and sound, therefore providing independent measures of the pulse. The flood model estimated that 77% of the DOC load from Matthew was due to wetlands (Table 3). This model was purely physical in the sense that DOC concentration and water volumes were the two parameters used to compute relative fractions of wetland and river in the DOC load. The BMC mixing model estimated that 70 ± 20% of NRE DOM and 52 ± 20% of Pamlico Sound DOM exhibited a wetland character, considering only mixing of river, wetland, and oceanic sources in both systems (Table 4). Segmentation of the NRE into upper, middle, and lower regions further attested to the strong influence exerted on DOM properties by wetlands (Figures 6B–D). Segmentation also provided a view of the time-lag of the wetland influence on DOM in the estuary. For example, wetland contribution in the middle estuary peaked at ca. 85% on 08 November, falling to roughly 50% 2 weeks later (Figure 6C). In the Pamlico Sound the% wetland contribution was consistent at ca. 60% from 02 November through 14 December (Figure 6D). The segmentation and time-series results indicated that the wetland characteristics remained a prominent feature of the NRE and PS for nearly 3 months following Matthew (Osburn et al., 2019a).
Shunt: Rapid Delivery of a Majority of DOC Coastal Waters in Response to an EWE
Inland precipitation related to Matthew resulted in a “shunting” of the wetland “pulse” of OM into the NRE-PS which dramatically increased its stock of DOC. Use of long-term monitoring data sets such as ModMon in the NRE-PS allowed for comparisons to be made between extreme events and long-term averages in these systems. We combined analyses from this study with long-term trends in DOC to determine what effect Hurricane Matthew’s floodwaters had the shunt of DOM to the NRE-PS.
Osburn et al. (2019a) indicated there was ca. 65% increase in DOC stock in the NRE-PS in response to Hurricane Matthew. When comparing our results from the geospatial and geochemical models, we observed that both produced similar fractional estimates for the river (23%) and wetland end-members in the NRE (70 and 77% for the geochemical and flood models, respectively). The similarity in these estimates is encouraging and demonstrates the need to incorporate lateral flooding of wetlands in coastal watersheds to provide best estimates of C export from land to coastal waters.
About 30–70% of annual DOC export from watersheds occurs following storms (Raymond and Saiers, 2010). Hurricane Matthew’s floodwaters caused a total terrestrial DOC load of 16.41 Gg C between 08 October and 08 November, during the period that the riparian wetlands were hydrologically connected to the Neuse River. This episodic load of DOC accounted for ca. 32% of the estimated annual load of DOC for the NRE (Table 4) which is similar to what other studies have shown in larger systems. For example, flooding from storm events in the Lower Mississippi River Basin in 2011 caused the DOC export from the Atchafalaya River to coastal waters to increase from ca. 5 to ca. 22 Gg C d–1. This increase accounted for ca. 50% of the annual carbon load (Bianchi et al., 2013). Our results indicate that due to the hydrologic connectivity of the wetlands upstream of the estuary, around 70–77% of the 32% annual load increase in the NRE can be attributed to the wetlands. Similarly, Majidzadeh et al. (2017) indicated that in the Yadkin-Pee Dee Hurricane Matthew exported a large amount of wetland DOC.
Our flood model estimates of DOC flux were conducted using a different approach than prior work, which strongly suggests a convergence on accurately estimating the DOC load caused by storms. For example, Paerl et al. (2018) estimated ca. 19 Gg of DOC loading from storm events in the estuary during 2016 using the Weighted Regressions on Time Discharge and Season (WRTDS; Hirsch et al., 2010; Hirsch and De Cicco, 2015) model. When compared to other storm events in the NRE the present DOC mass loading results were higher than estimated DOC loads from Hurricanes Fran (1996) and Irene (2011) although much lower than estimates from the combination of sequential Hurricanes Dennis, Floyd, and Irene in 1999 (7.4–8.4, 14 (TOC), and ca. 60 Gg C, respectively; Brown et al., 2014; Crosswell et al., 2014; Paerl et al., 1998; Paerl et al., 2018).
The Pulse-Shunt concept proposed by Raymond et al. (2016), was based on headwater fluvial systems but describes the dynamic we have modeled for coastal rivers and estuaries. First, during high discharge, from a low-frequency, large storm event, regional flooding inundates wetlands, with the hydrologic-connectivity of wetlands to the main channel of the river facilitating a flushing of DOM into the river and downstream to receiving waters. Second, as for lower order streams and rivers, estuaries could be turned into passive pipes. Evidence for the NRE existing in a passive pipe mode comes from characteristic where up to ca. 40% of the river’s annual load of terrestrial DOM was shunted downstream into Pamlico Sound. Moreover, this last point is important; this study demonstrated the lingering effect of these episodic and infrequent storms and suggest that coastal ecosystems such as the NRE attenuate the floodwater pulse over long periods of time.
Process: Significance of Extreme Weather Events on Coastal Carbon Cycles
Our findings demonstrated that EWE such as Hurricane Matthew, the second 500-year storm to occur in NC within the past 20 years (Paerl et al., 2019), transfer substantial amounts of terrestrial C to coastal waters in just a few weeks. Osburn et al. (2019a) provided evidence suggesting that much of this material can be processed and sustain Pamlico Sound as a weak CO2 source to the atmosphere. Increases in stock of relatively “fresh”, sunlight-absorbing DOC into coastal waters increases the potential for it to be converted to atmospheric CO2 via microbial respiration and photooxidation during a long residence time (Spencer et al., 2009; Bauer et al., 2013; Ward et al., 2017). Conversion of allochthonous DOM that would normally be stored in the terrestrial environment in soils or wetland sediments to CO2 in coastal waters creates a feedback loop to the atmosphere, which potentially could influence coastal C cycling (Bauer and Bianchi, 2011).
The geomorphological properties at the land-ocean continuum will modulate the transport and fate of DOM in coastal waters (Bianchi et al., 2007). For example, the NRE-PS is an embayed estuarine system which allows for some export of OM to the coastal Atlantic Ocean through three small inlets. However, the Mississippi and Amazon rivers are open deltas that permit OM to be transferred out into the open ocean (Hedges et al., 1997; Bianchi et al., 2013). Residence time in large river plumes may approximate the long residence time (ca. 1 year) within Pamlico Sound (Supplementary Table S1). These differences suggest that in similar embayed lagoons and semi-enclosed estuaries the fate of a large portion of the OM that would normally be stored in the estuaries or exported to the coastal ocean (e.g., DOM in large river plumes) due to flooding caused by extreme precipitation events, is alternatively processed in situ. Long residence time lagoonal estuaries constitute about 25% of estuaries globally and are a predominant feature of the SE Atlantic and Gulf coasts of the United States (Dürr et al., 2011).
Extreme weather events are increasing in intensity due to a positive feedback loop created by global warming that will undoubtedly cause a redistribution of water across the planet (Trenberth, 2011). Increased heating leads to longer periods of drought (Trenberth, 2011); extensive dry periods also allows terrestrial OM to accumulate in hydrologically isolated wetlands. However, warming also increases atmospheric water vapor, which leads to a larger moisture supply to fuel more intense precipitation events (Trenberth, 2011) and thus more flooding events (Paerl et al., 2019). Large pulses of reactive terrestrial OM to coastal waters have the potential to contribute to the increase in atmospheric CO2 through photooxidation and microbial respiration of DOC in estuaries (Bauer et al., 2013). Saturated soils from heavy rainfall in the Neuse River Watershed prior to Hurricanes Fran and Matthew caused similar exports of total organic carbon to coastal waters (ca. 14 and 21 Gg C, respectively), indicating the importance of extreme precipitation events and flooding on the transference of terrestrial OM to the coastal ocean. We suggest that these weather extremes (dry periods punctuated by intense precipitation events) will amplify pulses of C stored in wetlands which then are shunted into receiving coastal waters where this organic C is returned to the atmosphere as CO2. A predicted rise in the frequency of EWE, including major hurricanes in the Atlantic, where many lagoonal estuaries exist, will continue to exacerbate these conditions (Bender et al., 2010; Trenberth, 2011; Lehmann et al., 2015; Walsh et al., 2016).
Conclusion
A Bayesian Monte Carlo (BMC) mixing model combining stable carbon isotope analysis, SUVA254 values and SR values, revealed new insights into the effects of extreme events on this system, improving upon prior work in which OM sources from events such as hurricanes had not been clearly identified (Peierls et al., 2003; Osburn et al., 2012; Brown et al., 2014; Paerl et al., 2018). The BMC method provided estimates of the fractional source contributions from wetlands to the NRE following Hurricane Matthew in 2016, which we then compared to estimates made with a hydrological-connectivity flood model. Through this comparative modeling approach, we determined that the riparian wetlands exported ca. 50–70% of the DOM to the NRE-PS during Hurricane Matthew’s floodwaters, confirming predictions from earlier work (Osburn et al., 2019a).
Our modeling approach further provided insight into estuarine responses to low-frequency large storm events in a manner similar to rivers under the PSC (Raymond et al., 2016). For the NRE-PS, this coastal system responds similarly: the estuary essentially became a passive pipe, resulting in ∼40% of the annual load of DOM to be shunted through the estuary into Pamlico Sound. An important insight we gained from this approach was that the pulse of DOM from the hydrologically connected wetlands following Hurricane Matthew accounted for ca. 25% of the estimated annual load to the Neuse River Estuary. PSC could be amended for coastal environments such as Pamlico Sound to include processing (P) of DOM into CO2 by photooxidation or microbial respiration. Our results suggest that EWE, such as tropical cyclones, have a significant effect on coastal carbon cycles, by inducing large pulses of terrestrial DOM from floodwaters associated with them and translocating OM accumulating over time in wetlands into biogeochemically dynamic ecosystems where substantial processing can occur (Crosswell et al., 2014; Osburn et al., 2019a).
Estuarine and coastal waters are home to more than half of the world’s population and are important economic, recreational, and environmental ecosystems (Paerl et al., 2014). However, a lack of high-resolution observational data hinders our comprehension of the effects of EWE on coastal biogeochemistry (Brown et al., 2014). Therefore, the development of new interdisciplinary methods such as what we have done for this study is crucial to understanding the coinciding and subsequent processes occurring in coastal waters in response to EWE.
Data Availability Statement
The data used in this project can be found at the NSF Biological and Chemical Oceanographic Data Management Office (BCO-DMO; https://www.bco-dmo.org/project/734599).
Author Contributions
JR participated in the experiment design, performed the field samplings of the river and wetlands, conducted laboratory analyses, performed the data analyses, and was responsible for the manuscript preparation. CA contributed to the analysis of the geochemical mixing model and participated in the manuscript preparation. AH participated in field samplings in the estuary and sound, conducted laboratory analyses, and participated in the manuscript preparation. HP provided the estuary and sound samples and participated in the manuscript preparation. CO participated in the experiment design, data analysis, and manuscript preparation.
Funding
This work was funded by the National Science Foundation grants OCE 1705972 and OCE 1706009, the North Carolina Sea Grant program, the UNC Water Resources Research Institute, and the National Fish and Wildlife Foundation Project 8020.16.053916.
Conflict of Interest
The authors declare that the research was conducted in the absence of any commercial or financial relationships that could be construed as a potential conflict of interest.
Acknowledgments
We would like to thank Roxane Bowden, Stephen Richardson, Nicole Koerth, John Wall, Del Bohnenstiehl, Bill Showers, Mackenzie Fiss, Betsy Abare, Jeremy Braddy, Karen Rossignol, and Randy Sloup for their technical assistance. We would also like to thank the UNC-Chapel Hill/North Carolina Department of Environmental Quality ModMon Project for sampling and logistical support.
Supplementary Material
The Supplementary Material for this article can be found online at: https://www.frontiersin.org/articles/10.3389/fmars.2020.00018/full#supplementary-material
Abbreviations
δ 13C-DOC, stable isotope ratio of dissolved organic carbon (‰); [DOC], concentration of dissolved organic carbon (mg L–1); AT, total flooded area; AW, area of flooded wetlands; BMC, bayesian monte carlo; CFB, DOC concentration from river (mg L–1); CW, DOC concentration from wetland (mg L–1); DEM, digital elevation model; EWE, extreme weather events; fo, fractional contribution of marine sourced organic matter to BMC mixing model; fr, fractional contribution of river sourced organic matter to BMC mixing model; fw, fractional contribution of wetland sourced organic matter to BMC mixing model; LDOCR, dissolved organic carbon mass loading from riverine sources (Gg C); LDOCT, total dissolved organic carbon mass loading from wetland and riverine sources combined (Gg C); LDOCW, dissolved organic carbon mass loading from wetland sources (Gg C); NR, neuse river; NRE, neuse river estuary; PS, pamlico sound; PSC, pulse-shunt concept; REM, relative elevation model; SR, spectral slope ratio; SUVA254, specific UV absorbance at 254 nm (L mg C–1 m–1); VnW, volume of flooded non-wetland area; VT, total flooded volume; VW, volume of flooded wetlands
References
Arendt, C. A., Aciego, S. M., and Hetland, E. A. (2015). An open source bayesian monte carlo isotope mixing model with applications in earth surface processes. Geochem.Geophys., Geosyst. 16, 1274–1292. doi: 10.1002/2014gc005683
Atar, J. N. (2017). Contrasting Estuarine and Coastal Organic Matter Dynamics From Varying Climatic Regions. Master’s Thesis, North Carolina State University, Raleigh.
Avery, G. B. Jr., Kieber, R. J., Willey, J. D., Shank, G. C., and Whitehead, R. F. (2004). Impact of hurricanes on the flux of rainwater and cape fear river water dissolved organic carbon to long bay, southeastern United States. Global Biogeoch. Cycles 18:GB3015.
Bauer, J. E., and Bianchi, T. S. (2011). 5.02 Dissolved Organic Carbon Cycling and Transformation. Treatise on Estuarine and Coastal Science. Waltham: Academic Press.
Bauer, J. E., Cai, W. J., Raymond, P. A., Bianchi, T. S., Hopkinson, C. S., and Regnier, P. A. (2013). The changing carbon cycle of the coastal ocean. Nature 504, 61–70. doi: 10.1038/nature12857
Bauer, J. E., Druffel, E. R., Wolgast, D. M., and Griffin, S. (2001). Sources and cycling of dissolved and particulate organic radiocarbon in the northwest Atlantic continental margin. Global Biogeochem. Cycles 15, 615–636. doi: 10.1029/2000gb001314
Bender, M. A., Knutson, T. R., Tuleya, R. E., Sirutis, J. J., Vecchi, G. A., Garner, S. T., et al. (2010). Modeled impact of anthropogenic warming on the frequency of intense Atlantic hurricanes. Science 327, 454–458. doi: 10.1126/science.1180568
Bhatia, M. P., Das, S. B., Kujawinski, E. B., Henderson, P., Burke, A., and Charette, M. A. (2011). Seasonal evolution of water contributions to discharge from a Greenland outlet glacier: insight from a new isotope-mixing model. J. Glaciol. 57, 929–941. doi: 10.3189/002214311798043861
Bianchi, T. S., and Canuel, E. A. (2011). Chemical Biomarkers in Aquatic Ecosystems. Princeton, NJ: Princeton University Press.
Bianchi, T. S., Galler, J. J., and Allison, M. A. (2007). Hydrodynamic sorting and transport of terrestrially derived organic carbon in sediments of the Mississippi and Atchafalaya Rivers. Estuar.Coast. Shelf Sci. 73, 211–222. doi: 10.1016/j.ecss.2007.01.004
Bianchi, T. S., Garcia-Tigreros, F., and Yvon-Lewis, S. A. (2013). Enhanced transfer of terrestrially derived carbon to the atmosphere in a flooding event. Geophys. Res. Lett. 40, 116–122. doi: 10.1029/2012GL054145
Boyd, T. J., and Osburn, C. L. (2004). Changes in CDOM fluorescence from allochthonous and autochthonous sources during tidal mixing and bacterial degradation in two coastal estuaries. Mar. Chem. 89, 189–210. doi: 10.1016/j.marchem.2004.02.012
Brown, M. M., Mulligan, R. P., and Miller, R. L. (2014). Modeling the transport of freshwater and dissolved organic carbon in the Neuse River Estuary, NC, USA following Hurricane Irene (2011). Estuar.Coast. Shelf Sci. 139, 148–158. doi: 10.1016/j.ecss.2014.01.005
Cai, Y., Guo, L., Wang, X., and Aiken, G. (2015). Abundance, stable isotopic composition, and export fluxes of DOC, POC, and DIC from the lower mississippi river during 2006–2008. J. Geophys. Res.: Biogeosci. 120, 2273–2288. doi: 10.1002/2015jg003139
Chadwick, O. A., Derry, L. A., Vitousek, P. M., Huebert, B. J., and Hedin, L. O. (1999). Changing sources of nutrients during four million years of ecosystem development. Nature 397, 491–497. doi: 10.1038/17276
Chowdhury, S. (2013). Trihalomethanes in drinking water: effect of natural organic matter distribution. Water SA 39, 1–8.
Cloern, J. E., Canuel, E. A., and Harris, D. (2002). Stable carbon and nitrogen isotope composition of aquatic and terrestrial plants of the San Francisco Bay estuarine system. Limnol. Oceanogr. 47, 713–729. doi: 10.4319/lo.2002.47.3.0713
Crosswell, J. R., Wetz, M. S., Hales, B., and Paerl, H. W. (2012). Air-water CO2 fluxes in the microtidal neuse river estuary, North Carolina. J. Geophys. Res. 117, C08017.
Crosswell, J. R., Wetz, M. S., Hales, B., and Paerl, H. W. (2014). Extensive CO2 emissions from shallow coastal waters during passage of Hurricane Irene (August 2011) over the Mid-Atlantic Coast of the USA. Limnol. Oceanogr. 59, 1651–1665. doi: 10.4319/lo.2014.59.5.1651
Currin, C. A., Newell, S. Y., and Paerl, H. W. (1995). The role of standing dead Spartina alterniflora and benthic microalgae in salt marsh food webs: considerations based on multiple stable isotope analysis. Mar. Ecol. Progr. Ser. 121, 99–116. doi: 10.3354/meps121099
Deegan, L. A., and Garritt, R. H. (1997). Evidence for spatial variability in estuarine food webs. Mar. Ecol. Progr. Ser. 147, 31–47. doi: 10.3354/meps147031
Dilts, E., Yang, J., and Weisberg, P. J. (2010). Mapping riparian vegetation with lidar data. ArcUser Mag. 13, 18–21. doi: 10.1371/journal.pone.0054776
Dixon, J. L., Osburn, C. L., Paerl, H. W., and Peierls, B. L. (2014). Seasonal changes in estuarine dissolved organic matter due to variable flushing time and wind-driven mixing events. Estuar. Coast. Shelf Sci. 151, 210–220. doi: 10.1016/j.ecss.2014.10.013
Dürr, H. H., Laruelle, G. G., van Kempen, C. M., Slomp, C. P., Meybeck, M., and Middelkoop, H. (2011). Worldwide typology of nearshore coastal systems: defining the estuarine filter of river inputs to the oceans. Estuar. Coas. 34, 441–458. doi: 10.1007/s12237-011-9381-y
Fry, B., and Sherr, E. B. (1989). “δ13C measurements as Indicators of carbon flow in marine and freshwater ecosystems,” in In Stable Isotopes in Ecological Research, (New York. NY: Springer), 196–229. doi: 10.1007/978-1-4612-3498-2_12
Giese, G. L., Wilder, H. B., and Parker, G. G. Jr. (1985). Hydrology of major estuaries and sounds of North Carolina(No. 2221). Washington, DC: USGPO.
Gorham, E. (1995). “The biogeochemistry of northern peatlands and its possible responses to global warming,” in Biotic Feedbacks in the Global Climatic System, eds G. M. Woodwell, and F. T. MacKenzie, (New York, NY: Oxford University Press), 169–187.
Hall, B. D., Aiken, G. R., Krabbenhoft, D. P., Marvin-DiPasquale, M., and Swarzenski, C. M. (2008). Wetlands as principal zones of methylmercury production in southern Louisiana and the Gulf of Mexico region. Environ. Pollut. 154, 124–134. doi: 10.1016/j.envpol.2007.12.017
Hanley, K. W., Wollheim, W. M., Salisbury, J., Huntington, T., and Aiken, G. (2013). Controls on dissolved organic carbon quantity and chemical character in temperate rivers of North America. Global Biogeochem. Cycles 27, 492–504. doi: 10.1002/gbc.20044
Hansen, A. M., Kraus, T. E., Pellerin, B. A., Fleck, J. A., Downing, B. D., and Bergamaschi, B. A. (2016). Optical properties of dissolved organic matter (DOM): Effects of biological and photolytic degradation. Limnol. Oceanogr. 61, 1015–1032. doi: 10.1002/lno.10270
Hedges, J. I., Keil, R. G., and Benner, R. (1997). What happens to terrestrial organic matter in the ocean? Organic Geochem. 27, 195–212. doi: 10.1016/s0146-6380(97)00066-1
Helms, J. R., Stubbins, A., Ritchie, J. D., Minor, E. C., Kieber, D. J., and Mopper, K. (2008). Absorption spectral slopes and slope ratios as indicators of molecular weight, source, and photobleaching of chromophoric dissolved organic matter. Limnol. Oceanogr. 53, 955–969. doi: 10.4319/lo.2008.53.3.0955
Hirsch, R. M., and De Cicco, L. A. (2015). User guide to Exploration and Graphics for RivEr Trends (EGRET) and dataRetrieval: R packages for hydrologic data (No. 4-A10). Reston, VA: US Geological Survey.
Hirsch, R. M., Moyer, D. L., and Archfield, S. A. (2010). Weighted regressions on time, discharge, and season (WRTDS), with an application to Chesapeake Bay river inputs 1. J. Am. Water Resou. Assoc. 46, 857–880. doi: 10.1111/j.1752-1688.2010.00482.x
Hounshell, A. G., Rudolph, J. C., Van Dam, B. R., Hall, N. S., Osburn, C. L., and Paerl, H. W. (2019). Extreme weather events modulate processing and export of dissolved organic carbon in the Neuse River Estuary. Estuar., Coast. Shelf Sci. 219, 189–200. doi: 10.1016/j.ecss.2019.01.020
IPCC (2001). “A special report of IPCC working group III,” in Summary for Policymakers, Emission Scenarios, ed. N. Nakiaeenoviae, (Cambridge: Cambridge University Press), 2001.
Junk, W. J., Bayley, P. B., and Sparks, R. E. (1989). The flood pulse concept in river-floodplain systems. Can. Special Public. Fish. Aquat. Sci. 106, 110–127.
Kirk, J. T. (1994). Light and Photosynthesis in Aquatic Ecosystems. Cambridge: Cambridge university press.
Lehmann, J., Coumou, D., and Frieler, K. (2015). Increased record-breaking precipitation events under global warming. Clim. Change 132, 501–515. doi: 10.1007/s10584-015-1434-y
Luettich, R. A., Reynolds-Fleming, J. V., McNinch, J. E., and Buzzelli, C. P. (2000). Circulation characteristics of the neuse river estuary, North Carolina. Estuaries 23, 392–399.
Lunn, D., Spiegelhalter, D., Thomas, A., and Best, N. (2009). The BUGS project: Evolution, critique and future directions. Statist. Med. 28, 3049–3067. doi: 10.1002/sim.3680
Majidzadeh, H., Uzun, H., Ruecker, A., Miller, D., Vernon, J., Zhang, H., et al. (2017). Extreme flooding mobilized dissolved organic matter from coastal forested wetlands. Biogeochemistry 136, 293–309. doi: 10.1007/s10533-017-0394-x
Masiello, C. A., and Druffel, E. R. (2001). Carbon isotope geochemistry of the Santa Clara River. Global Biogeochem. Cycles 15, 407–416. doi: 10.1029/2000gb001290
Matson, E. A., and Brinson, M. M. (1990). Stable carbon isotopes and the C: N ratio In the estuaries of the pamlico and neuse rivers. North Carolina. Limnol. Oceanogr. 35, 1290–1300. doi: 10.4319/lo.1990.35.6.1290
Mitra, S., Wassmann, R., and Vlek, P. L. (2005). An appraisal of global wetland area and its organic carbon stock. Curr. Sci. 88, 25–35.
Mladenov, N., McKnight, D. M., Macko, S. A., Norris, M., Cory, R. M., and Ramberg, L. (2007). Chemical characterization of DOM in channels of a seasonal wetland. Aquat. Sci. 69, 456–471. doi: 10.1007/s00027-007-0905-2
Mladenov, N., McKnight, D. M., Wolski, P., and Ramberg, L. (2005). Effects of annual flooding on dissolved organic carbon dynamics within a pristine wetland, the Okavango Delta, Botswana. Wetland 25, 622–638. doi: 10.1672/0277-5212(2005)025[0622:EOAFOD]2.0.CO;2
Musser, J. W., Watson, K. M., and Gotvald, A. J. (2017). “Characterization of Peak Streamflows and Flood Inundation at Selected Areas in North Carolina Following Hurricane Matthew, October 2016,” in U.S. Geological Survey Open-File Report 2017-1047, (Reston, VA: US Geological Survey), 23.
National Weather Service [NWS] (2016). Advanced Hydrologic Prediction Service. Available at: https://water.weather.gov/ahps2/hydrograph.php?wfo=mhx&gage=ftbn7. (accessed Dec 30, 2016).
NC-DEQ (2018). North Carolina Department of Environmental Quality Neuse River Data Sheet. Avaliable at: https://files.nc.gov/deqee/documents/files/neuse.pdf. (accessed Jan 1, 2018).
Opsahl, S. P. (2005). Organic carbon composition and oxygen metabolism across a gradient of seasonally inundated limesink and riparian wetlands in the southeast Coastal Plain. USA. Biogeochemistry 76, 47–68. doi: 10.1007/s10533-005-2074-5
Osburn, C. L., Atar, J. N., Boyd, T. J., and Montgomery, M. T. (2019b). Antecedent precipitation influences the bacterial processing of terrestrial dissolved organic matter in a North Carolina estuary. Estuar.Coast. Shelf Sci. 221, 119–131.
Osburn, C. L., Handsel, L. T., Mikan, M. P., Paerl, H. W., and Montgomery, M. T. (2012). Fluorescence tracking of dissolved and particulate organic matter quality in a river-dominated estuary. Environ. Sci. Technol. 46, 8628–8636. doi: 10.1021/es3007723
Osburn, C. L., Handsel, L. T., Peierls, B. L., and Paerl, H. W. (2016). Predicting sources of dissolved organic nitrogen to an estuary from an agro-urban coastal watershed. Environ. Sci.Technol. 50, 8473–8484. doi: 10.1021/acs.est.6b00053
Osburn, C. L., and Morris, D. P. (2003). Photochemistry of chromophoric dissolved organic matter in natural waters. Effects Aquat. Org. Ecosyst. 1, 185–217.
Osburn, C. L., Rudolph, J. C., Paerl, H. W., Hounshell, A. G., and Van Dam, B. R. (2019a). Lingering carbon cycle effects of hurricane matthew in North Carolina’s coastal waters. Geophys. Res. Lett.. 46, 2654–2661. doi: 10.1029/2019gl082014
Osburn, C. L., and St-Jean, G. (2007). The use of wet chemical oxidation with high-amplification isotope ratio mass spectrometry (WCO-IRMS) to measure stable isotope values of dissolved organic carbon in seawater. Limnol. Oceanogr.: Methods 5, 296–308. doi: 10.4319/lom.2007.5.296
Paerl, H. W., Crosswell, J. R., Van Dam, B., Hall, N. S., Rossignol, K. L., Osburn, C. L., et al. (2018). Two decades of tropical cyclone impacts on North Carolina’s estuarine carbon, nutrient and phytoplankton dynamics: implications for biogeochemical cycling and water quality in a stormier world. Biogeochemistry 141, 1–26.
Paerl, H. W., Hall, N. S., Hounshell, A. G., Luettich, R. A. Jr., Rossignol, K. L., Osburn, C. L., et al. (2019). Recent increase in catastrophic tropical cyclone flooding in coastal North Carolina, USA: long-term observations suggest a regime shift. Nat. Sci. Rep. 9:10620. doi: 10.1038/s41598-019-46928-9
Paerl, H. W., Hall, N. S., Peierls, B. L., and Rossignol, K. L. (2014). Evolving paradigms and challenges in estuarine and coastal eutrophication dynamics in a culturally and climatically stressed world. Estuar. Coast. 37, 243–258. doi: 10.1007/s12237-014-9773-x
Paerl, H. W., Pinckney, J. L., Fear, J. M., and Peierls, B. L. (1998). Ecosystem responses to internal and watershed organic matter loading: consequences for hypoxia in the eutrophying Neuse River Estuary, North Carolina, USA. Mar. Ecol. Progr. Ser. es 166:17. doi: 10.3354/meps166017
Partners, O. C. M. (2017). North Carolina Statewide Lidar DEM 2014 Phase 1. Avaliable at: https://inport.nmfs.noaa.gov/inport/item/49411. (accessed Jan 31, 2017).
Peierls, B. L., Christian, R. R., and Paerl, H. W. (2003). Water Quality and phytoplankton as indicators of hurricane impacts on a large estuarine ecosystem. Estuaries 26, 1329–1343. doi: 10.1007/bf02803635
Pichler, T. (2005). Stable and radiogenic isotopes as tracers for the origin, mixing and subsurface history of fluids in submarine shallow-water hydrothermal systems. J. Volcanol. Geother. Res. 139, 211–226. doi: 10.1016/j.jvolgeores.2004.08.007
Prein, A. F., Rasmussen, R. M., Ikeda, K., Liu, C., Clark, M. P., and Holland, G. J. (2017). The future intensification of hourly precipitation extremes. Nat. Clim. Change 7:48. doi: 10.1038/nclimate3168
Pringle, C. (2003). What is hydrologic connectivity and why is it ecologically important? Hydrol. Process. 17, 2685–2689. doi: 10.1002/hyp.5145
Raymond, P. A., and Bauer, J. E. (2001). Use of 14C and 13C natural abundances for evaluating riverine, estuarine, and coastal DOC and POC sources and cycling: a review and synthesis. Org. Geochem. 32, 469–485. doi: 10.1016/s0146-6380(00)00190-x
Raymond, P. A., and Saiers, J. E. (2010). Event controlled DOC export from forested watersheds. Biogeochemistry 100, 197–209. doi: 10.1007/s10533-010-9416-7
Raymond, P. A., Saiers, J. E., and Sobczak, W. V. (2016). Hydrological and biogeochemical controls on watershed dissolved organic matter transport: Pulse-shunt concept. Ecology 97, 5–16. doi: 10.1890/14-1684.1
Reynolds-Fleming, J. V., and Luettich, R. A. Jr. (2004). Wind-driven lateral variability in a partially mixed estuary. Estuar.Coast. Shelf Sci. 60, 395–407. doi: 10.1016/j.ecss.2004.02.003
Richter, D. D., Markewitz, D., Trumbore, S. E., and Wells, C. G. (1999). Rapid accumulation and turnover of soil carbon in a re-establishing forest. Nature 400:56. doi: 10.1038/21867
Rickli, J., Frank, M., Baker, A. R., Aciego, S., De Souza, G., Georg, R. B., et al. (2010). Hafnium and neodymium isotopes in surface waters of the eastern Atlantic Ocean: Implications for sources and inputs of trace metals to the ocean. Geochim. Cosmochim. Acta 74, 540–557. doi: 10.1016/j.gca.2009.10.006
Rosenthal, J. S. (2011). Optimal proposal distributions and adaptive MCMC. Handb. Mark. Chain Monte Carlo 4, 119–138.
Runkel, R. L., Crawford, C. G., and Cohn, T. A. (2004). Load Estimator (LOADEST): A FORTRAN program for estimating constituent loads in streams and rivers (No. 4-A5). Reston, VA: US Geological Survey.
Spencer, R. G., Aiken, G. R., Dornblaser, M. M., Butler, K. D., Holmes, R. M., Fiske, G., et al. (2013). Chromophoric dissolved organic matter export from US rivers. Geophys. Res. Lett. 40, 1575–1579. doi: 10.1002/grl.50357
Spencer, R. G., Stubbins, A., Hernes, P. J., Baker, A., Mopper, K., Aufdenkampe, A. K., et al. (2009). Photochemical degradation of dissolved organic matter and dissolved lignin phenols from the Congo River. J. Geophys. Res.: Biogeosci. 114:3010.
Stewart, S. R. (2017). National Hurricane Center Tropical Cyclone Report: Hurricane Matthew. Miami, FA: National Hurricane Center.
Sullivan, M. J., and Moncreiff, C. A. (1990). Edaphic algae are an important component of salt marsh food-webs: evidence from multiple stable isotope analyses. Mar. Ecol. Progr. Series. Oldendorf 62, 149–159. doi: 10.3354/meps062149
Sutter, L. (1999). DCM wetland mapping in coastal North Carolina. Quezon City: Department of Environmental and Natural Resources.
Tockner, K., Pennetzdorfer, D., Reiner, N., Schiemer, F., and Ward, J. V. (1999). Hydrological connectivity, and the exchange of organic matter and nutrients in a dynamic river–floodplain system (Danube. Austria). Fresh. Biol. 41, 521–535. doi: 10.1046/j.1365-2427.1999.00399.x
Trenberth, K. E. (2011). Changes in precipitation with climate change. Clim. Res. 47, 123–138. doi: 10.3354/cr00953
U.S. Geological Survey [USGS] (2018). National Water Information System data available on the World Wide Web (USGS Water Data for the Nation). Avaliable at http://waterdata.usgs.gov/nwis/ (accessed June 21, 2018)Google Scholar
Vähätalo, A. V., and Wetzel, R. G. (2008). Long-term photochemical and microbial decomposition of wetland-derived dissolved organic matter with alteration of 13C: 12C mass ratio. Limnol. Oceanogr. 53, 1387–1392. doi: 10.4319/lo.2008.53.4.1387
Vannote, R. L., Minshall, G. W., Cummins, K. W., Sedell, J. R., and Cushing, C. E. (1980). The river continuum concept. Can. J. Fish. Aquat. Scie. 37, 130–137.
Walsh, K. J. E., McBride, J. L., Klotzbach, P. J., Balachandran, S., Camargo, S. J., Holland, G., et al. (2016). Tropical cyclones and climate change. Wiley Interdiscip. Rev. 7, 65–89. doi: 10.1002/wcc.371
Ward, N. D., Bianchi, T. S., Medeiros, P. M., Seidel, M., Richey, J. E., Keil, R. G., et al. (2017). Where carbon goes when water flows: carbon cycling across the aquatic continuum. Front. Mar. Sci. 4:7. doi: 10.3389/fmars.2017.00007
Weishaar, J. L., Aiken, G. R., Bergamaschi, B. A., Fram, M. S., Fujii, R., and Mopper, K. (2003). Evaluation of specific ultraviolet absorbance as an indicator of the chemical composition and reactivity of dissolved organic carbon. Environ. Sci. Technol. 37, 4702–4708. doi: 10.1021/es030360x
Keywords: hydrologic connectivity, dissolved organic matter, extreme weather events, stable carbon isotopes, wetlands
Citation: Rudolph JC, Arendt CA, Hounshell AG, Paerl HW and Osburn CL (2020) Use of Geospatial, Hydrologic, and Geochemical Modeling to Determine the Influence of Wetland-Derived Organic Matter in Coastal Waters in Response to Extreme Weather Events. Front. Mar. Sci. 7:18. doi: 10.3389/fmars.2020.00018
Received: 09 September 2019; Accepted: 10 January 2020;
Published: 07 February 2020.
Edited by:
Christian Lønborg, Australian Institute of Marine Science (AIMS), AustraliaReviewed by:
Philippe Massicotte, Laval University, CanadaKaelin M. Cawley, National Ecological Observatory Network, United States
Copyright © 2020 Rudolph, Arendt, Hounshell, Paerl and Osburn. This is an open-access article distributed under the terms of the Creative Commons Attribution License (CC BY). The use, distribution or reproduction in other forums is permitted, provided the original author(s) and the copyright owner(s) are credited and that the original publication in this journal is cited, in accordance with accepted academic practice. No use, distribution or reproduction is permitted which does not comply with these terms.
*Correspondence: Jacob C. Rudolph, jcrudolp@ncsu.edu