Complex Dispersal of Adult Yellowfin Tuna From the Main Hawaiian Islands
 Chi Hin Lam
 Clayward Tam2
  Donald R. Kobayashi
 Molly E. Lutcavage
- 1Large Pelagics Research Center, School for the Environment, University of Massachusetts Boston, Gloucester, MA, United States
- 2Pacific Islands Fisheries Group, Kailua, HI, United States
- 3Pacific Islands Fisheries Science Center, NOAA/NMFS, NOAA IRC, Honolulu, HI, United States
Local availability of yellowfin tuna, Thunnus albacares, is a key economic, dietary and cultural concern for Main Hawaiian Islands (MHI) communities and insular fisheries. Consequently, interactions of inshore vs. offshore fisheries and connectivity to yellowfin elsewhere in the Pacific remain important scientific management questions. Local fisheries target adult tuna during the summer months, but subsequent tuna movements, presumably away from the islands after reproduction ceases, remain undocumented. From 2014 to 2016, we partnered with local fishermen to catch and release nineteen yellowfin tuna (41–91 kg, estimated whole weight) off Kaua'i, with popup satellite archival tags programmed for 9–12-month missions. Although data collection periods did not exceed 59 days mainly because of tag hardware failures and predator interactions, short tracks revealed diverse patterns: local residency for some individuals, and rapid, long-distance (>800 km) dispersals in multiple directions for others. Adult yellowfin tuna frequenting the MHI have more complex movements than previously assumed. Despite being a nursery area, whether the assemblage is entirely produced and retained in the region is not resolved. However, attaining 1-year migration records requires tag performance that was not achieved by the deployed tags. It remains a prerequisite for greater understanding of yellowfin in the Main Hawaiian Islands and Central North Pacific, including assessment of their spatial connectivity, impacts of climate change, and shifting ecosystems.
Introduction
Yellowfin tuna (Thunnus albacares) is an iconic species in the Main Hawaiian Islands (MHI), yet little is known about where these tuna go after leaving local waters, their daily habits, and whether they inhabit the Islands exclusively, or journey to other areas of the Pacific. Known locally as ‘ahi, yellowfin tuna have been fished since Polynesians arrived in the Central North Pacific, and remain a prime resource for community stakeholders (Yuen, 1979; Glazier, 2007). Around the MHI, large yellowfin are targeted for fresh fish and sashimi markets, and smaller tuna are important to households and families with limited income (Glazier, 2007). Offshore longline, inshore small-scale troll and handline fisheries directly target yellowfin, with a minimum commercial size limit at 1.36 kg (3 lb) set by the State of Hawai‘i. Any changes to the commercial size or imposition of recreational size and bag limits will likely bring disproportionate social-cultural and economic impacts to MHI communities.
While population status of the Western Central North Pacific stock is currently considered not overfished, and despite the economic importance and extent of North Pacific yellowfin fisheries, there is no consensus on yellowfin population structure (Sibert and Hampton, 2003; Anderson et al., 2019). Based on tagging (Brill et al., 1999; Holland et al., 1999; Klimley and Holloway, 1999; Itano and Holland, 2000b; Adam et al., 2003), biological sampling (Boehlert and Mundy, 1994; Itano, 2000), and otolith geochemistry studies (Wells et al., 2012; Rooker et al., 2016), yellowfin caught around MHI appeared to be locally spawned and then retained. Adult yellowfin are estimated to reach 50% maturity at 112.5 cm fork length (Itano, 2000) or ~27.7 kg (59 lb) (Uchiyama and Kazama, 2003). Spawning season occurs from April through September, in sea surface temperatures between 24.5 and 27°C, with peak spawning between June and August (Itano, 2000). Larval nursery grounds were documented mostly on leeward coasts of all islands surveyed (Boehlert et al., 1992; Boehlert and Mundy, 1994). Apart from a small number of long-distance conventional tag recoveries off Japan and Mexico (Itano and Holland, 2000a), MHI yellowfin were assumed to stay within the islands, e.g., median individual range of <800 km in the Western and Central Pacific (Sibert and Hampton, 2003).
Almost two decades have gone by since the last tagging efforts were conducted in the MHI, with the majority of those on juvenile yellowfin (~60 cm median fork length or 10 lb) at select seamount sites and other coastal aggregation areas (Holland et al., 1999; Itano and Holland, 2000a,b; Adam et al., 2003). Despite early efforts, the spatial extent of the inshore tuna fisheries around Kaua‘i, Kona, and O‘ahu was never established. In addition, there is a surprising lack of ecosystem studies of MHI yellowfin, including updated life history information to accompany evaluation of local fisheries, habitat, and resiliency to perturbation. Given the importance of the adult spawning assemblage throughout the Hawaiian archipelago, this study aims to delineate the extent of movements and behavior of adult yellowfin tuna in relation to local fisheries, establish potential connectivity to other parts of the Pacific, and provide a much needed update on dispersal patterns in times of changing climate and ecosystems.
Materials and Methods
Tagging
Nineteen popup satellite archival tags or PSATs (MiniPAT; Wildlife Computers Inc.) were deployed on adult yellowfin (mean ± sd = 60 ± 15 kg estimated whole weight) between 2014 and 2017 off Kaua‘i (Table 1). Tagging trips were initially conducted off Kona in 2014, but did not intercept any adult yellowfin. Fishing and tagging then took place off Kaua‘i aboard two local fishing vessels (27–32 ft) using hook and line with circle hooks. Only fish deemed large enough for retaining PSAT tags (i.e., >35 kg) and in excellent condition were selected for tagging. Yellowfin tagged through 2015 were leadered alongside, tagged in the water, and released with monofilament removed as close to the hook as possible. In 2016–2018, individuals were brought aboard, placed on a wet, padded vinyl mat, a soft wet cloth was placed over the eyes to reduce stress, the circle hook was removed, and the fish was tagged and measured. Fish were returned to the water within 60–90 s. Tag tethers and anchors were constructed according to materials and methods developed for bluefin tuna tagging (Lutcavage et al., 1999; Galuardi and Lutcavage, 2012). The tagger implanted the black nylon “umbrella” dart through the musculature, into the pterygiophores supporting the second dorsal fin. Whole weight (to the nearest five pounds) was estimated by the vessel's captain and curved fork length was measured to the nearest centimeter when possible. If any yellowfin were retained and harvested during tagging trips, cursory visual examinations of stomach contents and reproductive condition were conducted.
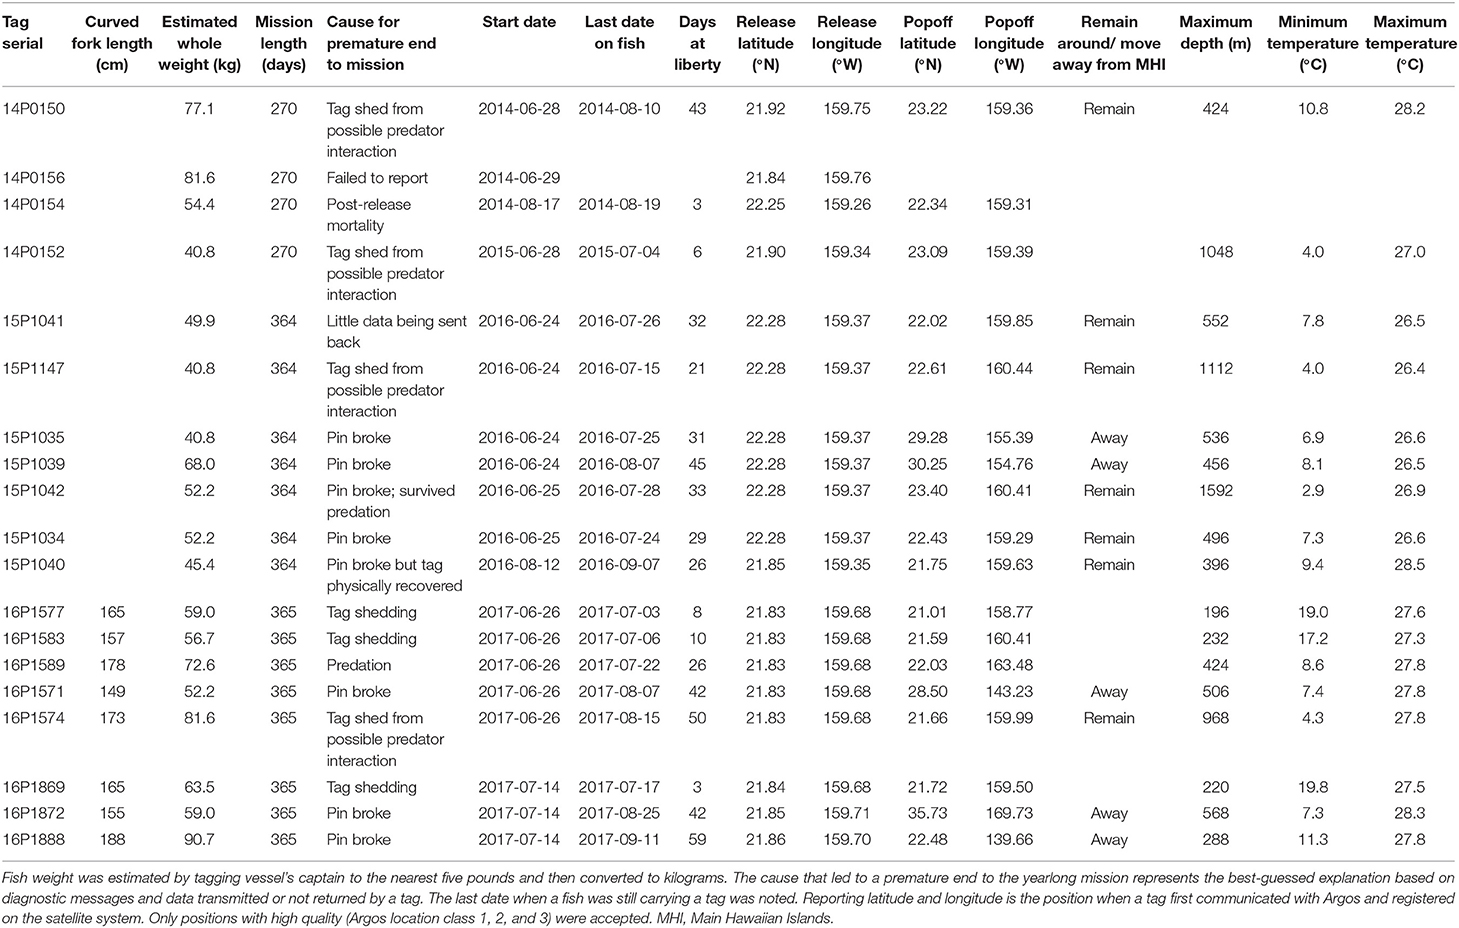
Table 1. Tagging and data summary for adult yellowfin tuna, Thunnus albacares.
PSATs were programmed to record relative light level, external temperature, pressure (depth), and 3-axis acceleration (in tag models from 2015) for the duration of 9 (n = 4) or 12 (n = 15) months. Physically recovered tags contained archived time series data at 15-s resolution; otherwise depth and temperature data were sub-sampled to 5-min resolution by manufacturer routines for transmission through the Argos satellites. Accelerometry data were not available for satellite transmission due to the lack of protocols to efficiently transmit such data at that time. MiniPATs deployed starting in 2014 were configured to transmit profile depth and temperature (PDT), and time-at-temperature and depth histograms at 6-h blocks. Temperature bins were <10°C, 10, 12, 14, 16, 18, 20, 22, 24, 26, 28, and >28°C, and depth bins were 0, 5, 25, 50, 75, 100, 125, 150, 200, 300, 400, and >400 m. All tags had a failsafe release if the tag experienced any constant depth for 3 days, a hallmark of post-release mortality or tag shedding. Tag firmware also included detection and transmission of a hardware failure message (“pin broke”) indicating that the tag's nosecone pin had broken, separating the tag from its tether, causing premature release. Once a tag popped off and began transmitting, positions with Argos location classes LC 1, 2, and 3 were noted, and the first of these positions was reported as the tag's initial detachment or popoff position. Returned data were imported into and managed through Tagbase (Lam and Tsontos, 2011).
Geolocation
A state-space Kalman filter model, TrackIt, was used to estimate positions based on transmitted light data and sea surface temperature (SST) matching with NOAA Optimum Interpolation SST V2 (esrl.noaa.gov/psd/data/gridded/data.noaa.oisst.v2.html) (Lam et al., 2010). No positions were placed on land, and thus required no further correction. The last position of a given estimated track represented one of the two scenarios: (1) tag suffering pin breakage—tag reported immediately to an Argos satellite after popoff; consequently, this last position is the popoff position and last-known position of a tuna; (2) tag shed or ingested by a predator—an estimated track was trimmed to the day before the shedding or predation occurred, therefore representing the most-probable position of an individual last carrying the tag. Predation was inferred if sensor data indicated ingestion (i.e., light levels dark, increased temperature indicative of warm-bodied predator, depth pattern changes) before the tag reported. From the final tracks and their associated error, a utilization distribution (UD) was generated (Galuardi and Lutcavage, 2012), with UD values between 0 and 50% representing high use areas. No treatment was applied to account for any bias introduced by the tag release positions to UD due to the short observation periods.
Horizontal Movement
Linear displacement was calculated between the release position and the last known position on fish using the “distGeo” function in R package, geosphere (version 1.5-7). For yellowfin that were >20 days at liberty and not consumed by a predator, we defined a yellowfin as moving away from the Main Hawaiian Islands if it traveled outside of the MHI Longline Fishing Prohibited Area and stayed outside. The boundary of the prohibited area was obtained from Office of Planning, State of Hawai‘i (planning.hawaii.gov/gis/download-gis-data). To aid the interpretation of tuna dispersal, the following geographical information system (GIS) resources were accessed: bathymetric values from Smith & Sandwell Topography (0.0167° resolution, version 11.1); Papahānaumokuākea Boundary Polygon from NOAA National Marine Sanctuary GIS Data Page (sanctuaries.noaa.gov/library/imast_gis.html); yellowfin tuna management boundary of Inter American Tropical Tuna Commission (IATTC) from RAM Legacy Stock Boundary Database (marine.rutgers.edu/~cfree/ram-legacy-stock-boundary-database); and annotated Digital Elevation Model from Seafloor Map of Hawai‘i (Version 1.4 June 20, 2014; shadedrelief.com/hawaii).
Tag-Recorded Water Column Data
We defined time-series depth and temperature records as day or night, based on local time calculated by time difference from the Greenwich Mean Time, i.e., GMT-10. For analyses of yellowfin behavior, data were trimmed to reflect the time period when a yellowfin was clearly carrying the tag. A tag may shed during periods of unusual acceleration and maneuvering, during which a tuna tried to evade and escape from a predator. Under this scenario, the complete time series was retained just prior to tag shedding. Time series data were summarized daily, and ambient temperatures (median, minimum, maximum) recorded by the fishes' tags were also calculated. Means () are reported plus or minus standard deviation (sd) unless otherwise indicated.
Results
Among the 19 MiniPATs deployed, one failed to report, one sent few data packets to Argos (likely due to a compromised battery), nine ended their mission prematurely and eight suffered pin breakage (42%) (Table 1). Since we first alerted the manufacturer of a high percentage of pin breakage, also subsequently observed by other researchers, the manufacturer has worked on various fixes over the next 2 years. Tagged fish remained at liberty with tracks from 3 to 59 days ( = 28 ± 8, n = 18). Nosecone pin breakage occurred for yellowfin at liberty between 26 and 59 days, effectively terminating all the longer deployments. One nosecone failure tag was physically recovered on the shoreline of the island of Ni‘ihau. Of the nine premature reports, one fish apparently suffered post-release mortality and one fish was consumed by a predator. Predation-associated impacts did not damage the tag or antenna, and provided data for deducing the plausible fate of the tagged individual.
Horizontal Movements
Returned light data allowed the reconstruction of fifteen tracks with their associated error (Appendix 1). Tagged yellowfin occupied a wide geographical area between 18–36°N and 139–170°W within the 2-month observation period (Figure 1). Yellowfin frequently entered waters north (North Kaua‘i Slide) and southeast of Kaua‘i (South Kaua‘i Slide, O‘ahu Deep), and southwest of O‘ahu (Wai‘anae Slump) (Figure 2). Tagged fish also utilized the inshore “CK” buoy off Makahuena Pt. (21.81 °N 159.36 °W). Among these locations, yellowfin remained for up to 50 days. For individuals at liberty >20 days (n = 12), seven tuna (58%) remained near the Main Hawaiian Islands and five (42%) moved away. One yellowfin (16P1589) approached the Papahānaumokuākea Marine National Monument when it was likely attacked by a warm-bodied predator. Most tagged fish were not observed in the general area of the West Hawaiian Seamounts (Figure 1), among which include the Cross Seamount, a well-known volcanic hotspot for good fishing (Holland et al., 1999).
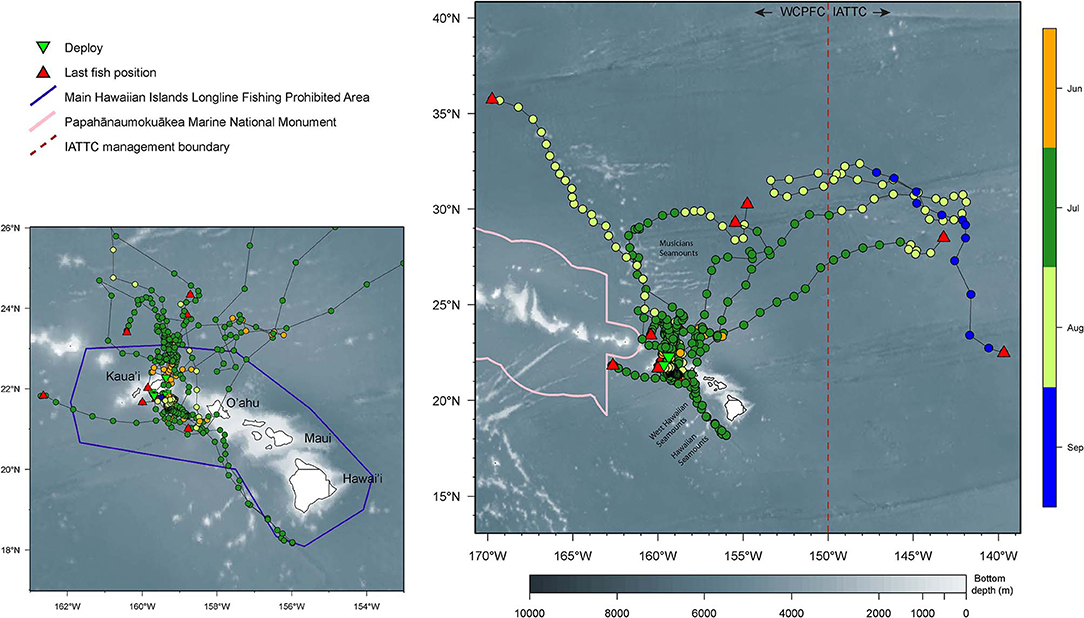
Figure 1. Horizontal movements of yellowfin tuna. Smaller map provides a zoomed-in view of movements around the Main Hawaiian Islands (MHI). Positions are color-coded by months. Tagging locations, green triangle; last known fish locations, red triangle; boundary of MHI Longline Fishing Prohibited Area, purple line; boundary of the Papahānaumokuākea Marine National Monument, pink line; management boundary of Inter American Tropical Tuna Commission (IATTC), brown dashed line. Selected islands and bathymetric features are labeled for reference.
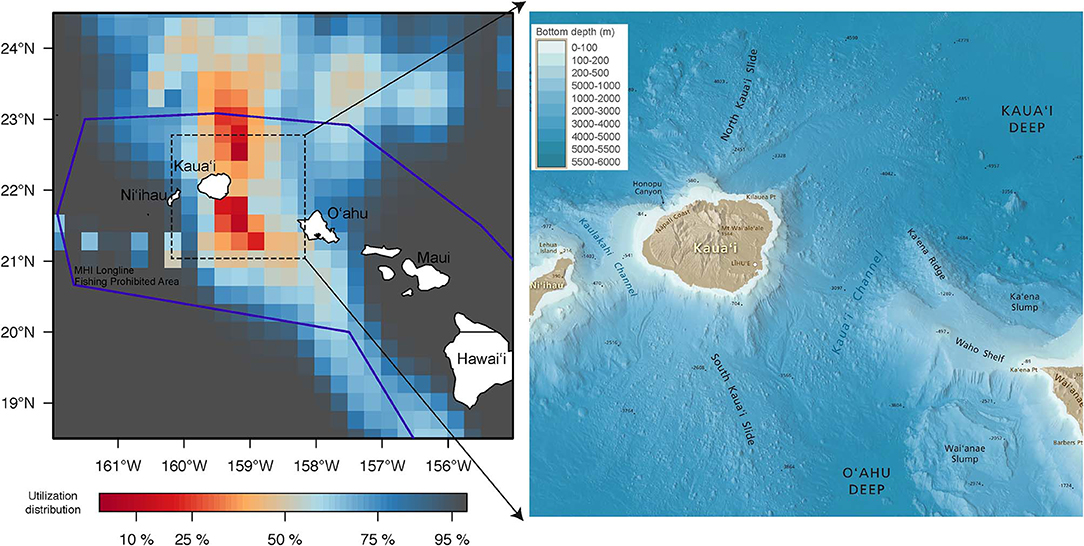
Figure 2. Spatial use around the Main Hawaiian Islands (MHI) by tagged yellowfin tuna. Utilization distribution (UD) is represented in false color. UD values of <50% signify high use areas. Boundary of MHI Longline Fishing Prohibited Area, purple line. Annotated bathymetric map around the high use areas is included for reference. See methods for map source.
Dispersal was directed and predominantly northward (Figure 1), with the exception of fish 14P0150. This individual headed southeast beyond O‘ahu, reaching seamounts south of Hawai‘i before returning to Wai'anae Slump, and continued north prior to tag popoff. Linear displacement ranged from 872 to 2,067 km ( = 1,514 ± 541, n = 6), corresponding to a movement rate of 34 ± 10 km day−1 (range: 22–44). The largest tagged fish (16P1888) traveled farthest and headed east, crossing the IATTC management boundary after 16 days at liberty (Appendix 2). This yellowfin crisscrossed the management boundary twice more before eventually reaching 139°W where the tag's nosecone pin broke. Two smaller fish (16P1872, 16P1571) had the highest daily movement rates. Fish 16P1872 headed northwest along the Musicians Seamounts and other bathymetric features, and 16P1571 crossed the management boundary after a month at liberty (Appendix 2). Also of note, fish 16P1872, and 16P1888 were released within 15 min of each other, presumably captured from the same school, but dispersed in opposite directions, NW and NE, respectively, and were over 1600 km apart when 16P1872 first reported.
The month in which a yellowfin was released had no significant relationship to local residency or dispersal. Three of four yellowfin (15P1147, 15P1041, 15P1035, 15P1039) released at the same location in early morning of 24 June 2016 were localized near the North Kaua‘i Slide for ten days before parting ways, with 15P1039 heading north to the Musicians Seamounts while 15P1147 and 15P1041 remained closer to Kaua‘i (Appendix 3). Fish 15P1035 moved northeast after release before continuing north, where its tag's nosecone pin broke in an area (~ 30°N 155°W) that was also visited by fish 15P1039 2 weeks later.
Vertical Activity
Diel change in depth distribution was prominent in tagged yellowfin (Figure 3, Figure S1). Their median (interquartile range, IQR) daytime and night depths were 103 (49–139) and 34 m (7–61), respectively. Overall, 90% of depth records were shallower than 190 m during the day and 88 m during the night, and while the maximum depth was 1,592 m, most ranged between 400–500 m. Median ambient temperature occupied was 22.4°C (IQR = 20.2–25.2) for daytime and 26.4°C (IQR = 24.9–26.9) for nighttime. Only 10% of recorded temperatures were <19°C, with a minimum record (tag 15P1042) at 2.9°C. Temperatures at 0–5 m, referred to as surface temperature hereafter, were 22.9–28.5°C. Fluctuations in surface temperature corresponded to both seasonality and different water masses encountered by yellowfin during their time at liberty (Figure 4), with day-to-day changes of up to 2°C encountered during northward dispersals (Appendices 2, 3). The differences between surface and daily mean temperature were <4°C for 87% of days when all data records were pooled, despite two tuna (15P1040, near Kaua‘i; 16P1872, high seas >26 °N) having a maximum daily thermal range difference of 17°C. The recovered tag on fish 15P1040 returned a maximum dynamic acceleration of 3.46 G (acceleration due to gravity, 1 G ~ 9.8 ms−2), and a maximum vertical speed of 5.3 ms−1.
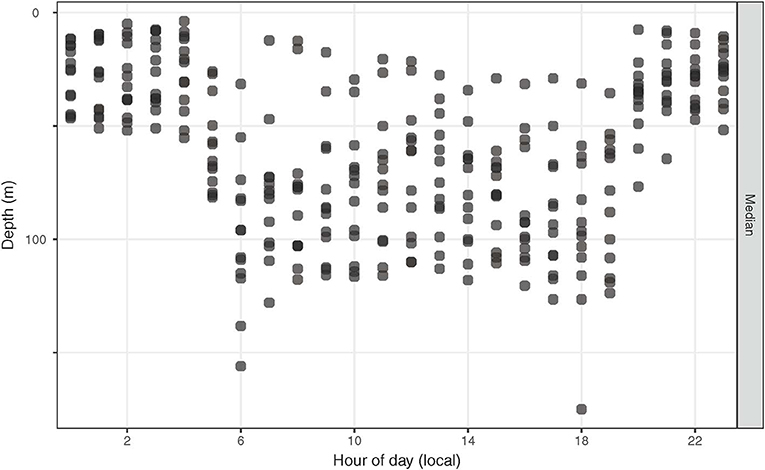
Figure 3. Hourly median depths of tagged yellowfin tuna. For each fish, depths were summarized hourly over its entire time at liberty.
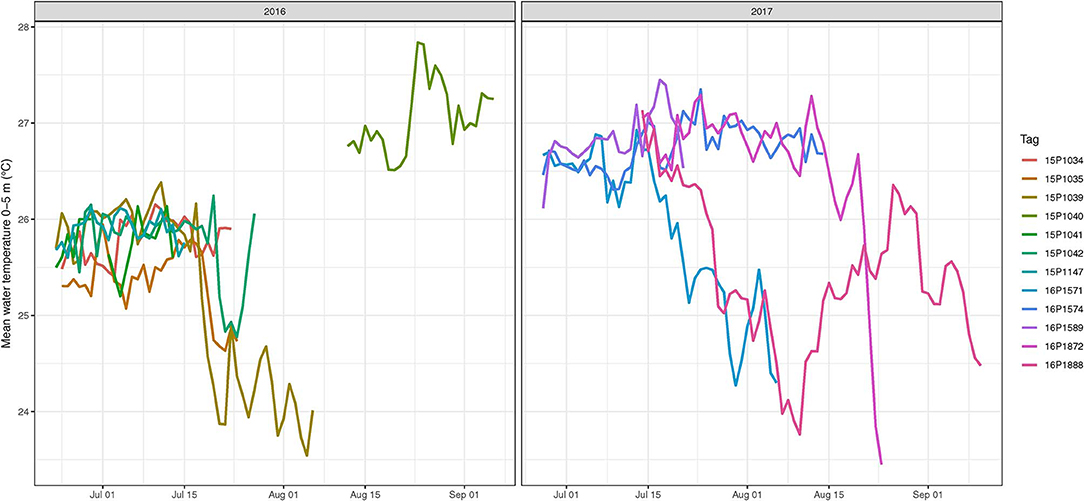
Figure 4. Mean water temperatures at 0–5 m as experienced by tagged yellowfin tuna in 2016 and 2017. For each fish (color coded), temperatures were summarized daily.
Yellowfin vertical habitat varied with time of day and geographic locations (Figure 5). They frequently occupied the surface mixed layer, ~0–100 m, with temperatures between 27–28°C throughout the day, especially at latitudes below 24°N. In daytime they occupied a wider range of the water column than at night. Their temperature range was similar across latitudes but while at latitudes >26°N, they frequently occupied cooler temperatures (13–18°C) found at deeper depths (100–140 m) during the day (Figure S1).
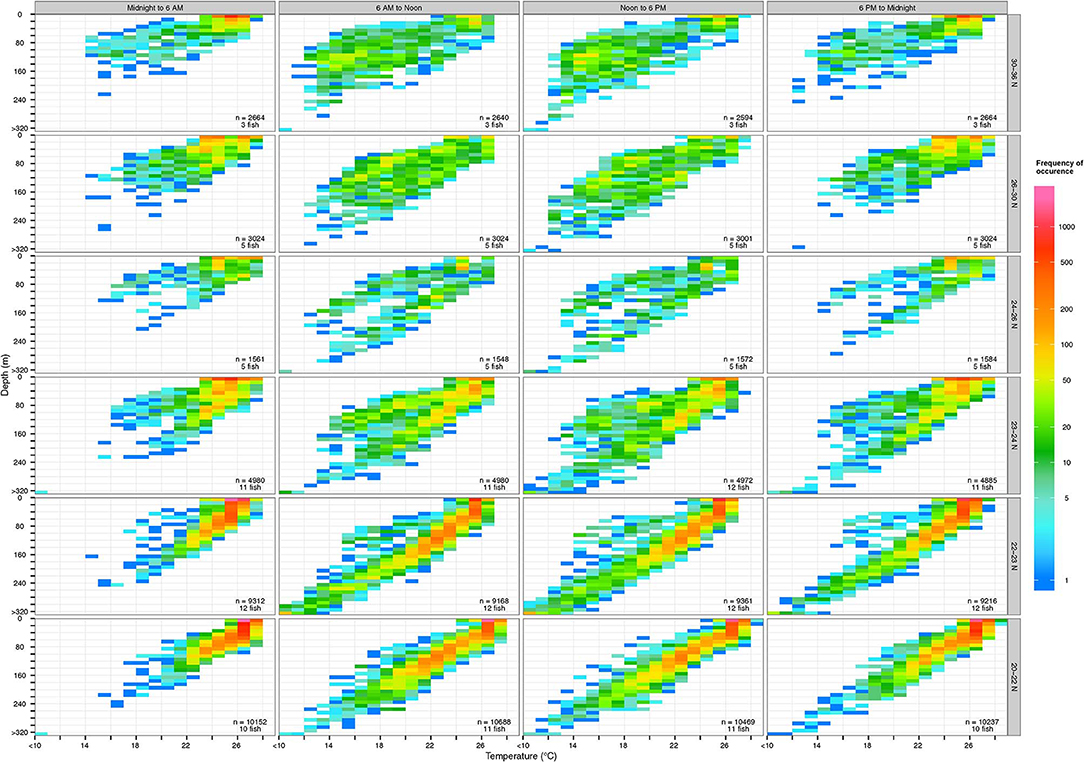
Figure 5. Vertical habitat of tagged yellowfin over 6-h periods at various latitudinal bands. Colors in logarithmic scale represent frequency of occurrence (i.e., count). The number of samples and individuals contributing to depth-temperature values are indicated in each subplot. Depths were binned every 10 m and values deeper than 320 m were aggregated into the >320-m bin. Temperatures were binned every 1°C and values below 10°C were aggregated into the <10°C bin.
Predator Interactions
Six cases of possible predator interaction were identified, with one confirmed mortality (Table 2). A warm-bodied predator, likely false killer or short finned pilot whale, was responsible for ingesting fish 16P1589, as indicated by elevated tag-recorded temperatures (Figure 6) and the lack of ambient light. Fish 15P1042 likely had escaped from a predator by descending from 134 m to 1501 m in under 5 min (Figure 6), indicating a vertical descent speed of 3.1 ms−1. This yellowfin then spent a full day near the surface before resuming behavior exhibited prior to the presumed interaction, and light level data recorded during the days before and after this episode were similar. Four of the six interactions occurred in the evening hours. Four other plausible cases featured similar rapid descent to below 300 m, but those soundings occurred just prior to tag shedding. In these cases, sensor data did not indicate ingestion of the tag but cannot confirm any scenario regarding the fate of the fish nor the possible predator.
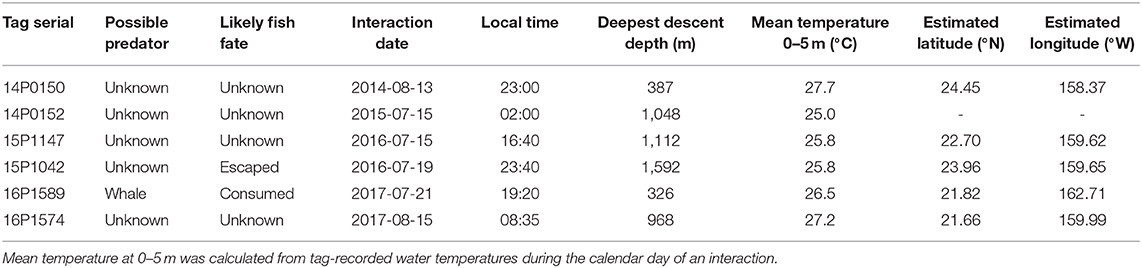
Table 2. Possible yellowfin tuna interactions with predators.
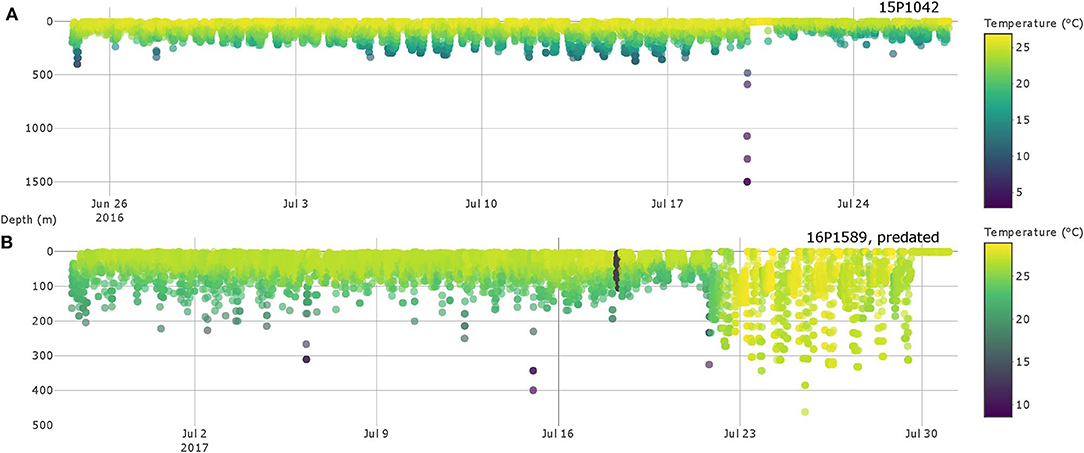
Figure 6. Depth and temperature profiles of yellowfin tuna 15P1042 (A) and 16P1589 (B) with possible predator interactions. Colors represent water temperature and are scaled individually for easier identification of possible interactions.
Discussion
Despite their economic value and cultural significance, the origins, behavior and stock structure of Pacific yellowfin tuna found in the Main Hawaiian Islands (MHI) remain under-explored. This study provides the most up-to-date fishery-independent information on behavior and vertical habitat use of adult yellowfin tuna in the MHI and Central North Pacific. There have been extensive tagging and biological sampling efforts to obtain explicit spatiotemporal information and define connectivity of yellowfin in the eastern (Schaefer et al., 2011, 2014), western (Evans et al., 2011) and Indo-Pacific regions (Fonteneau and Hallier, 2015), but surprisingly, tagging studies in the MHI were last conducted in the 1990's and not repeated despite many outstanding questions regarding the assemblage. Yellowfin spawned in the Hawaiian waters and recruited to the local population are currently assumed to remain in the region throughout their lifespan and have little exchange with other Pacific regions (Adam et al., 2003; Wells et al., 2012; Rooker et al., 2016). However, this study shows that even within short, 2-month tracking periods, tagged adult yellowfin traveled as far as 2,000 km away from the Hawaiian Archipelago, while maintaining a movement rate ( = 34 km day−1) similar to earlier studies (Brill et al., 1999). In 1998–2002, conventional tagging conducted under the Hawaii Tuna Tagging Project (soest.hawaii.edu/PFRP/biology/holland_hrttp.html) focused on juvenile yellowfin and bigeye tunas (Adam et al., 2003), and was successful in tracking them into adolescence, but not into adulthood. While being an instrumental tool in stock assessment, fishery-dependent, conventional tagging studies do not allow control over time elapsed between release and recapture events, limiting observation of seasonal movements or determination of accurate movement rates. While these early tagging results would be useful as a historic reference to compare with results obtained in this study, their data are not available in any public repository. The contrasting movement patterns exhibited by different yellowfin life stages and studies conducted over a decade apart have demonstrated that tuna movement between tropical and temperate regions remains inadequately understood (Holland et al., 1999; Pecoraro et al., 2017, 2018; Anderson et al., 2019). As the Central North Pacific faces various anthropogenic stressors (Erauskin-Extramiana et al., 2019; Woodworth-Jefcoats et al., 2019) and stakeholders experience potential changes to fisheries management and conservation measures such as creation of large-scale marine protected areas (Richardson et al., 2018; Hernández et al., 2019), availability of yellowfin tuna and economic impacts to local communities will remain a serious issue.
Life History and Movements
High yellowfin availability near coastal Hawaiian waters during June to August is linked to an island-associated spawning run (June, 1953; Itano, 2000). While we did not conduct reproductive sampling for histological evaluation, we visually examined gonads of yellowfin harvested during tagging trips. Most females appeared to be near either pre or post-spawning condition, although no hydrated oocytes were observed. Several males had slightly enlarged testes with milt in their central ducts, but it was not copious, which would indicate immediate spawning. Some tagged fish remained around the MHI for at least 50 days, when sea surface temperature were within 24–28°C (Figure 4), a condition optimal for spawning and larval development (Margulies et al., 2007). Inshore Hawaiian waters appear to be a meeting spot for spawning yellowfin aggregations based on presence of spawning individuals (Itano, 2000) and larvae (June, 1953; Boehlert and Mundy, 1994).
Our tagging data offered the first insight into what could happen after yellowfin complete island-associated reproduction. Individuals that dispersed northward also traveled through frontal structures within the same surface temperature range as insular areas, but daily temperature fluctuations were higher (Figure 4). It is possible that both foraging and spawning habitat conditions were also favorable offshore as tagged yellowfin moved away from the islands. Since yellowfin spawn multiple times a year (Margulies et al., 2007), documenting their reproductive status over potential spawning habitats, when yearlong tracks are achieved, will be important for depiction of reproduction, life history and bioenergetics. Regional fisheries management organizations have recommended that reproductive and genetic sampling be conducted alongside future electronic tagging programs of yellowfin and bigeye tuna (e.g., wpcouncil.org/research-priorities).
Horizontal Movement and Stock Structure
Yellowfin trajectories largely fit within the spatial structure (region 2) used in the stock assessment for the Western and Central Pacific (Tremblay-Boyer et al., 2017) with the exception of two individuals traveling beyond the management boundary into the Eastern Pacific (Figure 1). Pelagic tunas straying from their management unit, while problematic for assessments, is nothing new. However, our finding that several tagged yellowfin moved among management regions during the 2-month observation window was surprising. If an individual yellowfin were to maintain the general course and average movement rate, it could comfortably reach waters off Japan or Baja California within 4–6 months. While these coastal destinations have long been identified by conventional tagging, the time needed to reach them from the Main Hawaiian Islands was not known. It is also possible that yellowfin make cyclic returns to the MHI. Under this scenario, stock assessment must take into account seasonality in parameterizing quarterly movement rate, i.e., when yellowfin might be more resident around MHI during peak spawning. Kaua‘i-based fishermen have also noted sporadic appearance of large yellowfin during winter, and speculate on their connectivity to other Pacific regions, which should be examined in relation to longline catches beyond the 50-mile insular exclusion zone.
The diversity in movement patterns observed in this study contrasts with the primarily longitudinal movement in the equatorial region (Tremblay-Boyer et al., 2017) even though hardware failure prevented us from providing trajectories long enough to postulate spatial structure for yellowfin. This broad dispersal should not come as a surprise as movement is likely mediated by the different oceanographic conditions, and subsequently foraging and spawning opportunities between tropical and temperate Pacific. Tagging efforts have been disproportionally concentrated in the equatorial region, with over 300,000 conventional tags released (Fonteneau and Hallier, 2015). Movement patterns summarized from these efforts have led to the hypothesis of range contraction of yellowfin habitat over time (Tremblay-Boyer et al., 2017). From our small dataset, yellowfin covered large distances within a relatively short time, and individuals took different courses even when released minutes apart from one another. A finding of range contraction in the equatorial region could be an artifact of the location and observation period covered by tagging data, which could be mitigated with adequate sampling in areas other than the equatorial region, even as the majority of catches occur around the Equator.
Recently, high throughput genotyping with single nucleotide polymorphism markers has determined finer scale population structuring for yellowfin tuna in the Pacific Ocean (Grewe et al., 2015; Barth et al., 2017; Pecoraro et al., 2018; Anderson et al., 2019), complicating the management assumption that yellowfin comprise a single panmictic population in the Pacific. Sampling at each collection site/ area so far has remained small scale (n ≤ 11, Barth et al., 2017; n ≤ 24, Grewe et al., 2015; n ≤ 45, Pecoraro et al., 2018; n ≤ 80, Anderson et al., 2019), and the number of sites in the Pacific are limited (n = 2, Barth et al., 2017; n = 3, Grewe et al., 2015; n = 4, Pecoraro et al., 2018; n = 7, Anderson et al., 2019). Nonetheless, DNA profiling is expected to gain widespread use for its utility in addressing illegal fishing and seafood mislabeling (Gordoa et al., 2017). Given our results that yellowfin are highly mobile over a short period of time, particular attention should be given to DNA sampling design to account for spatiotemporal factors from seasonal movements of multiple size classes, to changing oceanographic conditions (e.g., currents, temperature, monsoon) and coupled systems (e.g., ENSO). As finer population structures are investigated with highly resolved next generation sequencing techniques, how and where sample collection takes place will become influential, as interpretation of results rely on grouping samples to a general area or location. To illustrate, if yellowfin 16P1888 were to be caught by a fishing vessel in the IATTC management area and bio-chemically profiled and biopsied onboard, this individual would have likely been assigned as a sample from the Eastern Pacific, even if it occupied coastal Hawaiian waters >2 weeks before. Similarly, if sampled at a landing port or tuna cannery, it would conceivably be assigned with the geographic location of that particular facility. This mismatch in resolution among genomic approaches, fishing operations and sampling methodology should not be overlooked (Kuparinen and Hutchings, 2019), and reinforces the need to couple genetic sampling with electronic tagging.
Depth Range, Thermal Habitat, and Predation
The stomach contents of yellowfin harvested during tagging trips included mostly small squid (Ommastrephidae), paper nautili (Argonauta), and some mixed, small fish species (e.g., Belonidae, Monacanthidae, Paralepididae). Buccaneer anchovy, Encrasicholina punctifer and vertical migrating mesopelagic shrimp, Oplophorus gracilirostris were previously identified as a dominant prey around the MHI (Reintjes and King, 1953; Itano, 2000; Graham et al., 2007). This highlights the generalist diet of yellowfin tuna (Reintjes and King, 1953; Pecoraro et al., 2017) and high utilization of the surface mixed layer, which distinguishes yellowfin from bigeye tuna that feed at a much higher trophic level even though the two species form mixed schools as juveniles (Choy et al., 2015).
Diurnal behavior of adult yellowfin in this study were mostly consistent with those conducted previously in the MHI, although not surprisingly, depth and thermal ranges exceeded those obtained in short, hydroacoustic tracking studies (Brill et al., 1999; Holland et al., 1999), and included deep descents beyond 400 m (maximum 1,592 m), and temperatures <8°C (minimum 2.9°C) noted elsewhere (Dagorn et al., 2007; Schaefer et al., 2011, 2014).
Daytime yellowfin habitat was almost entirely within the top 200 m, which places them within the preferred depths of toothed whales commonly found in Hawaiian waters, including the short-finned pilot whale, Globicephala macrorhynchus and false killer whale, Pseudorca crassidens (Forney et al., 2011; Bayless et al., 2017). False-killer whales in particular are known to target yellowfin tuna and mahi-mahi, Coryphaena hippurus near the surface, and are often photographed carrying or leaping out of the water with a fresh catch (see examples at cascadiaresearch.org/Hawaiian-cetacean-studies/false-killer-whales-hawaii). Depth-recorder data showed a false killer whale tagged near O‘ahu spent the majority of its time at the top 50 m, intermixed with V-shaped dives below 200 m and deeper dives between 1,020 and 1,272 m (Baird et al., 2013). Similarly, hunting dives of short-finned pilot whales featured V-shaped profiles and biosonar, interpreted as deep sprints to target “big payoff” prey such as giant squid or other energy-rich windfalls (Aguilar Soto et al., 2008). Rapid descents to deeper depths by tagged yellowfin mirrored depth profiles of potential predators (Figure 5), especially pilot whales: the dash to depth may be an effort by a yellowfin to outrun its predator. Our recovered tag documented that yellowfin routinely attained acceleration >3 G (maximum 3.46 G), showing its capability to evade a predator with short bursts. Predation events may be fairly common (e.g., 6 suspected cases out of 19 tagged tuna), in coastal Hawaiian waters (Figure 2) where yellowfin overlap with the spatial distributions of cetacean predators (Baird et al., 2013). Acoustic recorders positioned off Kaua‘i and Ni‘ihau documented that forging activity of deep-diving toothed whales increased after dusk, and peaked around midnight before decreasing toward dawn (Au et al., 2013), a pattern that fits our estimated timing of interactions (Table 2). Curiously, from our limited data, the deepest depths were reached by both yellowfin (Figure 4) and false killer whales (Baird et al., 2013) around midnight, suggesting interactions can occur any time of the day, facilitated by bio-sonar based foraging on the part of the whales (Aguilar Soto et al., 2008). Other top fish predators also attack large yellowfin, as spectacularly illustrated by our captain's catch of a >365 kg blue marlin that had swallowed its 50 kg ‘ahi prey whole.
Tag Reliability and Performance
There is a growing appreciation in stock assessment circles of the value of spatially and temporally explicit, fishery-independent information on habitat, dispersal patterns, and oceanographic associations of tunas and billfish obtained from electronic data loggers (Sippel et al., 2015). Yet high costs (~ USD$ 1,000–4,000 per tag) and reliability issues have limited the PSATs' potential to obtain a sample size (i.e., ≥250) with sufficient statistical power (Patterson and Hartmann, 2011). Their application is further discounted by short deployment durations i.e., <120 days stemming from a variety of tag hardware, software and user issues (Musyl et al., 2011), although year-long tracks have been achieved in a minority of tag records (Lutcavage et al., 2014). In life history context, a complete migration cycle of tunas and billfish implies a roundtrip from foraging to spawning grounds and back (Lam et al., 2016). Hardware failure in 42% of tags deployed in this study prevented attainment of year-long yellowfin trajectories necessary to characterize seasonal and basin-scale patterns. While it is informative that this particular tag model provides explicit error messages for a single known hardware problem (nosecone breakage), the resulting short missions, all under 60 days, were nonetheless costly in many ways, especially that of loss of scientific opportunity (Lutcavage et al., 2014). The explicit spatiotemporal information returned by electronic tags, especially long term tracks, would help inform and evaluate site fidelity, schooling behavior and relatedness questions now being addressed with genomic studies (Pecoraro et al., 2018; Anderson et al., 2019). Additionally, navigational abilities of tuna supported by physio-magnetic anatomical structures wired for sensory integration (Walker et al., 1984; Formicki et al., 2019) can be considered alongside full migration records. Despite the wealth of environmental and biological data that PSATs have offered since 1997, for them to be successfully utilized by assessment scientists and fisheries management organizations, tags must demonstrate a reasonable level of reliability over time, and meet performance standards.
Conclusions
Fisheries scientists have been calling for ways to elucidate the complex lifestyles and migrations of long-lived tuna and billfish, in large part to improve population assessments. But scientific profiling is also needed to assure fisheries sustainability against a background of warming oceans, changing fleet dynamics, new regulations, and demanding seafood markets. Yellowfin tuna comprise an enormous part of the economy, diet and culture throughout the Pacific Islands, yet fisheries research and tagging programs have focused intensively on equatorial regions while other parts of the Pacific remain understudied. There is much that remains unknown. If we are to maintain healthy local tuna assemblages, it is crucial to understand the dynamics of yellowfin tuna in the Central North Pacific, their connectivity to other regions, reproductive schedules, nursery areas and ecosystem interactions. Yellowfin mostly feed in the top layers of the ocean. Robust spatial information is required from their habitats to identify potential stressors arising from climate change, or impacts from pollution such as microplastics. Two of the crucial building blocks for this kind of information are robust tagging programs and biological sampling. We recommend that renewed investments in tagging with biological sampling be deployed to support ecosystem-based management. Local fishermen seek, require and prioritize timely knowledge in these times of changing ecosystems and economics. And they are prepared to assist in deploying tags at multiple locations across the Main Hawaiian Islands. With committed participation by these fishermen partners, we propose a cooperative research effort that provides a successful model to unlock often overlooked and unknown secrets of tuna in the Pacific and beyond.
Data Availability Statement
The datasets generated for this study are available on request to the corresponding author.
Ethics Statement
Ethical review and approval was not required for the animal study because we tagged-and-released commercial fish (non-endangered but managed and regulated) with non-invasive procedures. The fish subjects would otherwise have been harvested.
Bioethics
In the US, it is accepted practice that placing a dart type external fish tag aboard a commercial fishing vessel does not require review by IAUC committees. Tag and release, with a small bio-compatible dart, conducted in the manner stated in our paper, is routine in US recreational and commercial fisheries, and does not require permitting by fisheries regulators.
Author Contributions
ML and CT designed and executed the research. CL and DK performed the analyses. All authors prepared and reviewed the manuscript.
Funding
We are grateful to the initial funding provided by NOAA Cooperative Research Program (award NA15NMF4720395) and equipment donation by the Western Pacific Regional Fishery Management Council and the Large Pelagics Research Center.
Conflict of Interest
The authors declare that the research was conducted in the absence of any commercial or financial relationships that could be construed as a potential conflict of interest.
Acknowledgments
This research success relied on the extensive contributions of our fishermen partners in sharing knowledge and expertise, including Captains Ryan Koga, Eric Hadama, Kevin DeSilva, Curtis Matsumura, Mark Oyama, Nathan Abe, Mike Abe, Gary Shirakata, Kevin Awa, Marvin Lum, John Kauhaihao, Craig Koga, and Cory Nakamura, as well as Basil Oshiro, Gavin De Silva, Bryan Hayashi, Alan Horikawa, Joe Koerte, Ryan Kusunoki, Justin Pasamonte, Lance Gilbert, Jan TenBruggencate, and the late Reid Shigeki Takayama. Jan TenBruggencate and Leiana Robinson expedited recovery of a PSAT tag on Ni‘ihau. Owyn Snodgrass verified species of prey.
Supplementary Material
The Supplementary Material for this article can be found online at: https://www.frontiersin.org/articles/10.3389/fmars.2020.00138/full#supplementary-material
Figure S1. Diel depth distribution of tagged yellowfin tuna at various latitudinal bands.
Appendix 1. Reconstructed tracks of tagged yellowfin tuna. The confidence region along an estimated position is indicated by gray-shaded ellipses. Positions are color-coded by months. Tagging locations, green triangle; last known fish locations, red triangle.
Appendix 2. Animation of yellowfin tuna 16P1571 (cyan icon), 16P1872 (blue icon), 16P1888 (green icon), released in 2017. Black polygons represent exclusive economic zones (EEZ) obtained from Marineregions.org (marineregions.org/eez.php). Green polygon represents management boundary of Inter American Tropical Tuna Commission (IATTC) obtained from RAM Legacy Stock Boundary Database (marine.rutgers.edu/~cfree/ram-legacy-stock-boundary-database). Sea surface temperature imagery is OSTIA global foundation Sea Surface Temperature (product identifier: SST_GLO_SST_L4_NRT_OBSERVATIONS_010_001) obtained from European Union Copernicus Marine Environment Monitoring Service (marine.copernicus.eu/services-portfolio/access-to-products).
Appendix 3. Animation of yellowfin tuna 15P1035 (pink icon), 15P1039 (green icon), 15P1041 (yellow icon), 15P1147 (gray icon), all released on 24th June 2016. Black polygons represent exclusive economic zones (EEZ) obtained from Marineregions.org (marineregions.org/eez.php). Green polygon represents management boundary of Inter American Tropical Tuna Commission (IATTC) obtained from RAM Legacy Stock Boundary Database (marine.rutgers.edu/~cfree/ram-legacy-stock-boundary-database). Sea surface temperature imagery is OSTIA global foundation Sea Surface Temperature (product identifier: SST_GLO_SST_L4_NRT_OBSERVATIONS_010_001) obtained from European Union Copernicus Marine Environment Monitoring Service (marine.copernicus.eu/services-portfolio/access-to-products).
References
Adam, M. S., Sibert, J., Itano, D., and Holland, K. (2003). Dynamics of bigeye (Thunnus obesus) and yellowfin (T. albacares) tuna in Hawaii's pelagic fisheries: analysis of tagging data with a bulk transfer model incorporating size-specific attrition. Fish. Bull. 101, 215–228.
Aguilar Soto, N., Johnson, M. P., Madsen, P. T., Díaz, F., Domínguez, I., Brito, A., et al. (2008). Cheetahs of the deep sea: deep foraging sprints in short-finned pilot whales off Tenerife (Canary Islands). J. Animal Ecol. 77, 936–947. doi: 10.1111/j.1365-2656.2008.01393.x
Anderson, G., Lal, M., Hampton, J., Smith, N., and Rico, C. (2019). Close kin proximity in yellowfin tuna (Thunnus albacares) as a driver of population genetic structure in the Tropical Western and Central Pacific Ocean. Front. Mar. Sci. 6:341. doi: 10.3389/fmars.2019.00341
Au, W. W. L., Giorli, G., Chen, J., Copeland, A., Lammers, M., Richlen, M., et al. (2013). Nighttime foraging by deep diving echolocating odontocetes off the Hawaiian islands of Kauai and Ni'ihau as determined by passive acoustic monitors. J. Acoust. Soc. Am. 133, 3119–3127. doi: 10.1121/1.4798360
Baird, R. W., Webster, D. L., Mahaffy, S. D., Schorr, G. S., Aschettino, J. M., and Gorgone, A. M. (2013). Movements and Spatial Use of Odontocetes in the Western Main Hawaiian Islands: Results of a Three-Year Study Off O'ahu and Kaua'i. Washington, DC: Naval Postgraduate School NPS-OC-14-001CR; Chief of Naval Operations, Energy and Environmental Readiness Division.
Barth, J. M. I., Damerau, M., Matschiner, M., Jentoft, S., and Hanel, R. (2017). Genomic differentiation and demographic histories of Atlantic and Indo-Pacific yellowfin tuna (Thunnus albacares) populations. Genome Biol. Evol. 9, 1084–1098. doi: 10.1093/gbe/evx067
Bayless, A. R., Oleson, E. M., Baumann-Pickering, S., Simonis, A. E., Marchetti, J., Martin, S., et al. (2017). Acoustically monitoring the Hawai‘i longline fishery for interactions with false killer whales. Fish. Res. 190, 122–131. doi: 10.1016/j.fishres.2017.02.006
Boehlert, G. W., and Mundy, B. C. (1994). Vertical and onshore-offshore distributional patterns of tuna larvae in relation to physical habitat features. Mar. Ecol. Prog. Series 107, 1–13. doi: 10.3354/meps107001
Boehlert, G. W., Watson, W., and Sun, L. C. (1992). Horizontal and vertical distributions of larval fishes around an isolated oceanic island in the tropical Pacific. Deep Sea Res. Part A Oceanogr. Res. Pap. 39, 439–466. doi: 10.1016/0198-0149(92)90082-5
Brill, R. W., Block, B. A., Boggs, C. H., Bigelow, K. A., Freund, E. V., and Marcinek, D. J. (1999). Horizontal movements and depth distribution of large adult yellowfin tuna (Thunnus albacares) near the Hawaiian Islands, recorded using ultrasonic telemetry: implications for the physiological ecology of pelagic fishes. Mar. Biol. 133, 395–408. doi: 10.1007/s002270050478
Choy, C. A., Popp, B. N., Hannides, C. C. S., and Drazen, J. C. (2015). Trophic structure and food resources of epipelagic and mesopelagic fishes in the North Pacific Subtropical Gyre ecosystem inferred from nitrogen isotopic compositions. Limnol. Oceanogr. 60, 1156–1171. doi: 10.1002/lno.10085
Dagorn, L., Holland, K. N., and Itano, D. G. (2007). Behavior of yellowfin (Thunnus albacares) and bigeye (T. obesus) tuna in a network of fish aggregating devices (FADs). Mar. Biol. 151, 595–606. doi: 10.1007/s00227-006-0511-1
Erauskin-Extramiana, M., Arrizabalaga, H., Hobday, A. J., Cabré, A., Ibaibarriaga, L., Arregui, I., et al. (2019). Large-scale distribution of tuna species in a warming ocean. Glob. Chang. Biol. 25, 2043–2060. doi: 10.1111/gcb.14630
Evans, K. J., Patterson, T. A., and Pedersen, M. (2011). Movement Patterns of Yellowfin Tuna in the Coral Sea Region: Defining Connectivity With Stocks in the Western Pacific Ocean Region. Hobart, TAS; Canberra, ACT: CSIRO Marine and Atmospheric Research; Australian Fisheries Management Authority.
Fonteneau, A., and Hallier, J.-P. (2015). Fifty years of dart tag recoveries for tropical tuna: a global comparison of results for the western Pacific, eastern Pacific, Atlantic, and Indian Oceans. Fish. Res. 163, 7–22. doi: 10.1016/j.fishres.2014.03.022
Formicki, K., Korzelecka-Orkisz, A., and Tanski, A. (2019). Magnetoreception in fish. J. Fish Biol. 95, 73–91. doi: 10.1111/jfb.13998
Forney, K. A., Kobayashi, D. R., Johnston, D. W., Marchetti, J. A., and Marsik, M. G. (2011). What's the catch? Patterns of cetacean bycatch and depredation in Hawaii-based pelagic longline fisheries. Mar. Ecol. 32, 380–391. doi: 10.1111/j.1439-0485.2011.00454.x
Galuardi, B., and Lutcavage, M. (2012). Dispersal routes and habitat utilization of juvenile Atlantic bluefin tuna, Thunnus thynnus, tracked with Mini PSAT and archival tags. PLoS ONE 7:e37829. doi: 10.1371/journal.pone.0037829
Glazier, E. W. (2007). Hawai'i Pelagic Handline Fisheries: History, Trends, and Current Status. Honolulu, HI: Final Background Document Prepared for the Western Pacific Fisheries Management Council.
Gordoa, A., Carreras, G., Sanz, N., and Viñas, J. (2017). Tuna species substitution in the Spanish commercial chain: a knock-on effect. PLoS ONE 12:e0170809. doi: 10.1371/journal.pone.0170809
Graham, B. S., Grubbs, D., Holland, K., and Popp, B. N. (2007). A rapid ontogenetic shift in the diet of juvenile yellowfin tuna from Hawaii. Mar. Biol. 150, 647–658. doi: 10.1007/s00227-006-0360-y
Grewe, P. M., Feutry, P., Hill, P. L., Gunasekera, R. M., Schaefer, K. M., Itano, D. G., et al. (2015). Evidence of discrete yellowfin tuna (Thunnus albacares) populations demands rethink of management for this globally important resource. Sci. Rep. 5:16916. doi: 10.1038/srep16916
Hernández, C. M., Witting, J., Willis, C., Thorrold, S. R., Llopiz, J. K., and Rotjan, R. D. (2019). Evidence and patterns of tuna spawning inside a large no-take Marine protected area. Sci. Rep. 9:10772. doi: 10.1038/s41598-019-47161-0
Holland, K. N., Kleiber, P., and Kajiura, S. M. (1999). Different residence times of yellowfin tuna, Thunnus albacares, and bigeye tuna, T. obesus, found in mixed aggregations over a seamount. Fish. Bull. 97, 392–395.
Itano, D. G. (2000). The Reproductive Biology of Yellowfin Tuna (Thunnus albacares) in Hawaiian Waters and the Western Tropical Pacific Ocean: Project Summary. Honolulu: SOEST Publ00-01, JIMAR Contribution 00-328.
Itano, D. G., and Holland, K. N. (2000a). “Hawaii tuna tagging project,” in SCTB13 Working Paper RG-8. 13th Meeting of the Standing Committee on Tuna and Billfish (Noumea).
Itano, D. G., and Holland, K. N. (2000b). Movement and vulnerability of bigeye (Thunnus obesus) and yellowfin tuna (Thunnus albacares) in relation to FADs and natural aggregation points. Aquat. Living Resour. 13, 213–223. doi: 10.1016/S0990-7440(00)01062-7
Klimley, A. P., and Holloway, C. (1999). School fidelity and homing synchronicity of yellowfin tuna, Thunnus albacares. Mar. Biol. 133, 307–317. doi: 10.1007/s002270050469
Kuparinen, A., and Hutchings, J. A. (2019). When phenotypes fail to illuminate underlying genetic processes in fish and fisheries science. ICES J. Mar. Sci. 76, 999–1006. doi: 10.1093/icesjms/fsz002
Lam, C. H., Galuardi, B., Mendillo, A., Chandler, E., and Lutcavage, M. E. (2016). Sailfish migrations connect productive coastal areas in the West Atlantic Ocean. Sci. Rep. 6:38163. doi: 10.1038/srep38163
Lam, C. H., Nielsen, A., and Sibert, J. R. (2010). Incorporating sea-surface temperature to the light-based geolocation model trackit. Mar. Ecol. Prog. Series 419, 71–84. doi: 10.3354/meps08862
Lam, C. H., and Tsontos, V. M. (2011). Integrated management and visualization of electronic tag data with tagbase. PLoS ONE 6:e21810. doi: 10.1371/journal.pone.0021810
Lutcavage, M., Lam, C. H., and Galuardi, B. (2014). Seventeen years and $3 million dollars later: performance of PSAT tags deployed on Atlantic bluefin and bigeye tuna. ICCAT Collective Volume of Scientific Papers, SCRS/167/2014, Madrid.
Lutcavage, M. E., Brill, R. W., Skomal, G. B., Chase, B. C., and Howey, P. W. (1999). Results of pop-up satellite tagging of spawning size class fish in the Gulf of Maine: do North Atlantic bluefin tuna spawn in the mid-Atlantic? Can. J. Fish. Aquat. Sci. 56, 173–177. doi: 10.1139/f99-016
Margulies, D., Sutter, J. M., Hunt, S. L., Olson, R. J., Scholey, V. P., Wexler, J. B., et al. (2007). Spawning and early development of captive yellowfin tuna (Thunnus albacares). Fish. Bull. 105, 249–265.
Musyl, M. K., Domeier, M. L., Nasby-Lucas, N., Brill, R. W., Mcnaughton, L. M., Swimmer, J. Y., et al. (2011). Performance of pop-up satellite archival tags. Mar. Ecol. Prog. Series 433, 1–U58. doi: 10.3354/meps09202
Patterson, T. A., and Hartmann, K. (2011). Designing satellite tagging studies: estimating and optimizing data recovery. Fish. Oceanogr. 20, 449–461. doi: 10.1111/j.1365-2419.2011.00595.x
Pecoraro, C., Babbucci, M., Franch, R., Rico, C., Papetti, C., Chassot, E., et al. (2018). The population genomics of yellowfin tuna (Thunnus albacares) at global geographic scale challenges current stock delineation. Sci. Rep. 8:13890. doi: 10.1038/s41598-018-32331-3
Pecoraro, C., Zudaire, I., Bodin, N., Murua, H., Taconet, P., Diaz-Jaimes, P., et al. (2017). Putting all the pieces together: integrating current knowledge of the biology, ecology, fisheries status, stock structure and management of yellowfin tuna (Thunnus albacares). Rev. Fish Biol. Fish. 27, 811–841. doi: 10.1007/s11160-016-9460-z
Reintjes, J. W., and King, J. E. (1953). Food of yellowfin tuna in the central Pacific. Fish. Bull. 54, 90–110.
Richardson, A. J., Downes, K. J., Nolan, E. T., Brickle, P., Brown, J., Weber, N., et al. (2018). Residency and reproductive status of yellowfin tuna in a proposed large-scale pelagic marine protected area. Aquat. Conserv. 28, 1308–1316. doi: 10.1002/aqc.2936
Rooker, J. R., David Wells, R. J., Itano, D. G., Thorrold, S. R., and Lee, J. M. (2016). Natal origin and population connectivity of bigeye and yellowfin tuna in the Pacific Ocean. Fish. Oceanogr. 25, 277–291. doi: 10.1111/fog.12154
Schaefer, K. M., Fuller, D. W., and Aldana, G. (2014). Movements, behavior, and habitat utilization of yellowfin tuna (Thunnus albacares) in waters surrounding the Revillagigedo Islands archipelago biosphere reserve, Mexico. Fish. Oceanogr. 23, 65–82. doi: 10.1111/fog.12047
Schaefer, K. M., Fuller, D. W., and Block, B. A. (2011). Movements, behavior, and habitat utilization of yellowfin tuna (Thunnus albacares) in the Pacific Ocean off Baja California, Mexico, determined from archival tag data analyses, including unscented Kalman filtering. Fish. Res. 112, 22–37. doi: 10.1016/j.fishres.2011.08.006
Sibert, J., and Hampton, J. (2003). Mobility of tropical tunas and the implications for fisheries management. Mar. Policy 27, 87–95. doi: 10.1016/S0308-597X(02)00057-X
Sippel, T., Paige Eveson, J., Galuardi, B., Lam, C., Hoyle, S., Maunder, M., et al. (2015). Using movement data from electronic tags in fisheries stock assessment: A review of models, technology and experimental design. Fish. Res. 163, 152–160. doi: 10.1016/j.fishres.2014.04.006
Tremblay-Boyer, L., Mckechnie, S., Pilling, G., and Hampton, J. (2017). Stock Assessment of Yellowfin Tuna in the Western and Central Pacific Ocean Rev 1 (26 July 2017) (Raratonga: Western and Central Pacific Fisheries Commission Scientific Committee Thirteen Regular Session).
Uchiyama, J. H., and Kazama, T. K. (2003). Updated Weight-on-Length Relationships for Pelagic Fishes Caught in the Central North Pacific Ocean and Bottomfishes From the Northwestern Hawaiian Islands. Honolulu, HI: Pacific Islands Fisheries Science Center, National Marine Fisheries Service, NOAA.
Walker, M. M., Kirschvink, J. L., Chang, S.-B. R., and Dizon, A. E. (1984). A candidate magnetic sense organ in the yellowfin tuna, Thunnus albacares. Science 224, 751–753. doi: 10.1126/science.224.4650.751
Wells, R. J. D., Rooker, J. R., and Itano, D. G. (2012). Nursery origin of yellowfin tuna in the Hawaiian Islands. Mar. Ecol. Prog. Ser. 461, 187–196. doi: 10.3354/meps09833
Woodworth-Jefcoats, P. A., Blanchard, J. L., and Drazen, J. C. (2019). Relative impacts of simultaneous stressors on a pelagic marine ecosystem. Front. Mar. Sci. 6:383. doi: 10.3389/fmars.2019.00383
Keywords: tuna, PSAT, tagging, dispersal, predation, Main Hawaiian Islands, Central North Pacific
Citation: Lam CH, Tam C, Kobayashi DR and Lutcavage ME (2020) Complex Dispersal of Adult Yellowfin Tuna From the Main Hawaiian Islands. Front. Mar. Sci. 7:138. doi: 10.3389/fmars.2020.00138
Received: 04 December 2019; Accepted: 21 February 2020;
Published: 10 March 2020.
Edited by:
Michele Thums, Australian Institute of Marine Science (AIMS), AustraliaReviewed by:
Jason R. Hartog, CSIRO Oceans and Atmosphere (O&A), AustraliaNuno Queiroz, University of Porto, Portugal
Copyright © 2020 Lam, Tam, Kobayashi and Lutcavage. This is an open-access article distributed under the terms of the Creative Commons Attribution License (CC BY). The use, distribution or reproduction in other forums is permitted, provided the original author(s) and the copyright owner(s) are credited and that the original publication in this journal is cited, in accordance with accepted academic practice. No use, distribution or reproduction is permitted which does not comply with these terms.
*Correspondence: Chi Hin Lam, tagtuna@gmail.com