Non-song Vocalizations of Humpback Whales in Western Australia
 Angela Recalde-Salas
 Christine Erbe
 Chandra Salgado Kent
 Miles Parsons
- 1Centre for Marine Science and Technology, Curtin University, Perth, WA, Australia
- 2Centre for Ecosystems Research, Edith Cowan University, Joondalup, WA, Australia
- 3Oceans Blueprint, Coogee, WA, Australia
- 4Australian Institute of Marine Science, Perth, WA, Australia
This study presents non-song vocalizations of humpback whales (Megaptera novaeangliae) from two migratory areas off the Western Australian coast: Geographe Bay and Port Hedland. A total of 220 sounds were identified as non-song sounds in 193 h of recordings reviewed. Of those, 68 were measured and qualitatively classified into 17 groups using their spectral features. One group (HW-02) had a high level of variation in terms of spectral slope. However, further classification using statistical classification methods was not possible because of the small sample size. Non-song sound frequencies varied from 9 Hz to 6 kHz, with the majority of sounds under 200 Hz. The duration of non-song sounds varied between 0.09 and 3.59 s. Overall, the use of spectral features allowed general classification of humpback whale sounds in a low sample size scenario that was not conducive to using quantitative methods. However, for highly variable groups, quantitative statistical classification methods (e.g., random forests) are needed to improve classification accuracy. The identification and accurate classification of a species’ acoustic repertoire is key to effectively monitor population status using acoustic techniques and to better understand the vocal behavior of the species. The results of this study improve the monitoring of humpback whales by standardizing the classification of sounds and including them in the species’ repertoire. The inclusion of non-song sounds in passive acoustic monitoring of humpback whales will add females and calves to the detection counts of otherwise only singing males.
Introduction
Passive acoustic monitoring (PAM) is used worldwide as a technique to estimate relative abundance and distribution of sound-producing marine fauna. It is applied in basic ecology as well as for monitoring fauna before, during and after anthropogenic activities with potential impacts. PAM relies on the accurate identification of species, based on the acoustic characteristics of the sounds they produce. Therefore, the characterization of acoustic signals and repertoires for different species is a significant component of their monitoring.
The humpback whale is considered one of the most vocal of the cetaceans and the most acoustically studied. Humpback whale call repertoire is diverse in duration and frequency with most units exhibiting a fundamental frequency below 3 kHz. However, the general frequency range can vary between 50 Hz and 24 kHz (Silber, 1986; Au et al., 2006). Song is the best-studied form of communication in humpback whales and is defined as a repetitive sequence of sounds (Payne, 1978). It is typically unique for each population, evolving from year to year, but can also be transmitted between populations (Garland et al., 2011). Song is documented to be produced only by males, occurring primarily on breeding grounds (Payne, 1978; Frankel et al., 1995) and less frequently on feeding grounds (Clark and Clapham, 2004).
In addition to song, humpback whales emit other less-studied sounds described as social sounds. Social sounds are unpredictable, not patterned and range from 50 Hz to over 10 kHz (Dunlop et al., 2007; Zoidis et al., 2008) with source levels between 123 and 183 dB re 1 μPa at 1 m (Dunlop et al., 2013). These sounds can be song or non-song units vocalized in a social context (Dunlop et al., 2008; Rekdahl et al., 2013). Social sounds have been recorded in association with agonistic behavior or other individual interactions between adults (males and females; Silber, 1986; Richardson et al., 1995; Edds-Walton, 1997; Dunlop et al., 2008), and within groups with calves (e.g., mother with a calf or mother with a calf and escort(s); Dunlop et al., 2008; Zoidis et al., 2008). In this study, social sounds are referred to as non-song sounds because the behaviors associated with the sounds were not identified and it was not possible to determine whether these sounds served a social function.
According to spectrographic features, baleen whale sounds can be classified as constant-wave (CW), frequency-modulated (FM), or amplitude-modulated (AM) (Erbe et al., 2017). However, in the literature, these are frequently named and grouped according to how they are perceived by human listeners (and are given onomatopoeic names, such as grunt, growl, moan, wop, etc.). While most of the published studies that describe humpback whale vocalizations use onomatopoeic names, this type of classification may be problematic because different authors may give different names to the same signals, making a direct comparison difficult (Cholewiak et al., 2013; Erbe et al., 2017). Spectral features, however, are more standard and facilitate comparison among different signals, although some variation in categorization can occur as a result of recording and analysis settings (Erbe et al., 2017).
Few studies have described non-song sounds of the different humpback whale populations around the world. A repertoire of 34 social sounds and their social context have been described for the population that migrates along the east coast of Australia (Dunlop et al., 2007, 2008; Rekdahl et al., 2013), and another 24 have been described for the North Pacific population (Silber, 1986; Cerchio and Dahlheim, 2001; Zoidis et al., 2008). Only a few non-song sounds have been described for the Western Australian humpback whale population (Videsen et al., 2017), and a repertoire is yet to be developed.
The population of humpback whales off Western Australian (Breeding Group D) migrates from high-latitude feeding grounds in Antarctica to low-latitude breeding grounds off northwestern Australia. During migration, whales travel past Port Hedland (in the northwest) between approximately June and August on their way north, and between approximately August and November on their way south. During the southern migration, they travel through Geographe Bay (in the southwest of Australia) between September and January, before undertaking the remainder of their journey to sub-Antarctic and Antarctic waters. The period of migration at each location (Port Hedland and Geographe Bay) occurs over several months as different cohorts of the population migrate in a temporally staggered manner. This structured migration has been termed “temporal segregation” (Dawbin, 1997), whereby the first whales departing foraging grounds include a mix of females in late stages of lactation or with their yearly offspring. This cohort is followed by juveniles (males and females), then by resting females (i.e.,not lactating or pregnant) and mature males, and finally females in late pregnancy (Dawbin, 1997; Craig et al., 2003). The migration back to foraging grounds from breeding grounds has been reported to be first a mix of resting females and females in early stages of pregnancy, followed by immature males and females, then mature males, and finally, females in early stages of lactation and mothers with newborns (Dawbin, 1997; Craig et al., 2003).
The aim of this paper is to describe non-song sounds for the humpback whale population that migrates along the coast of Western Australia using: (1) qualitative descriptions of spectral features (CW, FM, AM, and contour shape), (2) qualitative onomatopoeic names for comparability with other studies, and (3) quantitative measures of spectral features and number of subunits. Qualitative and quantitative descriptors (1 and 3) were chosen to accurately describe and classify non-song sounds when advanced quantitative methods cannot be used because of sample size. In general, the vocalization rate of non-song sounds is low and data is either dismissed or classified using subjective descriptors (e.g., Silber, 1986). The characteristics proposed here to describe the sounds will reduce the subjectivity of the classification while allowing to use and compare small datasets and increasing the size of a species’ described repertoire.
Materials and Methods
Study Site
Underwater acoustic recordings were obtained in two areas off the coast of Western Australia: off Port Hedland and in Geographe Bay (Figure 1). Off Port Hedland, the northern and southern migrations of the 2011 migratory season were captured with recordings made between June 2011 and January 2012, while in Geographe Bay, the southern migrations of 2011 and 2012 were captured in November and December. Consequently, all recordings from Port Hedland in 2011 and 2012 and Geographe Bay in 2011 were from the same migratory season, while recordings in Geographe Bay in 2012 were from southbound animals in the subsequent migratory season.
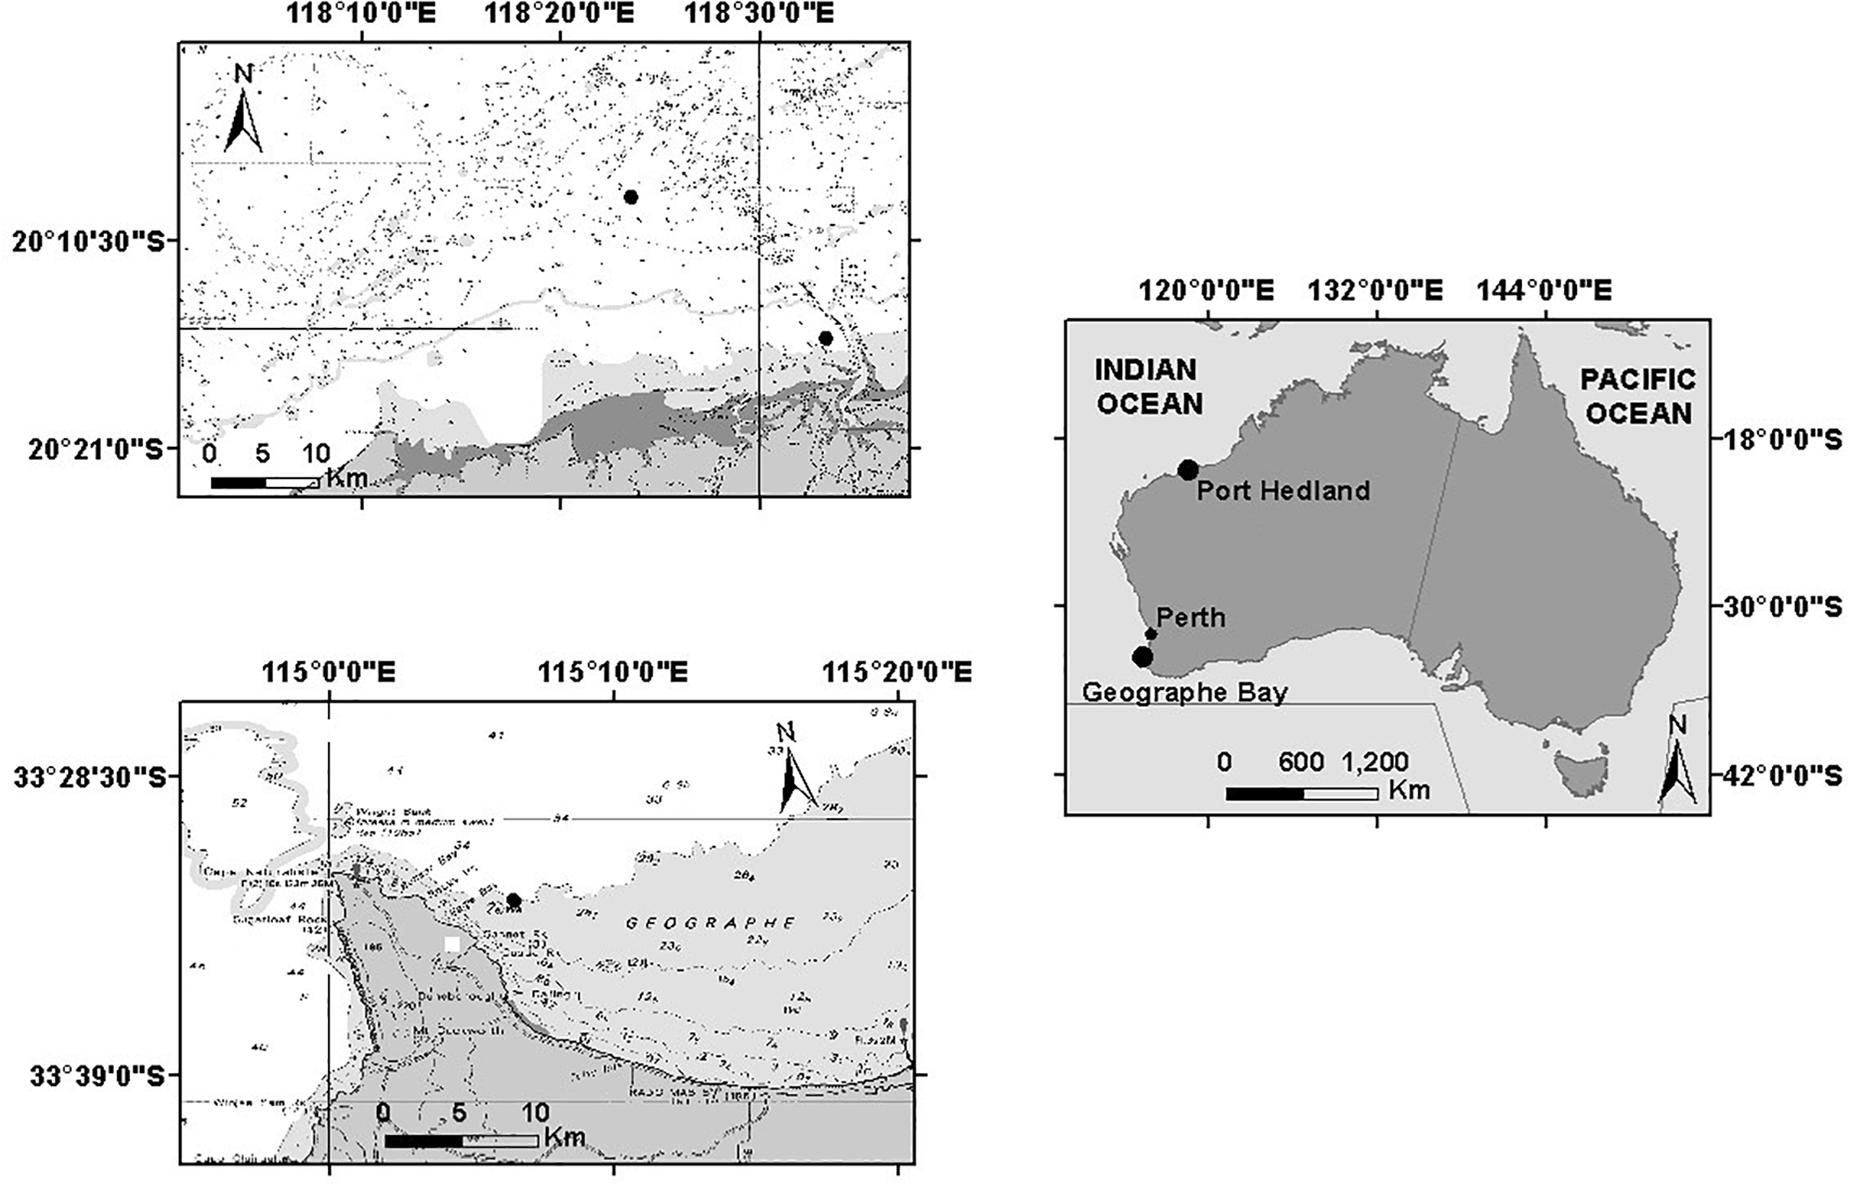
Figure 1. Geographic locations of noise recorder deployments in Port Hedland and Geographe Bay, Western Australia.
Geographe Bay is an important tourist destination in southwestern Australia, with recreational boating and whale-watching being key attractions of economic value. Therefore, high levels of vessel traffic and interactions with whales occur at this site. As a result, a long-term whale monitoring program has been underway since 2010, in which visual observations from multiple platforms have been collected to complement acoustic data.
Geographe Bay was selected as the principal study site as more data were available from this monitoring program. Humpback whales migrating south between September and January through Geographe Bay have peak migratory periods that vary among seasons (Salgado Kent et al., 2012). However, monitoring has been focused on the period after the peak of migration. This is important as it facilitates identification of non-song sounds because they are not masked by proliferate humpback whale song from the large number of whales passing through the area. Furthermore, presence of the species and their group compositions can be confirmed by visual observations and give additional information to the acoustical signals recorded.
The area off Port Hedland was selected as a secondary study site to increase the geographical scale of the study, while sampling the same population. Humpback whales migrate further offshore at Port Hedland than in Geographe Bay and, as a result, no visual observations were available. Port Hedland is the second-largest town in the Pilbara region of Western Australia and is also the location of the highest tonnage port in Australia (Western Australia Planning Commission Department of Planning, 2011).
Acoustic Recordings and Data Processing
In Geographe Bay, a single stationary underwater acoustic recorder was deployed on the seabed at 30-m depth, at 33°32′52.38″ and 115°6′39.18″E, approximately 2.5 km from the coast (Figure 1). The recorder was scheduled to record 13 min every 15 min (Table 1).
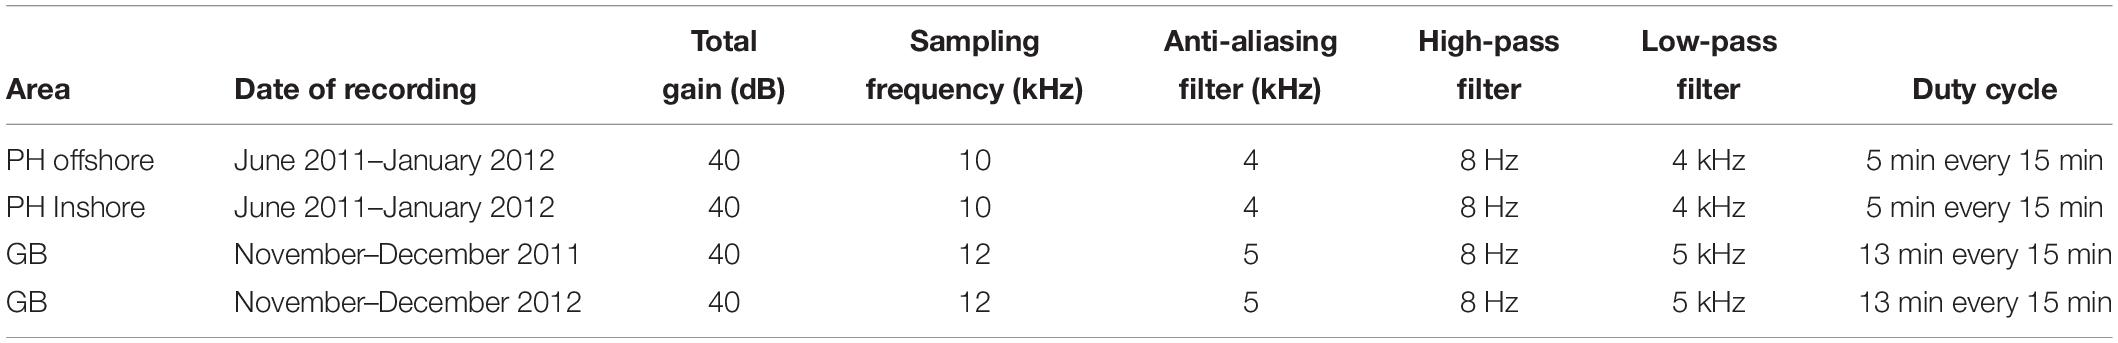
Table 1. Acoustic recorder settings for Port Hedland (PH) and Geographe Bay (GB) deployments.
Off Port Hedland, two underwater recorders were deployed: one at 20°8′19.32″S and 118°23′34.92″E, ≈20 km from the coast, and the other further inshore at 20°15′25.62″S and 118°33′22.74″E, ≈5 km from the coast (Figure 1). Recorders were deployed at 16 m and 6 m depths respectively, and scheduled to record 5 min every 15 min (Table 1). The offshore location was expected to capture sounds produced by a range of different cohorts of the whale population, while the inshore location was expected to capture a comparatively larger proportion of mothers and calves that typically migrate closer to the coast (Smultea, 1994; Ersts and Rosenbaun, 2003; Rasmussen et al., 2012; Guidino et al., 2014; Oña et al., 2016; Irvine and Salgado Kent, 2017). All recordings were used (no subsampling occurred).
Both areas used acoustic recording systems developed by the Centre for Marine Science and Technology (CMST) and the Defence Science and Technology Organisation (DSTO) (McCauley et al., 2017), fitted with a calibrated, omni-directional HTI 90-U hydrophone (HighTech Inc., MS, United States). Recording systems were calibrated with a white noise generator at −90 dB re 1 μPa2/Hz. Recorder settings are summarized in Table 1. Since the study durations at the two locations differed, so did their recording schedules to facilitate cost efficient data collection that did not exhaust battery life and memory capacity prior to the completion of the study. The area off of Port Hedland is transited by humpback whales during their northern and southern migrations, while Geographe Bay is transited only during the southern migration. Consequently, the logger off Port Hedland was programmed so that it could sample over a longer period than in Geographe Bay, and therefore avoid the necessity of redeploying it halfway through the season, as a cost-effective measure. This required ensuring the recorder off Port Hedland had sufficient memory and battery capacity over the longer period, thus, the schedule included shorter duration samples than in Geographe Bay (i.e., 5 min verses 13 min samples taken every 15 min). The differences in sample duration may affect the number of non-song sounds detected per day at each location (Recalde-Salas, 2020). Detection performance may also differ between the two sites, as a result of different levels of masking caused by vessel activity. Of the two sites, Port Hedland experiences more shipping, while Geographe Bay experiences more small vessel traffic. Shipping off Port Hedland was generally relatively distant and small vessel noise in Geographe Bay was transient (relatively short duration). Furthermore, an analysis on detection probability of whale sounds did not find vessels as a significant factor affecting the likelihood of detecting whale sounds (Recalde-Salas, 2020).Consequently, the effect on this study was considered relatively low given the SNR criteria. Moreover, the aim of the study was not a direct comparison of non-song vocalization rate or probability of detecting non-song sounds, but rather a description of non-song sounds which is expected to be unaffected by different duty cycles or vessel-related masking.
Acoustic data were first processed and reviewed using the Characterization Of Recorded Underwater Sound (CHORUS) toolbox built in the software MATLAB (version 2012a; The MathWorks, Inc., Natick, MA, United States) which provides a Graphical User Interface (GUI) (Gavrilov and Parsons, 2014). Data were visually inspected by plotting spectrograms with 2048-point Fast Fourier Transforms (FFTs), Hanning window, 70% overlap, on a logarithmic frequency scale of 8 to 4000 Hz. Color scale of the spectrograms was fixed at 60 to 110 dB re 1 μPa2/Hz.
Non-song sounds were identified as either sounds that were not part of humpback whale song or song units that did not follow the sequence characteristic of the song (Dunlop et al., 2007). Song described for each season in each area was referred to for this assessment.
Of those non-song sounds identified in recordings, only sounds without overlapping signals (e.g., other humpback whale calls or vessels) were selected for description. In addition, only sounds with fundamental frequency power spectrum density (PSD) higher than 90 dB re 1 μPa2/Hz and signal-to-noise ratio (SNR) calculated by CHORUS of at least 8 dB were selected. Non-song sounds that met these criteria were described qualitatively and quantitatively. Sounds were qualitatively described: (1) as CW, FM, AM, or a combination, and (2) according to their contour shape. Sounds were attributed onomatopoeic names based on how they were perceived by the listener (e.g., wop, cry, thwop, etc.), and according to names used in other studies for comparability (Silber, 1986; Dunlop et al., 2007; Zoidis et al., 2008; Rekdahl et al., 2013).
Quantitative description of non-song sounds included the number of subunits. Subunits were defined as a component of a sound distinguished by discontinuities in frequency and were referred to as parts A, B, and so on (Pace et al., 2010; Cholewiak et al., 2013). A unit was identified as the shortest continuous sound (Payne and McVay, 1971). When a sound was made of only one unit, it was considered to have no subunits (Cholewiak et al., 2013). Quantitative analysis further included measures of call duration (in seconds), and maximum and minimum frequencies (in Hz) (Table 2). Furthermore, a mean spectrum was computed over the duration of each call and the peak frequency was picked as the frequency of peak power. Then, 3-dB and 10-dB bandwidths were computed as the frequency bands around the peak frequency in which the peak power dropped by 3-dB and 10-dB, respectively. Because some literature described fundamental frequencies (i.e., the lowest frequency component), specifically for harmonic sounds, the maximum frequency of the fundamental was measured as well for these sounds.
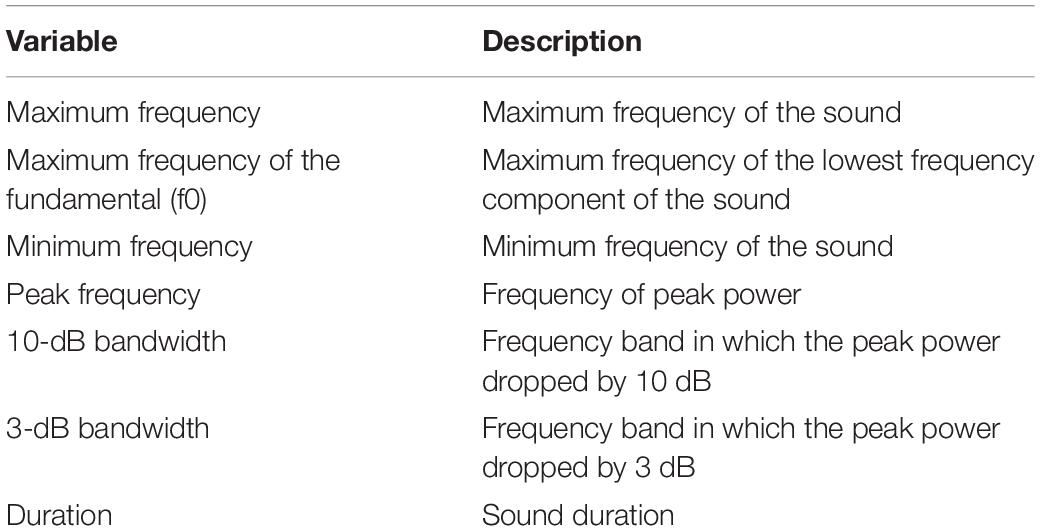
Table 2. Quantitative metrics used to describe non-song sounds of humpback whales in Geographe Bay and off Port Hedland, Western Australia.
Quantitative measures were undertaken using custom-written code in MATLAB. All analyses were carried out by two experienced analysts (ARS, CE). Under the PSD and SNR criteria used in this study, there were too few samples for classification using approaches such as Random Forest Decision Trees as done in other studies (Rekdahl et al., 2013). Thus, statistical summaries, spectrograms, and wave forms are presented for visualization of the range and variability of non-song sounds from the humpback whale population off Western Australia.
Results
A total of 107 (in 428 recordings from November to December 2011 and 2012) and 84 h (in 336 recordings from June 2011 to January 2012) were analyzed for Geographe Bay and Port Hedland, respectively. A total of 220 sounds were identified as non-song sounds (197 in Geographe Bay and 23 off Port Hedland). Of those, 68 were selected for qualitative and quantitative description (53 from Geographe Bay and 15 from Port Hedland). These discernible sounds occurred within 120 recordings (28%) in Geographe Bay and 3 recordings (0.3%) off Port Hedland.
Off Port Hedland, clearly discernible non-song sounds were only identified from inshore recordings before and after the peak migratory period. The offshore recordings had no discernible non-song sounds before and after the peak of migration. During the peak period, any non-song sounds were likely masked due to the high number of song sounds present in the inshore and offshore recordings. However, there were discernible non-song sounds in the inshore recordings early in the migration in mid-July (two non-song sounds were identified) and late in the migration in mid-November 2011 (15 non-song sounds were identified). The non-song sounds recorded in November were identified one month after the last singer was recorded. In contrast with results from Port Hedland, non-song sounds were more easily discerned in recordings from Geographe Bay. This is likely due to less masking of non-song sounds due to fewer singers recorded at any one time at this location. However, it is possible that when multiple singers were present in Geographe Bay, some non-song sounds may have been mis-identified as song units.
Sounds fell into one of 17 non-song sound types (referred to here as non-song sounds HW-01 to HW-17) based on their qualitative spectral features (Figure 2 and Table 3). Of the different non-song sound types described, most were FM (n = 8) followed by AMFM (n = 5), CW (n = 4), and AM (n = 1) (Table 3). These non-song sound types included the following onomatopoeic descriptors: grunt, growl, wop, thwop, trumpet, bup, cry, moan, muah, and boop (Figure 2). Sounds composed of subunits had, in some cases, combinations of these descriptors, yielding hyphenated onomatopoeic descriptors in Table 3. The first of the descriptors (such as “Growl” in “Growl-Wop”) describes the sound with which the signal commenced, while the second descriptor (i.e., “Wop” in “Growl-Wop”) describes the final sound.
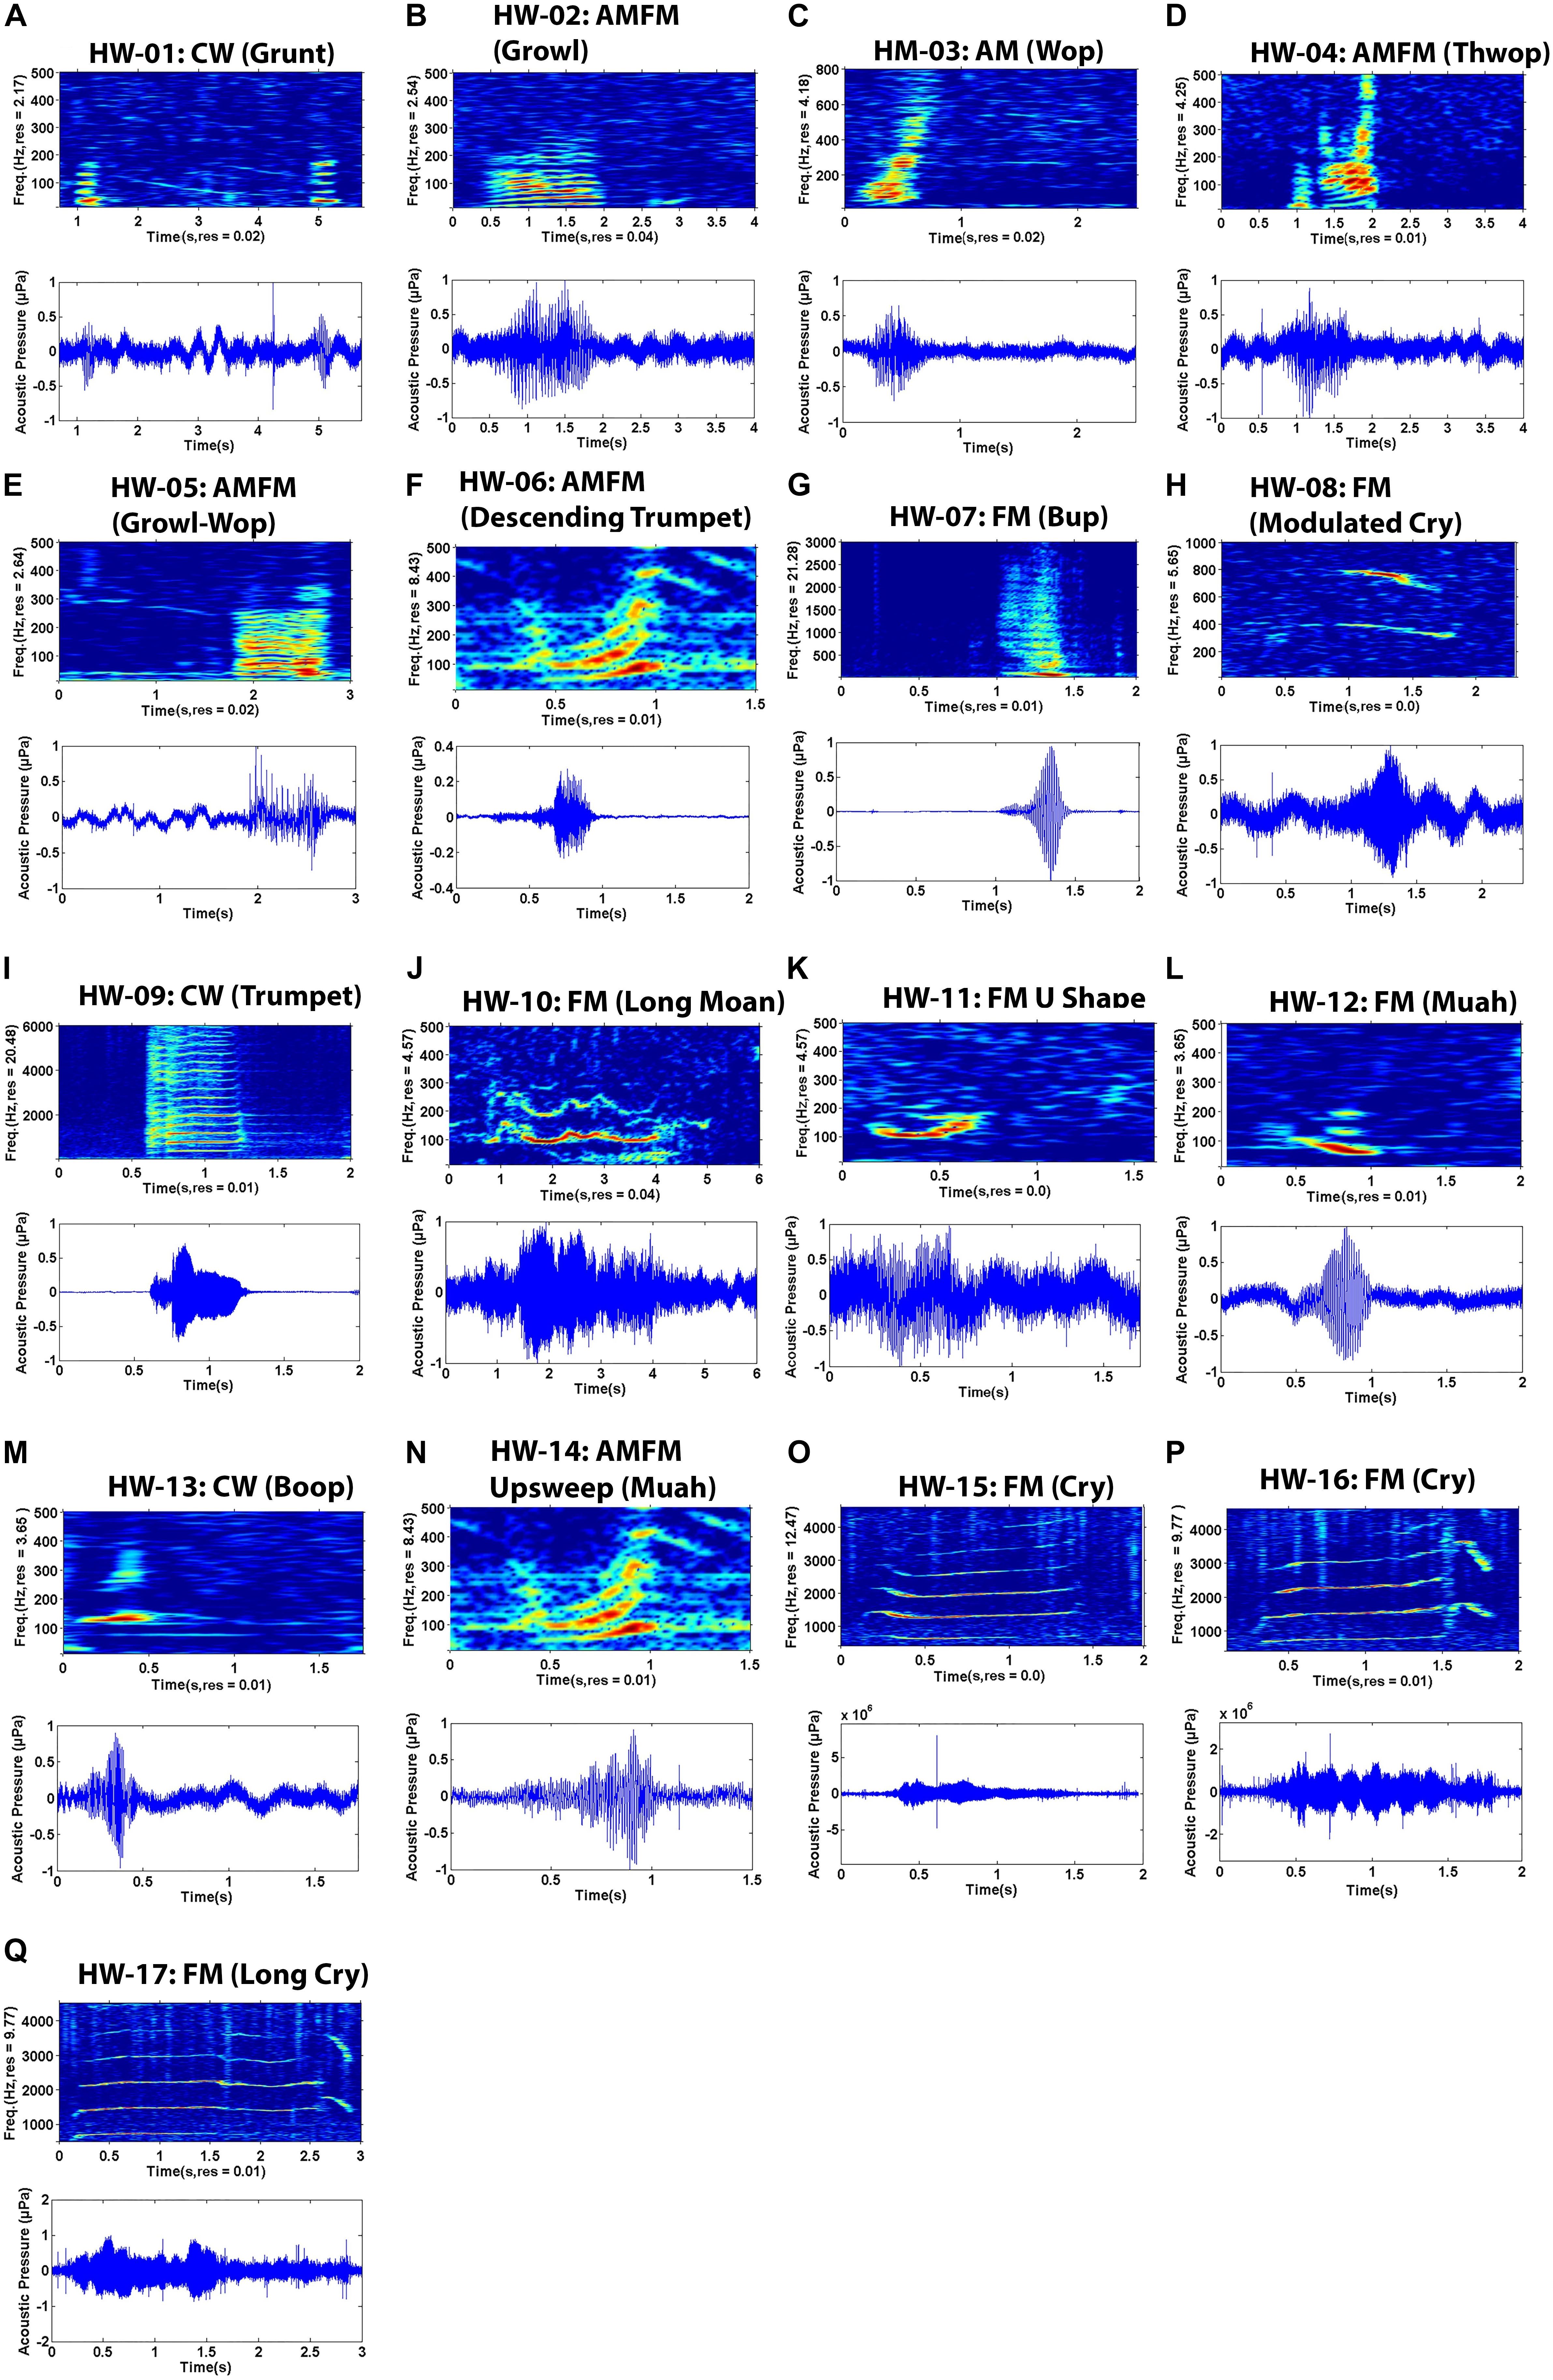
Figure 2. Spectrograms (top) and waveform (bottom) pairs (A–Q) of unique non-song sounds recorded off Geographe Bay and Port Hedland, northwestern Australia. Sound names are organized by number (e.g. HW-01), spectral feature (e.g. FM) and onomatopoeic name in parenthesis (e.g. Growl). FM = Frequency modulated, AM = Amplitude modulated, AMFM = Frequency and amplitude modulated, CW = Constant wave.
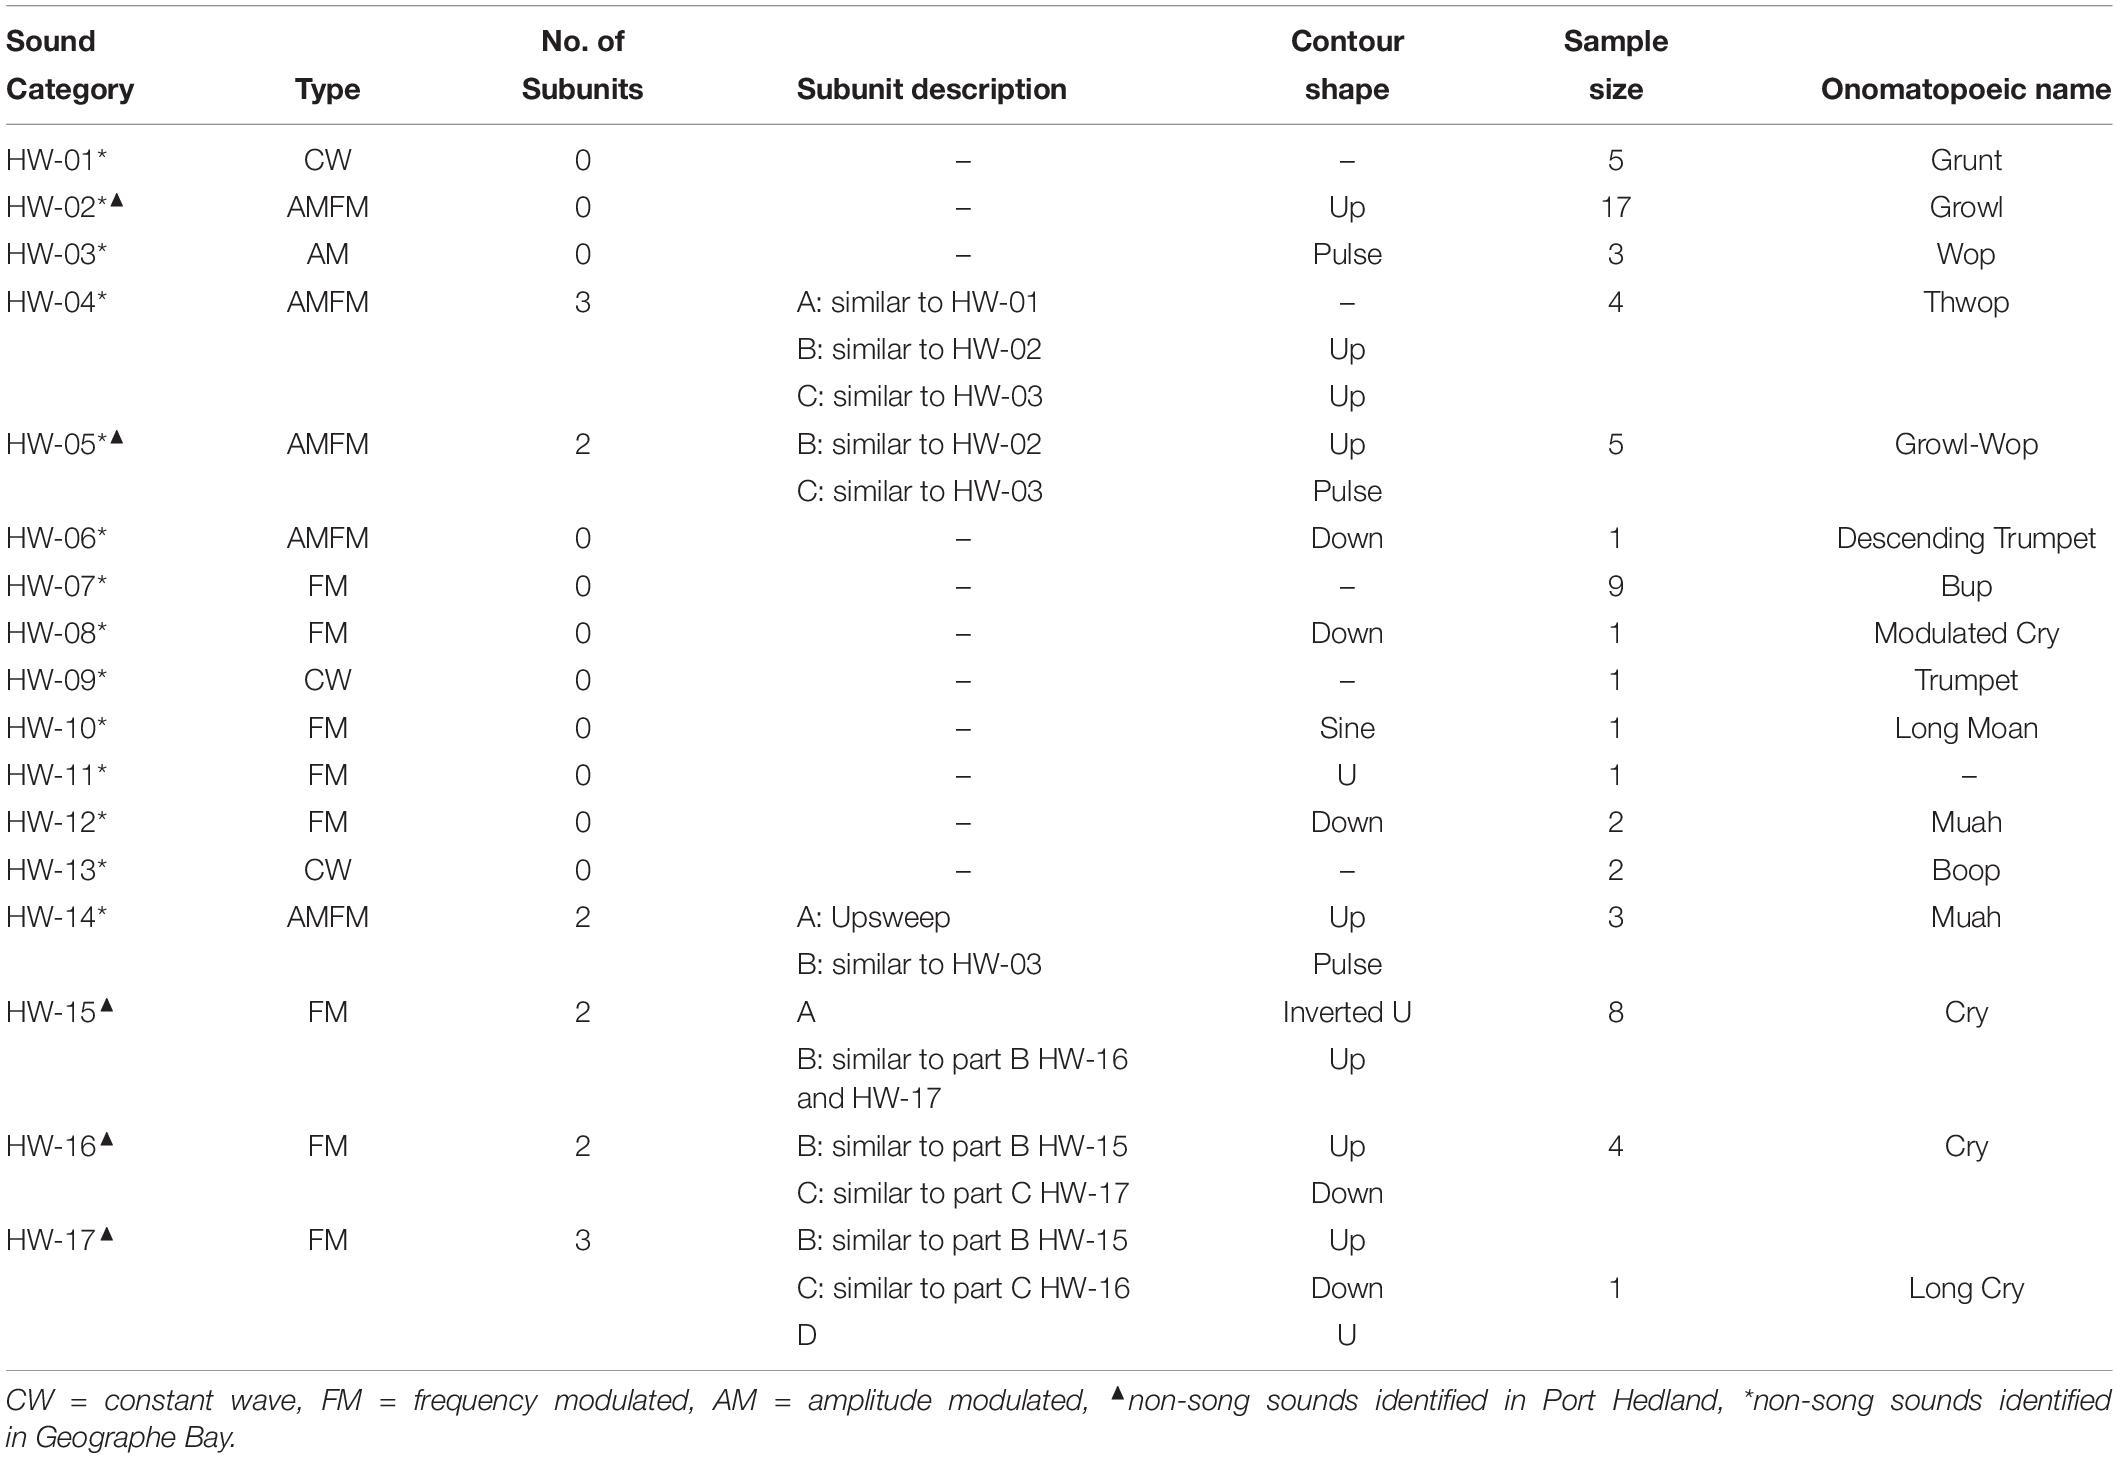
Table 3. Summary of spectral features and onomatopoeic names for non-song sound types recorded in Geographe Bay and off Port Hedland.
Variation was observed in some sound types, particularly in HW-02, HW-05, and HW-07 (Figure 3). Even though these sound types showed greater variation in spectral features than did other sound types, variability was not enough to result in different groupings. Variability was greatest for HW-02, with changes in upsweep shape that, on one occasion, appeared as an “n” (Figure 3A). HW-05 had variable bandwidth with some sounds having much more energy at higher frequencies (see HW-05 variations in Figures 2E, 3B).
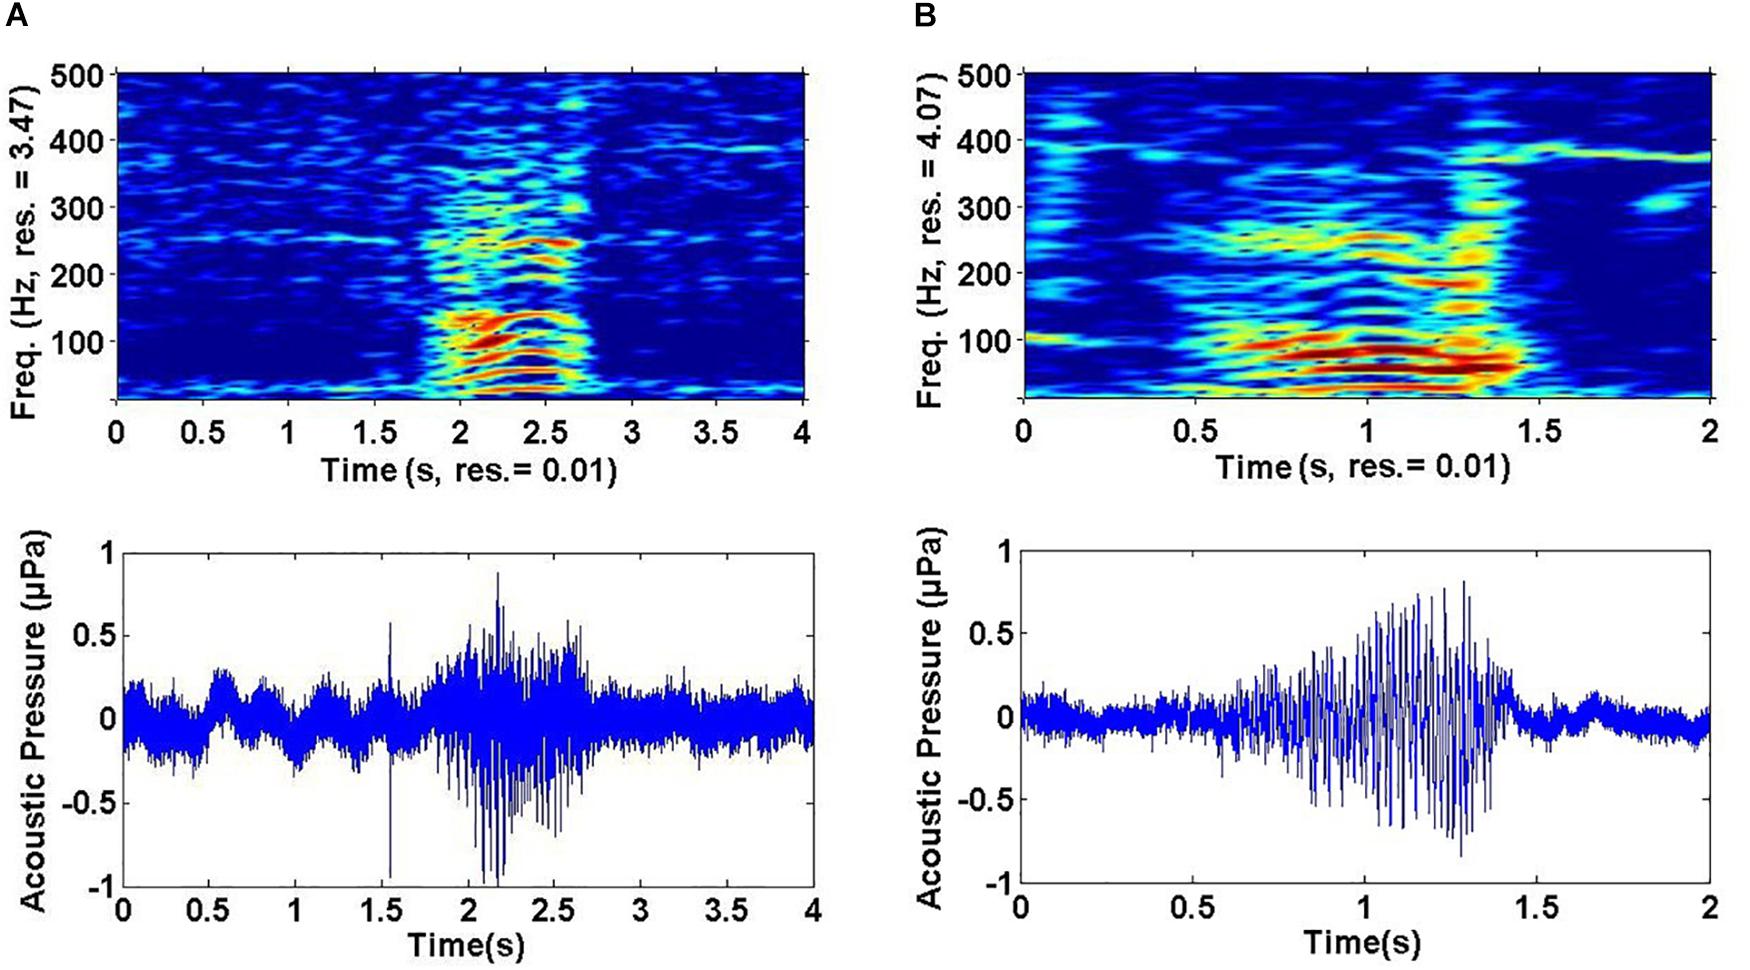
Figure 3. Example of spectrograms showing variability for non-song sounds: (A) HW-02 and (B) HW-05.
Two sound types were recorded in both areas (HW-02 and HW-05), 12 were exclusive to Geographe Bay (HW-01, HW-03, HW-04, and HW-06 to HW-14), and three were exclusive to Port Hedland (HW-15, HW-16, and HW-17). Only one sound type was identified as a unit used in song (HW-12). Of the 17 non-song sound types, 23.8% were HW-02 “Growl-Wop,” 13.4% were HW-07 “Bup,” and 11.9% were HW-15 “Cry,” with all other sound types having fewer than 10% of the total number of sounds discerned in recordings.
Non-song sound frequencies varied between 9 Hz and 6 kHz. The most common sound type (HW-02) had a mean peak frequency of 56 Hz, 3-dB bandwidth of 41 Hz and 10-dB bandwidth of 111 Hz (Table 4). Only two sound types (HW-15 and HW-16) had mean peak frequencies higher than 1 kHz and a 10-dB bandwidth over 100 Hz (Table 4). All non-song sound types had a mean duration of less than 4 s, with 11 having a mean under 1 s, and two over 2 s (Table 4). Some variability in spectrogram parameters was expected for each sound type. The largest variation was observed in the 3-dB bandwidth of all sounds. HW-15 and HW-16 also showed high variability in peak frequency and 10-dB bandwidth (Figure 4).
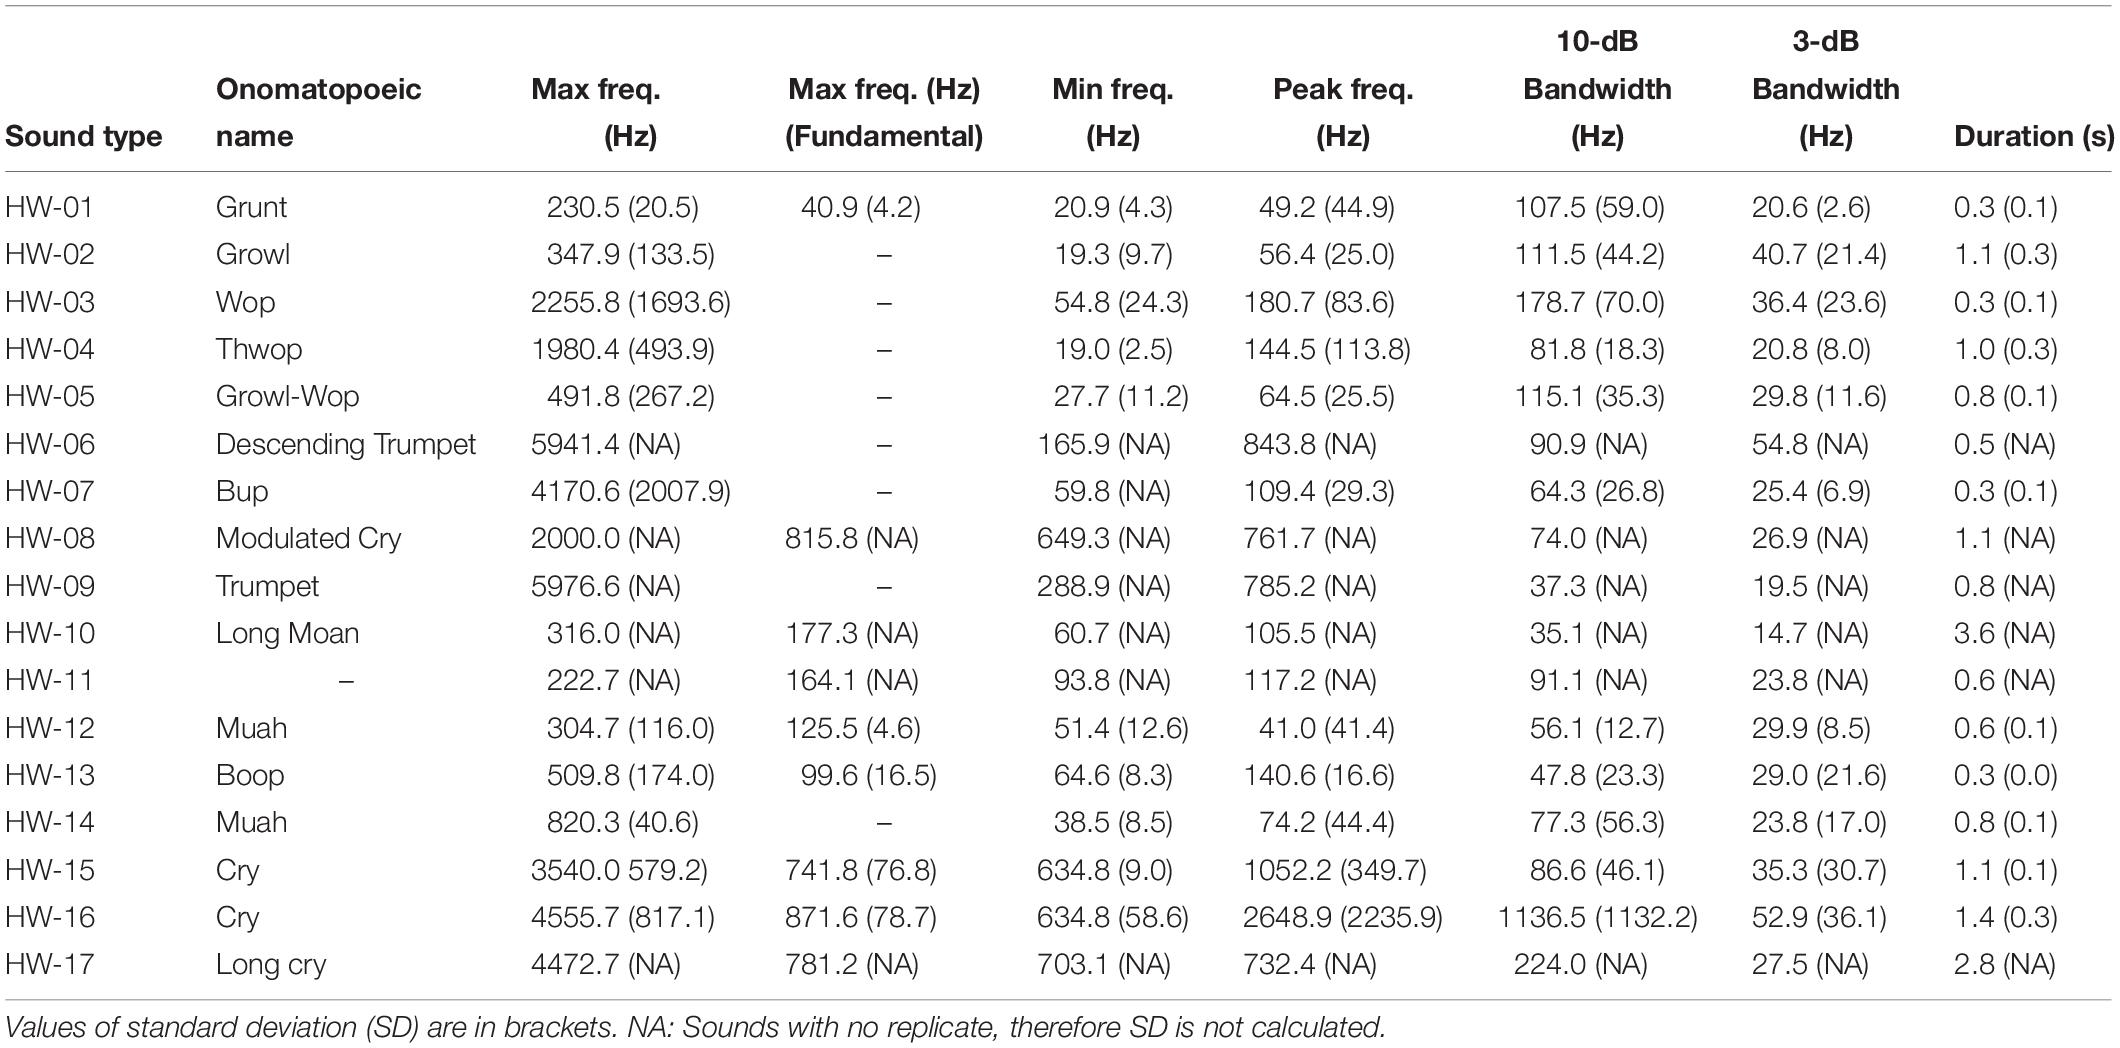
Table 4. Mean spectrogram parameters of non-song sounds recorded in Geographe Bay and Port Hedland.
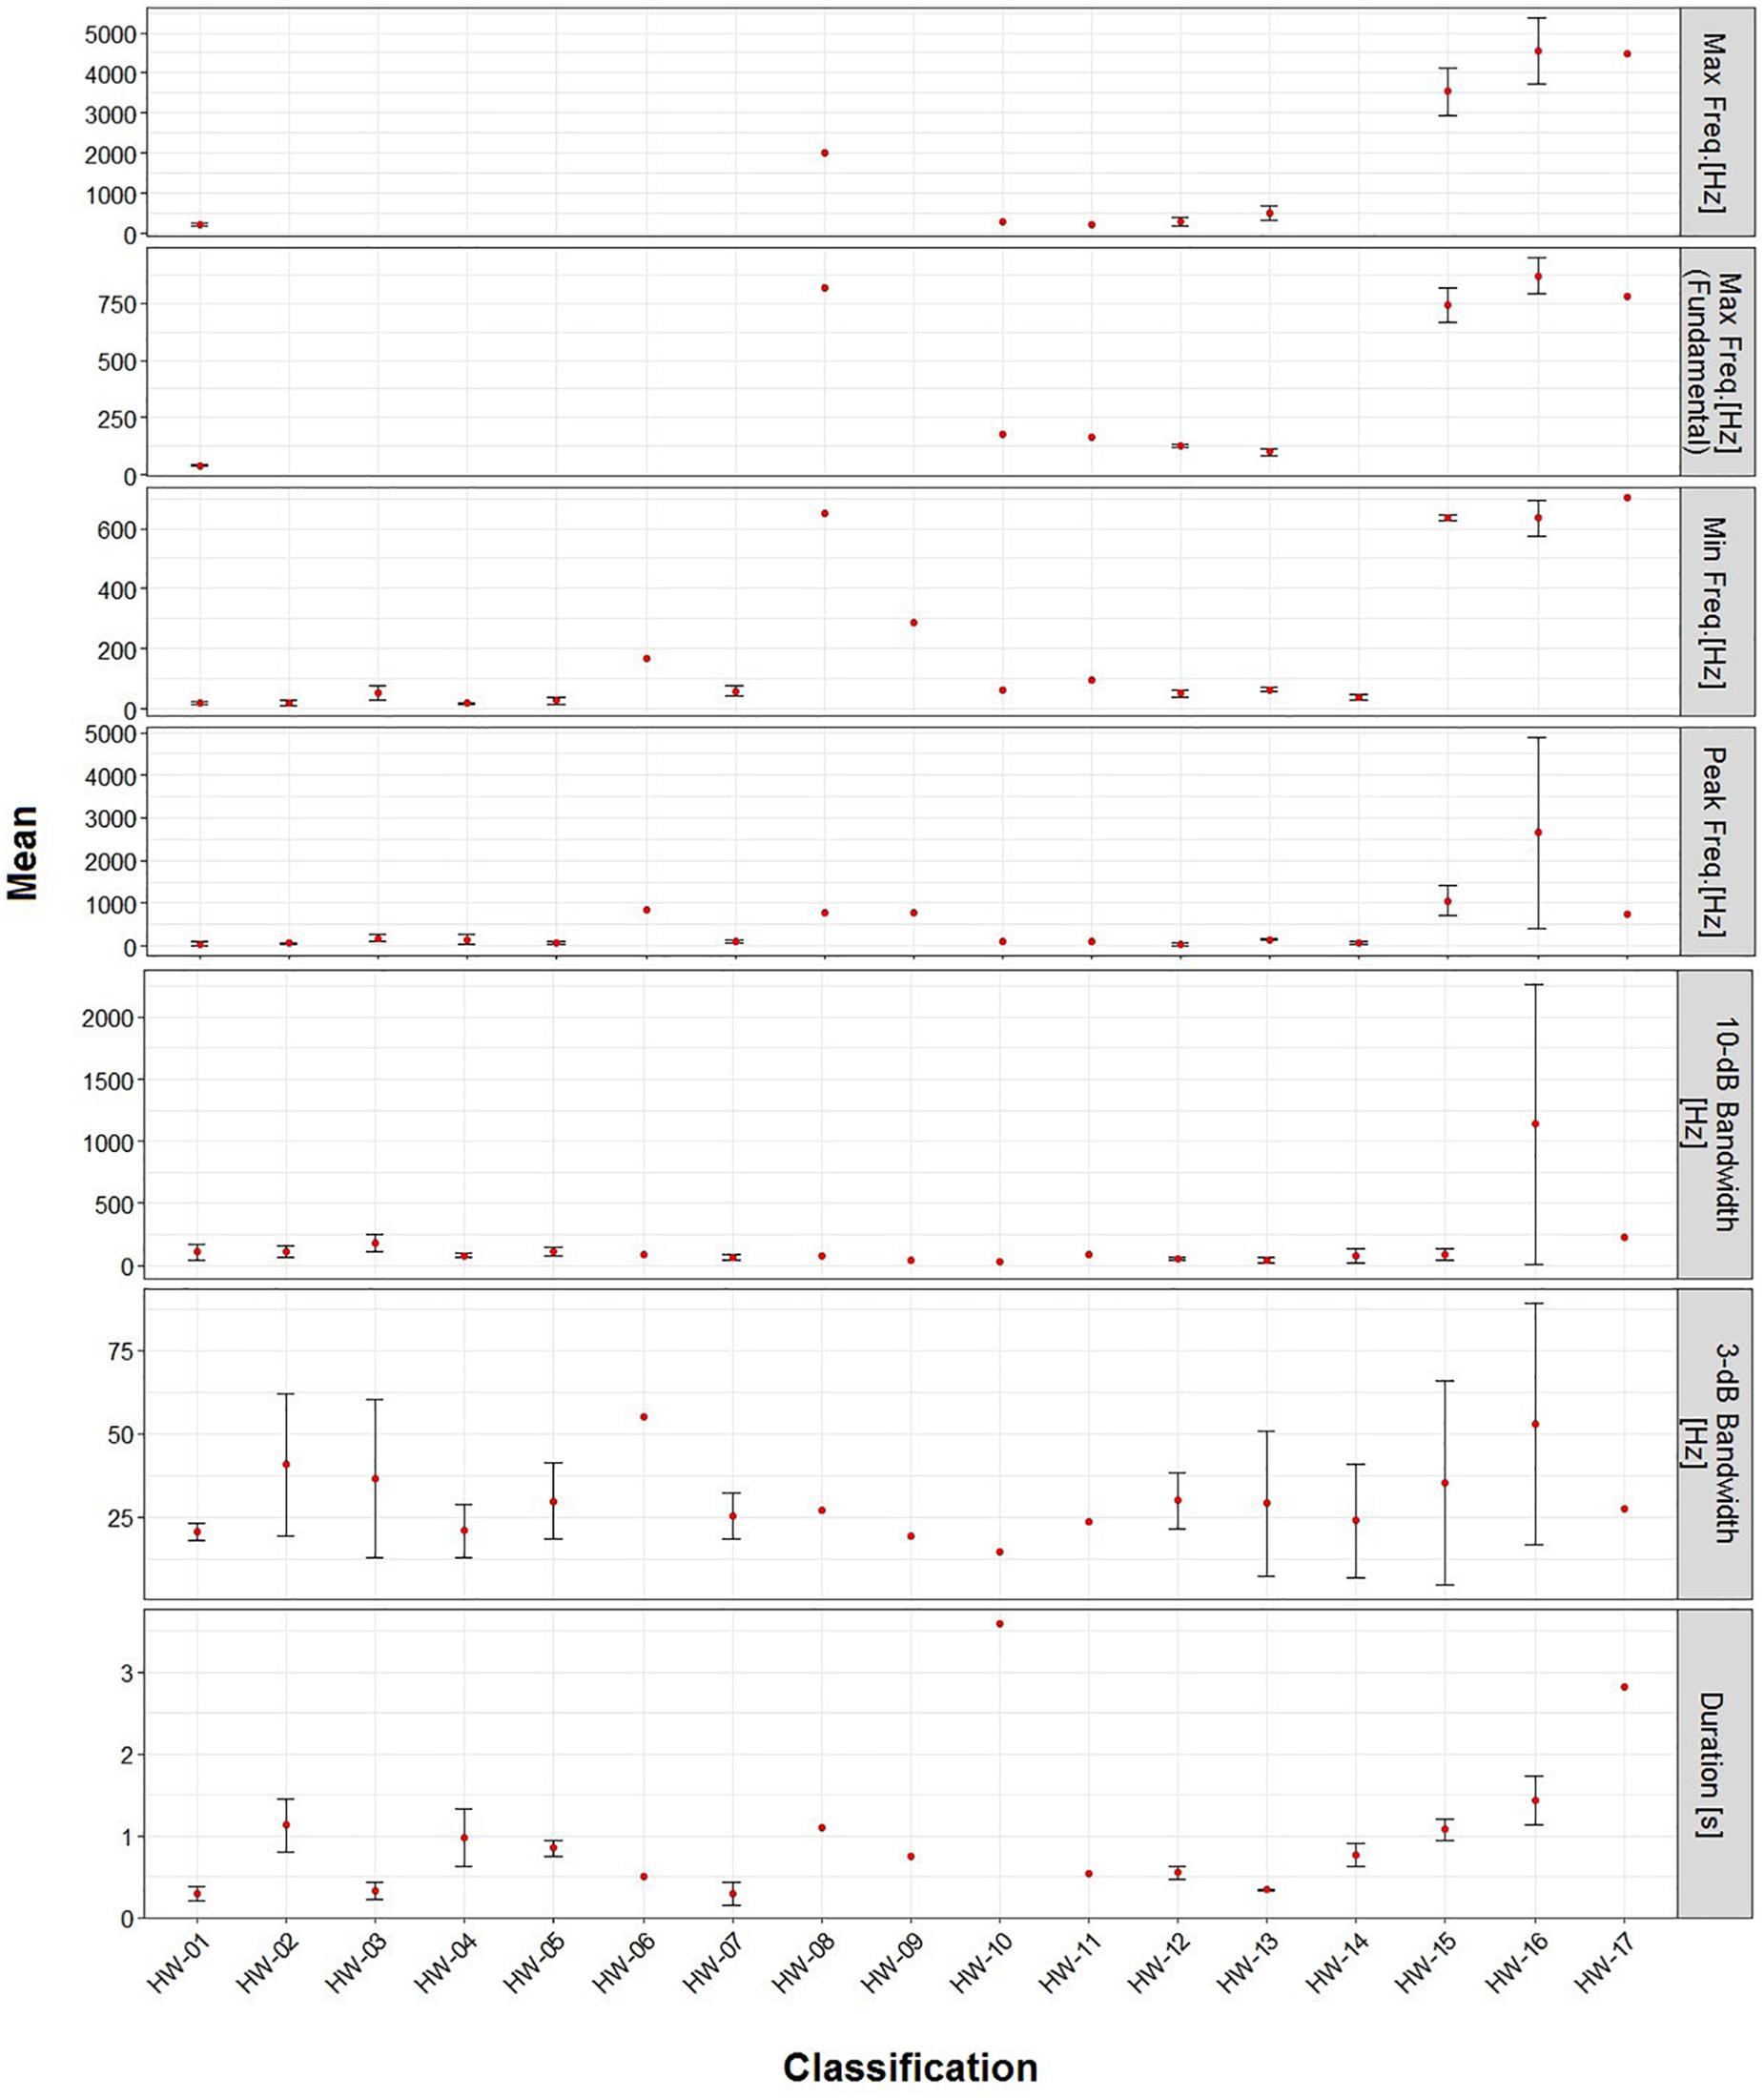
Figure 4. Mean (±SD) metrics for the spectrogram parameters of each sound type recorded in November 2011 and 2012 in Geographe Bay and between June and January 2012 off Port Hedland, Western Australia.
Discussion
While humpback whales are recognized for the complexity of their songs, the results of this study suggest that non-song sounds are also highly variable in structure. This study showed that the non-song repertoire can be composed of a variety of sounds including CW, FM, and AMFM with frequencies ranging from 9 Hz to up to 6 kHz. This is similar to other studies that have reported non-song sound repertoires ranging in frequencies from 30 Hz to 2.5 kHz (Dunlop et al., 2007). In this study, it is likely that additional non-song sounds were present in the recordings, but not identified. In total, non-song sounds from Port Hedland were detected in 3 days over 6 months of data analyzed and in Geographe Bay in 5 over 20 days analyzed in 2011, and 17 out of 25 days in 2012. Thus, the variability in non-song sounds produced off Western Australia is likely to be even greater than that described here. This is particularly true for non-song sounds in recordings off Port Hedland, as song dominated the recordings during the peak period of migration and precluded discerning non-song sounds from song. It is important to clarify that this information should not be used to describe or compare vocal activity and acoustical ecology of the species between areas because of differences in habitat use, ecology and behavior in each site. In addition, the study design also differed and does not allow a direct comparison between areas.
Only one (7.7%) of the non-song sound types reported in this study was identified as a song unit in song of the same year (HW-12). In contrast, 23.2% of the non-song sounds identified from the population of whales that migrate along the east coast of Australia (Breeding Stock E) were considered to be similar to song units from the same or previous years (Rekdahl et al., 2013). However, one of the sounds reported here (HW-08) has characteristics similar to a “cry,” which is reported as a non-song sound used as a song unit by the population off the east coast of Australia (Rekdahl et al., 2013). Whether the other non-song sounds identified in this study have been used as part of song off Western Australia in previous years, or will be in future years, is yet to be established.
Many non-song sounds not used as song units have been reported as “stable.” This means that the same non-song sounds are produced over multiple years (Rekdahl et al., 2013). Examples of stable non-song sounds reported include “wops” and “thwops” in the humpback whale population off eastern Australia (Dunlop et al., 2008; Rekdahl et al., 2013), which are similar to HW-02 identified in this study. HW-02 was identified in 2011 and 2012 in Geographe Bay, which suggests that it is also stable in this population.
Complex sounds (those with multiple subunits) seem to be typical within the humpback whale repertoire (Cholewiak et al., 2013). The definition of subunits and units has been used in classification of humpback whale song and bird song analysis (Isaac and Marler, 1963; Payne and McVay, 1971), but less frequently in the classification of humpback whale non-song sounds (Winn et al., 1979). Here, the number of subunits in non-song sounds proved to be valuable for describing non-song sounds and allowed the separation of certain sound types (e.g., HW-15, HW-16 and HW-17).
Some of the identified sounds here appear similar to social sounds or feeding calls reported elsewhere. For instance, HW-15 is similar to a series of “cries” reported as feeding calls in Alaska (Cerchio and Dahlheim, 2001). In Alaska, the “cry” was observed as a train of units. Here we also found multiple cries one after the other. However, because it was observed only in one recording, it is not possible to establish if these sounds are vocalized as independent units or a train of sounds as observed in Alaska. The feeding “cry” in Alaska was described as formed by three sections: (i) a short upsweep or downsweep, (ii) followed by the main, unmodulated part, and (iii) a short trailing portion, usually a downsweep (Cerchio and Dahlheim, 2001). A similar composition was observed for the population off Western Australia and sounds had similar shapes at the beginning and end of contours to “cries” reported in Alaska. However, the cries here were classified based on the combination of parts (here described as subunits). Cries were classified into three groups: HW-15 formed by the short up or downsweep (subunit A) and the CW portion (subunit B), HW-16 composed of subunit B and a short downsweep (subunit C) and finally a longer cry (HW-17), formed by subunits B and C connected to an additional subunit (subunit D). Further divisions were made based on variation in the duration of “cries” (e.g., HW-17 was twice as long as other cry types). These differences indicate a variability in the spectral characteristics of “cries” as previously reported. However, the small sample size prohibited confirmation of whether each variation was produced consistently enough for them to be defined as separate non-song sound types; or whether variations simply reflected variability among individual whales producing the same sound type, as suggested in previous studies (Cerchio and Dahlheim, 2001).
One of the few studies on non-song sounds for humpback whales migrating along the coast of Western Australia deployed D-tags on mother-calf groups (Videsen et al., 2017). The study identified grunting sounds that are similar to HW-03 identified here. Sounds in group HW-03 were recorded in Geographe Bay, an area that, according to visual observations, has a significant number of mother-calf groups during the time of recordings. It is likely that these sounds are also vocalized by mother-calf groups. However, additional analyses that match visual and acoustical observations are needed to confirm this.
Many studies use onomatopoeic names to describe sounds. This method can be problematic for comparison because sounds may be assumed similar or different depending on the perception of the analyst (Dunlop et al., 2007; Erbe et al., 2017). Here, a comparison of spectrograms showed similarities among multiple sounds in different studies, some of which were given a different onomatopoeic name (Table 5). The use of spectral features to qualitatively describe sounds is suggested as a potentially more robust approach to overcome this problem. However, it is important to consider differences in recording and analytical settings (e.g., FFT, overlap, etc.) to plot the spectrograms as these can also influence comparisons (Erbe et al., 2017). For example, in this study, HW-07 was suspected to be similar to a variety of different sounds reported in previous studies off Hawaii and eastern Australia. However, because of the variability within the group, it was not possible to confirm whether these sounds were the same as those reported in other studies using visual comparisons due to differences in spectrogram settings.
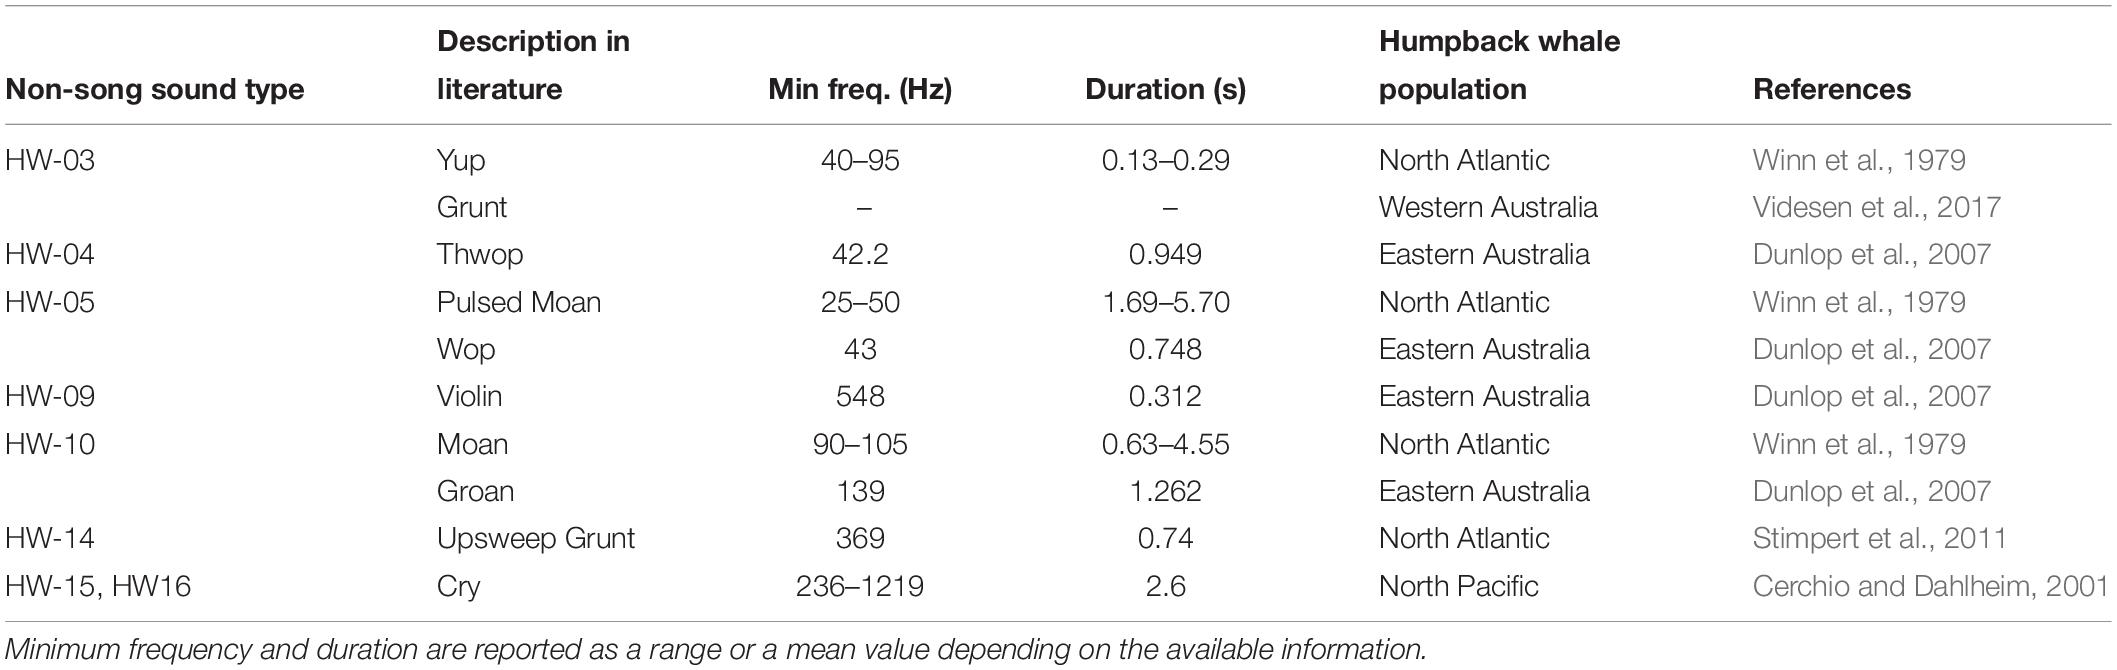
Table 5. Summary of similarities in non-song sound types identified for humpback whales off Western Australia and those reported elsewhere based on spectral feature comparison.
A qualitative analysis of spectral features of non-song sounds may have some limitations, particularly when there is high variability in sound types. Even when spectral features are used to describe sounds, there are some variations that occur as a result of the analyst’s visual perception of spectral features. For example, in this study both analysts agreed with spectral descriptions for almost all sounds, but there was a discussion on whether to divide some sounds classified in group HW-02. While a larger sample size would likely dissipate much of the uncertainty, classification and similarity analyses of quantitative metrics in spectral features are helpful in confirming groupings. Some of the analytical approaches that have been used include Random Forests (Risch et al., 2012; Rekdahl et al., 2013; Stowell and Plumbley, 2014), Principal Component Analysis (Dunlop et al., 2007) or machine-learning techniques (Halkias et al., 2013) for a variety of animal vocal repertoires from birds, bats, and cetaceans. The use of these methods requires a sufficiently large sample size for reliable results (Morgan et al., 2003). For instance, many studies have used classification methods with over 200 sounds, with all sound types recorded more than once (e.g., Cerchio and Dahlheim, 2001; Dunlop et al., 2008; Halkias et al., 2013; Rekdahl et al., 2013). In this study, the overall sample size was less than 70, and six of the sound types were recorded only once. The effectiveness of grouping of sound types using qualitative spectral features is supported by similarities reported between aural and visual inspection of spectrograms and quantitative classification in other studies (Dunlop et al., 2007; Rekdahl et al., 2013). However, for highly variable sound types (HW-02 and HW-15), quantitative classification using a large sample size is suggested to improve their classification.
In this study, there was some regional spatial variation in detections of non-song sounds, in that they were only identified in the inshore recordings off Port Hedland. Humpback whales have habitat preferences related to social organization, where mothers and calves show strong preference to shallower inshore waters (Ersts and Rosenbaun, 2003; Irvine and Salgado Kent, 2017). It is not possible to identify whether the non-song sounds recorded in inshore waters were produced by mother-calf pairs, but those recorded in November (e.g., HW-15, HW-16) correspond with the end of the southerly migration of mother-calf pairs from breeding grounds (Dawbin, 1966; Craig et al., 2003). Considering that humpback whales have a structured migration in which females in early stages of lactation and mothers with newborns are the last to depart from breeding grounds (Dawbin, 1997; Craig et al., 2003), it is likely that the sounds recorded in November off Port Hedland were vocalized by a mother-calf group.
Finally, this paper has improved current knowledge on the vocal repertoire of humpback whales, which improves the basis for PAM in behavioral and ecological studies. Attributes, such as differences in timing between the presence of song and non-song off Port Hedland observed here, extend the use of PAM to cohort-specific studies. However, the use of sound types in PAM must consider its potential limitations, such as difficulties in discerning sounds during peak periods for highly vociferous species such as humpback whales. Thus, consideration of the range of PAM approaches available is suggested, with selection of an optimal approach based on the objectives of a study and how the focal species behaves in the habitat under study.
Data Availability Statement
The datasets generated for this study are available on request to the corresponding author.
Author Contributions
ARS, CSK, MP, and CE conceived and designed the study. CSK and ARS collected the data for GB and MP for Port Hedland. ARS and CE analyzed the data with contributions from CSK. ARS wrote the manuscript with contributions to drafting and critical review from CE, CSK, and MP.
Conflict of Interest
The authors declare that the research was conducted in the absence of any commercial or financial relationships that could be construed as a potential conflict of interest.
Funding
The data collection in Port Hedland was funded by BHP, as part of their passive acoustics monitoring program. The data collection in Geographe Bay was funded by Australian Geographic for the 2012 season. BHP or Australian Geographic did not have any influence in the survey design or data analysis of this research.
Acknowledgments
We would like to thank Dr. Alec Duncan and Malcolm Perry from the Centre for Marine Science and Technology for the technical support and advice. We also thank Dr. Melinda Rekdahl from Wildlife Conservation Society (WCS), Dr. Ellen Garland from University of St Andrews and Elisa Girola from the Cetacean Ecology Acoustics Laboratory (CEAL) at the University of Queensland for their advice. We would also like to acknowledge Australian Geographic for funding the research in Geographe Bay and BHP for funding the research in Port Hedland through their Minerals Australia Social Investment Program – Environment Portfolio. ARS received a research grant from Holsworth Wildlife Research Endowment – Equity Trustees Charitable Foundation and the Ecological Society of Australia.
References
Au, W. W. L., Pack, A. A., Lammers, M. O., Herman, L. M., Deakos, M. H., and Andrews, K. (2006). Acoustic properties of humpback whale songs. J. Acoust. Soc. Am. 120, 1103–1110. doi: 10.1121/1.2211547
Cerchio, S., and Dahlheim, M. (2001). Variation in feeding vocalizations of humpback whales Megaptera novaeangliae from southeast Alaska. Bioacoustics 11, 277–295. doi: 10.1080/09524622.2001.9753468
Cholewiak, D. M., Sousa-Lima, R. S., and Cerchio, S. (2013). Humpback whale song hierarchical structure: historical context and discussion of current classification issues. Mar. Mamm. Sci. 29, E312–E332. doi: 10.1111/mms.12005
Clark, C. W., and Clapham, P. J. (2004). Acoustic monitoring on a humpback whale (Megaptera novaeangliae) feeding ground shows continual singing into late spring. Proc. R. Soc. B Biol. Sci. 271, 1051–1057. doi: 10.1098/rspb.2004.2699
Craig, A., Herman, L., Gabriele, C., and Pack, A. (2003). Migratory timing of humpback whales (Megaptera novaeangliae) in the Central North Pacific varies with age, sex and reproductive status. Behaviour. 140, 981–1001. doi: 10.1163/156853903322589605
Dawbin, W. H. (1966). “The seasonal migratory cycle of humpback whales,” in Whales, Dolphins, and Porpoises, ed. K. Norris (Berkeley, CA: University of California Press).
Dawbin, W. H. (1997). Temporal segregation of humpback whales during migration in southern hemisphere waters. Mem. Queensl. Mus. 42, 105–138.
Dunlop, R. A., Cato, D. H., and Noad, M. J. (2008). Non-song acoustic communication in migrating humpback whales (Megaptera novaeangliae). Mar. Mamm. Sci. 24, 613–629. doi: 10.1111/j.1748-7692.2008.00208.x
Dunlop, R. A., Noad, M. J., Cato, D. H., and Stokes, D. (2007). The social vocalization repertoire of east Australian migrating humpback whales (Megaptera novaeangliae). J. Acoust. Soc. Am. 122, 2893–2905. doi: 10.1121/1.2783115
Dunlop, R. A., Noad, M. J., Cato, D. H., and Stokes, D. (2013). Source levels of social sounds in migrating humpback whales (Megaptera novaeangliae). J. Acoust. Soc. Am. 134, 706–714. doi: 10.1121/1.4807828
Edds-Walton, P. L. (1997). Acoustic communication signals of mysticete whales. Bioacoustics 8, 47–60. doi: 10.1080/09524622.1997.9753353
Erbe, C., Dunlop, R., Jenner, K. C. S., Jenner, M., McCauley, R., Parnum, I., et al. (2017). Review of underwater and in-air sounds emitted by Australian and Antarctic marine mammals. Acoust. Austr. 45, 179–241. doi: 10.1007/s40857-017-0101-z
Ersts, P., and Rosenbaun, H. C. (2003). Habitat preference reflects social organization of humpback whales (Megaptera novaeangliae) on a wintering ground. J. Zoolol. 260, 337–345. doi: 10.1017/S0952836903003807
Frankel, A. S., Clark, C., and Gabriele, C. (1995). Spatial-distribution, habitat utilization, and social interactions of humpback whales, Megaptera novaeangliae, off Hawaii, determined using acoustic and visual techniques. Can. J. Zool. 73, 1134–1146. doi: 10.1139/z95-135
Garland, E. C., Goldizen, A. W., Rekdahl, M. L., Constantine, R., Garrigue, C., Hauser, N. D., et al. (2011). Dynamic horizontal cultural transmission of humpback whale song at the ocean basin scale. Curr. Biol. 21, 687–691. doi: 10.1016/j.cub.2011.03.019
Gavrilov, A. G., and Parsons, M. J. G. (2014). A Matlab tool for the characterisation of underwater sound (CHORUS). Acoust. Austr. 42, 190–196.
Guidino, C., Lllapapasca, M. A., Silva, S., Alcorta, B., and Pacheco, A. S. (2014). Patterns of spatial and temporal distribution of humpback whales at the southern limit of the southeast pacific breeding area. PLoS One 9:e112627. doi: 10.1371/journal.pone.0112627
Halkias, X. C., Paris, S., and Glotin, H. (2013). Classification of mysticete sounds using machine learning techniques. J. Acoust. Soc. Am. 134, 3496–3505. doi: 10.1121/1.4821203
Irvine, L., and Salgado Kent, C. (2017). The Distribution and Relative Abundance of Humpback Whale (Megaptera novaeangliae) Calves Within the Ningaloo Marine Park, Western Australia Between June and AUGUST 2016. Report to the Department of Parks and Wildlife, Western Australia. (Exmouth: Curtin University), 49.
Isaac, D., and Marler, P. (1963). Ordering of sequences of singing behavior of Mistle thrushes in relationship to timing. Anim. Behav. 11, 179–188. doi: 10.1016/0003-3472(63)90027-7
McCauley, R. D., Thomas, F., Parsons, M. J. G., Erbe, C., Cato, D. H., Duncan, A. J., et al. (2017). Developing an underwater sound recorder: the long and short (time) of it. Acoust. Austr. 45, 301–311. doi: 10.1007/s40857-017-0113-8
Morgan, J., Daugherty, R., Hilchie, A., and Carey, B. (2003). Sample size and modelling accuracy of decision tree based data mining tools. Proceedings of the Allied Academies International Conference. Acad. Inf. Manag. Sci. 7:41.
Oña, J., Garland, E. C., and Denkinger, J. (2016). Southeastern Pacific humpback whales (Megaptera novaeangliae) and their breeding grounds: distribution and habitat preference of singers and social groups off the coast of Ecuador. Mar. Mamm. Sci. 33, 219–235. doi: 10.1111/mms.12365
Pace, F., Benard, F., Glotin, H., Adam, O., and White, P. (2010). Subunit definition and analysis for humpback whale call classification. Appl. Acoust. 71, 1107–1112. doi: 10.1016/j.apacoust.2010.05.016
Payne, R. (1978). “Behavior and vocalizations of humpback whales (Megaptera sp.),” in Report on a Workshop on Problems Related to Humpback Whales (Megaptera novaeangliae) in Hawaii, eds K. S. Norris and R. R. Reeves (Washington, D.C: U.S. Marine Mammal Commission), 56–78.
Payne, R. S., and McVay, S. (1971). Songs of humpback whales. Science 173, 585–597. doi: 10.1126/science.173.3997.585
Rasmussen, K., Panama, D. C., Calambokidis, J., and Steiger, G. H. (2012). Distribution and migratory destinations of humpback whales off the Pacific coast of Central America during the boreal winters of 1996 – 2003. Mar. Mamm. Sci. 28, E267–E279. doi: 10.1111/j.1748-7692.2011.00529.x
Recalde-Salas, A. P. (2020). Variability in Baleen Whale Acoustical Ecology: Implications for Optimal Monitoring Using Passive Acoustics. Ph.D. thesis, Curtin University, Bentley, WA.
Rekdahl, M. L., Dunlop, R. A., Noad, M. J., and Goldizen, A. W. (2013). Temporal stability and change in the social call repertoire of migrating humpback whales. J. Acoust. Soc. Am. 133, 1785–1795. doi: 10.1121/1.4789941
Richardson, W. J., Greene, C. R. Jr., Malme, C. I., Thomson, D. H., and Greene, C. R. Jr. (1995). “Marine mammal sounds,” in Marine Mammals and Noise, eds W. J. Richardson, C. I. Malme, and D. H. Thomson (Cambridge, MA: Academic Press), 159–204. doi: 10.1016/b978-012588440-2/50007-x
Risch, D., Corkeron, P. J., Ellison, W. T., and Van Parijs, S. M. (2012). Changes in humpback whale song occurrence in response to an acoustic source 200 km Away. PLoS One 7:e29741. doi: 10.1371/journal.pone.0029741
Salgado Kent, C., Jenner, C., Jenner, M., Bouchet, P., and Rexstad, E. (2012). Southern Hemisphere breeding stock “D” humpback whale population estimates from North West Cape, Western Australia. J. Cetacean Res. Manag. 12, 29–38.
Silber, G. K. (1986). The relationship of social vocalizations to surface behavior and aggression in the Hawaiian humpback whale (Megaptera novaeangliae). Can. J. Zool. 64, 2075–2080. doi: 10.1139/z86-316
Smultea, M. A. (1994). Segregation by humpback whale (Megaptera novaeangliae) cows with a calf in coastal habitat near the island of Hawaii. Can. J. Zool. 72, 805–811. doi: 10.1139/z94-109
Stimpert, A. K., Au, W., Parks, S., Hurst, T., and Wiley, D. (2011). Common humpback whale (Megaptera novaeangliae) sound types for passive acoustic monitoring. J. Acoust. Soc. Am. 129, 476–482. doi: 10.1121/1.3504708
Stowell, D., and Plumbley, M. D. (2014). Automatic large-scale classification of bird sounds is strongly improved by unsupervised feature learning. PeerJ. 2:e488. doi: 10.7717/peerj.488
Videsen, S. K. A., Bejder, L., Johnson, M., and Madsen, P. T. (2017). High suckling rates and acoustic crypsis of humpback whale neonates maximise potential for mother–calf energy transfer. Funct. Ecol. 31, 1561–1573. doi: 10.1111/1365-2435.12871
Western Australia Planning Commission Department of Planning (2011). Regional HotSpots Land Supply Update. Perth: Western Australia Planning Commission.
Winn, H. E., Beamish, P., and Perkins, P. J. (1979). Sounds of two entrapped humpback whales (Megaptera novaeangliae) in Newfoundland. Mar. Biol. 55, 151–155. doi: 10.1007/bf00397311
Keywords: humpback whale, vocalizations, non-song sounds, social sounds, communication, Western Australia
Citation: Recalde-Salas A, Erbe C, Salgado Kent C and Parsons M (2020) Non-song Vocalizations of Humpback Whales in Western Australia. Front. Mar. Sci. 7:141. doi: 10.3389/fmars.2020.00141
Received: 05 September 2019; Accepted: 24 February 2020;
Published: 17 April 2020.
Edited by:
Randall William Davis, Texas A&M University at Galveston, United StatesReviewed by:
Gail Schofield, Queen Mary University of London, United KingdomNuno Queiroz, University of Porto, Portugal
Copyright © 2020 Recalde-Salas, Erbe, Salgado Kent and Parsons. This is an open-access article distributed under the terms of the Creative Commons Attribution License (CC BY). The use, distribution or reproduction in other forums is permitted, provided the original author(s) and the copyright owner(s) are credited and that the original publication in this journal is cited, in accordance with accepted academic practice. No use, distribution or reproduction is permitted which does not comply with these terms.
*Correspondence: Angela Recalde-Salas, angela.recaldesalas@uqconnect.edu.au