Global Patterns in Marine Sediment Carbon Stocks
 Trisha B. Atwood
 Andrew Witt
 Juan Mayorga
 Edd Hammill
 Enric Sala
- 1Department of Watershed Sciences and Ecology Center, Utah State University, Logan, UT, United States
- 2National Geographic Society, Washington, DC, United States
- 3Bren School of Environmental Science & Management and Marine Science Institute, University of California, Santa Barbara, Santa Barbara, CA, United States
To develop more accurate global carbon (C) budgets and to better inform management of human activities in the ocean, we need high-resolution estimates of marine C stocks. Here we quantify global marine sedimentary C stocks at a 1-km resolution, and find that marine sediments store 2322 (2239–2391) Pg C in the top 1 m (nearly twice that of terrestrial soils). Sediments in abyss/basin zones account for 79% of the global marine sediment C stock, and 49% of that stock is within the 200-mile Exclusive Economic Zones of countries. Currently, only ∼2% of sediment C stocks are located in highly to fully protected areas that prevent the disturbance of the seafloor. Our results show that marine sediments represent a large and globally important C sink. However, the lack of protection for marine C stocks makes them highly vulnerable to human disturbances that can lead to their remineralization to CO2, further aggravating climate change impacts.
Introduction
Marine sediments are one of the most expansive and critical carbon (C) reservoirs on the planet; hence, they are key for regulating climate change. Although less than 1% of the gross production on Earth ends up on the seafloor (Hedges and Keil, 1995; Burdige, 2007), organic C buried in the sediments of the ocean can remain there for 1000s to millions of years if left undisturbed (McLeod et al., 2011; Estes et al., 2019). However, advances in human exploitation of the ocean have made the once semi-permanent C stocks in marine sediments vulnerable to remineralization, a process that will likely exacerbate future climate change. To help develop more refined C budgets and to better inform management of human activities on the seafloor, we quantified the distribution of organic C stocks in global marine sediments and identified critical C storage hotspots.
Large-scale degradation of marine habitats has sparked concern that without protection, marine sediments may become a large source of carbon dioxide (CO2) (Pendleton et al., 2012; Lovelock et al., 2017). When disturbed, marine sediments can become mixed and resuspended, exposing them to oxygen and heterotrophic metabolism that can remineralize the C to CO2 (Bianchi et al., 2016). Climate change, coastal development, and advancements in technology that have expanded fishing (e.g., deep-sea bottom-trawling), mining, and oil and gas exploration and drilling in the ocean (Davies et al., 2007; Cordes et al., 2016), pose a potential threat to marine C stocks that could lead to their significant loss and remineralization. To help mitigate abatable threats to C, many have argued that the protection of C hotspots should be considered when developing spatial management plans, including Marine Protected Areas (MPAs) (Howard et al., 2017; Roberts et al., 2017).
Despite recent advancements in our understanding of the distribution of C stocks in vegetated coastal ecosystems such as mangroves (Atwood et al., 2017; Hamilton and Friess, 2018; Sanderman et al., 2018), seagrasses (Kennedy et al., 2010; Fourqurean et al., 2012), and salt marshes (Macreadie et al., 2017; Osland et al., 2018), as well as the carbon content in global surface (<5 cm) marine sediments (Seiter et al., 2004; Lee et al., 2019) we still lack robust, spatially explicit estimates of global marine sediment C stocks. Without this knowledge, the protection of marine habitats for their climate mitigation potential will likely be overlooked in ocean conservation efforts. Furthermore, seminal reports such as those by the International Panel on Climate Change (IPCC, 2013), which help guide societies response to climate change, are still using non-spatially explicit estimates of global marine sediment C stocks that are calculated by multiplying the average C density of marine sediments by their global extent (Emerson and Hedges, 1988). Such an approach limits our ability to understand and modify biogeochemical processes and the human driving forces that influence local and global marine sediment C inventories.
Fortunately, the collection and dissemination of the chemical compositions of 10s of 1000s of marine sediment cores through programs like the Ocean Drilling Program have now made it possible to map global sediment C stocks at a high spatial resolution. Here, we used C data from 11,578 sediment cores collected from the global ocean (Figure 1) to model and map the distribution of marine sediment organic C stocks down to a 1 m depth at a 1-km2 resolution. In addition to our fine-scale C estimates, we also quantified the amount of C stored within 200-mile Exclusive Economic Zones (EEZs), across oceanic provinces (continental shelf, continental slope, abyssal/basin plains, hadal zone, and subtidal coastal zones not included in the continental shelf), and within current MPAs.
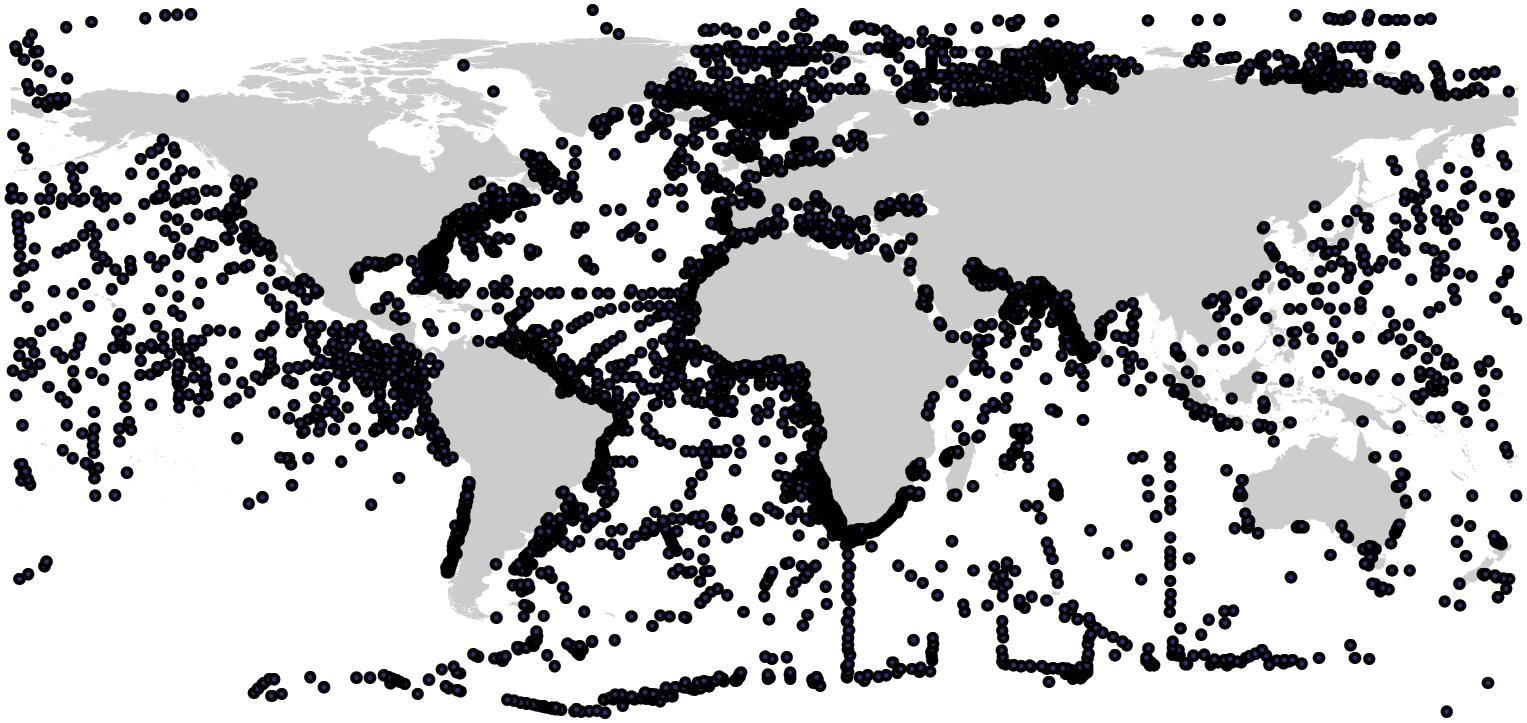
Figure 1. Sediment core locations. Black dots represent the locations where sediment cores for marine sedimentary carbon were collected.
Materials and Methods
C Mapping
We used Google Scholar, Web of Science, Pangea, personal datasets, and published reports to generate the most extensive dataset to date on ocean sediment C stocks. Studies included contained latitude and longitude of the sample location, percent organic C content of the sediment, loss on ignition (LOI) or percent organic matter (OM), and maximum core depth. This search resulted in C data for 15,004 cores. However, 3,426 cores were removed from the data set because they occurred in supratidal sites that lacked predictor variables for our Random Forest model (see below). In some cases, the original data was presented as an average across multiple sites; in these cases, GPS coordinates of the middle point were used. In cases where a single GPS point was provided for multiple cores, we jittered the longitude of each core in a random direction by 0.001 m. This offset allowed us to make each C sample spatially explicit. Studies reporting LOI were converted to percent C using Eq. 1 for cores collected from salt marsh (Howard et al., 2014) and Eq. 2 for cores collected from seagrass (Fourqurean et al., 2012; Howard et al., 2014).
We standardized soil C stocks down to 1 m in the sediment. This standardization allowed for direct comparisons with terrestrial soils (Scharlemann et al., 2014; Köchy et al., 2015), and allows for comparisons across marine systems as 1 m is commonly used in marine sediment C studies, especially studies in vegetated coastal ecosystems (Fourqurean et al., 2012; Duarte et al., 2013; Atwood et al., 2017; Macreadie et al., 2017). Additionally, studies have suggested that the top 1 m of sediment is the most sensitive to disturbances (Pendleton et al., 2012; Atwood et al., 2017). Studies containing depth profiles greater than (i.e., reported composite stocks for depths greater than 1 m) or less than 1 m were standardized to 1 m by taking the average C stock per centimeter and multiplying it by 100. For studies that did not provide a direct measure of C stock, we calculated it using Eq. 3. C stocks are generally reported in Mg ha–1, however, we converted all stocks to Mg km–2 for modeling and mapping. We used the pedotransfer function in Eq. 4 (R2 = 0.65, n = 6,172; Figure 2), to estimate dry bulk density in studies that did not report one.
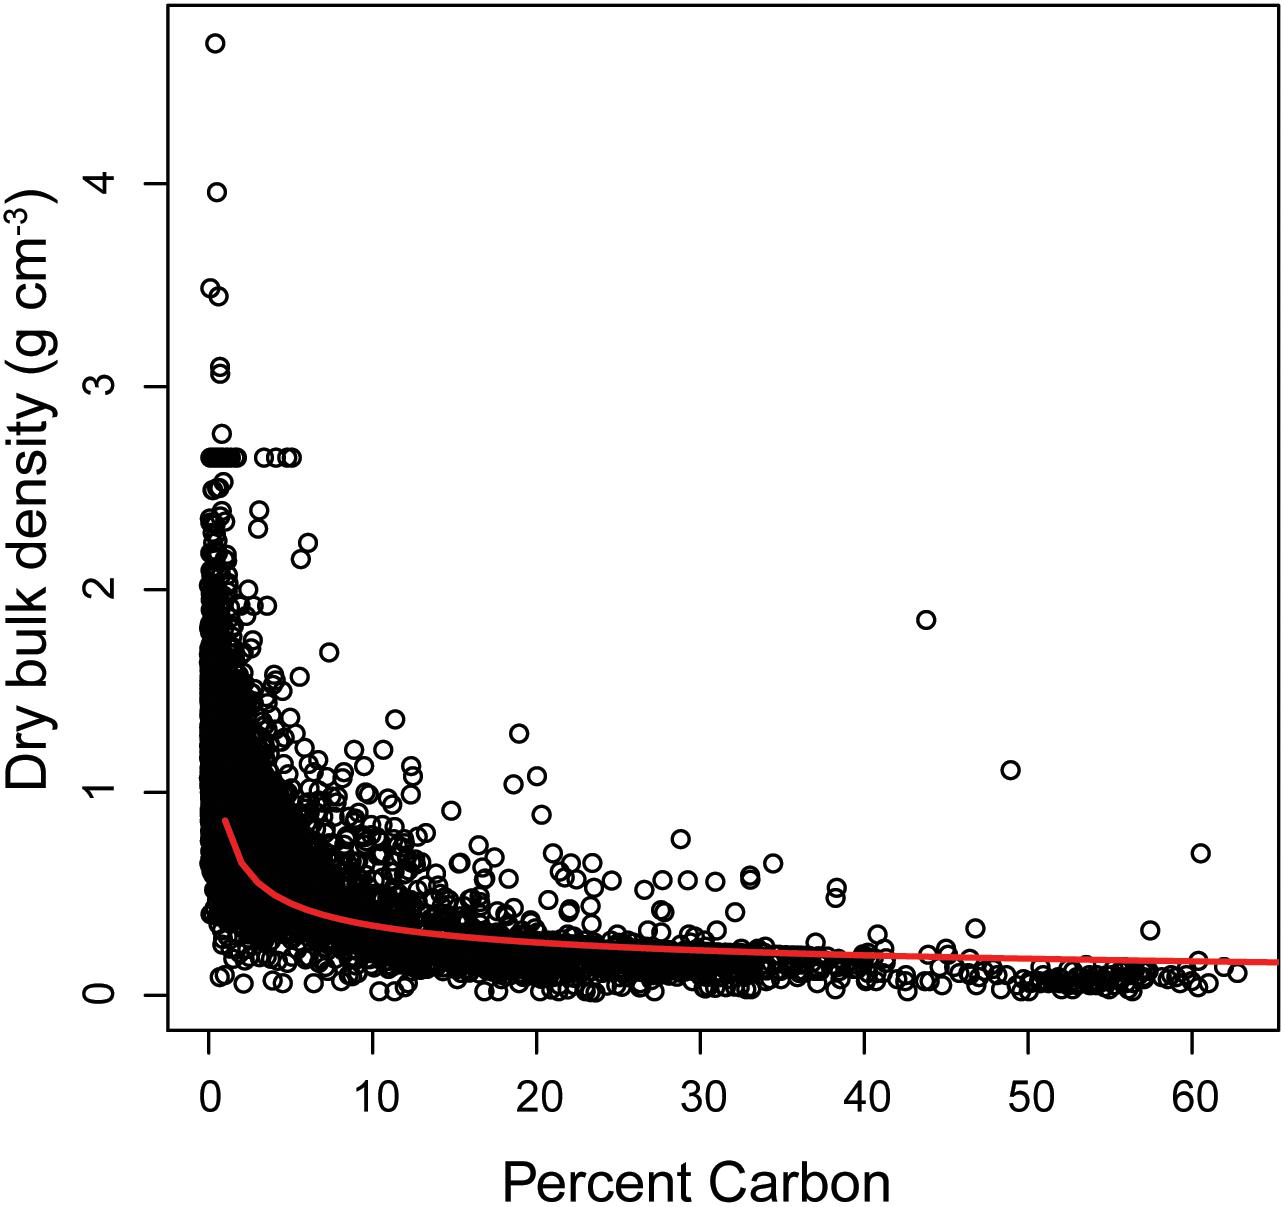
Figure 2. Pedotransfer function to estimate dry bulk density based on carbon content (R2 = 0.65, n = 6,172). Dry bulk density = 0.861 *%C–0.399.
Random Forest Regression models were implemented to predict global marine sediment C stocks between 80° N and ∼58° S. The southern bound of our data was limited by the spatial coverage of our predictor variables. Marine areas that lacked predictor variables, such as supratidal sites, were not included in the model. Random Forest Regressions were based on the compiled C data and 12 predictor variables; mean annual temperature of nearest land point, mean annual precipitation of nearest land point, maximum annual temperature of nearest land point, minimum annual temperature of nearest land point, ocean mean annual sea surface temperatures, ocean chlorophyll a concentration, elevation and bathymetry, sea surface height anomaly, sea surface salinity, distance from land, and distance from rivers (Table 1). These variables were chosen because they are known or hypothesized to influence the delivery and breakdown of C in marine systems. Carbon stocks down to 1 m in the sediment were modeled at a 1 km2 resolution using a bootstrapped (500 iterations) Random Forest regression from the ‘randomForest’ package in R 3.3.3. Model performance was assessed using cross-validation, where 30% of the data were withheld in each model refitting.
Table 1. Data sources for the predictor variables used in the Random Forest analysis.
Random Forest models are a popular and relatively new machine learning tool that can be used for digital soil mapping. Briefly, Random Forest models are an ensemble technique that allows for both classification and regression by developing multiple decision trees (i.e., bagging). Each tree is trained from a random bootstrap sample, where a subset of the data points are used to train (i.e., grow) the tree and the remaining data points are used to validate the tree. In our study, 30% of the data was used to validate our model. A more thorough explanation of Random Forest models can be found in Breiman (2001).
Random Forest models provide several advantages over other techniques: they allow for the modeling of high dimensional non-linear relationships, they require few defined parameters, they reduce experimental noise and enhance accuracy by aggregating predictions, and one can measure the variable importance of predictor variables (Breiman, 2001; Sanderman et al., 2018). Random Forest Models assess the importance of specific predictor variables by randomly permuting the out-of-bag observations and then passing the modified out-of-bag data down the tree to get new predictions. It then measures the importance of each variable by taking the difference between the misclassification rate for the modified and original out-of-bag data and dividing it by the standard error.
One disadvantage of using Random Forest models is that they do not estimate spatially-explicit uncertainty, rather they quantify model uncertainty as a whole. Previous investigations have demonstrated that sources of uncertainty in C stock are present across multiple scales in soil/sediment measurements. We therefore estimated error in C stocks at the core level using parametric bootstraps, and then propagated that error up to the pixel- and global-level. Parametric bootstrapping was done by comparing the measured C stocks from collected sediment cores to the predicted C stock values generated from the Random Forest model. The difference between the measured and predicted C stock values for each core are indicative of the error associated with the measurement and calculation of C stocks, while accounting for the influence of environmental parameters, as well as the model performance. Plots of the measured versus predicted data reveal that across the range of C stocks measured, the residuals are relatively evenly spread, but that the variation increases slightly as C stock increases (Figure 3). Therefore, we converted the residual difference between the measured and predicted data to a proportion of the measured value, and used these residuals to generate a normal distribution. This technique is similar to Monte Carlo simulations used in previous studies to propagate error in soil C stocks (Goidts et al., 2009). Proportional residuals were not bound between 0 and 1 as the difference between measured and predicted values could be greater or less than the measured value. We found that the proportional residuals form a normal distribution with a mean of −0.0032 and a standard deviation of 0.017.
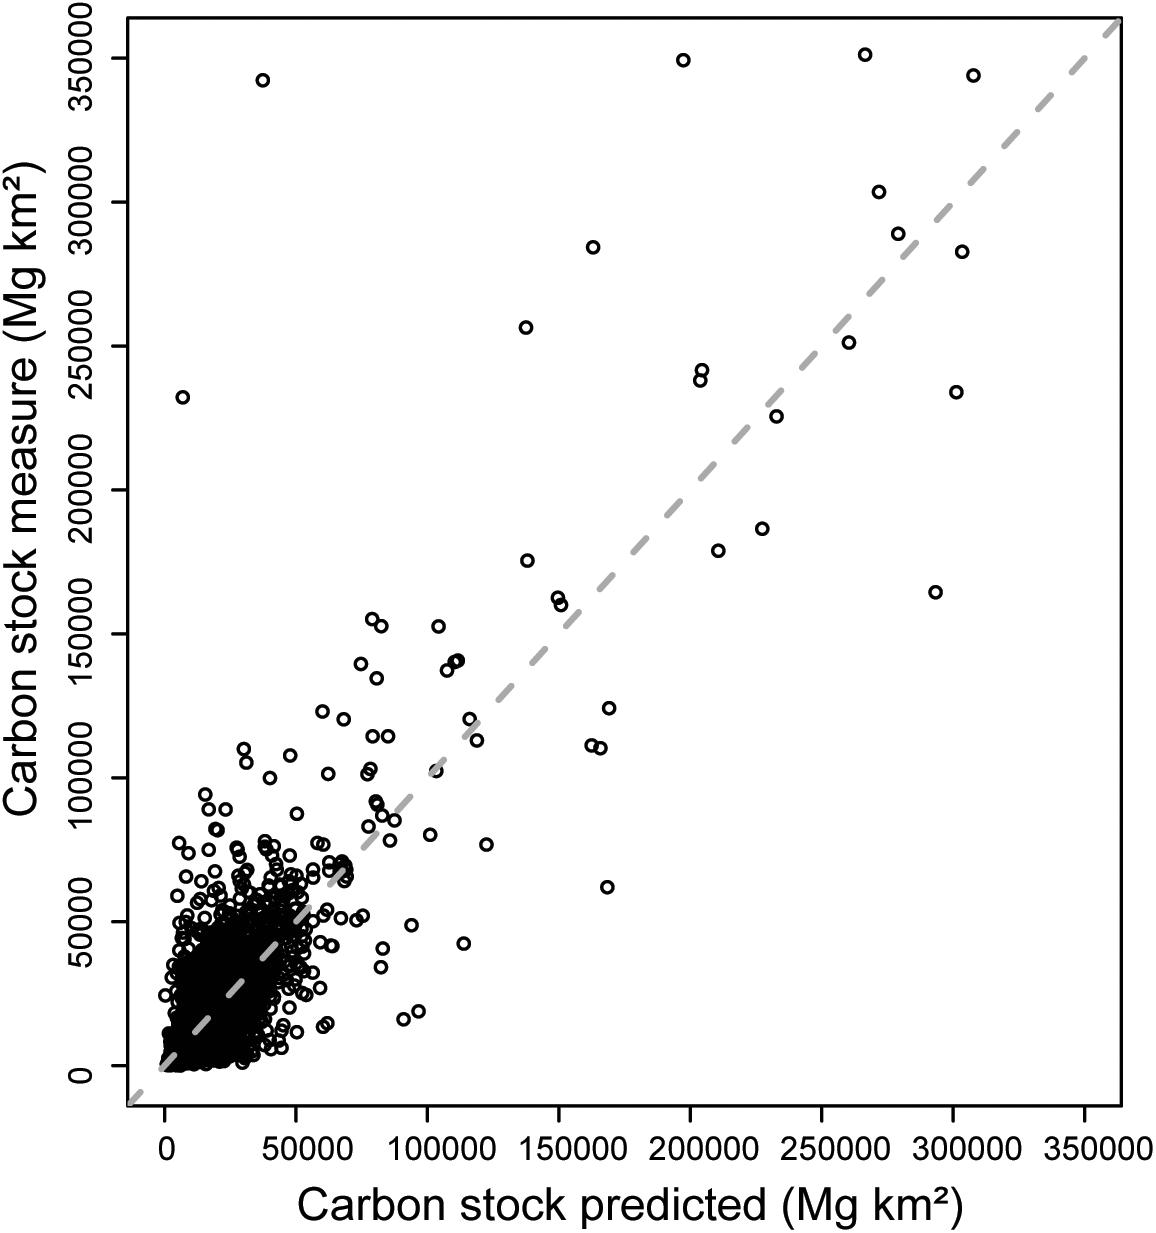
Figure 3. Predicted carbon (C) stock data versus measured C stock. Each data point represents the C stock data from one core. Measured C stocks were calculated from the data reported in the original source study, while predicted C stocks were obtained from the Random Forest model. The dashed line represents the 1:1 line where measured data equals predicted data.
From the distribution of proportional residuals, we estimated error in C stock by generating bootstrapped confidence limits around C stock estimates. We used 1000 iterations to produce bootstrapped confidence limits. For each iteration, we took the predicted C stock value for each collected sediment core, and then added a proportion of that predicted value based on a sample from the normal distribution of proportional residuals (a value that could be positive or negative). This process is analogous to the Monte Carlo simulations used in previous attempts to quantify error (Goidts et al., 2009). From the 1000 iterations of predicted value plus error sample generated for each individual core, we identified the 0.025 and 0.975 quantiles to produce upper and lower 95% confidence limits for the predicted value of each core. This process meant that for each core used in the analysis, we had a measured value, and an upper and lower confidence limit. Finally, Random Forest models were then run using the upper and lower confidence limits for each collected sediment core value to produce confidence intervals for each pixel, which was then propagated up to the global C stock.
We used Harris and Whiteway (2009) geomorphic units to calculate the amount of C stored in sediments located in the continental shelf, continental slope, abyss/basin, and hadal zones (Figure 4). We combined abyss and basin zones because they were not spatially explicit in the original data set. We estimated the amount of C stored in EEZs, the high seas, all MPAs, highly protected MPAs, and ocean depths > 1000 m (deep-sea) using spatial statistics. EEZ locations were obtained from the marine regions database managed by the Flanders Marine Institute1. MPA locations and protection levels were identified using the MPAtlas database (Marine Conservation Institute, 2019). Ocean depths were calculated from the bathymetry predictor variable used in the Random Forest analysis2.
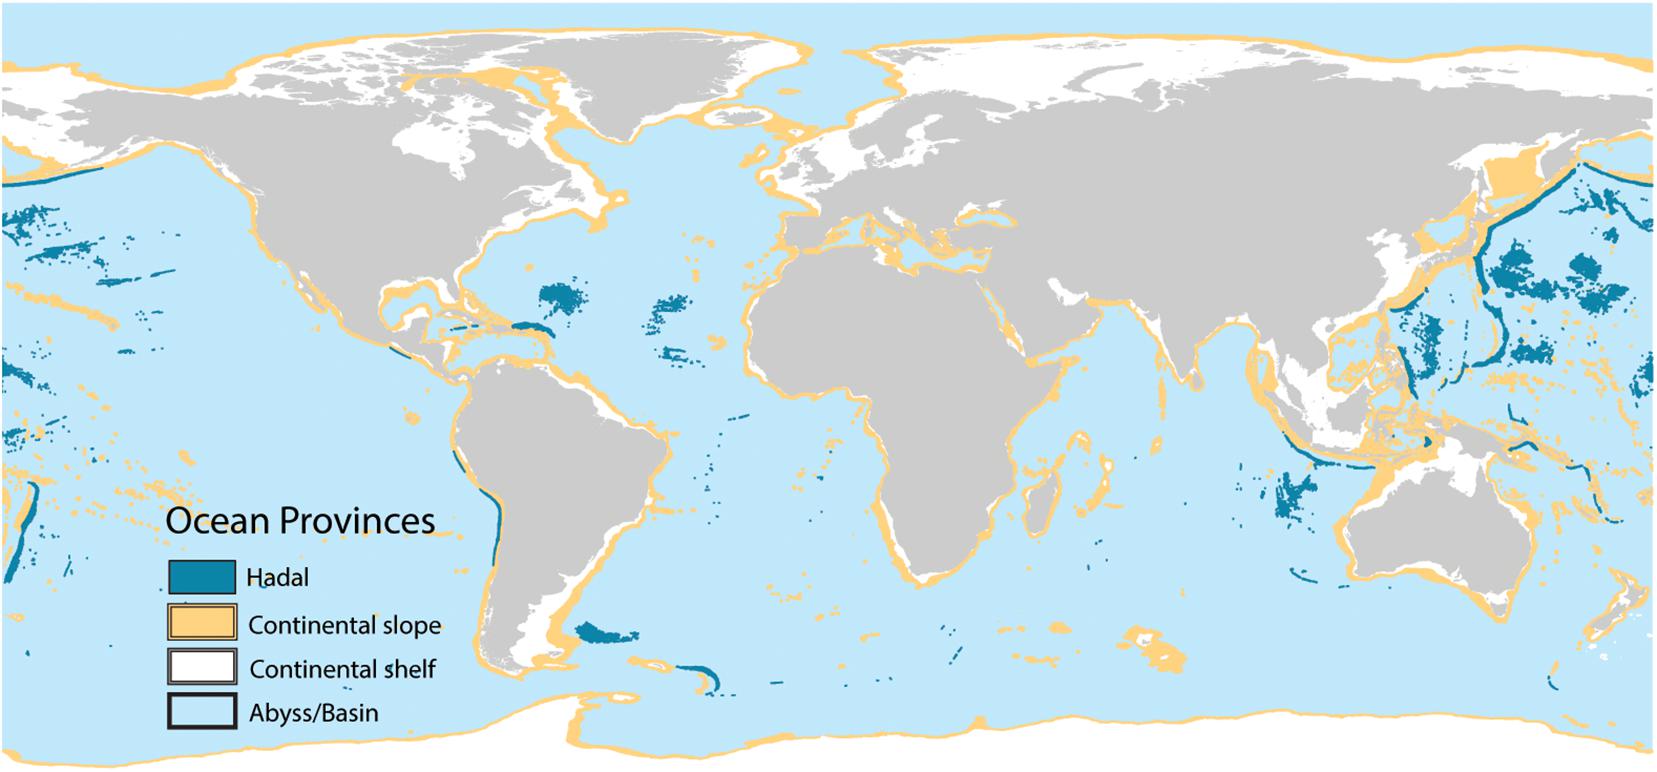
Figure 4. Global distribution of ocean provinces. Data from Harris and Whiteway (2009).
Results
Our Random Forest Regression model explained 76% of the variance in C stocks estimated from sediment cores (R2 = 0.76, RMSE 7306 Mg km2). Ocean chlorophyll a concentrations, elevation and bathymetry, mean annual precipitation of nearest land point, and sea surface height, respectively, were the most important variables explaining marine sediment C stocks (Figure 5).
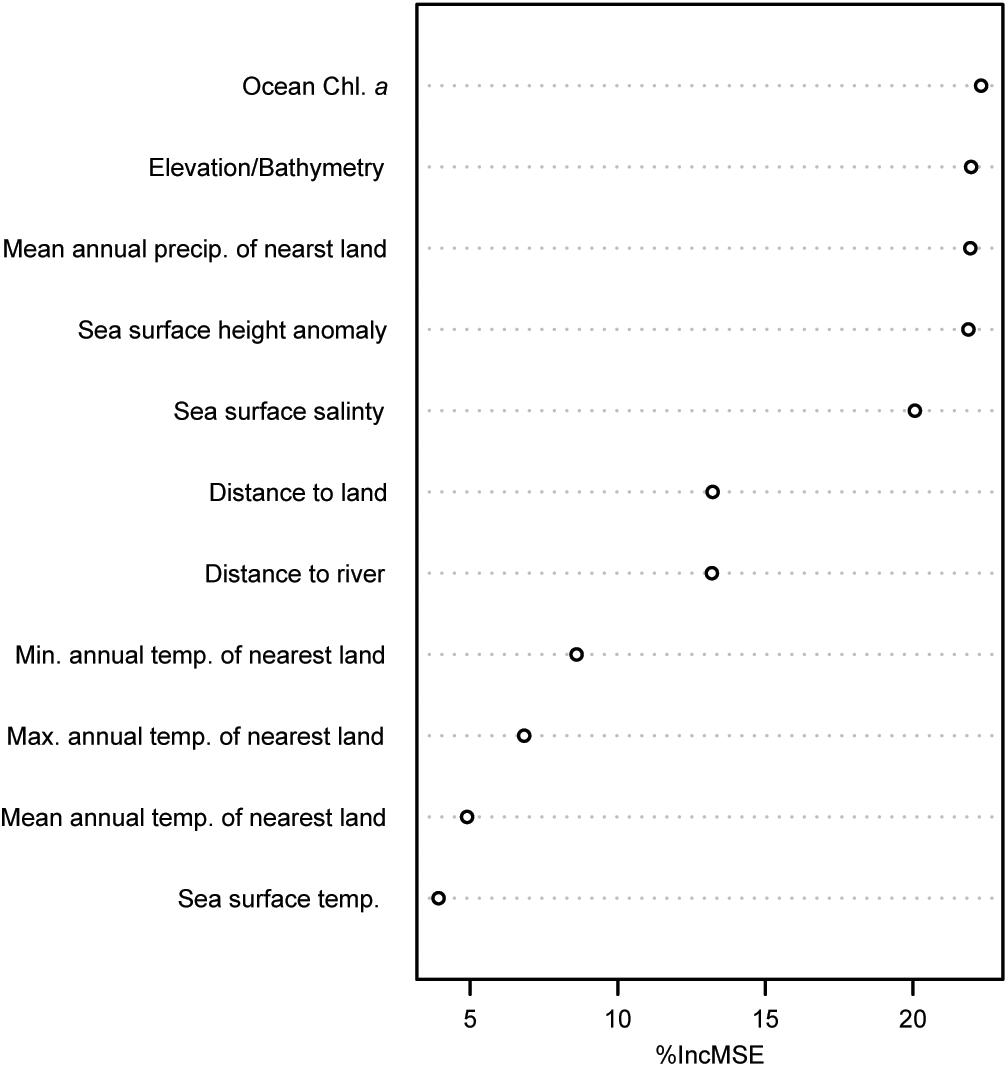
Figure 5. Variable importance plot for predictor variables used in the Random Forest analysis expressed as the percent increase in mean squared error (% IncMSE). The higher the values of %IncMSE, the more important that variable is in the Random Forest model.
We found that the global ocean stores 2322 Pg of C in the top 1 m (Figure 6A), with a 2239 to 2391 Pg C range across all pixels. Error spatially varied across ocean sediments with larger uncertainty occurring in areas that had low data densities and/or higher variability in known C stocks. Areas with the highest uncertainty included the continental shelf, with parts of the Caribbean, the North Sea, the Mediterranean, and coastal Indonesia and Malaysia having the highest variability in C stocks (Figure 6B).
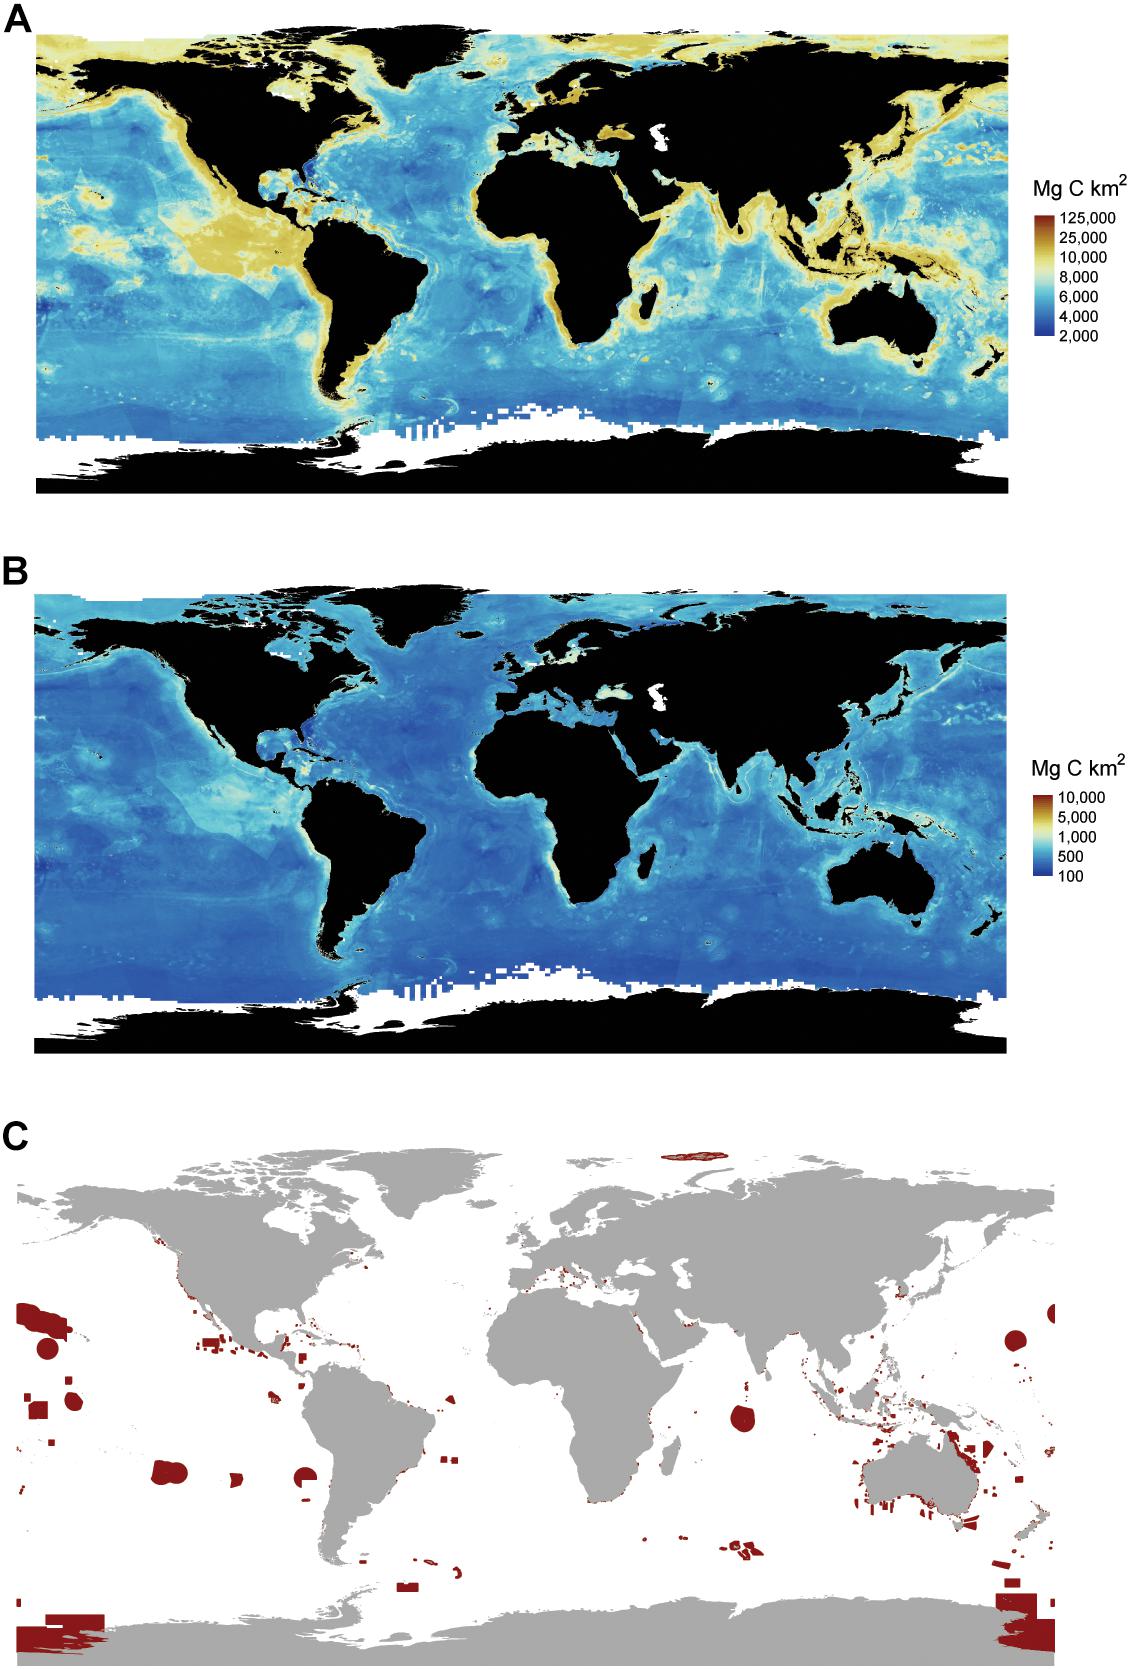
Figure 6. Global marine sediment carbon (C) stocks and marine protected areas. (A) Average distribution of global marine sediment C stocks. Stocks represent the amount of C stored in the top 1 m of sediment. (B) Uncertainty in C stocks as express by the difference between the upper and lower 95% CI. (C) Locations of marine protected areas. Areas circled in red are implemented fully to highly protected marine areas where only light extractive activities are allowed, and other impacts are minimized to the extent possible. Data on marine protected areas are from http://mpatlas.org/map/mpas/ (Marine Conservation Institute, 2019). MPAtlas. Seattle, WA, United States. www.mpatlas.org [Accessed 19/02/2019].
Carbon stocks spatially varied across oceanic depths and across regions. Five-times as much C is stored in deep-sea sediments (water depths > 1000 m) compared to sediments underlying shallow seas (Table 2). Within the oceanic provinces, abyssal/basins store the most C (1777–1898 Pg C), followed by the continental shelf (256–274 Pg C), the continental slope (164–175 Pg), hadal zone (23–24 Pg), and other non-shelf coastal habitats (19–20 Pg). The amount of C stored in EEZs and the high seas were similar, with 1132 (1092–1166, 95% CI) Pg C stored in EEZs and 1190 (1147–1225) Pg C stored in the high seas. As of 2019, 94 (92–97) Pg C in the top 1 m of sediments is stored in MPA’s, of which only 48 (47–50) Pg C is stored in highly protected MPAs (Figures 6A,C and Table 2).
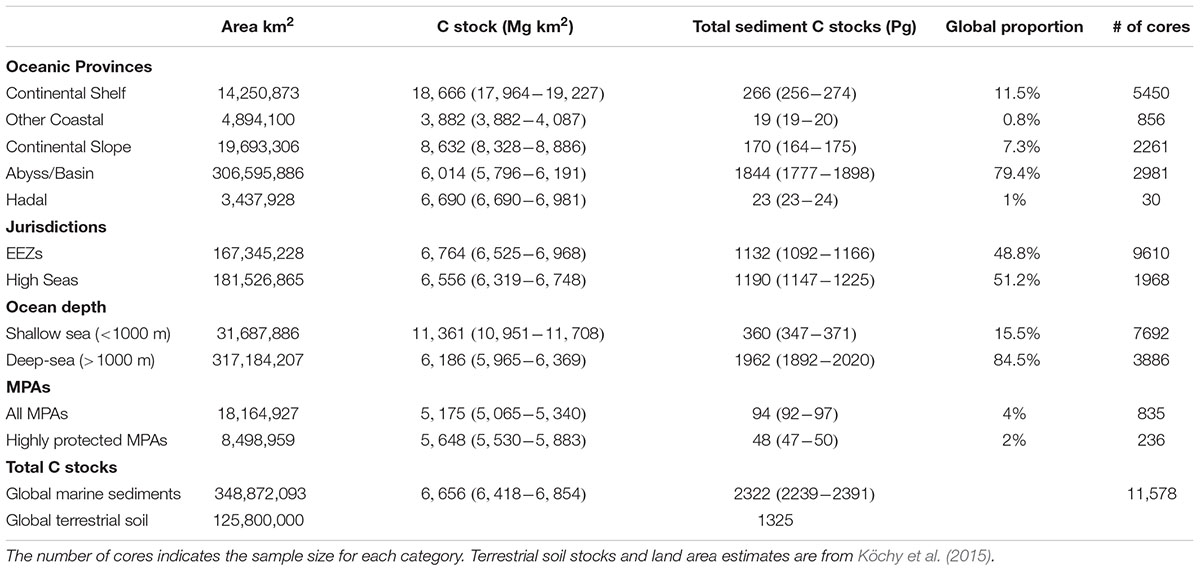
Table 2. Global extent, average (95% confidence intervals) carbon (C) stocks in the top 1 m, and proportion of the global marine sediment C stock in the top 1 m for different oceanic provinces, marine jurisdictions [Exclusive Economic Zones (EEZ)], ocean depths, marine protected areas (MPAs), including implemented highly and fully protected areas, and total marine sedimentary C stock for the global ocean.
Discussion
We estimate that the ocean is currently storing 2322 (2239–2391) Pg C in the top 1 m of sediments, with most (79%) of this C stored in abyssal/basin zones. This estimate makes the ocean the largest pool of sediment/soil C stocks in the world, with 1.75 times greater C stocks than the top 1 m of terrestrial soils (Köchy et al., 2015). Because our estimate does not include supratidal areas, our C stock estimate is likely conservative as it omits some supratidal marshes and mangroves, which are known to store large amounts of sediment C (Atwood et al., 2017; Macreadie et al., 2017; Osland et al., 2018). Past studies have estimated that marine surface sediments store between 87 Pg C (top 5 cm; Lee et al., 2019) and 147 Pg C (top 30 cm; Emerson and Hedges, 1988); if we extrapolate their results to a 1 m depth (assuming an equal distribution of C with depth), our estimate is 1.3 times to 4.7 times greater, respectively, than these previous calculations. Emerson and Hedges’ (1988) estimate was not spatially explicit and relied on average %C and bulk density estimates for the open ocean and continental margin sediments. The more recent estimate from Lee et al. (2019), used 5623 sediment cores collected from the global ocean before 2004, and k-nearest neighbors algorithms to estimate C content in marine sediments at a 5 × 5-arcmin resolution. They then calculated C stocks in the top 5 cm by using a global average for bulk density. Our study improves upon these past estimates of marine sediment C stocks by using spatially explicit estimates of bulk density, and by including 1000s of additional cores, many of which were collected from the carbon-rich sediments of coastal vegetated habitats (Atwood et al., 2017; Macreadie et al., 2017; Osland et al., 2018; Serrano et al., 2019).
Sediment C hotspots (i.e., large C stocks per unit area) generally occurred along continental shelves. Some of the largest C hotspots were observed off the coasts of Namibia, Peru, Baja California, and in the Caribbean Sea, the Baltic Sea, and the Indo-Pacific (Figure 4). Variable importance plots identified ocean chlorophyll a, depth, mean annual precipitation of nearest land, distance to land, and distance to rivers as some of the most important variables influencing C stock distributions. These results suggest that the large supply of organic-rich sediments from land runoff and river discharge (Bauer et al., 2013; Regnier et al., 2013; Bianchi et al., 2018) and the production of large phytoplankton blooms in upwelling areas are important drivers in the supply of C to continental shelf marine sediments. Over the past two centuries, human-driven land-use change, river modification, and climate change have led to significant impacts on the spatial and temporal fluxes of C from land, rivers, and pelagic environments to marine sediments (Bauer et al., 2013; Regnier et al., 2013). As a result, human activities will likely play a large role in reshaping the spatial distribution of future C hotspots.
Deep-sea sediments (ocean depths > 1000 m) generally had low C stocks per unit area owing to low C concentrations (<1%) in the sediment (Lee et al., 2019). However, because of their extensive geographic areal coverage, deep-sea sediments accounted for 84% of the total marine sediment C stock. Although our C stock assessment was standardized to a 1 m depth to help compare C stocks across systems, the C composing deep-sea stocks represent the accumulation of C over much longer timescales than those in shallow coastal zones. Sedimentation rates in the deep-sea are two to three orders of magnitude slower than coastal sediments (McLeod et al., 2011; Estes et al., 2019). Thus, C stocks down to 1 m depth in coastal sediments represent accumulation over 100 to 1000s of years, while a depth of 1 m in deep-sea sediments represent accumulation over 100s of 1000s to millions of years.
For anthropogenic disturbances (e.g., deep-sea mining or trawling) to enhance C remineralization in marine sediments, the organic C in the sediment must be physically and chemically available to be broken down by heterotrophic communities, and physicochemical conditions in the sediments must be or become conducive to heterotrophic metabolism (Hedges and Keil, 1995; Burdige, 2007; Hendriks et al., 2008). In general, organic-rich coastal sediments along the continental shelf that experience high sedimentation rates and rapid oxygen depletion with depth are hypothesized to be the most sensitive to disturbances. Disturbances that physically disrupt these organic-rich coastal sediments can enhance oxygen exposure and mix fresh C pools with degraded ones, priming microbial activity, and the breakdown of C (Bianchi, 2011; Lovelock et al., 2017; Macreadie et al., 2019). Conversely, recent estimates have suggested that a large portion of deep-sea sediment C occurs in oxygenated sediments, but that physical and chemical protections make that C inaccessible to heterotrophic metabolism (Keil and Hedges, 1993; Hedges and Keil, 1995; Estes et al., 2019). As a result, deep-sea sediment C along the continental slope, abyssal/basin, and hadal zones may be more resistant to disturbances than coastal continental shelf sediments. Even if deep-sea organic C is remineralized, it is unlikely to influence atmospheric CO2 concentrations over the near future because deep-sea C cycling works on millennial time-scales. However, organic C availability and the release of metabolic CO2 in sediment porewater from its degradation are major drivers of calcium carbonate dissolution in marine sediments (Emerson and Archer, 1990; Archer, 1991; Archer and Maier-Reimer, 1994; Jahnke et al., 1994). As calcium carbonate is a major buffer, alterations to calcium carbonate preservation in marine sediments could lead to complex and hard to predict ocean acidification feedbacks, as well as effects on benthic calcifiers (Sulpis et al., 2018).
The sheer volume of C stored in marine sediments underscores the importance of safeguarding, as the remineralization of even a small fraction of these C stocks could greatly exacerbate climate change. Currently, 4% (94 Pg C) of marine sediment C stocks occur in MPAs, and only 2% (48 Pg C) occur in highly protected MPAs where commercial extraction is prohibited, and recreational and subsistence extraction is minimal (i.e., no-take reserves). Although the expansion of MPAs will not reduce the effects of all disturbances on marine C stocks, they can help alleviate impacts from abatable threats like trawling and mining, as long as those activities are not displaced to areas with higher C stocks. However, most MPAs are established within country boundaries, with only ∼1% of the high seas receiving protection from current MPAs (Marine Conservation Institute, 2019). The large amount of C stocks residing outside EEZs (48%), is, therefore, concerning because there is currently little governance over the expanding human activities (e.g., deep-sea mining and bottom-trawling) that could lead to the disturbance and remineralization of sediment C stored in high seas benthic habitats (Ardron et al., 2013).
C Model Error and Uncertainty
Several factors may contribute to potential errors and uncertainty in our C model predictions. Error estimates showed that continental shelf sediments had the highest uncertainty in C stocks. This uncertainty is, at least in part, likely the result of high variability in the C content of continental shelf sediments, which can range from relic sands that have C contents of < 1% (Seiter et al., 2004) to organic-rich sediments in vegetated coastal habitats with C contents > 15% (Donato et al., 2011). In addition, the marine sediment C data used to build and test our models is subject to a variety of errors. First, studies used a variety of analytical methods for estimating percent C in sediments that include both quantitative (wet oxidation and dry combustion) and semi-quantitative (LOI) measures. Each of these methods, as well as the labs and equipment performing these analyses, vary in their sensitivity and error. Second, maximum core depth varied across studies, with 84% of the cores used in this study requiring standardization to 1 m. We chose a standardized depth of 1 m to comply with IPCC protocols and common practice in the literature for sediment/soil C budgets. Our extrapolations assume a uniform distribution of C to 1 m. However, many studies have shown that C concentrations in sediments show a non-linear decline in C to a depth of ∼30 cm and then remain relatively constant to ∼1 m (Sanders et al., 2016; Serrano et al., 2016). Third, 69% of cores used in our study did not have a bulk density measurement and required the use of a pedotransfer functions to estimate one. Furthermore, various coring devices were used by the different studies to extract sediments. Some coring devices cause severe disturbance to surface sediments, which can cause sediment loss from the surface. Other devices can cause compaction during core penetration, which can affect bulk density measurements. Bulk density estimates and non-standardization of core depth are often two of the largest sources of uncertainty in large-scale sediment/soil C models (Köchy et al., 2015; Sanderman et al., 2018). Overall, only ∼10% of our data provided all the necessary information to calculate C stocks down to 1 m, which highlights the large disconnect between the current methods used by studies examining C in marine sediments, and protocols set out by the IPCC for carbon budgets. Fourth, the global distribution of our sediment C data was not uniform, with fewer collections occurring in the southern hemisphere and a large data gap in the Southern Ocean. If the studies that collected the cores used in our model were globally or regionally biased toward more organic-rich or organic-poor sediments, then such biases would propagate through the C model predictions. Although we cannot discount that such sampling bias exists, our study provides the most robust collation of global marine sediment cores. Thus, our study represents our most up-to-date knowledge on C stocks in global marine sediments based on the cores collected to date. In addition to errors and uncertainty in the C data, our model uses 12 predictor variables (see section “Materials and Methods”) to estimate local C stocks at a 1-km resolution. Most of these predictor variables are themselves based on modeled data and are subject to their own error and uncertainty. Finally, some benthic habitats in the ocean are composed of hard substrates with little or no sediment or soil accumulation. However, a high resolution, global map of substrate characteristics has yet to be completed. In areas with extensive coverage of hard substrate and no or limited sediment or soil accumulation, our results will overestimate sediment C stocks.
Conclusion
Our study shows that marine sediments, particularly nearshore sediments, are a large and important global C sink. Currently, only a small portion of marine sediment C is safeguarded from activities that could lead to the disturbance of ocean sediments and the remineralization of these stocks. These results suggest that as nations strive to protect more of the ocean, the design of new MPAs should consider the inclusion of C storage as a conservation objective (Howard et al., 2017; Dinerstein et al., 2019). Not only can the protection of marine C stocks help mitigate climate change, but C-financing mechanisms can also be used to help support the economic costs of implementing and maintaining an MPA (Howard et al., 2017). This study provides a quantitative, high-resolution assessment of the C stored in marine sediments that not only enhances our understanding of the ocean C budget, but also helps identify major priority areas for conservation.
Data Availability Statement
The sediment carbon data is available at https://figshare.com/articles/marine_soil_carbon/9941816. The R code for calculating uncertainty and GeoTiff files of the carbon maps are available at https://figshare.com/articles/Global_marine_sedimentary_carbon_stock/11956356.
Author Contributions
TA and ES designed the study. TA, AW, and EH collected the data. AW, JM, and EH analyzed the data. TA, AW, JM, EH, and ES wrote the manuscript.
Funding
This study was funded by the National Geographic Society.
Conflict of Interest
The authors declare that the research was conducted in the absence of any commercial or financial relationships that could be construed as a potential conflict of interest.
Acknowledgments
We would like to thank Tom Bianchi and Boris Worm for comments on an early draft of the manuscript.
Footnotes
References
Archer, D. (1991). Modeling the calcite lysocline. J. Geophys. Res. 96, 17037–17050. doi: 10.1029/91jc01812
Archer, D., and Maier-Reimer, E. (1994). Effect of deep-sea sedimentary calcite preservation on atmospheric CO 2 concentration. Nature 367, 260–263. doi: 10.1038/367260a0
Ardron, J., Druel, E., Gjerde, K., Houghton, K., Rochette, J., and Unger, S. (2013). Advancing Governance of the High Seas. Potsdam: Institute for Advanced Sustainability Studies (IASS).
Atwood, T. B., Connolly, R. M., Almahasheer, H., Carnell, P. E., Duarte, C. M., Lewis, C. J. E., et al. (2017). Global patterns in mangrove soil carbon stocks and losses. Nat. Clim. Chang. 7, 523–528. doi: 10.1038/NCLIMATE3326
Bauer, J. E., Cai, W.-J., Raymond, P. A., Bianchi, T. S., Hopkinson, C. S., and Regnier, P. A. G. (2013). The changing carbon cycle of the coastal ocean. Nature 504, 61–70. doi: 10.1038/nature12857
Bianchi, T. S. (2011). The role of terrestrially derived organic carbon in the coastal ocean: a changing paradigm and the priming effect. Proc. Natl. Acad. Sci. U.S.A. 108, 19473–19481. doi: 10.1073/pnas.1017982108
Bianchi, T. S., Cui, X., Blair, N. E., Burdige, D. J., Eglinton, T. I., and Galy, V. (2018). Centers of organic carbon burial and oxidation at the land-ocean interface. Org. Geochem. 115, 138–155. doi: 10.1016/j.orggeochem.2017.09.008
Bianchi, T. S., Schreiner, K. M., Smith, R. W., Burdige, D. J., Woodard, S., and Conley, D. J. (2016). Redox effects on organic matter storage in coastal sediments during the Holocene: a biomarker/proxy perspective. Annu. Rev. Earth Planet. Sci. 44, 295–319. doi: 10.1146/annurev-earth-060614-105417
Burdige, D. J. (2007). Preservation of organic matter in marine sediments: controls, mechanisms, and an imbalance in sediment organic carbon budgets? Chem. Rev. 107, 467–485. doi: 10.1021/cr050347q
Cordes, E. E., Jones, D. O. B., Schlacher, T. A., Amon, D. J., Bernardino, A. F., Brooke, S., et al. (2016). Environmental impacts of the deep-water oil and gas industry: a review to guide management strategies. Front. Environ. Sci. 4:58. doi: 10.3389/fenvs.2016.00058
Davies, A. J., Roberts, J. M., and Hall-Spencer, J. (2007). Preserving deep-sea natural heritage: emerging issues in offshore conservation and management. Biol. Conserv. 138, 299–312. doi: 10.1016/j.biocon.2007.05.011
Dinerstein, E., Vynne, C., Sala, E., Joshi, A. R., Fernando, S., Lovejoy, T. E., et al. (2019). A global deal for nature: guiding principles, milestones, and targets. Sci. Adv. 5:eaaw2869. doi: 10.1126/sciadv.aaw2869
Donato, D. C., Kauffman, J. B., Murdiyarso, D., Kurnianto, S., Stidham, M., and Kanninen, M. (2011). Mangroves among the most carbon-rich forests in the tropics. Nat. Geosci. 4, 293–297. doi: 10.1038/ngeo1123
Duarte, C. M., Losada, I. J., Hendriks, I. E., Mazarrasa, I., and Marbà, N. (2013). The role of coastal plant communities for climate change mitigation and adaptation. Nat. Clim. Chang. 3, 961–968. doi: 10.1038/nclimate1970
Emerson, S., and Hedges, J. I. (1988). Processes controlling the organic carbon content of open ocean sediments. Palaeogeogr. Palaeoclimatol. Palaeoecol. 3, 621–634. doi: 10.1029/PA003i005p00621
Emerson, S. R., and Archer, D. (1990). Calcium carbonate preservation in the ocean. Philos. Trans. R. Soc. Ser. A Math. Phys. Sci. 331, 29–40. doi: 10.1098/rsta.1990.0054
Estes, E. R., Pockalny, R., D’Hondt, S., Inagaki, F., Morono, Y., Murray, R. W., et al. (2019). Persistent organic matter in oxic subseafloor sediment. Nat. Geosci. 12, 126–131. doi: 10.1038/s41561-018-0291-5
Fourqurean, J. W., Duarte, C. M., Kennedy, H., Marbà, N., Holmer, M., Mateo, M. A., et al. (2012). Seagrass ecosystems as a globally significant carbon stock. Nat. Geosci. 5, 505–509. doi: 10.1038/ngeo1477
Goidts, E., Van Wesemael, B., and Crucifix, M. (2009). Magnitude and sources of uncertainties in soil organic carbon (SOC) stock assessments at various scales. Eur. J. Soil Sci. 60, 723–739. doi: 10.1111/j.1365-2389.2009.01157.x
Hamilton, S. E., and Friess, D. A. (2018). Global carbon stocks and potential emissions due to mangrove deforestation from 2000 to 2012. Nat. Clim. Chang. 8, 240–244. doi: 10.1038/s41558-018-0090-4
Harris, P. T., and Whiteway, T. (2009). High seas marine protected areas: benthic environmental conservation priorities from a GIS analysis of global ocean biophysical data. Ocean Coast. Manag. 52, 22–38. doi: 10.1016/j.ocecoaman.2008.09.009
Hedges, J. I., and Keil, R. G. (1995). Sedimentary organic matter preservation: an assessment and speculative synthesis. Mar. Chem. 49, 81–115. doi: 10.1016/0304-4203(95)00008-F
Hendriks, I., Sintes, T., Bouma, T., and Duarte, C. (2008). Experimental assessment and modeling evaluation of the effects of the seagrass Posidonia oceanica on flow and particle trapping. Mar. Ecol. Prog. Ser. 356, 163–173. doi: 10.3354/meps07316
Howard, J., Hoyt, S., Isensee, K., Pidgeon, E., and Telszewski, M. (eds). (2014). Coastal Blue Carbon: Methods for Assessing Carbon Stocks and Emission Factors in Mangroves, Tidal Salt Marshes, and Seagrass Meadows. Arlington, VA: Conservation International, Intergovernmental Oceanographic Commission of UNESCO, International Union for Conservation of Nature.
Howard, J., McLeod, E., Thomas, S., Eastwood, E., Fox, M., Wenzel, L., et al. (2017). The potential to integrate blue carbon into MPA design and management. Aquat. Conserv. Mar. Freshw. Ecosyst. 27, 100–115. doi: 10.1002/aqc.2809
IPCC (2013). Climate Change 2013: The Physical Science Basis. Contribution of Working Group I to the Fifth Assessment Report of the Intergovernmental Panel on Climate Change, eds T. F. Stocker, D. Qin, G.-K. Plattner, M. Tignor, S. K. Allen, J. Boschung, et al. (Cambridge: Cambridge University Press), 1535. doi: 10.1017/CBO9781107415324
Jahnke, R. A., Craven, D. B., and Gaillard, J. F. (1994). The influence of organic matter diagenesis on CaCO3 dissolution at the deep-sea floor. Geochim. Cosmochim. Acta 58, 2799–2809. doi: 10.1016/0016-7037(94)90115-5
Keil, R. G., and Hedges, J. I. (1993). Sorption of organic matter to mineral surfaces and the preservation of organic matter in coastal marine sediments. Chem. Geol. 107, 385–388. doi: 10.1016/0009-2541(93)90215-5
Kennedy, H., Beggins, J., Duarte, C. M., Fourqurean, J. W., Holmer, M., Marbà, N., et al. (2010). Seagrass sediments as a global carbon sink: isotopic constraints. Global Biogeochem. Cycles 24:GB4026. doi: 10.1029/2010GB003848
Köchy, M., Hiederer, R., and Freibauer, A. (2015). Global distribution of soil organic carbon – Part 1: masses and frequency distributions of SOC stocks for the tropics, permafrost regions, wetlands, and the world. Soil 1, 351–365. doi: 10.5194/soil-1-351-2015
Lee, T. R., Wood, W. T., and Phrampus, B. J. (2019). A machine learning (kNN) approach to predicting global seafloor total organic carbon. Global Biogeochem. Cycles 33, 37–46. doi: 10.1029/2018GB005992
Lovelock, C. E., Atwood, T. B., Baldock, J., Duarte, C. M., Hickey, S., Lavery, P. S., et al. (2017). Assessing the risk of carbon dioxide emissions from blue carbon ecosystems. Front. Ecol. Environ. 15, 257–265. doi: 10.1002/fee.1491
Macreadie, I., Ollivier, Q. R., Kelleway, J. J., Serrano, O., Carnell, P. E., Ewers Lewis, C. J., et al. (2017). Carbon sequestration by Australian tidal marshes. Sci. Rep. 7:44071. doi: 10.1038/srep44071
Macreadie, P. I., Atwood, T. B., Seymour, J. R., Fontes, M. L. S., Sanderman, J., Nielsen, D. A., et al. (2019). Vulnerability of seagrass blue carbon to microbial attack following exposure to warming and oxygen. Sci. Total Environ. 686, 264–275. doi: 10.1016/j.scitotenv.2019.05.462
Marine Conservation Institute (2019). Available online at: www.mpatlas.org (accessed February 19, 2019).
McLeod, E., Chmura, G. L., Bouillon, S., Salm, R., Björk, M., Duarte, C. M., et al. (2011). A blueprint for blue carbon: toward an improved understanding of the role of vegetated coastal habitats in sequestering CO2. Front. Ecol. Environ. 9, 552–560. doi: 10.1890/110004
Osland, M. J., Gabler, C. A., Grace, J. B., Day, R. H., McCoy, M. L., McLeod, J. L., et al. (2018). Climate and plant controls on soil organic matter in coastal wetlands. Glob. Chang. Biol. 24, 5361–5379. doi: 10.1111/gcb.14376
Pendleton, L., Donato, D. C., Murray, B. C., Crooks, S., Jenkins, W. A., Sifleet, S., et al. (2012). Estimating global “blue carbon” emissions from conversion and degradation of vegetated coastal ecosystems. PLoS One 7:e43542. doi: 10.1371/journal.pone.0043542
Regnier, P., Friedlingstein, P., Ciais, P., Mackenzie, F. T., Gruber, N., Janssens, I. A., et al. (2013). Anthropogenic perturbation of the carbon fluxes from land to ocean. Nat. Geosci. 6, 597–607. doi: 10.1038/ngeo1830
Roberts, C. M., O’Leary, B. C., McCauley, D. J., Cury, P. M., Duarte, C. M., Lubchenco, J., et al. (2017). Marine reserves can mitigate and promote adaptation to climate change. Proc. Natl. Acad. Sci. U.S.A. 114, 6167–6175. doi: 10.1073/pnas.1701262114
Sanderman, J., Hengl, T., Fiske, G., Solvik, K., Adame, M. F., Benson, L., et al. (2018). A global map of mangrove forest soil carbon at 30 m spatial resolution. Environ. Res. Lett. 13:055002. doi: 10.1088/1748-9326/aabe1c
Sanders, C. J., Maher, D. T., Tait, D. R., Williams, D., Holloway, C., Sippo, J. Z., et al. (2016). Are global mangrove carbon stocks driven by rainfall? J. Geophys. Res. Biogeosci. 121, 2600–2609. doi: 10.1002/2016JG003510
Scharlemann, J. P. W., Tanner, E. V. J., Hiederer, R., and Kapos, V. (2014). Global soil carbon: understanding and managing the largest terrestrial carbon pool. Carbon Manag. 5, 81–91. doi: 10.4155/cmt.13.77
Seiter, K., Hensen, C., Schröter, J., and Zabel, M. (2004). Organic carbon content in surface sediments – defining regional provinces. Deep Sea Res. Part I Oceanogr. Res. Pap. 51, 2001–2026. doi: 10.1016/j.dsr.2004.06.014
Serrano, O., Lovelock, C. E., Atwood, T. B., Macreadie, P. I., Canto, R., Phinn, S., et al. (2019). Australian vegetated coastal ecosystems as global hotspots for climate change mitigation. Nat. Commun. 10, 1–10. doi: 10.1038/s41467-019-12176-8
Serrano, O., Ruhon, R., Lavery, P. S., Kendrick, G. A., Hickey, S., and Masqué, P. (2016). Impact of mooring activities on carbon stocks in seagrass meadows. Sci. Rep. 6:23193. doi: 10.1038/srep23193
Keywords: blue carbon, soil carbon, carbon storage, climate mitigation, carbon cycle, SOC
Citation: Atwood TB, Witt A, Mayorga J, Hammill E and Sala E (2020) Global Patterns in Marine Sediment Carbon Stocks. Front. Mar. Sci. 7:165. doi: 10.3389/fmars.2020.00165
Received: 24 November 2019; Accepted: 02 March 2020;
Published: 25 March 2020.
Edited by:
Selvaraj Kandasamy, Xiamen University, ChinaReviewed by:
Andrew W. Dale, GEOMAR Helmholtz Center for Ocean Research Kiel, GermanyTim Rixen, Leibniz Centre for Tropical Marine Research (LG), Germany
Copyright © 2020 Atwood, Witt, Mayorga, Hammill and Sala. This is an open-access article distributed under the terms of the Creative Commons Attribution License (CC BY). The use, distribution or reproduction in other forums is permitted, provided the original author(s) and the copyright owner(s) are credited and that the original publication in this journal is cited, in accordance with accepted academic practice. No use, distribution or reproduction is permitted which does not comply with these terms.
*Correspondence: Trisha B. Atwood, trisha.atwood@usu.edu