Retelling the History of the Red Sea Urchin Fishery in Mexico
 Alfonso Medellín-Ortiz1,2*
  Gabriela Montaño-Moctezuma3*
  Carlos Alvarez-Flores4
  Eduardo Santamaria-del-Angel2
- 1PhD, Coastal Oceanography Program, Universidad Autónoma de Baja California, Ensenada, Mexico
- 2Facultad de Ciencias Marinas, Universidad Autónoma de Baja California, Ensenada, Mexico
- 3Instituto de Investigaciones Oceanólogicas, Universidad Autónoma de Baja California, Ensenada, Mexico
- 4Pronatura Noroeste A.C., Ensenada, Mexico
The red sea urchin fishery has a long harvest and management history along the Northeastern Pacific coast. In Mexico, it has been commercially harvested since 1972, and although it is one of the most important fisheries in Baja California, efforts to assess the condition and dynamics of harvestable stocks have been focused on certain harvested areas with scarce fisheries independent data. Additionally, the analysis of yearly information for small geographic areas has obscured the actual status of harvested populations. This study aims to re-assess population trends, fishing effort, and catches, incorporating all available information from the last 19 years. Information was grouped based on 14 landing sites along Baja California’s Pacific coast. Length based virtual population analysis (LVPA) was implemented to estimate site-specific catch rates and densities. Red sea urchin catches/landings varied widely within and between areas. Population density was below 1 urchin m–2 in most of the sites, and was composed of higher recruits and juvenile densities that may partially mitigate for fishery removals. LVPA produced biomass estimations that double previous estimates. We suggest that the model parameters used in previous estimations might not reflect key biological traits of the red sea urchin, failing to reproduce population trends accurately. Results from this study allowed identifying the specific sites where population attributes (biomass, densities), fishery data (catch, effort), and the combination of both (Kobe plots), suggest that urchin populations may need attention. New management measures must be adopted: maximum legal size of 110 mm, improvement on fishery logs and analysis, continuous fishery independent surveys to track changes in the population that might not be so apparent when observing only catch/biomass data. Reinforce the under legal size management strategy, since results suggest that sites with high abundances of small urchins can support higher catches.
Introduction
Red sea urchins (Mesocentrotus franciscanus) are one of the must-studied echinoderms in the Northeaster Pacific coast, from Mexico to Alaska (Ebert et al., 2018). As a fishery, it has a long harvest and management history along the Pacific coast (Pfister and Bradbury, 1996; Andrew et al., 2002). According to historical records kept by the Mexican National Fisheries and Aquaculture Institute (INAPESCA), this fishery began in 1970 as Japanese divers taught Baja Californians to harvest red sea urchin. When the fishery started there were no management strategies, nor processing plants for the roe (Palleiro-Nayar, 1982, 2013), and the lack of regulations lasted for over 20 years. The first official regulations emerged in 1993, and consisted on limited effort (one diver per vessel), fishing seasons based on reproductive peaks (closed from March to July each year), exclusive fishing areas, total allowable permits, fishing logs, minimum urchin density for fishing sites, minimum legal harvest size (80 mm and up) based on unpublished reproduction studies (Tapia, 1986; Ruiz et al., 1987), and even individual catch quotas. All these regulations, but the quotas, have been kept in place since, with little or no modifications. The fishery management plan was published in DOF (2012), and more recently the NOM-007-SAG/PESC-2015 (DOF, 2015) incorporates the prohibition of night diving and allows a maximum of 5% under legal size urchins; also, the purple sea urchin harvest was included. Catch quotas were abandoned around 1996 due to under reporting and difficulty to track individual quotas (Palleiro-Nayar, 2013). Although this is one of the most important fisheries in Baja California, with revenues that range from 1.2 to 4.2 million dollars a year (Palleiro-Nayar, 2013), efforts to assess the condition and dynamics of harvestable stocks have been focused on certain harvested areas, with infrequent or no fisheries independent data for all fishing areas (Palleiro-Nayar et al., 2011, 2012; Palleiro-Nayar, 2013); also, information on Baja California’s red sea urchin population recruitment is lacking. Moreover, the information has been analyzed as yearly summarized data that represent small geographic areas that obscures the actual status of the different harvested populations. Although the fishery was officially considered as overfished (Jurado-Molina et al., 2009; Palleiro-Nayar et al., 2011, 2012), it lacks a stock assessment analysis to evaluate its current status. The present study incorporates all available information to re-analyze the last 19 years of the fishery, in order to assess total population trends, fishing effort, and catches. Main findings attempt to provide an integrated tool for better managing this important fishery.
Materials and Methods
Catch/landing data were requested through Mexico’s National Transparency Platform1. Database contained harvest date, whole red sea urchin catch in kg, landing site and number of vessels used for fishing. Number of vessels was considered equal to number of divers because regulations allow one diver per vessel only. An unstructured interview of all permit holders was conducted to gather information on latitude/longitude of fishing areas that were plotted and delimited to red sea urchin depth range and maximum dive depth reported by urchin divers (5–30 m). All information was grouped based on landing site (14 sites total) distributed along Baja California’s Pacific coast (Figure 1). In order to better understand and describe fishing effort and avoid duplicating fishing days, effective fishing days were counted for each permit holder per site, so that in any given month the minimum and maximum number of days fished were between 1 and 31 (depending on each month) (Supplementary Table S1). Effort was then calculated using the reported number of vessels/divers and effective fishing days on each site. CPUE was calculated as tons of whole red sea urchin per diver per effective fishing day. All daily data were summarized in monthly and yearly data for each site.
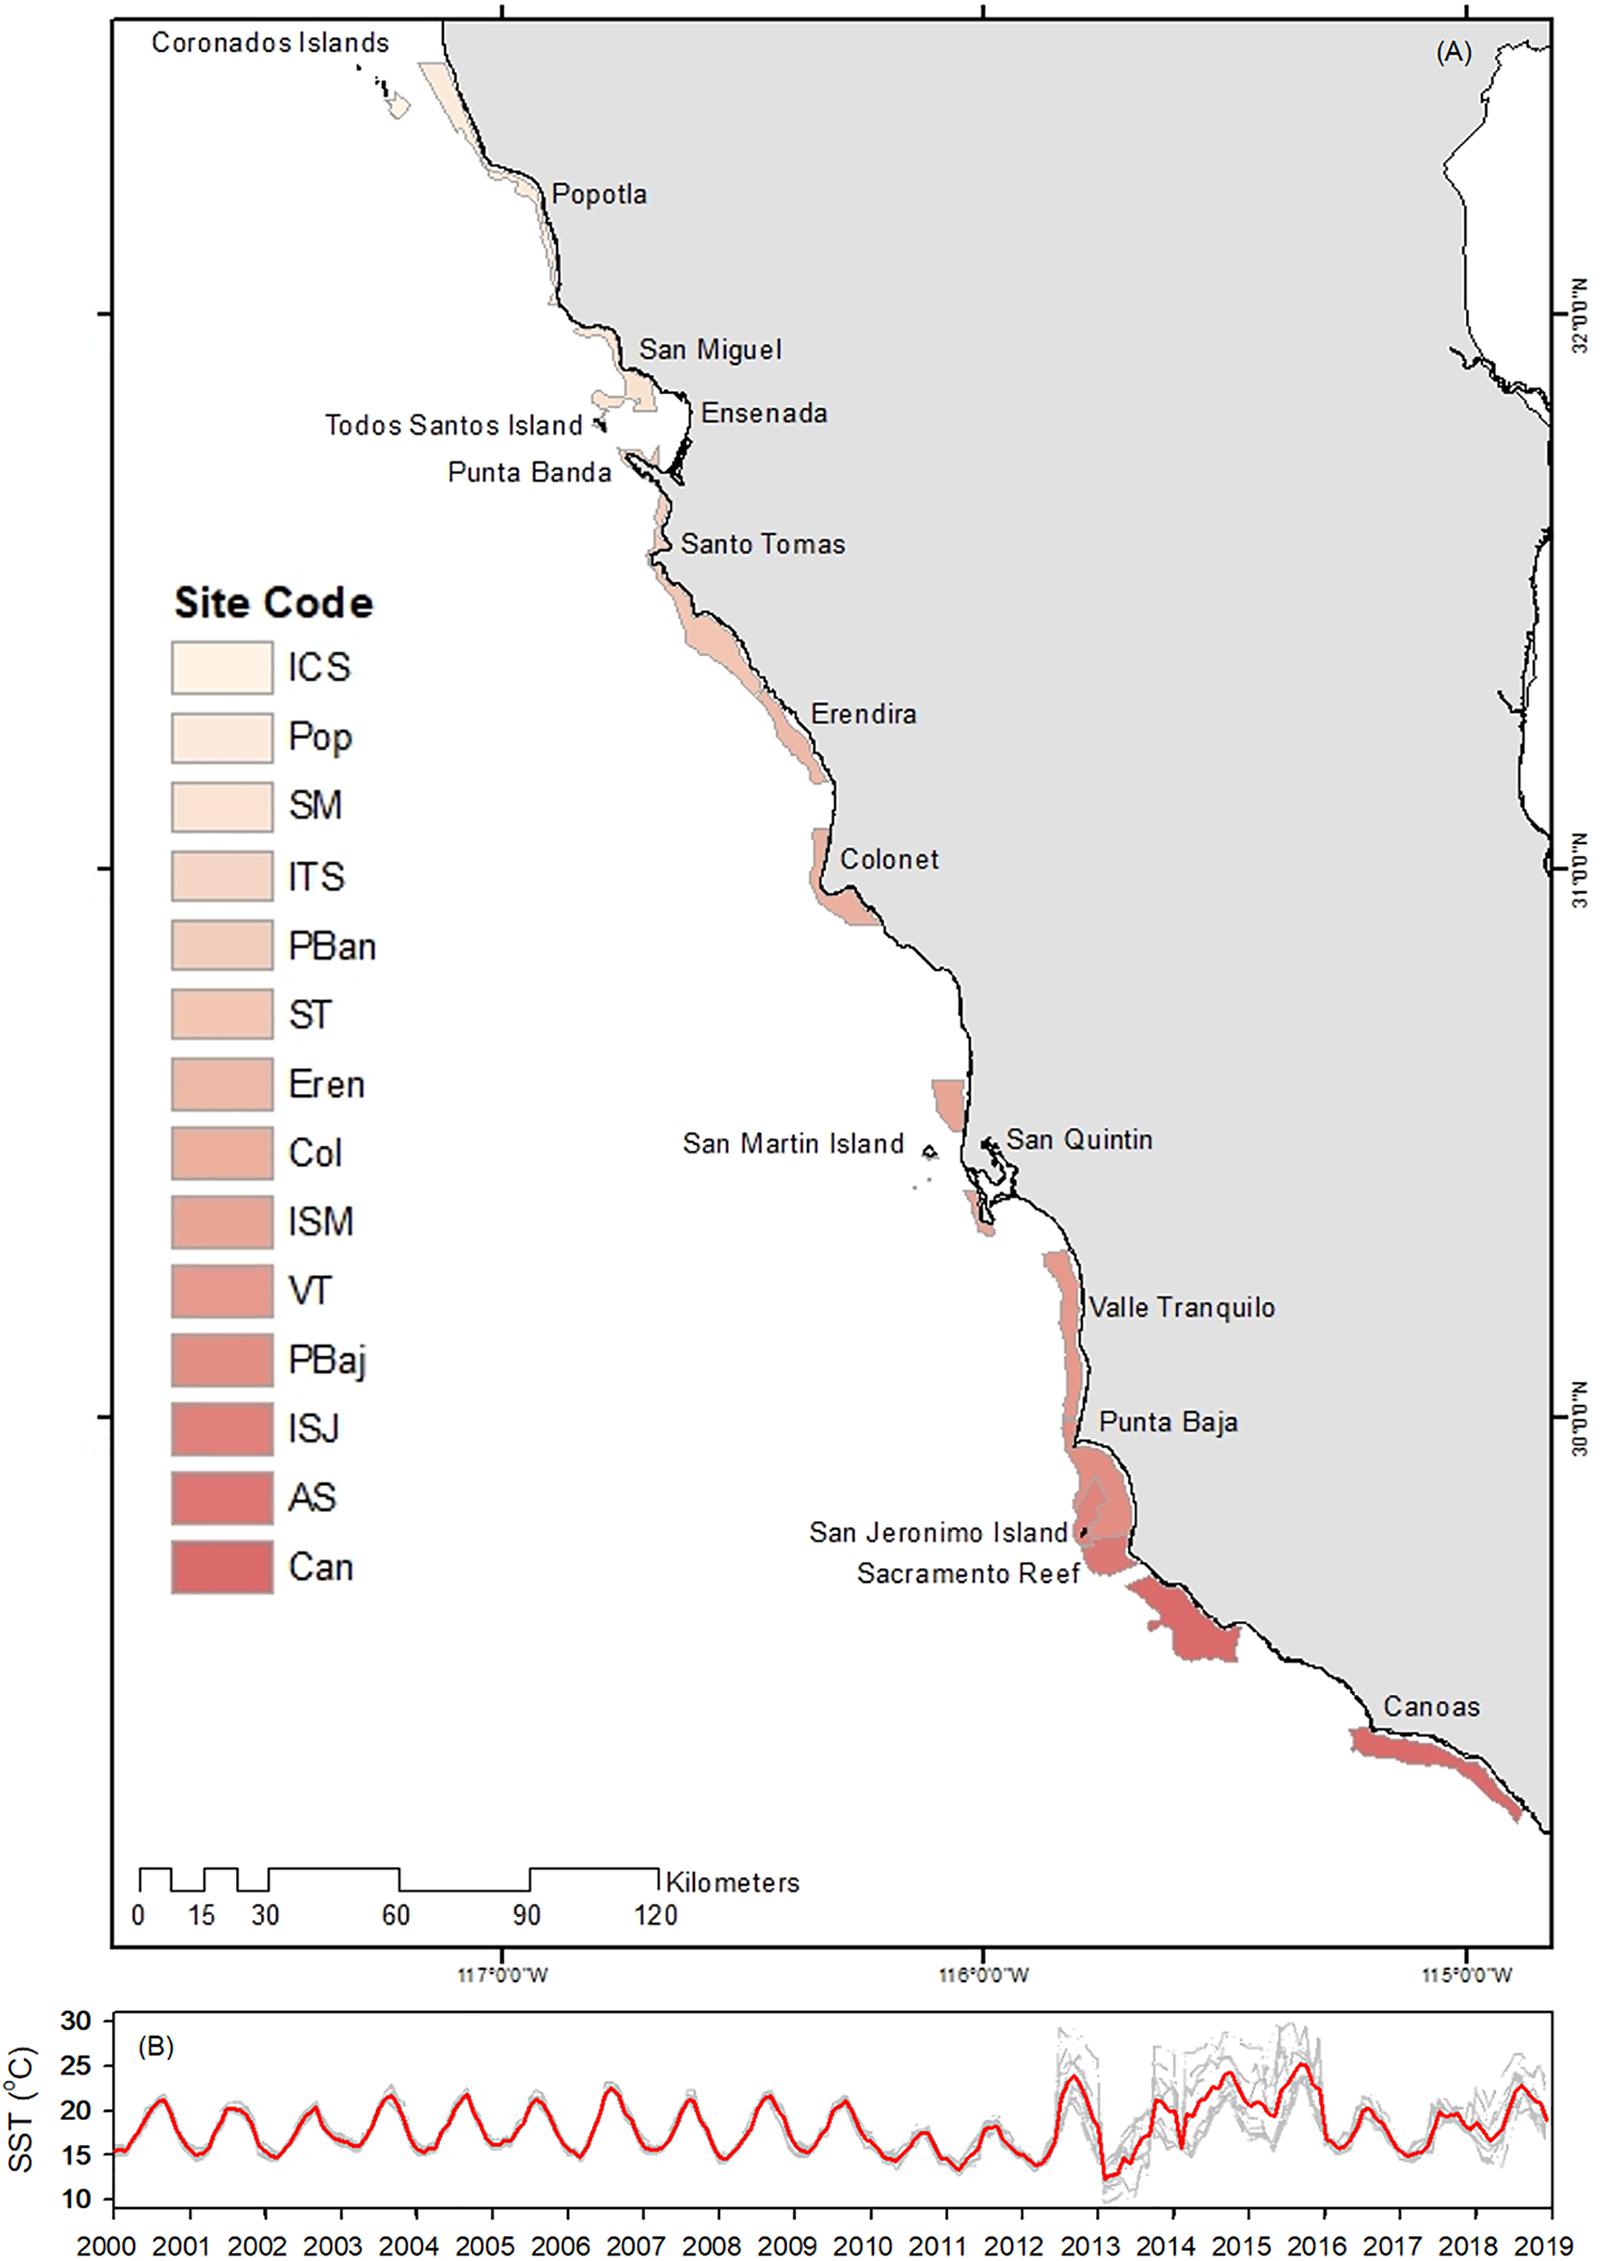
Figure 1. Depth delimited authorized fishing areas for red sea urchin (A), and SST time series profile (B) for each site (gray line) and average (red line). The color bars were used to separate sites only. Sea surface temperature was used to estimate natural mortality. Note the wide variations among sites in SST from 2012 to 2018.
Information on catch size structure and percentage of under legal catch was gathered from government public records (Sea Urchin Management plan; DOF-17-Abr-13), for the 2000–2010 fishing seasons, and was used to estimate the percentage of catch corresponding to legal (>80 mm) and sub legal (<80 mm) red sea urchins for seasons 2011–2018. Catches of sub legal sized urchins were estimated using average values based on official records of catch samplings at processing plants and permit holder plant surveys (Supplementary Figure S1).
Weight at length data of red sea urchins sampled at a processing plant was used to transform Catch/landing data to number of red sea urchins per ton:
where N is the estimated number of red sea urchins in one ton of catch, and w is the average weight (in grams) for each size class.
Length information from plant surveys was used to perform site-specific LVPA (Jones, 1981, 1984; Punt et al., 2013) to calculate the numbers by length-class using the formula:
where NLi is the number of urchins at length Li, C1–2 is catch in numbers between lengths L1 and L2, L8 and k are growth parameters for individuals in the population and M is the rate of natural mortality.
Natural mortality was estimated for each site using Pauly’s (1980) equation:
where L8 and K are growth parameters for individuals in the population and T is temperature (in°C). We used site-specific sea surface temperature data (Figure 1B; T ≥ 9.6 ≤ 18.10 ≥ 29.9°C), based on monthly multisensory SST time series for 2000–2018 (4 km pixel, daylight at 11 μ; from sensors AVHRR, MODIS Terra, MODIS Aqua and VIIRS Suomi-NPP). Images were processed in SEDAS (7) following Kahru et al. (2015) and Kahru et al. (2012) criteria. L8 and k growth parameters used in both estimations where based on Rogers-Bennett et al. (2003), and varied depending on urchin size (L∞ ≥ 134.56 ≤ 139.90 mm, and k ≥ 0.033 ≤ 04.38). Fisheries independent information on size structure for 9 sites for 2003, 2005, and 2006 were taken from Palleiro-Nayar et al. (2012), and was used as template to group VPA size class data into four size classes: Recruits (≥ 7 ≤ 37 mm), juveniles (≥ 42 ≤ 52 mm), sub-adults (≥ 57 ≤ 77 mm), and adults (≥80 mm). NLi was later transformed into biomass (BLi):
where ZL1,L2 is the total mortality for each length interval calculated with:
where FLi is fishing mortality for each length interval estimated using:
Sub adult and adult biomass estimations were considered the spawning stock biomass, whereas adult biomass was considered the harvestable biomass (HB), and the sum of each size class biomass for each year corresponded to the population biomass. Fisheries independent information was not included in the LVPA to avoid unrealistic catch of size classes that are not being taken by the fishery.
Biomass estimations for all sites and all size classes were used to calculate harvestable, spawning stock and population biomass proportion to maximum sustainable yield ratio (B/BMSY); overall and site specific fishing mortality to fishing mortality at MSY ratio (F/FMSY) was also calculated. To establish overall and site-specific harvestable, spawning stock and population biomass trends, B/BMSY and F/FMSY ratios were integrated into Kobe plots using KobePlot Ver (2019) software V5.
We calculated site-specific harvest rate (HR) as a percentage of the catch adult biomass estimates:
where B80,site corresponds to biomass estimations for the >80 mm size class per site, and Ctsite is the site specific catch.
Each site depth delimited fishing area was measured and red sea urchin preferred substrate area was calculated based on Palleiro-Nayar et al. (2011; Supplementary Table S2), coupled with site specific results to estimate sea urchin density:
where Nsite, size is the number of urchins estimated for each size class and dFasite is the depth/preferred substrate delimited fishing area in m2.
All results where geo-referenced and coordinates were randomized within each fishing area; randomization of latitude was limited by northern and southern fishing area coordinates, while longitude randomization was limited by the 5 and 30 m isobaths.
Results
Red sea urchin total annual catches at the beginning of the time series (2000) were 2,200 tons, and remained below 2,000 tons from 2001 to 2008. From 2009 on, catches increased around 2,700–3,000 tons, and peaked in 2013 with 3,215 tons. Catches dropped to 989 ton in 2016, the lowest catch recorded for the 19-year period, and remained at low levels (Figure 2). Catches of sublegal size urchins were very high from 2000 to 2002, accounting for almost 50% of the catch, they decreased gradually from 2003 onward, and increased again to 25–28% the last three years (Figure 2).
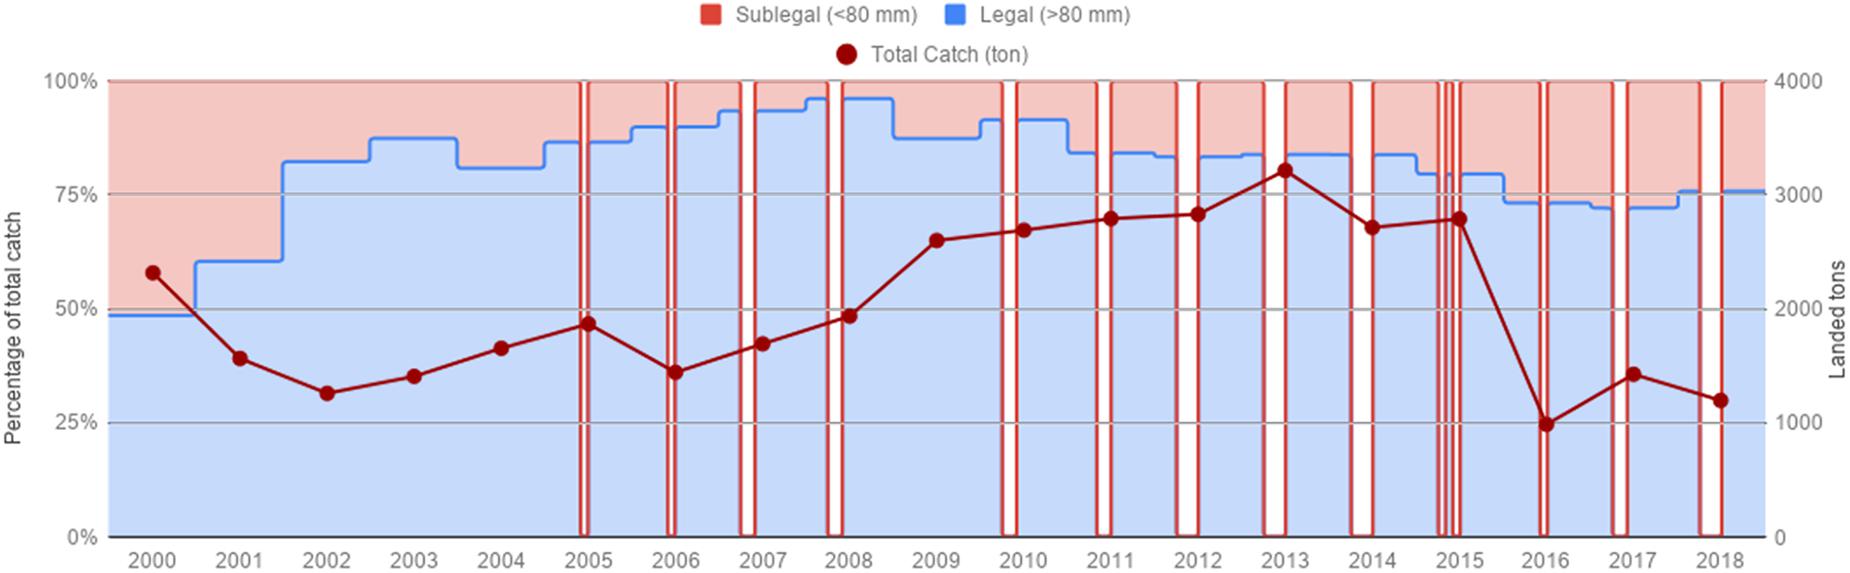
Figure 2. Total catch/landings for the red sea urchin fishery from 2000–2018. Percentage of legal and sub legal red sea urchins represent monthly catches. Gaps represent closed seasons.
During the course of the last 19 years of the fishery, the number of permit holders averaged 36.8 (max 41), with a maximum of 380 divers, accounting for 2,058 fishing days. Not all sites reported catch for the 228 months analyzed, with a minimum of 63 months for Isla San Jeronimo (ISJ) and maximum of 176 months for Punta Banda (PBan) (Supplementary Table S1). Average catch for all sites oscillated from 100–300 tons, and showed a smooth increase along the 18 years. Catch was highly variable depending on site, with highest catches, above average most of the years, at ST, PBaj, AS, and PBan. These sites showed high variability in catches during the 18 years; in contrast, lower catches were common at Isla Coronado (ICS) and ISJ, with low variability during the same period. Average catch remained below 150 tons for 2017–2018 (Figures 3A,B). Average cumulative yearly effort oscillated from 0 to 1,000 (divers per effective fishing day), with a similar decreasing trend as catch in 2016–2018. PBaj displayed the highest average effort and variability of all sites, while ICS, Isla Todos Santos (ITS), and ISJ showed the lowest average effort (Figures 3C,D). Average CPUE displayed a trend similar to that observed in average catch, with a slight increase from 2008–2016, and a sudden drop in 2017–2018 (Figure 3E). All sites displayed average CPUE values between 0.1 and 0.45 ton/diver/effective fishing day, with Col being the site with lowest average CPUE, and Pop the highest (Figure 3F).
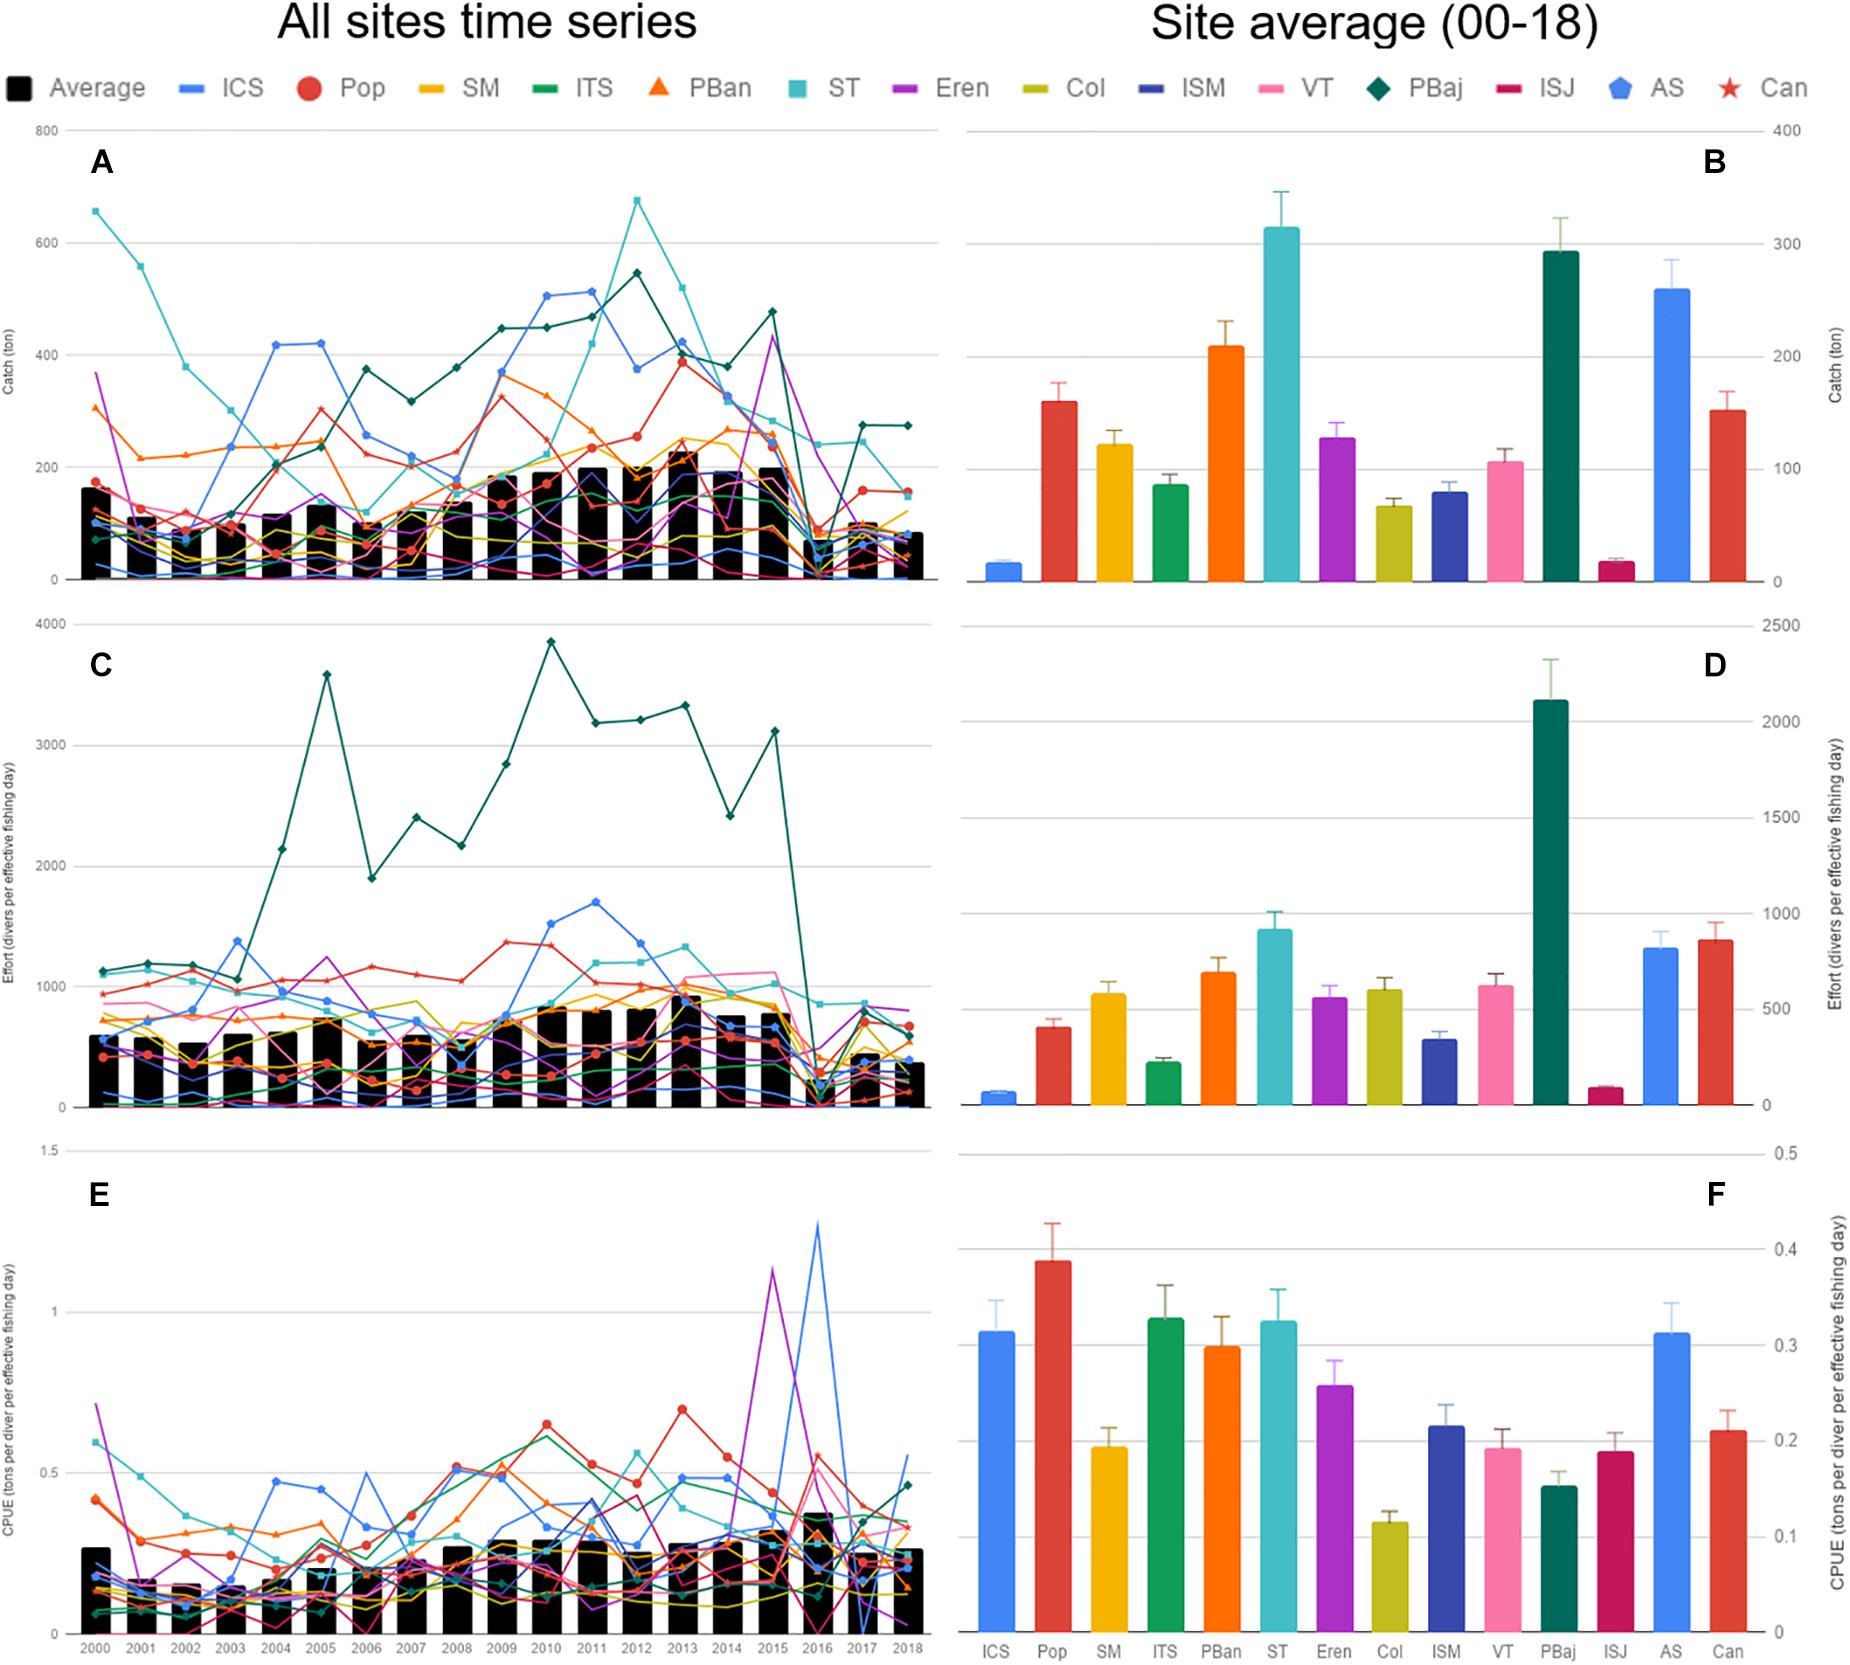
Figure 3. Average catch, effort and CPUE time series (A,C,E), and the corresponding average per site (B,D,F). Bars represent SE.
Site-specific HB estimates (urchins >80 mm) showed low values from 2000 to 2008, a subsequent period where average biomass levels increased (2009–2015), and a steep decline in 2016 at all sites; specially at PBaj where HB fell from 6,230 ton in 2015 to 115 ton in 2016 (Figures 4A,B). Two sites displayed the lowest HB values: ICS and ISJ; while four sites showed HB above 1,500 ton: PBaj, AS, ST and PBan (Figure 4B). Average HR was above 60% in 2000 and the average for the entire period analyzed was 20.43% (SE ± 0.97). Yearly HR was above 60% in almost all sites in 2000, excluding ITS and ISJ, and decreased to 20% and below throughout 2002–2015; however, all sites displayed HR above 40% for the 2016–2018 fishing seasons (excluding ICS). The lowest HR was calculated for ICS in 2006 (0.88%), while the highest HR was for Pop in 2000 (74.85%). None of the sites displayed constant HRs (Figures 4C,D).
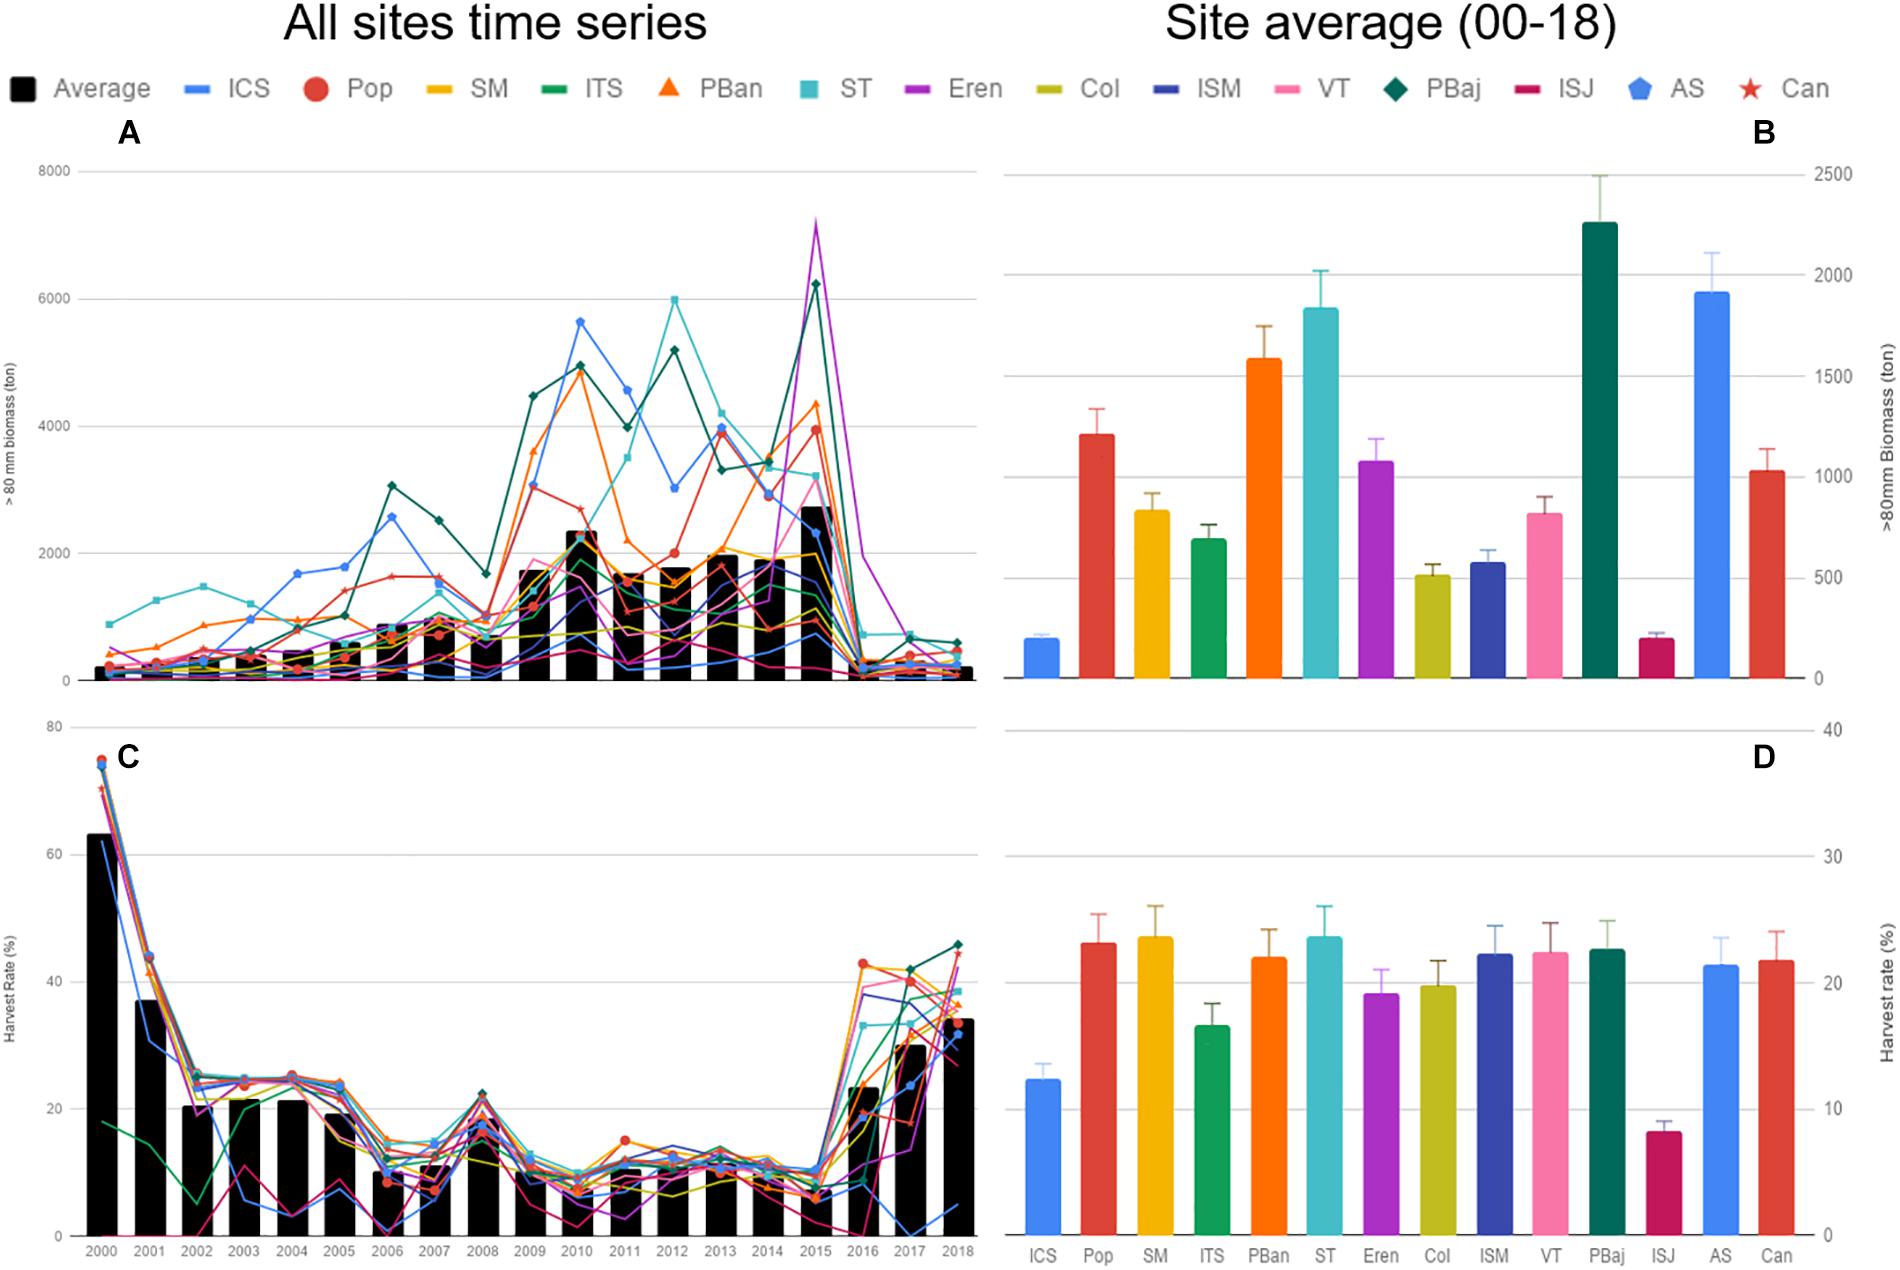
Figure 4. Red sea urchin harvestable biomass (urchins >80 mm) (A), and harvest rate (%) (C) from 2000 to 2018, and the corresponding average per site (B,D). Bars represent SE.
Average densities were below 3 urchin m–2 most of the years; densities showed a smooth increase from 2003 to 2015, and sharply declined in 2016. Densities reached 7 urchin/m2 on 2010 and 8 urchin/m2 2015 (Figure 5A). ISJ and Can showed very low average densities (under 0.5), higher values were common at Pop, ST, Eren, PBaj, and AS, just above 2 urchin m–2; only ITS and PBan presented average densities above 10 urchin m–2 (Figure 5B). A similar pattern among sites was observed with recruits (7–37 mm), juvenile (42–52 mm), and sub-adults (57–77 mm) average densities, although values among size classes differed. Recruits were more abundant (densities = 2.21 urchins m–2 ± 0.12); juveniles and sub-adult densities averaged 0.79 (±0.04) urchins m–2; and adult densities were low, with only 0.26 (±0.01) urchins m–2. We also observed a significant correlation between adult density and recruits in all sites (0.97 = r2 = 0.90, p < 0.001; Figure 6).
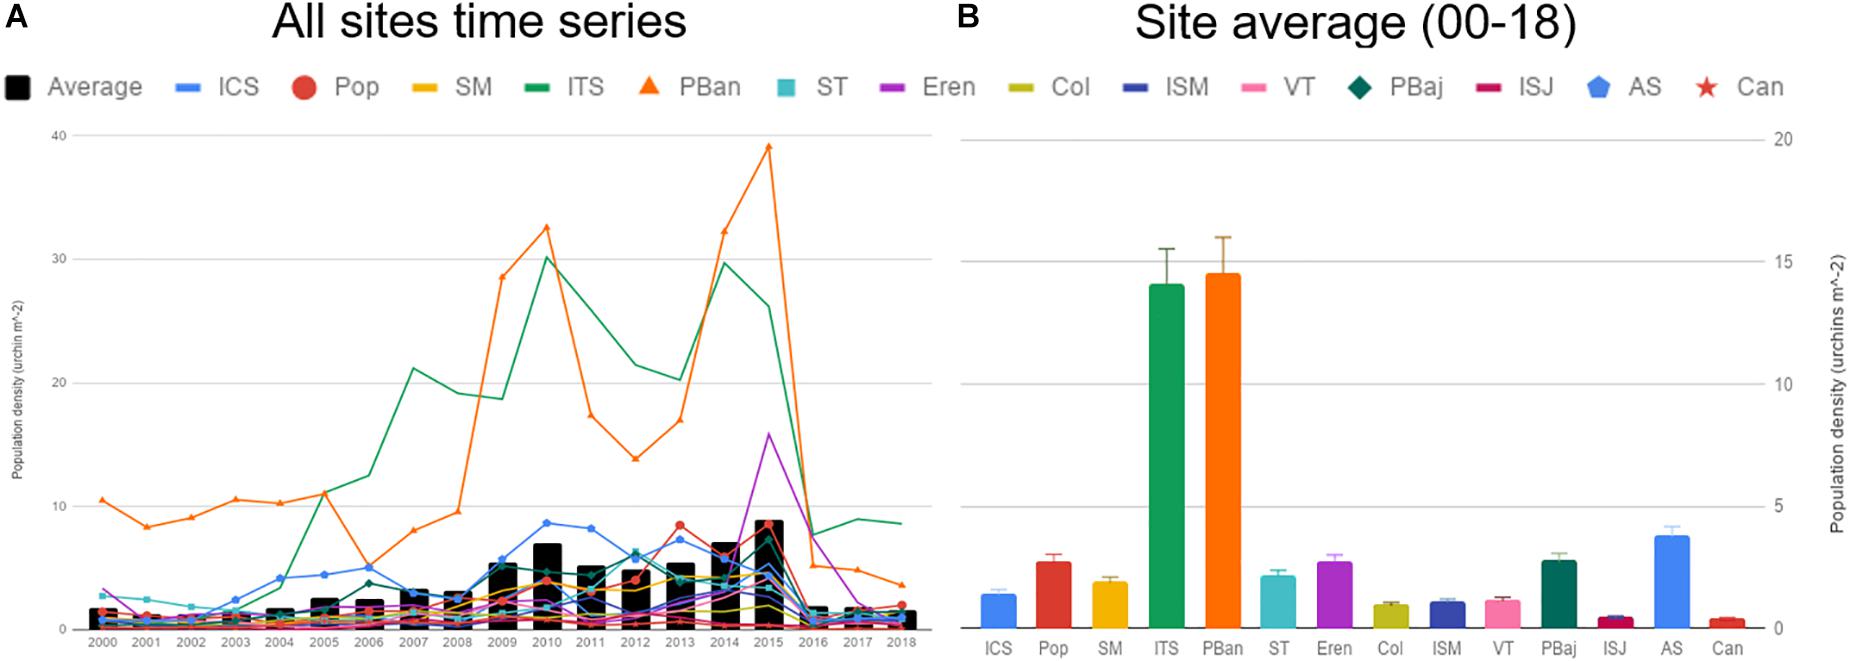
Figure 5. Average population density estimates from 2000 to 2018 (A), and 19-year site average (B).
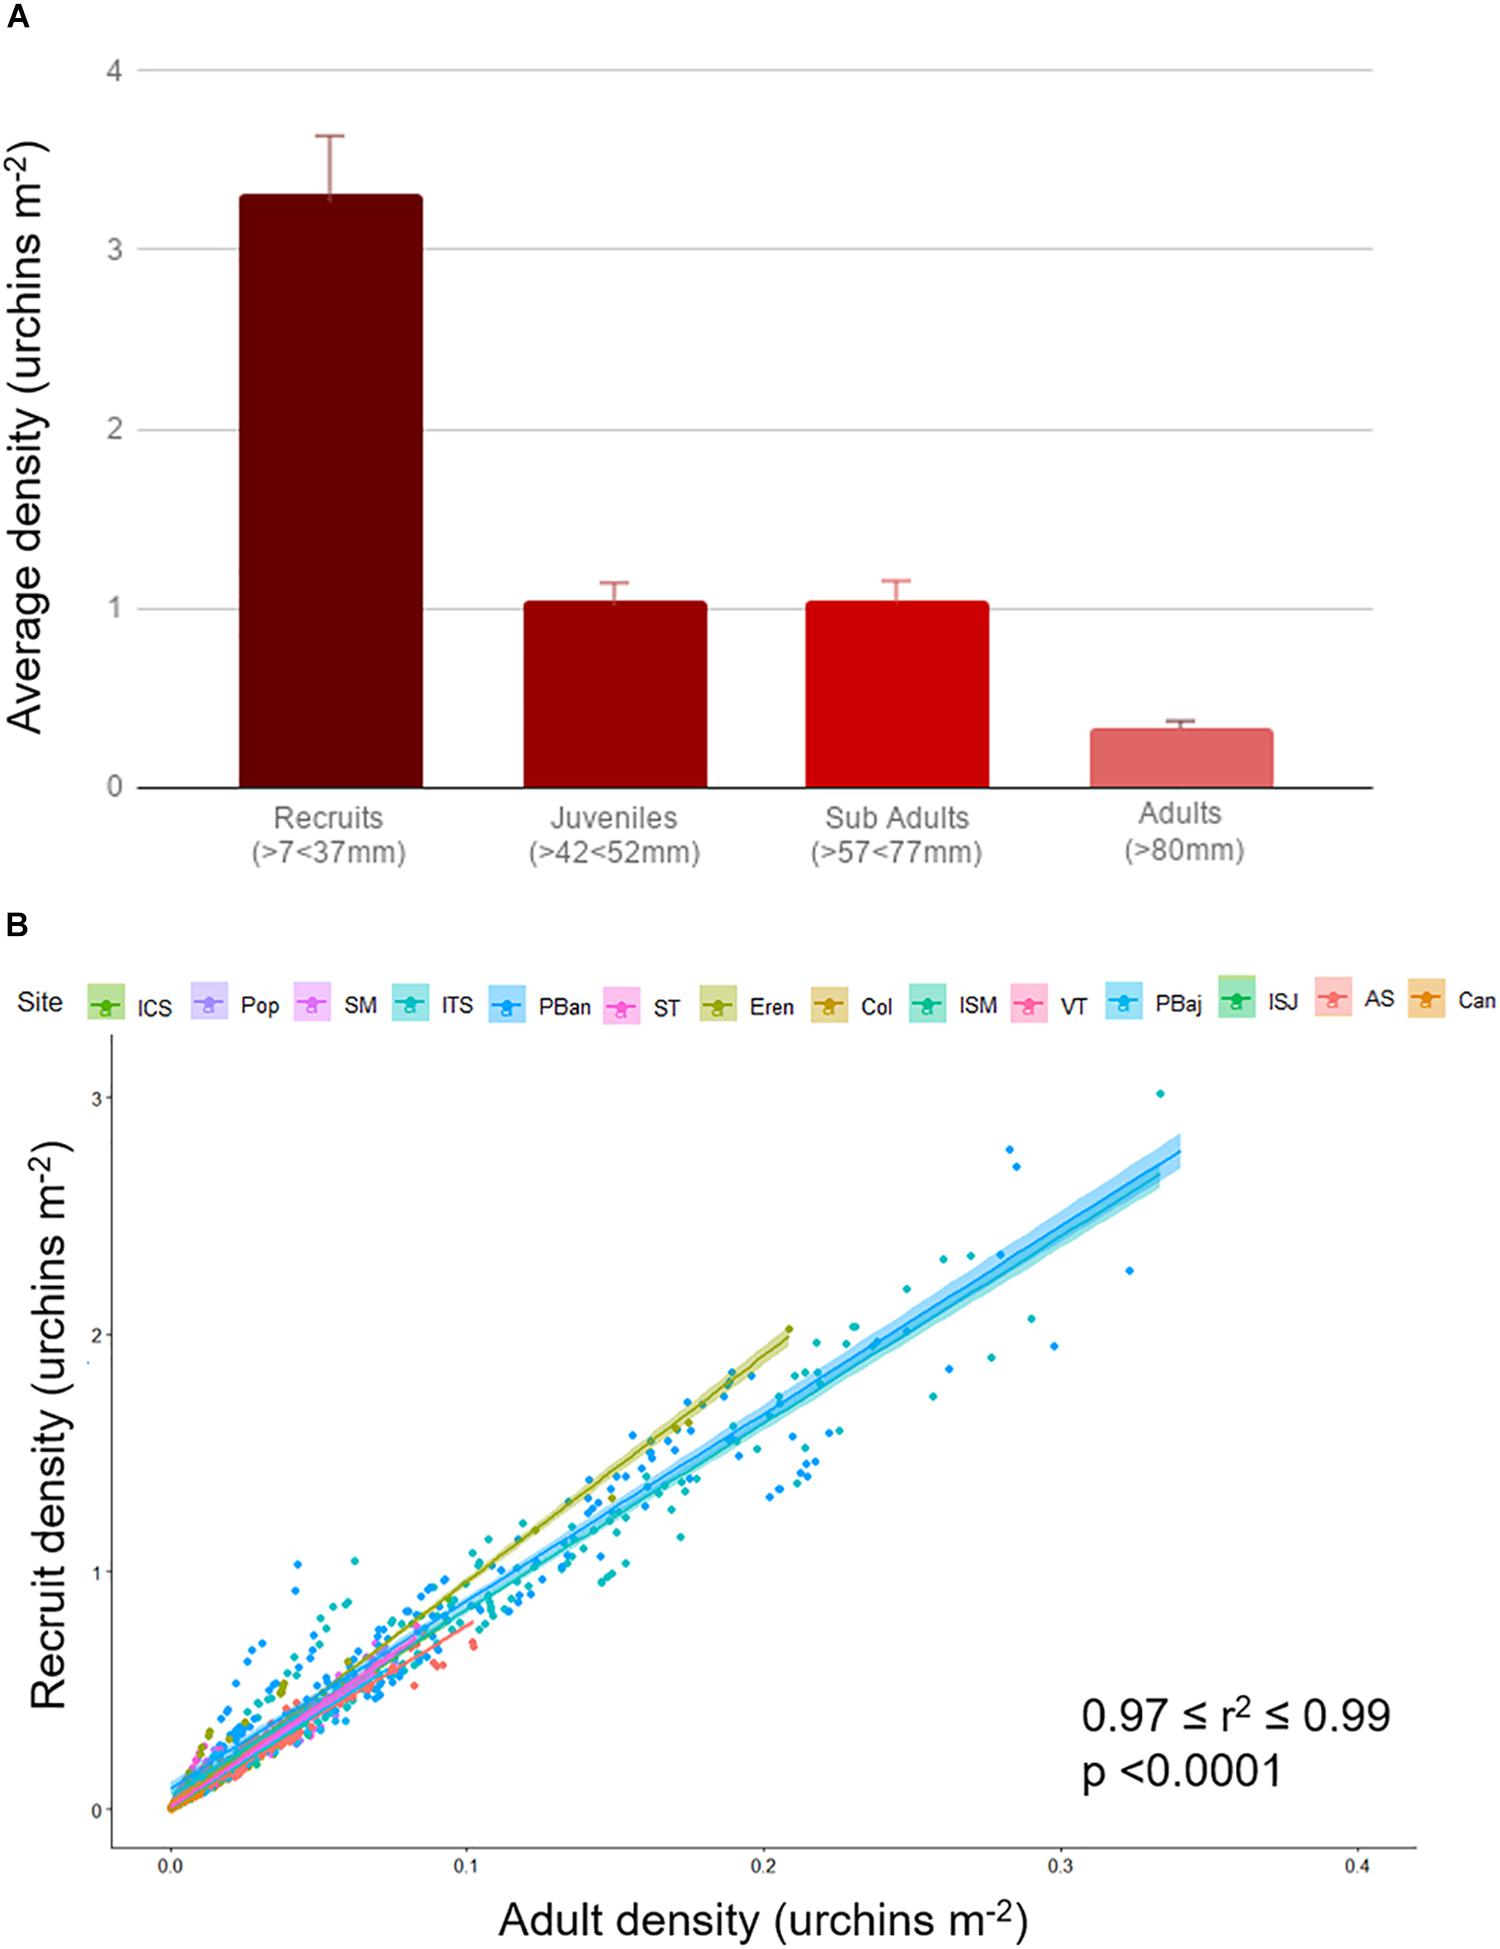
Figure 6. Average red sea urchin density (±SE) estimated by size class, 19-year data pooled (A). Recruits (7–37 mm), juvenile (42–52 mm), sub-adults (57–77 mm), and adults (>80 mm). Red sea urchin adult and recruit density relation per site (B). Data for each site contains all time series; color shade represents 95% confidence interval.
Mapping catches/landings and population density revealed the geographic overlap between areas where fishing occurs with high yields, and low average population densities, with the exception of ITS and PBan where yields and population densities were high. With this representation of catch and population densities, it was evident that large areas of Baja California display low urchin population densities, even sites that have been traditionally branded as “overrun by urchins” such as PBaj, ISJ, and AS (Figure 7).
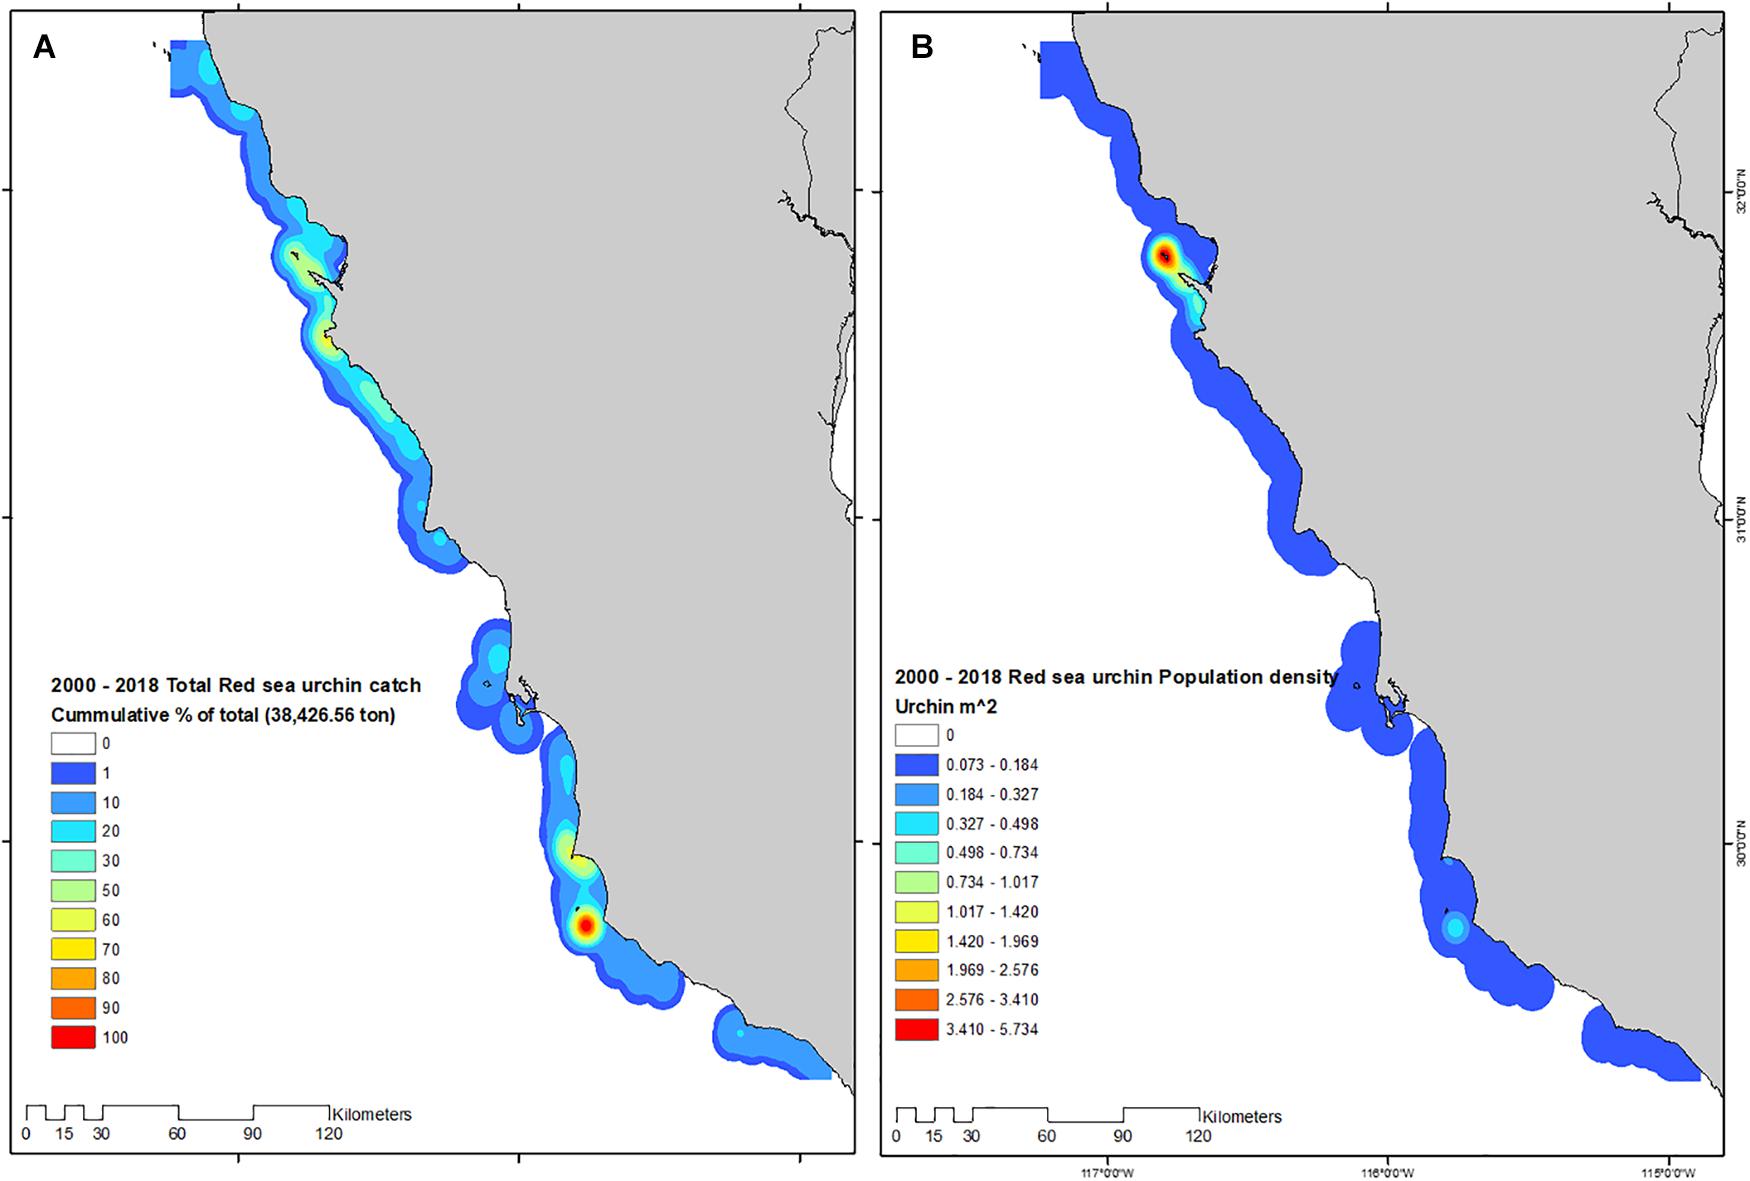
Figure 7. Total catch (A), and population density (B) estimated for the 2000–2018 red sea urchin fishing seasons.
Population biomass estimations in this study showed a decreasing trend from 1,000 ton in 2000 to a minimum of 192 ton in 2010. Official biomass estimations were at least 1,000 ton below the reported catch for each year; data were available only to 2013. Current HB estimations ranged from 3,206.38 ton in 2000 to 3,269.58 ton in 2018, with a maximum in 2015 (38,338.99 ton) and a period of high HB from 2006 to 2015 (Figure 8). Biomass estimations from this study correspond with adult density values, in such a way that both density and biomass increased from 2000 to 2010, remained high until 2015, and sharply decreased in 2016 (Figure 8).
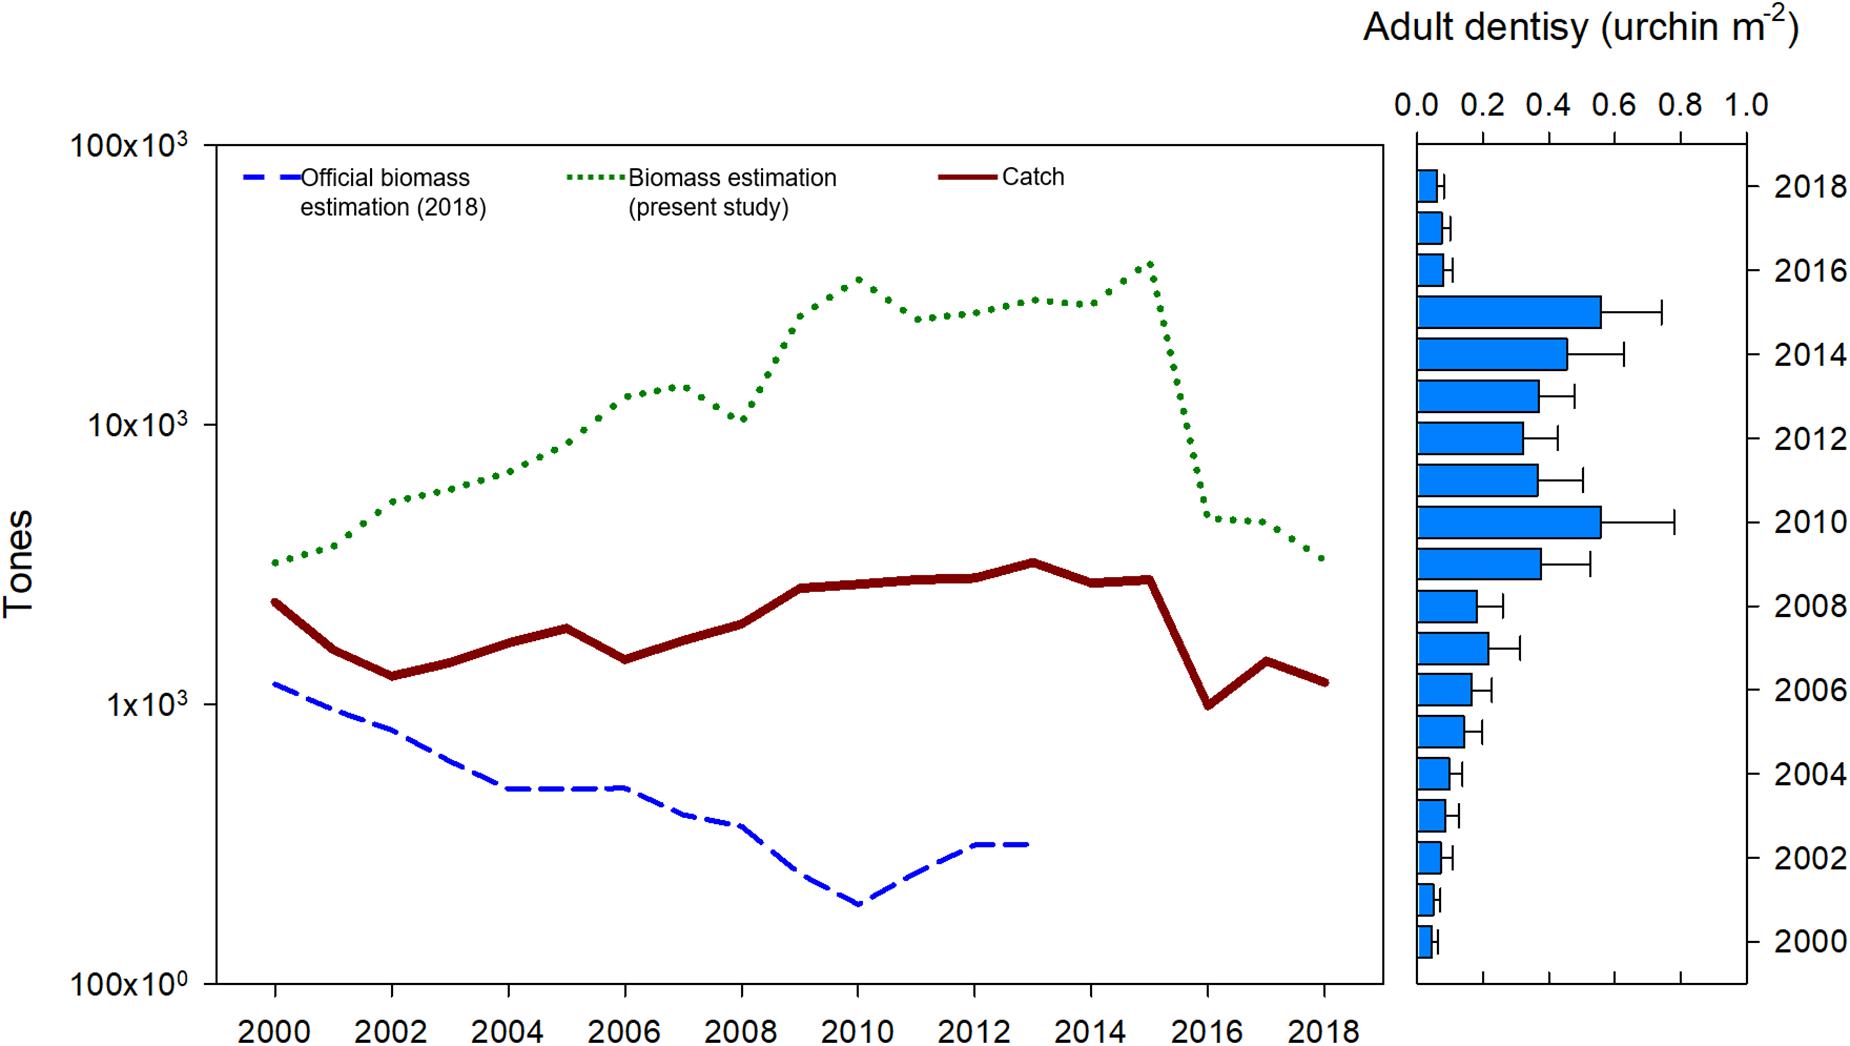
Figure 8. Official red sea urchin estimations (DOF, 2018), total catch, harvestable biomass estimations and adult urchin average density from this study.
When analyzing the fishery trajectory and population status through Kobe plots, trends in overall harvestable, spawning stock and population biomass display similar patterns. Starting in 2000, F/FMSY was below the “overfished” threshold (F/FMSY = 1), HB levels falling within “recovery” (B/BMSY < 1), while spawning stock and population biomass fell within the “safe zone” (B/BMSY > 1). The population remained in this status until 2009 when a slight increase in biomass was observed. High F/FMSY and B/BMSY ratios were observed in 2012–2013, which resulted both years above the “overfishing” threshold. After 2015, both F/FMSY and B/BMSY declined, and harvestable and spawning stock biomass returned to “recovery” levels (Figure 9).
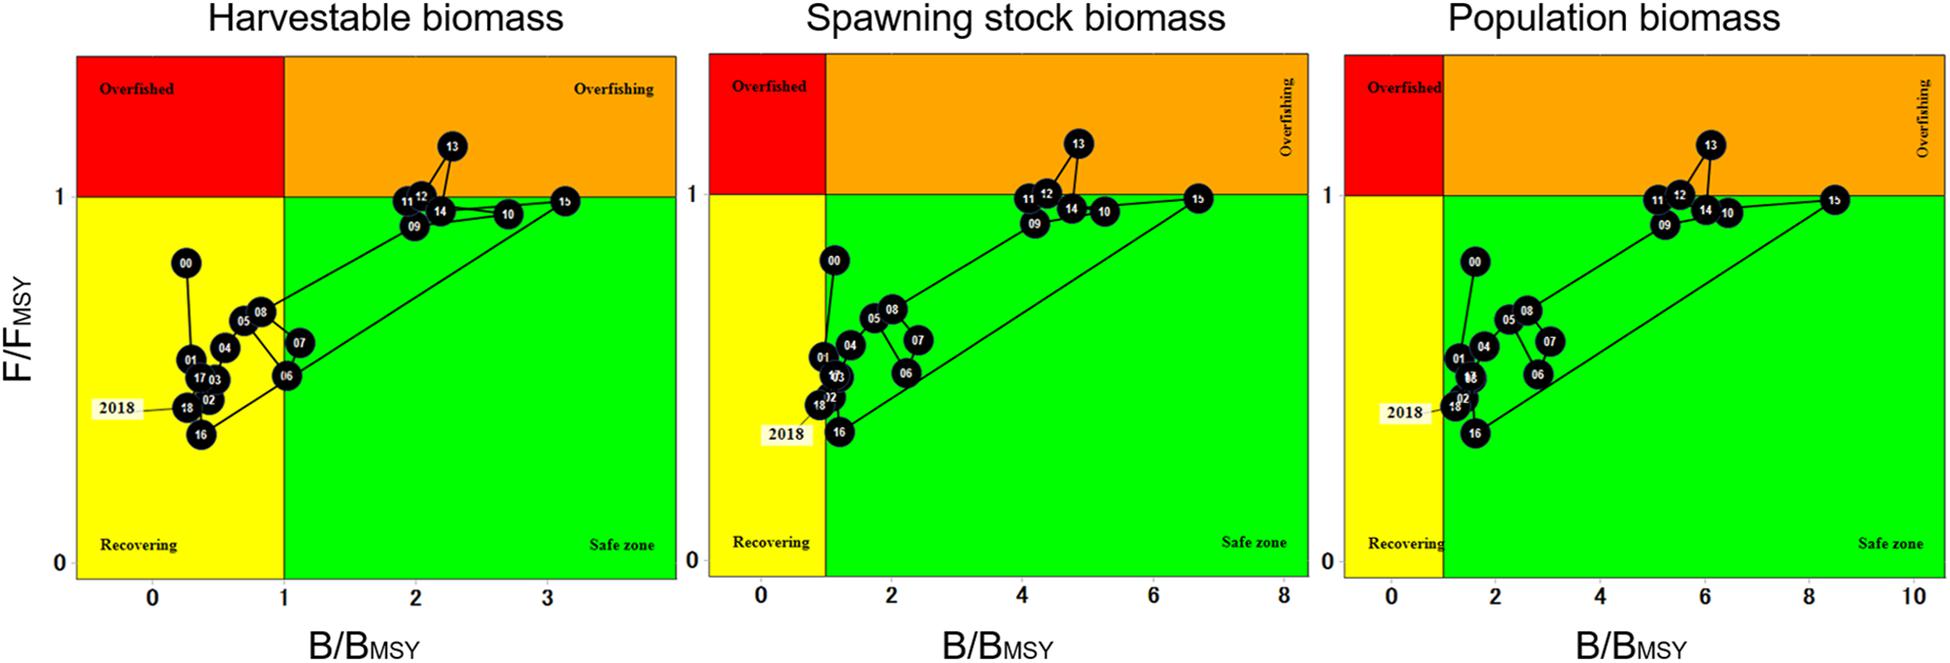
Figure 9. Kobe plots representing 19-year trend of overall harvestable, spawning stock and population biomass of red sea urchin.
Site-specific Kobe plots showed that each site displayed its own fishing mortality and biomass dynamics (Figure 10). Sites like SM, ST, and Isla San Martin (ISM) displayed F/FMSY and B/BMSY ratios that placed the fishery in overfished status for two years at SM and for several years at ISM; particularly the population at ISM remained either as overfishing or overfished most of the years, and stayed in the recovering zone for three years only (2006–2008). The population in ST displayed an overfishing status most of the years. Sites like CAN, PBan, PBaj, Pop, Ere, and VT, stayed at the safe zone several years; although these sites never reached an overfished condition, they spent several years as overfishing. ITS, ISJ, AS, and ICS remained within the recovering and the safe zone all years, and no overfishing occurred at these sites during the analyzed period, except ICS that experience overfishing one year only. The population at Col stayed in the recovering zone 18 years, and at the safe zone one year only. By 2018, most sites showed a recovering status, except SM and ISM that returned to the overfished zone (Figure 10).
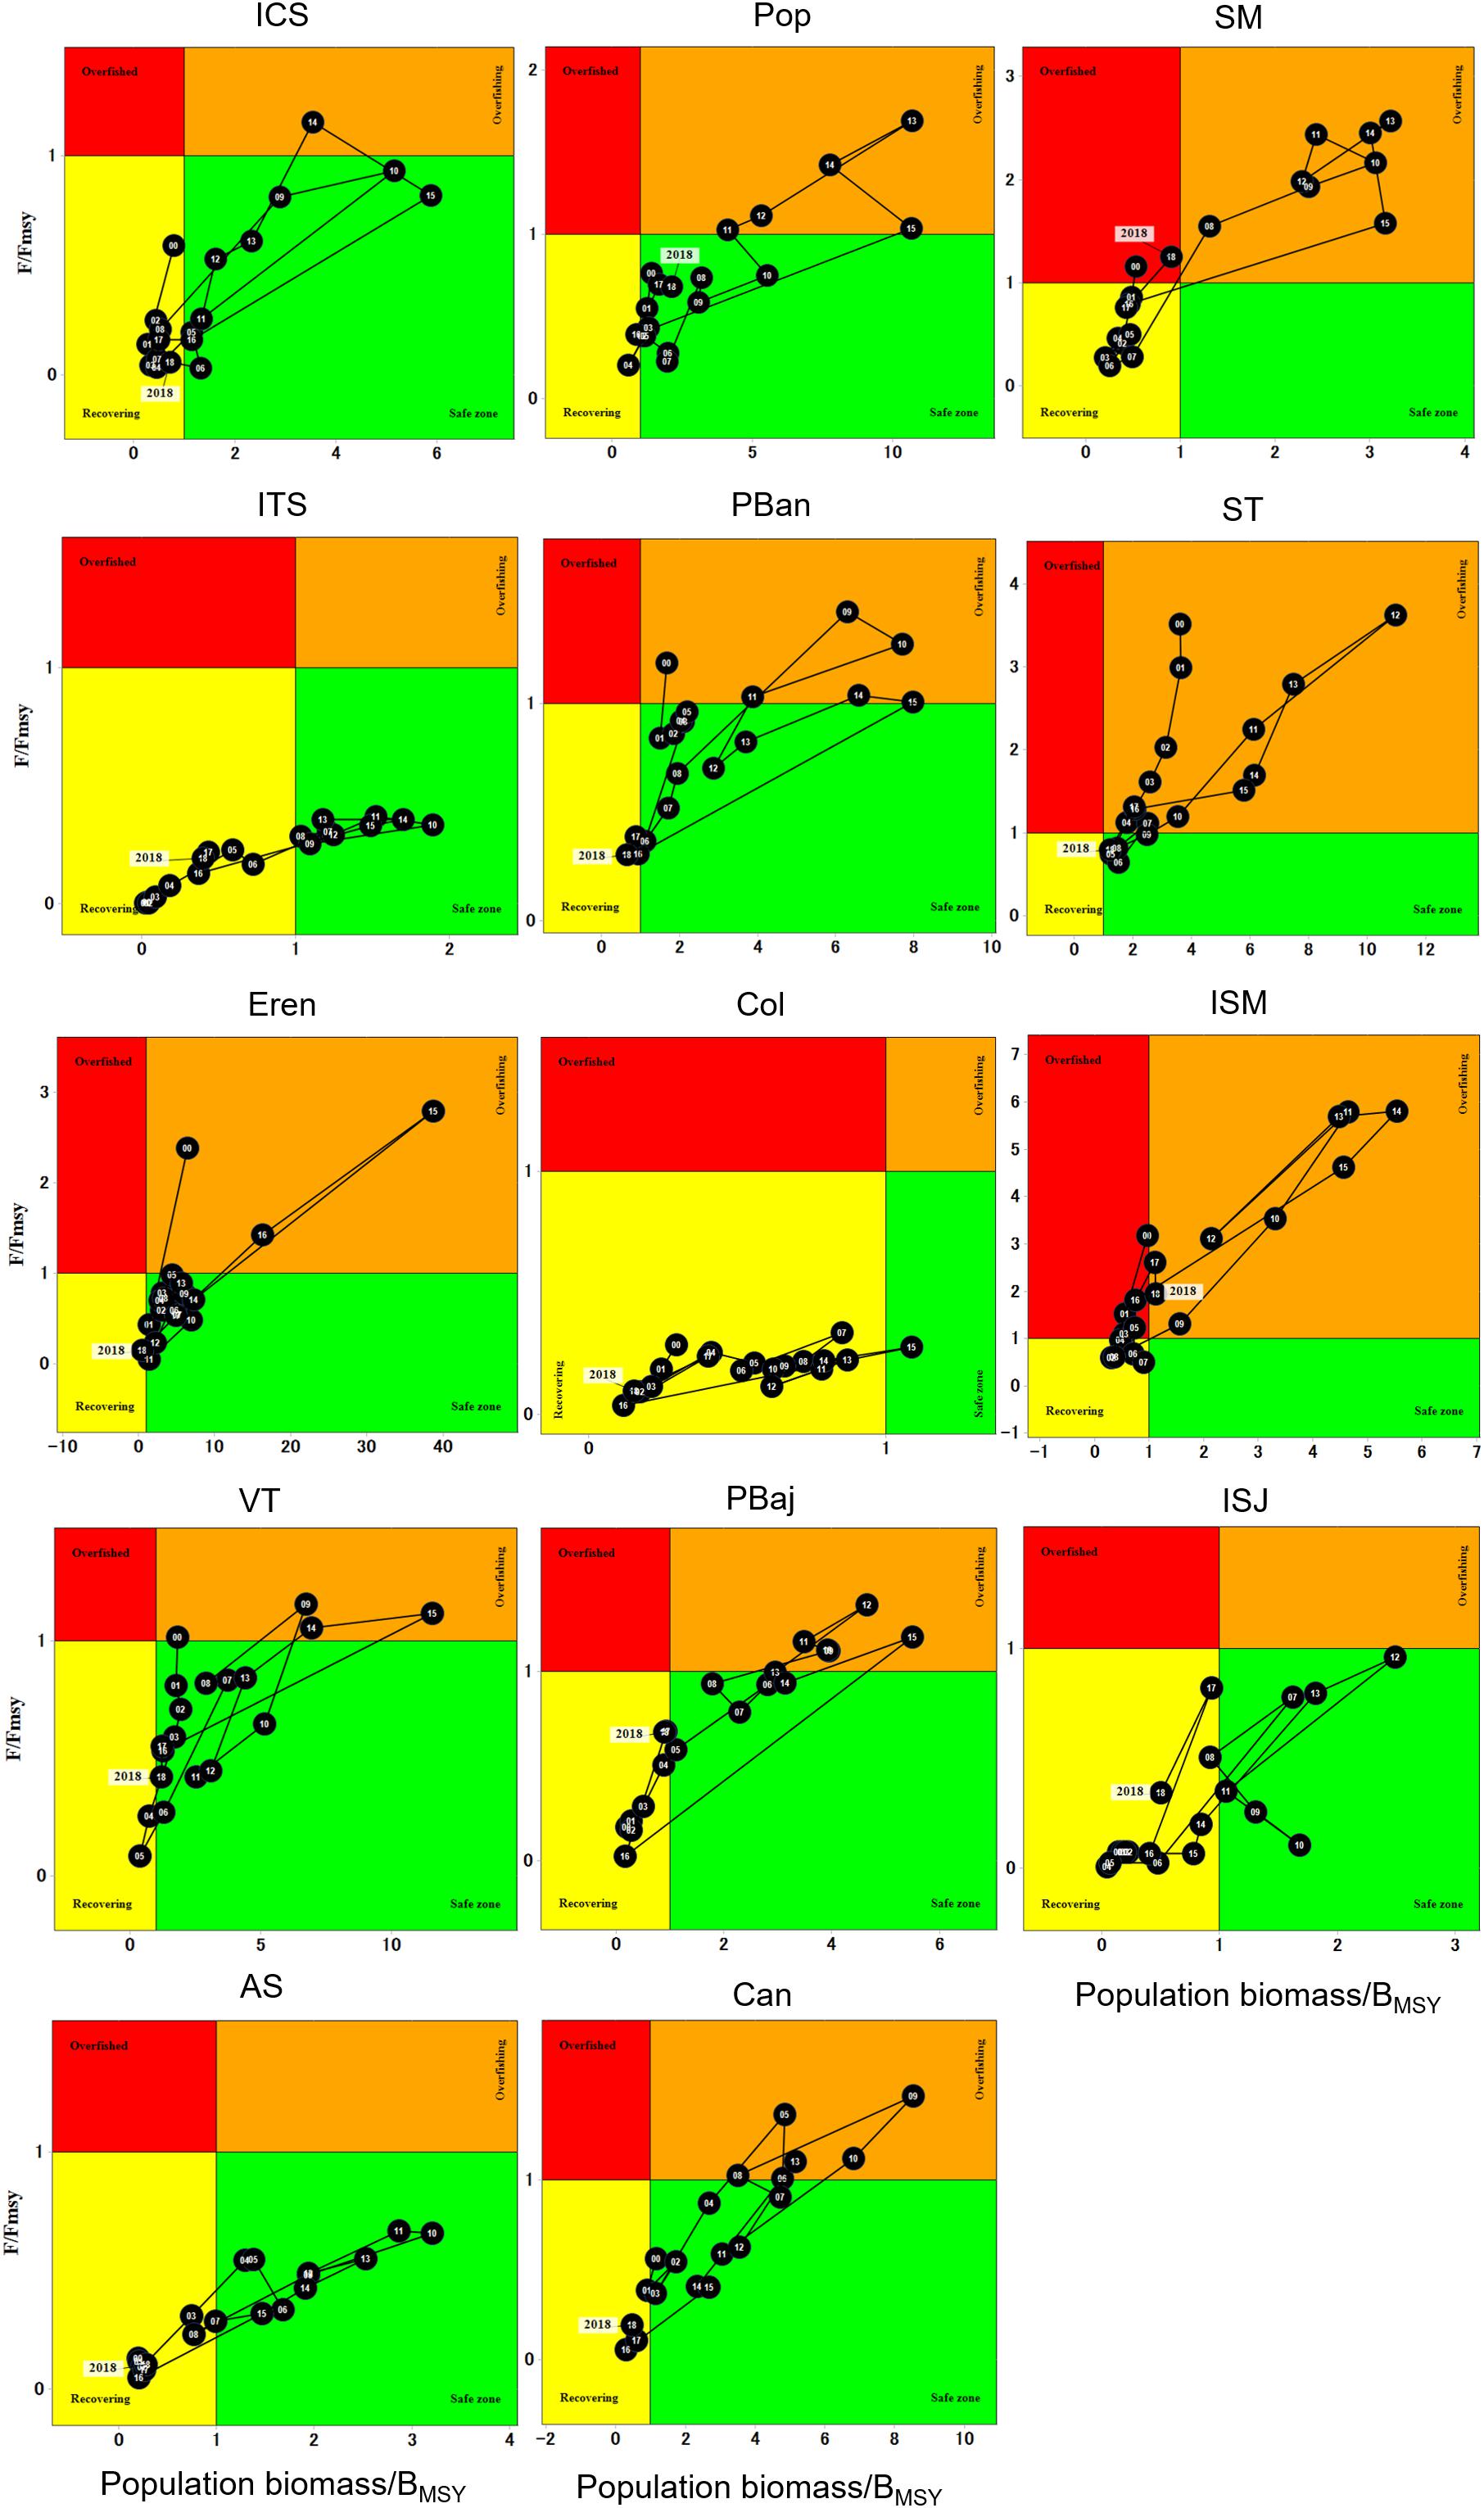
Figure 10. Site-specific Kobe plots for red sea urchin population biomass.
Discussion
Red sea urchin catches/landings for the 2000–2018 seasons varied widely within and between areas. Observed variability could be related not only to urchin availability but also to number of permit holders operating in each area, fishable days due to weather conditions, divers’ willingness to work and endurance, co-op internal agreements, and market conditions. These variability patterns have also been observed in northern and southern California (Kato, 1972; Kato and Schroeter, 1985; Kalvass and Hendrix, 1997; Morgan et al., 2000; Kalvass and Rogers-Bennett, 2001; Andrew et al., 2002; Schroeter et al., 2009), as a result of a combination of intense fishing, a series of strong El Niño periods, and difficult marketing conditions (DeWees, 2004). Time span analyzed in this study included data from the 2014–2016 highly anomalous years produced by “The Blob” and El Niño (Bond et al., 2015; Schiermeier, 2015; Whitney, 2015). SST data suggest different responses to these events depending on site location; this source of site dependent environmental variability was included in the analysis when calculating red sea urchin natural mortality.
This is the first attempt to introduce “high resolution” CPUE estimates, compared to the ones used to manage Baja California’s fishery. Historically, CPUE has been calculated as kg of urchin/day, since official records lack information about the number of dives performed by each diver on a working day, as well as the time spent diving. The lack of detail information accounted for an unreal effort measurement (e.g., official records report effort ≈1,700 days in 2000, which would require 4.6 years to achieve). The present study calculated 105 fished days for the same year (2000) because we included only the days that fishermen actually harvested; yet, a better effort measurement is still needed, such as diving hours per diver, as well as harvest location. This information is key to ensure a reliable CPUE as indicator to provide information on spatial distribution, fishing effort and success, as well as red sea urchin abundance and size (DFO, 2016). Internal agreements within and between permit holders, as well as market status, should also be considered given that in an exploited system the behavior of the harvesting sector may be equally important determinant to predict management options (Wilen et al., 2002), and biological outcomes.
Virtual Population Analysis are excellent for looking at the history of long lived organisms; length – based VPAs are often used to assess stocks of marine resources where age – related information is scarce or species are hard to age (Punt et al., 2013), with the assumption of a steady state and average conditions over time (Gulland and Rosenberg, 1992). However, the use of site specific natural mortality, intrinsic growth rate, and daily catch and effort values may provide some light in determining the impact of fishing mortality on site specific stocks, and thus separating the contributions of natural and fishing mortalities to the total mortality, by maximizing the possible variation in fishing mortality (Gulland, 1987). LVPA analysis implemented in this study produced biomass estimations that double previous estimates from other authors (Ramirez-Felix and Manzo-Monroy, 2004; Jurado-Molina et al., 2009) whose results are based on Schaefer’s biomass static/dynamic model, official catch and CPUE data (as total annual values), and fixed intrinsic growth rate (r). We suggest that such biomass estimations and maximum carrying capacity (K) of 24,465 ton, are applicable to harvestable size sea urchins (>80 mm) only, attributable to the use of total annual catch and CPUE data. In addition, both parameters used in Shaefer’s model have a specific relation that “force” the biological behavior of the assessed population to be short lived, fast growth or slow growth long lived species . This parameter relation may produce biomass estimates that do not necessarily reflect red sea urchin biological traits as a long lived, fast growing species with no decrease in reproductive potential with increasing age (no senescence; Ebert, 2008); thus, producing biomass estimations that could not support reported catch levels. LVPA allowed the inclusion of fishery independent information on size class frequencies, urchin size and site dependent k, M and temperature values, that in turn resulted in estimates that better reflect overall population biomass, and not only HB. It also allowed us to estimate red sea urchin densities for the whole 19-year time series, even reflecting in situ measurements conducted by Palleiro-Nayar et al. (2012). Fisheries independent information was used as basis to select same size class intervals; however, data from the independent surveys was not included into the LVPA. The structure of the model integrates all data as “catch” and results reflect unrealistic catch of length classes that are off limits to the fishery (minimum legal size >80 mm). This method can be a powerful tool for assessing red sea urchin population and fishery status. Moreover, when revising the Beverton–Holt life-history invariants of our parameters (specifically , where M is natural mortality and k is individual growth rate from growth models), estimates fall within what has been estimated for 123 marine species by Prince et al. (2015), with average values of = 1.89 (SE ± 0.051). It is important to note that Prince et al. (2015) did not include echinoderms in their 123 species meta-analysis.
Results from this study allowed identifying the specific sites where population attributes (biomass, densities), fishery data (catch, effort), and the combination of both (Kobe plots), suggest that urchin populations may need attention. Sites such as SM, ST, and ISM have remained at an overfishing status for several years (>8), and overfished (SM and ISM). This condition can be due to the combination of high catches, high mortality rates, and high effort during several years, and the resulted decline of HB and densities. In contrast, AS, ISJ, ITS, and Col never showed signs of overfishing during the 19 years. Results also allowed identifying more productive sites from those with low productivity; for example, ST presented similar average catches, effort, and adult biomass than AS; yet, the population at ST has been overfishing for 14 years, whereas the one at AS has never been either overfishing nor overfished. The same contrast was evident with SM and VT.
Consistent settlement/recruitment may partially mitigate for fishery removals, as is the case for Southern California (DeWees, 2004). Intense harvest may temporary deplete local HB without an effect on population recruitment, since red sea urchins are broadcast spawners which larvae remain pelagic for a period of 2–4 months before settlement (Strathmann, 1978), so they can travel long distances (Mileikovsky, 1971; Strathmann, 1974). However, adult urchins provide protected shelter to juveniles, and this protection may greatly enhance juvenile survival rate (Tegner and Dayton, 1981; Palleiro-Nayar et al., 2011); nevertheless, an exceedingly high adult density may impose negative effect on recruitment due to competition for space and food (Zhang et al., 2011). Similar patterns of HR in different sites may reflect higher recruitment in such areas, but it is paramount to determine and measure recruitment in all sites, and to establish sites that serve as sources and sink for recruits. It is also important to mention that HR is based solely on biomass-catch ratio for legal size urchin (>80 mm, or HB), and is sensitive to changes in biomass; if the available HB is high and catches do not reach the same levels, HRs will be low (as seen in Figure 4 from 2002 though 2015). High HRs are observable when HB is low and catch is high relative to that biomass (2006–2018, same Figure 4). However, for this latter period, fishing effort and fishing mortality drops, HB is also low but catches are high (relative to the HB), producing high HR. Our results show a high degree of selectivity over urchins bigger than >80 mm; however, not all sites displayed high densities of recruits (>7 <37 mm). Higher densities of recruits were only observed constantly at ITS and PBan (sites with also high adult densities). Management strategies should be implemented in all sites where juvenile, sub adult and adult urchin densities fall below 4 urchins m–2; densities under 1–3 urchins m–2 could hinder red sea urchins recruitment and reproductive success (Levitan et al., 1992; CDFG, 2001), as well as limit settlement of new recruits to the population and fishery.
Site specific and overall densities for red sea urchin population showed to be heavily skewed toward size classes smaller than 80 mm due to the established legal minimum size limit. This pattern is also observed in areas of British Columbia where red sea urchin populations are subject to high sea otters (Enhydran lutris) predation, where a rapid non-linear decrease in urchin size with otter occupation time is observed (Stevenson et al., 2016). Baja California’s red sea urchin divers are as effective in removing specific size classes of urchins as sea otters. In the absence of otters, spiny lobsters (Panulirus interruptus), California sheephead (Semicossyphus pulcher), sun stars (Pycnopodia helianthoides) and rock crabs (Cancer spp.), became red sea urchins predators (Kato and Schroeter, 1985). The extent, to which this predation may contribute to specific size class decrease in densities and biomass in Baja California, is not determined yet.
Information on geo-referenced catch, biomass and densities will contribute to a better understanding of the dynamic of the red sea urchin population and fishery in Baja California. Data generated with GPS tracking technology may allow determining changes in time and space of fishing hotspots, important to design “tailored” management strategies. This kind of technology has been applied in monitoring the sea urchin fishery of Galicia (Fernández-Boán et al., 2013), where CPUE did not exhibit a significant trend throughout the fishing season, but catch per area and area covered per unit of diving time were inversely related, indicating that fishers stay longer in high density patches, that may result in localized depletion.
Furthermore, permit holders have started translocation programs (Sepesca Bc, 2016) to “enhance recruitment” and roe yeild. Yet, these programs are far from addressing key ecological and population issues that could arise from trans locating red sea urchins.
Kobe plots have traditionally being used in the tuna fisheries managed by the International Commission for the Conservation of Atlantic Tunas (ICCAT), where scientific advice within the Regional Fisheries Management Organizations (tRFMOs) is based on the Kobe advice framework, requiring a stock assessment, estimates of reference points and projections. Advice is based on low risk of fishing mortality exceeding FMSY and biomass falling below BMSY (Kell, 2011, 2016). For the red sea urchin fishery, these phase plots allowed to identify not only the sites that have been overfished for several years, but also to discern the years when the decline in biomass might be linked to causes different from fishing (years where F/FMSY < 1 and B/BMSY < 1). We propose that the decline in 2016–2018 is the aftermath of the 2012–2016 highly variable period, where temperature variations increased due to the anomalous oceanographic conditions. Kobe plots for the red sea urchin fishery should be adopted in order to evaluate the consequences of different harvest scenarios, management strategies, or separate changes in biomass due to fishing from natural variation.
Recommendations
Populations that have been overfished for several years need management actions oriented to promote its recover. ICS, ITS, ISM, and ISJ were declared Biosphere Reserve in 2016, so the red sea urchin population in its adjacent marine area needs to be managed appropriately to ensure its recovery.
Based on our findings, we propose that although there might be an apparent decline in the overall population (e.g., ICS, ST, ISM, where average site densities are below 1 urchin m–2), juvenile red sea urchins (>42 <52 mm) contribute with recruits to the fishery as they grow and larvae (recruits) to the population every year. We found that the most important size classes in the red sea urchin population of Baja California were juveniles (≥42 ≤52 mm) and sub adults (≥57 ≤77 mm), which should not be harvested until they reach >80 mm. This becomes more important for those sites where most of the population consists of these size intervals and few adults of harvestable size (all sites except for ITS and PBan). In addition, based on the relation between adult density and recruitment (for spawning and sheltering recruits) we propose establishing a maximum size limit of 110 mm TL; this measure would ensure the protection of larger spawners which contribute a disproportionately high proportion of recruits.
Translocation of urchins has not been properly evaluated. While our results might suggest that such translocations may not have an impact on a population level, removing red sea urchins may clear areas for purple sea urchin to colonize, reducing suitable areas for red sea urchins to settle and leaving juveniles unprotected from predation. In addition, impacts of hyper aggregation of red sea urchins on kelp forests in Baja California are yet to be assessed.
Although biomass estimations are important for the red sea urchin fishery, based on its biological and ecological characteristics, we recommend tracking changes in adult density rather than biomass levels. Tracking changes in biomass for this species may result in biased decision making linked to high or even low values of biomass; it also sets the mind of fisher folk and managers in regards to the availability of red sea urchin linked to a specific area. Estimating red sea urchin density per site is a key indicator of population health and should be considered above any other assessment method. To this end, we propose that changes in fisheries data reporting and processing are necessary; current fisheries logbook for red sea urchin does not allow detailed analysis and may obscure key information. This new fishing log must include precise geographic locations, time spent by divers allocated independently for each dive in a day, and number of urchins harvested per dive (rather than kilograms). In addition, fisheries independent surveys must continue, as means to track changes in the population that might not be so apparent when observing only catch data. All the suggested information and analysis won’t put extra cost on permit holders or fishermen; these changes are thought to improve management, maintain an important fishery worth average two million dollars and preserve a key species of the kelp forest ecosystem.
Data Availability Statement
All datasets generated for this study are included in the article/Supplementary Material.
Author Contributions
AM-O: project lead, data analysis, data base procurement and curation, result processing, and manuscript elaboration. GM-M: Ph.D. lead adviser, manuscript revisions, and data analysis. CA-F: Ph.D. adviser, fisheries model fine tuning, and manuscript revisions. ES-D-A: Ph.D. adviser, sea surface temperature data processing, and manuscript revisions.
Funding
We would like to thank CONACyT for granting the scholarship No. 165841 to conduct this research.
Conflict of Interest
The authors declare that the research was conducted in the absence of any commercial or financial relationships that could be construed as a potential conflict of interest.
Acknowledgments
We would like to thank CONAPESCA and SEPESCA BC for all help provided. Special thanks to Dr. Julio Palleiro–Nayar whose life long labor with red sea urchins in the region inspired this work, and M.Sc. Nadia Olivares for her input, review and help during the preparation of this document. We also thank Ocean. Artemio Rodriguez and all red sea urchin permit holders and fisher folk for openly sharing their information and knowledge, and to all directly and indirectly involved in this research, thank you.
Supplementary Material
The Supplementary Material for this article can be found online at: https://www.frontiersin.org/articles/10.3389/fmars.2020.00167/full#supplementary-material
Footnotes
References
Andrew, N. L., Agatsuma, Y., Ballesteros, E., Bazhin, A. G., Creaser, E. P., and Barnes, D. K. A. (2002). Status and management of world sea urchin fisheries. Oceanogr. Mar. Biol. Annu. Rev. 40, 343–425.
Bond, N. A., Cronin, M. F., Freeland, H., and Mantua, N. (2015). Causes and impacts of the 2014 warm anomaly in the NE Pacific. Geophys. Res. Lett. 42, 3414–3420. doi: 10.1002/2015GL063306
CDFG (2001). California’s Living Marine Resources, A Status Report. Red Sea Urchin. Available online at: https://www.wildlife.ca.gov/Conservation/Marine/Invertebrates/Sea-Urchin-Work-Products (accessed September 20, 2016).
DeWees, C. M. (2004). “Sea urchin fisheries, a California perspective,” in Sea Urchins, fisheries and ecology. DEStech Publications, eds J. M. Lawrence and O. Guzman, Lancaster, 37–55.
DFO (2016). “Assessment of the Green Sea Urchin Fishery in the Northern Estuary and Gulf of St. Lawrence in 2015,”in DFO Canadian Science Advisory Secretariat Science Advisory Report 2016/054. Ottawa, ON: Fisheries and Oceans Canada.
DOF (2012). Acuerdo Por el Que se da a Conocer el Plan de Manejo de Erizo rojo Strongylocentrotus Franciscanus y erizo Morado Strongylocentrotus Purpuratus en la Peninsula de Baja California. In Spanish. Available online at: www.dof.gob.mx/nota_detalle_popup.php?codigo=5282909 (accessed January 10, 2013).
DOF (2015). Norma Oficial Mexicana NOM-007-SAG/PESC-2015. Para Regular el Aprovechamiento de las Poblaciones de erizo rojo y Morado en Aguas de Jurisdicción federal del Océano Pacifico de la Costa Oeste de Baja California. In Spanish. Available online at: http://dof.gob.mx/nota_detalle.php?codigo=5397876&fecha=24/06/2015 (accessed June 24, 2015).
DOF (2018). Acuerdo por el que se da a conocer la actualización de la Carta Nacional Pesquera. Erizo Rojo. In Spanish. Available online at: http://dof.gob.mx/nota_detalle.php?codigo=5525712&fecha=11/06/2018
Ebert, T. A. (2008). Longevity and lack of senescence in the red sea urchin Strongylocentrotus franciscanus. Exp. Gerontol. 43, 734–738. doi: 10.1016/j.exger.2008.04.015
Ebert, T. A., Barr, L. M., Bodkin, J. L., Burcham, D., Bureau, D., Carson, H. S., et al. (2018). Size, growth, and density data for shallow-water sea urchins from Mexico to the Aleutian Islands. Alaska, 1956–2016. Ecology 0, 1–1. doi: 10.1002/ecy.02123
Fernández-Boán, M., Freire, J., Parma, A. M., Fernández, L., and Orensanz, J. M. (2013). Monitoring the fishing process in the sea urchin diving fishery of Galicia. ICES J. Mar. Sci. 70, 604–617. doi: 10.1093/icesjms/fss207
Gulland, J. A. (1987). “Length–based methods in fisheries research, from theory to application,” in ICLARM Conference Proceedings, eds D. Pauly and G. R. Morgan, Safat, 335–342.
Gulland, J. A., and Rosenberg, A. A. (1992). “A review of length-based approaches to assessing fish stocks,” in FAO Fisheries Technical Paper. No. 323, Rome: FAO.
Jones, R. (1981). “The use of length composition data in fish stock assessments (with notes on VPA and cohort analysis),” in FAO Fisheries Circular, Rome: FAO, 734.
Jones, R. (1984). “Assessing the effects of changes in exploitation pattern using length composition data,” in FAO Fisheries Technical Paper, Rome: FAO, 256.
Jurado-Molina, J., Palleiro-Nayar, J. S., and Gutierrez, N. L. (2009). Developing a Bayesian framework for stock assessment and decision analysis of the red sea urchin fishery in Baja California. Mexico. Cien. Mar. 35, 183–193. doi: 10.7773/cm.v35i2.1528
Kahru, M., Di Lorenzo, E., Manzano-Sarabia, M., and Mitchell, B. G. (2012). Spatial and temporal statistics of sea surface temperature and chlorophyll fronts in the California Current. J. Plankton Res. 34, 749–760. doi: 10.1093/plankt/fbs010
Kahru, M., Kudela, R. M., Anderson, C. R., and Mitchell, B. G. (2015). Optimized merger of ocean chlorophyll algorithms of MODIS-Aqua and VIIRS. IEEE Geosci. Remote Sens. Lett. 12, 11. doi: 10.1109/LGRS.2015.2470250
Kalvass, P. E., and Hendrix, J. M. (1997). The California red sea urchin, Strongylocentrotus franciscanus, fishery, catch, effort and management trends. Mar. Fish. Rev. 59, 1–17.
Kalvass, P. E., and Rogers-Bennett, L. (2001). “Red sea urchin. 101-104 and 560-561,” in California’s Living Marine Resources, A Status Report, eds W. S. Leet, C. M. DeWees, R. Klingbeil, and E. J. Larson, (Sacramento, CA: Deptement of Fish and Game).
Kato, S., and Schroeter, S. C. (1985). Biology of the red sea urchin. Strongylocentrotus franciscanus, and its fishery in California. Mar. Fish Rev. 47, 1–20.
Kell, L. T. (2011). A standardized way of presenting species group executive summaries. ICCAT/SCRS/2010/138, Collect. Sci. Pap. ICCAT 66, 2213–2228.
Kell, L. T. (2016). Kobe, R Tools for Tuna Management Advice. Available online at: https://rdrr.io/cran/kobe/f/inst/doc/kobe.pdf (accessed July 20, 2019).
KobePlot Ver. (2019). National Research Institute for Far Seas Fisheries. Kanagawa: Fisheries Research Agency.
Levitan, D. R., Sewell, M. R., and Chiao, F. (1992). How distribution and abundance influence fertilization success in the sea urchin Strongylocentrotus franciscanus. Ecology 73, 248–254. doi: 10.2307/1938736
Mileikovsky, S. (1971). Types of larval development in marine bottom invertebrates, their distribution and ecological significance, a re-evaluation. Mar. Biol. 10, 193–213. doi: 10.1007/bf00352809
Morgan, L., Wing, S., Botsford, L. W., Lundquist, C., and Diehl, J. (2000). Spatial variability in red sea urchin recruitment in northern California. Fish. Oceanogr. 9, 83–98. doi: 10.1046/j.1365-2419.2000.00124.x
Palleiro-Nayar, J. S. (1982). “Estimación de la densidad y crecimiento del erizo rojo Strongylocentrotus franciscanus (Agassiz) para la zona de Santo Tomás, Baja California, México,” in Tesis de Licenciatura, Universidad Autónoma de Baja California, Ensenada, 68.
Palleiro-Nayar, J. S. (2013). Benthonic Resources of Baja California, Sea Urchin and Sea Cucumber. Mexico: Instituto Nacional de Pesca, 60.
Palleiro-Nayar, J. S., Montaño-Moctezuma, G., and Sosa-Nishizaki, O. (2012). Spatial and temporal variation of the population density of the red sea urchin Strongylocentrotus franciscanus (Echinodermata, Echinoidea, Strongylocentrotidae) in Baja California. Hidrobiologica 22, 28–34.
Palleiro-Nayar, J. S., Sosa-Nishizaki, O., and Montaño-Moctezuma, G. (2011). Impact of substrate and the presence of adults on recruitment of the red sea urchin Strongylocentrotus franciscanus in Baja California. Cien.Mar. 37, 59–70. doi: 10.7773/cm.v37i1.1693
Pauly, D. (1980). On the interrelationships between natural mortality, growth parameters and mean environmental temperature in 175 fish stocks. J. Cons. Int. Exp. Mer 39, 175–192. doi: 10.1093/icesjms/39.2.175
Pfister, C. A., and Bradbury, A. (1996). Harvesting red sea urchins, Recent effects and future predictions. Ecol. Appl. 6, 298–310. doi: 10.1111/j.1749-4877.2007.00046.x
Prince, J., Hordyk, A., Valencia, S. R., Loneragan, N., and Sainsbury, K. (2015). Revisiting the concept of Beverton-Holt life-history invariants with the aim of informing data-poor fisheries assessment. ICES J. Mar. Sci. 72, 194–203. doi: 10.1093/icesjms/fsu011
Punt, A. E., Huang, T., and Maunder, M. N. (2013). Review of integrated size-structured models for stock assessment of hard-to-age crustacean and mollusk species. ICES J. Mar. Sci. 70, 16–33. doi: 10.1093/icesjms/fss185
Ramirez-Felix, E., and Manzo-Monroy, H. G. (2004). Modelling the use of two fishery access rights, concessions and licenses, in the red sea urchin, Strongylocentrotus franciscanus (Agassiz), fishery at Santo Tomas, Baja California, Mexico. Cien. Mar. 30, 547–560. doi: 10.7773/cm.v30i4.343
Rogers-Bennett, L., Rogers, D. W., Bennett, W. A., and Ebert, T. A. (2003). Modeling red sea urchin (Strongylocentrotus franciscanus) growth using six growth functions. Fish. Bull. 101, 614–626.
Ruiz, A., Herrera, D., and Castro, J. (1987). Histological Analysis and Roe Organic Productivity in the Reproductive Cycle of the Red Sea Urchin Strongylocentrotus Franciscanus (Agassiz, 1863) Echinodermata, Bachelor thesis, Echinoidea in San Miguel, Ensenada, B.C.
Schroeter, S. C., Gutiérrez, N. L., Robinson, M., Hilborn, R., and Halmay, P. (2009). Moving from Data Poor to Data Rich, A Case Study of Community-Based Data Collection for the San Diego Red Sea Urchin Fishery. Mar. Cost.Fish. Dyn. Manag. Ecosyst. Sci. 1, 230–234.
Sepesca Bc. (2016). Programa Estatal de Apoyo para el Repoblamiento de Bancos de erizo Ejercicio 2016. Secretaria de Pesca y Acuacultura del Estado de Baja California. In Spanish. Available online at http://dceg.bajacalifornia.gob.mx/Sasip/documentos/archivos/SEP1720175783351663_2.pdf (accessed December 10, 2016).
Stevenson, C. F., Demes, K. W., and Salomon, A. K. (2016). Accounting for size-specific predation improves our ability to predict strength of a trophic cascade. Ecol., Evol. 6, 1041–1053. doi: 10.1002/ece3.1870
Strathmann, R. (1974). The spread of sibling larvae of sedentary marine invertebrates. Am. Nat. 108, 28–44.
Strathmann, R. (1978). Length of pelagic period in echinoderms with free larvae from the northeast Pacific. J. Exp. Mar. Biol. Ecol. 34, 23–27. doi: 10.1016/0022-0981(78)90054-0
Tapia, O. M. (1986). “Results of Roe Sexual Maturity in Strongylocentrotus Franciscanus, Through an Annual Cycle From January 1984 to January 1985 in San Miguel”. INAPESCA Technical Report (Unpublished). Mexico: In Spanish.
Tegner, M. J., and Dayton, P. K. (1981). Population structure, recruitment and mortality of two sea urchins (Strongylocentrotus franciscanus and S. purpuratus) in a kelp forest. Mar. Ecol. Prog. Ser. 5, 255–268. doi: 10.3354/meps005255
Whitney, F. A. (2015). Anomalous winter winds decrease 2014 transition zone productivity in the NE Pacific. Geophys. Res. Lett. 42, 428–431. doi: 10.1002/2014GL062634
Wilen, J. E., Smith, M. D., Lockwood, D., and Botsford, L. (2002). Avoiding Surprises, Incorporating fisherman behavior into management models. Bull. Mar. Sci. 70, 553–575.
Keywords: red sea urchin, VPAs, fisheries, population trends, harvest rate, Mesocentrotus franciscanus
Citation: Medellín-Ortiz A, Montaño-Moctezuma G, Alvarez-Flores C and Santamaria-del-Angel E (2020) Retelling the History of the Red Sea Urchin Fishery in Mexico. Front. Mar. Sci. 7:167. doi: 10.3389/fmars.2020.00167
Received: 19 September 2019; Accepted: 03 March 2020;
Published: 24 March 2020.
Edited by:
Mercedes González-Wangüemert, University of Algarve, PortugalReviewed by:
Brett W. Molony, CSIRO Oceans and Atmosphere, AustraliaMassimiliano Cardinale, Swedish University of Agricultural Sciences, Sweden
Copyright © 2020 Medellín-Ortiz, Montaño-Moctezuma, Alvarez-Flores and Santamaria-del-Angel. This is an open-access article distributed under the terms of the Creative Commons Attribution License (CC BY). The use, distribution or reproduction in other forums is permitted, provided the original author(s) and the copyright owner(s) are credited and that the original publication in this journal is cited, in accordance with accepted academic practice. No use, distribution or reproduction is permitted which does not comply with these terms.
*Correspondence: Alfonso Medellín-Ortiz, alfonso.medellin@uabc.edu.mx; Gabriela Montaño-Moctezuma, gmontano@uabc.edu.mx