Distribution and Suitable Habitat of the Cold-Water Corals Lophelia pertusa, Paragorgia arborea, and Primnoa resedaeformis on the Norwegian Continental Shelf
- 1Department of Biological Sciences, University of Bergen, Bergen, Norway
- 2Institute of Marine Research, Bergen, Norway
Cold-water corals are habitat-forming species that are also classified as indicators of vulnerable marine ecosystems (VMEs) due to the threat of various anthropogenic impacts, e.g., fisheries and oil/mineral exploration. To best protect VMEs, knowledge of their habitat requirements and distribution is essential. However, comprehensive sampling of the deep sea is difficult due to access and cost constraints, so species distribution modeling (SDM) is often used to predict overall distributions and ecological preferences of species based on limited data. We used Maximum Entropy (Maxent) modeling to predict the probability of presence of the reef-building scleractinian Lophelia pertusa and the octocorals Paragorgia arborea and Primnoa resedaeformis using a total of 2149 coral presence points and 15 environmental predictor variables. The environmental variables used in the analysis were processed to 176 m resolution and included bathymetry, depth, geomorphometric characteristics [slope, aspect, and bathymetric position index (BPI)], oceanography (temperature, salinity, current directions, and speed), surface chlorophyll a concentration, sediment type, and marine landscape type. Comparing presence points with environmental data showed that the temperature and depth range for Lophelia was narrower compared to the gorgonians, and it occurred in shallower, warmer water. Observations showed that Lophelia had a broad, bimodal response to Broad BPI, while the predicted model indicated a more narrow response. Paragorgia tolerated the greatest range of sloping according to the model. All three species were observed with a bimodal pattern along a wide range of mean current speed, while the models indicated a high response to faster current speed. Jackknife tests showed that sediment type was an important predictor for gorgonian corals, while BPI and minimum temperature were more important for Lophelia. The spatial precision of the models could be further increased by applying environmental layers with a higher and uniform spatial resolution. The predicted distribution of corals and their relation to environmental variables provides an important background for prioritizing areas for detailed mapping surveys and will aid in the conservation efforts for these VMEs in Norwegian waters and beyond.
Introduction
Cold-water corals, including sea pen communities, gorgonian coral gardens, and coral reefs, are important providers of habitat in the deep sea. Numerous species are associated with these ecosystems, and the species richness and biomass are often orders of magnitude higher here than on the surrounding seabed (Buhl-Mortensen P. et al., 2016). Their complex three-dimensional structures may provide shelter, breeding ground, and feeding space for numerous fish, such as redfish (Sebastes spp.), tusk (Brosme brosme), ling (Molva molva), and ray species, as well as microhabitats for both sessile and mobile epifauna (Husebø et al., 2002; Costello et al., 2005; Buhl-Mortensen et al., 2010; Buhl-Mortensen, 2017). Their skeleton and tissue may also serve as host to various cryptofauna and endoparasites, e.g., crustaceans, nematodes, fungi, and sponges (Buhl-Mortensen P. et al., 2016).
The cold-water corals Lophelia pertusa (Linnaeus, 1758), Paragorgia arborea (Linnaeus, 1758), and Primnoa resedaeformis (Gunnerus, 1763) (denoted herein as Lophelia, Paragorgia, and Primnoa) are common on the Norwegian continental shelf (Buhl-Mortensen et al., 2015b). Lophelia is a reef-forming scleractinian that has received much focus within research and management due to its extent, accessibility, and its status as a flagship species for deep-sea conservation (Davies et al., 2007; Davies and Guinotte, 2011). Primnoa and Paragorgia are sea fans, which are colonies that do not form reefs but may occur in dense aggregations known as “coral gardens” (Buhl-Mortensen P. et al., 2016).
Cold-water corals are long-lived sessile organisms (Druffel et al., 1995; Andrews et al., 2002; Risk et al., 2002; Mortensen and Buhl-Mortensen, 2005). Lophelia colonized the Norwegian waters after the last glaciation about 10,000 years ago (Mortensen et al., 2001; Freiwald et al., 2002; Roberts et al., 2009b). Although each individual Lophelia polyp has a relatively short life span (<20 years) (Mortensen and Lepland, 2007), the extensive reef structures they build can be of considerable age, with the oldest occurring reefs in Norway dating back to 8600 years before present (Mortensen et al., 2001; López Correa et al., 2012). The gorgonian colonies do not create similarly old habitat structures, but individual colonies may reach an age of several hundred years (Andrews et al., 2002; Mortensen and Buhl-Mortensen, 2005). Thus, these cold-water coral ecosystems are unique biological structures, and because of their slow growth, fragile skeletons, and dependency on suspended food particles, they are also especially vulnerable to anthropogenic disturbances such as bottom trawling, petroleum exploitation, seabed mining, cable laying, and threat of ocean acidification (Davies and Guinotte, 2011; Buhl-Mortensen et al., 2015b). Damage caused by bottom trawling is well documented, where crushed Lophelia frameworks are left behind (Fosså et al., 2002; Buhl-Mortensen et al., 2013; Buhl-Mortensen, 2017), but also negative effects of long-lining (Mortensen et al., 2005) and exposure to oil spills (Demopoulos et al., 2016) have been demonstrated. Many countries have therefore made efforts to protect these vulnerable marine ecosystems (VMEs) within their Exclusive Economic Zones, such as Norway (Fosså et al., 2005), Canada (Mortensen et al., 2005; Breeze and Fenton, 2007), and United Kingdom (Huvenne et al., 2016). In addition, the presence of cold-water corals is often considered in the design and establishment of marine protected areas (MPAs) in the Atlantic high seas (UNGA, 2006; O’Leary et al., 2012). In order to establish the most appropriate protected areas, information about the distribution of VMEs is important. Thanks to improved and new technologies (e.g., multibeam echosounders, remotely operated vehicles, autonomous vehicles), the efficiency of seafloor mapping is increasing, providing more information at a higher spatial resolution than previously. However, to obtain a more comprehensive coverage of species distribution, modeled predictions are currently required (e.g., Tittensor et al., 2009; Yesson et al., 2012; Buhl-Mortensen et al., 2015b). Species distribution modeling (SDM) can help us identify locations where VMEs are likely to occur so that conservation efforts can focus on these areas (Anderson and Martínez-Meyer, 2004; Davies and Guinotte, 2011; Ross and Howell, 2012). Similarly, knowledge of their ecological niche is essential for the development of reliable and accurate models that can be useful in area-based management (Phillips et al., 2004).
Several papers have identified various environmental factors that control the distribution of cold-water corals (Mortensen et al., 2001; Wheeler et al., 2007; Davies and Guinotte, 2011), including substrate type, temperature, salinity, currents, and food availability. However, knowledge of their relative importance and how these factors may interact is still limited. Corals have specific tolerance windows for physical parameters (e.g., temperature, salinity, and currents), which may additionally reflect the different water masses and corresponding variation in terms of food quality and abundance. Many of the environmental factors influence each other directly and are therefore correlated; e.g., water mass properties define density and occur at different depths, currents are directed by topography, and near bottom food availability and substrate composition are controlled by current patterns and production in the water column (Mortensen et al., 2001; Dolan et al., 2008). Corals are abundant on elevated topography, where there is stronger continuous or periodic flow (Mortensen and Buhl-Mortensen, 2004; Mohn et al., 2014), and observations show that the part of a Lophelia reef and gorgonian coral facing the prevailing current has the highest density of polyps (Mortensen and Buhl-Mortensen, 2005; Buhl-Mortensen P. et al., 2016). Strong and prevailing near bottom currents supply food, disperse larvae, and prevent benthic fauna from being smothered by sediment deposition (Davies et al., 2009). In addition, food from surface productivity can be transported to the seabed by vertical mixing and is thought to be an important factor in the distribution of Lophelia (Davies et al., 2008; Roberts et al., 2009a). Moreover, environmental factors may influence the different life stages differently. For example, broad scale current patterns are important for the dispersal of long-lived larvae, whereas substrate is crucial for settling and food supply is critical for the adult stage (Buhl-Mortensen et al., 2015b).
Recently a report on the distribution and threats to VMEs (coral and sponge habitats) in the Nordic waters was provided to aid in spatial management of fisheries (Buhl-Mortensen et al., 2019). Nevertheless, the knowledge of the distribution and importance of cold-water corals off Norway is still limited. The Norwegian national seabed mapping program MAREANO has to date covered approximately one third of the seabed within the depth range of the three corals within the study area. The density of survey stations is high and systematically distributed within the MAREANO mapping area, whereas in the remaining part of the study area, the historical records of coral occurrence are scarce and geographically biased. Management measures have been implemented for Lophelia reefs based on observed hot spot areas (areas with clusters of reefs), but none for the two other species. We believe that this study would be an aid to prioritizing areas in need of special protection.
Davies et al. (2008) modeled the distribution of Lophelia on both regional and global scales and noted coarse environmental data as a limiting factor. This study presents for the first time modeled distributions of Lophelia, Paragorgia, and Primnoa in Norwegian waters using high resolution environmental predictors. We use a wide range of predictor variables for training the models: depth, geomorphometric variables [slope, aspect, bathymetric position index (BPI)], oceanographic variables (temperature, salinity, current direction, and current speed), surface chlorophyll a concentration, sediment type, and marine landscape type.
The main objectives of the study were to:
1. Identify environmental variables, among those available as GIS layers, that are most useful for predicting the spatial distribution of Lophelia, Paragorgia, and Primnoa to increase our knowledge about their niches;
2. Develop SDMs with high spatial resolution for these species in Norwegian waters to predict areas with high probability of presence;
3. Explore the effects of differing environmental variable resolution on the accuracy of the predicted distribution.
Materials and Methods
Coral Presence Data
The majority of the coral presence data comes from video observations at survey stations of the Norwegian national seabed mapping program, MAREANO (Figure 1A). Survey stations were selected based on a combined stratified and random sampling strategy, with the aim to cover the variation in bathymetry, topography, landscapes (e.g., canyons, banks, troughs), and sediment types (indicated by the backscatter). The majority of stations (ca 80%) are distributed randomly within areas of potentially similar environment (identified by unsupervised classification), whereas the remaining 20% are allocated to features of special scientific interests (Buhl-Mortensen et al., 2015a).
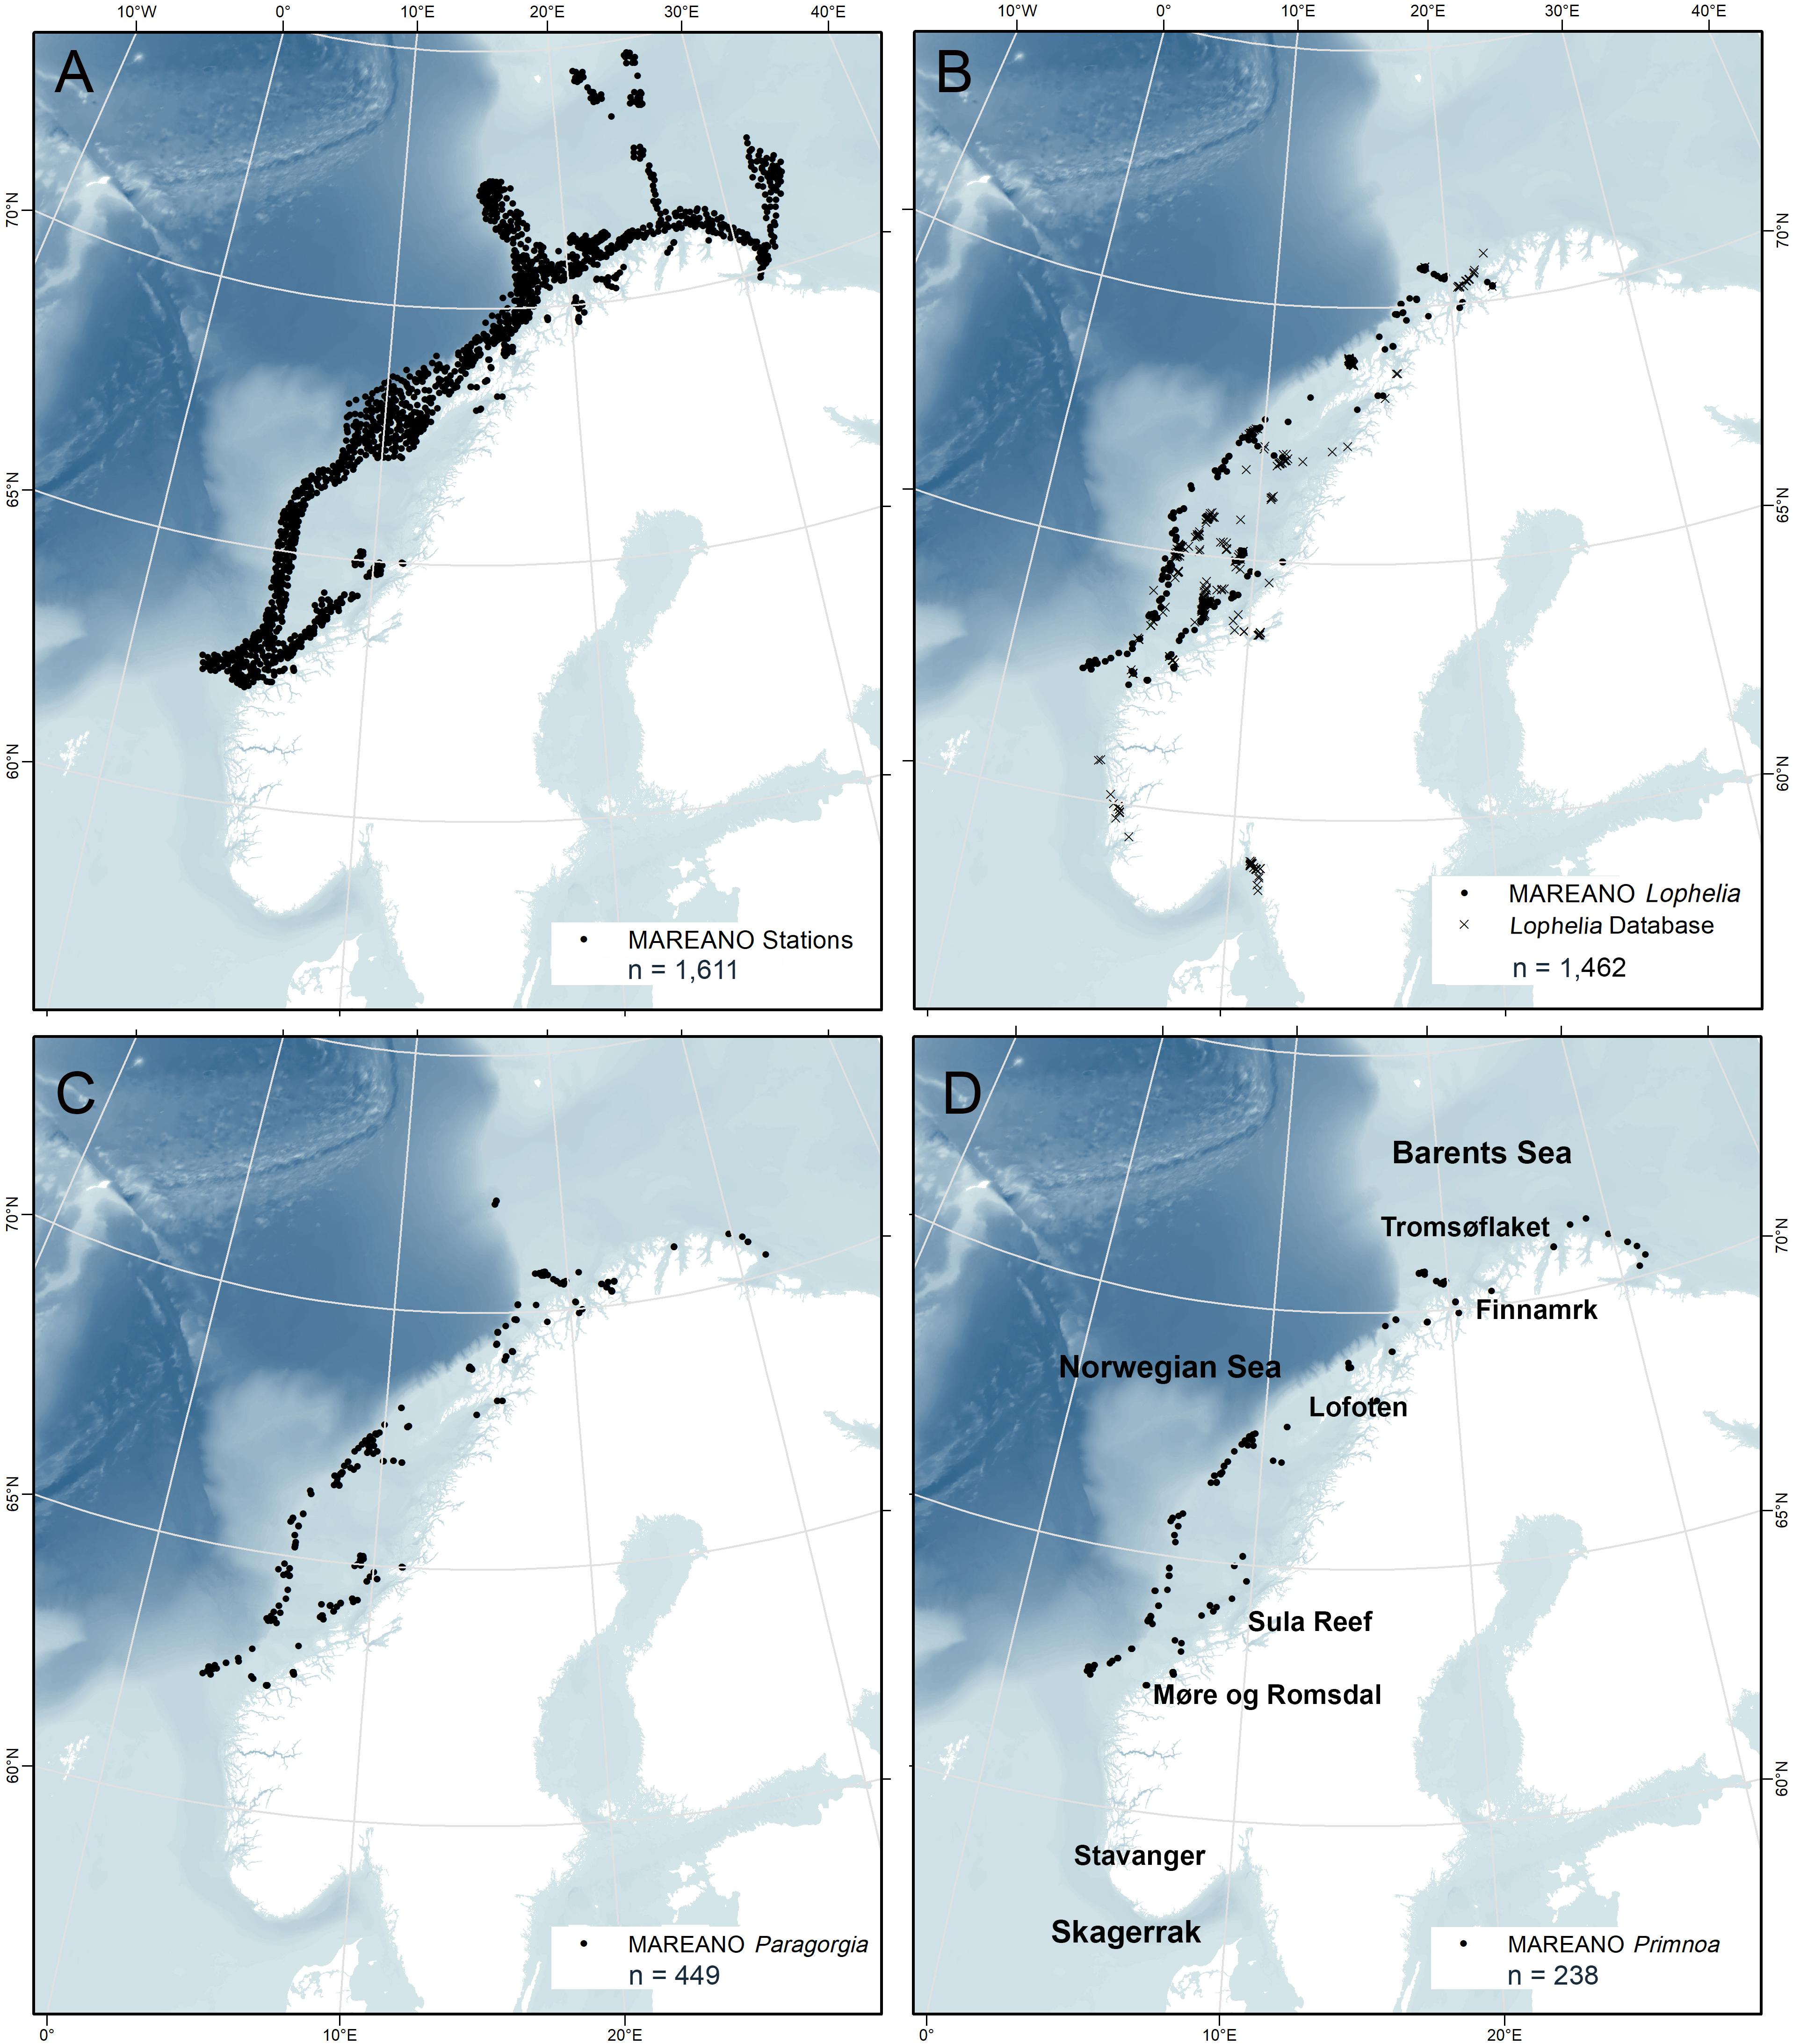
Figure 1. Distribution of all MAREANO video stations (A) and all coral presence points for Lophelia pertusa (B), Paragorgia arborea (C), and Primnoa resedaeformis (D) on the Norwegian continental shelf. n = number of presence points.
The MAREANO dataset contains 21,356 presence observations of Lophelia, 449 of Paragorgia, and 238 of Primnoa from 62°N to 71°N with a geographic precision of ± 5 m (Figures 1B–D). The presence points for Lophelia represent several observations within individual reefs, and therefore presence points less than 50 m apart were grouped and defined as a “Coral Reef Habitats.” A total of 595 such habitats were identified, and the center points of these reef observations were used as the presence points for the study of environmental characteristics and spatial modeling.
To provide a wider geographic coverage, the MAREANO dataset on Lophelia was supplemented with that from a database of Lophelia records from various sources dating back to the 1930s (Fosså et al., 2002). This dataset added 867 Lophelia observations, mainly from the mid-Norwegian coast and shelf, but also included data from western Norway and Skagerrak. Since the original points had variable geographic precision (10–1000 m uncertainty), only records with uncertainty of 100 m or less were included. Database points that were duplicates of the MAREANO video points were removed in ArcGIS 10.5.1 by creating a 50 m radius buffer polygon around the MAREANO points and deleting Lophelia database points overlapping the buffer. This, together with the Coral Reef Habitat points, resulted in a final total of 1462 Lophelia presence points for this study (Figure 1B).
Environmental Data
Twenty environmental raster layers were prepared using ArcMap (Table 1). Figures 2A–F show six selected environmental layers in the study area. Six digital terrain model (DTM) bathymetry base maps in 1/8 arc minute resolution were downloaded from the European Marine Observation and Data Network (EMODnet) portal for depth and geomorphometric variables. Benthic oceanographic point data were retrieved from the ocean modeling system NorKyst-800 (“Norwegian Coast-800,” see references and assessment results in, e.g., Myksvoll et al., 2018), where oceanographic variables are modeled at 800 m resolution along the Norwegian coast from the Swedish border to the Russian coast. The hydrodynamic model produces hourly results, and the ten years from 2005 to 2014 are used in our analysis. The lowermost vertical level in the NorKyst-800 system is assumed to represent the physical conditions near the benthic communities, and this level is approximately 10% of the height of the water level above the sea floor (Albretsen et al., 2011). Fifteen ocean color image rasters (2002–2016) indicating annual average values of sea surface chlorophyll a concentration were obtained from MODIS-Aqua (NASA Goddard Space Flight Center, 2018). Two categorical variables, sediment and marine landscape (Figures 2E,F), were obtained as shapefiles from the Geonorge public map catalog.
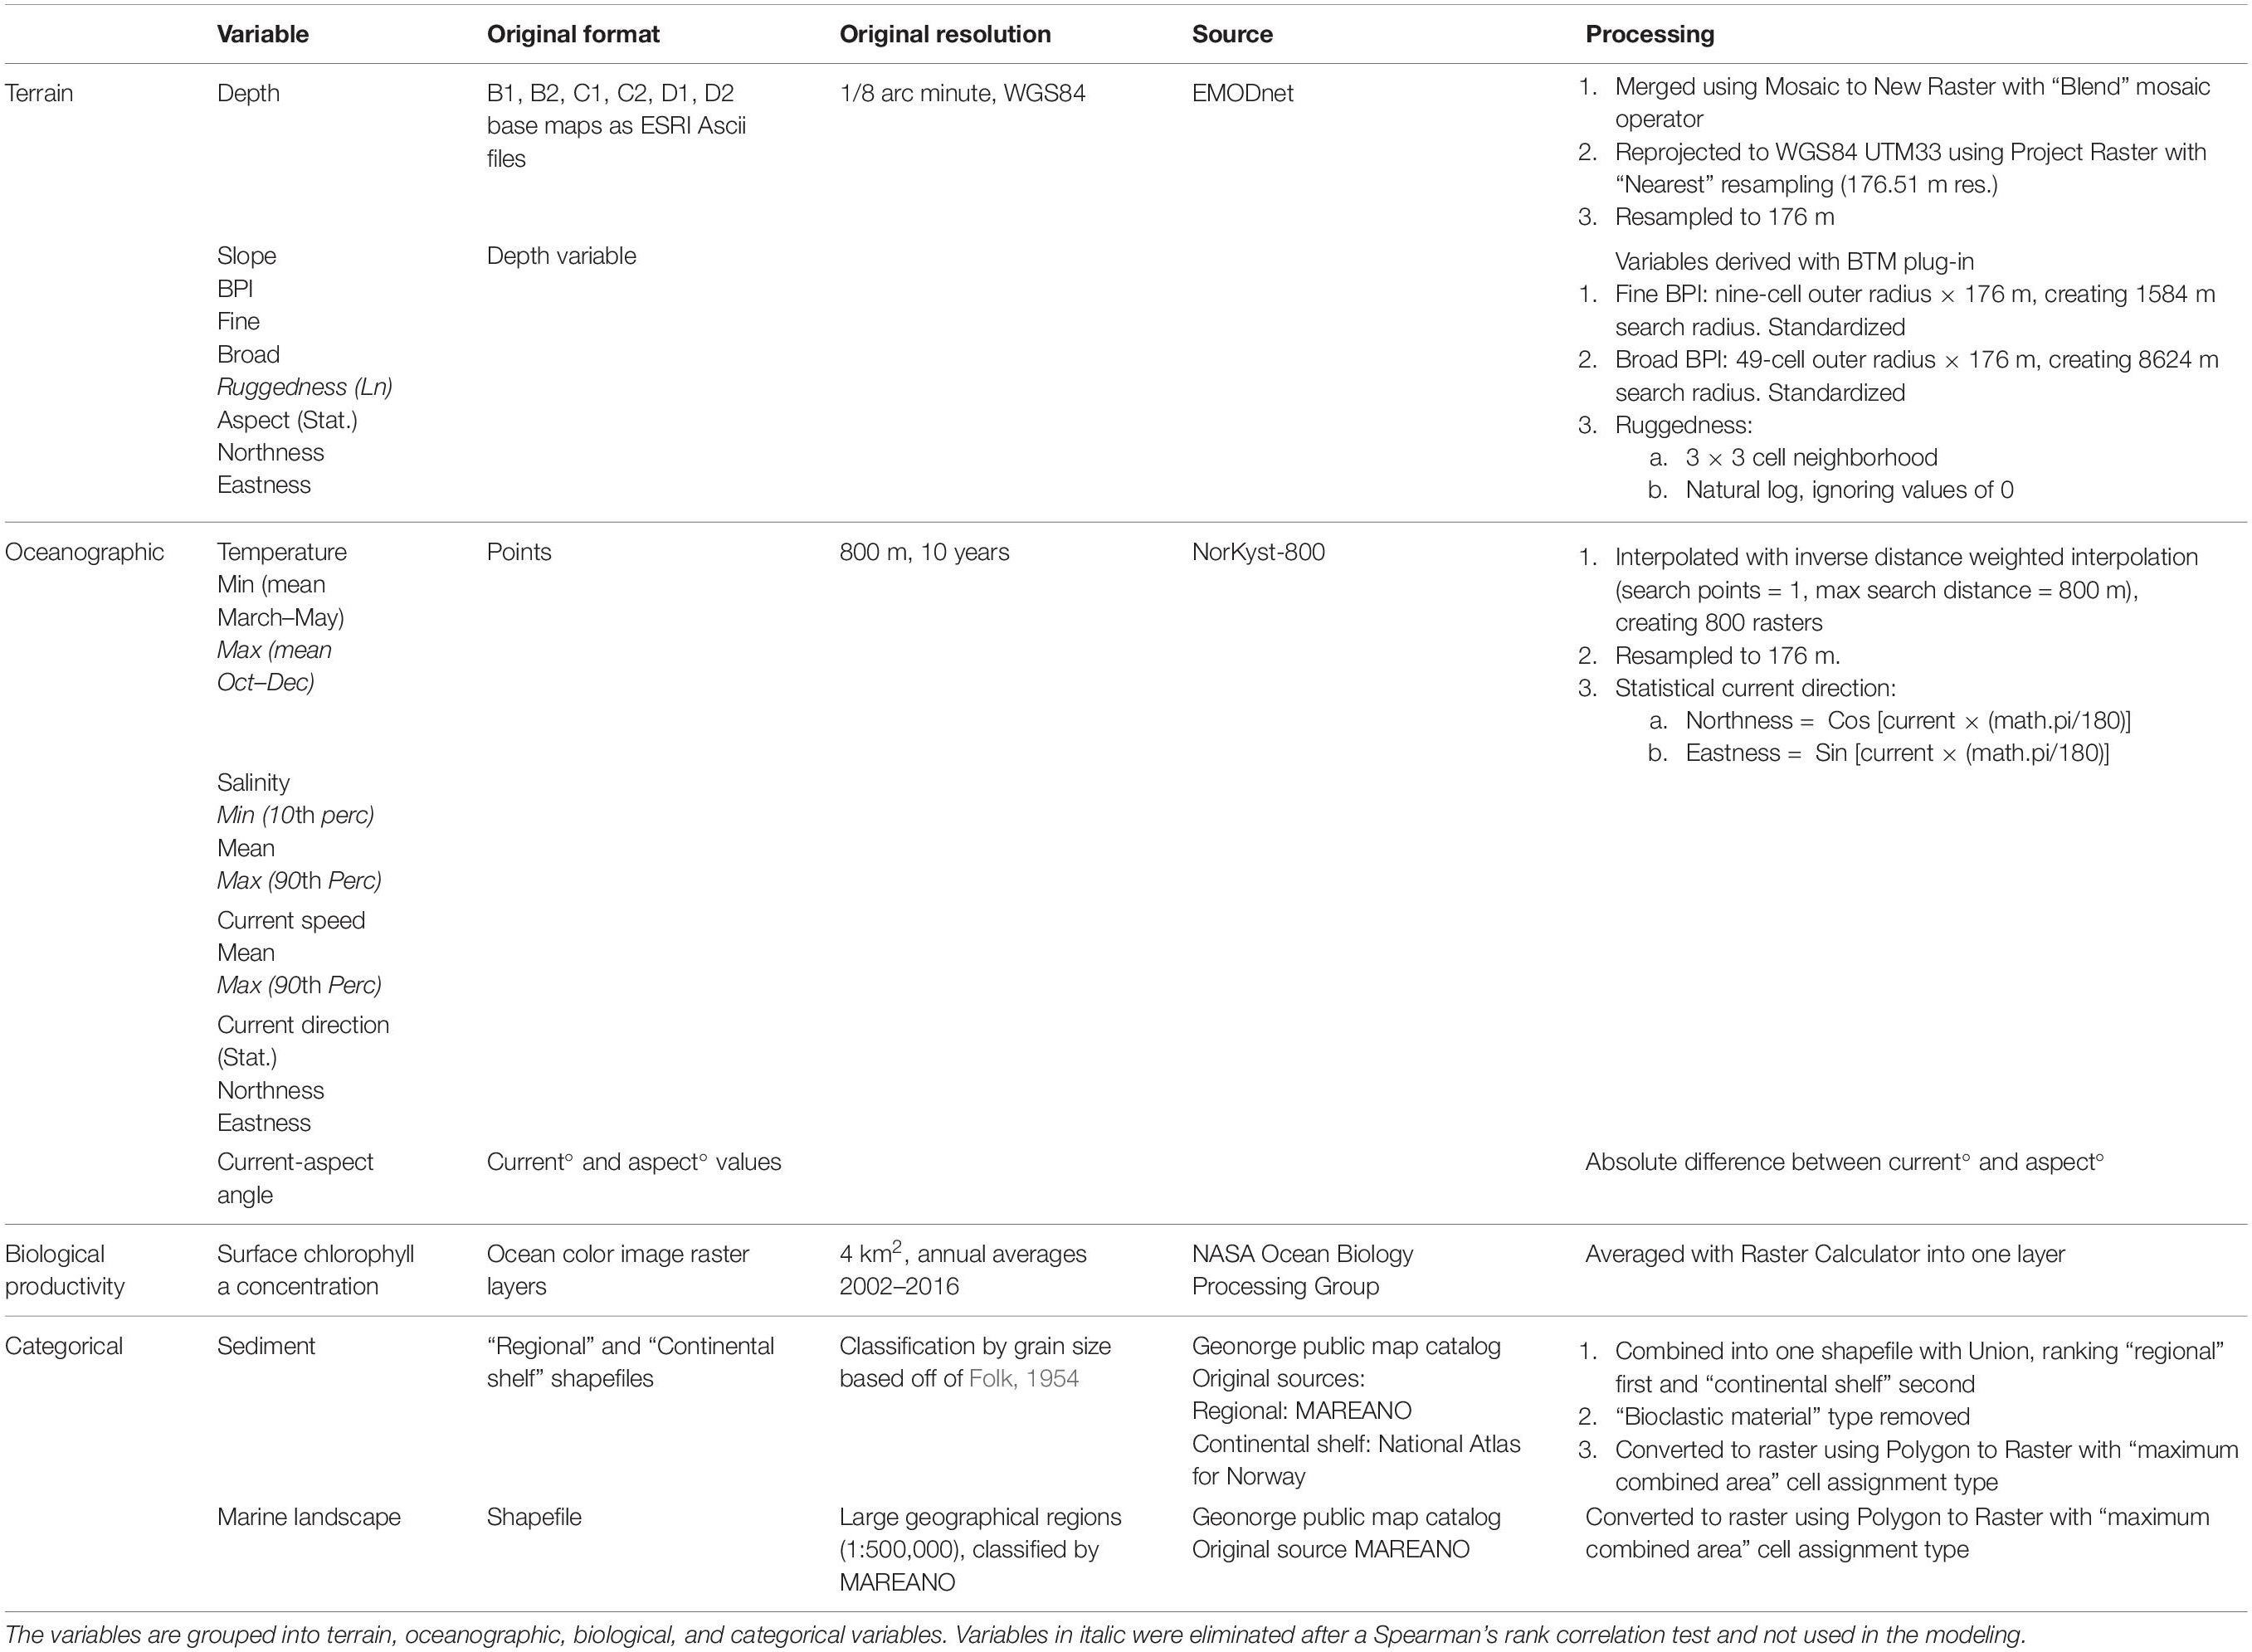
Table 1. List of all obtained environmental variables, with format, resolution, sources, and processing method.
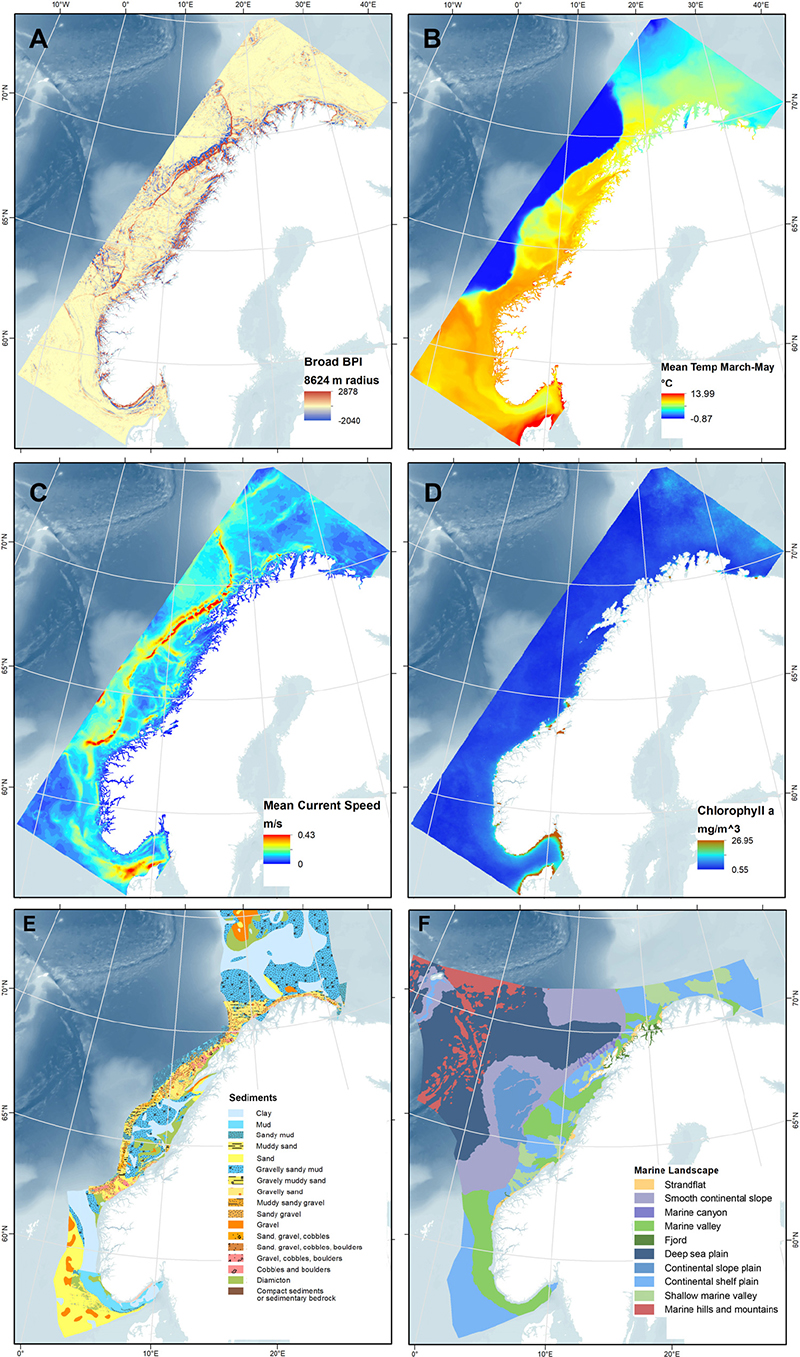
Figure 2. Maps of four selected numerical environmental variables (A–D), and two categorical variables (E,F). (A) Broad BPI, (B) minimum temperature (mean March through May), (C) mean current speed, (D) chlorophyll a concentration, (E) sediment type (classified by grain size, based on and modified from Folk (1954) combining MAREANO’s finer Regional map and the coarser Continental Shelf map from the National Atlas for Norway, 1991), and (F) Marine landscape types classified by MAREANO.
All environmental variables were processed in ArcMap to final raster layers and made to cover the extent of the coral presence data along the continental shelf (Figure 2). The six DTM bathymetry base maps were merged together and then re-projected to WGS84 UTM33, leading to a cell size of ≈176.51 m. This layer was then resampled to the nearest higher resolution integer cell size of 176 m, resulting in the final depth layer. The geomorphometric variables slope, broad and fine BPIs, ruggedness, and statistical aspect (Northness and Eastness) were derived from the depth layer using the Benthic Terrain Modeler (BTM) plug-in for ArcGIS (Walbridge et al., 2018) (Table 1). The low-scale raw ruggedness layer produced showed very small values (from 0 to 0.14), so a natural logarithm transformation of the layer, omitting values of 0, was created to separate out the values.
The point data collected from the NorKyst-800 model were bottom temperature (mean monthly), salinity (minimum, mean, maximum), current speed (mean, maximum), and current direction. The 3 months with the coldest mean bottom temperature, March through May, were averaged and used as the bottom minimum temperature, and the three warmest months, October through December, were averaged and used as the bottom maximum temperature. The 10th percentile values for minimum salinity and 90th percentile values for maximum salinity and maximum current speed were used to alleviate errors in the form of extreme values, introduced during Norkyst-800 model processing. The points for each variable were interpolated and then resampled to 176 m (using Inverse Distance Weighted interpolation tool in the Spatial Analyst toolbox) to match the depth and geomorphometric variables. Finally, current direction was decomposed into statistical Northness and Eastness.
To study if the interaction between terrain and currents is a better indicator than each of them separately, we created the variable “Current-Aspect Angle”; the angle between current direction and the heading of the terrain aspect (sloping direction) was used (Supplementary Figure S1). This variable was processed with the Raster Calculator and Math tools in the Spatial Analyst toolbox, as follows:
– If Current-Aspect Angle ≤ 180°, Current-Aspect Angle = abs (Current°− Aspect°);
– If Current-Aspect Angle > 180°, Current-Aspect Angle = abs [abs (Current°− Aspect°) − 360)].
Angles greater than 180° were matched with the corresponding angle since a 2D surface is measured. Thus, if the Current-Aspect Angle value:
= 0°, the direction of current and aspect are the same (e.g., slope facing North, current heading North);
< 90°, the current is at the same angle and with the same direction as the aspect;
= 90°, the current is perpendicular to the aspect and runs in parallel with the terrain;
> 90°, the current is at an angle opposite to the aspect, and hits the terrain;
= 180°, the direction of the current and aspect are opposite and the current hits the terrain (e.g., slope facing North, current heading South).
For chlorophyll a concentration, the last continuous variable, the 15 ocean color image raster layers were averaged into one (Figure 2D). All variables were snapped and resampled to match the final depth and geomorphology layers. Figure 2 shows maps for the continuous variables broad BPI (Figure 2A), minimum temperature (Figure 2B), mean current speed (Figure 2C), and chlorophyll a (Figure 2D).
Finally, the categorical variables sediment type and landscape were processed. Sediment type (Figure 2E), as classified by grain size based on Folk (1954), was collated from two sources: (1) “Regional,” a detailed layer mapped by MAREANO based on sediment sampling, backscatter, and seismic data, with video observation and bathymetry data to support, and (2) “Continental Shelf,” a coarser mapping based on the National Atlas of Norway (Vorren and Vassmyr, 1991). The Continental Shelf layer was used to cover areas outside the Regional layer. The sediment class “Bioclastic material” was removed to avoid circularity since this substrate is part of reefs. Marine landscape (Figure 2F) as defined by MAREANO is a large geographical region (can be mapped with a scale of 1:500,000) with a uniform appearance. MAREANO Buhl-Mortensen et al. (2015c) defined this using the parameters (1) relative relief (difference of 50 m in height within a 1 km2 area is set as a cut-off point), (2) slope angle, (3) terrain variation (e.g., ruggedness), and (4) relative position (BPI). The collated sediment and the marine landscape shapefile layers were then converted to raster layers.
The relationship between the values for all 20 environmental variables and coral presence data points was analyzed.
Modeling
Maximum Entropy (Maxent) version 3.4.1 Java application (Phillips et al., 2004) was used to create an SDM for each species. Maxent modeling is a common method used by many benthic ecologists (see Table 1 in Elith et al., 2011 for an overview) due to its good performance compared to other SDM modeling and its ease of use (Ghisla et al., 2012; Merow et al., 2013; Phillips et al., 2017). Maxent is relatively robust in dealing with variable correlation because regularization makes sure the model does not overfit (Phillips et al., 2006). However, some a priori variable selection is good to reduce covariation and better understand individual variable importance (Davies and Guinotte, 2011). The correlation between the continuous environmental variables at the location of coral presence points was evaluated using Spearman’s Rank test in the “Scatterplot Matrix for Table” tool in the Marine Geospatial Ecology Tools 0.8a68 (MGET) plug-in (Roberts et al., 2010). An ρ-value of 0.75 was applied as a cut off for pairs of correlated variables of which only one was selected.
As a result of the categorical sediment and marine landscape variables not covering the entire study area, two different models were run (Table 2). Model 1 excluded these two categorical terrain variables and is therefore limited by their absence, while Model 2 included these two variables and is therefore limited by a more restricted geographical extent (Figure 3). Models 1 and 2 were each run 10 times using cross-validation to test the models. This process involved splitting the presence data into 10 groups, and in each run, one group was left out while the rest of the data was used to train the model. The trained model was then tested with the omitted group (the “test data”), a method that uses all data to test the model (Philips, 2017). The default of 10,000 randomly placed background points was chosen for the comparison with presence data. The regularization multiplier was left as the default of 1, leaving regularization coefficients for the module training at default values.
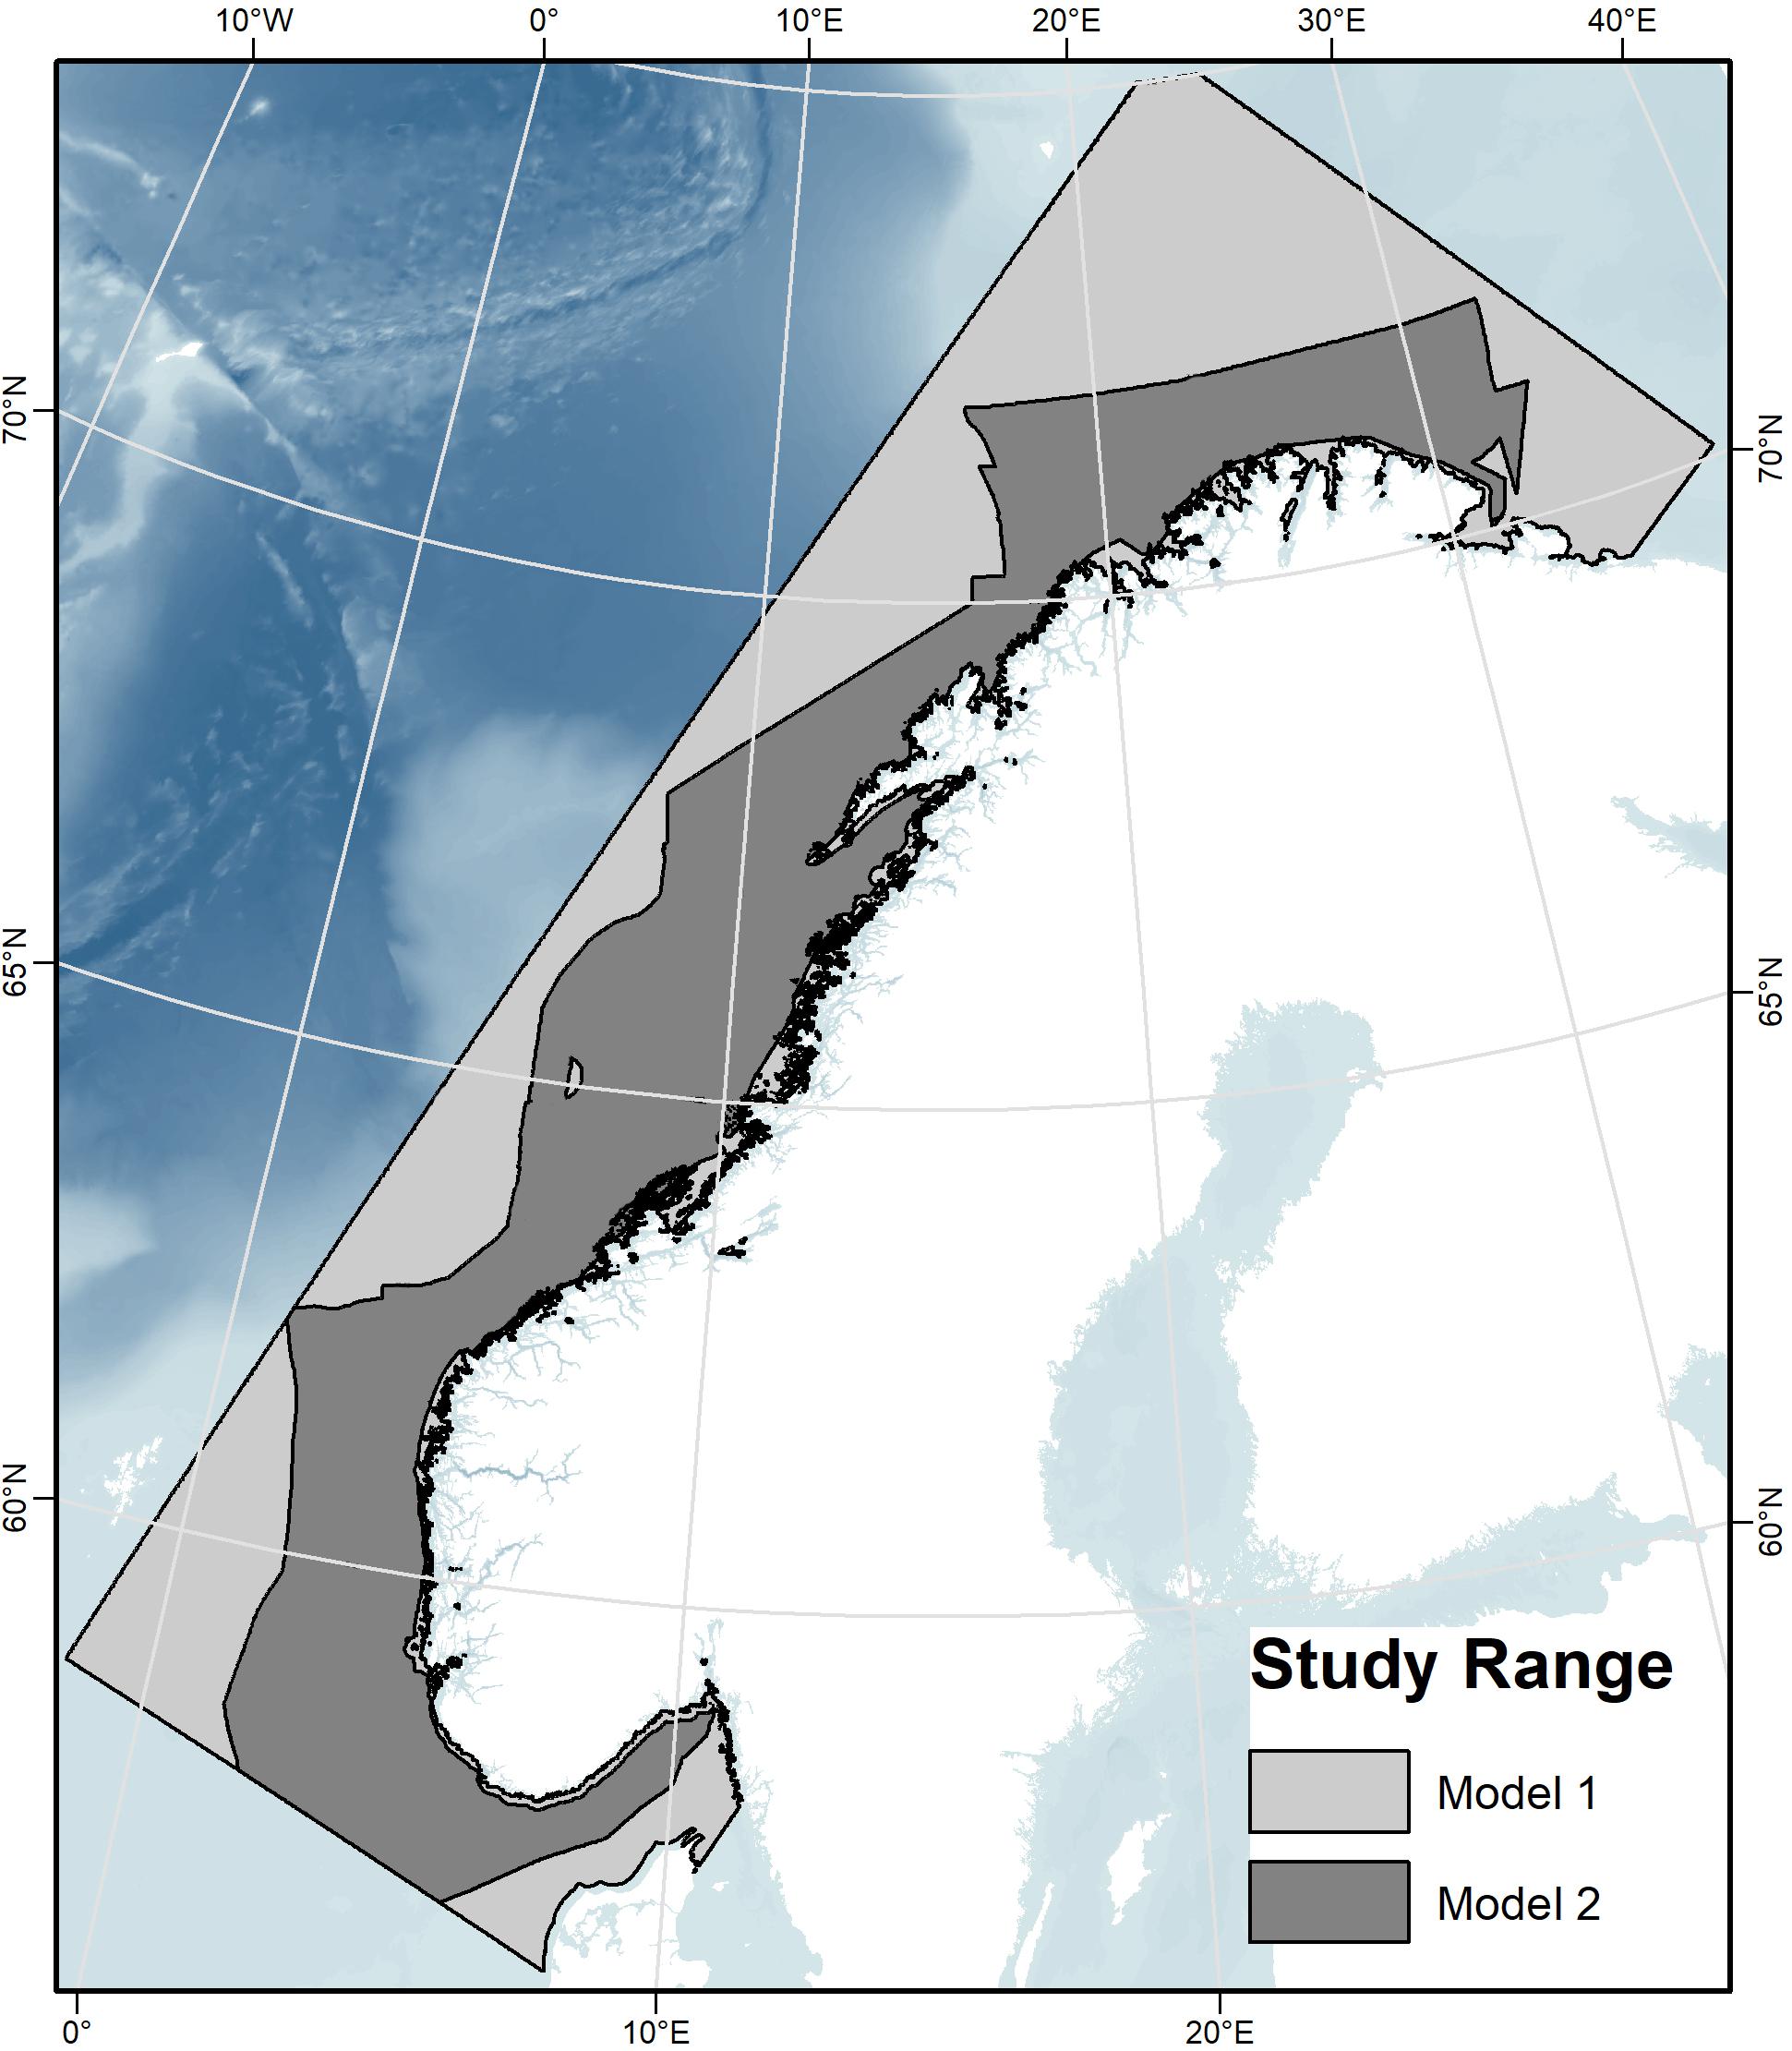
Figure 3. The study area showing the geographic extent of the two models. The light-gray polygon (Model 1) indicates the full study area, without full-areal coverage of the sediment and marine landscape environmental variables, and the dark-gray polygon (Model 2) superimposed on Model 1 indicates the more restricted area with all variables, including sediment and marine landscape.
The default cloglog (computes the complementary log-log transformation, including its inverse and the first two derivatives) output was used because of its higher discrimination power compared to the logistic output. Duplicate coral records within a 176 m cell were removed to reduce location bias. A bias grid was also used by creating a point density map of MAREANO station locations, which does not include sampling effort of the Lophelia database.
To gain an understanding of coral niches, a response curve for each modeled environmental variable was produced for each species. The response curves compare values of the environmental variables at coral presence points with values at random background points within the study area, and thus indicate a species’ preference to certain environmental values. “Clamping” extrapolation was also done in order to make conservative predictions of variable responses that could happen outside observations made in the study, whether it is geographical or temporal in nature. Linear, quadratic, and hinge variable response features were used.
Each of the 10 model runs produced a “gain,” a measure of goodness of fit that gives the likelihood ratio of finding coral points over random background points, using both the training points (training gain) and the test points (test gain). A gain of two means that the average likelihood of presence at a presence point is e2 ≈ 7.4 times greater than at a background point (Phillips et al., 2017). Maxent also evaluated each model’s discrimination ability with the training and test Area under the receiver operating characteristic (ROC) curve, the AUC, a value giving the ratio of the true positive rate (correctly predicting presence over falsely predicting absence) to the false positive rate (falsely predicting presence over correctly predicting absence), based on a chosen discrimination threshold of misclassification rate.
Results
Observed Environmental Characteristics of Coral Habitats
A summary of environmental variable characteristics at the coral presence points and in the overall study area is shown in Table 3. The distribution relative to six selected variables [depth, minimum temperature (March–May), broad BPI, mean current speed, and surface chlorophyll a concentration] per coral species is presented in Figure 4. Note that value extremities are grouped together in overflowing bins.
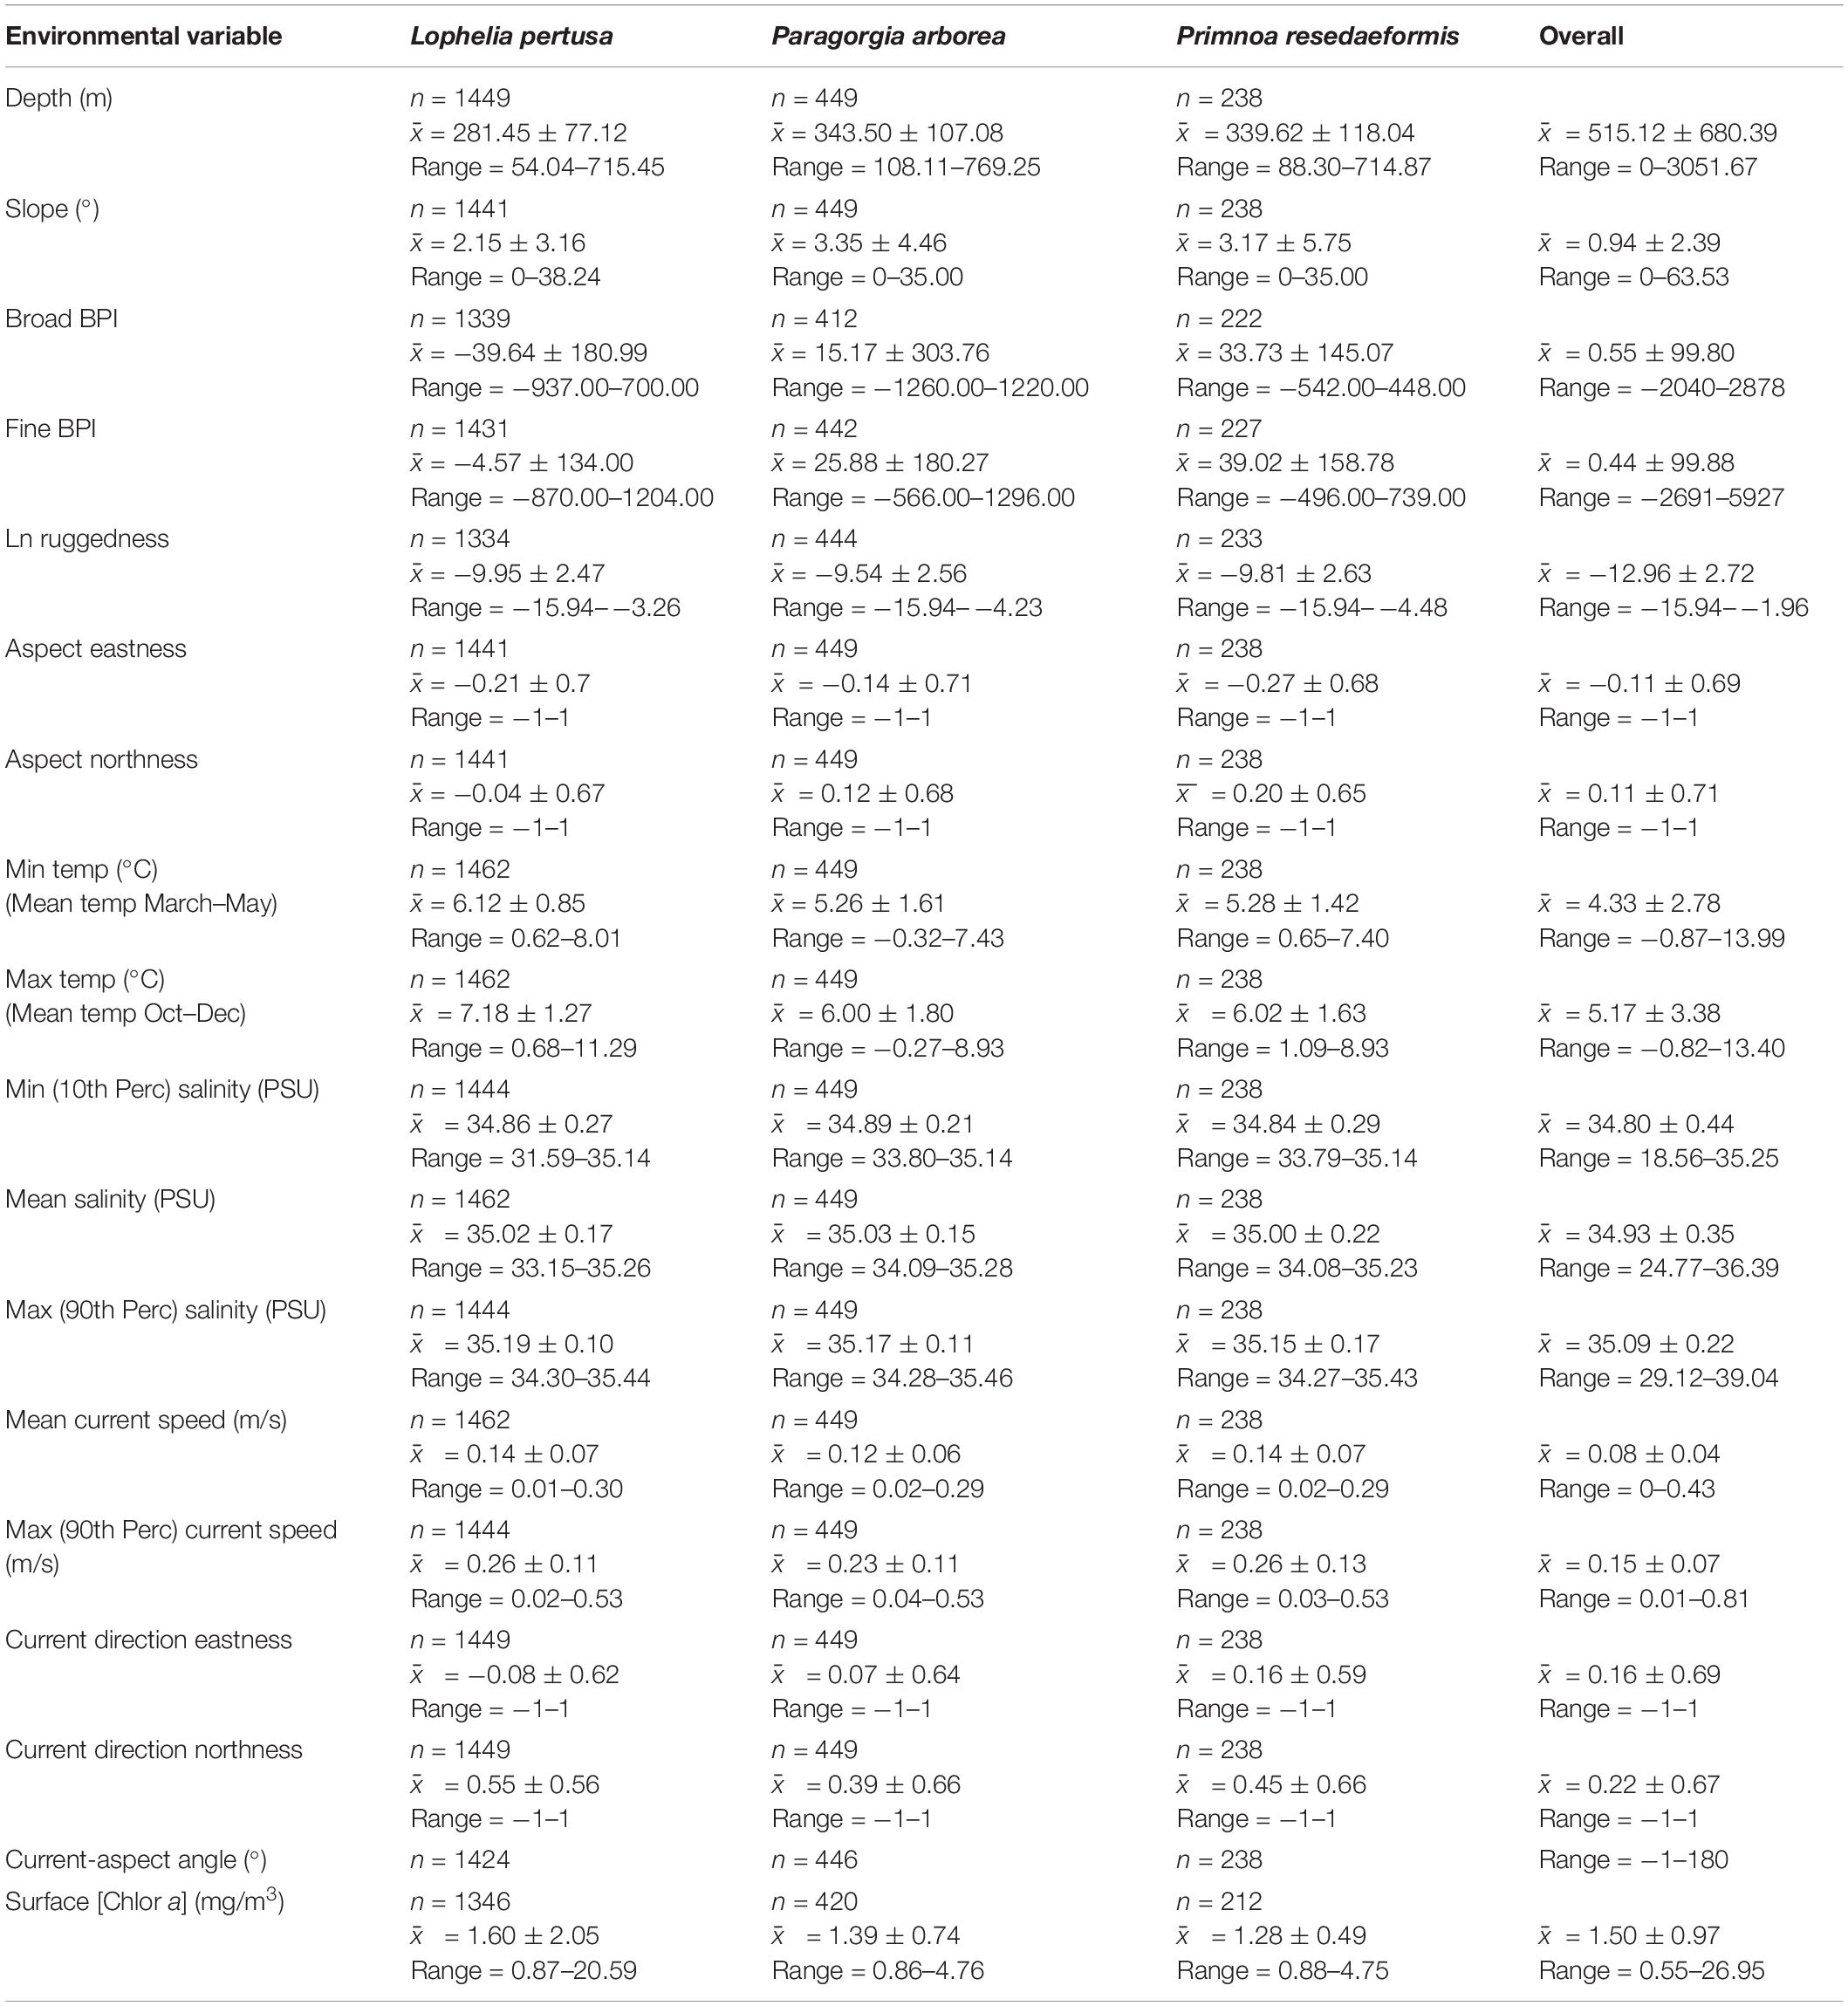
Table 3. Summary statistics count (n), mean () ± standard deviation (s), and range (min to max) for the continuous environmental variables for each species and the overall study area.
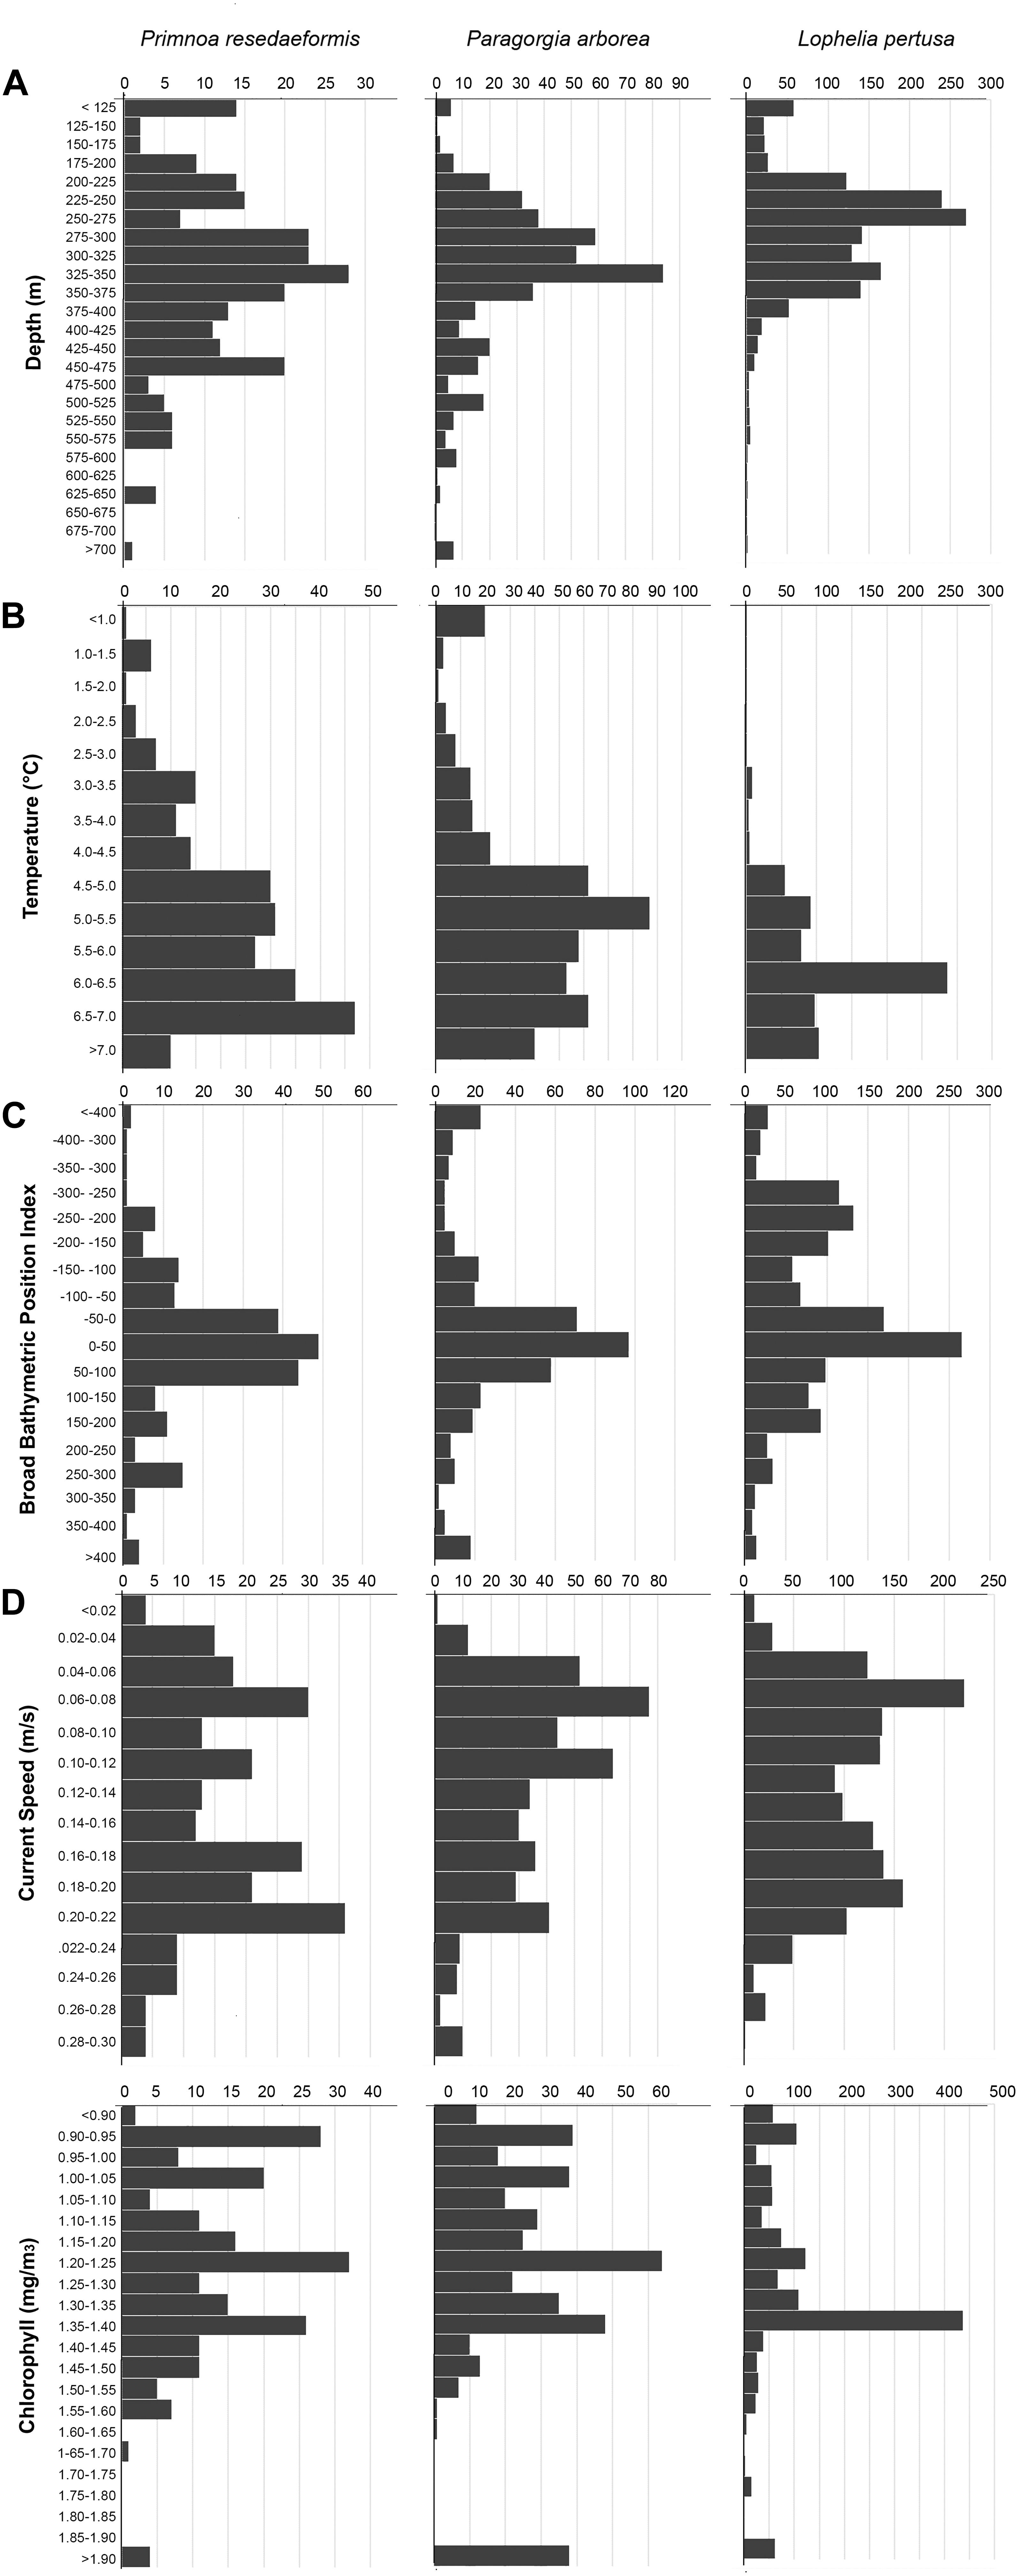
Figure 4. Number of occurrences of Primnoa, Paragorgia, and Lophelia versus depth (A), minimum temperature (B), broad BPI (C), mean current speed (D), and chlorophyll a concentration (E).
Depth
Corals were present across a wide depth range, from 50 to almost 800 m, while the overall maximum depth within the study area was 3052 m. Figure 4A shows that Paragorgia and Primnoa had a similar depth distribution, with maximum occurrences around 325–350 m. Lophelia was more common at shallower depths between 250 and 275 m depth. The two gorgonians also extended deeper than Lophelia, with maximum depths of >700 m, compared to 575 m for Lophelia. The plots of occurrence versus temperature (Figure 4B) reflected similar differences among the species.
Temperature
On average, Lophelia occurred in warmer water than Paragorgia and Primnoa (Table 3). For minimum temperature (March–May), Lophelia distribution showed a clear peak and clustering around 6–6.5°C, while high gorgonian presence extended widely between 4.5 and 7°C (Figure 4B). Primnoa peaked at warmer temperatures (6.5–7.0°C) and Paragorgia at slightly colder temperatures of around 5.0–5.5°C. Lophelia was associated with a higher minimum temperature of 3°C, compared to below 1°C for the other two species.
Salinity
On average, the distribution across the gradient in salinity was similar for all three species (mean salinity: 35.00–35.02 PSU, Table 3). The minimum salinity values differed more for the corals with 31.59 PSU for Lophelia, 33.79 PSU for Primnoa, and 33.80 PSU for Paragorgia (Table 3). Maximum salinity values were at 35.44 PSU for Lophelia, 35.43 PSU for Primnoa, and 35.46 PSU for Paragorgia.
Slope and BPI
The corals had an overall preference for moderate sloping terrain, with Lophelia’s mean slope at 2.15°, Primnoa at 3.17°, and Paragorgia at 3.35°, despite ranging up to 38.24° for Lophelia and 35.00° for the gorgonians. BPI (both broad and fine) and ruggedness (natural log) values had a unimodal distribution, centered around the mean. Lophelia was unique by displaying two peaks of high occurrences for broad BPI: one around more level areas similar to that for the gorgonians, and the other in strongly negative values (i.e., troughs) (Figure 4C). In general, Lophelia had a weak preference to negative BPI values with a broad BPI mean of −39.64 and fine BPI mean of −4.57, indicating occurrences in troughs.
Aspect
The gorgonians had a tendency to occur at north and west-facing slopes as indicated by positive values for Northness and negative values for Eastness, while Lophelia tended to occur on south and west-facing slopes due to negative Northness and Eastness values (Table 3).
Current Direction
The gorgonians appeared more in areas with north and east-heading currents and Lophelia in areas with north and west-heading currents (Table 3). The rose diagrams for the Current-Aspect Angle for all species (Supplementary Figure S2) show that most coral occurrences were in areas with currents generally flowing over (22.5–67.5°) or passing parallel to (67.5–112.5°) the slope, with slightly fewer occurrences of the current hitting the slope (112.5–157.5°).
Current Speed
Corals had a bimodal distribution related to mean current speed, with peaks in occurrence at slow (0.06 m/s) and fast (0.2 m/s) current speeds (Figure 4D). The max observed speed of the max current speed was 0.53 m/s for all corals (Table 3).
Surface Productivity
Lophelia had a clear peak in occurrence at a surface chlorophyll a concentration of 1.35–1.4m g/m3 (Figure 4E), as well as a large range of 0.87–20.59 mg/m3, compared to 0.86–4.76 mg/m3 for the gorgonians (Table 3).
Sediment
The bar graphs in Figure 5 show the relative frequency of sediment types for each coral species using MAREANOs sediment classification. The frequency results obtained from the combined sediment layer are juxtaposed with actual records of sediment type made in the MAREANO coral video dataset. According to the video observations, the gorgonians had the highest occurrence on Lophelia reefs, which was removed in the sediment layer to eliminate redundancy. The sediment types containing gravel were favorable habitats for all three corals. Lophelia observations were most common on “gravelly muddy sand” based on the sediment layer, while video observations indicated that it was most common on “gravelly sand,” two very similar sediment types. Primnoa occurred on muddy, sandy, gravelly sediment types in the interpreted sediment layers, while video observations indicated that “exposed bedrock” was the dominant sediment.
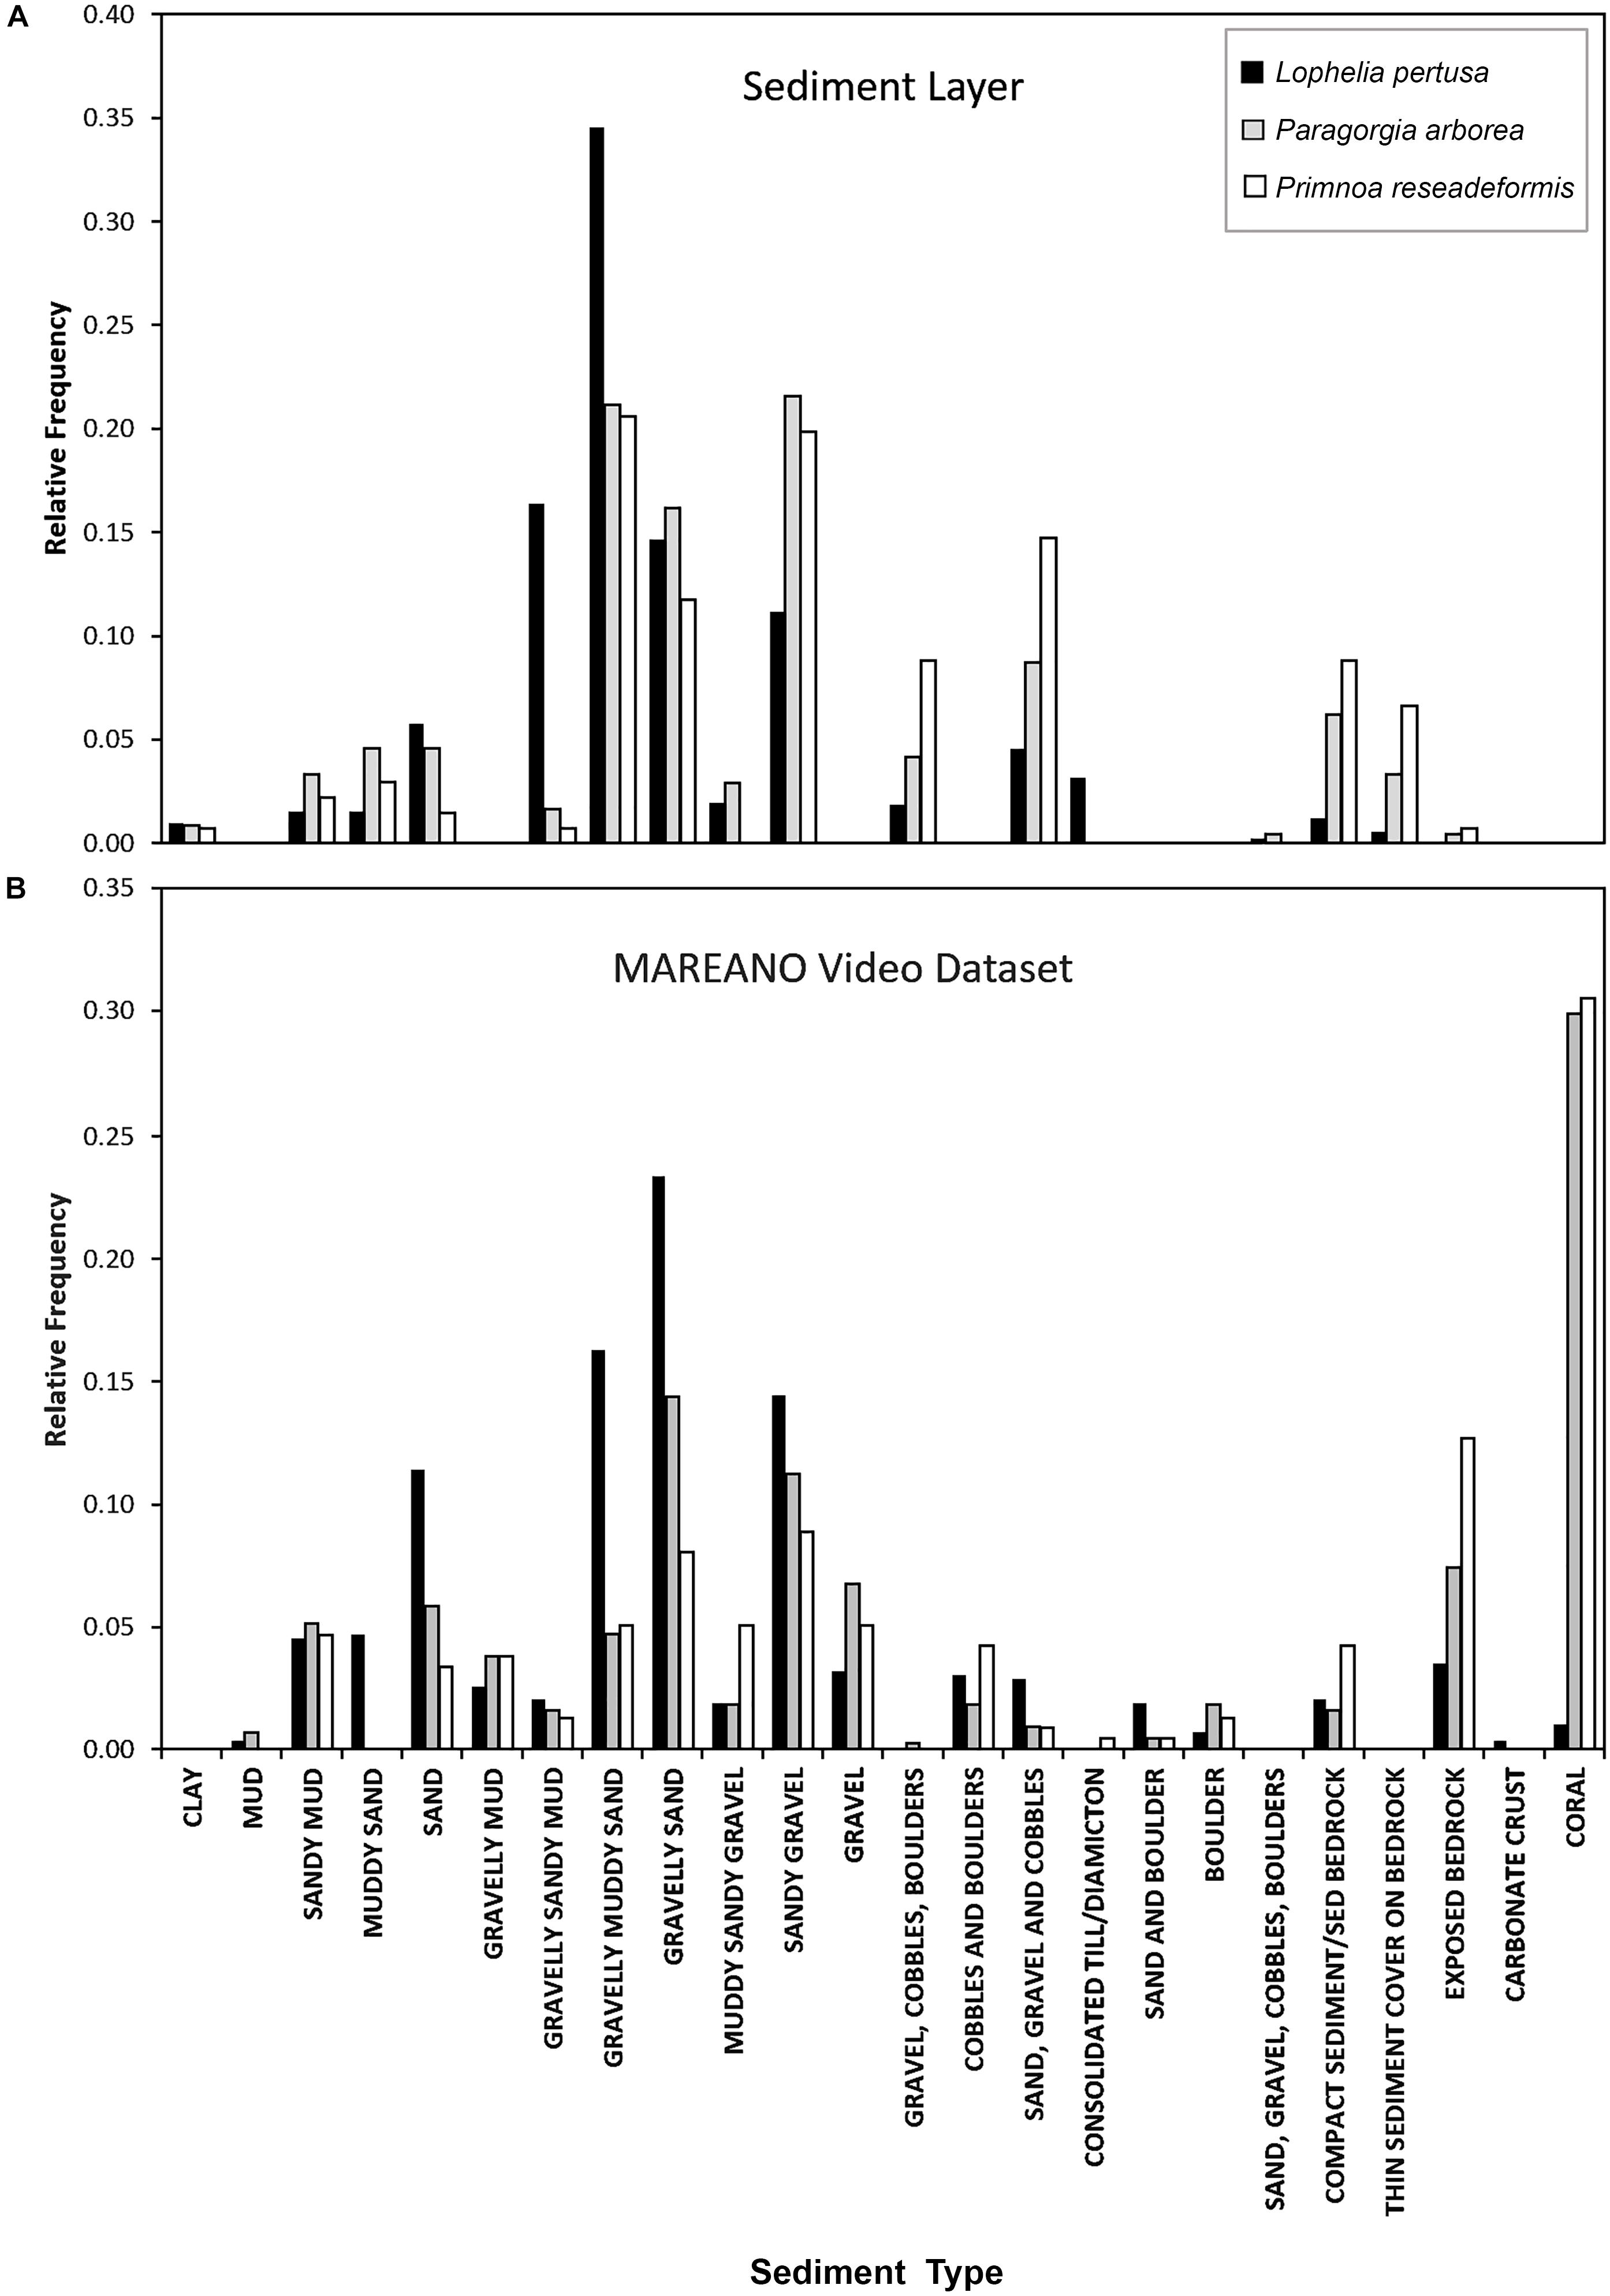
Figure 5. Relative frequency of sediment types for each coral species at their sites of occurrence from the MAREANO sediment layer (A), compared with the observed sediment type from the MAREANO video dataset (B).
Landscape
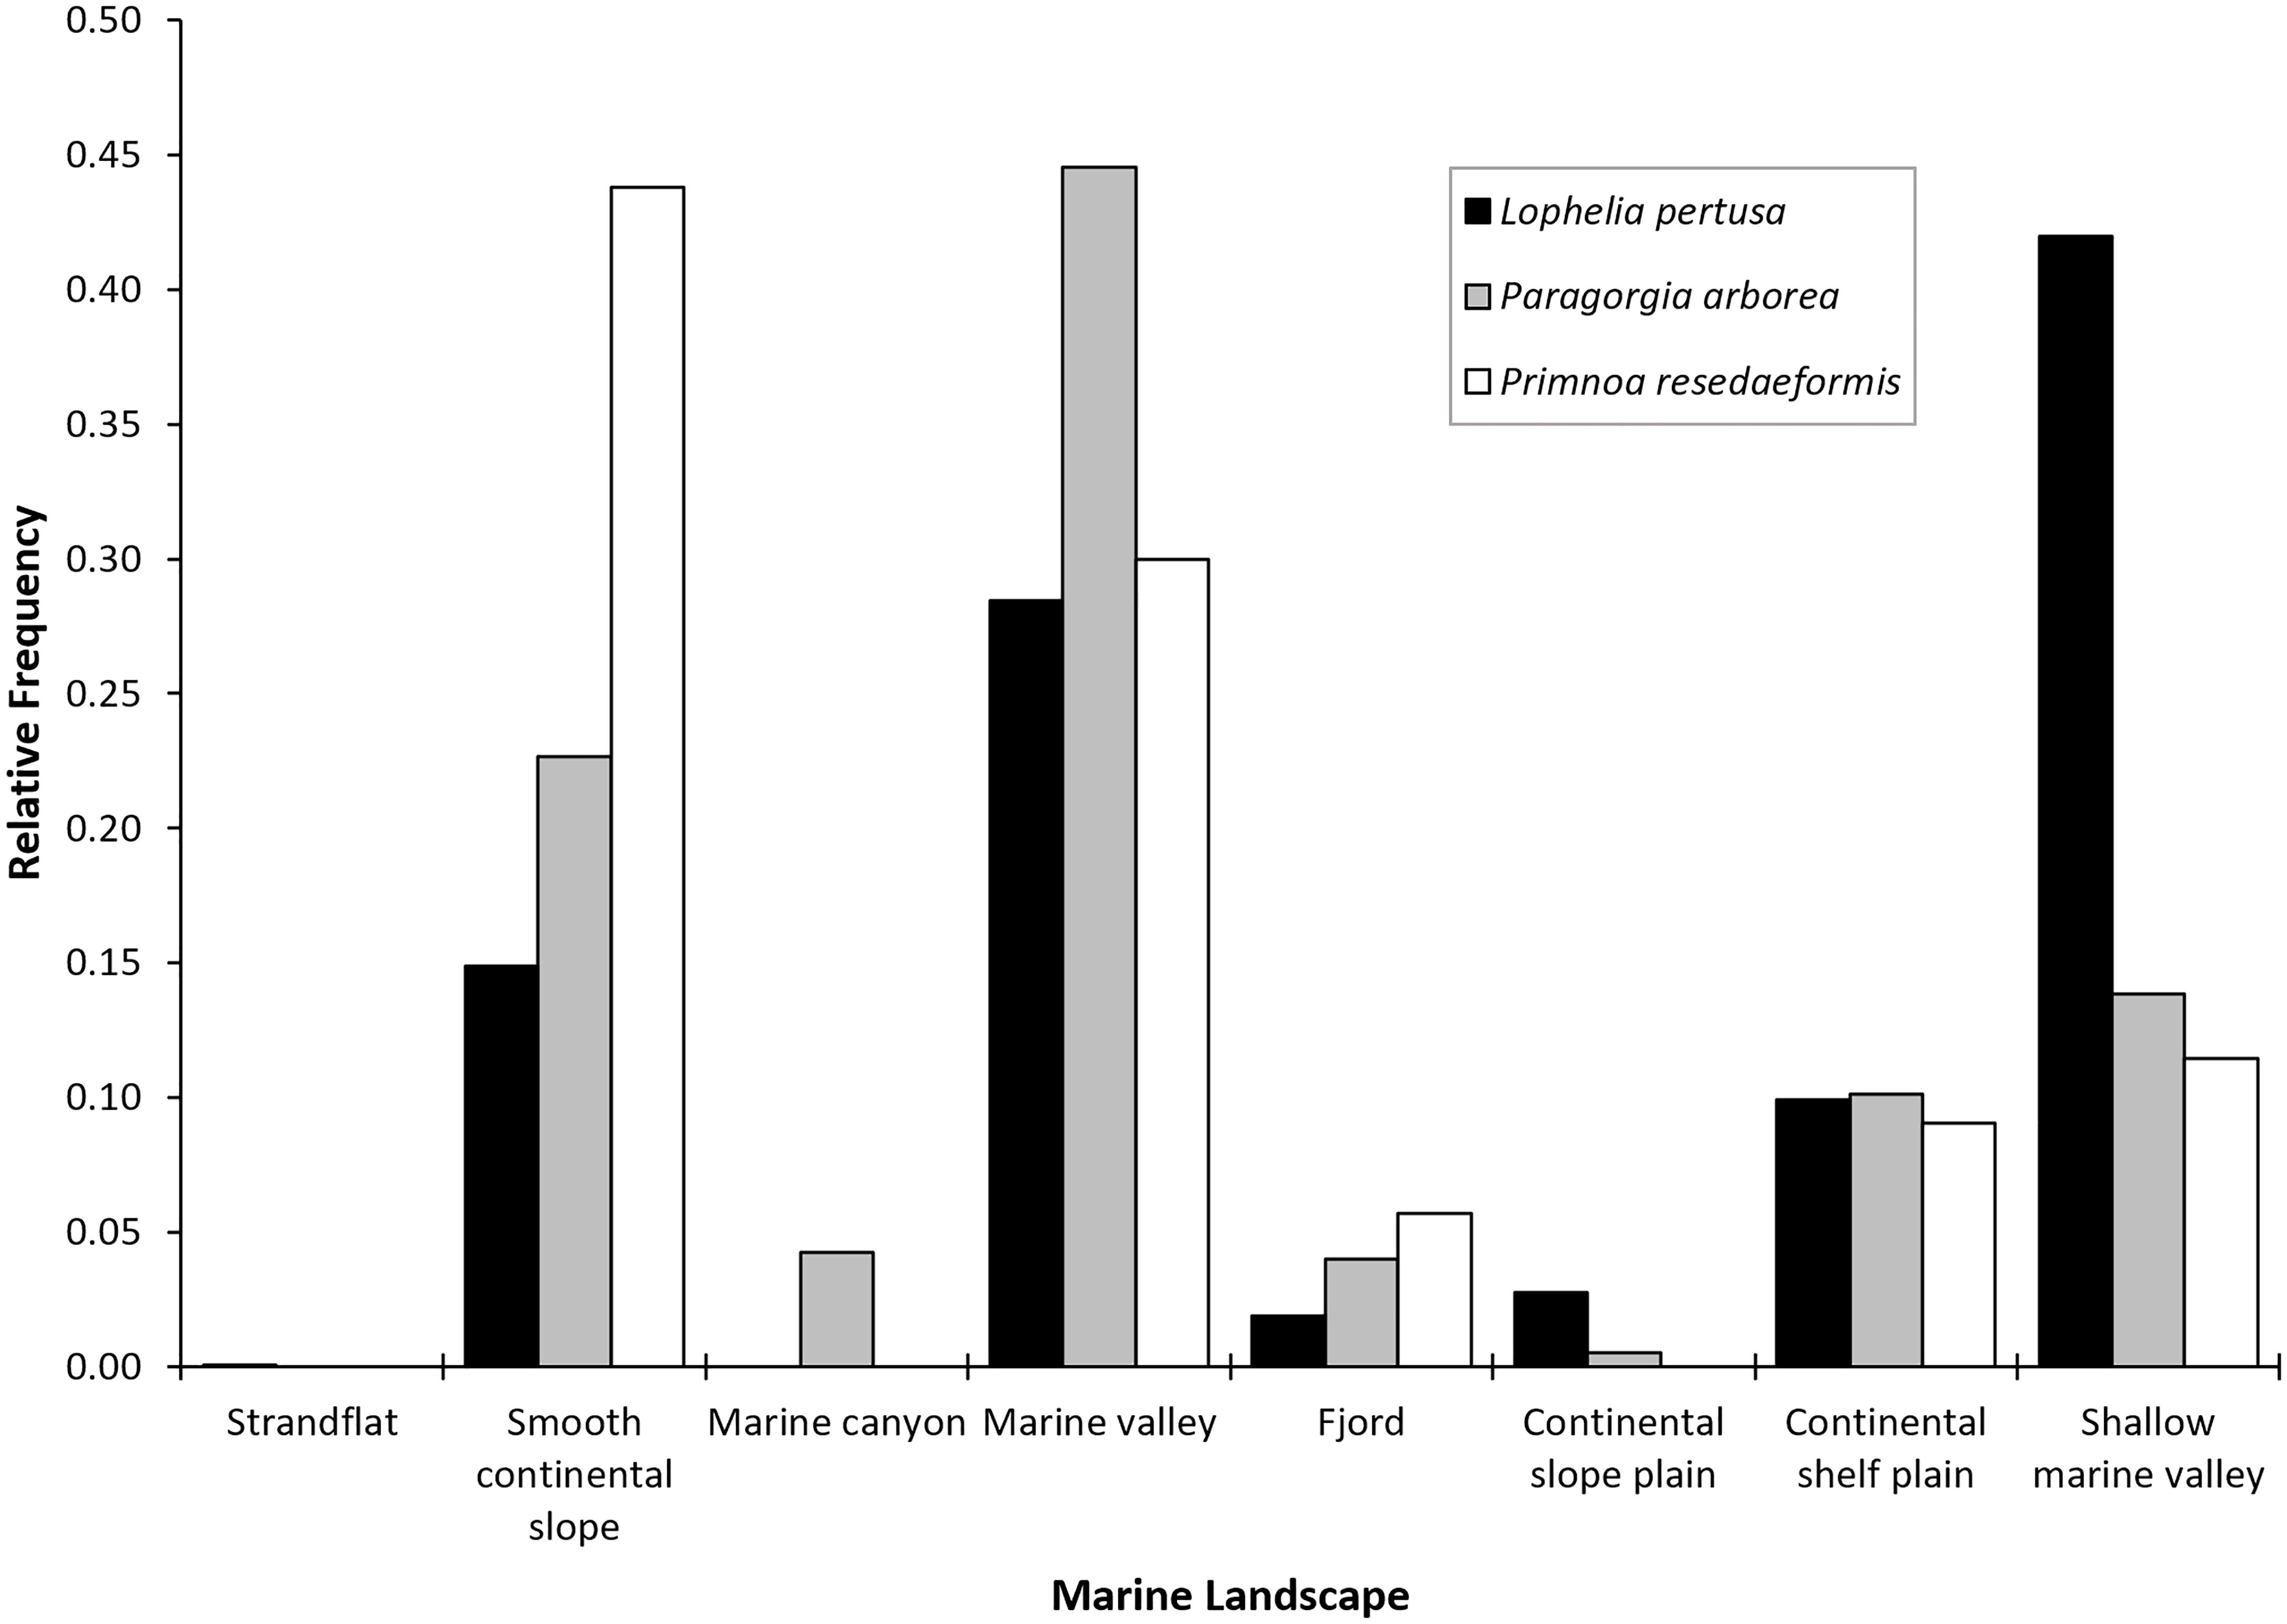
Based on MAREANO’s broad classification of marine landscapes in Norwegian waters (Figure 6), Lophelia was most frequent in shallow marine valleys, Paragorgia in marine valleys, and Primnoa on the smooth continental slope. All three species were also frequent on the continental shelf plain and to some degree in fjords. The correlations found for the continuous environmental variables are shown in Supplementary Figure S3. Variables eliminated from the model were natural-log ruggedness [ρ(2011) ≥ 0.75 (p < 0.01)], maximum current speed [ρ(2131) ≥ 0.75 (p < 0.01)], maximum salinity [ρ(2131) ≥ 0.75 (p < 0.01)], minimum salinity [ρ(2131) ≥ 0.75 (p < 0.01)], and maximum temperature [ρ(2149) ≥ 0.75 (p < 0.01)]. This resulted in a total of 15 variables used for the modeling stage.
Model Evaluation
The average 10-run test AUC was 0.931 ± 0.005 in Model 1 (excludes categorical terrain variables) and 0.933 ± 0.007 in Model 2 (includes categorical terrain variables) for Lophelia, 0.951 ± 0.008 in Model 1 and 0.945 ± 0.012 in Model 2 for Paragorgia, and 0.951 ± 0.021 in Model 1 and 0.954 ± 0.025 in Model 2 for Primnoa. The high test AUC values for all models show that the models have high discriminatory power between the test points and background data within the study area (see points on interpreting this below in the discussion). Looking at the average test gain from the Jackknife results in Figure 7 test gain is highest for Primnoa, indicating that the model concentrates around the presence points for Primnoa the most, owing perhaps to the fact that this species has the fewest presence points out of the three species and/or because this species is more restricted in its distribution.
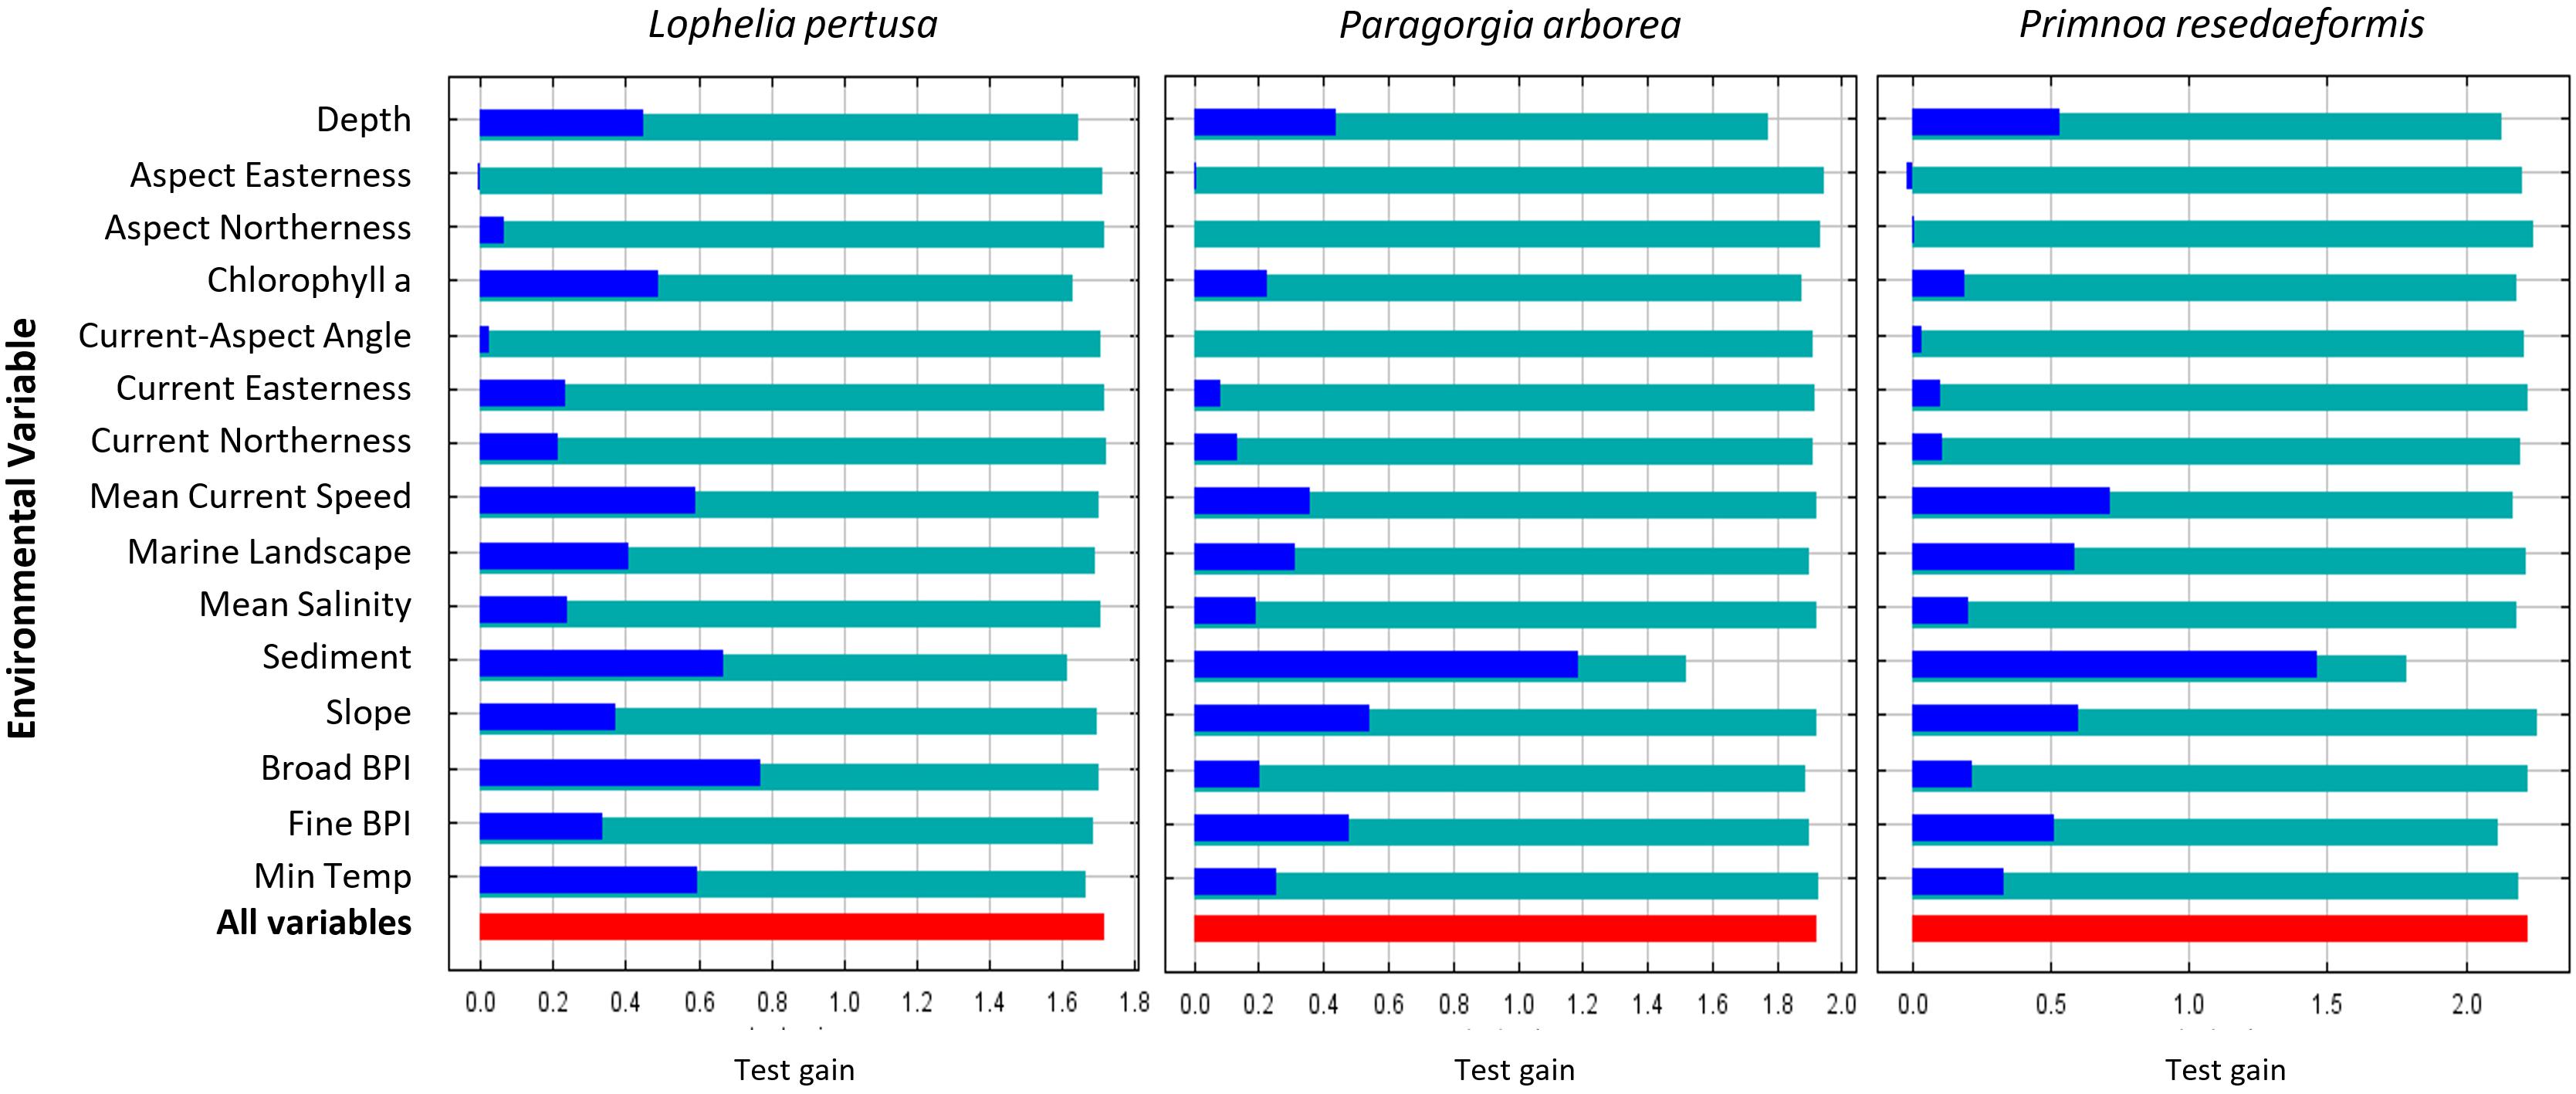
Figure 7. Average Jackknife test gain results from the 10 cross-validation Model 2 runs per species. Red bars indicate the average overall test gain, teal bars the test gain result when one variable is omitted, and blue bars the test gain result when only one variable is used in a model run.
Modeled Environmental Niches
The individual variable response curves in Figure 8 show how the Maxent model predicts the environmental niches for the three coral species, based on the values of the environmental variables at coral presence points compared to random background points within the study area. The curves show the mean response (red line) ± one standard deviation (blue shaded area) from 10 replicates for all three species from Model 2. Clamping extrapolation creates the flat predictions at the extremities, conditions that are outside the range found in the study’s presence and background points.
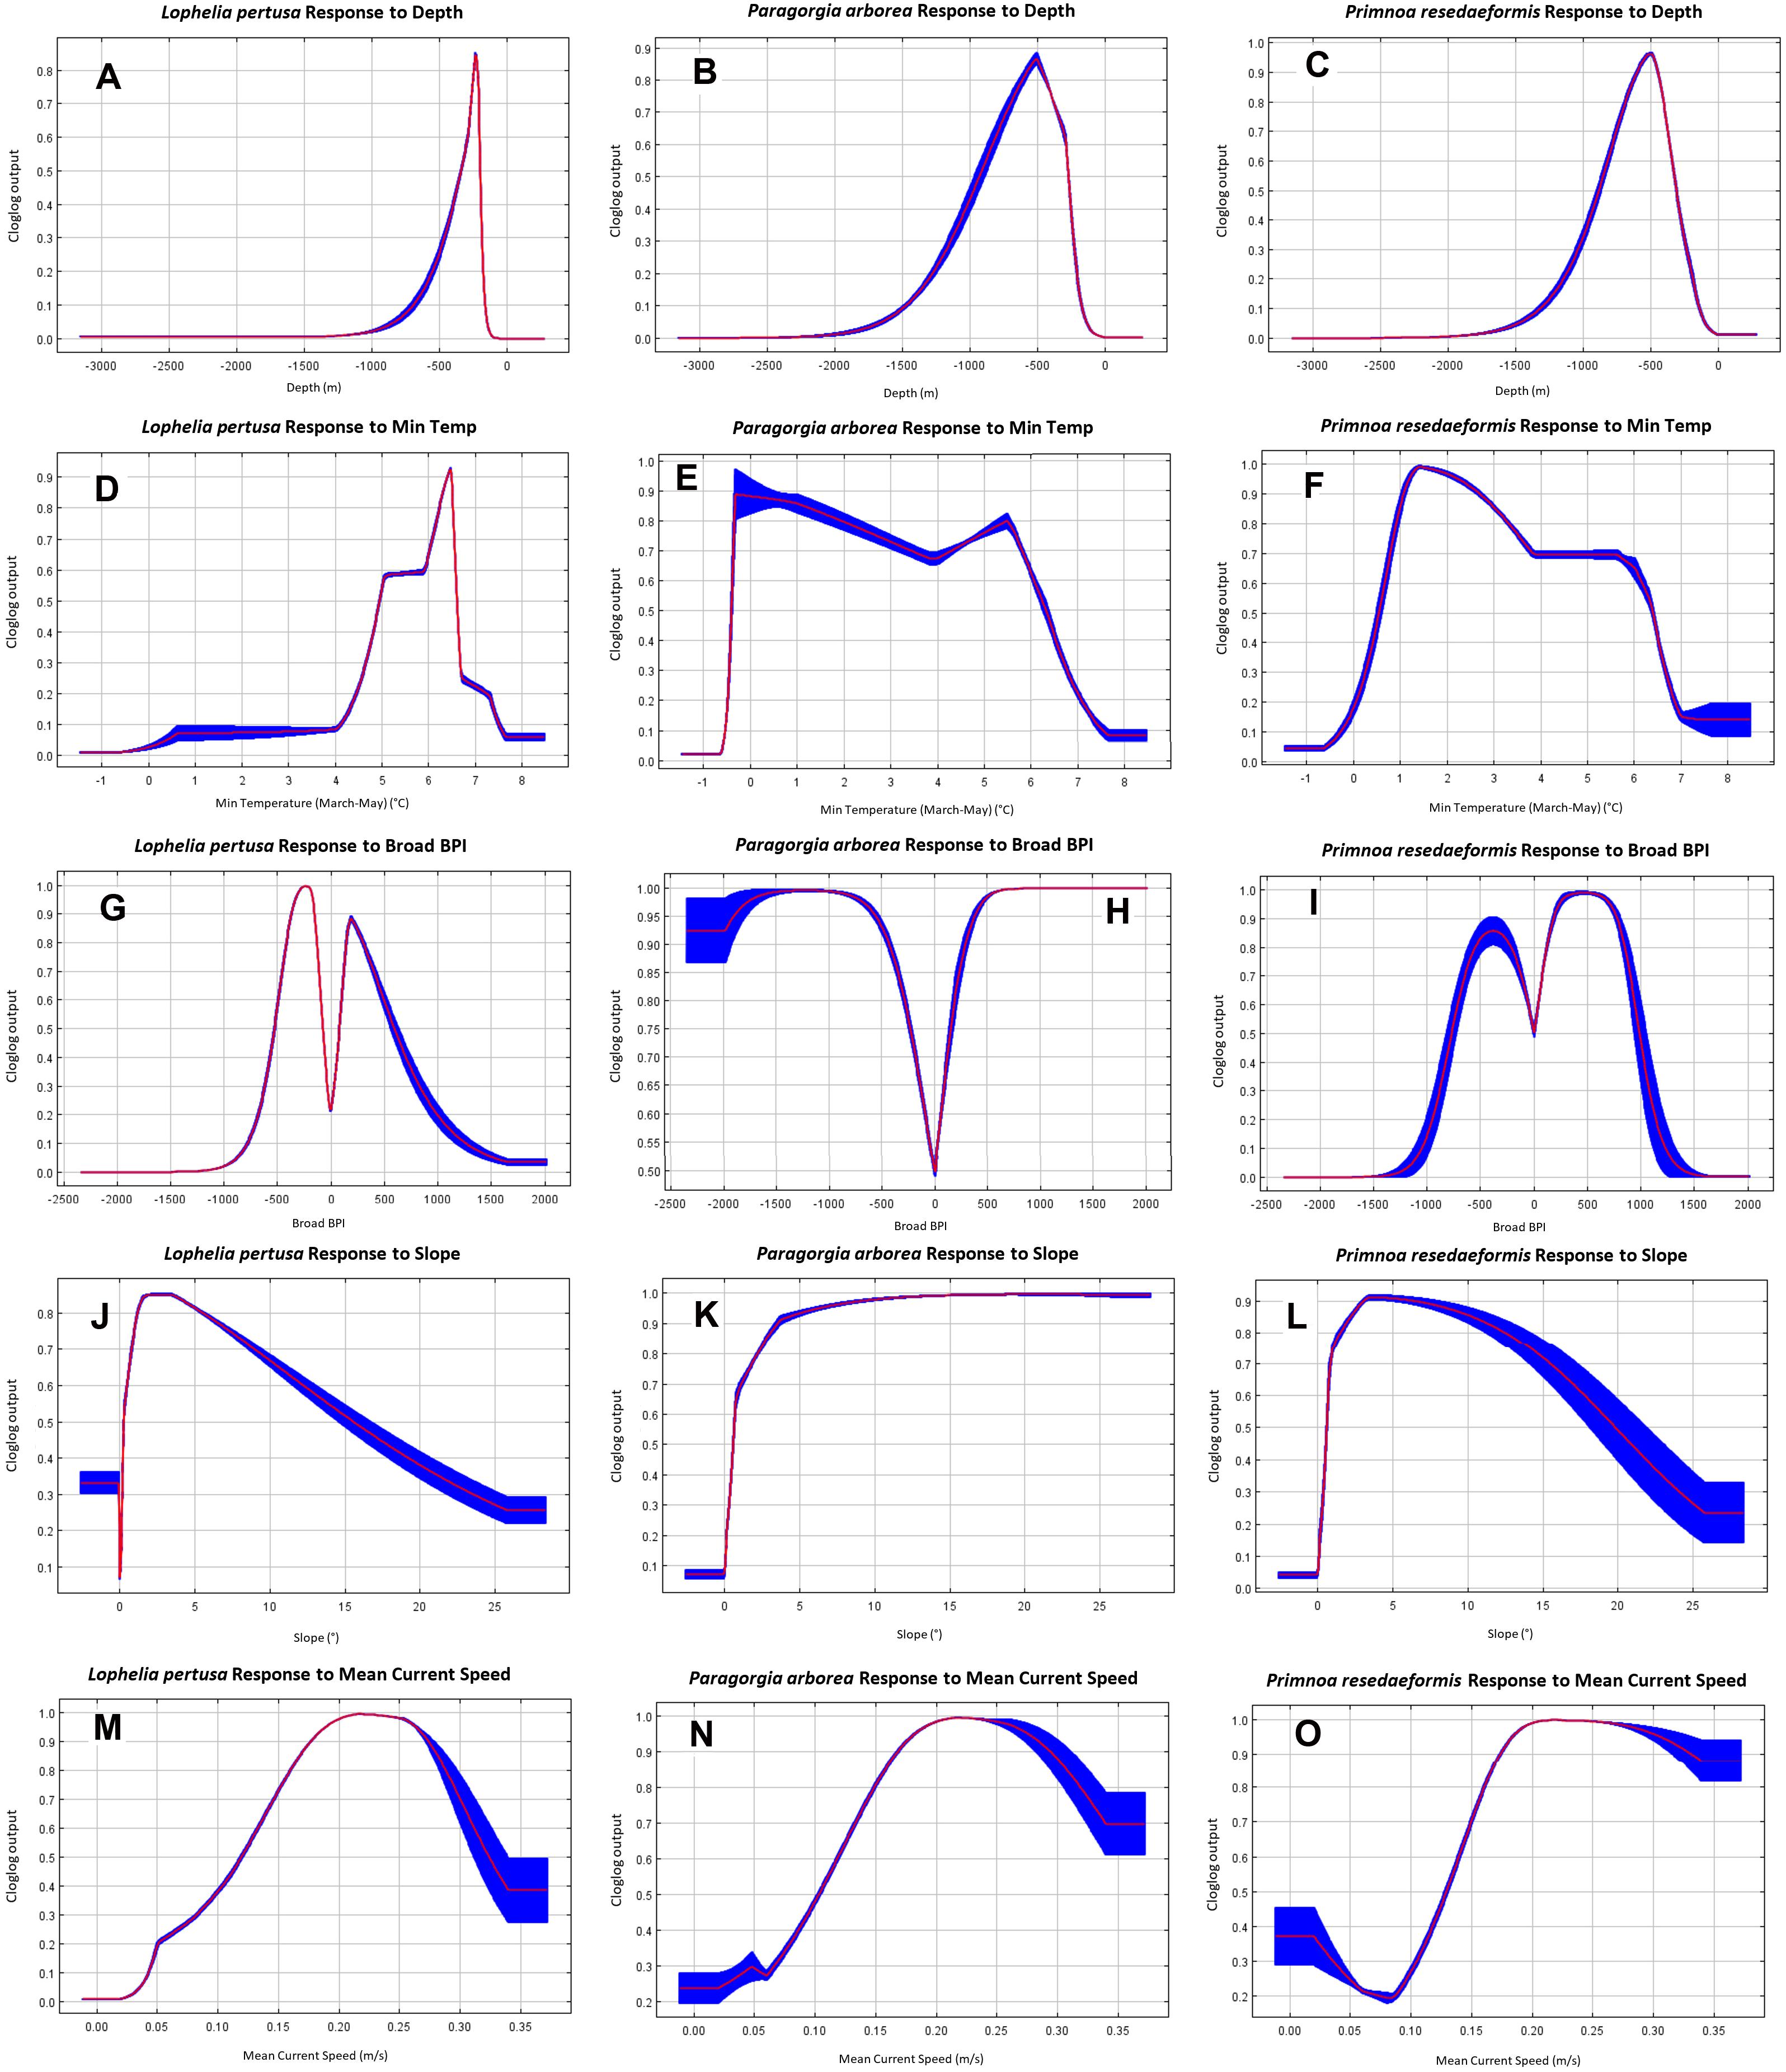
Figure 8. Model 2 individual variable response curves of each species for depth (A–C), minimum temperature (D–F), broad BPI (G–I), slope (J–L), and mean current speed (M–O).
The gorgonians appear to prefer slightly deeper, and colder, environments than Lophelia overall (Figures 8A–F). Lophelia’s temperature preference lies roughly between 4 and 7.5°C, peaking around 6.5°C, while for the gorgonians it ranges from 0 to 7°C, with a colder and a warmer peak. Paragorgia tolerates a greater range of sloping, and more convex terrain than Lophelia and Primnoa based on more certain predictions for increasing slope and extreme BPI values (Figures 8G–L). None of the corals seem to prefer flat terrain. All species have a strong response to the upper peak for mean current speed of around 0.2 m/s discussed above, as well as a small response to the slower mean current speed peak (Figures 8M–O).
In terms of sediment type (Not shown), there is very little response to clay, predominantly muddy sediment types, and gravel. There are strong responses to “gravelly muddy sand,” “sand, gravel, cobbles,” and various bedrock classifications (“thin sediment cover on bedrock,” “exposed bedrock,” “compact sediments or sedimentary bedrock”). Lophelia and Paragorgia also strongly prefer “sand, gravel, cobbles, boulders.” Out of the marine landscape categories (Not shown), Lophelia appears to mostly prefer shallow marine valleys and fjords, Paragorgia the smooth continental slope and marine canyons, and Primnoa the smooth continental slope and marine valleys.
Variable Contribution
The average test gains from Jackknife tests for the 10 Model 2 re-runs are shown in Figure 7. The red-colored bar shows the model’s average overall test gain. The teal-colored bars indicate the model’s test gain when one of the variables is omitted, showing which variables have the most unique information for the model that is not present in the other variables. The blue-colored bars indicate the model’s test gain when only one variable is used in each rerun, and the models with the least loss in test gain have the most useful information for the overall model (Philips, 2017).
For the Lophelia model, broad BPI, sediment, temperature, and current speed are the most useful variables, while sediment, chlorophyll a, and depth have the most unique information. Sediment gave the highest test gain alone for both gorgonians, and the models lost the highest amount of information without this variable. Thus, this variable is important for predicting these species’ distributions. For Lophelia, however, the sediment type was less important. The second most useful variables for the gorgonians were slope for Paragorgia and current speed for Primnoa.
Modeled Species Distribution
Model 1 extends to the full study range because sediment and marine landscape variables with limited geographical extent were not included, while Model 2 includes these two and consequently covers a smaller area. The mean SDMs after 10 model runs for all three species for Model 1 and Model 2 are shown in Figure 9.
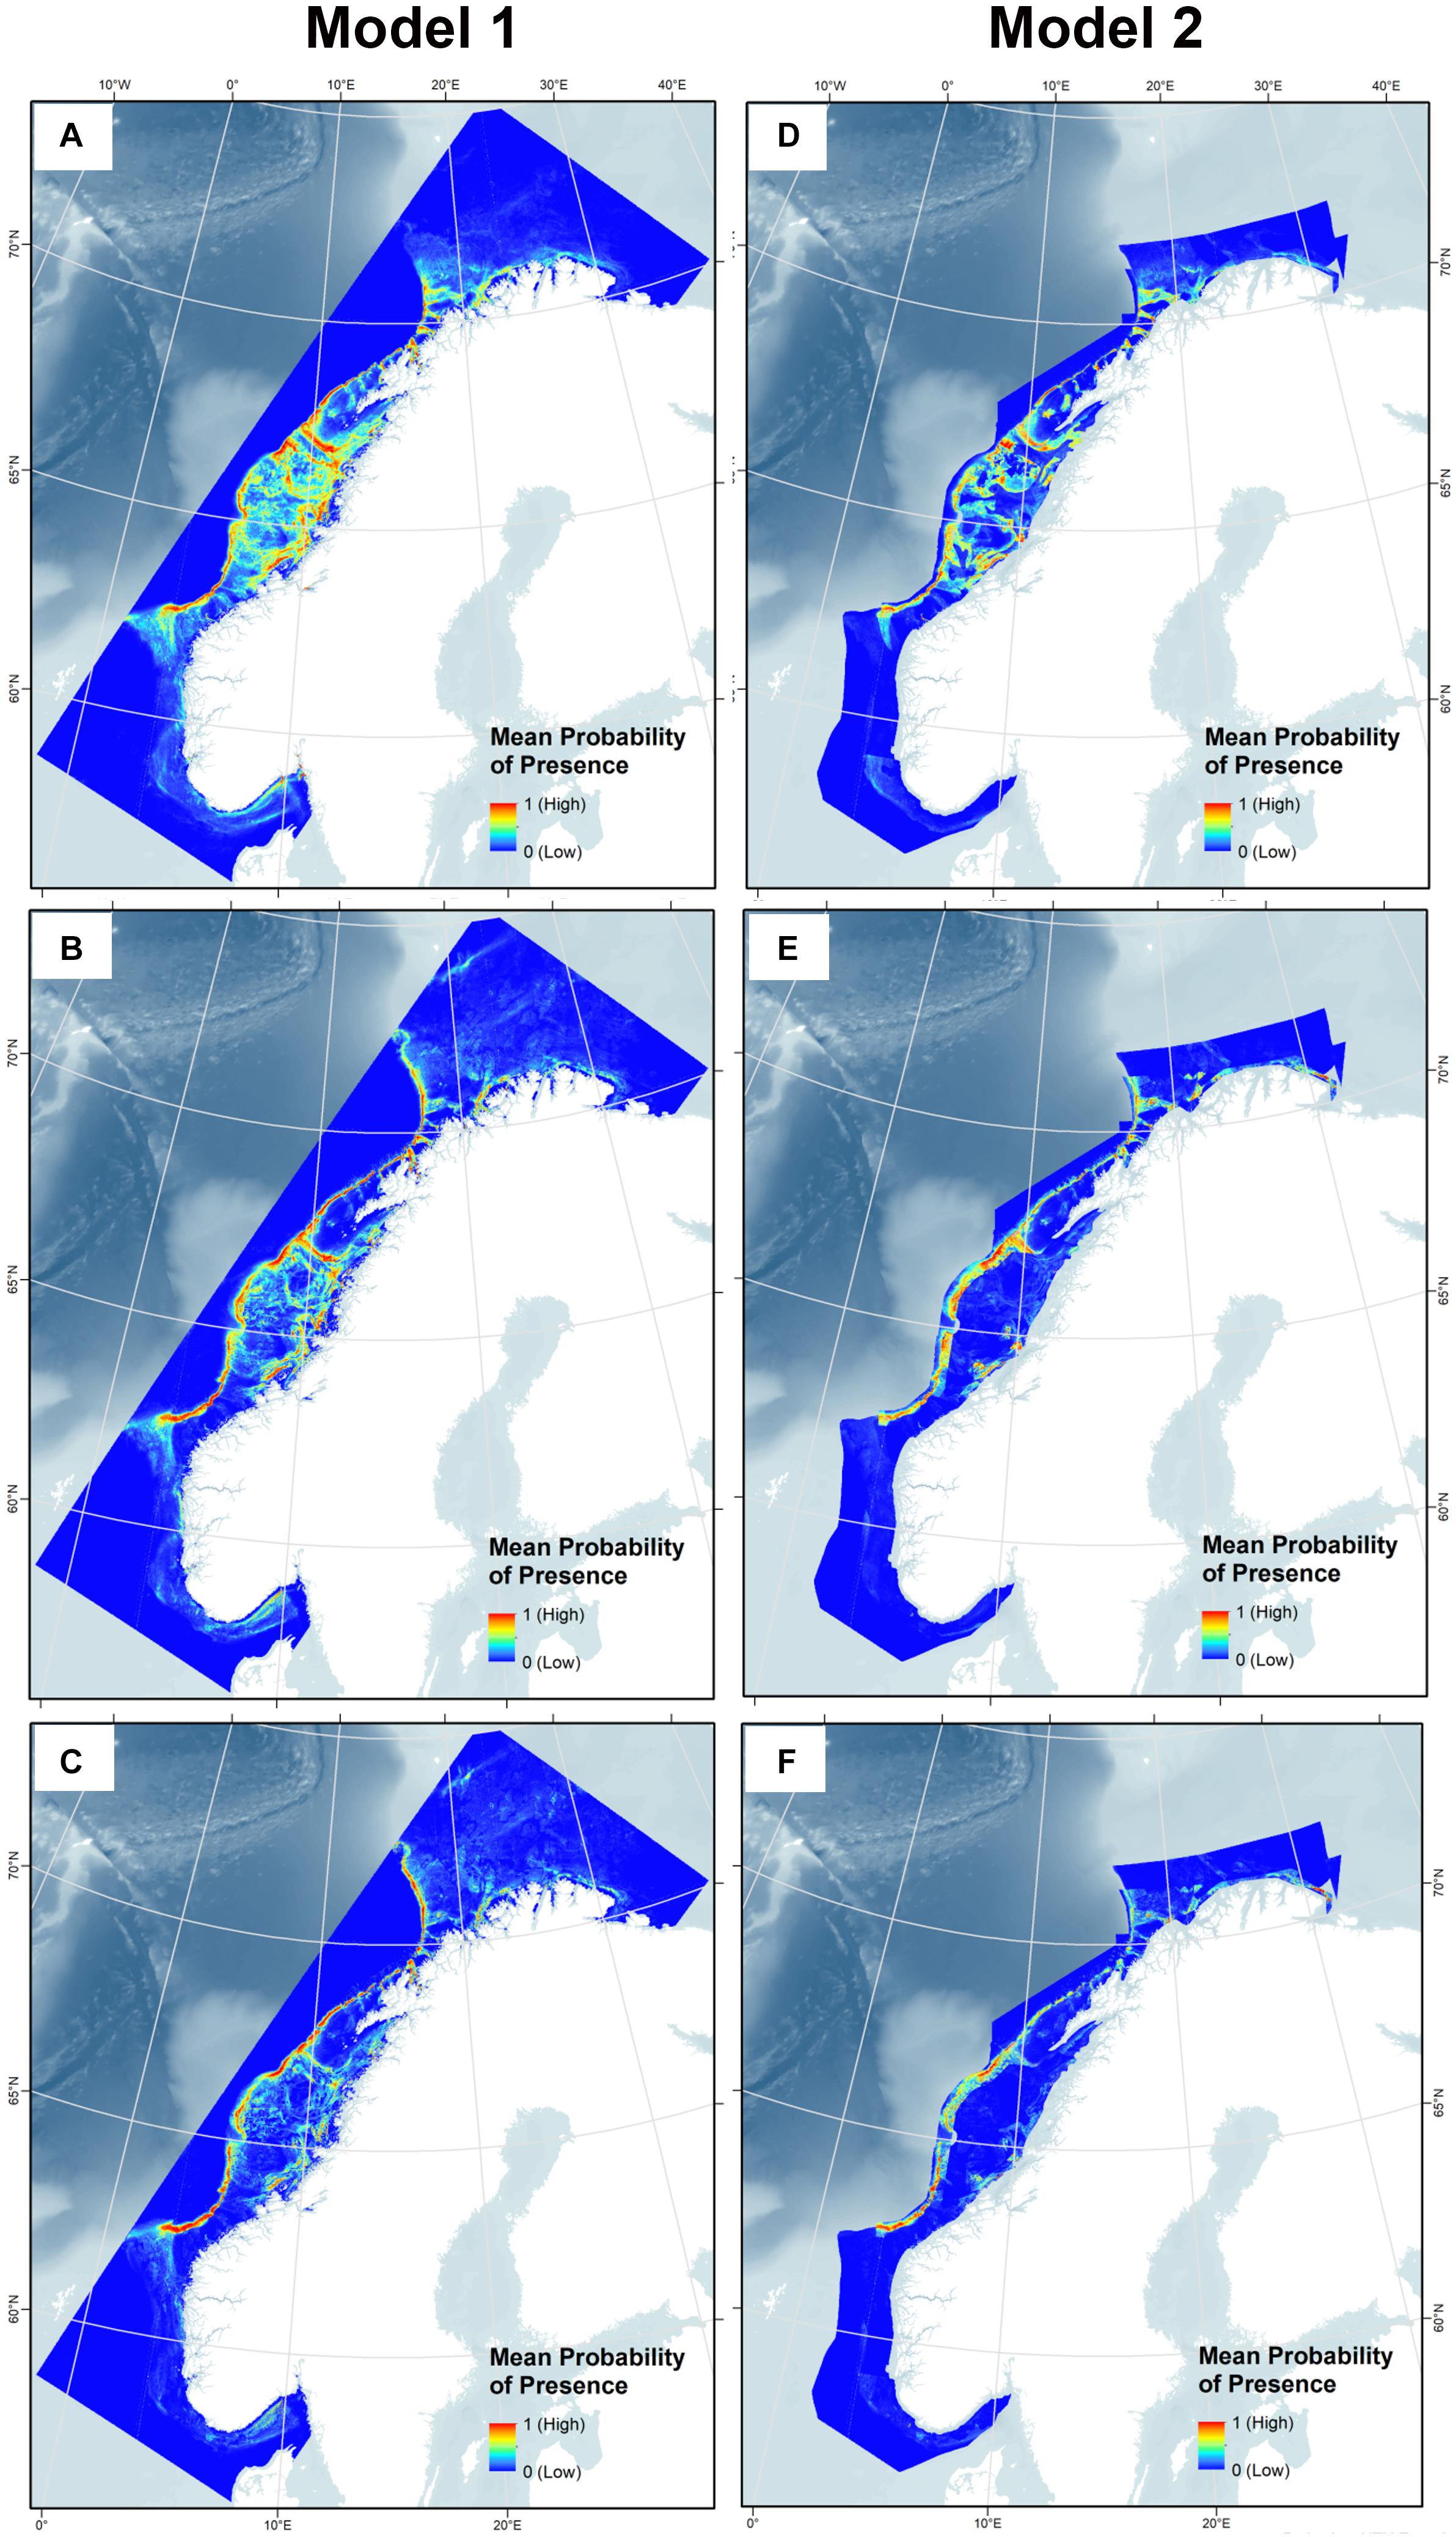
Figure 9. Habitat suitability for Lophelia pertusa (A,D), Paragorgia arborea (B,E), and Primnoa resedaeformis (C,F) on the Norwegian continental shelf using Model 1 and 2.
The predicted probability of presence showed congruency with the presence points used for the model, with presence points often overlaying red areas (highest probability of presence), as shown in Figure 10. Note that Model 2 does not cover areas closest to the coast due to the restricted sediment and marine landscape variables, so presence points within fjords are not incorporated into this model for each species. High probability of presence for all corals was predicted along the entire edge of the continental shelf from 62°N to 71°N, extending slightly further north into the Barents Sea for the gorgonians. Other high probability areas included the coastal regions of western Finnmark, the area on the shelf southwest of Lofoten (which includes the Røst Reef), Froan region with the Sula Reef, Iverryggen, in the Boknafjord around Stavanger, and some parts within the Norwegian coastal Skagerrak area. These areas are known to have many Lophelia reefs, of which many are protected against bottom trawling. Lophelia also has high probability in the Trondheimsfjord, along the western Norway coastal region (including Korsfjorden), and in the Oslo fjord. There is also some probability of presence at the coastal region running along the northern coast toward the Russian border, and the gorgonians have high probability at the most eastern point.
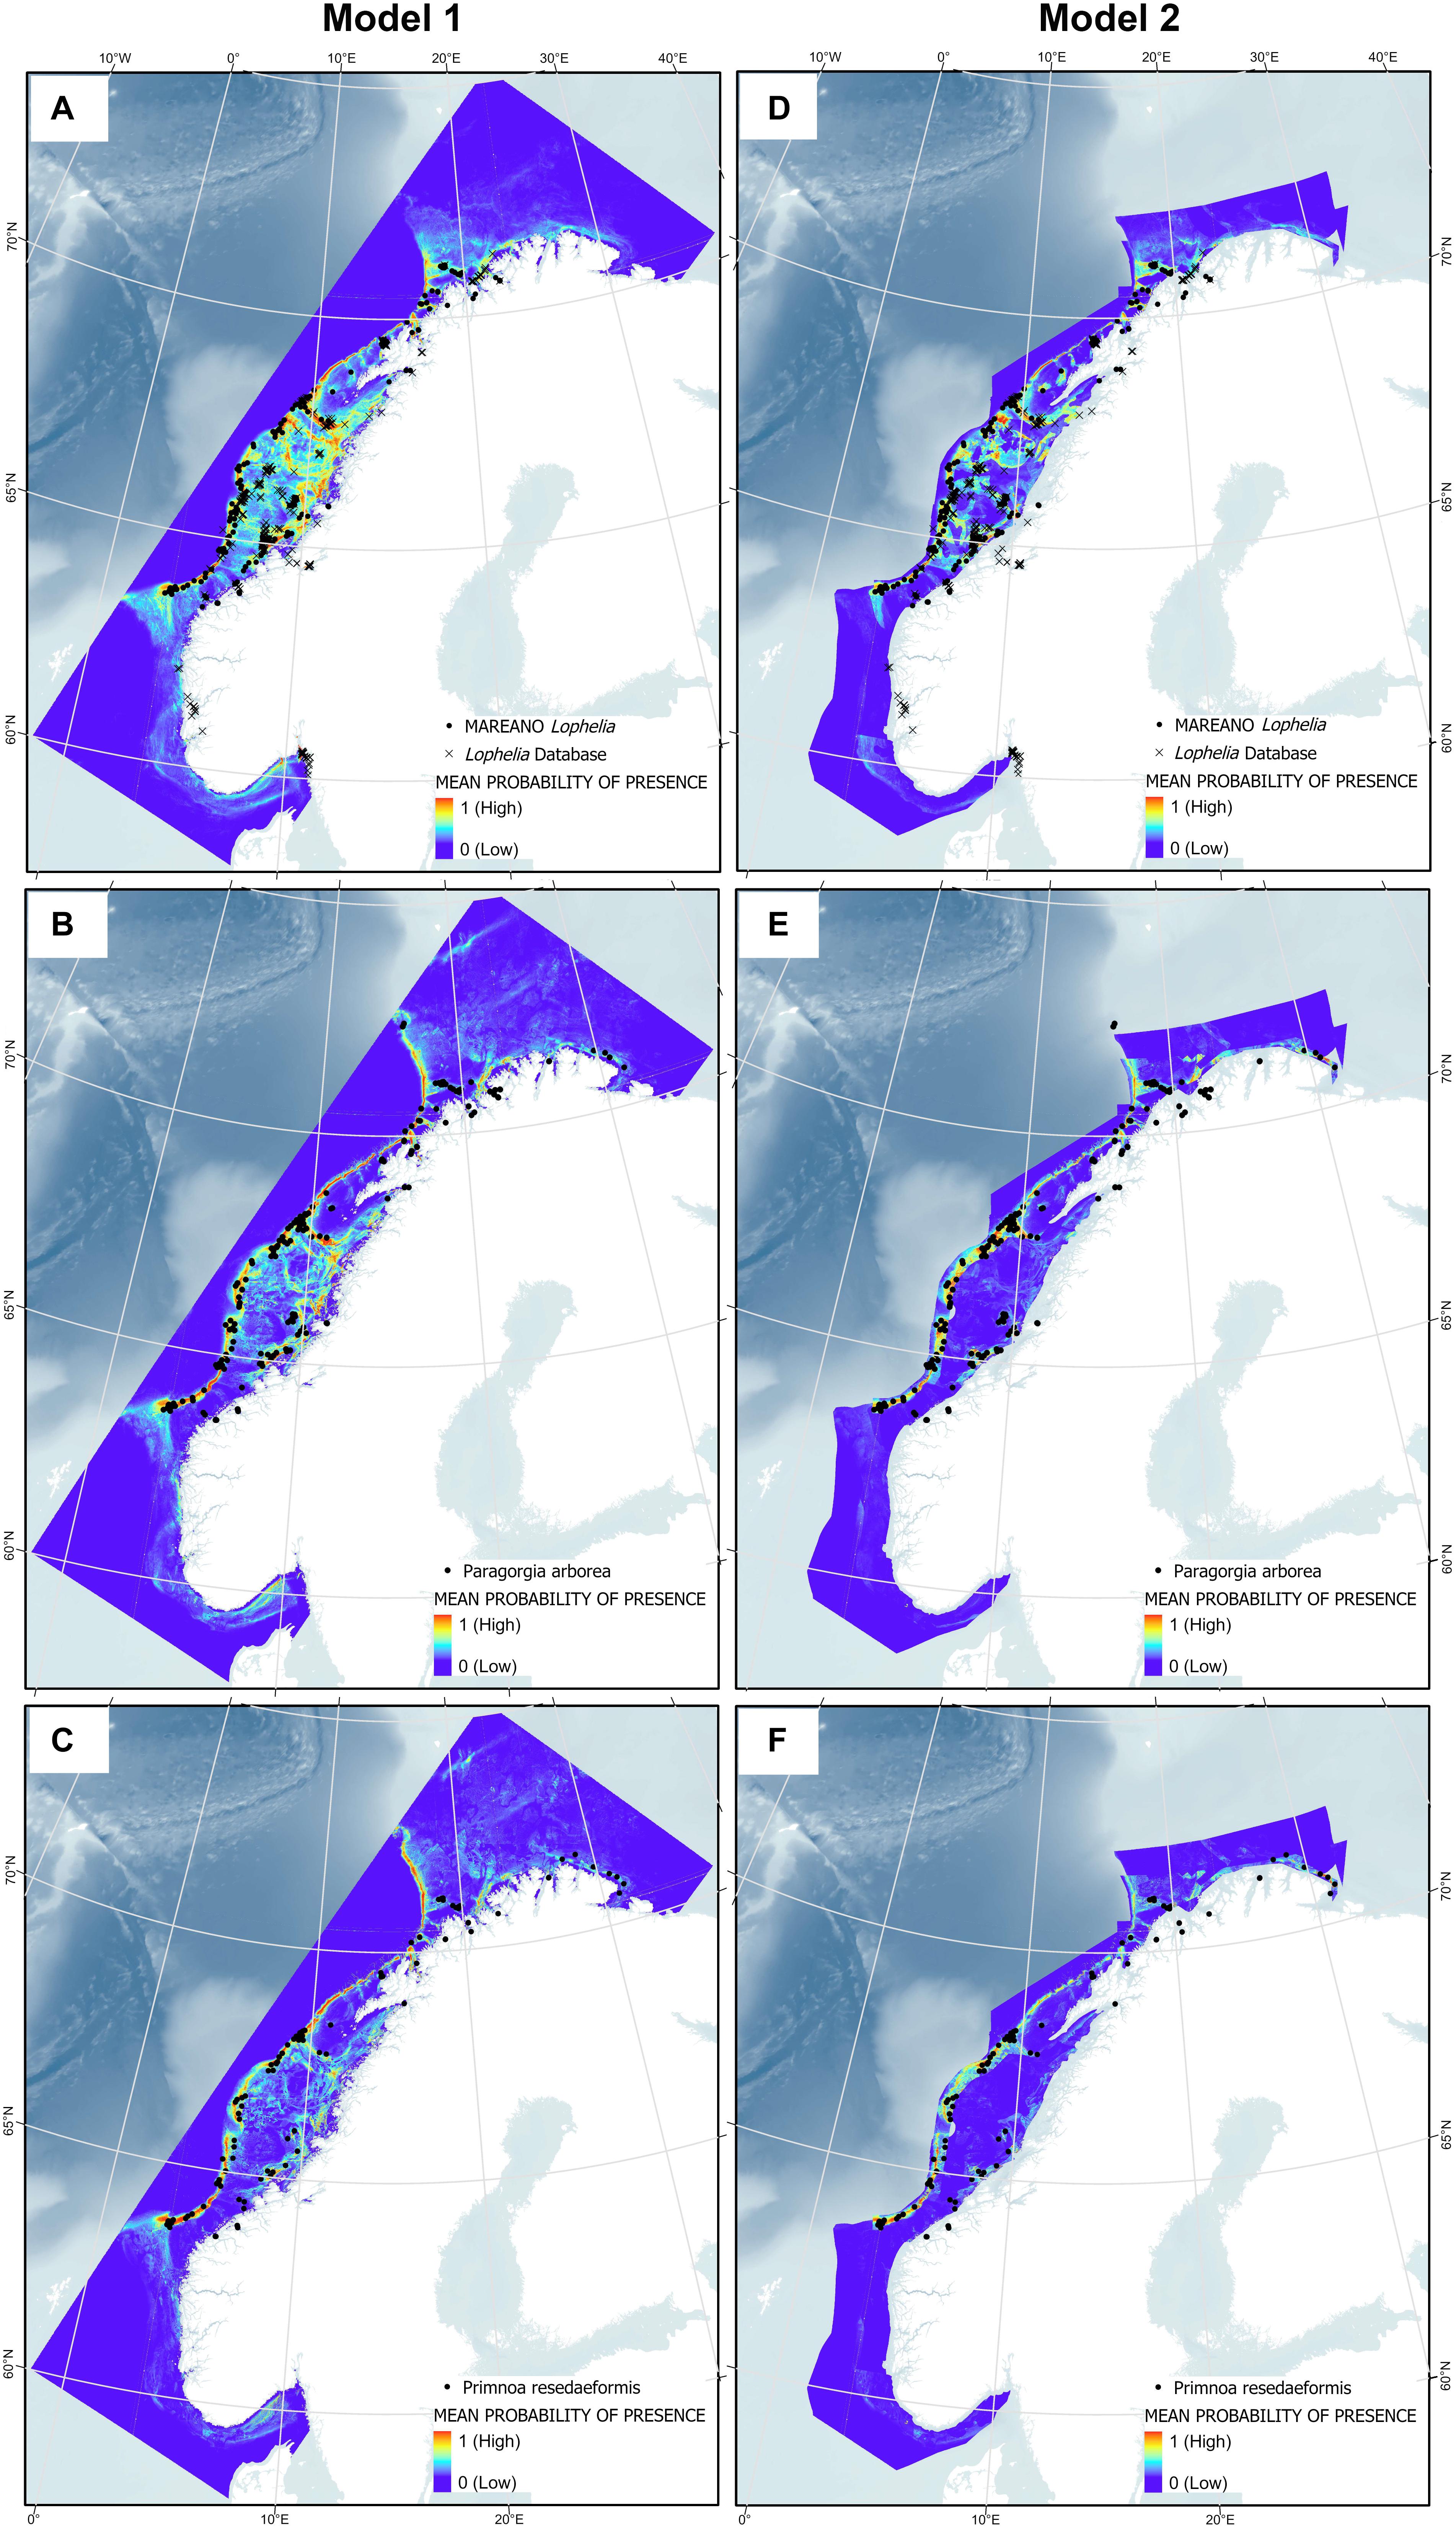
Figure 10. Presence points of Lophelia pertusa (A,D), Paragorgia arborea (B,E), and Primnoa resedaeformis (C,F) on the Norwegian continental shelf overlaying the results from Model 1 and 2.
In general, Lophelia is more widespread than the gorgonians, with green areas (at least 0.5 probability of presence) around most parts of the middle continental shelf. This becomes more restricted when the sediment and marine landscape variables in Model 2 are added; here, the gorgonians are almost entirely excluded on the continental shelf. Inclusion of the sediment and marine landscape variables overall created more defined SDMs and they were very important in model prediction (Figures 9D–F). An interesting artifact of the larger, less precise sediment classification used for the combined sediment layer is that a large chunk along the coast of Western Norway becomes entirely dark blue, especially noticeable for Lophelia; this is because this whole area is drawn as clay in the National Atlas from 1991, a sediment type to which all corals responded poorly.
Discussion
Due to limitations of surveying the deep sea, it is hard to gain a comprehensive understanding of cold-water coral distribution and niche. However, SDMs allow us to estimate these in relation to the available environmental conditions within the study area, which helps us to optimize mapping the presence of cold-water corals, such as Lophelia, Paragorgia, and Primnoa. The accuracy and precision of such models depend on the quality and density of predictor variables. Depth and geomorphology are common predictor variables for coral distribution modeling in both local and broad scaled studies (Leverette and Metaxas, 2005; Bryan and Metaxas, 2007; Davies et al., 2008; Dolan et al., 2008; Guinan et al., 2009; Ross and Howell, 2012; Georgian et al., 2014; Guijarro et al., 2016). High resolution bathymetry obtained with multi beam echosounder and interpreted substrate is in general more available at a local scale, whereas oceanographic variables (e.g., currents, temperature, and salinity), and water chemistry variables (e.g., chlorophyll, nutrients, pH) often do not exist at this spatial scale. For broad or global scales, coarse oceanographic variables together with bathymetry from GEBCO or similar data repositories has proven useful to illustrate the general distribution patterns (Davies et al., 2008; Tittensor et al., 2009; Davies and Guinotte, 2011; Yesson et al., 2012, 2017). However, recent development of high-resolution oceanographic models and oceanographic variables have proven more useful for local-scale modeling of coral distributions also at local scales (Georgian et al., 2014; Mohn et al., 2014).
Data Accuracy and Bias
Bias in data may cause inaccurate model predictions. Maxent assumes environmental conditions are represented in proportion to their occurrence within the study area (Merow et al., 2013). With sampling bias of presence points, uncertainty arises on whether predictions are due to species preference for specific environmental conditions or due to an unrepresentative sampling of the environmental conditions within the study area. The MAREANO video stations, the source of the majority of coral records, cover a wide range of geomorphometric, sediment, and marine landscape conditions in Norwegian waters. In terms of oceanographic variables, a broader range in mean temperature and current speed was represented by the oceanographic model compared to what has earlier been observed at locations for these three coral species (Buhl-Mortensen et al., 2015b). However, the range of modeled salinity was considerably smaller than the total range for the study area. This large salinity range is likely due to an area near the Baltic Sea having particularly low salinity. Range of sampled surface chlorophyll a concentration was also considerably smaller, due to a small area of high surface productivity in Kattegat (Figure 2D). A sampling bias grid was created for the MAREANO stations as a step to account for this bias connected to the choice of sampling areas.
Another potential bias is the clustering of presence points due to uneven sampling, known as spatial auto-correlation, which violates Maxent’s assumption of independent sampling (Phillips et al., 2006). Presence points from MAREANO videos are from 700 to 1000 m long transects. Thus, records can be viewed as observation clusters along the transect cluster. Clustering was reduced by grouping individual Lophelia video observation points into Coral Reef Habitat points, removing duplicate Lophelia points, and generally removing duplicate points for a species within a raster cell.
The number of background points, which can be points at any location within the study area (whether a presence or not), also affects the predictive power of the model. Increasing the number increases the AUC because the chance of selecting points that are different from sampled presence locations is larger, and the model will better discriminate between presence and background points (Acevedo et al., 2012). However, this can result in over-prediction (Chefaoui and Lobo, 2008). Like most studies using SDM, the default of 10,000 background points was used here (Fourcade et al., 2014). Finally, for the regularization multiplier, the control on the effect and number of factors used to create coefficients to the model, we used the standard setting of 1. A lower multiplier would result in too many constraints and make the model overfit, while a higher multiplier would give a more diffuse prediction (Philips, 2017).
The quality of the model results is only as good as the quality of the input environmental data. The oceanography data points from Norkyst-800 were 800 m apart and new continuous values was created by interpolation between the original points, which may not reflect actual conditions between the points. This could increase the deviation in temperature and salinity in steep terrain where there is a steep gradient in the relationship between depth temperature, and salinity. Also, converting the sediment and marine landscape shapefiles into rasters using the maximum combined area cell assignment type causes smaller vectors to be eliminated, though it is a small inconvenience as this assignment type chooses the value that covers most of a cell.
The resolution of environmental layers is likewise an important factor to consider. When Davies et al. (2008) modeled with the Ecological Niche Factor Analysis (ENFA), the model indicated temperatures outside of Lophelia’s known tolerance range because the grid resolution was not high enough. In this study, some points of Paragorgia had temperatures of around −0.3°C, outside its known tolerance; selecting these points in ArcMap indicated they were located on the continental margin. This suggests that large differences present at a short horizontal distance at the continental margin may not be captured within a 176 m grid cell (or the original 800 m for the oceanographic data), potentially assigning the values from the deeper area to the cells where the coral points were.
Broad areas particularly along the western coast had low probability of presence, and these areas matched the extent of clay sediment presence. Clay sediment gave a very low response for all three coral species, too soft a substrate for the corals to settle on. However, these broad sediment categorizations originate from the coarse “Continental Shelf” sediment map used to supplement the more restricted “Regional” sediment map, which in turn gave these coarse predictions. Lastly, the bathymetry map obtained from EMODnet and derived geomorphometric maps have straight lines in some areas that give false terrain variation, which is an artifact of obtaining data from different sources with differing sampling precision (Gunleiksrud and Hodnesdal, 2013).
The geographic precision is within 10 m for the corals observed from the MAREANO mapping. However, many of the historic records of Lophelia from the “Lophelia database” have an uncertainty of up to 100 m. Compared to the relative broad gridding of the predictor layers, these records are not a great source of uncertainty in the model. Misidentifying the corals in video records may happen, however. This is demonstrated by the occurrence of unusually deep records of Lophelia (715 m depth, Table 3), in areas where the cold deep water mass is not likely to support live Lophelia. These observations could be dead coral skeleton that have been transported down slope from nearby shallower areas.
Predicted Distributions and Niches
Twenty environmental variables were initially considered for analyzing the potential distribution of Lophelia, Paragorgia, and Primnoa on the Norwegian continental shelf, but elimination of some correlating variables resulted in 15 variables used for the actual modeling stage.
The models indicated high probability of presence for all three coral species along the continental margin from Møre og Romsdal up to Tromsøflaket, and along the northern Norwegian coast toward the Russian border. Large areas on the continental shelf southwest of Lofoten also showed high probability, which includes the Røst Reef, the largest known Lophelia reef found thus far (Fosså et al., 2005). Other areas of interest near the Norwegian coast were particularly the northern Lofoten/Tromsøflaket region near the continental margin and Lopphavet, and the Froan region with the Sula Reef (Freiwald et al., 2002). Fjords were also areas of high probability, specifically within the Trondheimsfjord (only Lophelia), as well as outside the Geirangerfjord, Korsfjorden, and the outer Oslo fjord, for which the environmental data layers do not extend into. Overall, the models confirm present species observations. When the sediment and marine landscape variables were included, there were more high probability areas for the gorgonians along the northern coast in the Barents Sea toward the Russian border.
The models confirmed previous observations (Järnegren and Kutti, 2014) of a very distinct coral response to a narrow salinity range close to 35 PSU, and other observations (Brooke and Järnegren, 2013; Buhl-Mortensen et al., 2015b) that Lophelia has a shallower preferred depth range (approximately 100–500 m) compared to Paragorgia and Primnoa (up to 1000 m). Temperature reflected this depth pattern, with a window of approximately 4–7.3°C for Lophelia, compared to 0.7–7.3°C for the gorgonians.
Regional maximum depths for Lophelia generally reflect different maximum depths of water masses with suitable temperatures for the corals (Frederiksen et al., 1992; Mortensen et al., 2001). Off the Norwegian coast, Lophelia reefs are most abundant at depths between 200 and 400 m, and the deepest presence at around 500 m coincides with the shallowest occurrences of the boundary layer between the relatively warm North Atlantic Current and the cold Norwegian Sea (Buhl-Mortensen et al., 2015b). This warm Atlantic water is also found in the basin south of Iceland where Lophelia is found down to over 1000 m (mostly dead samples, BIOICE data). The low number of records from Canada and Davis Strait can be explained by the strong Labrador Current from north to south that prevents the warm Gulf Stream from reaching the continental margins, which prohibits further northward colonization of this coral species. Likewise, the distribution of Paragorgia in the North Atlantic is connected to the North Atlantic Current, which is characterized by temperatures generally between 4 and 8°C and stable salinity around 35 PSU (Tendal, 1992). Madsen (1944) regards Paragorgia and Primnoa as extremely stenothermal requiring temperatures between 5 and 8°C. However, their minimum temperature is colder, down to 2°C (Buhl-Mortensen et al., 2015b). Mortensen and Buhl-Mortensen (2004) found a shallower upper limit for Primnoa than for Paragorgia off eastern Canada and suggested that the maximum temperature for Primnoa is about 2°C higher than for Paragorgia. This difference was not indicated in this study, which may be due to local environmental differences other than temperature and salinity, or that the shallower range of the MAREANO mapping area is more poorly represented than deeper locations.
All corals showed preference for exposure to a relatively high mean current speed, especially around 0.20 m/s, confirming the importance of flowing water, for, e.g., feeding and resuspension of sediment deposition (Davies et al., 2009). However, the angle at which the current hits the slope (“current-aspect angle”) where corals occur did not indicate a coral specific response. The rose diagrams showing the distribution of current direction observations show that all three species resided mostly on slopes with currents flowing parallel or slightly parallel to the terrain, and fewest observations were made for currents that hit (180°) or pass over (0°) the slope directly. This may indicate that not directly incoming or outgoing currents is a better condition for the corals, or it is simply an artifact of the dynamics of current-slope interaction. However, aspect and current-aspect angle in general were the least useful model predictors for all three corals. The current-aspect angle does not differentiate between currents heading from the land with currents heading toward land, on a broad scale. A modified variable differentiating between these situations could possibly have a greater explanatory power for the coral distribution. Preference for sloped terrain was indicated by species response not dropping with increasing slope, and by a strong response for non-flat terrain. The corals’ relation to topographic features reflects a correlation of topography and other factors such as substrate type and food availability. Lophelia’s preference for negative BPI (troughs) is probably caused by favorable current dynamics bringing food to the reefs. The difference between Lophelia and the two gorgonians with respect to aspect may be related to marine landscape-influenced current patterns. Lophelia showed a preference for shallow marine valleys and fjords, while the gorgonians preferred the smooth continental slope, marine canyons (Paragorgia) and marine valleys (Primnoa). Controlled by the Coriolis force and the topography, the currents in marine valleys (troughs) and fjords may differ on the two sloping sides having opposite aspect.
Surface productivity, on the other hand, had a more considerable effect on Lophelia presence than for the gorgonians. Lophelia has a varied diet, ranging from ingesting copepods to utilizing dead particulate matter, so it can benefit directly from particulate matter brought down to the surface (Frederiksen et al., 1992; Mortensen, 2001; Mortensen et al., 2001). As also indicated by Sherwood et al. (2008), we assume that also the two gorgonians would benefit from enhanced surface production. However, this factor might be of less importance compared with Lophelia, or the difference could be due to a stochastic effect related to low number of observation points for the gorgonians compared to Lophelia.
The overall AUC values for each species were slightly higher in Model 2 than in Model 1, suggesting that including sediment and marine landscape as predictors allows the model to better discriminate between species presence and absence. Species distribution was more restricted with these two variables included. Sediment type was clearly an important predictor of distribution for all species according to the Jackknife results. This was especially so for the gorgonians, with clear loss to the goodness of fit of the trained model (training gain) and to presence-background discrimination when this variable was omitted (when using test points, i.e., test AUC). Training gain and test AUC also decreased the least for the gorgonians when only sediment type was used, meaning sediment type could predict gorgonian presence well when used alone. Paragorgia and Primnoa require more solid substrate (boulder and bedrock) than Lophelia does, which creates its own substrate (coral skeleton framework) after initially settling on smaller hard substrate, such as pebble. In this study, the gorgonians most frequently occurred on Lophelia reefs according to MAREANO’s video records; this bioclastic bottom type was removed from the sediment layer. In this case, the substrate of the Lophelia-reefs can be regarded as substrate for Paragorgia and Primnoa. Moreover, Lophelia has been observed to grow on oil platforms in the North Sea (Bell and Smith, 1999), indicating that artificial substrates may provide settling opportunities in the absence of natural substrates, when other environmental conditions are suitable.
Study Implications
Evaluating accuracy of SDMs with only AUC should be done with caution, especially if the AUC is very high. If only background points are used when absence data is lacking, there is a higher degree of uncertainty of the probability of absence than there is for presence. False prediction of absences is therefore more likely to occur than false prediction of presences (Lobo et al., 2008), which means the model could potentially be over-predicting. It is better to over-predict slightly than to under-predict, however, since the modeled areas of high probability can be verified further with bottom cameras, for example; such field validation will also further improve model accuracy (Davies and Guinotte, 2011).
The actual realized distribution of corals could also be more limited than predicted due to, e.g., physical barriers that limit potential coral dispersal or bottom trawling that may have destroyed and removed corals from suitable areas (Elith, 2000). Also, climate change may alter the distribution of suitable habitat for coral: changes in sea level and consequently in currents and food delivery may affect the growth and waning of corals, as proposed for coral in the Porcupine Seabright (Rüggeberg et al., 2007).
Future studies could include other variables not used here, such as calcite and/or aragonite saturation state, which were found to contribute greatly to models for octocoral suborders (Yesson et al., 2012) and for Lophelia (Davies et al., 2008; Davies and Guinotte, 2011), or oxygen measurement (Yesson et al., 2012; Buhl-Mortensen et al., 2015b). Depth could be left out since, like in the study of Yesson et al. (2012), many variables utilized the bathymetry layer. Ideally, different regularization values should be explored, too, and the resulting models compared to obtain the best model that is simple and predicts accurately at the same time (Merow et al., 2013).
A combination of threats, from bottom trawling to particles released from the oil and mining industries, to ocean acidification and warming, put cold-water corals under pressure, especially those living near their tolerance threshold. About 30% of all known Lophelia occurrences so far are on the Norwegian continental shelf (Järnegren and Kutti, 2014). The threats as well as abundance of cold-water corals give Norway a great responsibility in leading their conservation, but also a head-start. The models created in this study should serve as guidance for further finding, studying, and conserving Lophelia, Paragorgia, and Primnoa.
Data Availability Statement
The datasets generated for this study are available on request to the corresponding author.
Author Contributions
HS analyzed data and authored the manuscript. PB-M and LB-M co-authored the manuscript.
Conflict of Interest
The authors declare that the research was conducted in the absence of any commercial or financial relationships that could be construed as a potential conflict of interest.
Acknowledgments
The data used were obtained with thanks from MAREANO, the NASA’s Ocean Biology Processing Group, EMODnet, Norkyst-800, and data under the Norwegian license for public data (NLOD) made available by Norges geologiske undersøkelse (NGU). Thanks to Jon Albretsen (IMR) and Genoveva Gonzalez-Mirelis (IMR) for constructive help with the manuscript.
Supplementary Material
The Supplementary Material for this article can be found online at: https://www.frontiersin.org/articles/10.3389/fmars.2020.00213/full#supplementary-material
FIGURE S1 | Current-aspect angle. For same direction as aspect: 0°, toward the aspect: 180°, perpendicular to the aspect: 90°.
FIGURE S2 | Rose diagrams for current-aspect angle (number of occurrences in five sections).
FIGURE S3 | Scatterplot matrix produced with the MGET plug-in for ArcGIS on all coral presence points for all continuous variables. The Spearman’s Rank ρ value for each variable pairing is in the upper right half, distribution of each variable in the diagonal, and a scatterplot with a line of best fit in the lower left half. Correlation pairings with ρ ≥ 0.75 are outlined; variables eliminated for the Maxent analysis are highlighted (from top-left to bottom-right): Max current speed, Ln ruggedness, max salinity, min salinity, and max temperature.
References
Acevedo, P., Jiménez-Valverde, A., and Lobo, J. M. (2012). Delimiting the geographical background in species distribution modelling. J. Biogeogr. 39, 1383–1390. doi: 10.1111/j.1365-2699.2012.02713.x
Albretsen, J., Sperrevik, A. K., Staalstrøm, A., Sandvik, A. D., Vikebø, F., and Asplin, L. (2011). NorKyst-800 Report No. 1 - User Manual and Technical Descriptions. Bergen: Havforskningsinstituttet - Institute of Marine Research.
Anderson, R. P., and Martínez-Meyer, E. (2004). Modeling species’ geographic distributions for preliminary conservation assessments: an implementation with the spiny pocket mice (Heteromys) of Ecuador. Biol. Conserv. 116, 167–179. doi: 10.1016/S0006-3207(03)00187-3
Andrews, A. H., Cordes, E. E., Mahoney, M. M., Munk, K., Coale, K. H., Cailliet, G. M., et al. (2002). Age, growth and radiometric age validation of a deep-sea, habitat-forming gorgonian (Primnoa resedaeformis) from the Gulf of Alaska. Hydrobiologia 471, 101–110. doi: 10.1023/A:1016501320206
Bell, N., and Smith, J. (1999). Coral growing on North Sea oil rigs. Nature 402:601. doi: 10.1038/45127
Breeze, H., and Fenton, D. (2007). Designing management measures to protect cold-water corals off Nova Scotia, Canada. Bull. Mar. Sci. 81, 123–133.
Brooke, S., and Järnegren, J. (2013). Reproductive periodicity of the scleractinian coral Lophelia pertusa from the Trondheim Fjord, Norway. Mar. Biol. 160, 139–153. doi: 10.1007/s00227-012-2071-x
Bryan, T. L., and Metaxas, A. (2007). Predicting suitable habitat for deep-water gorgonian corals on the Atlantic and Pacific continental margins of North America. Mar. Ecol. Prog. Ser. 330, 113–126. doi: 10.3354/meps330113
Buhl-Mortensen, L., Aglen, A., Breen, M., Buhl-Mortensen, P., Ervik, A., Husa, V., et al. (2013). Impacts of fisheries and aquaculture on sediments and benthic fauna: suggestions for new management approaches. Fisken Og Havet 2:69.
Buhl-Mortensen, L., Buhl-Mortensen, P., Dolan, M. F., and Holte, B. (2015a). The MAREANO programme – A full coverage mapping of the Norwegian off-shore benthic environment and fauna. Mar. Biol. Res. 11, 4–17. doi: 10.1080/17451000.2014.952312
Buhl-Mortensen, L., Burgos, J. M., Steingrund, P., Buhl-Mortensen, P., Ólafsdóttir, S. H., and Ragnarsson, S. A. (2019). Vulnerable marine ecosystems (VME) Coral and sponge VMEs in Arctic and sub-Arctic waters - distribution and threats. Temanord 519:144.
Buhl-Mortensen, L., Hodnesdal, H., and Thorsnes, T. (2015c). The Norwegian Sea Floor: New Knowledge from MAREANO for Ecosystem-Based Management (Trondheim: Skipenes kommunikasjon AS), 192.
Buhl-Mortensen, L., Olafsdottir, S. H., Buhl-Mortensen, P., Burgos, J. M., and Ragnarsson, S. A. (2015b). Distribution of nine cold-water coral species (Scleractinia and Gorgonacea) in the cold temperate North Atlantic: effects of bathymetry and hydrography. Hydrobiologia 759, 39–61. doi: 10.1007/s10750-014-2116-x
Buhl-Mortensen, L., Vanreusel, A., Gooday, A. J., Levin, L. A., Priede, I. G., Buhl-Mortensen, P., et al. (2010). Biological structures as a source of habitat heterogeneity and biodiversity on the deep ocean margins. Mar. Ecol. 31, 21–50. doi: 10.1111/j.1439-0485.2010.00359.x
Buhl-Mortensen, P. (2017). Coral reefs in the Southern Barents Sea: habitat description and the effects of bottom fishing. Mar. Biol. Res. 13, 1027–1040. doi: 10.1080/17451000.2017.1331040
Buhl-Mortensen, P., Buhl-Mortensen, L., and Purser, A. (2016). Trophic Ecology and Habitat Provision in Cold-Water Coral Ecosystems. Berlin: Springer.
Chefaoui, R. M., and Lobo, J. M. (2008). Assessing the effects of pseudo-absences on predictive distribution model performance. Ecol. Modell. 210, 478–486. doi: 10.1016/j.ecolmodel.2007.08.010
Costello, M. J., McCrea, M., Freiwald, A., Lundälv, T., Jonsson, L., Bett, B. J., et al. (2005). “Role of cold-water Lophelia pertusa coral reefs as fish habitat in the NE Atlantic,” in Cold-water Corals and Ecosystems, eds A. Freiwald and J. M. Roberts (Heidelberg: Springer), 771–805. doi: 10.1007/3-540-27673-4-41
Davies, A. J., Duineveld, G. C., Lavaleye, M. S., Bergman, M. J., van Haren, H., and Roberts, J. M. (2009). Downwelling and deep-water bottom currents as food supply mechanisms to the cold-water coral Lophelia pertusa (Scleractinia) at the Mingulay Reef complex. Limnol. Oceanogr. 54, 620–629. doi: 10.4319/lo.2009.54.2.0620
Davies, A. J., and Guinotte, J. M. (2011). Global habitat suitability for framework-forming cold-water corals. PLoS One 6:e18483. doi: 10.1371/journal.pone.0018483
Davies, A. J., Roberts, J. M., and Hall-Spencer, J. (2007). Preserving deep-sea natural heritage: emerging issues in offshore conservation and management. Biol. Conserv. 138, 299–312. doi: 10.1016/j.biocon.2007.05.011
Davies, A. J., Wisshak, M., Orr, J. C., and Roberts, J. M. (2008). Predicting suitable habitat for the cold-water coral Lophelia pertusa (Scleractinia). Deep Sea Res. I 55, 1048–1062. doi: 10.1016/j.dsr.2008.04.010
Demopoulos, A. W. J., Bourque, J. R., Cordes, E., and Stamler, K. M. (2016). Impacts of the Deepwater Horizon oil spill on deep-sea coral-associated sediment communities. Mar. Ecol. Prog. Ser. 561, 51–68. doi: 10.3354/meps11905
Dolan, M. F. J., Grehan, A. J., Guinan, J. C., and Brown, C. (2008). Modelling the local distribution of cold-water corals in relation to bathymetric variables: Adding spatial context to deep-sea video data. Deep Sea Res. I Oceanogr. Res. Pap. 55, 1564–1579. doi: 10.1016/j.dsr.2008.06.010
Druffel, E. R., Griffin, S., Witter, A., Nelson, E., Southon, J., Kashgarian, M., et al. (1995). Gerardia: bristlecone pine of the deep-sea? Geochim. Cosmochim. Acta 59, 5031–5036. doi: 10.1016/0016-7037(95)00373-8
Elith, J. (2000). “Quantitative methods for modeling species habitat: comparative performance and an application to australian plants,” in Quantitative Methods for Conservation Biology, eds S. Ferguson and M. Burgman (New York, NY: Springer), 39–58. doi: 10.1007/0-387-22648-6-4
Elith, J., Phillips, S. J., Hastie, T., Dudík, M., Chee, Y. E., and Yates, C. J. (2011). A statistical explanation of MaxEnt for ecologists. Divers. Distribut. 17, 43–57. doi: 10.1111/j.1472-4642.2010.00725.x
Folk, R. L. (1954). The distinction between grain size and mineral composition in sedimentary-rock nomenclature. J. Geol. 62, 344–359. doi: 10.1086/626171
Fosså, J. H., Lindberg, B., Christensen, O., Lundälv, T., Svellingen, I., Mortensen, P. B., et al. (2005). “Mapping of lophelia reefs in Norway: experiences and survey methods,” in Cold-Water Corals and Ecosystems. Erlangen Earth Conference Series, eds A. Freiwald and J. M. Roberts (Berlin: Springer), 359–391. doi: 10.1007/3-540-27673-4_18
Fosså, J. H., Mortensen, P. B., and Furevik, D. M. (2002). The deep-water coral Lophelia pertusa in Norwegian waters: distribution and fishery impacts. Hydrobiologia 471, 1–12. doi: 10.1023/A:1016504430684
Fourcade, Y., Engler, J. O., Rödder, D., and Secondi, J. (2014). Mapping species distributions with MAXENT using a geographically biased sample of presence data: a performance assessment of methods for correcting sampling bias. PLoS One 9:e97122. doi: 10.1371/journal.pone.0097122
Frederiksen, R., Jensen, A., and Westerberg, H. (1992). The distribution of the scleractinian coral Lophelia pertusa around the Faroe Islands and the relation to internal tidal mixing. Sarsia N. Atlant. Mar. Sci. 77, 157–171. doi: 10.1080/00364827.1992.10413502
Freiwald, A., Hühnerbach, V., Lindberg, B., Wilson, J. B., and Campbell, J. (2002). The sula reef complex Norwegian shelf. Facies 47, 179–200. doi: 10.1007/BF02667712
Georgian, S. E., Shedd, W., and Cordes, E. E. (2014). High-resolution ecological niche modelling of the cold-water coral Lophelia pertusa in the Gulf of Mexico. Mar. Ecol. Prog. Ser. 506, 145–161. doi: 10.3354/meps10816
Ghisla, A., Rocchini, D., Neteler, M., Förster, M., and Kleinschmidt, B. (2012). “Species distribution modelling and open source GIS: why are they still so loosely connected?,” in Proceedings of the 2012 International Congress on Environmental Modelling and Software. Managing Resources of a Limited Planet: Pathways and Visions under Uncertainty, Sixth Biennial Meeting, Leipzig.
Guijarro, J., Beazley, L., Lirette, C., Kenchington, E., Wareham, V., Gilkinson, K., et al. (2016). Species distribution modelling of corals and sponges from research vessel survey data in the newfoundland and labrador region for use in the identification of significant benthic areas. Can. Tech. Rep. Fish. Aquat. Sci. 3171:126.
Guinan, J., Brown, C., Dolan, M. F. J., and Grehan, A. J. (2009). Ecological niche modelling of the distribution of cold-water coral habitat using underwater remote sensing data. Ecol. Informat. 4, 83–92. doi: 10.1016/j.ecoinf.2009.01.004
Gunleiksrud, G., and Hodnesdal, H. (2013). Mer Detaljert Kart Av Terrenget På Havbunnen. Available online at: http://www.mareano.no/nyheter/nyheter_2012/mer_detaljert_kart_av_terrenget_pa_havbunnen (accessed July 2017).
Gunnerus, J. E. (1763). Om en søevext, allevegne ligesom besat med frøehuuse, Gorgonia resedæformis. Det Kongelige Norske Videnskabers Selskabs Skrifter, 2, 321–329.
Husebø, Å, Nøttestad, L., Fossa, J. H., Furevik, D. M., and Jørgensen, S. B. (2002). Distribution and abundance of fish in deep-sea coral habitats. Hydrobiologia 471, 91–99. doi: 10.1023/A:1016549203368
Huvenne, V. A. I., Bett, B. J., Masson, D. G., Le Bas, T. P., and Wheeler, A. J. (2016). Effectiveness of a deep-sea cold-water coral marine protected Area, following eight years of fisheries closure. Biol. Conserv. 200, 60–69. doi: 10.1016/j.biocon.2016.05.030
Järnegren, J., and Kutti, T. (2014). Lophelia Pertusa in Norwegian Waters. What Have We Learned Since 2008?. NINA Report 1028. Trondheim: Norwegian Institute for Nature Research.
Leverette, T. L., and Metaxas, A. (2005). “Predicting habitat for two species of deep-water coral on the canadian Atlantic continental shelf and slope,” in Cold-Water Corals and Ecosystems, eds A. Freiwald and J. M. Roberts (Berlin: Springer-Verlag), 467–479. doi: 10.1007/3-540-27673-4_23
Linnaeus, C. (1758). Systema Naturae per Regna Tria Naturae, Secundum Classes, Ordines, Genera, Species, Cum Chararteribus, Differentiis, Synonymis, Locis (Holmiae: Laurentii Salvii). Tomus 1: Regnum animale. Stockholm.
Lobo, J. M., Jiménez-Valverde, A., and Real, R. (2008). AUC: a misleading measure of the performance of predictive distribution models. Glob. Ecol. Biogeogr. 17, 145–151. doi: 10.1111/j.1466-8238.2007.00358.x
López Correa, M., Montagna, P., Joseph, N., Rüggeberg, A., Fietzke, J., Flögel, S., et al. (2012). Preboreal onset of cold-water coral growth beyond the arctic circle revealed by coupled radiocarbon and u-series dating and neodymium isotopes. Q. Sci. Rev. 34, 24–43. doi: 10.1016/j.quascirev.2011.12.005
Madsen, F. J. (1944). Octocorallia (stolonifera–telestacea–xeniidea–alcyonacea–gorgonacea). Danish Ingolf Exped. 5, 1–65.
Merow, C., Smith, M. J., and Silander, J. A. (2013). A practical guide to MaxEnt for modeling species’ distributions: what it does, and why inputs and settings matter. Ecography 36, 1058–1069. doi: 10.1111/j.1600-0587.2013.07872.x
Mohn, C., Rengstorf, A., White, M., Duineveld, G., Mienis, F., Soetaert, K., et al. (2014). Linking benthic hydrodynamics and cold-water coral occurrences: a high-resolution model study at three cold-water coral provinces in the NE Atlantic. Prog. Oceanogr. 122, 92–104. doi: 10.1016/j.pocean.2013.12.003
Mortensen, P. B. (2001). Aquarium observations on the deep-water coral Lophelia pertusa (L. 1758) (Scleractinia) and selected associated invertebrates. Ophelia 54, 83–104. doi: 10.1080/00785236.2001.10409457
Mortensen, P. B., and Buhl-Mortensen, L. (2004). Distribution of deep-water gorgonian corals in relation to benthic habitat features in the Northeast Channel (Atlantic Canada). Mar. Biol. 144, 1223–1238. doi: 10.1007/s00227-003-1280-8
Mortensen, P. B., and Buhl-Mortensen, L. (2005). Morphology and growth of the deep-water gorgonians Primnoa resedaeformis and Paragorgia arborea. Mar. Biol. 147, 775–788. doi: 10.1007/s00227-005-1604-y
Mortensen, P. B., Buhl-Mortensen, L., Gordon, D. C. Jr., Fader, G. B., McKeown, D. M., and Fenton, D. G. (2005). Evidence of fisheries damage to deep-water gorgonians in the Northeast channel, Nova Scotia. Am. Fish. Soc. Symp. 41, 369–382.
Mortensen, P. B., Hovland, M. T., Fosså, J. H., and Furevik, D. M. (2001). Distribution, abundance and size of Lophelia pertusa coral reefs in mind-Norway in relation to seabed characteristics. J. Mar. Biol. Assoc. U. K. 81, 1–17.
Mortensen, P. B., and Lepland, A. (2007). Ecological consequences of exploration drilling on coral reefs in the Træna Deep. Fisken Og Havet 7:87.
Myksvoll, M. S., Sandvik, A. D., Albretsen, J., Asplin, L., Johnsen, I. A., Karlsen, O., et al. (2018). Evaluation of a national operational salmon lice monitoring system—From physics to fish. PLoS One 13:e0201338. doi: 10.1371/journal.pone.0209949
NASA Goddard Space Flight Center (2018). NASA Goddard Space Flight Center, Ocean Ecology Laboratory, Ocean Biology Processing Group. Moderate-Resolution Imaging Spectroradiometer (MODIS) Aqua. NASA OB.DAAC. Greenbelt, MD: NASA.
O’Leary, B. C., Brown, R. L., Johnson, D. E., von Nordheim, H., Ardron, J., Packeiser, T., et al. (2012). The first network of marine protected areas (MPAs) in the high seas: the process, the challenges and where next. Mar. Policy 36, 598–605. doi: 10.1016/j.marpol.2011.11.003
Philips, S. J. (2017). A Brief Tutorial on Maxent. Available online at: http://biodiversityinformatics.amnh.org/open_source/maxent/ (accessed august 16, 2017).
Phillips, S. J., Anderson, R. P., Dudík, M., Schapire, R. E., and Blair, M. E. (2017). Opening the black box: an open-source release of Maxent. Ecography 40, 001–007. doi: 10.1111/ecog.03049
Phillips, S. J., Anderson, R. P., and Shapire, R. E. (2006). Maximum entropy modeling of species geographic distributions. Ecol. Modell. 190, 231–259. doi: 10.1016/j.ecolmodel.2005.03.026
Phillips, S. J., Dudík, M., and Schapire, R. E. (2004). “A maximum entropy approach to species distribution modeling,” in Proceedings of the Twenty-First International Conference on Machine Learning, Banff.
Risk, M. J., Heikoop, J. M., Snow, M. G., and Beukens, R. (2002). Lifespans and growth patterns of two deep-sea corals: Primnoa resedaeformis and Desmophyllum cristagalli. Hydrobiologia 471, 125–131. doi: 10.1023/A:1016557405185
Roberts, J. J., Best, B. D., Dunn, D. C., Treml, E. A., and Halpin, P. N. (2010). Marine geospatial ecology tools: an integrated framework for ecological geoprocessing with ArcGIS, Python, R, MATLAB, and C++. Environ. Model. Softw. 25, 1197–1207. doi: 10.1016/j.envsoft.2010.03.029
Roberts, J. M., Wheeler, A. J., Freiwald, A., and Cairns, S. D. (2009a). 3. Biology in Cold-Water Corals - The Biology and Geology of Deep-Sea Coral Habitats. Cambridge: Cambridge University Press, 67–107.
Roberts, J. M., Wheeler, A. J., Freiwald, A., and Cairns, S. D. (2009b). 4. Reefs and Mounds in Cold-Water Corals - The Biology and Geology of Deep-Sea Coral Habitats. New York, NY: Cambridge University Press, 108–141.
Ross, R. E., and Howell, K. (2012). Use of predictive habitat modelling to assess the distribution and extent of the current protection of ‘listed’ deep-sea habitats. Divers. Distribut. 19, 433–445. doi: 10.1111/ddi.12010
Rüggeberg, A., Dullo, C., Dorschel, B., and Hebbeln, D. (2007). Environmental changes and growth history of a cold-water carbonate mound (Propeller Mound, Porcupine Seabight). Intern. J. Earth Sci. 96, 57–72. doi: 10.1007/s00531-005-0504-1
Sherwood, O. A., Jamieson, R., Edinger, E. N., and Wareham Hayes, W. E. (2008). Stable C and N isotopic composition of cold-water corals from the Newfoundland and Labrador continental slope: examination of trophic, depth and spatial effects. Deep Sea Res. Part I Oceanogr. Res. Pap. 55, 1392–1402. doi: 10.1016/j.dsr.2008.05.013
Tendal, O. S. (1992). The North Atlantic distribution of the octocoral Paragorgia arborea (L., 1758) (Cnidaria. Anthozoa). Sarsia 77, 213–217. doi: 10.1080/00364827.1992.10413506
Tittensor, D. P., Baco, A. R., Brewin, P. E., Clark, M. R., Consalvey, M., Hall-Spencer, J., et al. (2009). Predicting global habitat suitability for stony corals on seamounts. J. Biogeogr. 36, 1111–1128. doi: 10.1111/j.1365-2699.2008.02062.x
UNGA (2006). Resolution 61/105 Sustainable Fisheries, Including Through the 1995 Agreement for the Implementation of the Provisions of the United Nations Convention on the Law of the Sea of 10 December 1982 relating to the Conservation and Management of Straddling Fish Stocks and Highly Migratory Fish Stocks, and Related Instruments. New York, NY: UNGA.
Vorren, T. O., and Vassmyr, S. (1991). Kontinentalsokkelen - Overflatesedimenter, 1:3 Mill in Nasjonalatlas for Norge, Karblad 2.3.8. Hønefoss: Statens kartverk.
Walbridge, S., Slocum, N., Pobuda, M., and Wright, D. J. (2018). Unified geomorphological analysis workflows with benthic terrain modeler. Geosciences 8:94. doi: 10.3390/geosciences8030094
Wheeler, A. J., Beyer, A., Freiwald, A., de Haas, H., Huvenne, V. A. I., Kozachenko, M., et al. (2007). Morphology and environment of cold-water coral carbonate mounds on the NW European margin. Intern. J. Earth Sci. 96, 37–56. doi: 10.1007/s00531-006-0130-6
Yesson, C., Bedford, F., Rogers, A. D., and Taylor, M. L. (2017). The global distribution of deep-water antipatharia habitat. Deep Sea Res. II. 145, 79–86. doi: 10.1016/j.dsr2.2015.12.004
Keywords: cold-water corals, Maxent, species distribution modeling, habitat suitability, vulnerable marine ecosystems, Lophelia pertusa, Paragorgia arborea, Primnoa resedaeformis
Citation: Sundahl H, Buhl-Mortensen P and Buhl-Mortensen L (2020) Distribution and Suitable Habitat of the Cold-Water Corals Lophelia pertusa, Paragorgia arborea, and Primnoa resedaeformis on the Norwegian Continental Shelf. Front. Mar. Sci. 7:213. doi: 10.3389/fmars.2020.00213
Received: 21 July 2019; Accepted: 18 March 2020;
Published: 24 April 2020.
Edited by:
Ana Colaço, Marine Research Institute (IMAR), PortugalReviewed by:
Evan Edinger, Memorial University of Newfoundland, CanadaLindsay Beazley, Department of Fisheries and Oceans (Canada), Canada
Copyright © 2020 Sundahl, Buhl-Mortensen and Buhl-Mortensen. This is an open-access article distributed under the terms of the Creative Commons Attribution License (CC BY). The use, distribution or reproduction in other forums is permitted, provided the original author(s) and the copyright owner(s) are credited and that the original publication in this journal is cited, in accordance with accepted academic practice. No use, distribution or reproduction is permitted which does not comply with these terms.
*Correspondence: Pål Buhl-Mortensen, paal.mortensen@hi.no
 Hanna Sundahl
 Pål Buhl-Mortensen
 Lene Buhl-Mortensen
