Brightness of the Night Sky Affects Loggerhead (Caretta caretta) Sea Turtle Hatchling Misorientation but Not Nest Site Selection
 Thomas R. Stanley
 Jeremy M. White
 Susan Teel
 Mark Nicholas
- 1US Geological Survey, Fort Collins, CO, United States
- 2National Park Service, Fort Collins, CO, United States
- 3Gulf Islands National Seashore, National Park Service, Gulf Breeze, FL, United States
Sea turtles in the Gulf of Mexico, which are listed as either threatened or endangered under the US Endangered Species Act, face numerous threats but are particularly susceptible to the negative effects of light pollution on nesting beaches. Light pollution affects the distribution, density, and placement of nests on beaches, and disrupts seafinding in hatchlings emerging from nests; often leading to their death. Rapid urban growth near Gulf Islands National Seashore (GUIS), FL, United States, over the last century has contributed to increased light pollution on its beaches. There is concern that light pollution is causing females to build nests in at-risk locations subject to erosion and flooding, and is causing the observed high rates of hatchling misorientation. From 2015 to 2016, we measured brightness of the night sky, horizon profile, and lunar variables at GUIS at loggerhead (Caretta caretta) nests to assess the effects of brightness on building of at-risk nests and hatchling misorientation. In addition, we quantified the effects of relocating at-risk nests on nest success. We found that contrast in brightness between the landward and seaward directions at GUIS was partially responsible for high rates of hatchling misorientation, and there was a strong moderating influence of lunar fraction and lunar altitude on hatchling misorientation: larger lunar fractions and lower lunar altitudes reduced misorientation. We did not find an effect of artificial light, horizon profile, or lunar fraction on the propensity of loggerheads to build nests in at-risk locations, and found no evidence that relocating nests at GUIS reduced loggerhead nest success. In fact, we found that nest success was improved and hatchling misorientation rates were reduced for relocated loggerhead nests.
Introduction
Five species of sea turtles occur in the Gulf of Mexico: Kemp’s ridley (Lepidochelys kempii), loggerhead (Caretta caretta), green (Chelonia mydas), leatherback (Dermochelys coriacea), and hawksbill (Eretmochelys imbricata) (Valverde and Holzwart, 2017). Of these five species, two are listed under the US Endangered Species Act as threatened (C. caretta and C. mydas) and three are listed as endangered (L. kempii, D. coriacea, and E. imbricata) (Us Fish and Wildlife Service, 2019).
Sea turtles in the Gulf of Mexico face numerous threats including destruction of nesting and foraging habitats, incidental fisheries bycatch, entanglement in marine debris, vessel strikes, and the effects of artificial light pollution on nesting (Witherington et al., 2014). Light pollution is especially insidious due to the large number of individuals affected (Witherington, 1997). In particular, light pollution affects female placement of nests on the beach (Witherington, 1992a; Salmon et al., 1995a; Witherington et al., 2014; Price et al., 2018) and may lead to selection of sites subject to erosion or flooding, which are well-documented sources of egg mortality (Witherington, 1986; McGehee, 1990; Foley et al., 2006; Pike and Stiner, 2007; Ahles and Milton, 2016). Furthermore, it is well known that light pollution can disrupt seafinding [i.e., the tendency to move in the direction of the ocean; (Witherington et al., 2014)] of hatchlings emerging from nests, and cause misorientation [i.e., travel in any direction other than the general vicinity of the ocean; (Witherington et al., 2014)] leading to death by a variety of causes (McFarlane, 1963; Philibosian, 1976; Mann, 1978; Berry et al., 2013; Peterson et al., 2013; Witherington et al., 2014).
Gulf Islands National Seashore (GUIS), founded in 1971 and operated by the National Park Service (NPS), is located in the northeastern portion of the Gulf of Mexico and stretches across 256 km of coastline. All five species of Gulf sea turtles inhabit this region, and the beaches of GUIS are used by four of these species for nesting (hawksbill is excluded). In an effort to protect sea turtles nesting at GUIS, the NPS instituted a monitoring program in 1994. Daily beach surveys are conducted annually between May and October to identify all nesting events (i.e., non-nesting emergence, nest building, egg laying), relocate nests built in at-risk locations (e.g., below the tide line where they are susceptible to flooding or erosion), and monitor nests for predation, disturbance during incubation, and emergence of hatchlings to ensure (through redirection if necessary) they safely reach the Gulf of Mexico.
Over the course of the GUIS monitoring program, observations have suggested that selection of at-risk locations is common for loggerheads nesting at GUIS and may be increasing. Between 1996 and 2013, the percentage of at-risk nests that required relocation ranged between 20 and 78% of all nests (MN, Unpublished), and a linear regression of the data yields a positive slope of 2.66 and a 95% CI (1.47, 3.85) that does not overlap zero (TS, unpublished data); validating anecdotal observations that there has been an increase over time. Likewise, observations have suggested that misorientation in hatchlings is frequent at GUIS: from 2010 to 2018 the percentage of nests with misoriented hatchlings averaged 62% (MN, Unpublished).
Because rapid urban growth near GUIS over the last century has contributed to increased light pollution on its beaches, there is speculation by park biologists that light from anthropogenic sources is negatively influencing nest site selection by females and is causing the high rates of hatchling misorientation. However, no quantitative data exploring the association between light pollution and sea turtle nesting at GUIS have been collected. Hence, our objectives were to characterize brightness and illuminance of the night sky and assess its effects on loggerhead sea turtle nesting and hatchling misorientation on beaches at GUIS. We accomplished this by taking light measurements in a pattern covering the entire sky and horizon profile measurements at loggerhead nests the night after a nest was built and at the time hatchlings emerged from nests. This approach was novel in that, unlike other studies where only four directional measurements were taken (e.g., Salmon et al., 1995b; Price et al., 2018), the multiple nest-centered directional measurements allowed us to evaluate hypotheses regarding the range of vertical and horizontal directions from which a turtle might be perceiving light. We then used the directional light data to model the probability a nest was built in an at-risk location and the probability hatchlings were misoriented. In addition, we evaluated the effects of relocating nests on hatchling production and misorientation to quantify any possible negative effects.
Materials and Methods
Study Site and Nest Monitoring
This study was conducted at GUIS, Florida District, near Pensacola Beach, Florida. Sea turtle nests have been monitored annually at GUIS since 1994 at three distinct areas: Fort Pickens (12.3 km of shoreline), Perdido Key (11.2 km of shoreline), and Santa Rosa Island (12.2 km of shoreline). In addition, and despite not being part of GUIS, nests at Pensacola Beach (12.9 km of publicly owned shoreline) were also monitored.
During 2015 and 2016, sea turtle nests were discovered at these four locations during daily beach surveys to locate sea turtle tracks emerging from the water and leading to a nest depression in the sand. Surveys began before 0600 h, were conducted beginning May 1, and continued through October.
When a nest was discovered an assessment was made by GUIS biologists to determine if the nest was at-risk of erosion or flooding. This at-risk determination was based on distance from the Gulf, elevation of the nest relative to the high tide line, slope of the beach, and local knowledge and experience. When a nest was considered by GUIS biologists to be at-risk it was relocated to a more suitable site, typically directly north of the nest, higher on the beach, near the primary dune line using established protocols (Appendix).
In general, loggerhead egg incubation time varies between 50 and 70 days (MN, Unpublished). Beginning on the 50th day after their discovery nests were monitored daily until signs of hatching appeared, whereupon nests were monitored continuously by trained volunteers until the nest hatched. Signs of hatching typically included a cone or depression in the sand, indicating the turtles were digging their way out and the cavity was slowly collapsing, or scratching noises that could be heard by placing one’s ear on a towel laid over the sand near the nest, and listening. Once hatchlings emerged from the nest observers determined the direction of travel, and if they began to crawl in a direction that was clearly away from the Gulf they were placed in a bucket and counted before release into the Gulf. Since its inception in 1994 the GUIS sea turtle monitoring program has classified hatched nests as misoriented if more than 25% of the hatchlings appeared misoriented. Consequently, in the interest of continuity with standardized procedures and established reporting, we adopted this same threshold for our analysis.
Seventy-two hours after the initial hatching event, nests were assessed by GUIS biologists. Assessments were conducted after dusk to ensure that any turtles found alive in the nest cavity could be released immediately into the Gulf of Mexico. The nests were excavated and the number of live or dead hatchlings in the cavity were recorded along with any unhatched eggs. The unhatched eggs were opened to determine the stage of embryological development. Hatchlings found alive in the nest cavity were immediately released into the Gulf of Mexico, and any hatchlings that had broken partly through their egg shells, or “pipped” and were alive, were held in a cooler of sand until their carapaces uncurled. These hatchlings were held until they fully emerged from the eggshell and absorbed external yolk into their abdomen. Once ready, hatchlings were released into the Gulf of Mexico after sunset.
This study, and the field protocols affecting sea turtles, were approved by and carried out in accordance with the recommendations of the National Park Service (permits: GUIS-2014-SCI-0029, GUIS-2016-SCI-0037, GUIS-2017-SCI-001, GUIS-1017-SCI-0012, GUIS-2018-SCI-0001) and the Florida Fish and Wildlife Conservation Commission (permits: 18-830_CP_RP#811 and 17-830_CP_RP).
Light Intensity and Horizon Profile Measurements
Night sky light intensity data and horizon profile measurements for nests discovered were collected by recruiting local middle school, high school, and college students as citizen scientists under the guidance of GUIS personnel. Measurements at newly built nests were usually collected the night after discovery, began after astronomical twilight, and typically took 1 h to complete. Measurements at hatched nests were usually collected the night of hatching, but no later than 72 h after hatching. This 72 h post-hatching sampling window was necessary because the hatchling monitoring and the light measurement teams in this study were distinct. Because the exact time hatchlings emerge from a nest is inherently unpredictable, and because multiple nests might hatch on the same night, the light measurement team was sometimes unable to measure light intensity the night of hatching. Operationally, this resulted in 42% of the nests being sampled the night of hatching, and 39%, 10%, and 9% of the nests being sampled one, two, or three nights post-hatching, respectively.
We note that sampling after the night of hatching may introduce light intensity measurement error, due to differences in moonrise, lunar fraction, lunar altitude, or cloud cover. However, because lunar variables change slowly and predictably, it was our judgment that taking light intensity measurements as close to the night of hatching as possible, but within a 72 h window, would yield measurements similar enough to those at hatching that there would be little information loss. Likewise, within that 72 h window, we strived to sample on nights with cloud cover conditions that were similar enough to conditions on the night of hatching that there would likely be little information loss.
Citizen scientists collected light measurement data using two Unihedron Sky Quality Meters (with Lens, hereafter denoted as SQM; Unihedron, Grimsby, Ontario, Canada). The first SQM was left unfiltered and was sensitive to a broad spectrum of light (300–700 nm range, hereafter denoted as white light) while the second SQM was fitted with a Baader light blue bandpass filter with peak transmission at 470 nm (hereafter denoted as blue light), mounted ∼55 cm above the beach surface on a tripod with a leveler. We included blue light measurements in this study because there is evidence hatchlings are particularly sensitive to blue wavelengths, hence light pollution with greater blue spectral power may be a better predictor of misorientation than white light. The SQM-tripod unit was used to measure white and blue light intensity 360° around the horizontal plane (in 15° increments), and at vertical altitudes of 10°, 20°, 45°, 75°, and 90° (i.e., zenith), to obtain hemispheric measurements covering the night sky (the sensor detection cone has an angle of 20°). Each tripod was also equipped with a laser pointer that could be aimed at the top of dunes or buildings or other structures to obtain a horizon profile (degrees vertical altitude) over a 360°circle (in 15° increments).
Data and Statistical Methods
We modeled the binary response variables for at-risk nests at nest sites (1 if the nest was built in a location at-risk for flooding or erosion, 0 otherwise) and misorientation at hatched nests (1 if > 25% of the hatchlings appeared misoriented, 0 otherwise) using logistic regression with predictor variables such as year and site, and other variables we describe below. We included only nesting data for the more common loggerhead sea turtles in our analyses because only four green sea turtle nests, four Kemp’s ridley sea turtle nests, and one leatherback sea turtle nest were discovered in 2015 and 2016 combined. Furthermore, Kemp’s ridley sea turtles generally nest during the day (Shaver and Rubio, 2008; Shaver et al., 2016) when the effects of night sky light intensity are irrelevant.
Two lunar variables included as predictors in our analysis were lunar fraction and lunar altitude. We considered lunar fraction to be important because it is an index of the moon’s brightness and moonlight is a natural cue that aids hatchling seafinding (Tuxbury and Salmon, 2005); we considered lunar altitude to be important because the moon is brightest near moonrise and moonset (Witherington, 1992b; Witherington et al., 2014) and altitude affects reflected light from surfaces like sand or water. We let lunar fraction take values over the interval [0, 1] (0 = new moon, 1 = full moon), and lunar altitude (for the misorientation analysis only) at the time of sampling take values over the interval [−1, 1] using the divisor 83.18°: the maximum possible lunar altitude at GUIS. Negative values for lunar altitude indicate the moon was below the horizon during sampling. Because the moon likely has no appreciable effect on risk or misorientation if it is below the horizon (Salmon and Wyneken, 1990; Witherington, 1992b), for our analysis we multiplied lunar fraction by an indicator variable that was set to 1 if the moon was above the horizon, and 0 otherwise. We obtained lunar fraction and lunar altitude values using the R suncalc package (R Core Team, 2017; Agafonkin and Thieurmel, 2018) and supplying the date and time (at the approximate midpoint) during which SQM measurements were made.
Witherington et al. (2014) described a useful concept for characterizing the portion of the world measured (detected) by a directional light sensor, which they call an “acceptance cone.” The acceptance cone can be decomposed into both a horizontal and vertical “angle of acceptance” (AOA) which, with respect to a sea turtle, describe the range of directions from which light can be perceived (i.e., a subset of its effective field of view). We used this concept below to define subsets of data over which light intensity and horizon profile measurements were aggregated to construct predictor variables.
From the azimuth-specific horizon profile data we computed the mean horizon and maximum horizon values (in degrees altitude) from a subset of our data (described below) representing the horizontal AOA. These values were used as predictor variables for both the nest-at-risk and misorientation analyses.
For each nest site and hatched nest, we recorded 53 measurements of white light intensity and 53 measurements of blue light intensity. The SQM sensor records light intensity in magnitudes per square arcsecond and is a measure of brightness, an inverse logarithmic metric where smaller SQM readings indicate more light is hitting the sensor than larger SQM readings. We used azimuth-specific SQM data collected at a vertical altitude of 10° to compute the mean SQM and minimum SQM values (smaller values equate to brighter light) for white and blue light, and the landward minus seaward differences in these statistics (i.e., a measure of “contrast”), from a subset of our data (described below) representing the horizontal AOA. Because the SQM sensor detection cone has an angle of 20°, our measurements taken at an altitude of 10° integrate light intensity from 0° (i.e., the horizon) to 20° altitude into the SQM reading, and therefore the vertical AOA is 20°. For convenience, we will hereafter refer to these data as the 10° SQM data. There is some evidence from the literature that light closest to the horizon plays the greatest role in determining orientation direction in sea turtles (Witherington et al., 2014). For loggerheads, studies suggest that the light from 10° below the horizon to 30° above the horizon is what they are keying in on (Salmon and Wyneken, 1990; Witherington, 1992b). Consequently, we also computed the mean SQM and minimum SQM statistics from what we will hereafter refer to as the 20° SQM data, which includes both the 10° and 20° vertical altitude data so that the SQM readings integrate light from 0° to 30° altitude into the SQM reading. Thus, 30° represents the vertical AOA. We use both the 10° SQM data and 20° SQM data to construct predictor variables used in our analyses.
In addition to the SQM predictor variables, we converted the hemispheric SQM luminance measurements into 24 azimuth-specific illuminance values (in micro-lux units) using sine and cosine corrections (Duriscoe, 2016). These measures integrate light intensity measurements from 10° altitude (nearest to the horizon) to 90° altitude (zenith) into the illuminance value, and therefore the vertical AOA is 90°. We then used the azimuth-specific illuminance data to compute the mean illuminance and maximum illuminance values (log transformed; higher illuminance values indicate brighter light) for white and blue light, and the landward and seaward contrast in these statistics, from a subset of our data (described below) representing the horizontal AOA.
For the white and blue light SQM and horizon profile data for each nest a set of 24 azimuth-specific values were recorded at: 0° (true north), 15°, … 180° (south), … and 355°. Thus, we need a meaningful way of aggregating these data to characterize what a female loggerhead might perceive as she searches for a nesting site or during a hatchling’s crawl to the Gulf of Mexico, but that does not impose arbitrary structure that might constrain the results. Because an adult female requires land to build a nest and a hatchling sea turtle needs to find its way to the Gulf, a natural starting point for our analysis is to distinguish between the landward and seaward data subsets.
The coast of GUIS is approximately angled such that it is oriented from 75° to 255°. Thus, we define landward as 255°–75° (inclusively, with 345° perpendicular to the shore) and seaward as 75°–255° (inclusively, with 165° perpendicular to the shore). Data were then classified so that the azimuth-specific horizon profile and light data could be meaningfully aggregated by direction.
In this study, rather than select a single subset of azimuths and analyze only those, we chose to define multiple subsets each representing the horizontal AOA over which we aggregated our azimuth-specific horizon profile, SQM, and illuminance data (Table 1). We accomplished this by specifying a set of azimuths, centered on the landward and seaward azimuths that are perpendicular to the shoreline (i.e., 345° and 165°, respectively), to define the horizontal AOAs considered in our analysis (Table 1).
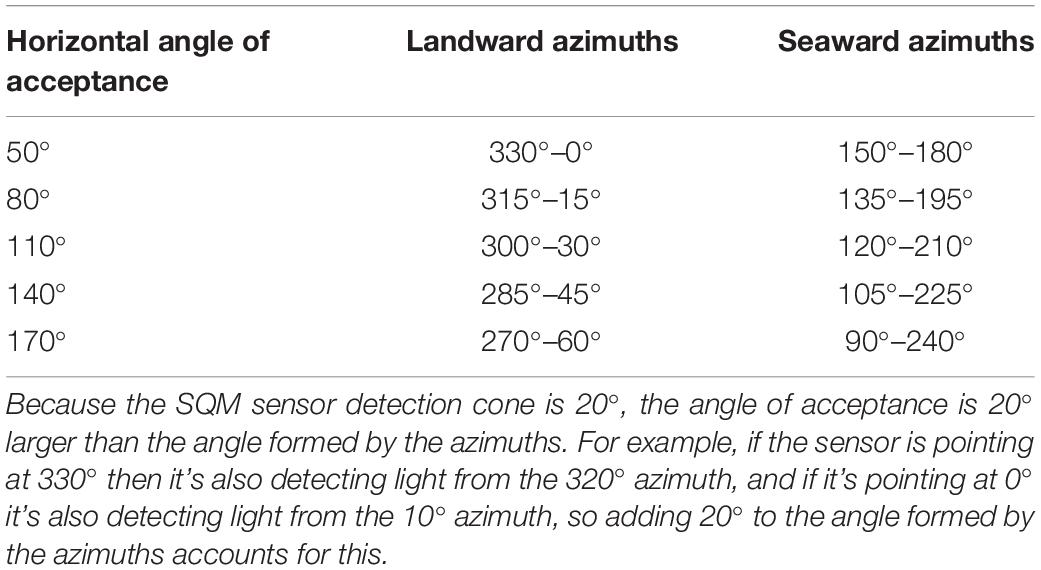
Table 1. Horizontal angles of acceptance and the associated azimuths over which the horizon profile, SQM, and illuminance data were aggregated to construct predictor variables.
Given our full set of predictor variables, we evaluated a total of 728 nest-at-risk models and a total of 288 hatchling misorientation models (with both additive and interactive effects), and we used information-theoretic model selection procedures (i.e., AICc; Akaike’s Information Criterion – corrected for small sample size) to identify the set of models best supported by the data (Burnham and Anderson, 2002). We also used AICc to evaluate whether there was support in the data for a favored AOA, and whether there was evidence that blue light was a better predictor of risk or misorientation than white light.
Results
Relocation Effects on Nesting
In 2015, 44.6% of all loggerhead nests (total nests = 65) were relocated and in 2016, 68.6% of all loggerhead nests (total nests = 102) were relocated. The percent nest success (a nest was successful if at least one hatchling emerged from the nest and is the opposite of complete nest failure), the percent hatching success (hatched eggs/total eggs), the percent emergence success (emerged hatchlings/total eggs), and the percentage of successful nests with >25% misoriented hatchlings, were calculated for relocated and non-relocated nests (Table 2). As a general pattern, hatching and emergence success rates for relocated nests were higher than for non-relocated nests, and the hatchling misorientation rate was lower for relocated nests than for non-relocated nests. We ran a year + relocated logistic regression model on these data and found the Wald Chi-Square for the relocated variable had p < 0.014 for all four of the relocation effects (Table 2).
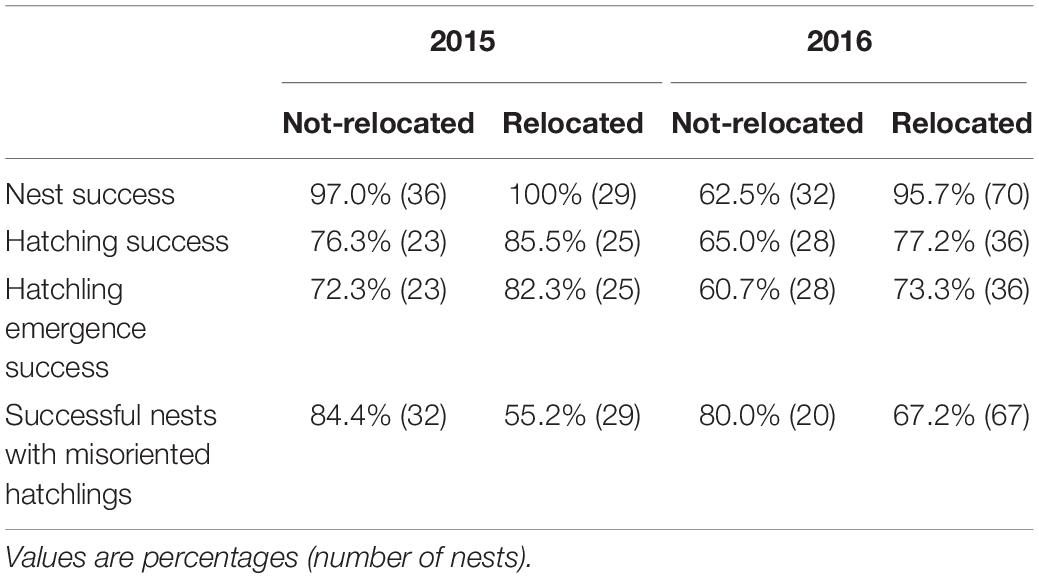
Table 2. Nest relocation effects on loggerhead (Caretta caretta) nesting.
Nest-at-Risk Models
For our analysis of factors influencing the probability a nest was built in an at-risk location, no strongly supported predictor variables were found. Indeed, among the set of models that do not involve an AOA we found the null model (i.e., intercept only) was most strongly supported by the data (i.e., it had the lowest AICc), with the year and lunar fraction models being somewhat competitive (i.e., their AICc values were within 2 units of the null model; Table 3).
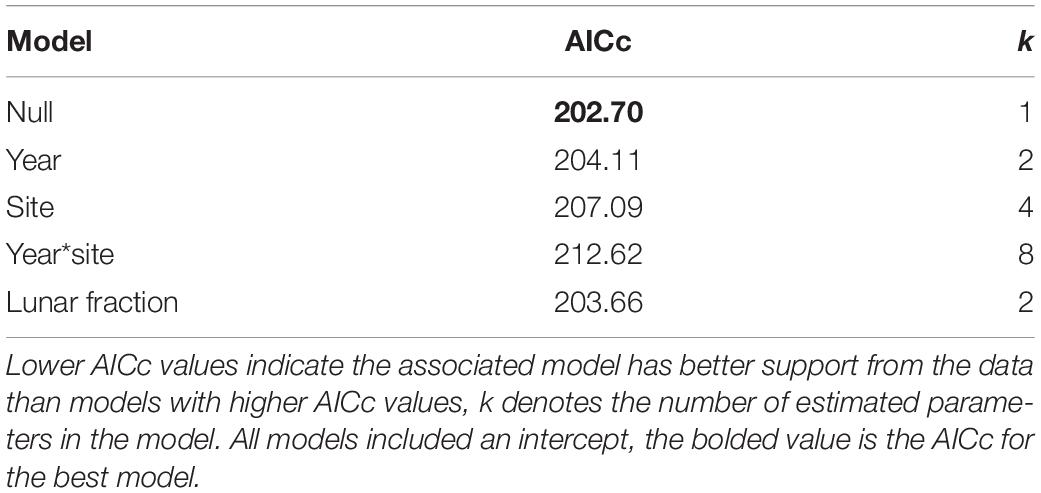
Table 3. Model selection results for nest-at-risk models that do not involve an angle of acceptance.
Among the set of models that do involve an AOA, two models had AICc values slightly lower than the null model (Table 4). The best model had an interaction between mean horizon altitude (mha) and lunar fraction (lf) at a 170° AOA [β (95% CI): βmha = −0.196 (−0.390, −0.028), βlf = −0.834 (−2.51, 0.749), βmha^*lf = 0.313 (0.041, 0.641)]; and generally indicated the probability a nest was built in an at-risk location increased as mean horizon altitude and lunar fraction increased, except that when mean horizon altitude was near zero the probability decreased (Figure 1). For comparison, we also report the simpler additive model with these same variables (Table 4).
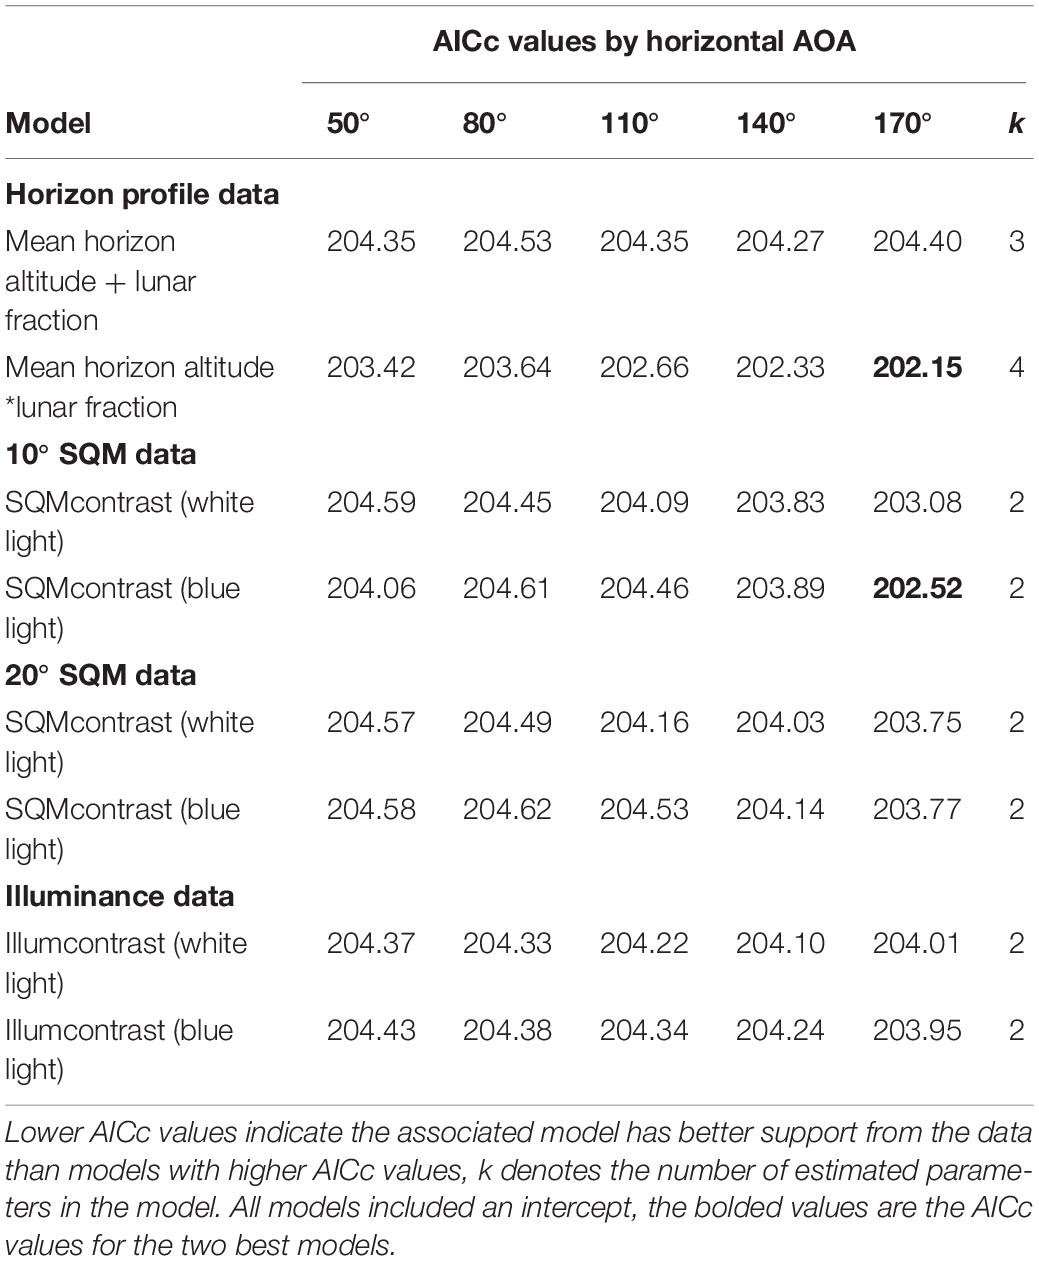
Table 4. Model selection results for nest-at-risk models that involve an angle of acceptance (AOA).
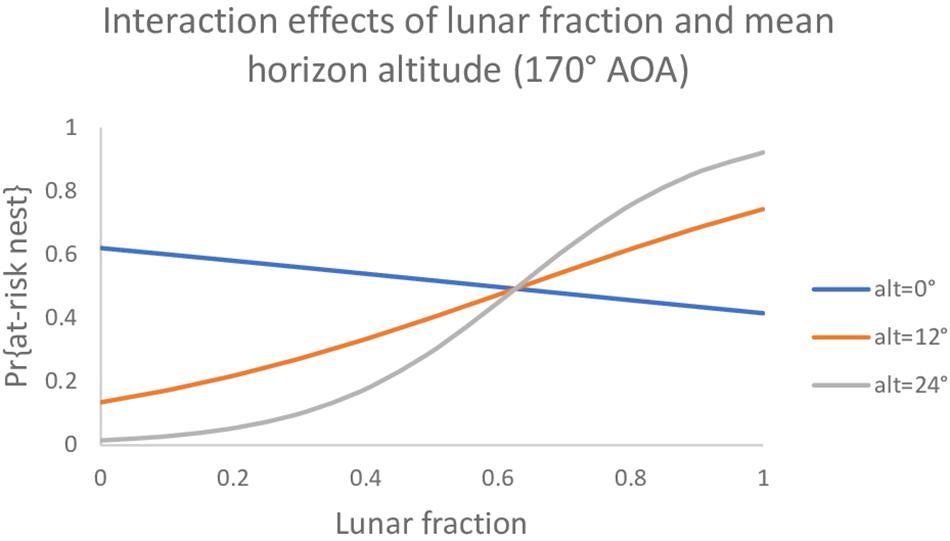
Figure 1. The probability a loggerhead (Caretta caretta) nest was built at an at-risk location under a model with main effects and an interaction between mean horizon altitude and lunar fraction at a 170° angle of acceptance (AOA).
The second-best model had a variable representing the contrast between landward (lw) and seaward (sw) blue light brightness, computed as min(SQMlw) – min(SQMsw) (170° AOA, 10° SQM data) (Table 4). Hereafter, we will refer to this variable as SQMcontrast. The 95% CI on the estimated parameter for SQMcontrast overlapped zero [β (95% CI): β = 0.242 (−0.073, 0.580)], suggesting the variable was not a good predictor for risk. For comparison with this model, we also report the equivalent model based on the 20° SQM data and the illuminance data (where illumcontrast = log(max(illuminancelw)) – log(max(illuminancesw))), as well as the equivalent models for white light (Table 4). For all models we present the results for the full set of AOAs evaluated, allowing us to determine whether there was evidence for a preferred AOA. Finally, we ran a more complex model that combined the variables from the two best AOA models and got AICc = 203.75 (k = 5), which offered no improvement over the null model.
Hatchling Misorientation Models
Our analysis of factors influencing the probability that hatchlings were misoriented yielded multiple models with strongly supported predictor variables. Among the set of models that did not involve an AOA, we found an additive model with the variables lunar fraction (lf) and lunar altitude (la) to be the model most strongly supported by the data (Table 5), and in both cases the 95% confidence intervals on the parameter estimates did not overlap zero [β (95% CI): βlf = −3.425 (−5.180, −1.887), βla = 4.124 (0.919, 7.768)]. This suggests the variables were useful predictors for the probability hatchlings were misoriented. The lunar fraction ∗ lunar altitude interaction model was also competitive, and both this model and the additive model were vastly better than the null model (Table 5).
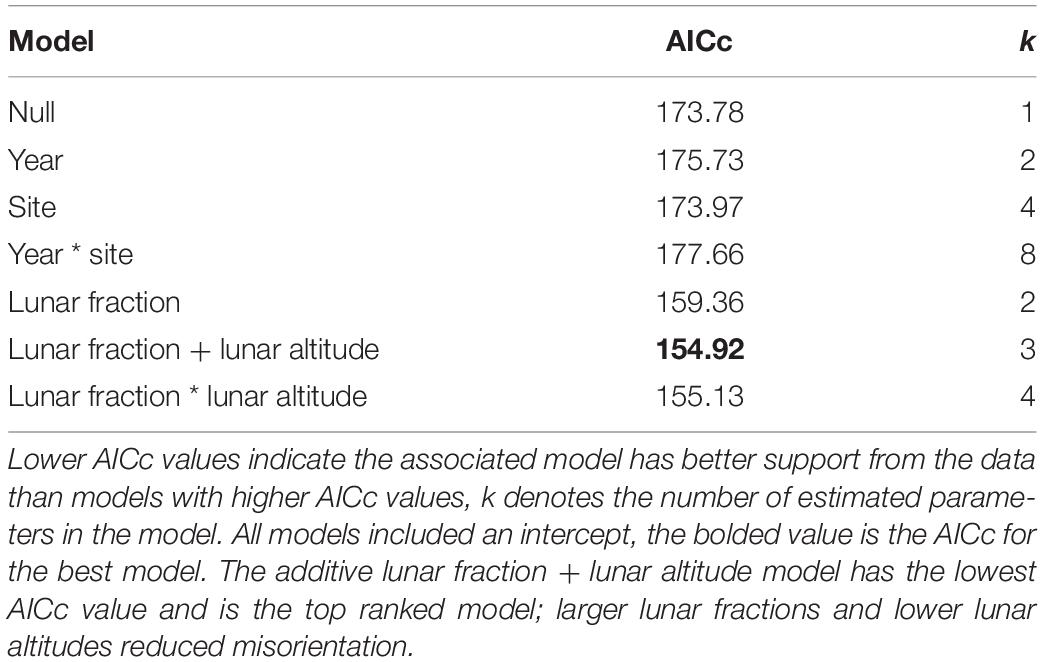
Table 5. Model selection results for hatchling misorientation models that do not involve an angle of acceptance.
Among the set of models that do involve an AOA, an additive model generalizing the top model was vastly superior to all other models we tried. Specifically, this model included the lunar fraction (lf) and lunar altitude (la) variables and also SQMcontrast (80° AOA, 10° SQM data; Table 6). For all three variables in this model the 95% confidence intervals on the parameter estimates did not overlap zero [β (95% CI): βlf = −2.327 (−4.190, −0.594), βla = 6.179 (2.493, 10.429), βSQMcontrst = −1.010 (−1.655, −0.442)]; indicating the variables were useful predictors for the probability hatchlings were misoriented and generally showed that the probability of misorientation decreased as lunar fraction increased, increased as lunar altitude increased, and decreased as SQMcontrast increased (i.e., it became more positive; Figure 2). Models with two-way and three-way interaction terms between these three variables had larger AICc values than the purely additive model.
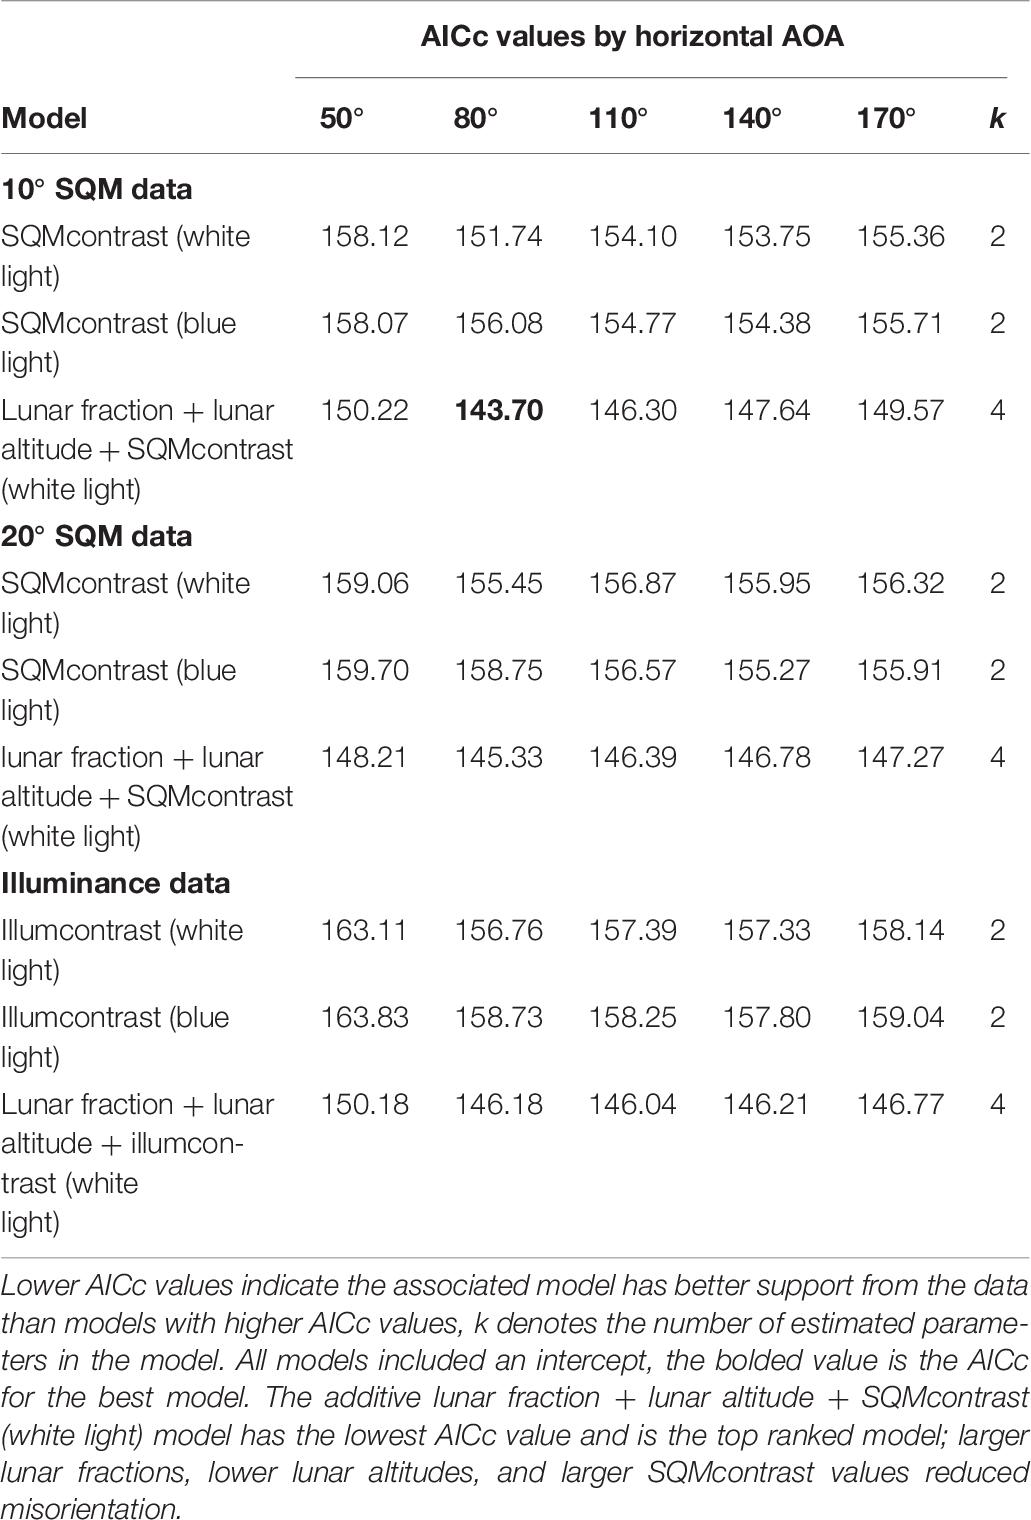
Table 6. Model selection results for hatchling misorientation models that involve an angle of acceptance (AOA).
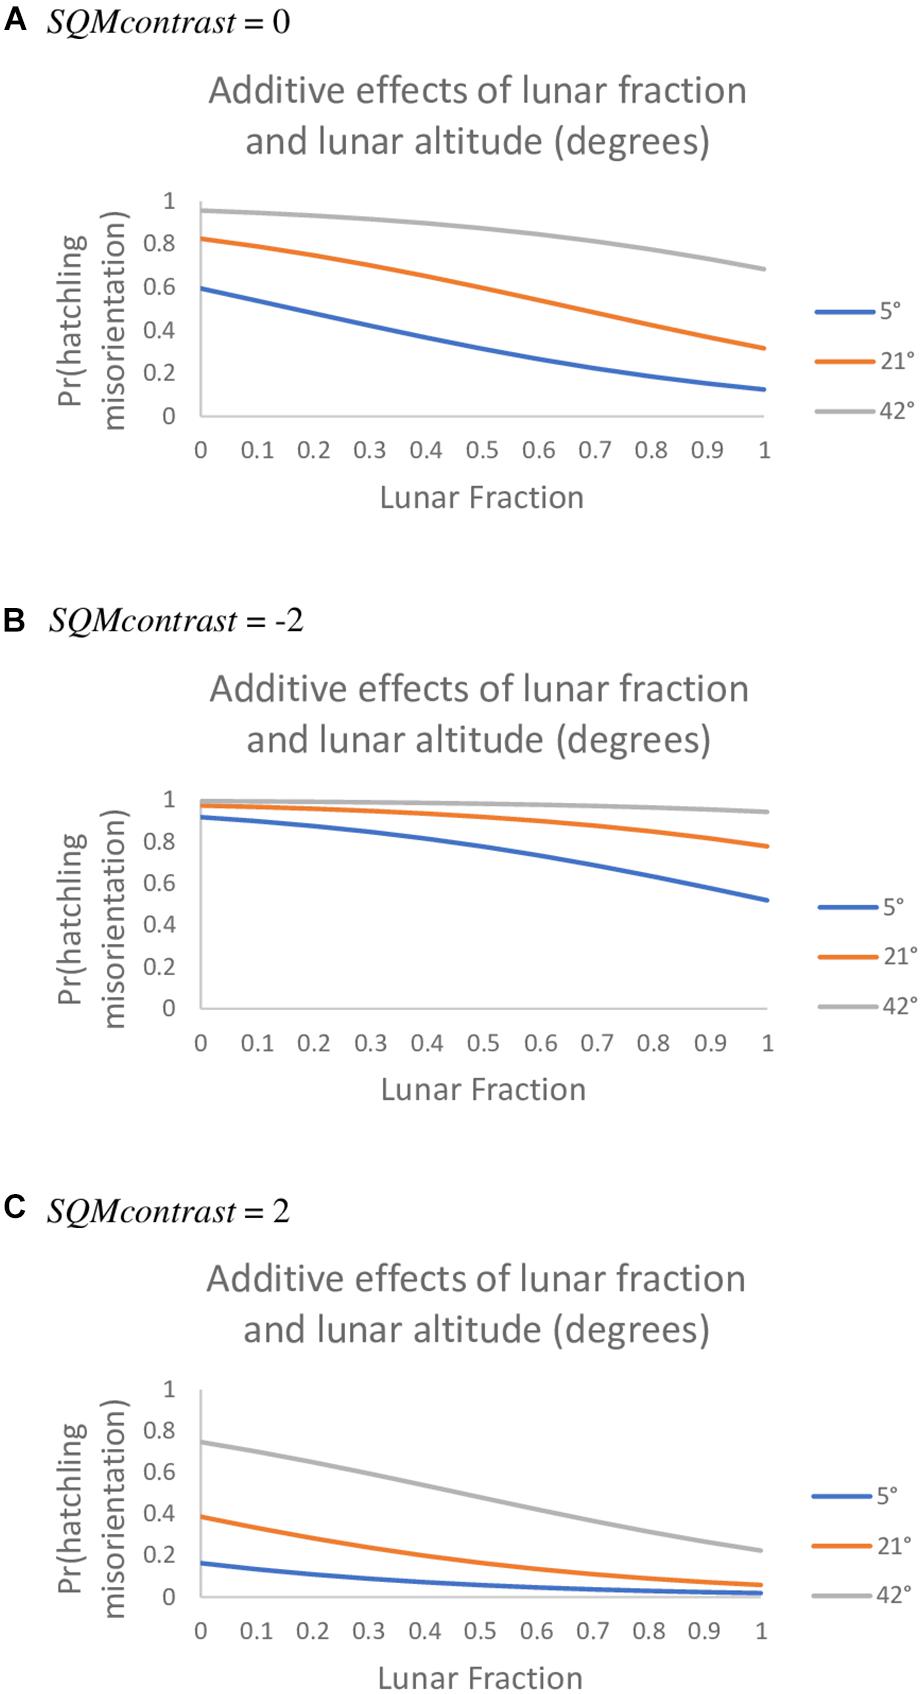
Figure 2. The probability loggerhead (Caretta caretta) hatchlings were misoriented under an additive model with the predictor variables lunar fraction, lunar altitude, and SQMcontrast values of 0 (A), −2 (B), and 2 (C) (80° AOA, 10° SQM data, observed range was −5.0 to 2.7).
For comparison with the top model, we included the equivalent models run on the 20° SQM data and the illuminance data (Table 6). We also included the single variable SQMcontrast white and blue light models for the 10° SQM data and 20° SQM data, and the illumcontrast white and blue light models. For all models we present the results for the full set of AOAs evaluated, allowing us to determine whether there was evidence for a preferred AOA. Finally, we do not present any models using the horizon profile data because the best model, which was the single variable max(horizon) model, had an AICc of 175.47 and was less supported by the data than the null model (AICc = 173.78).
For predicting the probability a hatchling was misoriented on any particular night, our data suggested the top model was the best to use (Table 6 and Figure 2). However, the lunar fraction and lunar altitude variables in this model are not something over which we can exert any control. It is only the landward and seaward contrast variable, SQMcontrast, that we can exert influence over and we generally have more control over the landward brightness than the seaward brightness. Because the degree of control we must exert over landward brightness will likely differ on moonlit vs. moonless nights, we ran the SQMcontrast (white light) model using the 10° SQM data (80° AOA) separately on moonlit vs. moonless nights. We found on moonlit nights the parameter estimates (95% CI) were 0.399 (−0.110, 0.923) for the intercept and −0.897 (−1.520, −0.379) for the SQM contrast variable; whereas on moonless nights the estimates were −0.397 (−1.902, 0.977) for the intercept and −1.214 (−2.333, −0.317) for the contrast variable. Because the 95% CIs on the SQMcontrast parameters under both models do not overlap zero, both models are useful for predicting the hatchling misorientation we observed in this study. These models generally show the probability of misorientation decreases as SQMcontrast becomes more positive, and for SQMcontrast >−2.0 the probabilities for moonlit and moonless nights diverge (Figure 3).
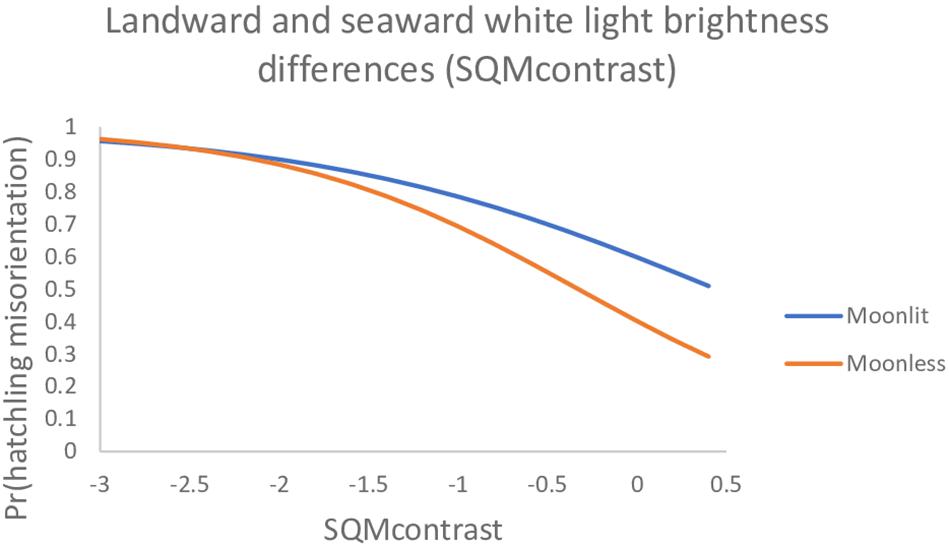
Figure 3. The probability loggerhead (Caretta caretta) hatchlings were misoriented on moonlit vs. moonless nights under a model with SQMcontrast only (80° AOA, 10° SQM data). Data are plotted only over the range of SQMcontrast values actually observed in both subsets of the data. The full range observed for both data sets combined was −5 to 2.7.
Discussion
Hatchling Results
We found three variables were strongly associated with the probability of hatchling misorientation: lunar fraction, lunar altitude, and SQMcontrast (the difference in white light intensity between the landward and seaward directions). That these variables were useful predictors was not surprising. There is ample laboratory and field evidence suggesting that brightness is an important seafinding cue (Daniel and Smith, 1947; Hendrickson, 1958; Mrosovsky and Shettleworth, 1968; Lorne and Salmon, 2007; Harewood and Horrocks, 2008; Berry et al., 2013), and it is known that, in the absence of artificial light, celestial light is reflected by the ocean and hatchlings naturally orient seaward (Mrosovsky and Shettleworth, 1968; Van Rhijn and Van Gorkom, 1983; Tuxbury and Salmon, 2005; Witherington et al., 2014). However, when artificial lighting is present hatchlings may become misoriented and have difficulty finding their way to the sea, but this will differ depending on moon phase (Salmon and Witherington, 1995; Lohmann et al., 1996; Tuxbury and Salmon, 2005; Berry et al., 2013).
When we consider only the lunar fraction and SQMcontrast variables we found the probability of misorientation was greater during a new moon than during a full moon but that, regardless of moon phase, misorientation was greater when landward brightness exceeded seaward brightness (i.e., SQMcontrast < 0; Figure 2B) than when the reverse was true (i.e., SQMcontrast > 0; Figure 2C). Salmon and Witherington (1995) obtained a similar result – most misorientation occurred on dark evenings near a new moon – and showed there was a significant inverse relationship between the frequency of misorientation and the number of days from the closest new-moon. Also like us, Rivas et al. (2015) found that the effect of artificial lighting on leatherback hatchling orientation was reduced in the presence of moonlight. Our data, along with those of Salmon and Witherington (1995) and Rivas et al. (2015), suggest there is a tension between levels of natural and artificial light that, depending on their relative brightness, influences the degree to which misorientation occurs. This tension is succinctly captured in the cue competition hypothesis of Tuxbury and Salmon (2005), which postulates a tradeoff between natural cues and the perceived magnitude of artificial light and its effect on misorientation during a new moon vs. full moon. Our results generally support the Tuxbury and Salmon (2005) cue competition hypothesis, except our data suggest it is the contrast between landward and seaward light that is important, not just the absolute magnitude of artificial light.
The third variable we found associated with hatchling misorientation probabilities was lunar altitude; with misorientation probabilities increasing as lunar altitude increased (Figure 2). To our knowledge the effects of lunar altitude on misorientation have not previously been investigated in an explicit manner, and we found no studies that corroborate our findings or offer explanations for why this might occur. Nevertheless, we pose two hypotheses to explain the pattern we observed.
Because the coastal orientation at GUIS is ∼75°–255° the azimuth of the moon, when it is visible, typically puts it over the waters of the Gulf. Indeed, this was the case for all 80 of the hatching nests we monitored when the moon was visible, the azimuth of the moon placed it over the water. Thus, we hypothesize that, due to the amplifying effect on brightness of moonlight scattering off the surface of the water, at a lower lunar altitude the moon provides a stronger directional cue (sensu Witherington et al., 2014) toward the Gulf than it does at a higher lunar altitude, where scatter off the water will be more diffuse and the directional cue weaker. If true, then at GUIS we would expect the probability of misorientation to be lower at a lower lunar altitude and higher at a higher lunar altitude, as we observed.
As noted earlier there is evidence that light closest to the horizon plays the greatest role in determining orientation direction in sea turtles (Witherington et al., 2014), and that for loggerheads it is thought light from 10° below the horizon to 30° above the horizon is what they are keying in on (Salmon and Wyneken, 1990; Witherington, 1992b). Thus, our second hypothesis for the observed association between lunar altitude and misorientation is that at higher lunar altitudes the moon exceeds the vertical AOA for loggerheads, and therefore is effectively not perceived by them. For example, if we assume the vertical AOA is 30° above the horizon for loggerheads, then in our sample of 80 nests 49% of those nests hatched when the lunar altitude exceeded 30° (maximum lunar altitude in this study was 47°). Consequently, for our example, we would expect that for 49% of the nests in our study the moon would offer little to no directionality guiding hatchlings toward the Gulf. We note our two hypotheses regarding lunar altitude are not mutually exclusive and could be operating simultaneously.
As part of our analysis we fit a simple SQMcontrast (white light) model to hatchling misorientation data partitioned into moonlit and moonless nights. We did this to isolate the variable we can exert some control over (SQMcontrast) from the variables we cannot exert control over (lunar fraction, lunar altitude). Examination of the plots for these models show interesting features (Figure 3). First, for SQMcontrast < −2 the plots are somewhat flat and are essentially indistinguishable. What this tells us is that landward brightness in this region of the plot is so great it is overwhelming lunar effects, and that management actions to decrease landward brightness will be mostly ineffective until SQMcontrast exceeds −2.0. Second, the slope of the curve on moonless nights (−1.214) is more negative than on moonlit nights (−0.897). What this tells us is that management actions that decrease landward brightness will be more effective on moonless nights that on moonlit nights – all else being equal. Lastly, if management actions decrease landward brightness successfully, bringing it to levels equal to seaward brightness (i.e., SQMcontrast = 0), then misorientation probabilities will be lower but still unacceptably high (0.60 on moonlit nights and 0.40 on moonless nights). Consequently, it will be necessary to strive for SQMcontrast > 0 especially on moonlit nights. Our findings are unique from those of other studies in that we quantitatively identify thresholds, or transition points, identifying conditions under which controlling light pollution might be most effective. Whereas Witherington et al. (2014) suggested the higher levels of ambient light on moonlit nights may lessen the relative contribution of artificial light sources to the light fields that hatchlings perceive, they did not provide quantitative data regarding what the relative contributions might be. We believe our data are particularly informative with respect to the Tuxbury and Salmon (2005) cue competition hypothesis – which they presented abstractly without quantitative thresholds – because we report quantitative thresholds that are prospective management targets under the cue competition hypothesis. Lastly, as we noted in the methods, it is possible that the 72-h post-hatching sampling window we adopted for light intensity measurements introduced measurement error. Because we could not account for measurement error explicitly in our models it could have inflated the model deviance, thereby reducing statistical power for detecting the effects of light intensity on misorientation. Consequently, our hatchling misorientation results are likely conservative, meaning the influence of light intensity (i.e., SQMcontrast) had to be relatively strong for us to detect it.
For hatchling misorientation the best model was the lunar fraction, lunar altitude, SQMcontrast model with AICc = 143.70 (Table 6). Because models with AICc values within 2 units of the best model are considered to have substantial empirical support, whereas models with AICc values >4 units from the best model have considerably less empirical support (Burnham and Anderson, 2002), we can gain insights into whether loggerheads have a preferred AOA or are more sensitive to blue light than white light by comparing AICc among certain models.
We assessed the horizontal AOA by comparing among models in same row as the best model, which were identical in every way except for their horizontal AOA. Doing this we found none of the models were within two AICc units of the best model, the 110° and 140° AOA models were between two and four AICc units away, and the 50° and 170° AOA models were >4 units away. This suggests that the horizontal AOA for loggerheads was probably >50° but <170° and was probably closer to 80° than it was to 110° or 140°. We note that this range is much narrower than the 180° reported by Witherington et al. (2014).
We assessed the vertical AOA by comparing among the lunar fraction, lunar altitude, SQMcontrast models in the same column as the best model, which were identical in every way except for their vertical AOA. Doing this we found for the 20° SQM data the model was within two AICc units of the best model (AICc = 145.33), but for the illuminance data the model was >2 units from the best model (AICc = 146.18; Table 6). This suggests, albeit weakly, that a vertical AOA closer to 20° or 30° was better supported by the data than the vertical AOA of 90°captured by the illuminance data, and is consistent with the 10° below the horizon to 30° above the horizon values suggested by others (Salmon and Wyneken, 1990; Witherington, 1992b).
We included blue light measurements (at 470 nm) in this study because of evidence hatchlings are particularly sensitive to blue wavelengths (Witherington, 1992b, 1997; Lohmann et al., 1996; Witherington et al., 2014), with a peak behavioral sensitivity near 500 nm (Witherington, 1992b). Hence, we hypothesized light pollution with strong blue spectral power may be a better predictor of misorientation than white light pollution. However, when we compared AICc values for the SQMcontrast (white light) models with the AICc values for the SQMcontrast (blue light) models, we found no evidence that blue light was a better predictor of misorientation than white light. Of the 15 within-AOA comparisons, in only two cases were the AICc differences >2.0 units, and in both of those cases the AICc for the white light model was lower (Table 6). The wavelength, intensity, direction and color of light, as well as shapes of visible objects like dunes or vegetation, all provide cues to orienting sea turtle hatchlings (Witherington et al., 2014). The failure in our study to show blue light was a better predictor of misorientation than white light may have been caused by the presence of conflicting unmeasured cues. For example, in experiments loggerheads were found to be most strongly attracted to light in the near-ultraviolet to green region and showed an aversion response to light in the yellow region of the spectrum (Lohmann et al., 1996; Witherington, 1997). It is possible, therefore, that wavelengths other than the 470 nm wavelength we measured were both present and brighter and thus had a stronger influence on hatchling orientation. Alternatively, because our study was in situ and not a controlled laboratory experiment, there may have simply been too much environmental variation present to detect an effect with our sample sizes.
Nests-at-Risk Results
With respect to adult nest placement we investigated a very specific question: what factors were associated with female loggerheads selecting an at-risk location to build their nest rather than a not-at-risk location? Whereas several studies have assessed the effects of lighting and light intensity on the distribution, density, and placement of sea turtle nests on beaches (Witherington, 1992a; Salmon et al., 1995a; Witherington et al., 2014; Price et al., 2018), we are not aware of any studies that have addressed our specific question.
Despite the fact that we considered several predictor variables aggregated over multiple different horizontal and vertical AOAs, and evaluated 728 distinct models, we found none of the variables or models we evaluated were good predictors for the probability a female built a nest in an at-risk location. We base this conclusion primarily on the fact that the two best models (Table 4) had AICc values that were only marginally better than the AICc for null model (Table 3). Considering the top-ranked model had three more parameters than the null model and an interaction term, but the AICc value was only 0.55 units lower than that of the null model, it would be a stretch to claim that reliable prediction could be based on this more complex model. With respect to the second-best model, adding the SQMcontrast parameter improved the AICc value by only 0.18 units when compared to the null model, but the 95% confidence interval on the parameter overlapped zero; indicating SQMcontrast was not a good predictor variable. In conclusion, we found no evidence light pollution was affecting the placement of nests in at-risk locations.
As with hatchlings, we were interested in whether adult nesting in an at-risk location could be better predicted with blue light data than white light data, and whether there was any evidence of a preferred vertical or horizontal AOA. After making among model comparisons of AICc for at-risk nests (Table 4) equivalent to those described for the hatchlings, we found AICc differences were <2.0 units in all cases. We interpreted these results to mean there was no evidence from our study of heightened sensitivity to blue light or a preferred AOA associated with loggerheads building nests in at-risk locations.
Relocation Effects on Nest Success
In 2015 and 2016 GUIS biologists relocated multiple nests because they were judged to be at-risk, and in 2016 a beach renourishment project at Pensacola Beach required relocation of 15 additional nests that were not at-risk. Our comparison of relocated nests with non-relocated nests showed relocated nests fared better in four categories (Table 2). These results differ from Ahles and Milton (2016; Table 1), who found percent hatching success and percent hatchling emergence success were lower for relocated nests (their “12 h native” treatment) than for non-relocated nests (their “in situ” treatment), though only the emergence success difference was statistically significant. Interestingly, the corresponding percentages for their relocated “12 h renourished” nests were slightly higher than for their “In situ” nests, though the differences were not statistically significant (Ahles and Milton, 2016).
We note that the nest success, hatching success, and hatchling emergence success rates we report for non-relocated nests (Table 2) are likely higher than normally would be observed on beaches where none of the nests were relocated. This is because the at-risk nests in our study, which likely would have had success rates near zero if left in situ, were all relocated. Thus, none of the at-risk nests appeared in the non-relocated group where they would have dragged down average success rates. Consequently, rate differences between our relocated nests, and non-relocated nests in general, are likely to be even greater than is apparent from our data. What this suggests is that under the conditions prevailing at GUIS in 2015 and 2016 (with respect to storms, predation rates, etc.), relocating at-risk nests (that are almost certain to fail) is an effective management action that can actually increase average success rates. Additionally, our data show that careful selection of sites for relocated nests can reduce rates of hatchling misorientation.
Conclusion
Our findings support speculation that artificial light, specifically the contrast in brightness between the landward and seaward directions (i.e., SQMcontrast), is partially responsible for high rates of loggerhead hatchling misorientation at GUIS. Specifically, we found that:
1. Landward brightness can be so great that it overwhelms any positive effects the moon might be having, and management actions that decrease landward brightness will be mostly ineffective until SQMcontrast > −2.0.
2. Management actions that decrease landward brightness will be more effective on moonless nights than on moonlit nights.
3. Management actions should strive to reduce landward brightness to levels that are lower than seaward brightness (i.e., SQMcontrast > 0).
In addition, our results document the strong moderating influence of lunar fraction and lunar altitude on hatchling misorientation (larger lunar fractions and lower lunar altitudes reduced misorientation). With respect to factors influencing the selection of nest sites in at-risk locations, we did not document any effects of artificial light, lunar fraction, or horizon profile. Finally, we found no evidence that relocating nests at GUIS reduced loggerhead success rates, in fact relocation actually improved rates, and we found evidence that hatchling misorientation rates were lower for relocated nests. Thus, when nests are deemed to be at-risk, relocating them in accordance with the procedures outlined in the Appendix can be considered an effective management tool.
Data Availability Statement
The raw data supporting the conclusions of this article will be made available by the authors, without undue reservation, to any qualified researcher.
Ethics Statement
The animal study was reviewed and approved by Florida Fish and Wildlife Conservation Commission and the National Park Service.
Author Contributions
MN directed all aspects of the sea turtle monitoring program at GUIS, and was responsible for collection of the at-risk, misorientation, and nest success data. ST directed and obtained funding for the project, and coordinated personnel tasked with collecting the night sky and horizon profile data. JW designed the apparatus used to take night sky measurements, provided training on its proper use, and contributed to data analyses. TS analyzed the data and wrote the article. All authors contributed to manuscript proofing and revision.
Funding
The National Park Foundation (3/20/2014) and National Fish and Wildlife Foundation (54274) provided funding through grants, and Environmental Stewards helped fund and manage several internships. Gulf Islands National Seashore provided funding for equipment, and teacher and intern stipends. ST and MN were provided with salary support from the NPS, JW was provided with salary support from the NPS and Colorado State University, and TS received salary support from the NPS and US Geological Survey, Fort Collins Science Center.
Disclaimer
Any use of trade, firm, or product names is for descriptive purposes only and does not imply endorsement by the U.S. Government.
Conflict of Interest
The authors declare that the research was conducted in the absence of any commercial or financial relationships that could be construed as a potential conflict of interest.
Acknowledgments
We thank interns H. Afford, S. Benyo, S. Butts, P. Caldwell, K. Christopher, S. Dantin, A. Giove, E. Grounds, R. Halterman, L. Harris, R. Harwell, A. Jones, M. Lenczewski, E. Marshall, C. Rohe, and D. Sibble; teacher M. MacGregor; volunteer M. Harwell; and other volunteers and citizen scientists who collected the data and managed the Teens Helping in the Seashore project. NPS park staff who provided support for the project included C. Bromley, B. Everitt, K. Irick, K. Lessard, B. Mims, and S. Tennyson. We also thank the NPS personnel who protected nesting turtles, eggs, and hatchlings, and collected data: J. Brandon, C. Brig, J. Bryars, R. Carruth, M. Hardin, J. Ingram, C. King, C. Tyson, and R. Wise. Special thanks also go to volunteers M. Albaugh, J. Awkerman, S. Blankman, J. Bonanno, J. Brandon, R. Cooper, C. Davis, B. Hemmer, M. Hemmer, N. Hetzel, W. Hoeflich, C. Marvel, C. Melton, A. Nicholas, J. Nicholas, S. Nicholas, T. Preston, L. Rodriguez, S. Rogan, C. Sessions, B. Sexton, J. Stegall, B. Stevenson, C. Tyson, M. Waite, S. Waite, and D. Zemenick.
References
Agafonkin, V., and Thieurmel, B. (2018). Suncalc: Compute Sun Position, Sunlight Phases, Moon Position and Lunar Phase. R Package Version 0.4. Available online at: https://CRAN.R-project.org/package=suncalc (accessed March 30, 2020).
Ahles, N., and Milton, S. L. (2016). Mid-incubation relocation and embryonic survival in loggerhead sea turtle eggs. J. Wildlife Manage. 80, 430–437. doi: 10.1002/jwmg.1023
Berry, M., Booth, D. T., and Limpus, C. J. (2013). Artificial lighting and disrupted seafinding behaviour in hatchling loggerhead turtles (Caretta caretta) on the Woongarra Coast, southeast Queensland, Australia. Aust. J. Zool. 61, 137–145.
Burnham, K. P., and Anderson, D. R. (2002). Model Selection and Multimodel Inference: A Practical Information-Theoretic Approach. 2nd Edn. New York, NY: Springer-Verlag.
Daniel, R. S., and Smith, K. U. (1947). The sea-approach behavior of the neonate loggerhead turtle (Caretta caretta). J. Comp. Physiol. Psychol. 40, 413–420. doi: 10.1037/h0058581
Duriscoe, D. M. (2016). Photometric indicators of visual night sky quality derived from all-sky brightness maps. J. Quant. Spectrosc. Ra. 181, 33–45. doi: 10.1016/j.jqsrt.2016.02.022
Foley, A., Peck, S., and Harman, G. (2006). Effects of sand characteristics and inundation on the hatching success of loggerhead sea turtle (Caretta caretta) clutches on low-relief mangrove islands in Southwest Florida. Chelonian Conserv. Biol. 5, 32–41.
Harewood, A., and Horrocks, J. (2008). Impacts of coastal development on hawksbill hatchling survival and swimming success during the initial offshore migration. Biol. Conserv. 141, 394–401. doi: 10.1016/j.biocon.2007.10.017
Hendrickson, J. R. (1958). The green sea turtle, Chelonia mydas (Linn.) in Malaya and Sarawak. P. Zool. Soc. Lond. 130, 455–535. doi: 10.1111/j.1096-3642.1958.tb00583.x
Lohmann, K. J., Witherington, B. E., Lohmann, C. M. F., and Salmon, M. (1996). “Orientation, navigation, and natal beach homing in sea turtles,” in The Biology of Sea Turtles, eds P. L. Lutz and J. A. Musick (Boca Raton, FL: CRC Press), 107–135.
Lorne, J. K., and Salmon, M. (2007). Effects of exposure to, artificial lighting on orientation of hatchling sea turtles on the beach and in the ocean. Endanger. Species Res. 3, 23–30. doi: 10.3354/esr003023
Mann, T. M. (1978). Impact of developed coastline on nesting and hatchling sea turtles in southeastern Florida. Fla. Mar. Res. Publ. 33, 53–55.
McFarlane, R. W. (1963). Disorientation of loggerhead hatchlings by artificial road lighting. Copeia 1963:153. doi: 10.2307/1441283
McGehee, M. A. (1990). Effects of moisture on eggs and hatchlings of loggerhead sea turtles (Caretta caretta). Herpetologica 46, 251–258.
Mrosovsky, N., and Shettleworth, S. J. (1968). Wavelength preferences and brightness cues in the water-finding behaviour of sea turtles. Behaviour 32, 211–257. doi: 10.1163/156853968x00216
Peterson, C. H., Fegley, S. R., Voss, C. M., Marschhauser, S. R., and Vandusen, B. M. (2013). Conservation implications of density-dependent predation by ghost crabs on hatchling sea turtles running the gauntlet to the sea. Mar. Biol. 160, 629–640. doi: 10.1007/s00227-012-2118-z
Philibosian, R. (1976). Disorientation of hawksbill turtle hatchlings, Eretmochelys imbricata, by stadium lights. Copeia 1976:824. doi: 10.2307/1443476
Pike, D. A., and Stiner, J. C. (2007). Sea turtle species vary in their susceptibility to tropical cyclones. Oecologia 153, 471–478. doi: 10.1007/s00442-007-0732-0
Price, J. T., Drye, B., Domangue, R. J., and Paladino, F. V. (2018). Exploring the role of artificial lighting in loggerhead turtle (Caretta caretta) nest-site selection and hatchling disorientation. Herpetol. Conserv. Biol. 13, 415–422.
R Core Team (2017). R: A Language and Environment for Statistical Computing. Vienna: R Foundation for Statistical Computing.
Rivas, M. L., Tomillo, P. S., Uribeondo, J. D., and Marco, A. (2015). Leatherback hatchling sea-finding in response to artificial lighting: interaction between wavelength and moonlight. J. Exp. Marine Biol. Ecol. 463, 143–149. doi: 10.1016/j.jembe.2014.12.001
Salmon, M., Reiners, R., Lavin, C., and Wyneken, J. (1995a). Behaviour of loggerhead sea turtles on an urban beach. I. Correlates of nest placement. J. Herpetol. 29, 560–567.
Salmon, M., Tolbert, M. G., Painter, D. P., Goff, M., and Reiners, R. (1995b). Behavior of loggerhead sea turtles on an urban beach. II. hatchling orientation. J. Herpetol. 29, 568–576.
Salmon, M., and Witherington, B. E. (1995). Artificial lighting and seafinding by loggerhead hatchlings: Evidence for lunar modulation. Copeia 1995, 931–938.
Salmon, M., and Wyneken, J. (1990). Do swimming loggerhead sea turtles (Caretta caretta L.) use light cues for offshore orientation? Mar. Behav. Physiol. 17, 233–246. doi: 10.1080/10236249009378774
Shaver, D. J., Lamont, M. M., Maxwell, S., Walker, J. S., and Dillingham, T. (2016). Head-started kemp’s ridley turtle (Lepidochelys kempii) nest recorded in florida: possible implications. Chelonian Conserv. Biol. 15, 138–143. doi: 10.2744/CCB-1192.1
Shaver, D. J., and Rubio, C. (2008). Post-nesting movement of wild and head-started Kemp’s ridley sea turtles Lepidochelys kempii in the Gulf of Mexico. Endanger. Species Res. 4, 43–55. doi: 10.3354/esr00061
Tuxbury, S. M., and Salmon, M. (2005). Competitive interactions between artificial lighting and natural cues during sea-finding by hatchling marine turtles. Biol. Conserv. 121, 311–316. doi: 10.1016/j.biocon.2004.04.022
Us Fish and Wildlife Service (2019). Endangered Species Database. Available online at: https://www.fws.gov/endangered/species/us-species.html (accessed February 21, 2019).
Valverde, R. A., and Holzwart, K. R. (2017). “Sea turtles of the Gulf of Mexico,” in Habitats and Biota of the Gulf of Mexico: Before the Deepwater Horizon Oil Spill, ed. C. Ward (New York, NY: Springer).
Van Rhijn, F. A., and Van Gorkom, J. C. (1983). Optic orientation in hatchlings of the sea turtle, Chelonia mydas. III. Sea-finding behaviour: the role of photic and visual orientation in animals walking on the spot under laboratory conditions. Mar. Behav. Physiol. 9, 211–228. doi: 10.1080/10236248309378594
Witherington, B. E. (1986). Human and Natural Causes of Marine Turtle Clutch and Hatchling Mortality and Their Relationship to Hatchling Production on an Important Florida Nesting Beach. Ph.D. thesis, University of Central Florida, Orlando, FL, 141.
Witherington, B. E. (1992a). Behavioral responses of nesting sea turtles to artificial lighting. Herpetologica 48, 31–39.
Witherington, B. E. (1992b). Sea-finding behavior and the use of photic orientation cues by hatchling sea turtles. Ph.D. dissertation, University of Florida, Gainesville, FL, 241.
Witherington, B. E. (1997). “The problem of photopollution for sea turtles and other nocturnal animals,” in Behavioral Approaches to Conservation in the Wild, eds J. R. Clemmons and R. Buchholz (Cambridge: Cambridge University Press), 303–328.
Witherington, B. E., Martin, R. E., and Trindell, R. N. (2014). Understanding, Assessing, and Resolving Light-Pollution Problems on Sea Turtle Nesting Beaches, Revised. Florida Fish and Wildlife Research Institute Technical Report TR-2. Petersburg, FL: Florida Fish and Wildlife Research Institute. vii+83.
Appendix
GUIS Protocol for Marine Turtle Nest Relocation (June, 2015)
Each season several nests at Gulf Islands National Seashore (GUIS) are built in locations that are precarious. On numerous occasions since 1994, nests have been built only 1.5–3.0 m from the Gulf of Mexico (GoM). In some instances, even nests built 6.0–12.0 m from the GoM are built in areas with little elevation and can readily flood. Flooding can come from above from high surf, or from below if ground water levels are elevated by rain or high surf.
Nests deemed to be too low on the beach or in danger of flooding can be moved. Historical GUIS records witness that large numbers of nests can flood and thus fail if left in situ.
A new nest location can be chosen and then excavated above the high tide line. Usually a suitable area can be found directly north of the at-risk nest site.
The top of the original nest, or egg cavity, should be measured by using a wooden stake and tape measure. Care must be taken to reflect the actual surrounding grade. Measure to the top and bottom of the nest or eggs, and record.
The new nests should be excavated to the same depth as the original nest cavity. The width should have similar dimensions as well. When all the eggs are deposited into the new cavity, the depth to the top of the eggs should be recorded.
Move the eggs one by one with care, but in a timely manner. Do not roll or rotate the eggs from their original orientation. Use a cooler to store the eggs. Fill the bottom with a layer of sand from the nest area to prevent the eggs from rolling in the container. The sand will also cushion the eggs. Use the lid to shade the eggs while moving them. Large temperature changes need to be avoided.
After all the eggs have been deposited (not dropped) carefully in the new nest cavity one at a time, partially cover the eggs with the moist sand, using sand from the original nest site. Compress with light to moderate pressure, then use surrounding moist sand as needed. Compress the sand again with your hands with slight to moderate pressure.
Mark these nests in accordance with GUIS general guidelines for a positive nest.
Keywords: light pollution, loggerhead sea turtle nesting, hatchling misorientation, night sky brightness, Caretta caretta, nest relocation, nest success, Gulf Islands National Seashore
Citation: Stanley TR, White JM, Teel S and Nicholas M (2020) Brightness of the Night Sky Affects Loggerhead (Caretta caretta) Sea Turtle Hatchling Misorientation but Not Nest Site Selection. Front. Mar. Sci. 7:221. doi: 10.3389/fmars.2020.00221
Received: 18 November 2019; Accepted: 23 March 2020;
Published: 15 April 2020.
Edited by:
Peter H. Dutton, Southwest Fisheries Science Center (NOAA), United StatesReviewed by:
Roldan A. Valverde, Southeastern Louisiana University, United StatesDavid Terrington Booth, University of Queensland, Australia
Copyright © 2020 Stanley, White, Teel and Nicholas. This is an open-access article distributed under the terms of the Creative Commons Attribution License (CC BY). The use, distribution or reproduction in other forums is permitted, provided the original author(s) and the copyright owner(s) are credited and that the original publication in this journal is cited, in accordance with accepted academic practice. No use, distribution or reproduction is permitted which does not comply with these terms.
*Correspondence: Thomas R. Stanley, stanleyt@usgs.gov