A Baseline for the Blue Economy: Catch and Effort History in the Republic of Seychelles’ Domestic Fisheries
 Hanna J. Christ
 Rachel White
 Lincoln Hood
 Gabriel M. S. Vianna
 Dirk Zeller
- 1Marine Futures Lab, School of Biological Sciences, University of Western Australia, Crawley, WA, Australia
- 2Sea Around Us – Indian Ocean, School of Biological Sciences, University of Western Australia, Crawley, WA, Australia
The adoption of sovereign blue bonds by the Republic of Seychelles, hereafter referred to as Seychelles, focuses on resource sustainability and illustrates options for island countries to use their ocean resources for years into the future. The fishing industry is one of the main pillars of Seychelles’ economy and is of crucial importance for domestic food- and employment-security. In order to promote long-term ecological sustainability and economic viability of domestic fisheries, accurate and long-term baseline information is required. Such baseline data were derived here with a reconstruction of the Seychelles’ domestic fisheries catches and fishing effort within its Exclusive Economic Zone (EEZ) from 1950 to 2017, coupled with resulting Catch Per Unit Effort data (CPUE). The total reconstructed domestic catch was approximately 1.5 times larger than the baseline as reported by the United Nations Food and Agriculture Organization (FAO) on behalf of Seychelles from 1950 to 2017 after adjustment for fully domestic catches within the EEZ. Domestic catches (i.e., excluding the large-scale industrial pelagic catches) increased by over 500% throughout the time period, growing from 1,900 t⋅year−1 in the 1950s to around 11,200 t in 2017. The major targeted taxa were jacks (Carangidae), tuna-like fishes (Scombridae) and snappers (Lutjanidae). Total fishing effort in the form of fishing capacity grew from 21,500 kWdays in 1950 to over 3.4 million kWdays in 2017. The resultant artisanal CPUE displayed a declining trend over time, suggesting a potential decline in relative abundance of fish populations within the Seychelles EEZ or targeted fishing areas.
Introduction
The novel blue bonds initiative in the Seychelles has emerged as a threefold strategy to encourage and support long-term sustainability, economic growth and social equity (WorldBank, 2018b; Schutter and Hicks, 2019). In 2018, the Seychelles issued the first sovereign blue bond in history to finance marine resource sustainability and advance the ocean economy, i.e., ocean-based economic activities (WorldBank, 2018a; Cisneros-Montemayor et al., 2019). The blue economy concept describes the use of various ocean resources for economic growth (ocean economy), whilst implementing environmentally sustainable practices and social equity (Cisneros-Montemayor et al., 2019). The development of a blue economy is particularly important to small island countries, as their societies and economies often face special challenges, such as limited terrestrial resources and economic opportunities, small domestic markets, a narrow range of domestic products and high dependence on imported goods (Briguglio, 1995; Jennings et al., 1996b; Rustomjee, 2016). Driven by growth in the tourism sector, the Seychelles became a high-income island state in 2014 with low absolute poverty levels (WorldBank, 2019). Despite a considerable Gross Domestic Product (GDP) per capita increase over the last decade, income inequality persists and poverty remains of national concern (Conceição, 2019; WorldBank, 2019). The socio-economic and environmental strategies from the blue bonds could arguably1 contribute to narrowing inequality gaps in order to advance a fairer and more inclusive society. Inequality gaps could be addressed through government incentives such as increases in the minimum wage or asset building for fishing families, e.g., home ownership (Powell, 2014).
The Seychelles’ blue bonds complement a broad range of sustainability initiatives such as marine spatial planning, debt swap for conservation2, and the World Bank’s Third South West Indian Ocean Fisheries Governance and Shared Growth Project (SWIOFish3)3. Fisheries management is a direct focus of the blue bonds and this initiative raised US$15 million to invest in the management of fisheries, marine protected areas, and seafood value expansion, whilst promoting ocean resilience to rebuild fish stocks (Jackson, 2018). The blue bond initiative is the first of its kind, as it attempts to address sustainable use of the marine environment, improve fisheries governance, and the potential impacts that such conservation measures could have on the livelihood of Seychellois, such as displacement from traditional fishing grounds and financial hardship from temporal closures and license restrictions (IFLR, 2019). To build truly effective fisheries management systems which ensure long-term viability and minimize social costs, comprehensive and historically extensive fisheries baseline data are required to inform management (Zeller et al., 2006, 2015; Froese et al., 2017; Palomares et al., 2018). These data will provide a historical baseline for informed insights and assessments of the status of underlying marine resources.
Seychellois and their economy are highly dependent on the Indian Ocean for many marine ecosystem services, including transportation, nutrition, and tourism (Jennings et al., 1996b; Mathieu et al., 2003; WorldBank, 2018b). The large-scale industrial tuna fishing industry is a key contributor to the Seychelles’ economy, providing ∼17% of the country’s employment and 68% of the entire export trade (Central Intelligence Agency, 2016; WorldBank, 2017). Although these large-scale, almost exclusively export-oriented tuna fisheries make a significant revenue contribution to the economy, they are dominated by foreign fleets and foreign beneficial ownership. Thus, truly domestic small-scale fisheries remain of paramount importance for domestic food security, employment, and cultural heritage in the Seychelles (Robinson et al., 2006). Despite inequality and the historical presence of poverty malnourishment is rare in the Seychelles, which illustrates that even those Seychellois living in poverty have continued access to fish, their primary source of protein and micronutrients (Carroll, 1991; Wilson, 1994; Golden et al., 2016; Hicks et al., 2019; WorldBank, 2019). This reaffirms that the food-security provided by the domestic small-scale artisanal and accompanying take-home catch as well as “true” subsistence fisheries are an integral health, livelihood and food security component in these communities (FAO, 2015; Pauly and Charles, 2015; Pauly and Zeller, 2016a). With careful consideration, the Seychelles’ blue bond initiative could provide a unique example for small island countries and emerging economies on how to improve and enhance a sustainable and profitable resource relationship (Ghina, 2003), and could be viewed as a crucial step in the right direction for fisheries policy and management (Zeller and Pauly, 2019).
Both environmental and social challenges are often created through the development of the fishing industry, as technological advancements lead to increased fishing effort, i.e., associated with economic gains, and a reduction in employment opportunities, e.g., mechanized longlines which require fewer fishers, leading to increased social inequality (Kent, 1986; Bailey and Jentoft, 1990; Miyake, 2005; Dunn et al., 2010; Zeller and Pauly, 2019). In addition, long-term sustainable practices and truly effective management has been recognized as a global necessity, due to widespread overfishing in an ultimately limited ecosystem (Jennings et al., 1996a; Robinson et al., 2004; Pauly, 2006; Payet and Agricole, 2006; Chang-Seng, 2007; Daw et al., 2012; Khan and Amelie, 2015; Pauly and Zeller, 2016a, b; Zeller and Pauly, 2019). In the Seychelles, reducing fishing pressure on marine resources has been of national interest since the 1980s (Wakeford, 2001), when concerns arose due to rapid fleet expansion and technological development, i.e., larger motorized vessels primarily focused on the traditional and vulnerable inshore fishing grounds (Grandcourt, 2002). Among attempts to reduce the exploitation of coastal resources, the government issued low-interest loans to encourage the acquisition of larger vessels with the intention of relocating fishing effort to offshore fishing areas that were thought to be more lightly exploited (Carroll, 1991). However, over time such subsidized loans led to an overall increased fishing pressure in both offshore and inshore regions and an overall higher fishing effort (Zeller and Pauly, 2019).
In 1984, the Seychelles established the Seychelles Fishing Authority (SFA), which began collecting data on landed catch, vessel registration, days fished, gears utilized and catch rates (SFA, 1988, 1996, 2005, 2006, 2014, 2017). However, despite intensive and commendable efforts by the SFA to collect and report commercial fisheries data, a comprehensive long-term and high-resolution catch and effort analysis that also considers non-commercial, e.g., subsistence, or discarded catch had not been conducted. In addition to collecting and reporting on catch data, fishing fleet statistics are highly useful for providing insights into changes in fishing effort and the status of targeted fish stocks (Davidson et al., 2014). The present study reconstructs and examines catch and fishing effort data from 1950 to 2017 for domestic marine fisheries within Seychelles’ EEZ (Figure 1). Fishing effort data and the corresponding CPUE were reconstructed for artisanal, recreational sportfishing and industrial fisheries within Seychelles EEZ. The “true” subsistence sector was not considered here but instead take-home catch as a component of the artisanal fishery, and therefore “true” subsistence effort was not presented. The corresponding Catch Per Unit Effort (CPUE) trends were also evaluated using these catch and effort time series data. The aim was to provide a comprehensive historical baseline for each domestic fishing sector (semi-industrial, artisanal, recreational, and subsistence) over a historically and ecologically meaningful time period. The increased focus on marine conservation, sustainability, and long-term fisheries management by the Seychelles’ government highlight the importance of comprehensive historical data baselines for informed decision-making.
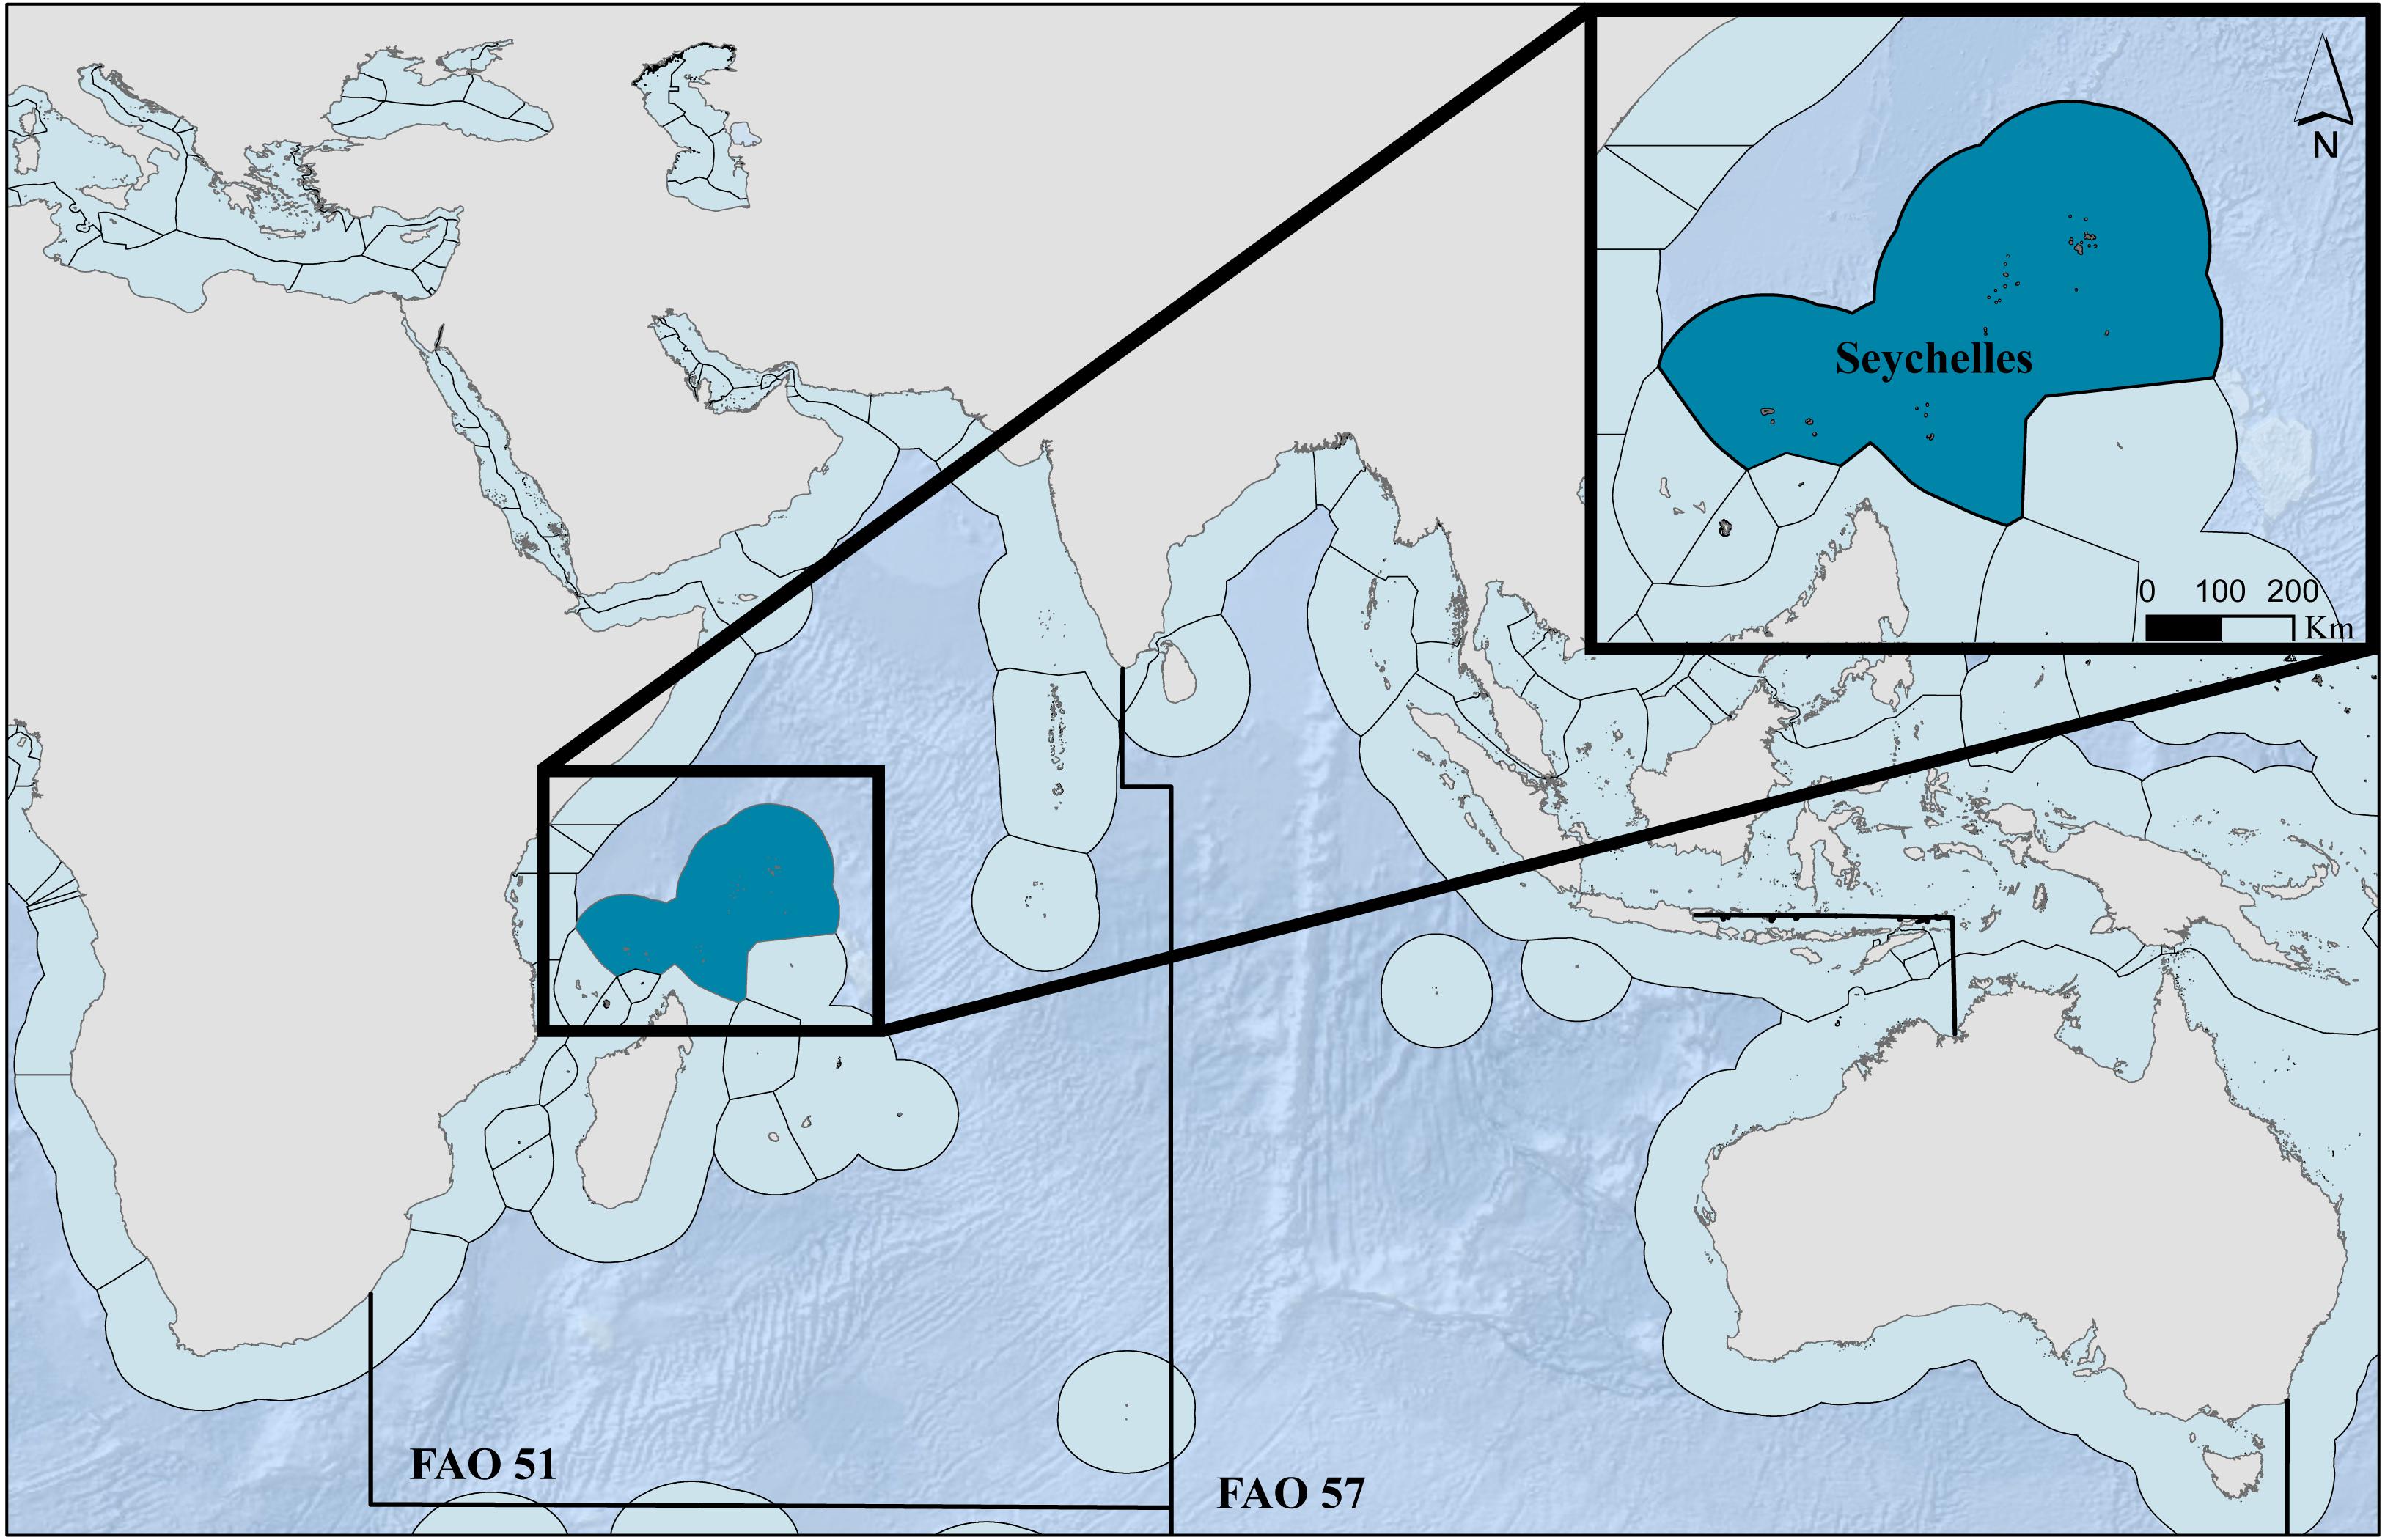
Figure 1. The exclusive economic zone (EEZ) of the Republic of Seychelles.
Methods
Total domestic marine fisheries catch for 1950–2017 was derived for the Seychelles following the reconstruction approach outlined in Zeller et al. (2016). This catch data reconstruction was built upon the official catch statistics as reported by the Food and Agriculture Organization (FAO) of the United Nations on behalf of the Seychelles, by complementing these official records with the best available time series estimates of all unreported fisheries components using secondary data from the peer-reviewed and gray literature. These secondary data, combined with conservative assumptions allow a comprehensive catch data time series to be developed that can help address existing data gaps (Pauly and Zeller, 2016b). The present study builds on a previous preliminary reconstruction for the Seychelles from 1950 to 2010 by Le Manach et al. (2015b). With newly available literature and government reports, the present study introduces take-home catch estimates since 1950, provides updates to industrial, artisanal, and recreational catches, and improves the taxonomic resolution of the catch data.
The SFA, the FAO, and the Indian Ocean Tuna Commission (IOTC) all report on particular components of Seychelles’ fisheries. Data reported by the FAO are the historically longest time series of catches starting in 1950, but only represent reported landings (FAO, 2019a). These data were used as the reported baseline data to the most recently reported FAO data year (here 2017). Official landings data presented by the FAO on behalf of the Seychelles reports catches for both the Eastern (FAO area 57) and Western Indian Ocean (FAO area 51). As all of the Seychelles’ EEZ waters are well within the Western Indian Ocean (Figure 1), the Eastern Indian Ocean landings were assumed to belong exclusively to large-scale industrial tuna and billfish vessels (Le Manach et al., 2015b). In addition, these large-scale industrial vessels, under majority-foreign beneficial ownership, caught 90% of Seychelles’ Western Indian Ocean landings, which were primarily tuna and billfishes. These assumed foreign beneficial ownership tuna and billfish landings from the Eastern and Western Indian Ocean were harmonized with the FAO and the IOTC data to avoid double reporting, and treated separately in a spatially assigned Sea Around Us global catch database (Zeller et al., 2016; Coulter et al., 2020). These industrial tuna and billfish data can be accessed via the integrated catch dataset for the Seychelles at www.seaaroundus.org/data/#/eez/690 and www.seaaroundus.org/data/#/fao/51 and www.seaaroundus.org/data/#/fao/57. However, due to the focus on truly domestic, within EEZ fisheries, these catches were excluded from consideration in the current study, and thus, the remaining assumed domestic FAO reported data is henceforth referred to as the “adjusted” FAO reported baseline.
The SFA reports generally consist of three main sectors: industrial, semi-industrial, and artisanal. The industrial sector is the large-scale tuna and billfish fisheries with predominantly foreign beneficial ownership which was treated independently from this study (Coulter et al., 2020). The data for the industrial tuna-associated fishery are integrated and available via www.seaaroundus.org/data/#/eez/690 and www.seaaroundus.org/data/#/fao/51 and www.seaaroundus.org/data/#/fao/57. The semi-industrial and artisanal sectors are domestically owned and operated commercial fleets. The semi-industrial fleet encompasses larger longline boats that fish offshore waters within the EEZ for tuna-like taxa. The semi-industrial sector was considered the “domestic industrial” sector in the present study to align with the globally applied sectoral assignments of the Sea Around Us into industrial, artisanal, subsistence and recreational sectors (Zeller et al., 2016). The artisanal sector represents small-scale vessels and fishers operating primarily for commercial purposes in nearshore and inshore waters (Zeller et al., 2016). This sector differentiation is consistent with the previous preliminary reconstruction of the Seychelles by Le Manach et al. (2015b). In addition to commercial fisheries, catches from the non-commercial sectors (recreational and subsistence), not or rarely reported on by the SFA, were also reconstructed in this study. Recreational fisheries were considered exclusively sportfishing charter boat operations and this may under-represent catches due to the absence of non-charter recreational fishers. Subsistence fisheries were considered as take-home catches by commercial fishers only, which provide personal and family home consumption (Zeller et al., 2016). Thus, “true” subsistence fishing by non-commercial fishers was not accessed here. Both missing non-commercial components require further study and dedicated data collection and estimation in the Seychelles. For each fishing sector, the catch data were subdivided as either reported or unreported, landed (i.e., retained) or discarded (dead), and the best available taxonomic category was assigned. In agreement with SFA (2018), we conservatively assumed that the small-scale sectors (artisanal, recreational sportfishing, and take-home subsistence) had no discards, i.e., all catches were considered landed and retained. Discards of dead or dying catch by small-scale fisheries operating in relatively shallow water using predominantly static gears such as traps (and even handlines) are relatively low, even if unwanted bycatch may exist, albeit with often high survival rates (Zeller et al., 2018).
Domestic Data
Artisanal
Since 1990, the SFA has reported the number of registered vessels by vessel type (pirogue, vessels with outboard motors, schooner, and whaler) and gear (handline, trap, net and miscellaneous). In order to reconstruct the vessel time series prior to 1985 (the first year of reported vessel registrations), the ratio of pirogues by gear type to the total population of the Seychelles was derived (De Moussac, 1987; Payet, 1996; Le Manach et al., 2015b). The ratio of pirogue to total population was doubled for 1950, under the assumption that pirogues were relatively more common in this period, as they were the only fishing vessel type at the time, followed by the introduction of whalers in 1958 (Wakeford, 2001), schooners in 1974 (Payet, 1996), and vessels with outboard motors in 1981 (De Moussac, 1987; Bach and Lablache-Carrara, 1991; Payet, 1996; Wakeford, 2001; Le Manach et al., 2015b). The pirogue to population ratio was interpolated from the anchor points in 1950–1985 and multiplied by the population of Seychelles in each year to estimate the number of pirogue vessels from 1950 to 1984 (Le Manach et al., 2015b; UNSD, 2018; National Bureau of Statistics, 2019). The numbers of whalers, schooners, and vessels with outboard motors were reported from 1985 to 2017, these vessel counts were extrapolated back to their known year of introduction, 1958, 1974, and 1981, respectively (De Moussac, 1987; Bach and Lablache-Carrara, 1991; SFA, 1991; Payet, 1996; Wakeford, 2001; Le Manach et al., 2015b; Assan and Lucas, 2016). Specific gear ratios were reported in 1990 (SFA, 1991) and 2015 (Assan and Lucas, 2016) for all vessel types (pirogues, whalers, schooners, and vessels with outboard motors). All vessel-specific gear ratios were interpolated between the reported ratios in 1990 and 2015, the given trends in gear ratios were carried back to the start year of each vessel type and extrapolated forward to 2017 (SFA, 1991; Assan and Lucas, 2016) to create a complete time series of the artisanal fishing fleet by vessel and gear type (see Supplementary Table S1) (De Moussac, 1987; Bach, 1992; Payet, 1996; Wakeford, 2001; Le Manach et al., 2015b).
Catch rates (kg⋅person−1⋅day−1) of landed catch per vessel type and gear type were reported for 1990 and 2015 in the SFA statistical reports (SFA, 1991, 2016). To derive a catch rate time series, the rates between these years were interpolated and extrapolated forward to 2017. For each gear type during the early time period (1950–1989), the specific gear type catch rate from 1990 was conserved back to 1970, and then linearly extrapolated to a 25% reduction in 1950 (see Supplementary Table S2).
Crew size and numbers of days fished were reported by vessel type for 1990 and 2015 in SFA fisheries statistical reports (SFA, 1991; Assan and Lucas, 2016). For each vessel type, the crew size, and days fished were interpolated between reported years (1990 and 2015). For pirogues and outboard motor-powered vessels, the number of days fished in 1990 was held constant back to 1950 and 1981, respectively, as pirogues were assumed to have been fishing prior to 1950, and outboard motor-powered vessels were reported as fishing full time in the year of introduction (De Moussac, 1987; SFA, 1991; Payet, 1996; Wakeford, 2001). For whalers and schooners, the 1990 reported number of days fished was linearly carried back to an assumed full-time rate in the year of introduction, 1958 and 1974, respectively (De Moussac, 1987; SFA, 1991; Bach, 1992; Payet, 1996; Wakeford, 2001). To determine crew sizes for pirogues, whalers, schooners, and outboard motor-powered vessels, the reported crew size in 1990 was linearly interpolated to the reported 2015 crew size, and the 1990 reported crew size was held constant back to the year of known introduction for each vessel type, and the 2015 crew size was held constant to 2017 (SFA, 1991, 2016; Wakeford, 2001; Le Manach et al., 2015b.
Finally, for each vessel-gear type, e.g., pirogue-handline, the annual landed catch was calculated using the associated crew size, catch rate, and the number of days fished. For every given year, landed catch for each vessel-gear type was added together to estimate the total reconstructed annual landed catch for the artisanal fishery. This follows the procedures also used in the preliminary reconstruction by Le Manach et al. (2015b).
The adjusted FAO reported baseline (see above for exclusion of foreign beneficial ownership dominated tuna and billfish catches) was assumed to represent artisanal catch only, i.e., it was assumed that non-commercial catches (recreational and subsistence) were not included in the reported data, and thus, any difference between the reported and total reconstructed artisanal catch for any given year was assigned as unreported artisanal landings.
Sportfishing (Recreational)
The recreational fisheries data estimated here were assumed to be entirely tourism-based sport fishers on charter vessels and largely started after the airport inauguration in 1970 (Payet, 1996; Le Manach et al., 2015b). Thus, our estimates for the recreational sector are minimum estimates as they exclude any potential domestic recreational fisheries undertaken outside of charter boat operations. The number of charter vessels were assumed to start in 1970 and were reported by the SFA for the years 1985–1992 and 1996–2001, and by the IOTC in 2017 (Payet, 1996; SFA, 2005; Pepperell et al., 2017; Assan et al., 2018). These reported data indicated that the charter fleet increased rapidly from 7 vessels in 1985 to 38 in 2001 and to 168 vessels in 2017. The number of charter vessels were interpolated between anchor points for unknown years. A comprehensive report of charter vessels and landings for 1985–1990 was released by the SFA (1991); as no other SFA reports specified recreational or sportfishing catches, the data from SFA (1991) were assumed unreported to the FAO, and thus were considered here as unreported catches (Nageon et al., 2014). The 1985–1990 data points from SFA (1991) were used to estimate catch rates per charter vessel, as these rates were variable and showed a declining trend over time they were used as indicators only for the remaining time period. Due to a lack of information, the 1985 catch per vessel (4.1 t⋅vessel−1) was held constant back to 1970 and multiplied by the interpolated number of charter vessels from 1971 to 1984 to estimate the sportfishing landings in these years. The 1990 catch per vessel (2.3 t⋅vessel−1) was held constant to 2017 and multiplied by the number of reported and interpolated charter vessels from 1991 to 2017 to estimate the annual sportfishing landings.
Take-Home Catch (Subsistence)
The subsistence catches as estimated here were considered to be entirely take-home catch by artisanal fishers only. Thus, “true” subsistence fishing by non-commercial fishers has yet to be quantified. In 1994, 7% of households in the Seychelles were considered to be commercial fisher households (National Bureau of Statistics, 2012). The percent of fisher households from 1994 was maintained at 7% back to 1950, due to a lack of information on the earlier period and as a lower percentage of fisher households in early periods would be unlikely, due to the traditional reliance on this resource (Louis-Marie, 1987). In 2010, 14% of total households in the Seychelles were reported to be commercial fisher households (National Bureau of Statistics, 2012). Commercial fisher household percentages were interpolated between 1994 (7%) and 2010 (14%), and the 2010 percentage was conservatively held constant to 2017 (Le Manach et al., 2015b; UNSD, 2018; National Bureau of Statistics, 2019).
In 1950, 100% of all commercial fisher households in the Seychelles were assumed to take some catch home for self- and family-consumption. In 2010, a household survey reported that 71% of all fisher households engaged in take-home catch (UNSD, 2018). A linear interpolation of the percentage of households engaging in take-home catch was performed between 1950 (100%) and 2010 (71%), and the trend was carried forward to 2017. The number of total households were reported in 1971, 1977, 1987, 1994, 1997, 2002, and 2010 (National Bureau of Statistics, 2012, 2017) and were utilized to estimate the average family size. This trend in family size was extrapolated back to 1950, and forward to 2017. Family size was multiplied by fisher households engaged in take-home catch to estimate the total number of people consuming take-home catch.
As there were no independent studies for pre-1990, the per capita consumption study by Wilson (1994) with 85 kg⋅person−1⋅year−1 was assumed as the take-home catch consumption for 1950, and this was interpolated to 57 kg⋅person−1⋅year−1 in 2017 as indicated by the WorldBank (2017) to derive a complete time series. The number of people assumed to be consuming take-home catch from 1950 to 2017 (based on family size) was multiplied by the consumption rate time series. Due to the systematic absence of take-home and/or “true” subsistence catch data from the SFA statistical reports, all take-home catches were assumed to be unreported.
Semi-Industrial (Domestic Industrial)
The semi-industrial fishery in the Seychelles, here considered “domestic industrial” in line with the Sea Around Us database structure (Zeller et al., 2016), started in 1995 and historically targeted billfish, sharks, and tuna in offshore EEZ waters (SFA, 1991; Kolody et al., 2010; Le Manach et al., 2015b). Due to the relatively small fleet size (5 active vessels in 2016), all semi-industrial landings were assumed to be reported by the SFA (2016) and therefore to the FAO. However, discards were assumed to be unreported, as these are explicitly excluded from FAO data requests (FAO, 2019a) but specifically included by the Sea Around Us (Zeller et al., 2016, 2018). Estimates of discarded catch were derived as a proportion of the reported landings from this sector. The discards considered here were based on targeted catch damaged by shark and cetacean depredation (Le Manach et al., 2015b; Rabearisoa et al., 2018). Depredation rates to targeted tuna/billfish catches ranged from 11 to 30% between 1995 and 2000 (SFA, 1996, 1998, 2002; Le Manach et al., 2015b); these rates were applied as is and the 2000 rate of 21% was carried forward to 2017. Any potential discards of non-depredated but unwanted and unmarketable species were not estimated here but require further research. Our discards estimates are therefore likely conservative.
Taxonomic Composition
The taxonomic composition of reported landings (semi-industrial and artisanal sectors), was based on the adjusted FAO baseline data, however, the SFA statistical reports from 1990 SFA (1991), 2013 (Assan and Lucas, 2015), and 2015 (SFA, 2005) had more detailed taxonomic information. Utilizing these detailed SFA reports, the FAO taxonomic categories were disaggregated further. The FAO taxonomic categories were disaggregated by linear interpolation between the taxa reported within each category in 1990 SFA (1991) and an average of the taxa reported within each category in the 2013 and 2015 SFA reports (SFA, 1991; Assan and Lucas, 2015, 2016). The taxonomic disaggregation within FAO categories was conserved (i.e., not altered) from the SFA anchor points for pre-1990 and post-2013. A report on sharks by Nevill et al. (2007) had distinct artisanal and industrial commonly caught shark species, this disaggregation was held constant for reported “sharks and rays” for the entire time period due to the lack of earlier studies on shark composition in the commercial fisheries catch. As the FAO had limited taxonomic disaggregation in the early time period, the taxonomic breakdown for “marine fishes nei” was estimated to be the average reported landings for 1983–2017 by the FAO (2019b) for the entire time period (Le Manach et al., 2015b).
For the unreported catch component estimated for the artisanal sector, the interpolated SFA taxonomic breakdown from 1990 to 2015 was applied (SFA, 1991; Nevill et al., 2007; Assan and Lucas, 2016; SFA, 2016). For 1950–1989 the SFA (1991) disaggregation from 1990 was held constant, and for 2016–2017 the disaggregation from Assan and Lucas (2016) was carried forward (see Supplementary Table S3).
The taxonomic composition for the estimated sportfishing catches was based on the reported sportfishing landings from 1990 (SFA, 1991) and anecdotal4 reports of targeted reef fish (FAO, 2005; Martín, 2011; Breuil and Grima, 2014; Nageon et al., 2014; Pepperell et al., 2017). This disaggregation was held constant for the entire period this fishery was active, i.e., 1971–2017 (SFA, 1988, 1991). See Supplementary Tables S4 for details.
For the taxonomic composition of the estimated take-home catch, the combined reported and unreported artisanal landings composition (see above) was utilized, but adjusted for the exclusion of high-value taxa, i.e., tunas, lobster, sea cucumber, and sharks (see Supplementary Table S5). Thus, lower-value fish were assumed to be the most likely to be used for self- and family-consumption, with high-valued taxa generally sold. This assumption was supported by the high prevalence of poverty affecting fisher families (Muller et al., 2016).
Fishing Effort Data
The Seychelles’ total fishing effort for its domestic fleet, i.e., excluding the large-scale tuna/billfish fleets with predominantly foreign beneficial ownership (Coulter et al., 2020), was estimated following the global fishing effort method described in Greer et al. (2019) based on the fishing capacity of the artisanal, sportfishing, and semi-industrial fisheries. Since the take-home catch was estimated as a component of the artisanal fishery rather than an independent truly subsistence fishery, a dedicated fishing effort for the take-home catch was not estimated. The fishing effort for each sector was calculated based on the number of vessels, length, motorization (kW), days fished, and type of gear utilized in individual fleets.
The total number of fishing vessels operating in each fleet were those used to estimate the landings described above. Vessel size, motorization, and days fishing data from the Sea Around Us global fishing effort database were updated with local information and sources as outlined below (Table 1). Artisanal vessels were assigned an average length of 4.5 m or 11.3 m, classified as either unmotorized (i.e., traditional pirogues), or motorized vessels. Charter (sportfishing) vessels were assigned an average length of 11.3 or 20.0 m and semi-industrial vessels were 20.0 m, all motorized (Table 1). Engine power in kW was associated with the length of motorized vessels and gear used, while unmotorized vessels were allocated an engine power equivalent based on manpower conversion equivalent to motorization (Greer et al., 2019). Commercial (artisanal and semi-industrial) fishers were assumed to spend 175 days per year fishing, and tourist charter boats were assumed to be fishing recreationally for 104 days per year. Final effective fishing effort (kWdays) was estimated for each individual fishing fleet from 1950 to 2017 by combining the number of vessels, engine power, and days fished.
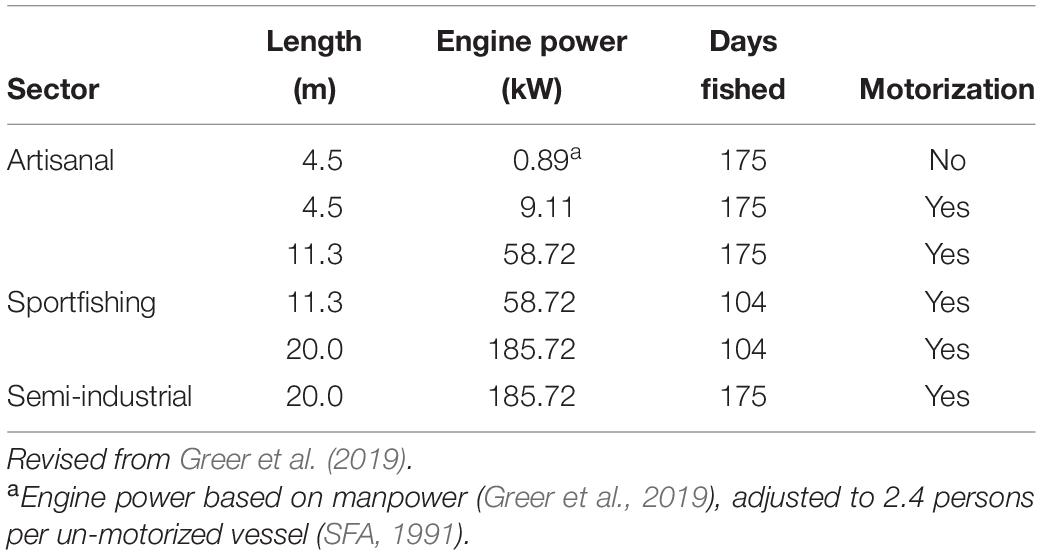
Table 1. Fishing capacity of the artisanal, recreational sportfishing, and semi-industrial fishing sectors of the Republic of Seychelles.
Catch per Unit Effort (CPUE)
Estimated Catch Per Unit Effort (CPUE) time series were derived for the artisanal, recreational sportfishing, and semi-industrial sectors in an attempt to derive a first-order indicator of likely relative abundance trends of the underlying fish stocks within the Seychelles. The CPUE per sector was derived by dividing the reconstructed catch time series by the estimated fishing effort from 1950 to 2017 for each sector, excluding the large-scale industrial tuna and billfish fleets dominated by foreign beneficial ownership (Coulter et al., 2020).
Data Uncertainty
Data uncertainty scores in the form of data reliability scores for the catch data were assigned by fishing sector for four time periods (1950–1969, 1970–1989, 1990–2009, and 2010–2017). Uncertainty around, or trust in the data derived here, both reported and unreported, was estimated following a scoring approach adopted from the Intergovernmental Panel on Climate Change (IPCC) as outlined in Zeller et al. (2016). Uncertainty scores range from 1 to 4, representing highest uncertainty (±50%) to lowest uncertainty (±10%) (see Supplementary Table S7).
Results
The reconstructed annual domestic catches, excluding the large-scale industrial tuna and billfish fleets dominated by foreign beneficial ownership (Coulter et al., 2020), across all the sectors considered here increased by more than 500% over the 1950–2017 time period, from 1,900 t in 1950 to 11,200 t in 2017 (Figure 2). From 1950–1986, the reconstructed catches increased by approximately 200 t⋅year−1 to the first time series peak of 9,200 t in 1986, and then declined until the 2000s, before increasing again, eventually reaching 11,200 t in 2017. Of the total reconstructed catch, 38% was deemed unreported, with the unreported proportion decreasing from nearly 50% of total catches in 1950 to an average of around 30% in the early 1990s (Figure 2). Since 1995, the unreported proportion fluctuated with an average of 38% until 2016, when the adjusted reported FAO baseline data suddenly declined by 45%, resulting in an unreported proportion of 63% for 2017.
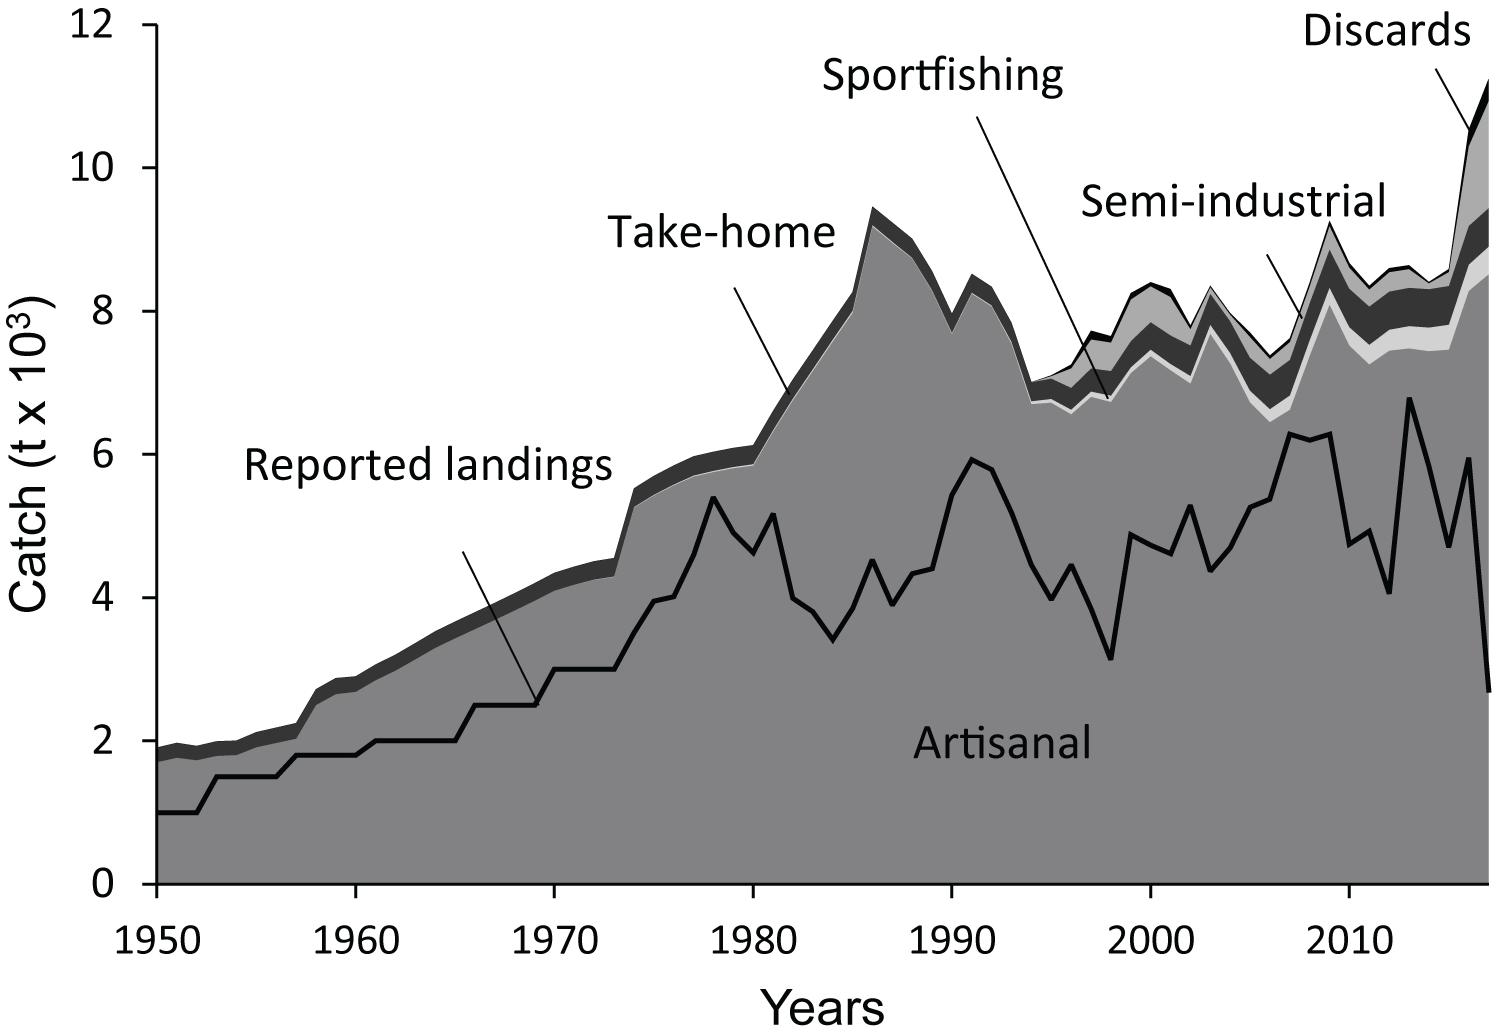
Figure 2. Total reconstructed domestic catch for Seychelles from 1950 to 2017 within Seychelles’ EEZ by fishing sector. Landings as reported by FAO on behalf of the Seychelles are represented as the black overlay line. Industrial large-scale tuna and billfish fisheries are excluded and addressed separately in the global spatial tuna database (Coulter et al., 2020).
The artisanal sector dominated the domestic fisheries within the Seychelles’ EEZ and represented over 90% of total truly domestic catches since 1950. The artisanal catch exhibited an increasing trend from 1950 to 1986 when it peaked with an annual catch of 9,200 t (Figure 2). From 1987 to 2017 the artisanal catch stabilized with interannual variability at an average of 7,500 t⋅year−1.
The recreational sportfishing sector steadily increased since its commencement in 1971 and represented around 4% of the entire Seychelles domestic catch in 2017 (Figure 2). Sportfishing landings increased from around 60 t in the mid-1990s to almost 400 t in 2017. The total sportfishing catch from 1971 to 2017 was 4,900 t, all of which was considered unreported.
The subsistence take-home consumption increased from 200 t in 1950 to 500 t in 2017 and had an average of 310 t⋅year−1 across the entire time period. The total take-home catch from 1950 to 2017 was 21,400 t, all of which was considered unreported.
The semi-industrial sector increased over time, contributing 16% to the total catch in 2017, compared to 5% when it commenced (Figure 2). It displayed particularly strong growth in the last two years. The semi-industrial fishery had an average catch of 330 t⋅year−1 until 2015, however, in 2016 the annual catch increased fourfold with an average catch of 1,600 t⋅year−1 for 2016–2017. This fishery produced almost 1,700 t of discards, i.e., 17% of its landings, over the active time period (1995–2017), which were all deemed unreported.
Taxonomic Composition
The catch composition across all four sectors comprised over 90 taxa, of which 65 were at the informative species level, accounting for 53% of the reconstructed catch. This represents 15 taxonomic categories in the data reported by the FAO on behalf of the Seychelles. The major family was Carangidae, representing 27% of the total catch, with the dominant taxa being Carangoides spp. and Caranx sexfasciatus (Figure 3). The second most important family was Scombridae, which accounted for 23% of the total catch, with Rastrelliger kanagurta and Rastrelliger spp. being the main taxa (Figure 3). Lutjanidae accounted for 16%, with Aprion virescens and Lutjanus spp. being the most caught taxa. Siganidae and Lethrinidae each represented 8% of the total catch, and Serranidae and Sphyraenidae nearly 4% of the total catch each.
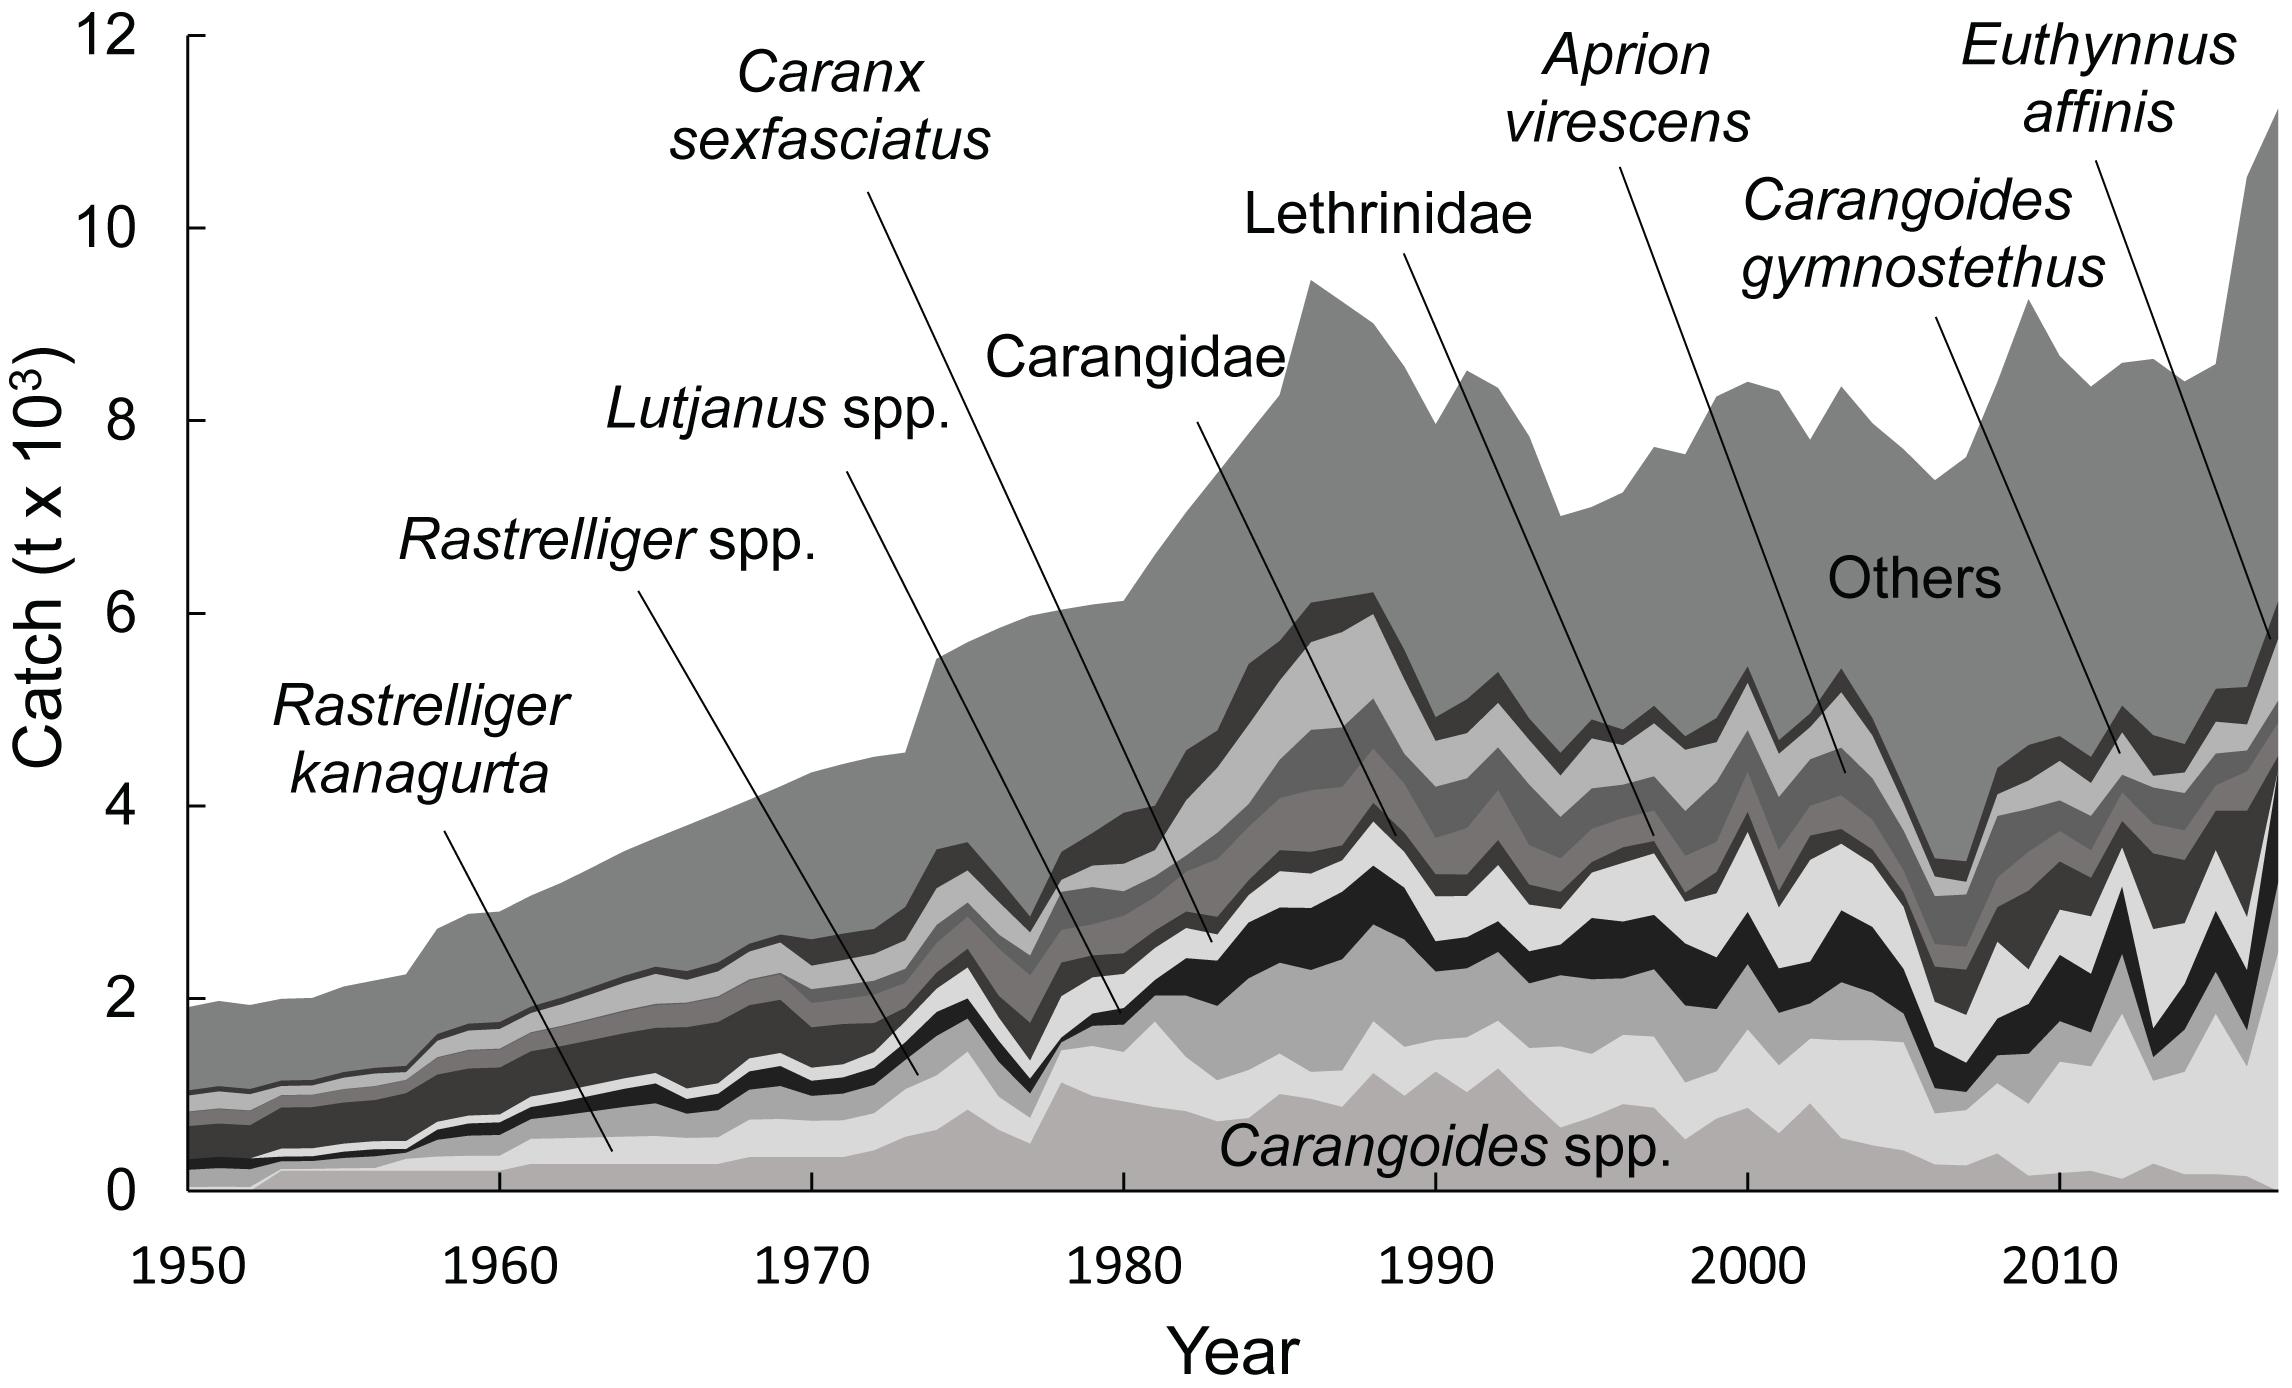
Figure 3. Taxonomic composition of reconstructed total catches for Seychelles for 1950–2017. The category “Others” consists of 82 additional taxa with minor contributions to the overall catch.
For the artisanal and take-home catch, Carangidae, Scombridae, and Lutjanidae were the main families and represented over 60% of the total catch (Supplementary Tables S3, S5). The sportfishing sector primarily targeted Scombridae (Euthynnus affinis and Thunnus albacares) and Istiophoridae (Istiophorus platypterus), these taxa combined represented more than 70% of the targeted sportfishing taxa (see Supplementary Table S4). The semi-industrial sector primarily targeted Scombridae with T. albacares and T. obesus which represented 38% of the total catch, followed by Xiphias gladius 37% and Elasmobranchii 20% (see Supplementary Table S6).
Fishing Effort
The total effective fishing effort, here estimated as annual fishing capacity, has grown from 21,500 kWdays in 1950 to over 3.4 million kWdays in 2017 (Figure 4A). In addition to the gradual increase in the total number of vessels, from 147 vessels in 1950 to 708 vessels in 2017 (Figure 4B), effective fishing effort has also increased due to the introduction and growth in vessel motorization. Artisanal (and take-home component) fishing effort represented 100% of the total effective effort in 1950 but declined to 53% in 2017 (Figure 4A). This percent decline was primarily due to the establishment and rapid growth of the sportfishing sector and more recently the semi-industrial sector. The sportfishing sector began in 1971 with an estimated 2,800 kWdays of effort and grew to over 1.1 million kWdays in 2017 (Figure 4A). The semi-industrial sector began in 1995 and by 2017 accounted for 12% of the total effort (Figure 4A).
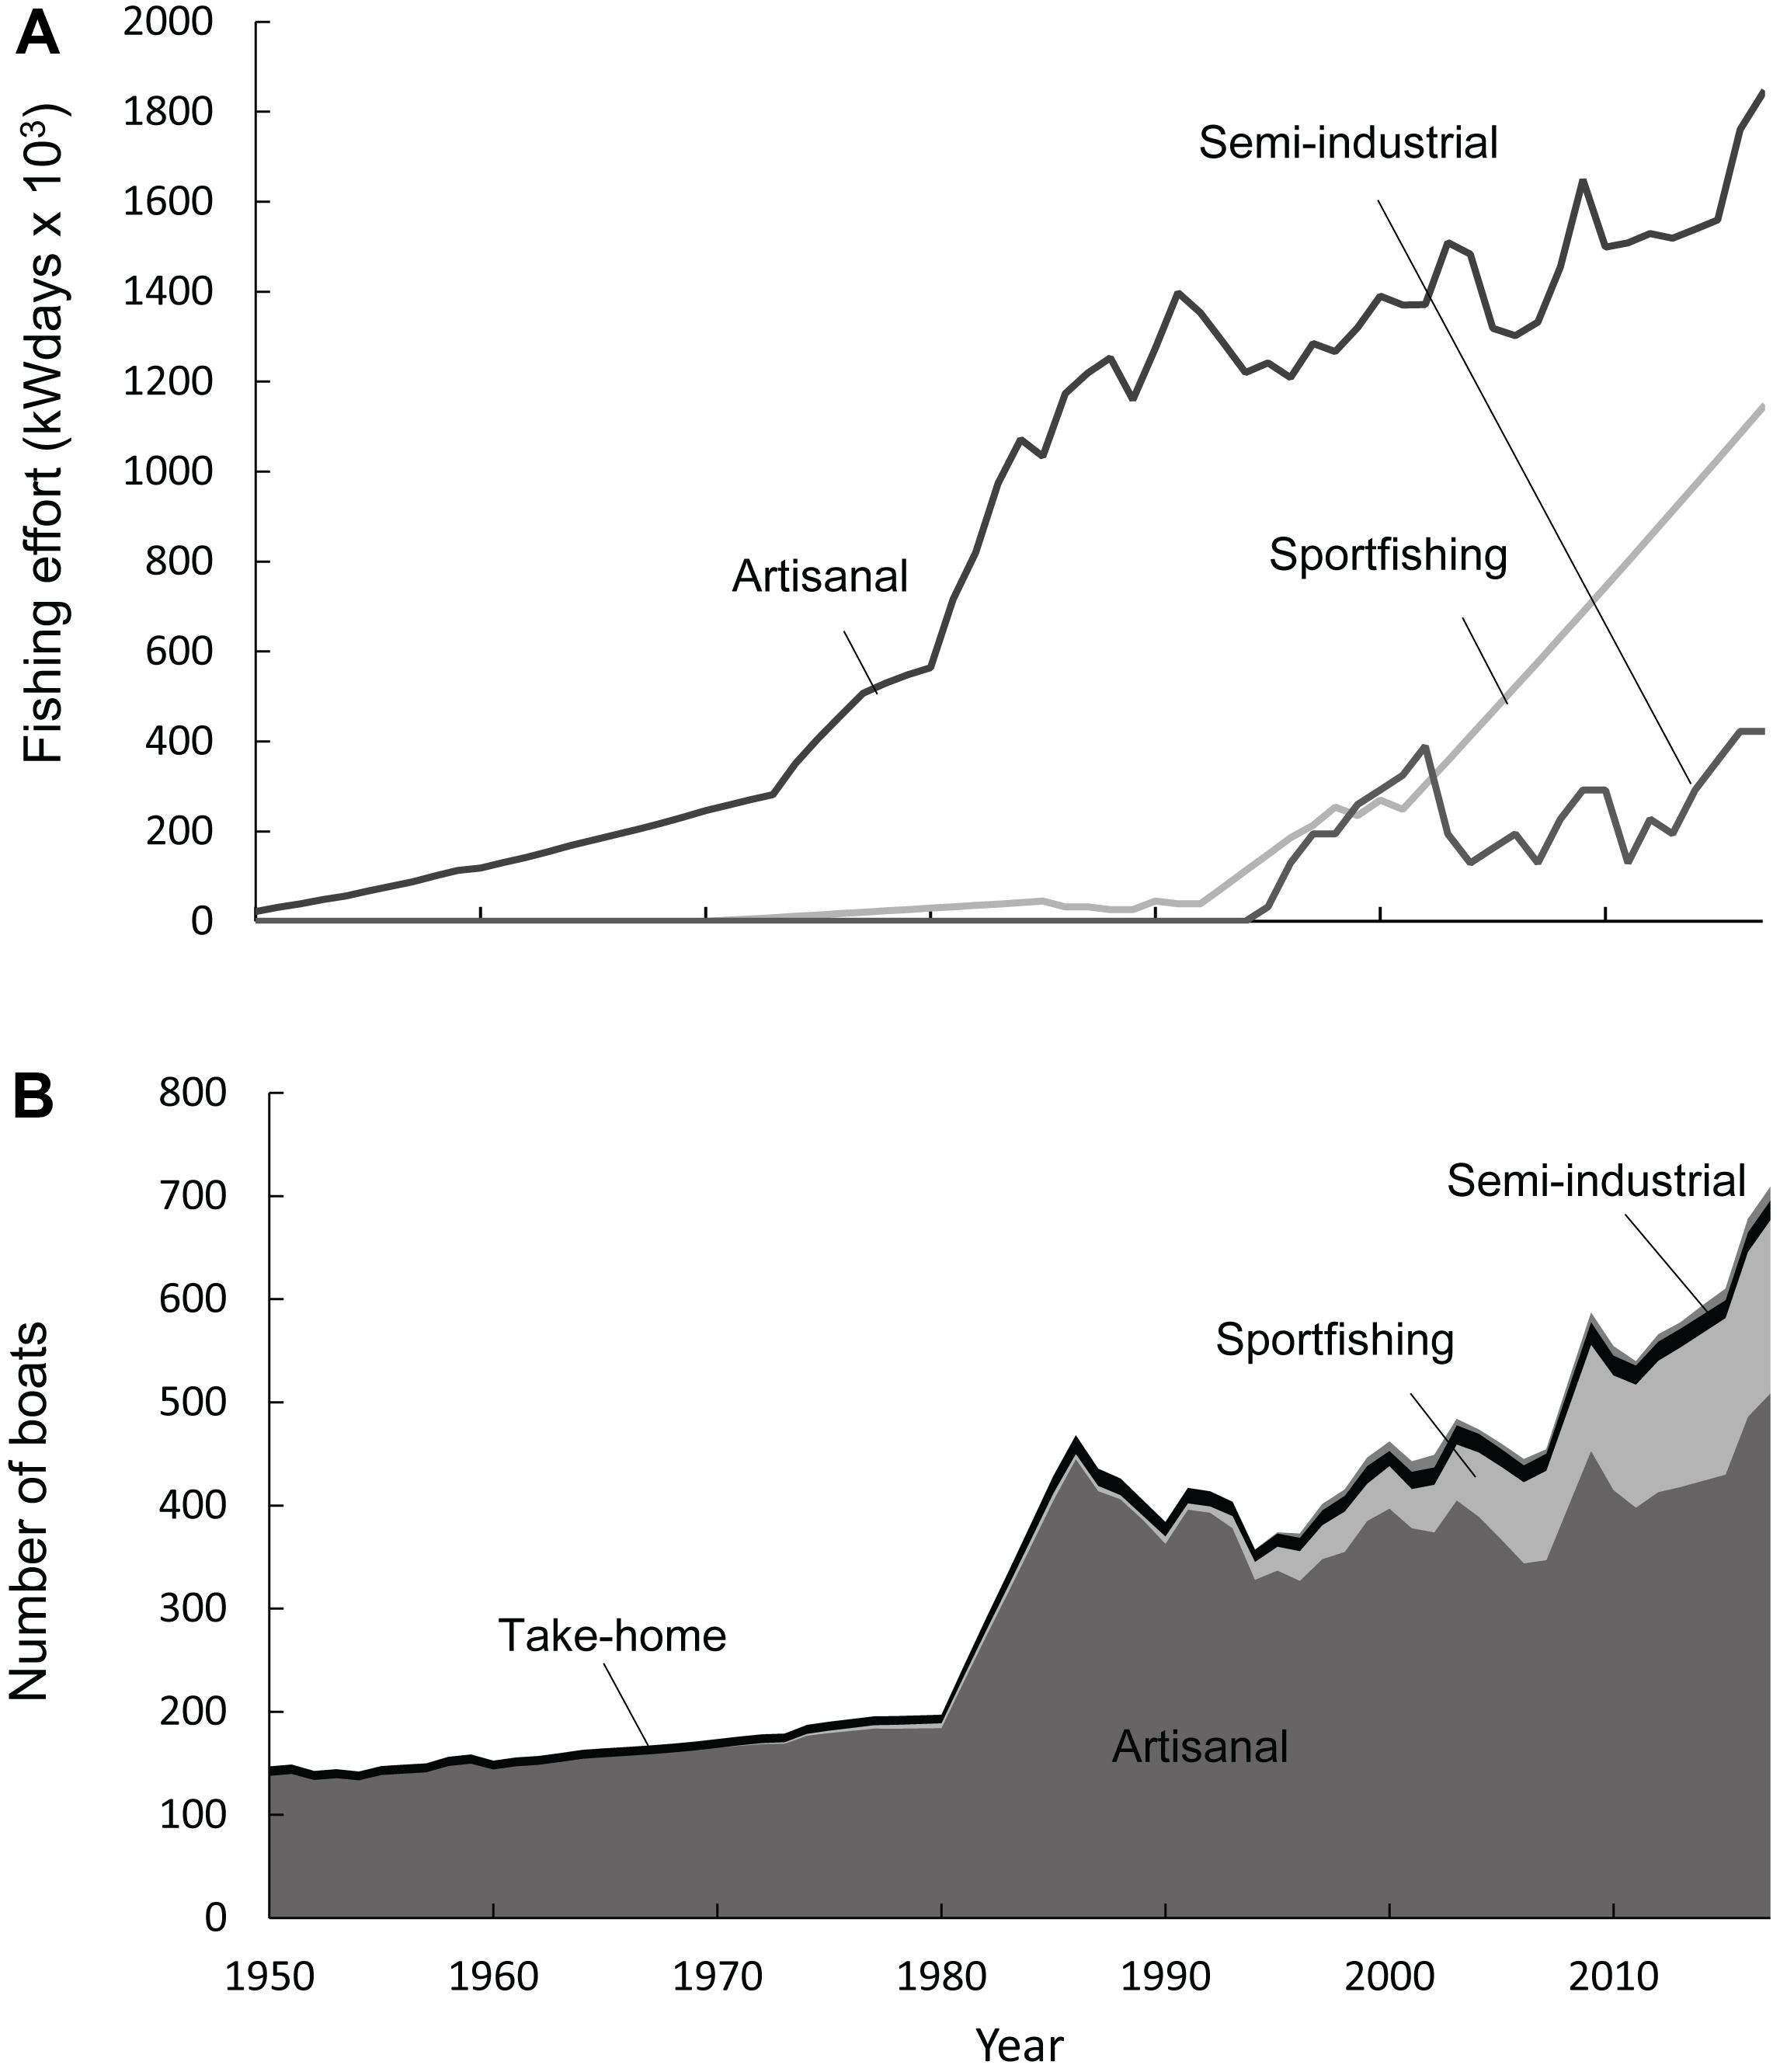
Figure 4. Fishing effort for the domestic fisheries in the Seychelles from 1950 to 2017 as (A) effective fishing effort (fishing capacity); and (B) total number of vessels by sector. Take-home catch was estimated as a component of the artisanal fishery rather than an independent fishery so the effort for the take-home catch was not estimated.
Catch per Unit Effort (CPUE)
The artisanal CPUE steeply declined from an average of almost 80 kg⋅kWdays−1 in the early 1950s to approximately 14 kg⋅kWdays−1 in the 1970s, followed by a more gradual decline to an average of 5 kg⋅kWdays−1 since the 1990s (Figure 5A). This CPUE decline appeared to be driven by the introduction of motorization which led to an increase in effective fishing effort. The sportfishing CPUE displayed a steadily declining trend from around 0.6 kg⋅kWdays−1 in 1971 to around 0.3 kg⋅kWdays−1 by 1990 and has remained constant since (Figure 5B). The semi-industrial CPUE was approximately 1.6 kg⋅kWdays−1 from 1995 to 2015 but increased to around 3.7 kg⋅kWdays−1 by 2016 (Figure 5B).
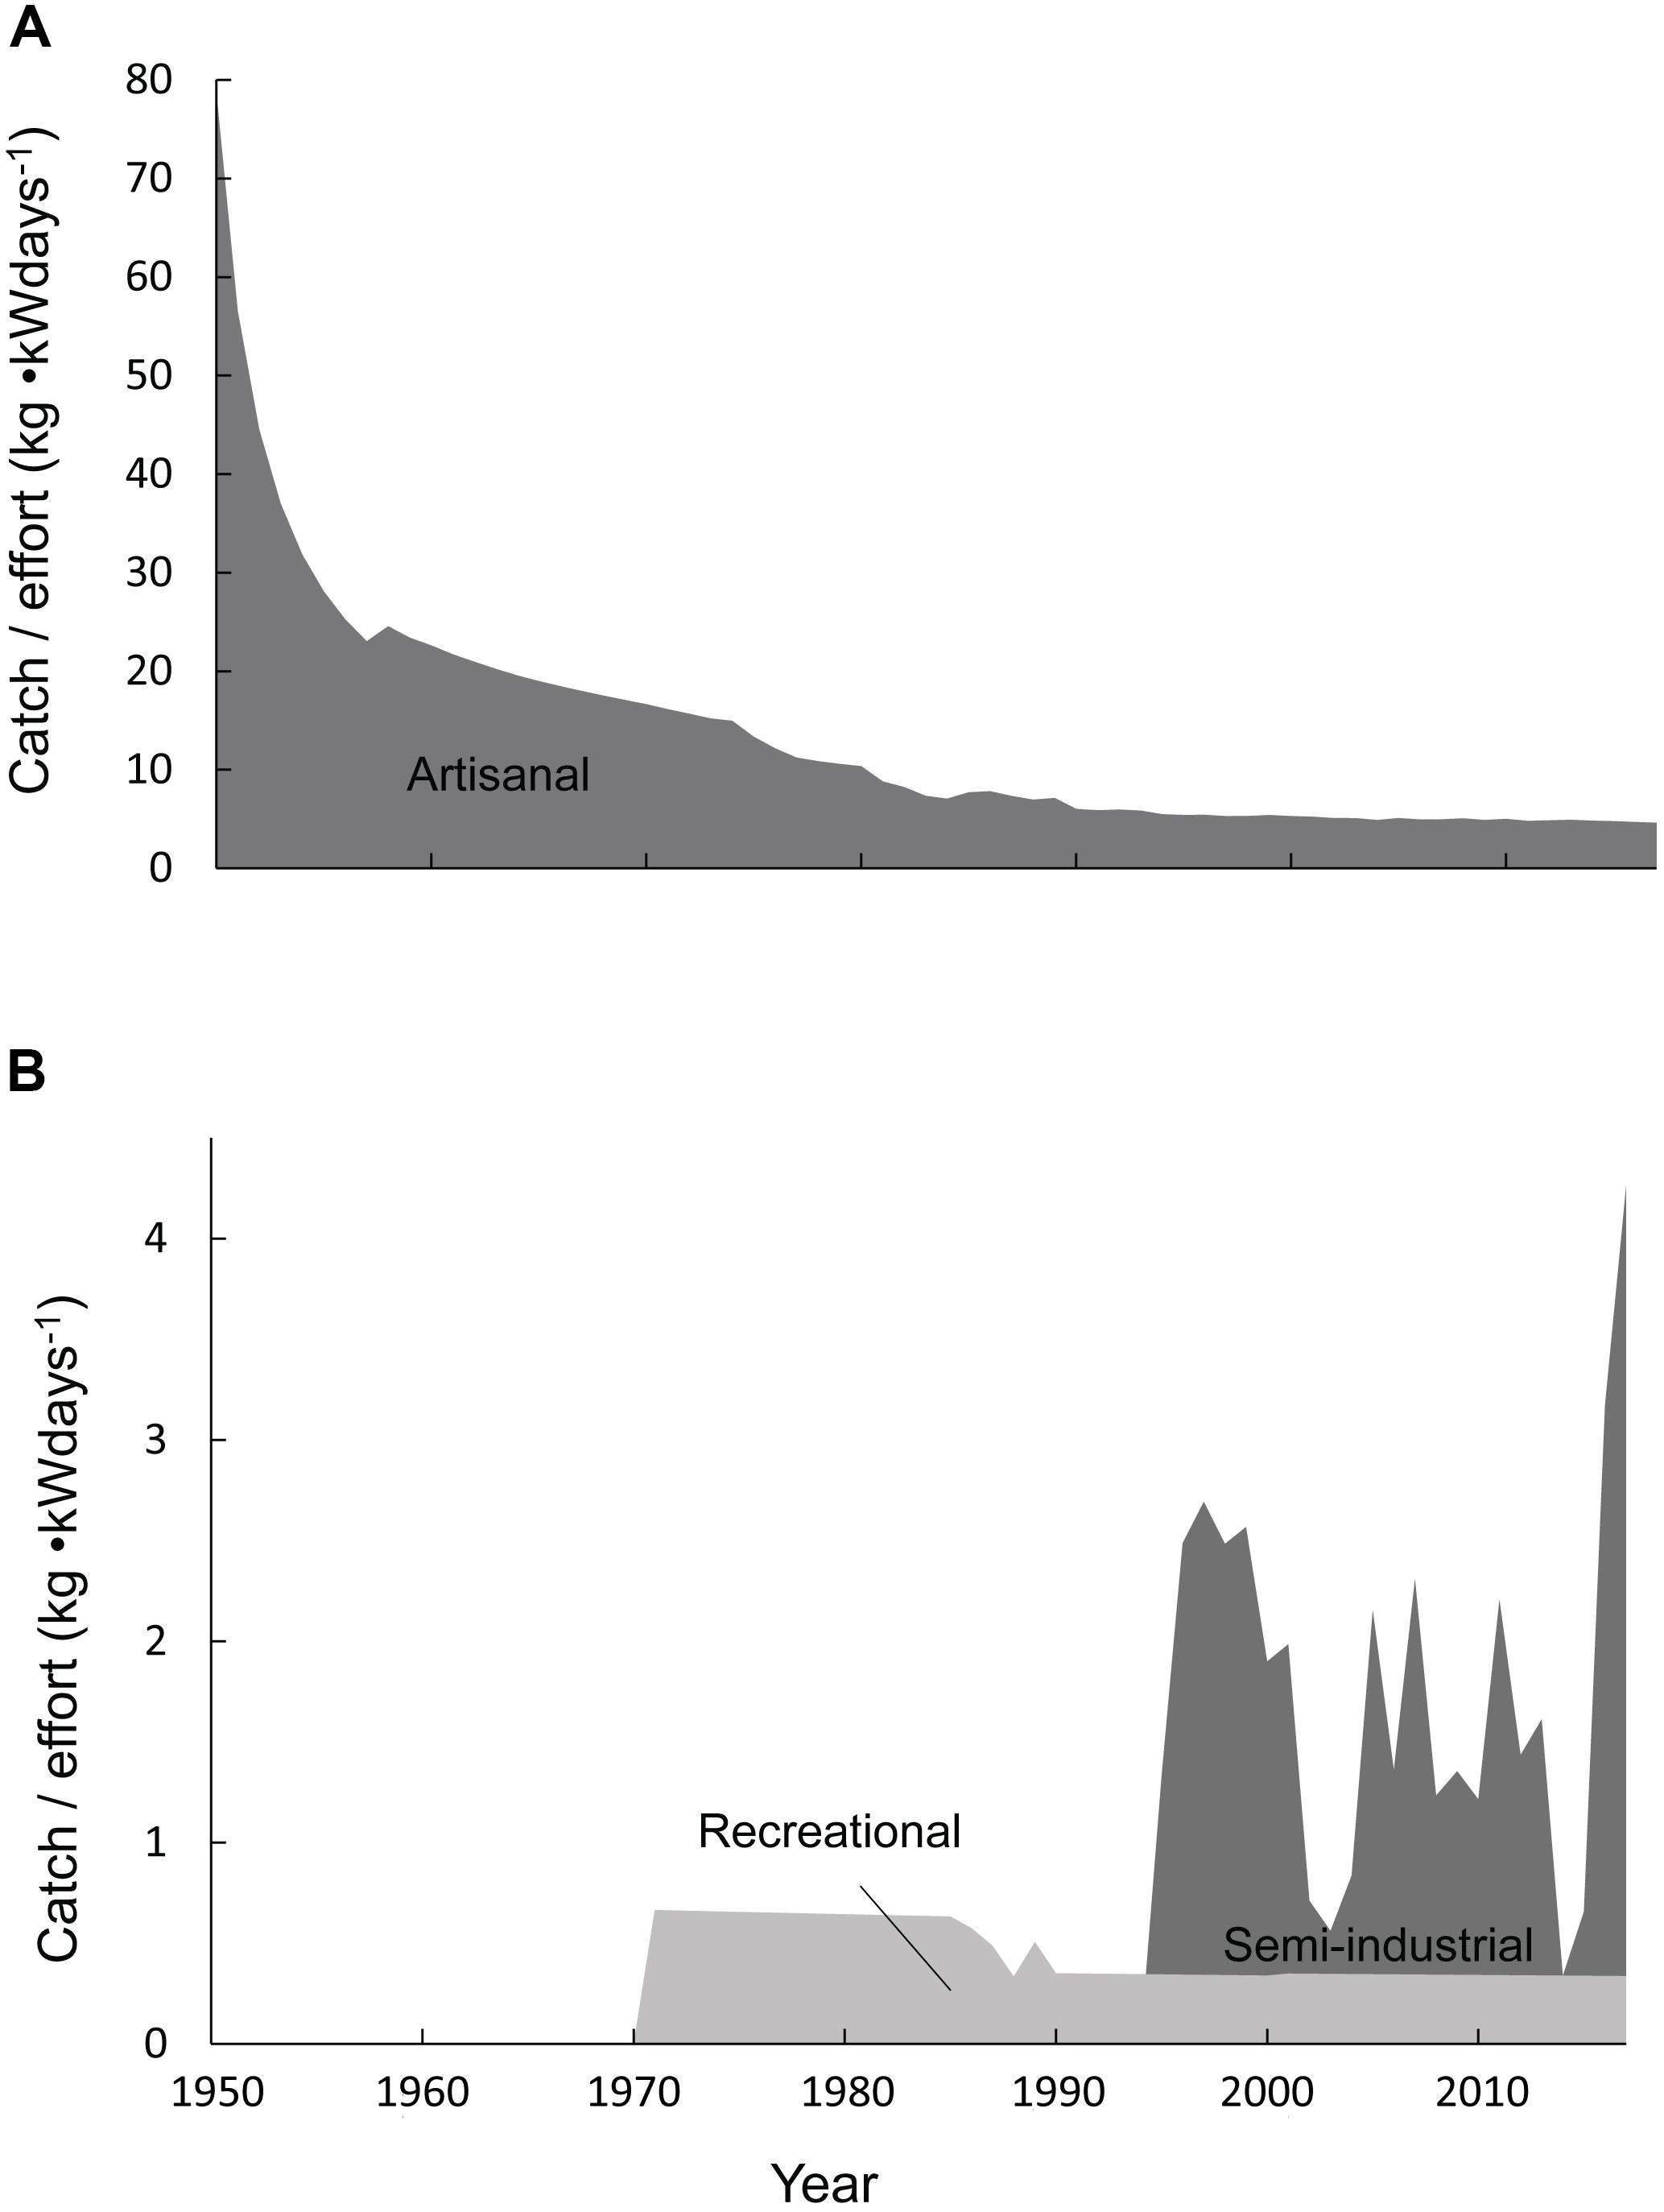
Figure 5. Catch-per-unit-effort (CPUE) for the domestic fisheries in the Seychelles from 1950 to 2017, for (A) artisanal; and (B) recreational sportfishing and semi-industrial sector.
Discussion
The reconstructed domestic fisheries catches of the Seychelles for 1950–2017, excluding the large-scale industrial tuna and billfish fisheries with predominantly foreign beneficial ownership (Coulter et al., 2020), were more than 1.5 times the adjusted official statistics as reported by the FAO on behalf of the Seychelles. Such a difference between reported data and likely total catches is not unusual and can be seen across many Indian Ocean small island countries and territories, e.g., catches for Mauritius, La Reunion and Mayotte were 2.4, 1.6 and 1.4 times the data reported by FAO on behalf of these entities, respectively (Boistol et al., 2011; Doherty et al., 2015b; Le Manach et al., 2015a). Non-reporting and under-reporting in small -scale fisheries, especially for non-commercial sectors, is widespread globally (Zeller et al., 2015; Smith and Zeller, 2016).
Despite commendable efforts by the SFA to improve catch statistics by collecting information from different fishing sectors, non-commercial fisheries (recreational and subsistence) were consistently not included in the national reports and therefore not reported to the FAO, despite FAO requesting such data (Garibaldi, 2012), a situation that unfortunately is common throughout the globe (Pauly and Zeller, 2016a). The unreported sectors estimated here (sportfishing and take-home catch) represent nearly 10% of the entire domestic catch in 2017, and catches from these sectors have the potential to increase given the economic opportunities associated with the sportfishery (Mwebaze and MacLeod, 2013). In this study, recreational catches were assumed to be sportfishing from the tourism sector only. The strong reliance of many island countries on the tourism industry creates not only economic opportunities (Cisneros-Montemayor and Sumaila, 2010) but also environmental, social, and economic challenges (Pattullo, 1996; Bhola-Paul, 2015). In addition to tourism-based sportfishing, it is possible that the improved socio-economic conditions in recent years may have created local recreational fishing interests not addressed in this study. Such a potential underestimation of catches for the recreational sector will need examining in future research. To reduce the amount of catch considered unreported, previous fisheries management plans which included detailed monitoring of recreational fisheries should be reactivated in future management plans and such estimates reported to FAO, ideally after adjustment for of the presentist bias (Zeller et al., 2018).
Furthermore, trends in “true” subsistence and take-home catch could be assessed by regular national surveys with questions regarding take-home catch and time spent fishing only for subsistence purposes. These self-consumption fisheries are especially relevant as they are strongly linked to socio-economic indicators in small island countries (Kronen et al., 2010). Given that our estimates of recreational and subsistence only focused on tourism-based sportfishing and commercial take-home catch, respectively, makes our estimates conservative minimum estimates. The total recreational and subsistence catches are therefore likely larger than 10% of the total catches and require further detailed study and management focus.
In addition to unreported landings, discarded catch is also not included in the official catch statistics reported by the FAO on behalf of countries. While this exclusion is in line with FAO’s data request (Garibaldi, 2012), it should be considered problematic in today’s age of ecosystem-based fisheries management considerations. Depredation of targeted catch by sharks and toothed whales in the Seychelles’ semi-industrial longline fishery are amongst the highest (>22%) in the world (Rabearisoa et al., 2018). The discards estimated here were a conservative representation (20.5%) of these rates (Le Manach et al., 2015b).
The artisanal sector dominated the total domestic catch, representing over 90% of total catches over the entire time period. Despite the relatively low economic value when compared to the foreign-owned and operated industrial fishery for high-value tuna, the artisanal fishery is arguably the most important fishery component for the Seychelles’ blue bonds initiative to focus on when developing management strategies. The artisanal fishery plays a vital role in Seychelles’ domestic food security and local livelihoods, whilst being less wasteful in terms of negligible discards and having lower fuel use and lower CO2 emission intensity (Zeller and Pauly, 2019). In addition, the linkage between resources and economy suggests that economic growth measured via market-based GDP alone (Jerven, 2013), such as from large industrial fisheries does not reflect the strong dependency on limited natural resources that massively contribute to local food security and human well-being (Costanza et al., 1997; Robinson et al., 2004; Costanza et al., 2014; Zeller and Pauly, 2019; Kalimeris et al., 2020). Seafood represents the primary source of protein for Seychellois, resulting in a high rate of marine fish consumption of 57 kg⋅person−1⋅year−1 (WorldBank, 2017), despite 21% of household survey respondents reporting an inability to afford to buy sufficient fish and meat (Muller, 2014; National Bureau of Statistics, 2016). In addition, fishers represent the most destitute population sector in the Seychelles, highlighting the paramount importance of artisanal fishing and associated livelihood development (Muller et al., 2016). The Seychelles is highly dependent on foreign imports, e.g., canned meats, and as a result, is particularly susceptible to inflation and global market fluctuations, which can also affect the domestic fish market (Larose, 2003; Philpot et al., 2015). In 2008, the global financial crises triggered a fivefold increase in the inflation rate causing a 60% increase in the price of fish; this rise in cost encouraged ordinary non-fishing locals to engage in fishing endeavors, intensifying fishing effort (Clifton et al., 2012).
Overall, total domestic catch increased steadily since 1950, coupled with intensified fishing effort driven by the expansion of fishing grounds and an increase in fleet size and motorization. The increasing catch trend has been observed also in other island entities such as the Comoros (Doherty et al., 2015a), Maldives (Hemmings et al., 2014), and Fiji (Zylich et al., 2012). The total artisanal catch showed an increasing trend since 1950 until it peaked in 1986, likely associated with government incentives to stimulate the artisanal fisheries (government loans), and modernization of fishing fleets and technology (Wakeford, 2001). Since 2015, the number of outboard motor-powered vessels increased by 28%, indicating that modernization and fleet expansion continues. Despite relatively high reporting by the SFA in previous years, the reporting rate has dropped since 2016, resulting in nearly 70% of the total domestic catch for 2017 likely unreported. The drop in reporting was exemplified by the disappearance of catches of carangids (jacks) in the official statistics reported by the FAO on behalf of the Seychelles, previously one of the most prominent reported groups. The disappearance of the officially reported Carangidae family with no disaggregation to carangid species is unlikely to reflect the disappearance of these taxa from the fisheries and the disappearance was not conserved in the estimation of the unreported component. This change in reporting must be investigated as incorrect trends could improperly influence new blue bond management strategies. In addition, national non-tuna SFA data were revealed to be more taxonomically detailed than the FAO non-tuna data, suggesting a substantial loss in taxonomic resolution between national records (SFA) and data reported by the FAO. This crucial loss of information between national data and FAO records has been observed in numerous other countries (Pauly and Zeller, 2016a). As the artisanal fisheries represent the majority of Seychelles domestic catch, species-specific information is of high importance when making well- informed policy and management plans (Mees and Rousseau, 1997; Pauly and Charles, 2015; Robinson et al., 2020).
While catch reconstructions conducted and led by the Sea Around Us over the last 15+ years for every maritime country in the world (Pauly and Zeller, 2016a, b) have attracted some criticisms (e.g., Garibaldi et al., 2014; Chaboud et al., 2015; Ye et al., 2017), these were either shown to be misguided (Al-Abdulrazzak and Pauly, 2014; Belhabib et al., 2015), or a miss-directed pre-occupation with the uncertainty associated with reconstructed data (Pauly and Zeller, 2017). The overall uncertainty range for the Seychelles domestic reconstructed catch data presented here was considered to be up to ± 40%, and the estimates presented likely underestimate the actual catch given the conservative assumptions made throughout (Pauly and Zeller, 2016a, 2017).
Three different patterns in the CPUE by sector were observed over the entire time period. The artisanal fishery showed a strong decline in CPUE from almost 80 kg⋅kWdays−1 in 1950 to nearly 5 kg⋅kWdays−1 in 2017. The increasing number of fishing vessels and motorization over time intensified the pressure on fish stocks, somewhat reflected in the declining CPUE trend for the artisanal fishery. The relatively flat trend in sportfishing CPUE from 1971 to 1985 and from 1990 to 2017 reflects the data sources and methods used and thus, this trend should be interpreted with caution as it may not indicate the true trend. The semi-industrial long-line fishery displayed considerable CPUE variability, likely due to the strong fluctuation in pelagic catch with relatively stable effort. This is not unusual amongst semi-industrial fisheries due to the high temporal and spatial variability of pelagic species in the open ocean (Ward and Hindmarsh, 2007). The increasing fishing effort trends appear to be strongly influenced by the introduction of outboard motors in the artisanal fleets in the early 1980s, and the increase in the number of vessels within the existing fishing fleets. Despite a slight reduction in effort in relation to the number of boats since 1991, the CPUE has not shown signs of recovery in the small-scale fisheries (Figure 5A). The stable low CPUE since 1985 for small-scale sectors could be associated with shifting the targeted demersal species to those previously less exploited or an overall demersal stock depletion (Jennings et al., 1995; SFA, 1996; Nageon and de Lestang, 1998; Spalding and Jarvis, 2002). Since the mid-1980s, fishing effort has steadily increased while CPUE has declined. The Seychelles management strategy to attempt and encourage to re-distribute fishing effort to offshore grounds via financial incentives have done little to halt CPUE declines (Wakeford, 2001), suggesting at least potential failure of this policy, as has been shown globally (Swartz et al., 2010; Zeller and Pauly, 2019).
Given Seychelles’ unique opportunity of blue bonds, the accurate assessment of the health of fish populations for fisheries management is critical. Strong monitoring and accurate reporting of all fisheries sectors, including non-commercial sectors, i.e., subsistence and recreational, is crucial to provide accurate data for underlying fisheries stock assessments to ensure long-term resource sustainability and consequently food security. Species and/or stock-specific monitoring and stock assessments are of the utmost importance for effective management plans for sustainable fisheries. While traditional stock assessments are technically challenging and financially problematic for most developing countries and small island entities due to the need for expensive secondary data, novel and easily applicable data-limited stock assessment methods with low data requirements are now readily available. Adopting these well-established data-limited assessment methods will allow valuable insights into stocks with less exhaustive sampling, allowing for fisheries management to promote local sustainable practices (Froese et al., 2017, 2018, 2019).
The opportunity of the blue bonds strategy brings financial funds that enable further research to promote informed decisions regarding fisheries management, but also the design and establishment of other management, livelihood, and conservation strategies, such as marine protected areas, or non-extractive tourism opportunities, could result in improvements for the economy and environment. With such implementation of novel initiatives, the Seychelles fisheries would benefit from refinement and increased frequency of current data collection systems, such as household surveys in addition to annual fisheries reports (Zeller et al., 2015). Given the historical value of the small-scale fisheries as demonstrated here, all small-scale sectors should be highlighted in the blue economy roadmap of the Seychelles along with future research and strong regulations (Secretariat Commonwealth, 2018; Techera, 2019). Small-scale fisheries management could alleviate some significant social inequality and resource overexploitation challenges, and improve the overall quality of life for many Seychellois.
Data Availability Statement
The datasets generated for this study are available on request from the corresponding author and will be freely available at www.seaaroundus.org/data/#/eez/690 during 2020.
Author Contributions
HC and RW collaborated to complete the data synthesis and analysis and drafted, reviewed, and edited the manuscript. GV and LH edited the manuscript. DZ conceptualized catch reconstructions, advised on methods, guided analysis, reviewed, and edited the manuscript.
Conflict of Interest
The authors declare that the research was conducted in the absence of any commercial or financial relationships that could be construed as a potential conflict of interest.
Funding
This was a contribution of the Marine Futures Lab and the Sea Around Us—Indian Ocean, both are research initiatives at the University of Western Australia. The Marine Futures Lab was supported by the Ian Potter Foundation, the Pangaea Initiative, Parks Australia, and private philanthropy. The research of the Sea Around Us initiatives were supported by the Oak Foundation, the Paul M. Angell Family Foundation, the Marisla Foundation, the David and Lucile Packard Foundation, the MAVA Foundation, Bloomberg Philanthropies, Oceana and the Minderoo Foundation.
Acknowledgments
We would like to thank F. Le Manach for the preliminary catch data reconstruction for the Seychelles’ EEZ on which the present contribution builds.
Supplementary Material
The Supplementary Material for this article can be found online at: https://www.frontiersin.org/articles/10.3389/fmars.2020.00269/full#supplementary-material
Footnotes
- ^ http://blueeconomyseychelles.org/item/59-economic-inequality-in-a-high-income-country-can-the-blue-economy-mind-the-gap (accessed on 22/01/2020)
- ^ These debt swap agreements are financial transactions whereby a charitable conservation trust is established and agrees to repay a portion of a nation’s debt to creditors. The trust then offers more favorable lending terms to the country and directs savings on future debt repayments to fund new projects designed to protect marine life and address effects of climate change
- ^ http://projects.worldbank.org/P155642?lang=en
- ^ http://www.seychellesnewsagency.com/articles/6076/Seychelles+to+evaluate+status+of+fish+stock+with+new+tagging+project+in+; https://www.charterworld.com/index.html?sub~=~seychelles-fishing-charter
References
Al-Abdulrazzak, D., and Pauly, D. (2014). Ground-truthing the ground-truth: reply to Garibaldi et al.’s comment on “Managing fisheries from space: Google Earth improves estimates of distant fish catches”. ICES J. Mar. Sci. 71, 1927–1931. doi: 10.1093/icesjms/fsu103
Assan, C., Lucas, J., and Lucas, V. (2018). Seychelles National Report to the Scientific Committee of the Indian Ocean Tuna Commission, 2018. Victoria: Indian Ocean Tuna Commission.
Assan, C. N., and Lucas, J. L. (2015). Seychelles Artisanal Fisheries Statistics for 2013. Available online at: http://www.oceandocs.org/bitstream/handle/1834/4973/Tech.065.pdf?sequence=1 (accessed January 23, 2017).
Assan, C. N., and Lucas, J. L. (2016). Seychelles Artisanal Fisheries Statistics for 2015. Victoria: SFA.
Bach, P. (1992). Production et niveau d’exploitation des ressources démersales et semi-pelagiques exploitées par la pêche artisanale seychelloise sur le plateau de Mahé. Cybium 16, 345–360.
Bach, P., and Lablache-Carrara, G. (1991). “La pêche à la ligne à main aux Seychelles,” in La Recherche Scientifique Face à la Pêche Artisanale = Research and Small-Scale Fisheries, eds J.-R. Durand, J. Lemoalle, and J. Weber (Paris: ORSTOM), 295–307.
Bailey, C., and Jentoft, S. (1990). Hard choices in fisheries development. Mar. Policy 14, 333–344. doi: 10.1016/0308-597x(90)90055-v
Belhabib, D., Koutob, V., Sall, A., Lam, V. W. Y., Zeller, D., and Pauly, D. (2015). Counting pirogues and missing the boat: Reply to Chaboud et al.’s comment on Belhabib et al. Fisheries catch misreporting and its implications: the case of Senegal”. Fish. Res. 164, 325–328. doi: 10.1016/j.fishres.2014.09.016
Bhola-Paul, H. M. (2015). Tourism challenges and the opportunities for sustainability: a case study of grenada, Barbados, and Tobago. J. Tour. Hosp. Manage. 3, 204–213.
Boistol, L., Harper, S., Booth, S., and Zeller, D. (2011). “Reconstruction of marine fisheries catches for mauritius and its outer islands, 1950-2008,” in Fisheries Catch Reconstructions: Islands, Part II, Vol. 19, eds S. Harper, and D. Zeller (Vancouver: University of British Columbia), 39–61.
Breuil, C., and Grima, D. (2014). Baseline Report Seychelles DR Congo (Smartfish Programme of the Indian Ocean Commission, Fisheries Management FAO Component). Ebene: FAO, 36.
Briguglio, L. (1995). Small island developing states and their economic vulnerabilities. World Dev. 23, 1615–1632. doi: 10.1016/0305-750X(95)00065-K
Carroll, J. (1991). Seychelles Economy. London: Africa South of the Sahara, Europa Publications. 870–873.
Central Intelligence Agency (2016). The World Factbook 2016-17. Langley, VA: Government Printing Office.
Chaboud, C., Fall, M., Ferraris, J., Fontana, A., Fonteneau, A., Laloë, F., et al. (2015). Comment on “Fisheries catch misreporting and its implications: the case of Senegal”. Fish. Res. 164, 322–324. doi: 10.1016/j.fishres.2014.10.012
Chang-Seng, D. (2007). Climate change scenario assessment for the Seychelles Second National Communication under the United Nations Framework Convention on Climate Change. Victoria: Academic Press.
Cisneros-Montemayor, A. M., and Sumaila, U. R. (2010). A global estimate of benefits from ecosystem-based marine recreation: potential impacts and implications for management. J. Bioeconomics 12, 245–268. doi: 10.1007/s10818-010-9092-7
Cisneros-Montemayor, A. M., Moreno-Báez, M., Voyer, M., Allison, E. H., Cheung, W. W. L., Hessing-Lewis, M., et al. (2019). Social equity and benefits as the nexus of a transformative Blue Economy: a sectoral review of implications. Mar. Policy 109:103702. doi: 10.1016/j.marpol.2019.103702
Clifton, J., Etienne, M., Barnes, D. K. A., Barnes, R. S. K., Suggett, D. J., and Smith, D. J. (2012). Marine conservation policy in Seychelles: current constraints and prospects for improvement. Mar. Policy 36, 823–831. doi: 10.1016/j.marpol.2011.11.009
Conceição, P. (2019). “Human development report 2019,” in Beyond Income, Beyond Averages, Beyond Today: Inequalities in Human Development in the 21st Century (New York, NY: United Nations Development Programme).
Costanza, R., d’Arge, R., De Groot, R., Farber, S., Grasso, M., Hannon, B., et al. (1997). The value of the world’s ecosystem services and natural capital. Nature 387, 253–260.
Costanza, R., Kubiszewski, I., Giovannini, E., Lovins, H., McGlade, J., Pickett, K. E., et al. (2014). Development: time to leave GDP behind. Nat. News 505, 283–285.
Coulter, A., Cashion, T., Cisneros-Montemayor, A. M., Popov, S., Tsui, G., Le Manach, F., et al. (2020). Using harmonized historical catch data to infer the expansion of global tuna fisheries. Fish. Res. 221:105379. doi: 10.1016/j.fishres.2019.105379
Davidson, D. J., Andrews, J., and Pauly, D. (2014). The effort factor: evaluating the increasing marginal impact of resource extraction over time. Glob. Environ. Change 25, 63–68. doi: 10.1016/j.gloenvcha.2014.02.001
Daw, T. M., Cinner, J. E., McClanahan, T. R., Brown, K., Stead, S. M., Graham, N. A. J., et al. (2012). To fish or not to fish: factors at multiple scales affecting artisanal fishers’ readiness to exit a declining fishery. PLoS One 7:e31460. doi: 10.1371/journal.pone.0031460
Doherty, B., Hauzer, M., and Le Manach, F. (2015a). “Reconstructing catches for the Union of the Comoros: Uniting historical sources of catch data for Ngazidja, Ndzuwani and Mwali from 1950–2010,” in Fisheries Catch Reconstructions in the Western Indian Ocean eds F. Le Manach, and D. Pauly (Vancouver: University of British Columbia), 1–11.
Doherty, B., Herfaut, J., Le Manach, F., Harper, S., and Zeller, D. (2015b). “Reconstructing domestic marine fisheries in Mayotte from 1950–2010,” in Fisheries Catch Reconstructions in the Western Indian Ocean, eds F. Le Manach, and D. Pauly (Vancouver: University of British Columbia), 53–65.
Dunn, D. C., Stewart, K., Bjorkland, R. H., Haughton, M., Singh-Renton, S., Lewison, R., et al. (2010). A regional analysis of coastal and domestic fishing effort in the wider Caribbean. Fish. Res. 102, 60–68. doi: 10.1016/j.fishres.2009.10.010
FAO (2005). Fishery Country Profile - Seychelles. Rome: Food and Agriculture Organization of the United Nations.
FAO (2015). Voluntary Guidelines for Securing Sustainable Small-Scale Fisheries in the Context of Food Security and Poverty Eradication. Rome: Food and Agriculture Organization of the United Nations.
FAO (2019a). FAO Yearbook. Fishery and Aquaculture Statistics 2017/FAO Annuaire. Statistiques des Pêches et de L’aquaculture 2017/FAO Anuario. Estadísticas de Pesca y Acuicultura 2017. Rome: FAO.
Froese, R., Demirel, N., Coro, G., Kleisner, K. M., and Winker, H. (2017). Estimating fisheries reference points from catch and resilience. Fish Fish. 18, 506–526. doi: 10.1111/faf.12190
Froese, R., Winker, H., Coro, G., Demirel, N., Tsikliras, A. C., Dimarchopoulou, D., et al. (2018). A new approach for estimating stock status from length frequency data. ICES J. Mar. Sci. 75, 2004–2015. doi: 10.1093/icesjms/fsy078
Froese, R., Winker, H., Coro, G., Demirel, N., Tsikliras, A. C., Dimarchopoulou, D., et al. (2019). Estimating stock status from relative abundance and resilience. ICES J. Mar. Sci. 77, 527–538. doi: 10.1093/icesjms/fsz230
Garibaldi, L. (2012). The FAO global capture production database: a six-decade effort to catch the trend. Mar. Policy 36, 760–768. doi: 10.1016/j.marpol.2011.10.024
Garibaldi, L., Gee, J., Tsuji, S., Mannini, P., and Currie, D. (2014). Comment on: “Managing fisheries from space: Google Earth improves estimates of distant fish catches” by Al-Abdulrazzak and Pauly. ICES J. Mar. Sci. 71, 1921–1926. doi: 10.1093/icesjms/fsu079
Ghina, F. (2003). Sustainable development in small island developing states. Environ. Dev. Sustain. 5, 139–165.
Golden, C. D., Allison, E. H., Cheung, W. W. L., Dey, M. M., Halpern, B. S., McCauley, D. J., et al. (2016). Nutrition: Fall in fish catch threatens human health. Nat. News 534, 317–320. doi: 10.1038/534317a
Grandcourt, E. M. (2002). Demographic characteristics of a selection of exploited reef fish from the Seychelles: preliminary study. Mar. Freshw. Res. 53, 123–130.
Greer, K., Zeller, D., Woroniak, J., Coulter, A., Winchester, M., Palomares, M. L. D., et al. (2019). Global trends in carbon dioxide (CO2) emissions from fuel combustion in marine fisheries from 1950 to 2016. Mar. Policy 107:103382. doi: 10.1016/j.marpol.2018.12.001
Hemmings, M., Harper, S., and Zeller, D. (2014). “Reconstruction of total marine catches for the Maldives: 1950-2010,” in Fisheries Catch Reconstructions: Islands, Part IV, eds K. Zylich, D. Zeller, M. Ang, and D. Pauly (Vancouver: University of British Columbia), 107–120.
Hicks, C. C., Cohen, P. J., Graham, N. A. J., Nash, K. L., Allison, E. H., D’Lima, C., et al. (2019). Harnessing global fisheries to tackle micronutrient deficiencies. Nature 574, 95–98. doi: 10.1038/s41586-019-1592-6
IFLR (2019). Behind the Deal: Seychelles’ Landmark Blue Bond. Available online at: https://www.iflr.com/Article/3858308/Behind-the-deal-Seychelles-landmark-blue-bond.html?ArticleId=3858308 (accessed July 12, 2019).
Jackson, O. (2018). DEAL: Seychelles’ Sovereign Blue Bond. London: International Financial Law Review.
Jennings, S., Boullé, D. P., and Polunin, N. V. C. (1996a). Habitat correlates of the distribution and biomass of Seychelles’ reef fishes. Environ. Biol. Fishes 46, 15–25. doi: 10.1007/bf00001693
Jennings, S., Grandcourt, E. M., and Polunin, N. V. C. (1995). The effects of fishing on the diversity, biomass and trophic structure of Seychelles’ reef fish communities. Coral Reefs 14, 225–235. doi: 10.1007/bf00334346
Jennings, S., Marshall, C., and Polunin, N. V. C. (1996b). Seychelles marine protected areas: comparative structure and status of reef fish communities. Biol. Conserv. 75, 201–209. doi: 10.1016/0006-3207(95)00081-x
Jerven, M. (2013). Poor Numbers: How We Are Misled by African Development Statistics and What to do About it. Ithaca, NY: Cornell University Press.
Kalimeris, P., Bithas, K., Richardson, C., and Nijkamp, P. (2020). Hidden linkages between resources and economy: a “Beyond-GDP” approach using alternative welfare indicators. Ecol. Econ. 169:106508. doi: 10.1016/j.ecolecon.2019.106508
Khan, A., and Amelie, V. (2015). Assessing climate change readiness in Seychelles: implications for ecosystem-based adaptation mainstreaming and marine spatial planning. Reg. Environ. Change 15, 721–733. doi: 10.1007/s10113-014-0662-4
Kolody, D., Robinson, J., and Lucas, V. (2010). Swordfish Catch Rate Standardization for the Seychelles Semi-Industrial and Industrial Longline Fleets. Victoria: IOTC.
Kronen, M., Vunisea, A., Magron, F., and McArdle, B. (2010). Socio-economic drivers and indicators for artisanal coastal fisheries in Pacific island countries and territories and their use for fisheries management strategies. Mar. Policy 34, 1135–1143. doi: 10.1016/j.marpol.2010.03.013
Larose, P. (2003). The impact of global financial integration on Mauritius and Seychelles. Bank Valletta Rev. 28, 33–49.
Le Manach, F., Bach, P., Barret, L., Guyomard, D., Fleury, P.-G., Sabarros, P. S., et al. (2015a). “Reconstruction of the domestic and distantwater fisheries catch of La Réunion (France), 1950–2010,” in Fisheries Catch Reconstructions in the Western Indian Ocean eds F. Le Manach, and D. Pauly (Vancouver: University of British Columbia), 83–98.
Le Manach, F., Bach, P., Boistol, L., Robinson, J., and Pauly, D. (2015b). “Artisanal fisheries in the world’s second largest tuna fishing ground — reconstruction of the Seychelles’ marine fisheries catch, 1950–2010,” in Fisheries Catch Reconstructions in the Western Indian Ocean, 1950-2010, eds F. Le Manach, and D. Pauly (Vancouver: University of British Columbia), 99–109.
Louis-Marie, Y. (1987). Analysis of the Fishing Development in Seyschelles. Master’s dissertation, World Maritime University, Malmö.
Martín, J. I. (2011). Fisheries in the Seychelles and Fisheries Agreements with the EU. Brussels: European Parliament.
Mathieu, L. F., Langford, I. H., and Kenyon, W. (2003). Valuing marine parks in a developing country: a case study of the Seychelles. Environ. Dev. Econ. 8, 373–390. doi: 10.1017/s1355770x0300196
Mees, C. C., and Rousseau, J. A. (1997). The potential yield of the lutjanid fish Pristipomoides filamentosus from the Mahé Plateau, Seychelles: managing with uncertainty. Fish. Res. 33, 73–87. doi: 10.1016/s0165-7836(97)00069-6
Miyake, P. M. (2005). “A brief history of the tuna fisheries of the world,” in Second Meeting of the Technical Advisory Committee of the FAO Project Management of Tuna Fishing Capacity, eds W. H. Bayliff, J. I. Leiva, and J. Majkowski (Rome: FAO).
Muller, C. (2014). Living Conditions Survey 2011 & Poverty Digest. Victoria: National Bureau of Statistics.
Muller, C., Kannan, A., and Alcindor, R. (2016). Multidimensional Poverty in Seychelles. Available online at: https://econpapers.repec.org/paper/aimwpaimx/1601.htm (accessed August 15, 2019).
Mwebaze, P., and MacLeod, A. (2013). Valuing marine parks in a small island developing state: a travel cost analysis in Seychelles. Environ. Dev. Econ. 18, 405–426. doi: 10.1017/s1355770x12000538
Nageon, J., Lucas, V., and Sauer, W. (2014). “An EAF Baseline Report for the Seychelles Artisanal and Recreational Fisheries Targeting the demersal Fish Stocks by Handline, Traps,” inGillnest and drop lines Preparation of Management Plans for Selected Fisheries in Africa, eds K. A. Koranteng, M. C. Vasconcellos, and B. P. Satia (Rome: Food and Agriculture Organization of the United Nations), 215.
National Bureau of Statistics (2012). Population and Housing Census 2010 Report. Victoria: National Bureau of Statistics.
National Bureau of Statistics (2016). A Poverty Profile of the Republic of the Seychelles, Poverty Report for the Household Budget Survey 2013. Victoria: National Bureau of Statistics and The World Bank.
National Bureau of Statistics (2017). Seychelles in Figures. Victoria: National Bureau of Statistics
National Bureau of Statistics (2019). Population and Vital Statistics: Mid Year Population Estimates 2019 Statistics Statistical Bulletin. Victoria: National Bureau of Statistics.
Nevill, J., Robinson, J., Giroux, F., and Isidore, M. (2007). Seychelles National Plan of Action for the Conservation and Management of Sharks. Victoria: Seychelles Fishing Authority.
Palomares, M. L. D., Froese, R., Derrick, B., Nöel, S.-L., Tsui, G., Woroniak, J., et al. (2018). A Preliminary Global Assessment of the Status of Exploited Marine Fish and Invertebrate Populations. Available online at: https://www.jstor.org/stable/41849821 (accessed November 30, 2019).
Pattullo, P. (1996). Last Resorts: The Cost of Tourism in the Caribbean. Kingston: Ian Randle Publishers.
Pauly, D. (2006). Major trends in small-scale marine fisheries, with emphasis on developing countries, and Some Implications for the Social Sciences. Mar. Stud. 4, 7–22.
Pauly, D., and Charles, A. (2015). Counting on small-scale fisheries. Science 347, 242–243. doi: 10.1126/science.347.6219.242-b
Pauly, D., and Zeller, D. (2016a). Catch reconstructions reveal that global marine fisheries catches are higher than reported and declining. Nat. Commun. 7:10244. doi: 10.1038/ncomms10244
Pauly, D., and Zeller, D. (2016b). Global Atlas of Marine Fisheries: A Critical Appraisal of Catches and Ecosystem Impacts. Washington, D.C: Island Press.
Pauly, D., and Zeller, D. (2017). The best catch data that can possibly be? Rejoinder to Ye et al.“FAO’s statistic data and sustainability of fisheries and aquaculture”. Mar. Policy 81, 406–410. doi: 10.1016/j.marpol.2017.03.013
Payet, R., and Agricole, W. (2006). Climate change in the Seychelles: implications for water and coral reefs. AMBIO 35, 182–190.
Pepperell, J., Griffiths, S., and Kadagi, N. (2017). Acquisition of Catch and Effort and Size Data from Sport Fisheries in the Western Indian Ocean. Victoria: IOTC, 100
Philpot, D., Gray, T. S., and Stead, S. M. (2015). Seychelles, a vulnerable or resilient SIDS? A local perspective. I. Stud. J. 10, 31–48.
Powell, J. A. (2014). Six Policies to Reduce Economic Inequality. Berkeley, CA: University of California.
Rabearisoa, N., Sabarros, P. S., Romanov, E. V., Lucas, V., and Bach, P. (2018). Toothed whale and shark depredation indicators: a case study from the Reunion Island and Seychelles pelagic longline fisheries. PLoS One 13:e0202037. doi: 10.1371/journal.pone.0202037
Robinson, J., Aumeeruddy, R., Isidore, M., Payet, R., Marguerite, M., Laval, M., et al. (2006). “Country review: Seychelles,” in Review of the State of World Marine Capture Fisheries Management: Indian Ocean, ed. C. De Young (Rome: FAO), 425–435.
Robinson, J., Isidore, M., Marguerite, M. A., Õhman, M. C., and Payet, R. J. (2004). Spatial and temporal distribution of reef fish spawning aggregations in the Seychelles–An interview-based survey of artisanal fishers. West. Indian Ocean J. Mar. Sci. 3, 63–69.
Robinson, J. P. W., Robinson, J., Gerry, C., Govinden, R., Freshwater, C., and Graham, N. A. J. (2020). Diversification insulates fisher catch and revenue in heavily exploited tropical fisheries. Sci. Adv. 6:eaaz0587. doi: 10.1126/sciadv.aaz0587
Rustomjee, C. (2016). Financing the Blue Economy in Small States. Waterloo: Center for International Governance Innovation.
Schutter, M. S., and Hicks, C. C. (2019). Networking the Blue Economy in Seychelles: pioneers, resistance, and the power of influence. J. Polit. Ecol. 26, 425–447. doi: 10.2458/v26i1.23102
Secretariat Commonwealth (2018). in Seychelles Blue Economy Strategic Policy Framework and Roadmap: Charting the Future (2018–2030), Available online at: https://seymsp.com/wp-content/uploads/2018/05/CommonwealthSecretariat-12pp-RoadMap-Brochure.pdf (accessed October 15, 2018).
SFA (1991). Seychelles Artisanal Fisheries Statistics for 1990. Victoria: Seychelles Fishing Authority.
SFA (2002). Seychelles Artisanal Fisheries Statistics for 2001. Victoria: Seychelles Fishing Authority.
SFA (2018). Seychelles Fishing Authority Strategic Plan 2018–2020. Victoria: Seychelles Fishing Authority.
Smith, N. S., and Zeller, D. (2016). Unreported catch and tourist demand on local fisheries of small island states: the case of The Bahamas, 1950-2010. Fishery Bull. 114, 117–131. doi: 10.7755/fb.114.1.10
Spalding, M. D., and Jarvis, G. E. (2002). The impact of the 1998 coral mortality on reef fish communities in the Seychelles. Mar. Pollut. Bull. 44, 309–321. doi: 10.1016/s0025-326x(01)00281-8
Swartz, W., Sala, E., Tracey, S., Watson, R., and Pauly, D. (2010). The spatial expansion and ecological footprint of fisheries (1950 to present). PLoS One 5:e15143. doi: 10.1371/journal.pone.0015143
Techera, E. (2019). Indian Ocean fisheries regulation: exploring participatory approaches to support small-scale fisheries in six States. J. Indian Ocean Reg. 16, 27–46. doi: 10.1080/19480881.2020.1704979
UNSD (2018). United Nations Demographic Year Book 1953-1959. New York, NY: United Nations Statistics Division.
Ward, P., and Hindmarsh, S. (2007). An overview of historical changes in the fishing gear and practices of pelagic longliners, with particular reference to Japan’s Pacific fleet. Rev. Fish Biol. Fish. 17, 501–516.
Wilson, D. (1994). Unique by a thousand miles: Seychelles tourism revisited. Ann. Tour. Res. 21, 20–45. doi: 10.1016/0160-7383(94)90003-5
WorldBank (2017). Third South West Indian Ocean Fisheries Governance and Shared Growth Project (SWIOFish3). Washington, DC: The World Bank.
WorldBank (2018a). Seychelles launches World’s First Sovereign Blue Bond. Washington, DC: The World Bank.
WorldBank (2018b). Sovereign Blue Bond Issuance: Frequently Asked Questions. Washington, DC: The World Bank.
Ye, Y., Barange, M., Beveridge, M., Garibaldi, L., Gutierrez, N., Anganuzzi, A., et al. (2017). FAO’s statistic data and sustainability of fisheries and aquaculture: Comments on Pauly and Zeller (2017). Mar. Policy 81, 401–405. doi: 10.1016/j.marpol.2017.03.012
Zeller, D., Booth, S., and Pauly, D. (2006). Fisheries contributions to the gross domestic product: underestimating small-scale fisheries in the Pacific. Mar. Resour. Econ. 21, 355–374. doi: 10.1086/mre.21.4.42629521
Zeller, D., Cashion, T., Palomares, M., and Pauly, D. (2018). Global marine fisheries discards: a synthesis of reconstructed data. Fish Fish. 19, 30–39. doi: 10.1111/faf.12233
Zeller, D., Harper, S., Zylich, K., and Pauly, D. (2015). Synthesis of underreported small-scale fisheries catch in Pacific island waters. Coral Reefs 34, 25–39. doi: 10.1007/s00338-014-1219-1
Zeller, D., Palomares, M. L. D., Tavakolie, A., Ang, M., Belhabib, D., Cheung, W. W. L., et al. (2016). Still catching attention: Sea Around Us reconstructed global catch data, their spatial expression and public accessibility. Mar. Policy 70, 145–152. doi: 10.1016/j.marpol.2016.04.046
Zeller, D., and Pauly, D. (2019). Viewpoint: back to the Future for fisheries, where will we choose to go? Glob. Sustain. 2, 1–8. doi: 10.1017/sus.2019.8
Zylich, K., Omeara, D., Jacquet, J., Harper, S., and Zeller, D. (2012). “Reconstruction of marine fisheries catches for the Republic of Fiji (1950–2009),” in Fisheries Catch Reconstructions: Islands, Part III. Fisheries Centre Research Reports 20(5), eds S. Harper, K. Zylich, L. Boonzaier, F. Le Manach, D. Pauly, and D. Zeller (Vancouver: University of British Columbia).
Keywords: marine capture fisheries, blue bonds, catch reconstruction, catch per unit effort (CPUE), Indian Ocean, small-island country, small-scale fisheries, food security
Citation: Christ HJ, White R, Hood L, Vianna GMS and Zeller D (2020) A Baseline for the Blue Economy: Catch and Effort History in the Republic of Seychelles’ Domestic Fisheries. Front. Mar. Sci. 7:269. doi: 10.3389/fmars.2020.00269
Received: 30 November 2019; Accepted: 03 April 2020;
Published: 05 May 2020.
Edited by:
Maria Lourdes D. Palomares, University of British Columbia, CanadaReviewed by:
Aylin Ulman, Mersea Marine Consulting, Fethiye, TurkeyAndrés M. Cisneros-Montemayor, University of British Columbia, Canada
Copyright © 2020 Christ, White, Hood, Vianna and Zeller. This is an open-access article distributed under the terms of the Creative Commons Attribution License (CC BY). The use, distribution or reproduction in other forums is permitted, provided the original author(s) and the copyright owner(s) are credited and that the original publication in this journal is cited, in accordance with accepted academic practice. No use, distribution or reproduction is permitted which does not comply with these terms.
*Correspondence: Hanna J. Christ, hannachrist31@gmail.com