Continuous Focal Group Follows Operated by a Drone Enable Analysis of the Relation Between Sociality and Position in a Group of Male Risso’s Dolphins (Grampus griseus)
 Karin Hartman
 Pieter van der Harst
 Raul Vilela
- 1Nova Atlantis Foundation, Azores, Portugal
- 2Bioconsult SH GmbH & Co. KG, Husum, Germany
- 3OCEANSEA Conservación del Medio Marino, Tarifa, Spain
Relationships between social status and relative position of group-living animals have been described in a variety of species. For wild cetaceans, who spend most of their time underwater, collecting detailed, continuous data to assess such relationships depends highly on group size, formation, shyness of animals and observation platform. We test a new method for focal group sampling using an Unmanned Aerial Vehicle (UAV), focusing on one long-term followed group of 13 male Risso’s dolphins (Grampus griseus) in the Azores, Portugal. We aim to assess the usefulness of a UAV in delivering robust data to evaluate sociality in relation to relative position. Our analysis is based on recordings of synchronous breathing events, which are taken as an indicator of association strength. Twenty-one separate UAV flights were performed during seven surveys in July–August 2017, recording 2,886 breathing events and 571 synchronous dyads. Results showed strong differences in sociality between individuals and identified two strongly associated pairs, one strongly associated trio and six less associated individuals within the group. We subsequently created continuous time series of relative positions by interpolation of the positions recorded with the UAV at breathing events, and applied the Dynamic Time Warping method to assess associations based on relative position. This analysis identified more detailed association patterns than the synchrony analysis, and revealed a correlation between measures of sociality and relative position, at an individual and sub-cluster level, which may indicate dominant relationships. We compared results with those obtained with Photo-ID to assess any observation bias related to using a UAV. We found that 37% more breathing events were recorded with the UAV, and 21% more synchronous dyads detected, compared with Photo-ID, collected over the same observation periods, but, based on synchrony data, both methods yielded very similar results. We conclude that using a UAV for focal group follows of Risso’s dolphins enables a more granular study of association patterns than Photo-ID, by taking into account the relative position of individuals. The correlation found between measures of sociality and relative position holds promise for using UAVs in future studies of dominant relationships in Risso’s dolphins and other cetacean species.
Introduction
The relative position in the group can have a significant impact on an individual’s fitness for animals living in groups (Krause, 1994). Thus, it is considered to be an important indicator of an individual’s social status (dominant/subordinate, leading/following) in a wide variety of species, such as bottlenose dolphins (Tursiops truncatus), where the front position has been associated with leadership (Lewis et al., 2011), gray wolves (Canis lupus), where frontal leadership is displayed mostly by dominant breeding wolves (Peterson et al., 2002) or baboons (Papio Anubis), where within a given sex-age class dominant individuals tended to be found closer to the center than subordinates (Farine et al., 2017). Dominance and leadership in animal groups are linked to coordination of behavior and decision-making, which are subjects of numerous biological studies (Conradt and Roper, 2005; King and Sueur, 2011; Smith et al., 2016). Studying these mechanisms in wild animals can be challenging. For cetaceans, this is further complicated by the fact that they spend most of their lives underwater, which forms a serious obstacle for continuous behavioral data recording. Consequently, the moment of surfacing for breathing is usually taken as an opportunity for data collection, linked to a minimum length of observation time (Altmann, 1974; Mann, 1999).
At present, the commonly applied methods to record cetacean behavior are the focal group follow (Altmann, 1974; Mann, 1999) or the point sampling protocol (Martin and Bateson, 2007). More precise data can be gathered by applying the individual focal follow sampling protocol, enabling an observer to focus on details during the observation of one individual and the “nearest neighbors” (Altmann, 1974; Mann, 1999). These observation techniques are commonly combined with individual photo-identification (Photo-ID) (Würsig and Jefferson, 1990) and serve for the analysis of social structures, based on measures of association (Cairns and Schwager, 1987; Bigg et al., 1990). However, depending on the group size, shyness of the animals under observation, number of observers and observation platform, not all individuals may be constantly visible from a horizontal observation perspective, which may result in loss of valuable data.
This difficulty can be overcome by using an Unmanned Aerial Vehicle (UAV), commonly known as a drone. These machines provide an aerial perspective that enables continuous recording of behavior of animals under observation, offering strong potential for more detailed data collection of a set of associated animals. Besides, UAVs are small and (fairly) non-intrusive (Koski et al., 2015; Christiansen et al., 2016a; Domínguez-Sánchez et al., 2018; Torres et al., 2018), partly because the noise propagated underwater from small UAVs is likely non- to minimally invasive (Christiansen et al., 2016a). Off the shelf UAVs are relatively inexpensive, thus are more affordable for researchers. Therefore they seem a highly promising tool which has already successfully been employed in numerous biological studies for various taxa and eco-systems (Koh and Wich, 2012; van Andel et al., 2015; Wich et al., 2016), including marine mammals, with multiple purposes such as abundance estimations (Koski et al., 2011, photogrammetry (Durban et al., 2015), identification (Karnowski et al., 2016), examining the body condition of whales (Christiansen et al., 2016b), collecting blow samples of humpback whales (Megaptera novaeangliae) (Apprill et al., 2017), and analyzing detailed behavior of gray whales (Eschrichtius robustus) (Torres et al., 2018). However, no literature is currently available describing the application of UAVs for focal group and individual follows in wild dolphin species. Apart from enabling continuous recording of behavioral data of individuals, the UAV also offers an opportunity, not feasible with Photo-ID for larger group sizes, to record individuals’ positions within the group. This presents a potentially meaningful advance in the research of wild dolphin species operating in groups.
When studying the social behavior of wild cetaceans, one notable feature that is sometimes observed is synchrony. Synchronous breathing is defined as two or more individuals who simultaneously break the surface to breath, in close vicinity of each other (Sakai et al., 2010). It has been suggested that synchronous breathing can be interpreted as a specific, affiliative social behavior, serving as a valuable indicator when studying complex delphinid social relationships (Connor et al., 2006). Synchrony in the context of male cetacean collaboration has been described for Indo-pacific bottlenose dolphins (T. aduncus) (Connor et al., 2006; McCue et al., 2020). In this species, synchronous surfacing of alliance members was commonly observed, and especially linked to occasions of intense social behavior with female consorts. Data for this study was obtained using video footage taken from a research vessel (Connor et al., 2006). Apart from this, a study of Atlantic spotted dolphins (Stenella frontalis) and bottlenose dolphins (T. truncatus) in the Bahamas describes visual and acoustic synchrony by males of both species linked to inter- and intraspecific aggression (Herzing, 2015).
In the Azores, a population of 1,250 Risso’s dolphins (Grampus griseus) has been identified, of which a subset of about 250 individuals are considered resident in the study area (Hartman et al., 2015). A long-term dataset is available for a part of this population, based on Photo-ID (Hartman et al., 2008) and individual/group follows (Altmann, 1974; Mann, 1999). In contrast to other squid eating odontocete species, the male individuals studied here are organized in highly stable clusters of 3–12 individuals (mean: 5.8, SD: 1.9; Hartman et al., 2008). The group sizes found in these clusters invite a deeper analysis of the social intra-group dynamics in male Risso’s dolphins, by analyzing the relative position of individuals and their synchrony patterns. Although it is feasible to score these features using video footage when following 2–3 animals from the surface (Connor et al., 2006), continuous focal group sampling of all individuals in larger groups requires a new and precise sampling method.
Here we report on the outcomes of a study aiming to test a new method using a UAV for collecting data on behavior of a focal group of 13 male Risso’s dolphins, focusing on synchrony and individual position in the group. We analyze all surfacing events and consider synchronized breathing events as an indicator of association of members within the group. We subsequently apply time series analysis on the synchrony patterns and relative position of individuals during and between breathing events to investigate the relationship between measures of sociality and relative position. In order to evaluate any observation bias related to the use of a UAV, we compare the outcomes of the analysis based on UAV footage with those produced by simultaneously collected Photo-ID observations. We assess the additional insights into the social dynamics in the group resulting from the analysis of UAV footage that cannot be obtained with conventional Photo-ID data. This comparison highlights benefits and constraints of both methods, and may help guide future research for studying social dynamics in other wild cetacean species as well.
Materials and Equipment
Oceanic boat based surveys were conducted off Pico Island, the Azores, Portugal, covering approximately 540 km2 during May–September 2017. Risso’s dolphins were first located from a land based look out (38.4078 N and 28.1880 W) using 25 × 80 binoculars (Steiner observer, (Hartman et al., 2008)), and encountered during ocean based surveys, using a 5.8 m long zodiac, equipped with a 50 HP outboard engine. The research vessel was cruising on average with a speed of <6 km/h when following the focal follow pod “IKB.” This is one of the frequently sighted resident male pods off Pico island (Hartman et al., 2008, 2015), of which individuals have been followed since 2004. During this study, IKB was composed of 13 adult individuals. Their specific, adult age class was determined by applying the methodology based on scarring patterns and skin coloration described in Hartman et al. (2016). The members “M21g”, “M24j”, “M47f”, “S10c”, “S11c”, “S11d”, “S11e”, “S27f”, “Ub7c”, “S27a”, “Extension1” and “Sample 34” have been sexed by using genotyping techniques (Karin Hartman, personal communication). Individual “New1” was sexed by several confirmed observations of the genital split during Photo-ID effort in the field. Group membership at the start of each survey was determined when a sample of individuals were interacting socially and/or showed coordinated activity in their behavior, following Whitehead, 2003, with inter-animal distances of less than 15 m (chain rule; Smolker et al., 1992). Four general behavior types (resting, traveling, socializing, foraging) were defined after Altmann (1974) and Shane (1990). The pod, consisting of adult individuals with severely marked dorsal fins, could be recognized by eye at sea by KH at the start of the observation. Pod members were identified during each encounter by applying standard Photo-ID methods of the dorsal fins, using a digital Nikon D7100 camera equipped with a 70–300 mm zoom lens (Hartman et al., 2008). Next to Photo-ID, all surface behavior was noted using the focal group follow protocol, e.g.,: time, GPS, traveling direction, speed, behavior, formation state, formation event, and displays (Altmann, 1974; Mann, 1999; Visser et al., 2011). All surveys on IKB involving the UAV lasted for a minimum of 20 min up to approximately 60 min per encounter, per day. From May to August 2017, we performed 9 surveys over 9 days on IKB using a UAV. Of these surveys, two were excluded from the analysis since they produced insufficient data for meaningful analysis. Two of the remaining surveys took place in July 2017 (yielding 57 min of effective UAV footage) and five in August 2017 (1 h and 48 min).
We used a DJI Phantom 4, with four to six separate batteries, operating a camera with a focal length of 20 mm, stabilized by a 3-axis gimbal, and a sensor with a capacity of 12.4 megapixels. The video output was recorded at 4K and 30 fps. Our UAV pilots used the manual remote flight control of the aircraft and real-time camera output through an Apple iPad MiniTM tablet operating the DJI Go application.
Methods
UAV Operating Protocol
The UAV was operated when no whale watching vessels were nearby, when it was not raining, the sea state was <Douglas scale 3, the wind <Beaufort 4, with two to five observers present at sea. The general behavior of the IKB pod was observed for about 5 min before the UAV was launched from our research vessel. After being airborne, the UAV was brought into position near the pod at an average altitude of 7.7 m (range 7–15 m), but always to the side of the group at a lateral distance of 10–25 m, to create an angle at which individual dorsal fins could be captured from the side, while keeping sufficient distance to capture all individuals in one frame. From this position, we could record the breathing intervals and the behavior of the entire group on a continuous basis (Figures 1A,B). Due to the light coloration of the adult Risso’s dolphins, we could also follow the pod with the UAV when the dolphins dove deeper in between breathing cycles, by following the “blue shape” (Figure 1C). During flights, the research vessel was cruising at 25–50 m distance from the pod. UAV flights lasted up to 18 min, after which batteries had to be replaced, preferably during diving bouts. Flights were aborted when the wind was picking up above Beaufort 4, when it started to rain or when whale watching vessels were approaching the pod.
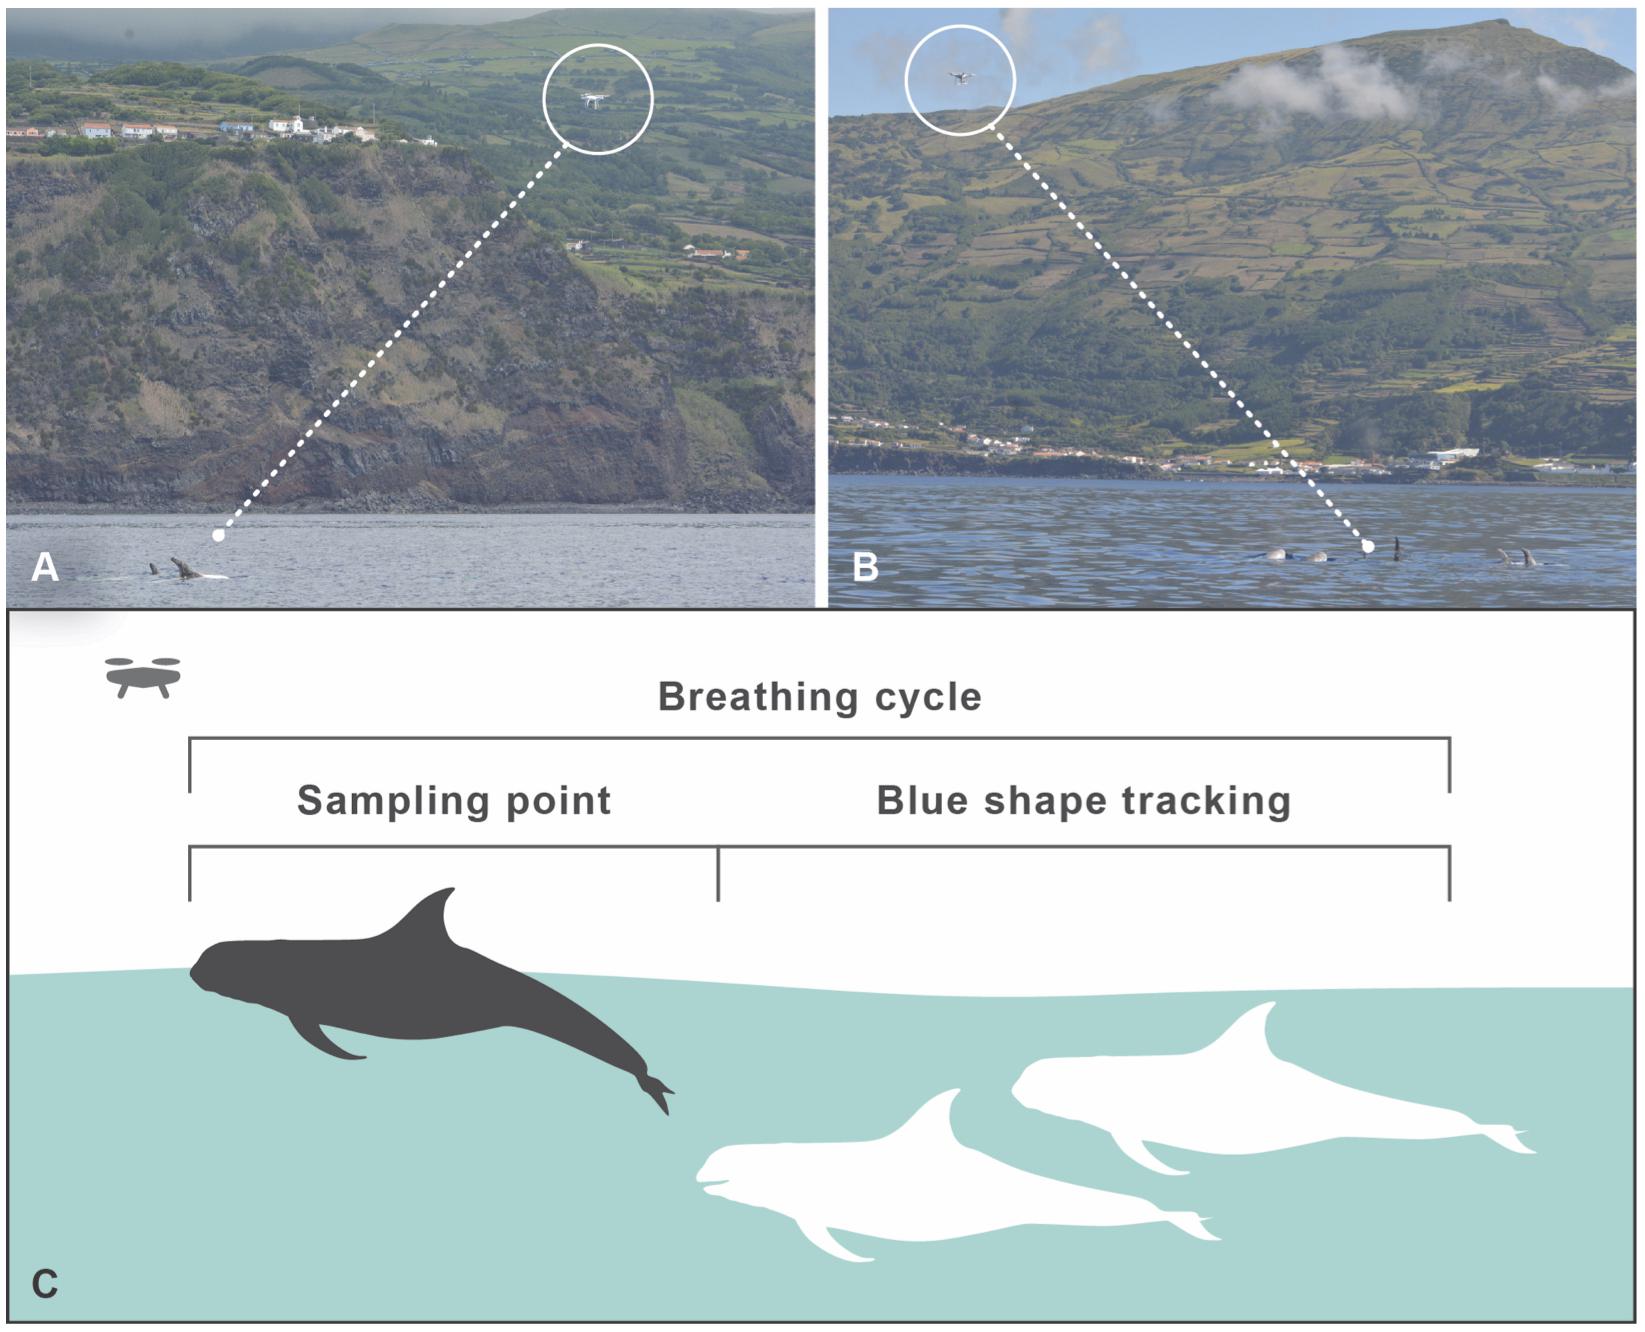
Figure 1. Drone operating protocol. (A,B) Positions of the UAV, capturing all group members. (C) UAV data sampling during surfacing. Due to the light skin coloration of adult Risso’s dolphins, individuals show up as a blue shape when diving deeper (up to a few meters depth, depending on light and water conditions), and can continue to be tracked for continuous focal group follows, especially during resting/traveling behavior.
Photo-ID Scoring Protocol
Photo-ID data were captured by Karin Hartman as soon as we arrived near the pod, and continued until the moment we left the pod. During UAV observations, Photo-ID continued, with the aim to capture every breathing event of every individual. Thus, Photo-ID data capture always spanned a longer period of time than UAV data capture. For this study however, we only used the photographs of dorsal fins taken from the start of the UAV observation to the end, in order to compare results between the two methods. These Photo-IDs were used to create a standardized series of tables (one table per survey), marking per individual the time of surfacing, and whether the individual surfaced separately or in synchrony with one or more other individuals. Synchrony was defined as an occasion where two or more group members performed the same behavior simultaneously or in unison (Mann and Smuts, 1999), while swimming less than 50 cm from each other (Connor et al., 2006); see Figures 2A–K.
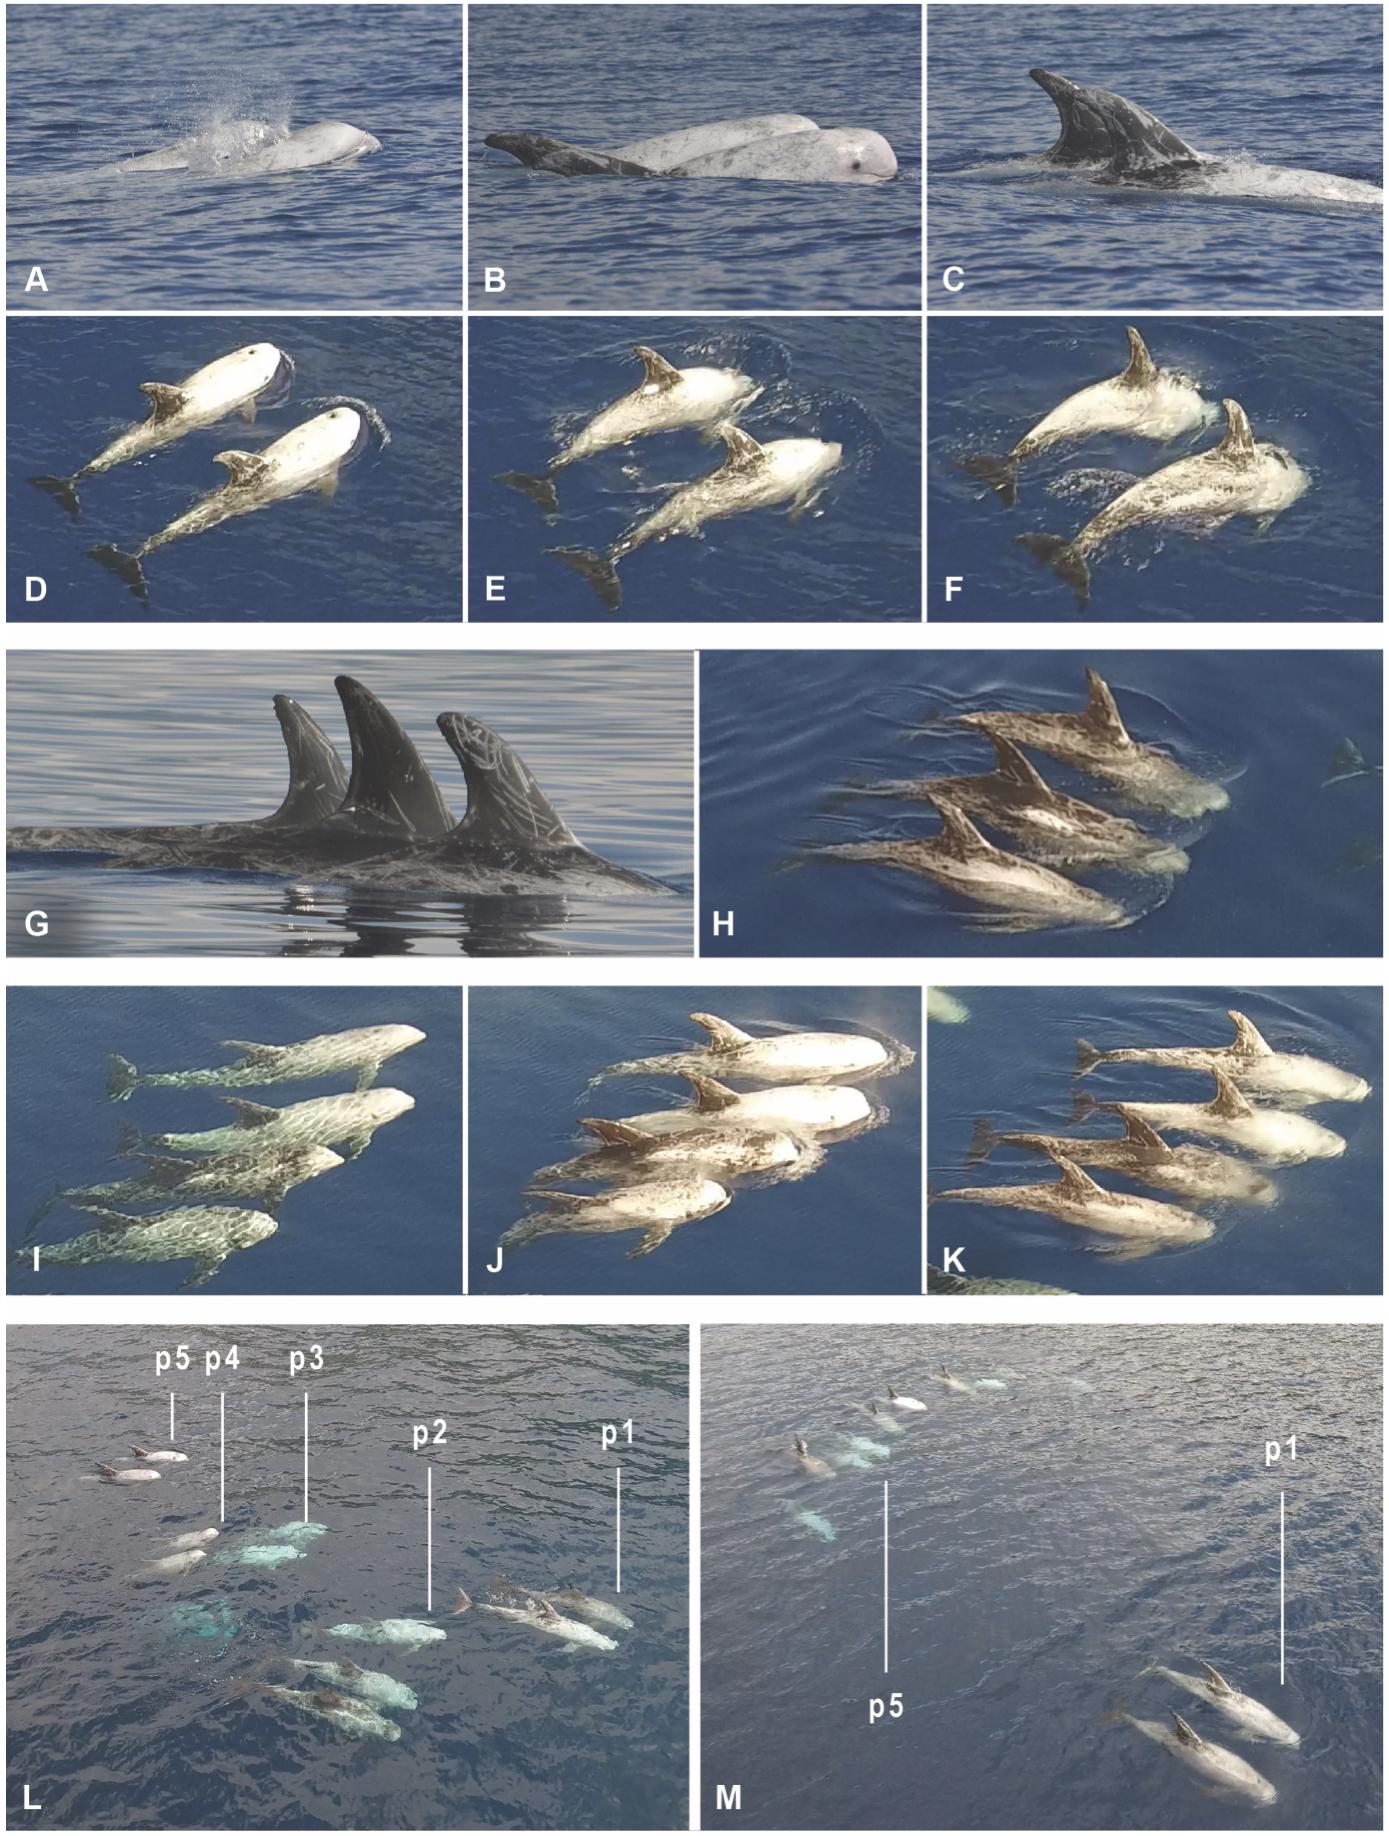
Figure 2. Examples of individual identification and group compositions used for scoring relative positions of individuals. (A–C) Photo identification of a synchronized pair using conventional photo identification methods. (D–F) Same pair, captured by the UAV. (G) Photo identification of a synchronized triplet. (H) Same triplet, captured by the UAV. (I–K) Photo identification of a synchronized quartet, captured by the UAV. (L) The IKB group organized in 5 rows, using a relative classification for individual positions categorized as: front row (p1), row behind the front (p2), center (p3), row before the rear (p4), or rear row (p5). (M) The IKB group organized in 2 rows: front (p1) and rear (p5).
UAV: Synchrony and Relative Position Scoring Protocol
Individuals were identified using stills taken from video footage obtained by the UAV. Figures 2A–K show conventional Photo-ID of individuals vs. video identification recorded at the same moment. The second the dolphins surfaced to breath was taken as the sampling point for data scoring for each individual. Surfacing events were manually scored by two observers as “synchronized” based on a frame-by-frame analysis of the UAV footage (Connor et al., 2006), using the same definition as for Photo-ID. A standardized series of tables was created (one table per survey), marking the relative position of the individuals (columns) for each surfacing event (rows). The relative position of dolphins was determined to analyze a possible correlation with relationship preferences, using a maximum of five positions within the pod: i.e. front-row (p1), row behind the front (p2), center (p3), row before the rear (p4), or rear (p5). Figure 2L shows a situation where group members are organized in 5 rows. However, during surveys the group formation could change, and “rows” could merge or break up. Figure 2M shows a different situation, where group formation was reduced to two rows: p1 marks the front and p5 the rear of the pod. Other examples of how we treated different group-formation states for analysis are given in Supplementary Figure S1.
Statistical Analysis
UAV and Photo-ID: Associations and Network Analysis Based on Synchrony
We compared the results between the two observation methods, performing the following analyses: For every survey a co-occurrence matrix was constructed with the names of the individuals on both the X- and the Y-axis, noting for every dyad (i,j) the number of synchronized breathing events (‘”synchs”) observed. A value of zero was noted when no synchs were recorded for a dyad. A pair comprised one dyad, a trio three, a quartet six, etc.1 The synch rate Xi per individual i was calculated per survey (Eq. 1):
where A is the synchrony co-occurrence matrix (or adjacency matrix) per survey and N the total number of surfacing events observed per individual per survey. The individual synch rates per survey were used to calculate the average synch rate per individual across all surveys. Synch rates Di,j per dyad i,j were calculated per survey as follows (Eq. 2):
Next, a synch rate matrix was constructed for the entire studied period by taking the arithmetic average of the dyadic synch rates Di,j across all surveys for every dyad (i,j). Thus, every survey carried the same weight in determining the average synch rate across all surveys.
We performed a network analysis on the synch rate matrix across all surveys, where the community structure in terms of clusters was identified optimizing the modularity score using the greedy optimization of modularity algorithm (Clauset et al., 2004). Relationships and network structure were illustrated using a social network plot, where nodes with highest associations are grouped together, while more isolated individuals remain in the periphery of the graph (Clauset et al., 2004).
In order to assess connections between individuals, we calculated the modularity and individual centrality scores. Modularity is a measure of how separated the different clusters are from each other (Clauset et al., 2004). The centrality score for each individual was calculated based on the eigenvector centrality score of the positions occupied by each individual in the network (Bonacich, 1987). A Mantel test (999 permutations) was performed over the co-occurrence matrices to compute the significance of the correlation among surveys (Mantel, 1967).
UAV: Relative Position
With the UAV, it was possible to record the relative position in the group of each individual; something that was not feasible with Photo-ID. Using the data on individuals’ relative position generated by scoring the UAV footage, we calculated per survey the average position per individual by assigning a value of 1 to position p1, etc. up to position p5. Next, we determined the average across all surveys per individual, and using the standard score (Spiegel and Stephens, 2008) we classified the average relative position as Front (values <−1), Front/Middle (values from −1 to −0.5), Middle (values between −0.5 and 0.5), Middle/Rear (values from 0.5 to 1) and Rear (values >1). In order to assess a possible relationship between the synch rate and the relative position in the group, we calculated the correlation between the average synch rate per individual across all surveys and its average position across all surveys. The same analysis was performed on the relationship between the centrality score and the average position in the group.
UAV: Associations Based on Time-Series Analysis
With the possibility created by the UAV to record relative positions, we were also able to perform time series analyses on coordinated swimming, which is broader than synchronized breathing only: individuals that swim alongside each other do not always surface in synchrony, but can still be visibly ‘paired’, which is not captured when focusing on synchronous breathing only. So, in order to assess if relaxing the constraint of perfect synchrony would give us more detailed insight into individual preferences and avoidances based on coordinated swimming, we performed an additional analysis of spatial and temporal proximity. For each individual, its relative position within the group was recorded per breathing event. Next, we performed a rational interpolation of the observed position, by means of the algorithm of Stineman (Johanesson and Bjornsson, 2006), to estimate its position on a second-by-second basis. We used the outcomes to construct a continuous time series containing the position of the animal during the entire period of analysis. Individuals with less than two observed breathing events were removed from the analysis.
A dissimilarity matrix was calculated for each dyad, covering every survey, using the Dynamic Time Warping (DTW) method (Berndt and Clifford, 1994; Giorgino, 2009), based on the relative positions of individuals within the pod per second. DTW is a widely used algorithm specifically developed for measuring similarity between time series which may vary (i.e., warp). The algorithm finds the optimal alignment between two time series looking for minimum distance mapping between the query and reference time series, accounting for imperfect synchronization events (Berndt and Clifford, 1994). This method is effective in time series clustering analysis (Ferreira and Zhao, 2016; Sardá-Espinosa, 2019). Hierarchical cluster analysis of the dissimilarities matrix provided by the DTW algorithm was performed using the Ward’s minimum variance method (Legendre and Legendre, 2012; Murtagh and Legendre, 2014). Clustering uncertainty was assessed by means of the p-value via multiscale bootstrap resampling (Shimodaira, 2004; Suzuki and Shimodaira, 2015), and clustering results were presented in a cluster dendrogram based on a p-value <0.05. We compared the results of the DTW analysis with those of the synchrony analysis, to assess if the greater detail available through the DTW method leads to additional insights into the community structure.
All analyses were performed in R software (R core team, 2018). We used the igraph package (Csárdi and Nepusz, 2006) to perform the network analysis. Time series interpolation was done using the stinepack package (Johanesson and Bjornsson, 2006), while the TSclust package (Montero and Vilar, 2014) was used to calculate the dissimilarities matrix using the DTW method. We subsequently used the pvclust package (Suzuki and Shimodaira, 2015) for clustering and assessing uncertainty, and the vegan package (Oksanen et al., 2016) to perform the Mantel test.
Results
Fieldwork
Data for this study was recorded during seven separate survey days from the 15th of July until the 31st of August 2017. The IKB pod was engaged in resting or traveling behavior during our observation time and was organized as a tight group. We did not observe any negative response like tail fluke-diving or aggressive displays (e.g., tail and flipper slapping, breaching) from the individuals toward the UAV. A total of twenty-one separate UAV flights were operated, from which 144 min could be assessed as “full” focal group follow time, and used for analysis. For Photo-ID, we used 149 min (the difference with UAV footage is explained by the time needed to change batteries between UAV flights), and collected about 8,000 photographs, out of which 2,000 were selected for analysis.
The group size was 11–13, with an average group size of 11.9. One animal (UB7C) was absent during five of the follows; one (S11d) in three cases, and one animal (S27a) was absent during one follow. One sub-adult of unknown sex was present during one observation, displaying 11 synchs. Since this individual is not a member of the stable pod, it has been excluded from the analysis, without any significant impact on results.
We recorded 2,886 breathing events with the UAV, 37% more than with Photo-ID (2,108), leading to 21% more recorded synchronized dyads (571 versus 470). The 571 dyads were accounted for by 465 pairs, 18 trios, four quartets and one octet. The average synch rate for Photo-ID (39%) was slightly higher than for the UAV (36%), indicating that relatively fewer synchs were missed with Photo-ID than individual surfacing events.
Synchrony and Centrality
Table 1 shows the average synch rates and centrality scores for both methods. Outcomes were very similar between the two methods. The synch rates varied strongly among individuals, from 4% (S27a) to 68% (S11e) based on UAV analysis, and from 3% (S27a) to 70% (S11e) based on Photo-ID. Individuals with higher synch rates showed higher centrality scores (Bonacich, 1987) and vice versa [Correlation coefficient R = 0.90 (UAV) and 0.92 (Photo-ID)].
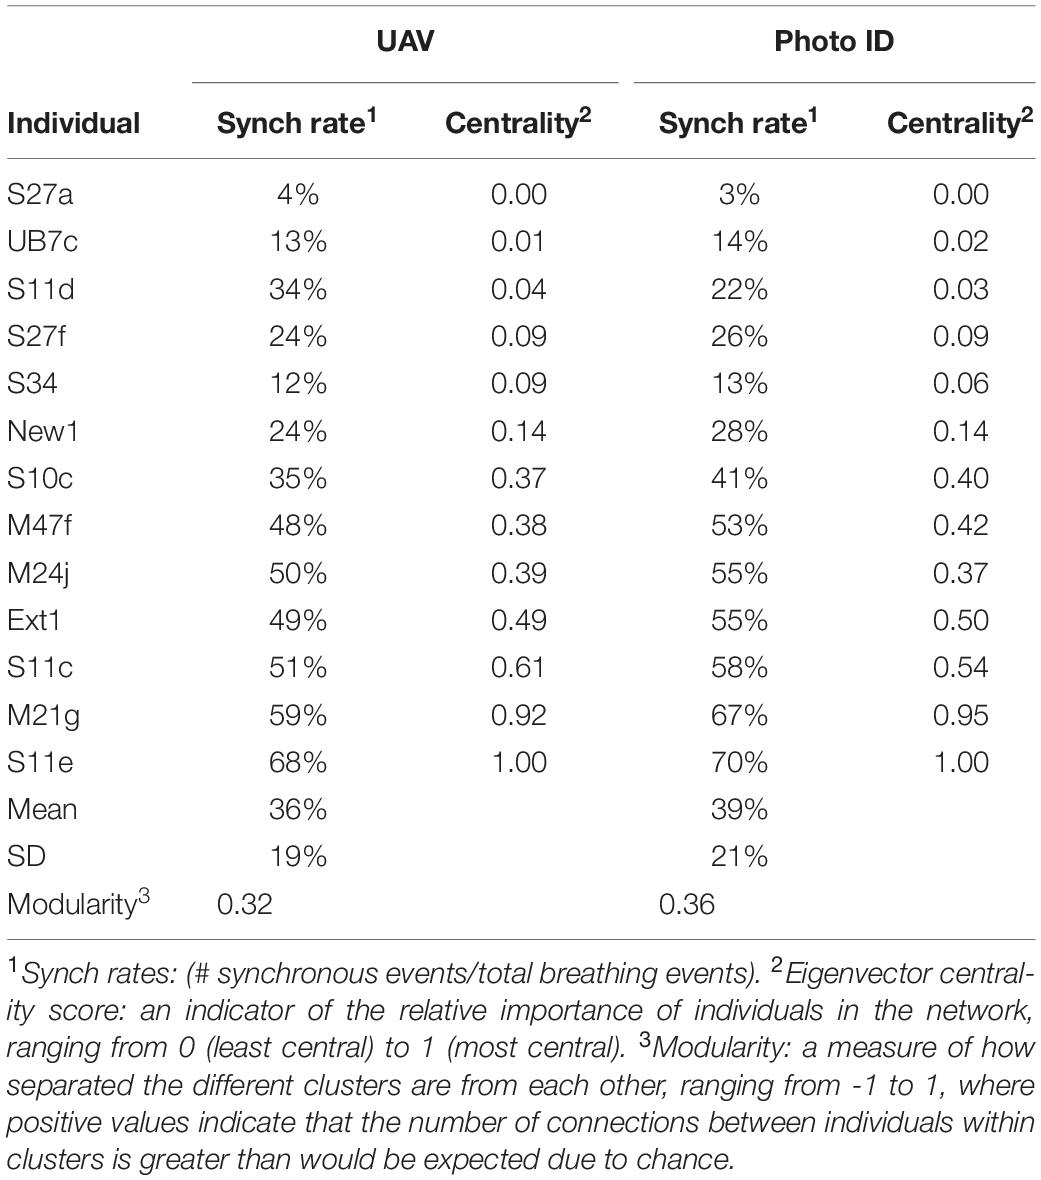
Table 1. Measures of sociality compared between UAV and Photo ID.
Associations Based on Synchrony
During each survey, the synchronized pairs and trios were generally stable, but variation occurred among surveys. The network analysis performed on the UAV data identified three frequently synchronized clusters within the pod, comprising one trio (M47f-S10c-Ext1) and two pairs (M24j-S11c and S11e-M21g), as well as one cluster of six less associated individuals. Figure 3 shows a social network graph illustrating the groups and relations identified. The network modularity score (0.32) reveals a generally well-connected network (Clauset et al., 2004). The network analysis performed on the basis of the Photo-ID data identified the exact same clusters, and a slightly higher network modularity score of 0.36.
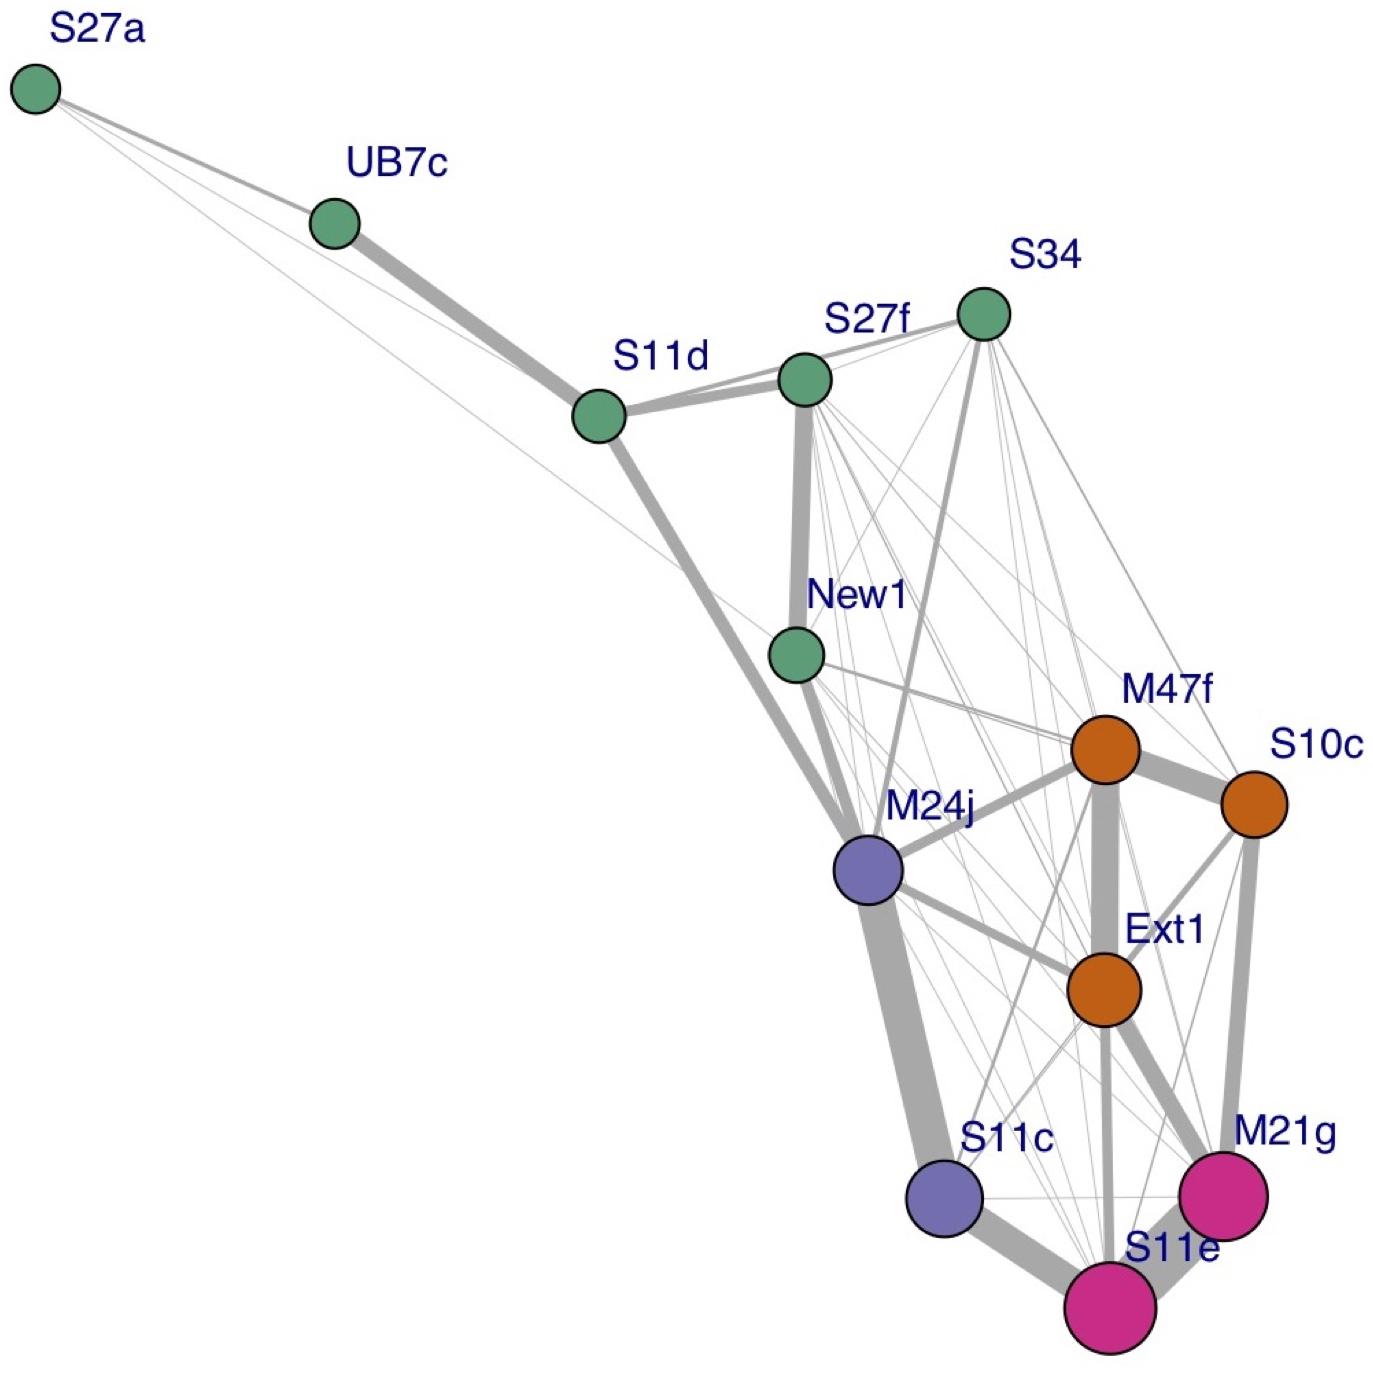
Figure 3. Social network plot based on the proportion of synchs to surfacing events per individual, across all surveys. The width of the link represents the strength of the association; the size of each node is proportional to the hub score of the corresponding individual (i.e., how well connected it is), and the color represents each cluster identified.
UAV: Relative Position
The six individuals with the lowest synchrony rate (<30%) were generally seen in the rear of the pod. The individuals with higher synchrony rates (≥30%) were generally observed in the middle/front of the group (Table 2). The average relative position across all surveys and the average synch rate per individual showed a negative correlation (R = −0.70). The correlation coefficient between centrality and average position was also negative (R = −0.57). Results from the Mantel tests (999 permutations) did not show any autocorrelation between surveys during the period analyzed (Legendre and Legendre, 2012).
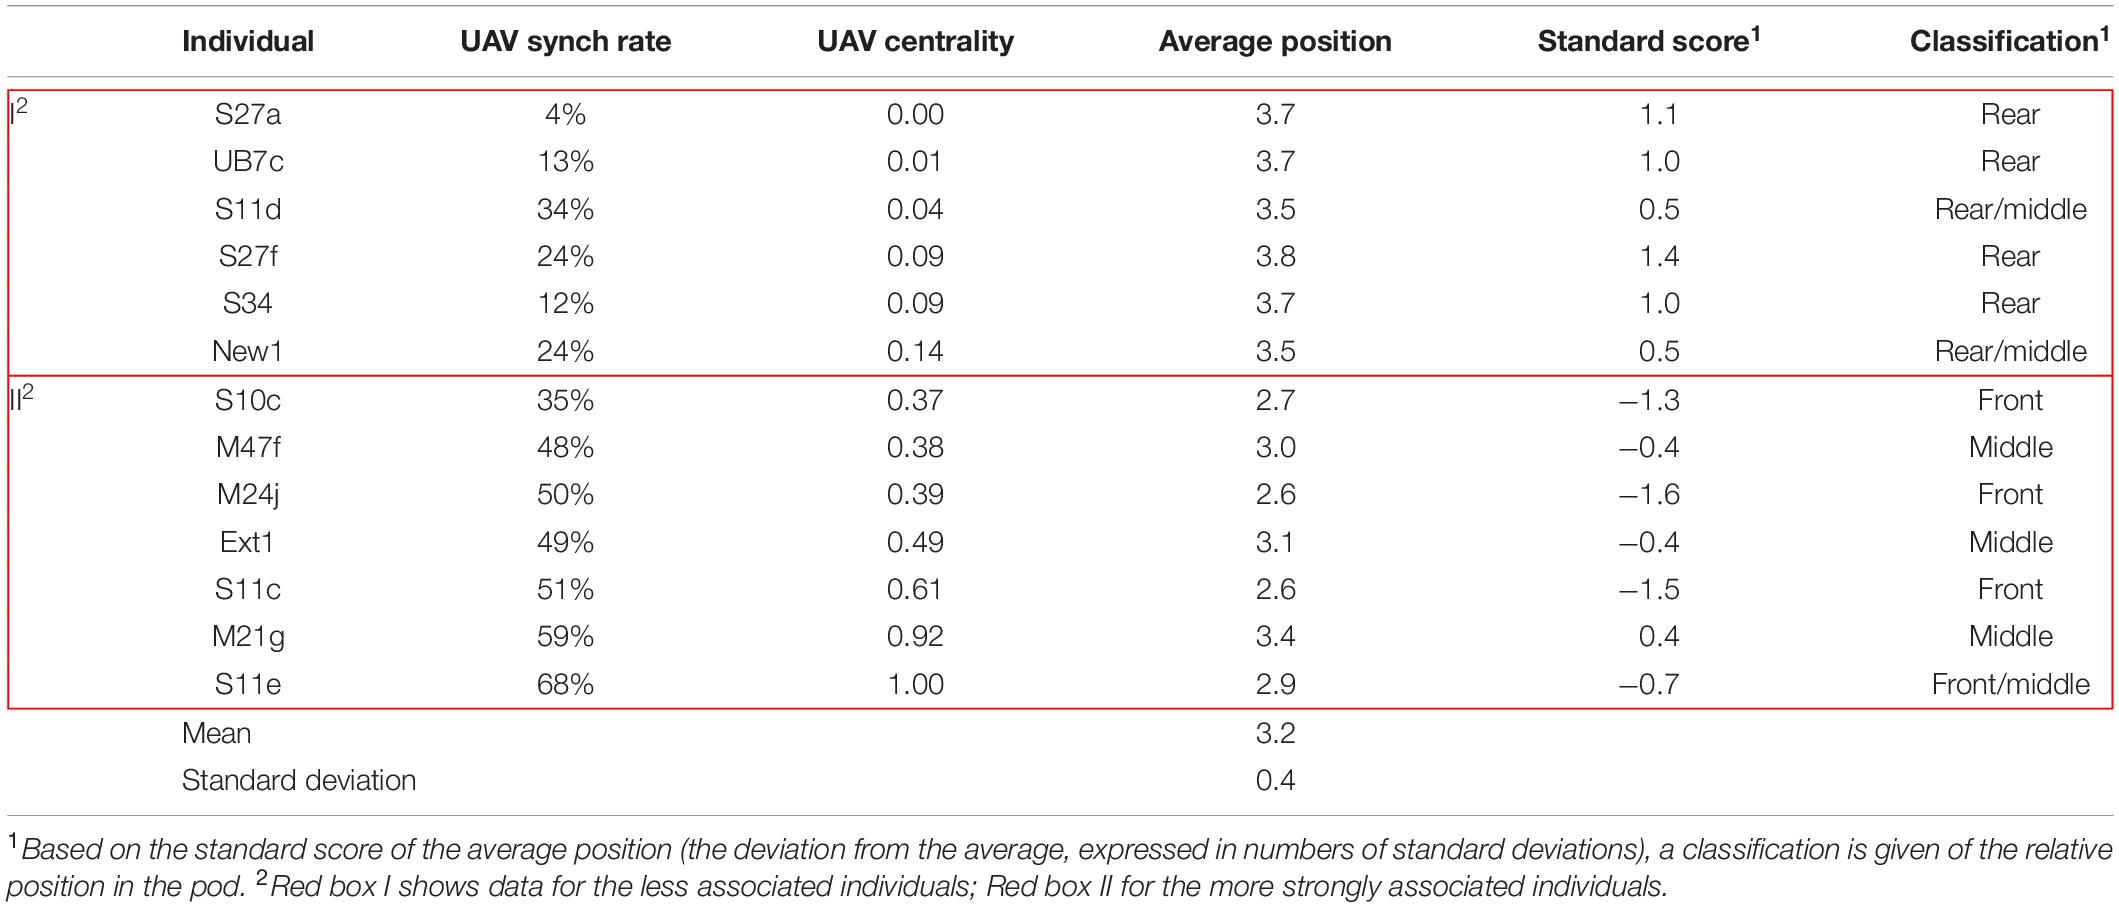
Table 2. UAV synch rate, eigenvector centrality and average position.
UAV: Associations Based on Time-Series Analysis
The time series analysis using the DTW method based on interpolated relative positions gave us more detailed insights in patterns of coordinated swimming than obtained when focusing on synchronized breathing only. Figure 4 illustrates the alignment in swimming patterns thus established for one of the frequently synchronized pairs: S11e-M21g. For the entire pod, this analysis resulted in the clustering dendrogram depicted in Figure 5.
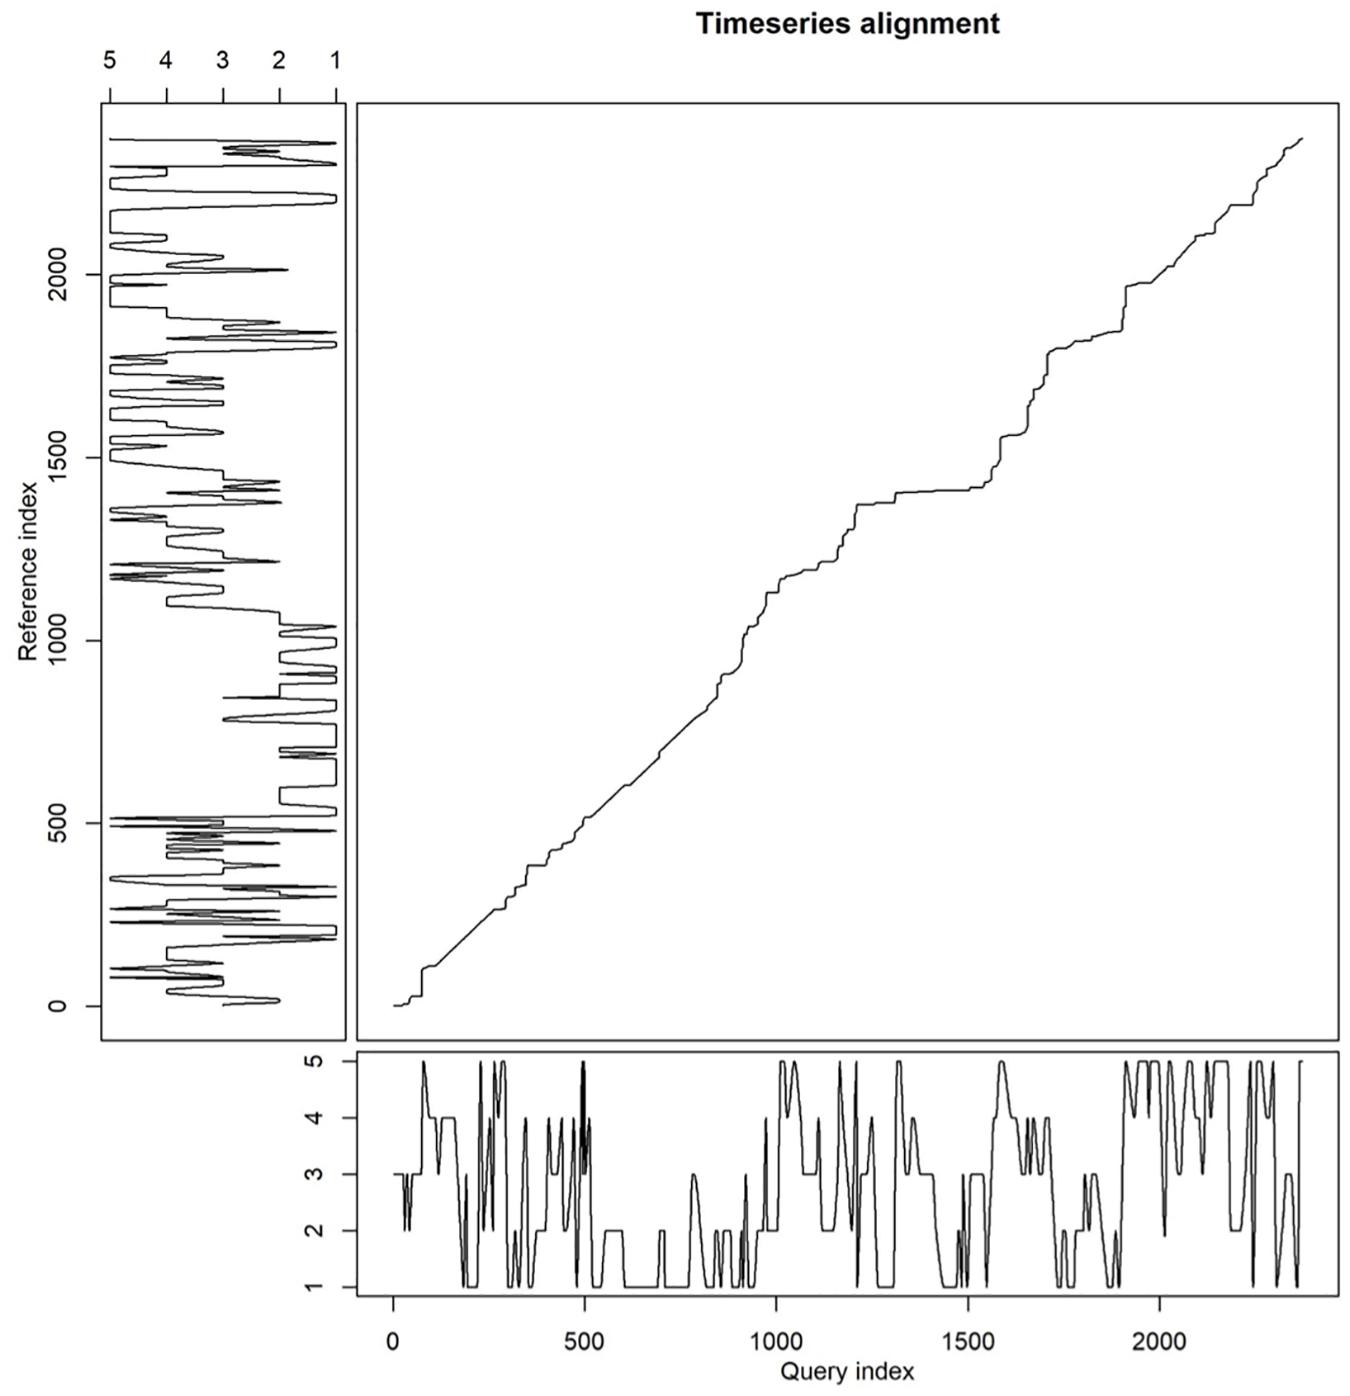
Figure 4. Relative position of individuals S11e (X-axis) and M21g (Y-axis). Perfectly aligned swimming would yield a straight diagonal line from bottom left to upper right.
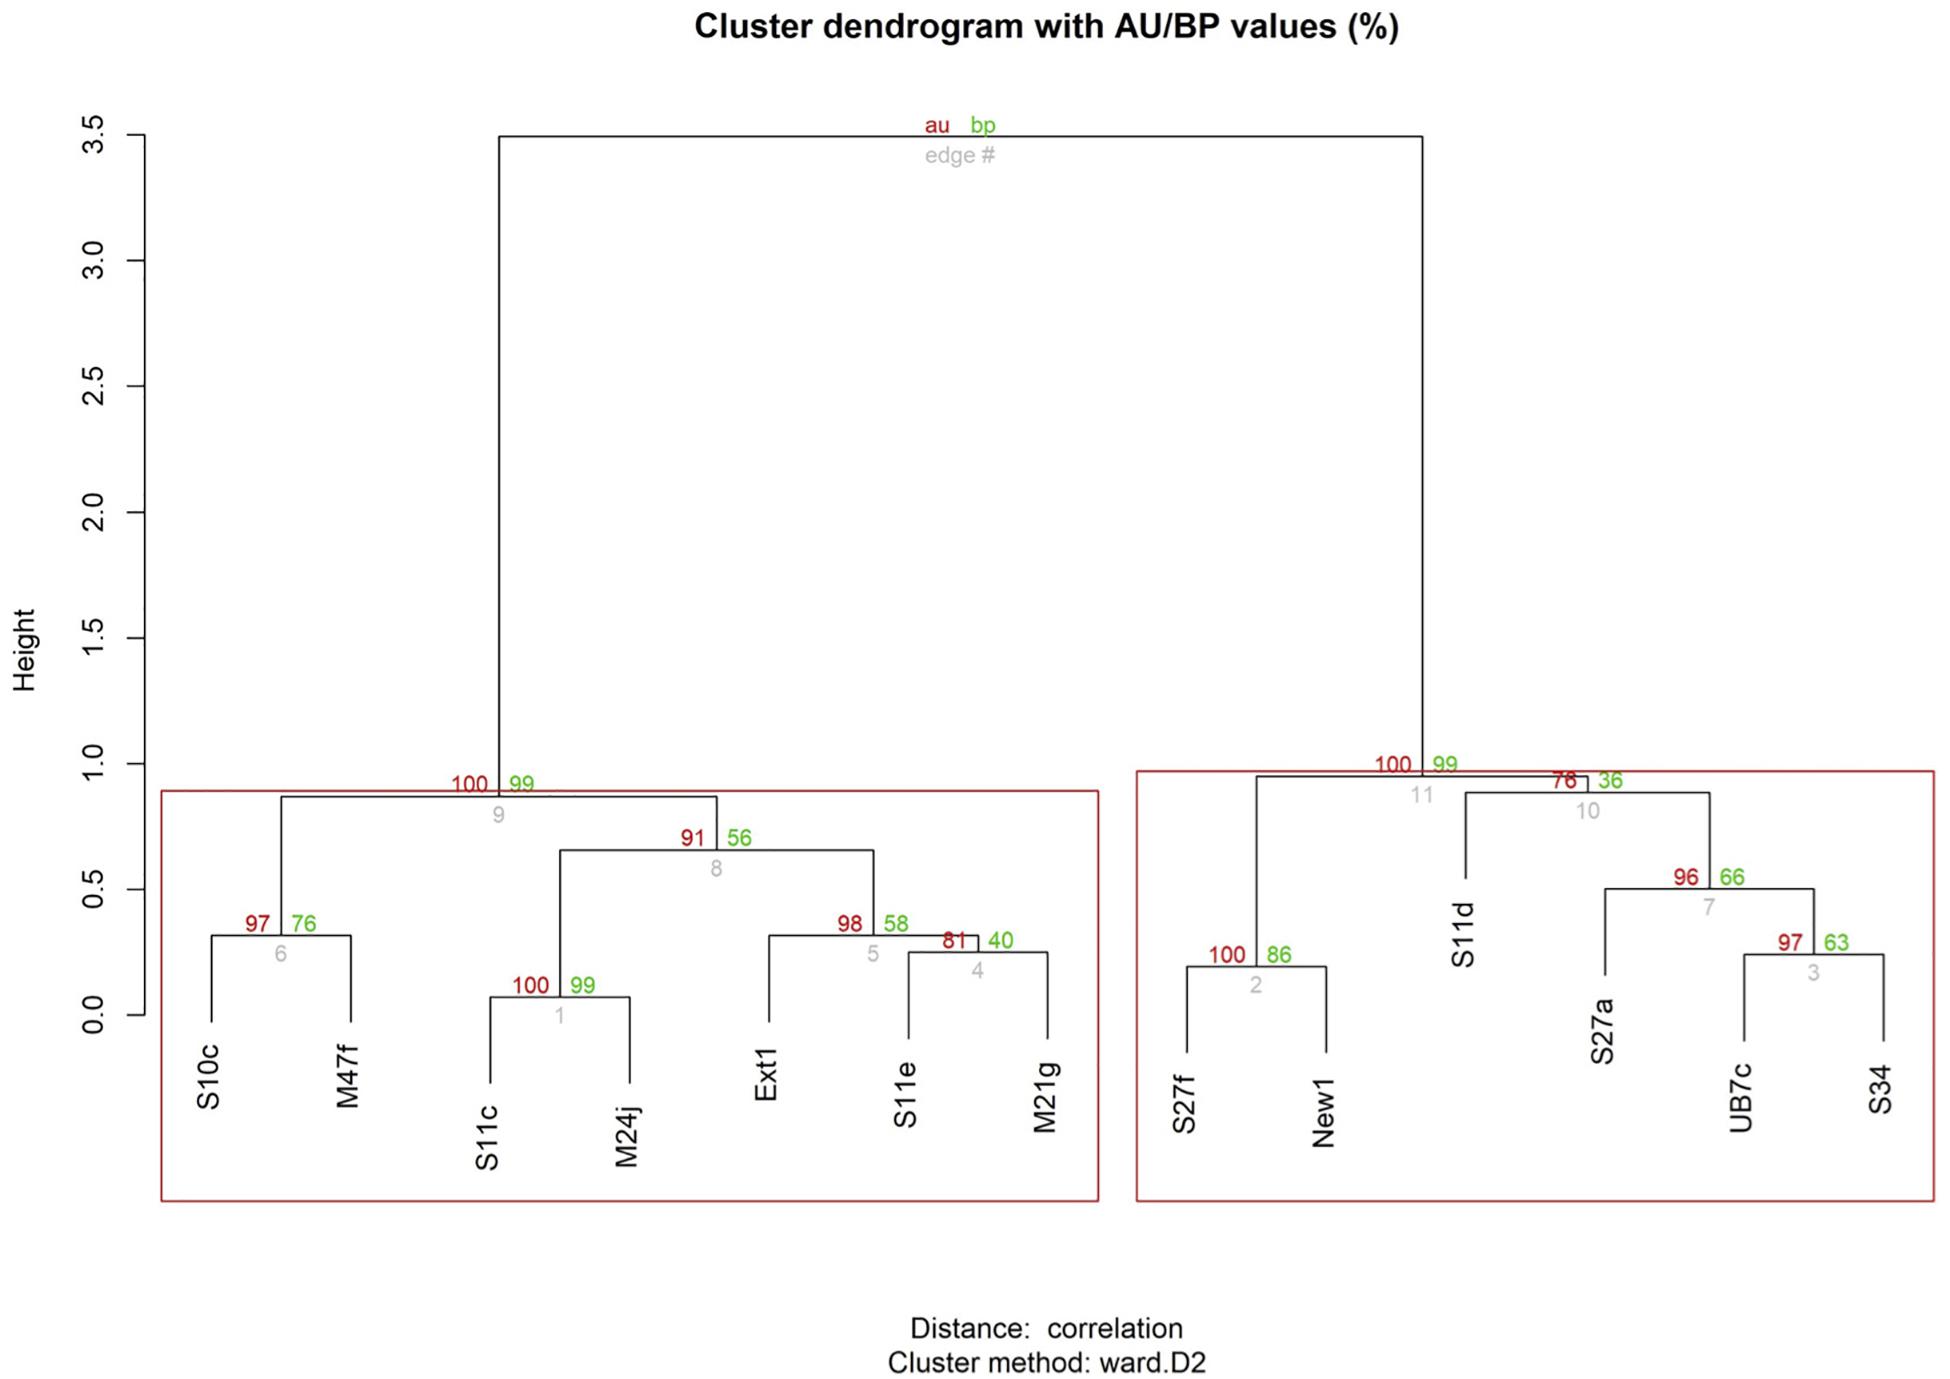
Figure 5. Graphical representation of the results from the Dynamic Time Warping analysis, considering both relative position in the pod and breathing time, across all surveys. Values in red: indicate the Approximately Unbiased (AU) p-value, computed by multiscale bootstrap resampling. Values >95 are strongly supported by data. Clusters with AU larger than 95% (p-value <0.05) are highlighted in red boxes. Values in green: represent bootstrap probability p-values, computed by normal bootstrap resampling. Height: a measure of the relative distance between clusters.
The Mantel test did not show high levels of correlation, indicating a lack of temporal autocorrelation among surveys. The dendrogram based on time series analyses of relative positions, including non-perfect synchrony events, shows two main clusters (indicated by the red boxes). The first cluster (on the left) comprises the same seven individuals that were identified as strongly associated based on synchrony data alone (Figure 3). It equally contains two pairs and one trio, but the composition of the trio has changed: individual Ext1 has moved from pair M47f-S10c to form a trio with pair S11e-M21g. The second cluster (on the right) is equal to the cluster of six less associated individuals identified with synchrony data alone (Figure 3), but now one significantly associated pair and one trio are identified within this cluster, which was not evident based on synchrony data alone.
Discussion
UAV Focal Follows vs. Photo-ID Survey Methodology
The application of a new method for focal group follows in Risso’s dolphins using a UAV appeared to be successful. The relatively small group size (n = 13) in combination with the unique scarification patterns on the dorsal fin, making individuals well recognizable from the air, allowed for solid recordings of social behavior for this pod. Given that this size is more than double the average for stable male pods, the UAV seems to be an adequate tool for measuring social behavior in male Risso’s dolphin pods in general. Per time unit, the number of breathing events and synchs recorded by the UAV was higher than with Photo-ID. Nevertheless, the results of the synchrony analysis based on Photo-ID were very similar, identifying the exact same clusters. This confirms that the use of a UAV does not introduce observation bias relative to Photo-ID, and opens the possibility to extend the findings from UAV-based studies with an analysis of historical Photo-ID data, to study sociality based on synchrony over many years, for this pod and other stable groups.
The Dynamic Time Warping analysis of relative positions, including non-perfect synchrony, could however, only be realized using a UAV. This led to richer insights of the social dynamics within the observed pod: it confirmed the clusters detected through synchrony patterns, but in addition it identified additional clusters (one pair and one trio) within the cluster of less associated individuals. More importantly, it revealed a correlation between measures of sociality and the position in the group. This invites further research based on UAV observations of this and other groups to examine dominance patterns, which would yield new insights into the social structure of male Risso’s dolphin groups. Thus, similar to Torres et al. (2018), we found that UAV-based observations yield more data per time unit than boat-based observations (i.e., Photo ID), but the real added value of UAV-based observations is the ability, in Risso’s dolphins, to perform a focal follow capturing an entire pod and to record the relative position of individuals, something that is not possible using boat-based surveys given the size of Risso’s dolphins male pods (average 5.8; Hartman et al., 2008). Apart from that, an additional advantage of UAV observations is that it allows for keeping a greater distance with the research vessel, thereby reducing engine noise disturbance.
UAV Intrusiveness
A study by Christiansen et al. (2016b) suggests that underwater noise levels caused by a UAV are small. However, when animals surface, which is usually the moment that observations are recorded, as is the case in this study, they will be exposed to in-air UAV noise levels. Many applications of UAVs to marine mammals (e.g., photogrammetry (Durban et al., 2015), collecting blow samples (Apprill et al., 2017), examining body conditions of whales (Christiansen et al., 2016b) involve the use of a UAV at a 90° angle to the surface (directly overhead). At this angle, the distance of the UAV to the animals observed is equal to the altitude, and the impact from the UAV noise is greater compared to lower angles for the same altitude. Indeed, a study on the impact of approaching UAVs to birds (Vas et al., 2015) found that vertical approaches caused stronger reactions than approaches at lower angles. Possibly in view of such findings, research licenses applicable to the use of a UAV increasingly specify a minimum altitude. The licenses applicable to our 2017 research did not prescribe such a minimum altitude. As from 2018 however, a minimum altitude of 20 m has been introduced. In our study, performed in 2017, we did not observe any reaction from the Risso’s dolphins to the UAV even at altitudes as low as 7 m. We assume this is because we always maintained lateral distances of at least 10m, thereby strongly reducing the impact of the UAV noise. However, in order to replicate the study performed, and to continue to be able to identify all animals from the greater distance resulting from an increased minimum altitude, we suggest researchers to use UAV cameras with a zoom function.
Multi-Level Associations
We observed strong variation in measures of sociality within the pod: individual synch rates varied from 4 to 68%. Similarly, some individuals displayed synchronous behavior with only one or two group members, whereas others were observed in synchrony with almost every other individual in the pod. Synchronous behavior was mostly observed in pairs and trios, with frequent switching recorded, leading to 50 unique dyads among the 13 animals in the pod. Out of these, the time series analysis identified four stable pairs and two stable trios, divided over two main clusters. Thus, three different association levels emerged: the pod, containing two main clusters, which in turn comprised the stable pairs and trios.
The analysis of relative position based on UAV observations established that the less associated individuals (Box I in Table 2) were mostly observed in the rear/middle of the pod, and the more strongly associated individuals (Box II in Table 2) in the front/middle. This might be an indication of dominant relationships driving the formation of sub-clusters, as has been described for other species, such as brown capuchins (Cebus apella), where dominant animals chose the positions with greatest expected foraging success (Janson, 1990), white-faced capuchins (C. capucinus), where dominant individuals were observed more in the center/front (Hall and Fedigan, 1997), or vervets (Chlorocebus pygerythrus), where foraging in the front, outer-edge of the group was associated with dominance (Teichroeb et al., 2015).
Although the stability over several years of male Risso’s dolphin pods has been established (Hartman et al., 2008), the function of the different levels of association still needs to be demonstrated in future research to evaluate if these can be identified as distinct levels of alliance formation. This would entail establishing the benefits for individuals, such as access to females, which has been described as the function of the first-, second- and third-order alliances of Indo-pacific bottlenose dolphins (T. aduncus) in Shark Bay, who cooperate in male-male fights and in stealing, harassing or consorting females (Connor and Krützen, 2015). A next step would be to assess to what extent we observe coordinated behavior (such as synchrony) by individuals in relation to these actions. Indicators for the existence of such complex social layers and intra- and inter-group collaboration in Risso’s dolphins have been frequently observed during 20 years of fieldwork in our research site (Karin Hartman, unpublished data; Supplementary Figure S2 shows instances of such specific observed behavior in various male pods).
Our present study gives some clues for the existence of different levels of alliance formation: the observed switching pair/trio formations may indicate that individuals seek to maintain bonds with more than one other individual in the group. This is in line with the prediction that when males are of equal competitive ability, alliances should be dynamic with frequently switching male alliances, to improve their expected reproductive success (Whitehead and Connor, 2005). Even if this study does not yet establish that the identified association levels represent levels of alliance formation, the observed structure is somewhat reminiscent of the bottlenose dolphin “super alliance,” consisting of fourteen animals. Here, individuals frequently changed their association with other individuals (first order alliances consisting of pairs or trios), but always within the group of fourteen (second order alliance) with distinct preferences (Connor et al., 2006; Connor and Krützen, 2015). One striking difference with bottlenose dolphins would be the strength of the association of the pod in Risso’s dolphins, implicating that the individuals are in almost constant association with all other members of the pod, but within that setting have clear preferences and avoidances demonstrated by coordinated swimming.
Drivers of Stable Male Pods
One reason for the existence of relatively large stable male Risso’s dolphin pods might be the deep-sea cephalopod diet of this species, resulting in possible foraging benefits when collaborating in a large group (Hartman et al., 2008, 2015; Hartman, 2018). Although the foraging strategies of Teuthophagous cetacean species are not well understood at present, sperm whales (Physeter macrocephalus) have been observed to dive “lined up,” indicating some form of group collaboration when foraging (Whitehead, 2003), and strong pair-wise synchrony in movement and vocalizations has been described for beaked whales when performing foraging dives (Aguilar de Soto et al., 2020).
In Risso’s dolphins, a remarkable specific behavior called “habitat defense” has been displayed by resident and stable male pods (Hartman et al., 2008). Other cephalopod eating species that are frequently spotted in the research area have been observed being harassed by clusters of collaborating and/or singe pods of male Risso’s dolphins until they left. This specific behavior may also affect the group size of male Risso’s dolphins.
The most obvious driver for large male alliances is to gain access to females through cooperation (De Waal and Harcourt, 1992; Clutton Brock, 2016). In general, the low cost of dolphin locomotion leads to higher encounter rates between males and females. This favors consortships of (oestrus) females by larger male alliances versus a single male, and larger male alliances may serve the defense against competing male pods in the area (Connor and Whitehead, 2005). The intra-alliance bonds might be important now, ensuring that once a female has been “secured,” individuals get a chance to mate. But the large number of individuals present in the cluster also complicates their “intra-group politics,” since only one male will eventually attain reproductive success. In such competition, alliance members would have to fight for access to females. The large testes (3% of the body mass) found in Grampus griseus suggest sperm competition and a promiscuous mating system (Perrin and Reilly, 1984; Connor Richard et al., 2000). The suspicion of dominant relationships leads to the prediction that the less ‘social’ individuals will have less access to females. Conversely, the prediction is that effective cooperation between individuals increases chances of individual reproductive success (Clutton Brock, 2016). Mating success and dominant relationships will therefore be the primary focus of future research, investigating the function of the association levels such as found in this study.
Data Availability Statement
The datasets generated for this study are available on request to the corresponding author.
Ethics Statement
The authors were not affiliated with any academic institution during the research, and the research was not subject to an ethical review process by a review board or an ethics committee of such institution. However, the research was carried out under licenses issued by the relevant authorities (Região Autónoma dos Açores, Direção Regional Do Ambiente) with references 38/2016/DRA and SAI-DRA-2017-2710, authorizing the observation of wild cetaceans by Photo-ID and drone, under applicable laws and regulations.
Author Contributions
KH and PH designed the study, performed the data collection and data scoring. PH provided and operated the UAV. PH and RV performed modeling work and analyzed output data. RV performed the statistical analyses. KH, assisted by PH, wrote the first version of the manuscript, and all authors contributed significantly to revisions.
Funding
This research did not receive any external funding.
Conflict of Interest
RV was employed by the company BioConsult GmbH & Co. KG, but performed his work in his spare time.
The remaining authors declare that the research was conducted in the absence of any commercial or financial relationships that could be construed as a potential conflict of interest.
Acknowledgments
We wish to thank all interns and volunteers who helped during the fieldwork season 2017, especially Mick van Rossum, Nicole Batteke and Kate High. Special thanks to co-UAV pilot Martijn van Schie, and to Zoltan Korai and Nóra Mészáros for working out the graphic design of several figures and the animations in the video abstract. We are grateful for the constructive comments made by (anonymous) reviewers, which helped to improve the article. This research was authorized by the Regional Secretariat of the Sea, Science and Technology, Horta, Faial Island, Azores under license number: 38/2016/DRA, and SAI-DRA-2017-2710.
Video Abstract
A video abstract of this manuscript can be found here.
Supplementary Material
The Supplementary Material for this article can be found online at: https://www.frontiersin.org/articles/10.3389/fmars.2020.00283/full#supplementary-material
Footnotes
- ^ A trio consisting of individuals A, B and C comprises the three dyads AB, AC and BC. A quartet similarly comprises the six dyads AB, AC, AD, BC, BD and CD.
References
Aguilar de Soto, N., Visser, F., Tyack, P. L., Alcazar, J., Ruxton, G., Arranz, P., et al. (2020). Fear of killer whales drives extreme synchrony in deep diving beaked whales. Sci. Rep. 10:13. doi: 10.1038/s41598-019-55911-3
Altmann, J. (1974). Observational study of behavior: sampling methods. Behaviour 49, 227–266. doi: 10.1163/156853974X00534
Apprill, A., Miller, C. A., Moore, M. J., Durban, J. W., Fearnbach, H., and Barrett-Lennard, L. G. (2017). Extensive core microbiome in drone-captured whale blow supports a framework for health monitoring. mSystems 2:e00119-17. doi: 10.1128/mSystems.00119-17
Berndt, D. J., and Clifford, J. (1994). “Using dynamic time warping to find patterns in time series,” in Proceedings of the 3rd International Conference on Knowledge Discovery and Data Mining AAAIWS’94 (Palo Alto, CA: AAAI Press), 359–370.
Bigg, M. A., Olesiuk, P. F., Ellis, G. M., Ford, J. K. B., and Balcomb, K. C. (1990). Social organization and genealogy of resident killer whales (Orcinus orca) in the coastal waters of British Columbia and Washington State. Rep. Int. Whaling Comm. 12, 383–405.
Bonacich, P. (1987). Power and centrality: a family of measures. Am. J. Soc. 92, 1170–1182. doi: 10.1086/228631
Cairns, S. J., and Schwager, S. J. (1987). A comparison of association indices. Anim. Behav. 35, 1454–1469. doi: 10.1016/S0003-3472(87)80018-0
Christiansen, F., Dujon, A. M., Sprogis, K. R., Arnould, J. P. Y., and Bejder, L. (2016a). Noninvasive unmanned aerial vehicle provides estimates of the energetic cost of reproduction in humpback whales. Ecosphere 7:e01468. doi: 10.1002/ecs2.1468
Christiansen, F., Rojano-Doñate, L., Madsen, P. T., and Bejder, L. (2016b). Noise levels of multi-rotor unmanned aerial vehicles with implications for potential underwater impacts on marine mammals. Front. Mar. Sci. 3:277. doi: 10.3389/fmars.2016.00277
Clauset, A., Newman, M. E. J., and Moore, C. (2004). Finding community structure in very large networks. Phys. Rev. E 70:066111. doi: 10.1103/PhysRevE.70.066111
Clutton Brock, T. H. (2016). “Mammal societies,” in Mammal Societies, ed. T. H. Clutton Brock, (Chichester: John Wiley & Son Inc), 373–395.
Connor, R., and Whitehead, H. (2005). Alliances II. Rates of encounter during resource utilization: a general model of intrasexual alliance formation in fission–fusion societies. Anim. Behav. 69, 127–132. doi: 10.1016/j.anbehav.2004.02.022
Connor, R. C., and Krützen, M. (2015). Male dolphin alliances in Shark Bay: changing perspectives in a 30-year study. Anim. Behav. 103, 223–235. doi: 10.1016/j.anbehav.2015.02.019
Connor, R. C., Smolker, R., and Bejder, L. (2006). Synchrony, social behaviour and alliance affiliation in Indian Ocean bottlenose dolphins, Tursiops aduncus. Anim. Behav. 72, 1371–1378. doi: 10.1016/j.anbehav.2006.03.014
Connor Richard, C., Read, A. J., and Wrangham, R. (2000). “Male reproductive strategies and social bonds,” in Cetacean Societies. Field Studies of Dolphins and Whales, eds J. C. Mann, R. C. Connor, P. L. Tyack, and H. Whitehead, (Chicago, MI: The University of Chicago Press), 91–126.
Conradt, L., and Roper, T. J. (2005). Consensus decision making in animals. Trends Ecol. Evol. 20, 449–456. doi: 10.1016/j.tree.2005.05.008
Csárdi, G., and Nepusz, T. (2006). The igraph software package for complex network research. Interj. Comp. Syst. 1695, 1–9.
De Waal, F. B. M., and Harcourt, A. H. (1992). “A history of ethological research,” in Coalitions and Alliances in Humans and Other Animals, eds A. H. Harcourt, and F. B. M. De Waal, (Oxford: Oxford University Press), 445–471.
Domínguez-Sánchez, C. A., Acevedo-Whitehouse, K. A., and Gendron, D. (2018). Effect of drone-based blow sampling on blue whale (Balaenoptera musculus) behavior. Mar. Mamm. Sci. 34, 841–850. doi: 10.1111/mms.12482
Durban, J. W., Fearnbach, H., Barrett-Lennard, L. G., Perryman, W. L., and Leroi, D. J. (2015). Photogrammetry of killer whales using a small hexacopter launched at sea. J. Unmanned Veh. Sys. 3, 131–135. doi: 10.1139/juvs-2015-0020
Farine, D. R., Strandburg-Peshkin, A., Couzin, I. D., Berger-Wolf, T. Y., and Crofoot, M. C. (2017). Individual variation in local interaction rules can explain emergent patterns of spatial organization in wild baboons. Proc. R. Soc. B 284:20162243. doi: 10.1098/rspb.2016.2243
Ferreira, L. N., and Zhao, L. (2016). Time series clustering via community detection in networks. Inform. Sci. 326, 227–242. doi: 10.1016/j.ins.2015.07.046
Giorgino, T. (2009). Computing and visualizing dynamic time warping alignments in R: the dtw Package. J. Stat. 31, 1–24. doi: 10.18637/jss.v031.i07
Hall, C. L., and Fedigan, L. M. (1997). Spatial benefits afforded by high rank in white-faced capuchins. Anim. Behav. 53, 1069–1082. doi: 10.1006/anbe.1996.0392
Hartman, K., Visser, F., and Hendriks, A. (2008). Social structure of Risso’s dolphins (Grampus griseus) at the Azores: a stratified community based on highly associated social units. Can. J. Zool. 86, 294–306. doi: 10.1139/Z07-138
Hartman, K., Wittich, A., Cai, J., van der Meulen, F., and Azevedo, J. (2016). Estimating the age of Risso’s dolphins (Grampus griseus) based on skin appearance. J. Mammal. 97, 490–502. doi: 10.1093/jmammal/gyv193
Hartman, K. L. (2018). “Risso’s dolphin: Grampus griseus,” in Encyclopedia of Marine Mammals, 3rd Edn, eds B. Würsig, J. G. M. Thewissen, and K. M. Kovacs, (Cambridge, MA: Academic Press), 824–827. doi: 10.1016/B978-0-12-804327-1.00219-3
Hartman, K. L., Fernandez, M., Wittich, A., and Azevedo, J. M. N. (2015). Sex differences in residency patterns of Risso’s dolphins (Grampus griseus) in the Azores: causes and management implications. Marine Mamm. Sci. 31, 1153–1167. doi: 10.1111/mms.12209
Herzing, D. L. (2015). Synchronous and rhythmic vocalizations and correlated underwater behavior of free-ranging atlantic spotted dolphins (Stenella frontalis) and bottlenose dolphins (Tursiops truncatus) in the Bahamas. Anim. Behav. Cogn. 2, 14–29. doi: 10.12966/abc.02.02.2015
Janson, C. H. (1990). Ecological consequences of individual spatial choice in foraging groups of brown capuchin monkeys, Cebus apella. Anim. Behav. 40, 922–934. doi: 10.1016/S0003-3472(05)80994-7
Johanesson, T., and Bjornsson, H. (2006). Stineman, a Consistently Well Behaved Method of Interpolation. Available online at: https://cran.r-project.org/web/packages/stinepack/stinepack.pdf (accessed July 30, 2018).
Karnowski, J., Johnson, C., and Hutchins, E. (2016). Automated video surveillance for the study of marine mammal behavior and cognition. Anim. Behav. Cogn. 3, 255–264. doi: 10.12966/abc.05.11.2016
King, A., and Sueur, C. (2011). Where next? Group coordination and collective decision making by primates. Int. J. Primatol. 32, 1245–1267. doi: 10.1007/s10764-011-9526-7
Koh, L. P., and Wich, S. A. (2012). Dawn of drone ecology: low-cost autonomous aerial vehicles for conservation. Trop. Conserv. Sci. 5, 121–132. doi: 10.1177/194008291200500202
Koski, W., Abgrall, P., and Yazvenko, S. (2011). An inventory and evaluation of unmanned aerial systems for offshore surveys of marine mammals. J. Cetacean Res. Manag. 11, 239–247.
Koski, W. R., Gamage, G., Davis, A. R., Mathews, T., LeBlanc, B., and Ferguson, S. H. (2015). Evaluation of UAS for photographic re-identification of bowhead whales, Balaena mysticetus. J. Unmanned Veh. Sys. 3, 22–29. doi: 10.1139/juvs-2014-0014
Krause, J. (1994). Differential fitness returns in relation to spatial position in groups. Biol. Rev. Camb. Philos. Soc. 69, 187–206. doi: 10.1111/j.1469-185x.1994.tb01505.x
Lewis, J. S., Wartzok, D., and Heithaus, M. R. (2011). Highly dynamic fission–fusion species can exhibit leadership when traveling. Behav. Ecol. Sociobiol. 65, 1061–1069.
Mann, J. (1999). Behavioral sampling methods for cetaceans: a review and critique. Mar. Mamm. Sci. 15, 102–122. doi: 10.1111/j.1748-7692.1999.tb00784.x
Mann, J., and Smuts, B. (1999). Behavioral development of wild bottlenose dolphin newborns. Behaviour 136, 529–566. doi: 10.1163/156853999501469
Mantel, N. (1967). The detection of disease clustering and a generalized regression approach. Cancer Res. 27, 209–220. doi: 10.1158/0008-5472.CAN-16-0883
Martin, P., and Bateson, P. (2007). Measuring Behaviour: An Introductory Guide. Cambridge: Cambridge University Press, doi: 10.1017/CBO9780511810893
McCue, L. M., Cioffi, W. R., Heithaus, M. R., Barrè, L., and Connor, R. C. (2020). Synchrony, leadership, and association in male Indo-pacific bottlenose dolphins (Tursiops aduncus). Ethology 1–10. doi: 10.1111/eth.13025
Montero, P., and Vilar, J. A. (2014). TSclust: an R package for time series clustering. J. Stat. 62, 1–43. doi: 10.18637/jss.v062.i01
Murtagh, F., and Legendre, P. (2014). Ward’s hierarchical agglomerative clustering method: which algorithms implement Ward’s criterion? J. Classif. 31, 274–295. doi: 10.1007/s00357-014-9161-z
Oksanen, J., Blanchet, F. G., Kindt, R., Legendre, P., Minchin, P. R., O’Hara, R. B., et al. (2016). Vegan: Community Ecology Package. Available online at: https://cran.r-project.org/web/packages/vegan/vegan.pdf (accessed September 1, 2019).
Perrin, W. F., and Reilly, S. B. (1984). Reproductive parameters of dolphins and small whales of the family Deiphinidae. Rep. Intern. Whal. Comm. 6, 97–125.
Peterson, R. O., Jacobs, A. K., Drummer, T. D., Mech, L. D., and Smith, D. W. (2002). Leadership behavior in relation to dominance and reproductive status in gray wolves. Canis lupus. Can. J. Zool. 80:14051412. doi: 10.1139/Z02-124
R core team (2018). R: A Language and Environment for Statistical Computing. Vienna, Austria: R Foundation for Statistical Computing. Available online at: http://www.R-project.org
Sakai, M., Morisaka, T., Kogi, K., Hishii, T., and Kohshima, S. (2010). Fine-scale analysis of synchronous breathing in wild Indo-Pacific bottlenose dolphins (Tursiops aduncus). Behav. Process. 83, 48–53. doi: 10.1016/j.beproc.2009.10.001
Sardá-Espinosa, A. (2019). Comparing Time-series Clustering Algorithms in R using the Dtwclust Package. Available online at: https://cran.r-project.org/web/packages/dtwclust/vignettes/dtwclust.pdf (accessed February 1, 2020).
Shane, S. H. (1990). “Behavior and ecology of the bottlenose dolphin at Sanibel Island Florida,” in The Bottlenose Dolphin, eds S. Leatherwood, and R. R. Reeves, (New York, NY: Academic Press).
Shimodaira, H. (2004). Approximately unbiased tests of regions using multistep-multiscale bootstrap resampling. Ann. Stat. 32, 2616–2641. doi: 10.1214/009053604000000823
Smith, J. E., Gavrilets, S., Mulder, M. B., Hooper, P. L., Mouden, C. E., Nettle, D., et al. (2016). Leadership in mammalian societies: emergence, distribution, power, and payoff. Trends Ecol. Evol. 31, 54–66. doi: 10.1016/j.tree.2015.09.013
Smolker, R. A., Richards, A. F., Connor, R. C., and Pepper, J. W. (1992). Sex differences in patterns of association among Indian Ocean bottlenose dolphins. Behaviour 123, 38–69. doi: 10.1163/156853992X00101
Spiegel, M. R., and Stephens, L. J. (2008). Schaum’s Outlines Statistics, 4th Edn. New York, NY: McGraw Hill.
Suzuki, R., and Shimodaira, H. (2015). PVclust: Hierarchical Clustering with p-values via Multiscale Bootstrap Resampling. Available online at: https://cran.r-project.org/web/packages/pvclust/pvclust.pdf (accessed November 19, 2019).
Teichroeb, J. A., White, M. M. J., and Chapman, C. A. (2015). Vervet (Chlorocebus pygerythrus) intragroup spatial positioning: dominants trade-off predation risk for increased food acquisition. Int. J. Primatol. 36, 154–176. doi: 10.1007/s10764-015-9818-4
Torres, L. G., Nieukirk, S. L., Lemos, L., and Chandler, T. E. (2018). Drone up! Quantifying whale behavior from a new perspective improves observational capacity. Front. Mar. Sci. 5:319. doi: 10.3389/fmars.2018.00319
van Andel, A. C., Wich, S. A., Boesch, C., Koh, L. P., Robbins, M. M., Kelly, J., et al. (2015). Locating chimpanzee nests and identifying fruiting trees with an unmanned aerial vehicle. Am. J. Primatol. 77, 1122–1134. doi: 10.1002/ajp.22446
Vas, E., Lescroël, A., Duriez, O., Boguszewski, G., and Grémillet, D. (2015). Approaching birds with drones: first experiments and ethical guidelines. Biol. Lett. 11:20140754. doi: 10.1098/rsbl.2014.0754
Visser, F., Hartman, K. L., Rood, E. J. J., Hendriks, A. J. E., Zult, D. B., Wolff, W. J., et al. (2011). Risso’s dolphins alter daily resting pattern in response to whale watching at the Azores. Mar. Mamm. Sci. 27, 366–381. doi: 10.1111/j.1748-7692.2010.00398.x
Whitehead, H., and Connor, R. (2005). Alliances I. How large should alliances be? Anim. Behav. 69, 117–126. doi: 10.1016/j.anbehav.2004.02.021
Wich, S., Dellatore, D., Houghton, M., Ardi, R., and Koh, L. P. (2016). A preliminary assessment of using conservation drones for Sumatran orang-utan (Pongo abelii) distribution and density. J. Unmanned Veh. Sys. 4, 45–52. doi: 10.1139/juvs-2015-0015
Keywords: UAV, focal group follow, Risso’s dolphins, male associations, synchrony, relative position, dynamic time warping, levels of association
Citation: Hartman K, van der Harst P and Vilela R (2020) Continuous Focal Group Follows Operated by a Drone Enable Analysis of the Relation Between Sociality and Position in a Group of Male Risso’s Dolphins (Grampus griseus). Front. Mar. Sci. 7:283. doi: 10.3389/fmars.2020.00283
Received: 07 February 2020; Accepted: 07 April 2020;
Published: 08 May 2020.
Edited by:
Lars Bejder, University of Hawai‘i at Mānoa, United StatesReviewed by:
Denise Lore Herzing, Florida Atlantic University, United StatesKate R. Sprogis, Murdoch University, Australia
Copyright © 2020 Hartman, van der Harst and Vilela. This is an open-access article distributed under the terms of the Creative Commons Attribution License (CC BY). The use, distribution or reproduction in other forums is permitted, provided the original author(s) and the copyright owner(s) are credited and that the original publication in this journal is cited, in accordance with accepted academic practice. No use, distribution or reproduction is permitted which does not comply with these terms.
*Correspondence: Karin Hartman, oceanwatch@gmail.com