Influence of Storm Events on Chlorophyll Distribution Along the Oligotrophic Continental Shelf Off South-Western Australia
 Miaoju Chen
 Charitha B. Pattiaratchi
 Anas Ghadouani
 Christine Hanson
- 1Oceans Graduate School and The UWA Oceans Institute, The University of Western Australia, Perth, WA, Australia
- 2Department of Civil, Environmental and Mining Engineering, School of Engineering and The UWA Oceans Institute, The University of Western Australia, Perth, WA, Australia
- 3John Forrest Secondary College, WA Department of Education Morley, WA, Australia
The role of storm events in controlling chlorophyll distribution along the oligotrophic Rottnest continental shelf is examined data collected by autonomous ocean gliders combined with meteorological data. Spatial and temporal distribution of chlorophyll concentrations were obtained from a repeated transect across the shallow continental shelf that revealed complex relationships among wind events (e.g., differences in wind speed and direction) and chlorophyll concentrations. Data indicated that the water column responded rapidly to changes in wind speeds alternating between stratification, de-stratification and vice-versa over 1–3 days. Under low wind conditions (wind speeds < 7 ms–1), the water column was stratified and dense shelf water cascades (DSWC) was the dominant feature. The majority of DSWC events were associated with synchronous increases in chlorophyll and suspended sediment, often close to the seabed. During storm events (wind speeds > 15 ms–1) higher chlorophyll values were present throughout the vertically mixed water column. Maximum chlorophyll concentrations, more than double that due to climatology, were observed 1–3 days after the passage of storms subsequent to sediment re-suspension. Storm events, with an onshore component, promoted downwelling, the water column retained vertical stratification, and DSWC was present across the shelf. Here, DSWC intensified with higher chlorophyll in the cascaded water extending further offshore. It is concluded that wind speed and direction are the dominant parameters controlling the distribution of chlorophyll particularly during storm events.
Introduction
The coastal ocean is a dynamic region that accounts for a disproportionate amount of global ocean production relative to their surface area, mainly due to the combined fluxes of nutrient supply from different sources (e.g., from terrestrial, open ocean and local regeneration). The coastal ocean also accounts for 20–35% of ocean primary production even though they only account for 8% of the ocean surface area (Walsh, 1991; Lemay et al., 2018). Due to a range of spatial and temporal scales of physical forcing, coastal oceans experience much higher variability at diel, seasonal, and inter-annual scales than the open oceans. In regions of low tidal forcing episodic local atmospheric forcing drives a range of complex physical processes in the coastal ocean. Variations in wind speed and direction have been shown to affect local hydrodynamics and water column distribution of nutrients and phytoplankton biomass (Liu et al., 2013; Martellucci et al., 2018; Kotta and Kitsiou, 2019). Strong wind events (e.g., storms with wind speeds > 15 ms–1) have been found to induce vertical mixing as winds change in direction and strength (Klinck, 1996; Glenn et al., 2008; Ulses et al., 2008). Storms can also cause resuspension of detritus, sediments and other materials, likely due to wave shear stress (Fanning et al., 1982; Gardner et al., 2001; Pusceddu et al., 2005; Yang et al., 2007; Verspecht and Pattiaratchi, 2010). Shropshire et al. (2016) concluded that in coastal regions, physical response to storms generally include a decrease in sea surface temperature due to heat loss and vertical mixing across the thermocline (Price, 1981), transient upwelling induced by Ekman pumping (Bueti et al., 2014), and a near inertial response (Jacob et al., 2000; Mihanović et al., 2016). A recent study by Schultze et al. (2020) indicated that during the storm Bertha passage in the North Sea increased the vertical fluxes promoting an increase in the surface layer Chlorophyll. Due to adverse conditions experienced during storm activity, field measurements of the influence of wind on the distribution of water properties during and subsequent to storm activity are scarce.
Primary drivers of phytoplankton variability in many coastal and shelf waters are the seasonal (or mean over weeks and months) changes in the vertical stability of the water column and the availability of nutrients and light. Superimposed on this seasonal pattern is an additional layer of shorter time and space scale variability that results from the dynamic interaction of phytoplankton with a range of physical processes. These features include tidal variability (i.e., spring/neap cycles), storms, frontal features, coastal upwelling, advection of offshore water masses and the influence of coastal and oceanic currents (O’Boyle and Silke, 2010). Limited studies have focused on the importance of transient events such as storm activity on phytoplankton dynamics (e.g., Claustre et al., 1994; Blauw et al., 2018; Ferreira Cordeiro et al., 2018; Schultze et al., 2020) and not many have considered an oligotrophic environment that is dominated by wind effects and strong vertical stratification/destratification. Short time and space scale physical processes, for example storm events can drive non-linear phenomena which decouple biological trophic interactions. Such decoupling may lead to transient states in which the phytoplankton can show unusually high primary production rates, leading to an amplification of phytoplankton patchiness. The temporal scale of these winds events is of the order of days and sampling on these scales is required to document physical processes and their impact on phytoplankton communities. Phytoplankton community structure in coastal regions has been shown to change rapidly in response to water column stability (Moline, 1998; Sharples et al., 2001; O’Boyle and Silke, 2010), nutrient (Pinckney et al., 1999), and light availability (Schofield et al., 1993). At global scales, Freitas et al. (2016) revealed the complex connection between optical properties and environmental conditions. They suggested that surface waves control suspended sediment in both inner and mid-shelves; and enhancement of phytoplankton abundance was associated with horizontal advection and upwelling events on episodic time scales.
Many studies have shown that storms are able to increase coastal productivity after the passage of the storm (Shiah et al., 2000; Babin et al., 2004; Chen et al., 2017). For example, Hurricane Washi increased the chlorophyll concentration in the coastal water off Hainan island by 20% (Zhang et al., 2014) with the largest increase in coastal waters compared to those offshore (Chen et al., 2017). The importance of both wind speed and direction on the spatial distribution of phytoplankton in the coastal waters to adjacent to Hong Kong was demonstrated by Yin et al. (2004). Here, a change in wind direction resulted in the coastal plume being trapped inside the estuary and simultaneous vertically mixing of the water column leading to a bloom. When the winds changed direction, the plume extended into the coastal region and the bloom dissipated (Yin et al., 2004).
Few studies have investigated the role of storm events in influencing phytoplankton distribution in dynamic coastal regions through direct measurements. This is primarily due to paucity of observational data due to adverse weather conditions when traditional shipborne measurements are not possible. Majority of the oceanographic and biological data from coastal regions are restricted in both space and time and are thus not suitable to examine chlorophyll variability at shorter time scales. Satellite remote sensing techniques are also limited through the presence of clouds during the storms and are also restricted to the surface layers. To overcome these shortcomings in observing the coastal ocean to strong wind forcing over time scales of order (days) the use of autonomous ocean gliders provides a viable alternative platform.
The main objective of this paper is to examine the variability in chlorophyll fluorescence (a proxy for phytoplankton biomass) in response to different wind events using a multi-year (2009–2016) ocean glider dataset collected along a single transect along the Rottnest continental shelf, off south-west Australia (Figure 1). Simultaneous acquisition of physical (temperature, salinity) and bio-optical (chlorophyll fluorescence, particle backscatter) data with the ocean glider allowed for a detailed view into the linkages between chlorophyll fluorescence, particle backscatter and meteorological forcing.
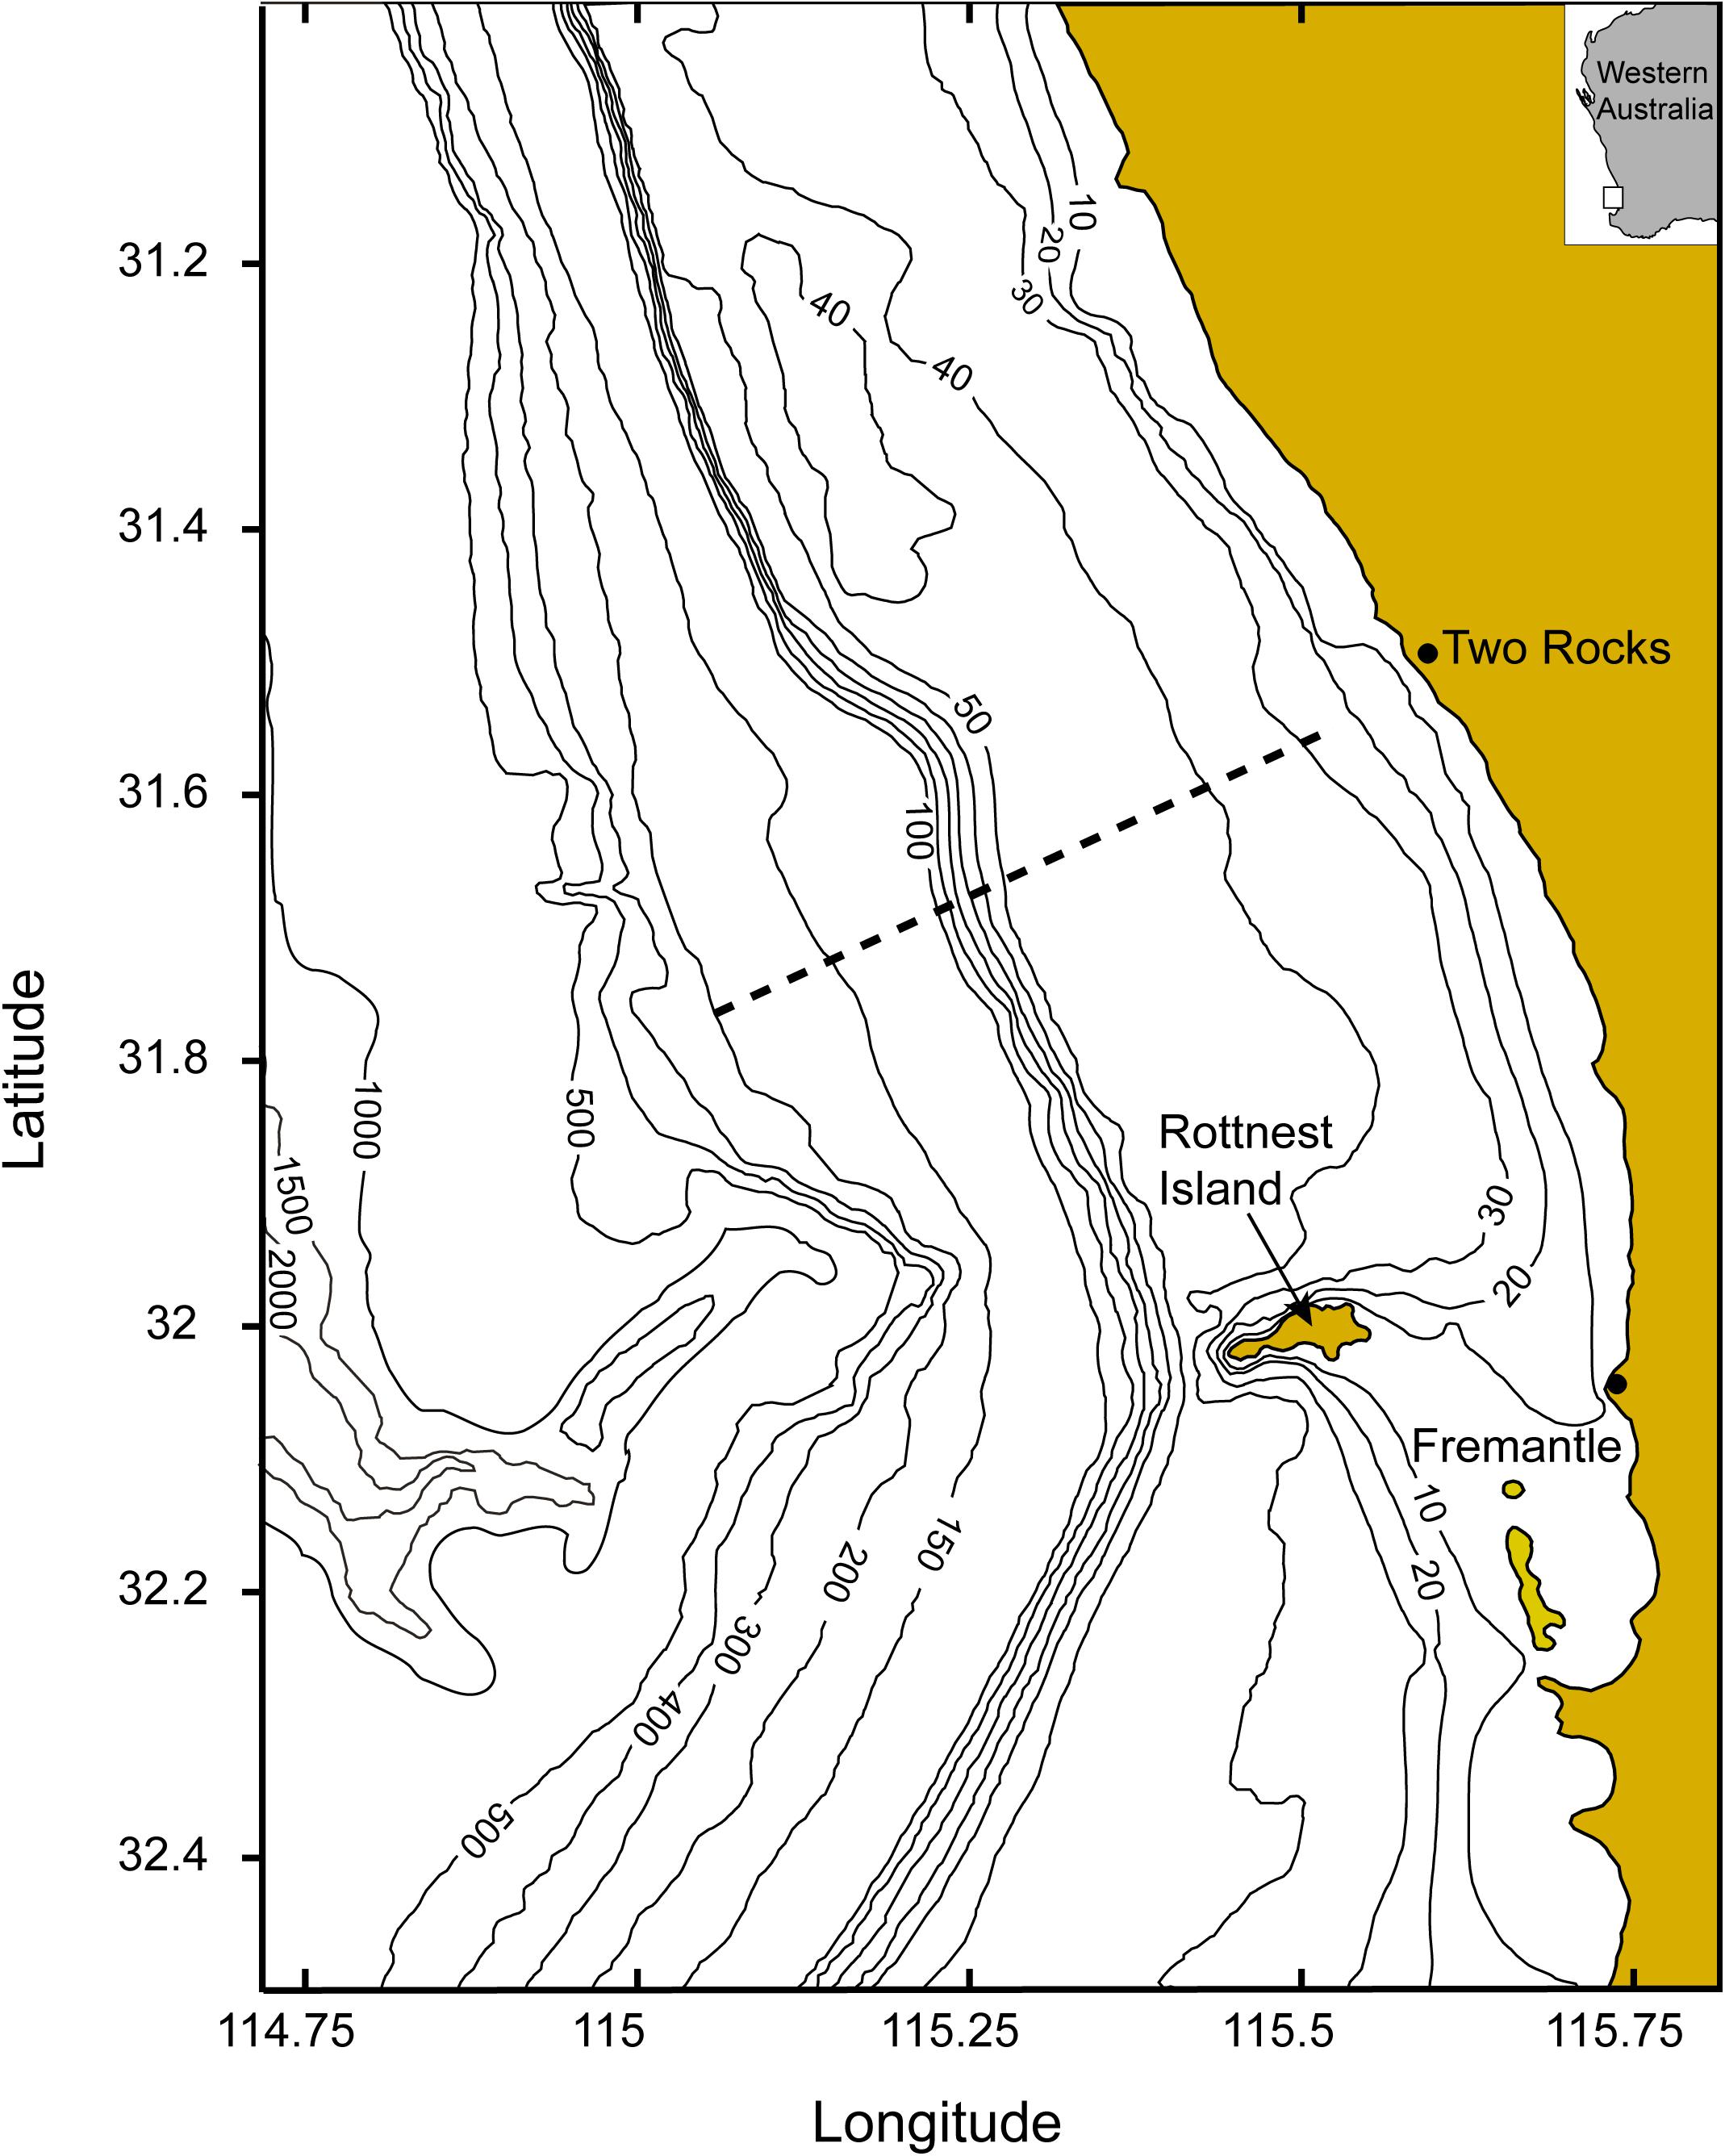
Figure 1. Location of the study area and the glider transect. Bathymetric contours are in meters.
This paper is arranged as follows: Section “Study site” describes the study region with methodology describing data collection and analysis described in Section “Materials and Methods.” Results and discussions are outlined in “Results” and Section “Discussion.” The conclusions are presented in Section “Conclusion.”
Study Site
Continental shelf processes off south-western Australia are mainly wind driven as tidal forcing is minimal with diurnal tides with range <0.6 m (Pattiaratchi and Eliot, 2008). As a result wind action dominate the physical processes that contribute to circulation, vertical mixing and particulate resuspension. Three wind systems dominate this region (Pattiaratchi et al., 1997; Verspecht and Pattiaratchi, 2010; Gallop et al., 2012; Mihanović et al., 2016): sea breezes; storms (wind speeds > 15 ms–1), and calm periods (wind speeds < 5 ms–1).
Local sea breezes superimposed upon synoptic southerly (meteorological convention) winds, with maximum speeds often >15 ms–1, are prevalent in austral spring and summer (September–February) (Verspecht and Pattiaratchi, 2010). The unusually strong alongshore sea breeze results from the interaction of the local sea breeze generated due to the synoptic pressure system and the land–sea temperature gradient and promote strong vertical mixing and surface currents (Pattiaratchi et al., 1997; Gallop et al., 2012). During a typical sea breeze day, the wind speed in the morning is usually low (5 ms–1) and directed offshore (easterly). The wind direction then typically changes to south/south-westerly around late morning/early afternoon, and steadily increases to speeds 10–15 ms–1. The maximum wind speed is generally reached by the late afternoon/early evening (Verspecht and Pattiaratchi, 2010; Mihanović et al., 2016). The sea breeze induced diurnal forcing coincides with the local inertial period (both ∼ 24 h). This forcing combination leads to a resonance effect that results in the vertical penetration of wind action, in generating currents and vertical mixing to much larger depths (>300 m) than those estimated by the local Ekman depth (Mihanović et al., 2016).
Storm systems are most frequent during winter (June–August), associated with the passage of frontal systems with maximum wind speeds > 25 ms–1. Winter storms have a typical pattern with strong north/north-westerly winds blowing for 12–52 h, followed by a period of similar duration when winds turn south/south-westerly. Maximum wind speeds are from the north-west. Summer storms have southerly winds over a period of 3–4 days that are enhanced by the sea breeze system in the afternoon. Calm wind conditions are mainly observed during autumn and winter (March-August; between winter storm fronts) and are characterized by low wind speeds (<5 ms–1).
Coastal waters off south-western Australia are influenced by the Leeuwin and Capes Currents (Pattiaratchi and Woo, 2009). Estern boundary currents consist of equatorward surface flow accompanied by large-scale upwelling (Andrews and Hutchings, 1980; Bakun, 1990; Nykjaer and Van Camp, 1994; Montecino and Lange, 2009). Off the west coast of Australia, poleward flow of the Leeuwin Current (LC) generally suppresses upwelling along the shelf break and outer shelf of Western Australia coast (Cresswell and Golding, 1980; Weaver and Middleton, 1989; Woo and Pattiaratchi, 2008). The LC flows strongest during the austral autumn/winter (April-September) when the opposing southerly winds and sea breezes are weakest (Smith et al., 1991; Pattiaratchi and Woo, 2009; Wijeratne et al., 2018). The LC is characterized by low chlorophyll concentrations (<0.5 mgm–3) with phytoplankton restricted to deep chlorophyll maximum layers near the nitracline (Hanson et al., 2007), nutrient levels that are close or below detection levels, lower salinity, <35.0 (Pearce et al., 2000), and low productivity, <500 mg Cm–2d–1 (Koslow et al., 2008). The Capes Current (CC), a seasonal inner shelf wind-driven current, flows northward inshore of the LC during summer months (Pearce and Pattiaratchi, 1999; Gersbach et al., 1999).
Two major physical processes influence the water column of the Rottnest continental shelf: (1) DSWC - dense shelf water cascades during autumn and winter months (Pattiaratchi et al., 2011; Mahjabin et al., 2019a, b); and, (2) strong sea breezes during the summer months that result in a well mixed water column in water depths < 50 m. Sporadic upwelling may also occurs during the summer months (Gersbach et al., 1999; Hanson et al., 2005; Rossi et al., 2013).
As a consequence of high rates of evaporation and strong surface cooling during both autumn and winter months, denser water, compared to that further offshore is present along the inner continental shelf (Pattiaratchi et al., 2011; Mahjabin et al., 2019a, b). This cross-shelf density gradient drives a gravitational circulation with offshore transport of denser water along the sea bed that is defined as Dense Shelf Water Cascade (DSWC). Recent field measurements and numerical model studies have shown that DSWCs are a regular occurrence during austral autumn and winter (Pattiaratchi et al., 2011). Although both wind speed and direction were controlling parameters for the presence DSWC, the horizontal density gradient was the dominant driving force of DSWC. Mahjabin et al. (2019b) showed that the water column responded almost instantaneously to wind forcing acting to inhibit DSWC formation through vertical mixing and enhance DSWC under onshore wind (downwelling) conditions. In particular, DSWC was enhanced during the passage of cold fronts with strong onshore winds that caused downwelling, resulting in onshore movement of surface water and offshore movement in the bottom layer, enhancing the cascade. Vertical mixing of the water column and shutdown of the DSWC occurred when the winds were strong and consisted of an offshore component and/or were upwelling favorable that resulted in advection of higher density water offshore at the surface resulting in vertical mixing (Mahjabin et al., 2019a, b). Pattiaratchi et al. (2017) indicated that spatial chlorophyll distributions closely matched with seawater density patterns, transporting coastal waters along the seabed from the continental shelf to the open sea.
The seasonal cycle of chlorophyll is characterized by a bloom late autumn (Figure 2) with maxima (1.12 mgm–3) in May and lowest values (0.36 mgm–3) in February (late summer). This contrasts with the ‘spring’ bloom in observed globally. This late fall-early winter bloom is a distinct feature of the region over the continental shelf with a north-south extent ∼1000 km (Pattiaratchi et al., 1990; Koslow et al., 2008; Chen et al., 2019). In comparison to other eastern ocean boundary systems, the study region is highly oligotrophic. Shipborne measurements (Twomey et al., 2007) of nutrients in the upper 50 m indicated that nitrate concentrations were close to the detection limit of the instruments (<0.1 μM). The maximum-recorded nitrate value was 0.28 μM. Surface concentrations of phosphate, nitrite and ammonia were also <0.1 μM whilst silicate values were relatively high at >2.0 μM (Twomey et al., 2007). The phytoplankton biomass was dominated by the <5 μm fraction accounting for >80% of primary production (Koslow et al., 2008). The phytoplankton species are dominated by diatoms throughout the year (Kuret, 2011). However, during late fall-early winter bloom, dinoflagellates can make up 25% of the total biomass.
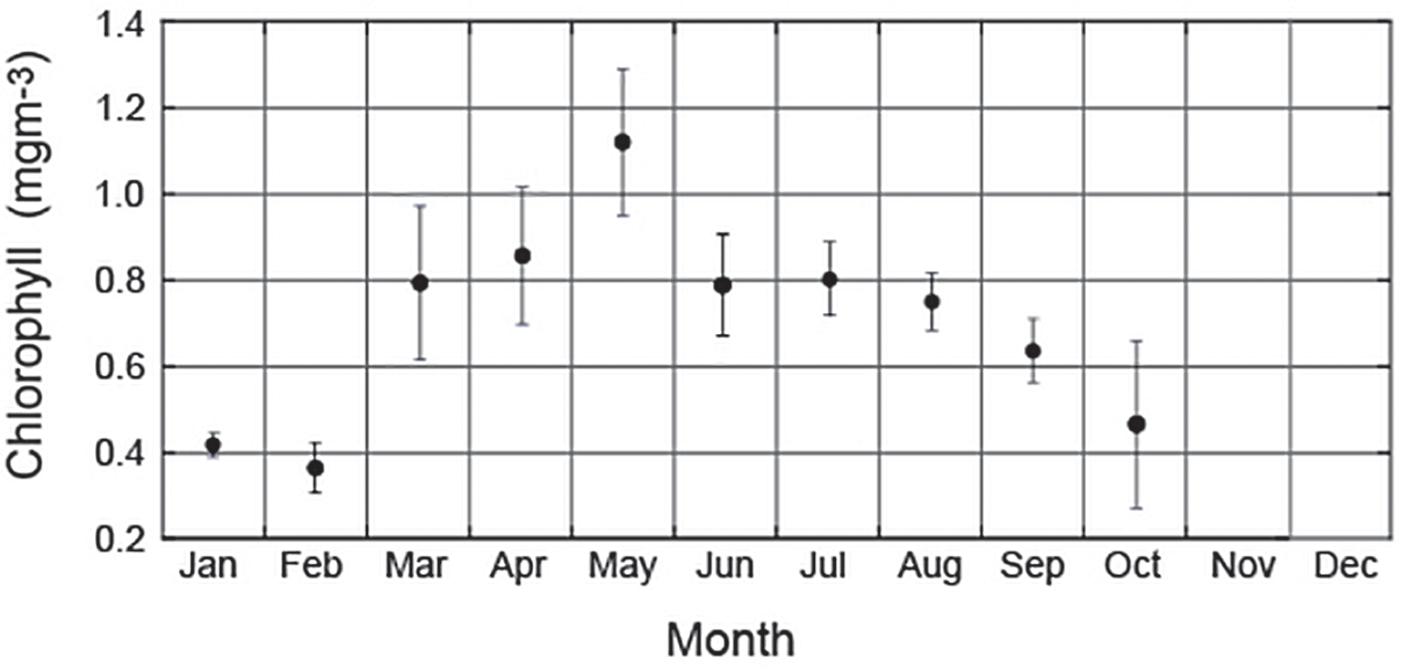
Figure 2. Time series of monthly mean chlorophyll concentration along the Rottnest continental shelf derived using ocean glider data. Vertical bars represent standard deviation. Note that there were insufficient data for November and December.
Materials and Methods
Ocean Gliders
Teledyne Webb Research Slocum Electric G2 Gliders (Teledyne Webb Research) operated by the Integrated Marine Observing System (IMOS) facility for ocean gliders (Pattiaratchi et al., 2017) have been deployed on the Rottnest continental shelf along the Two Rocks transect (Figure 1) since 2009. For this study, five ocean glider deployments spanning different years and seasons were selected from more than 50 glider missions and 250 cross-shelf transects (Table 1): (1) 14–24 March 2009; (2) 19–25 May 2009; (3) 25 January–14 February 2010; (4) 17–30 September 2011; (5) 8–24 March 2015; and, (6) 15–26 May 2016. All the ocean glider data are available through the Australian Ocean Data Network.1 Each deployment included 2–6 repeated transects along the same glider path, with ∼0.5 million individual sampling points obtained for each variable. Transects corresponded to three main wind conditions: (1) calm winds; (2) sea breezes that contain a strong diurnal variability; and, (3) winter and summer storms. Time series of these repeated glider vertical sections were used to examine the changes in the cross-shelf physical (temperature, salinity) and bio-optical (chlorophyll fluorescence, particle backscatter) in response to wind forcing over periods of O(days).
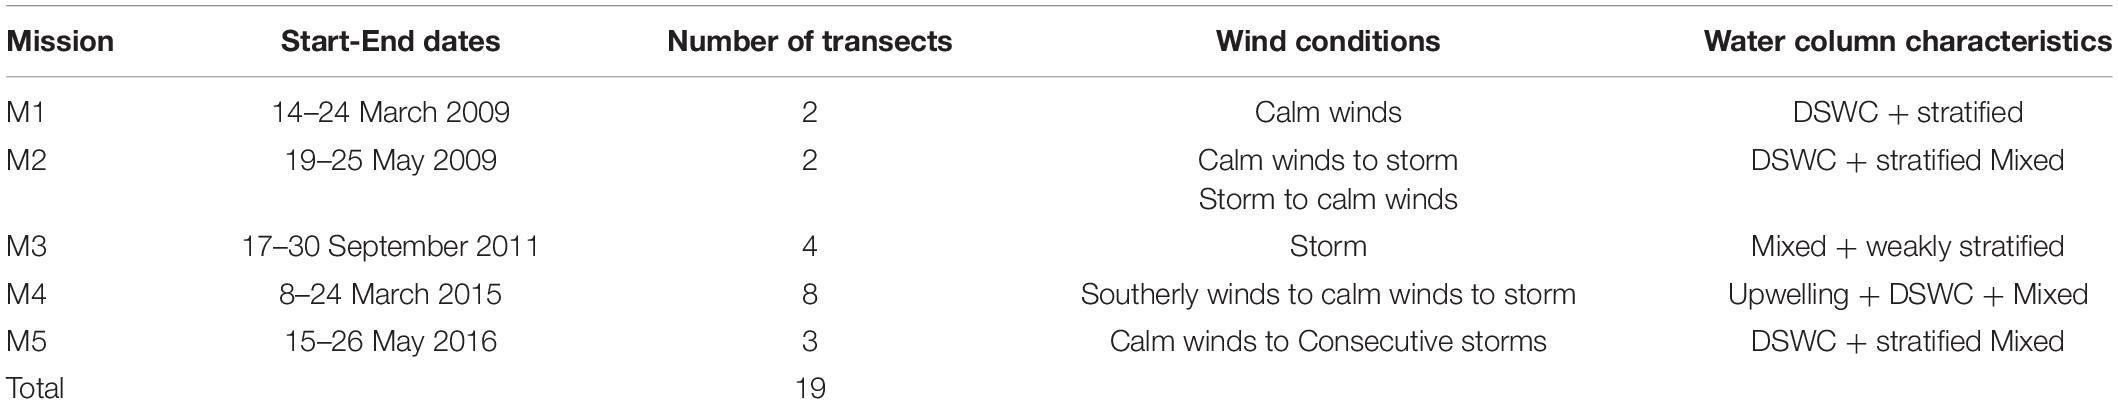
Table 1. Overview of glider missions.
The Slocum gliders traversed the Two Rocks transect with a mean horizontal velocity of ∼25 km day-1 (∼0.25 ms-1) with each transect being completed in 1–3 days. The scientific payload contained a pumped Seabird-CTD (conductivity-temperature-depth) sensor, WETLabs BBFL2SLO 3 parameter optical sensor (measuring chlorophyll fluorescence, colored dissolved organic matter and 660 nm backscatter) and an Aanderaa Oxygen optode. The sensors were sampled at 4 Hz (yielding measurements approximately every 7 cm in the vertical). The actual vehicle trajectory was transposed onto the Two Rocks transect as a straight line (Pattiaratchi et al., 2011).
After the recovery of the ocean glider, all the data collected by the glider were subject to QA/QC procedures that include a series of automated and manual tests (Woo, 2017). To maintain data integrity, all of the sensors (CTD and optical sensors) are returned to the manufacturers for calibration after a period 365 days in the water. For details on QA/QC procedures applied to the WETLabs BBFL2SLO 3 Eco Puck sensor data (chlorophyll fluorescence and 660 nm backscatter) are described in Chen et al. (2019). The measurement of chlorophyll through fluorometers is influenced by quenching (i.e., the reduction in the fluorescence during daylight hours). In this study no correction for quenching (e.g., Sackmann et al., 2008) was applied to chlorophyll fluorescence although effects of quenching could be detected along the transect depths <40 m.
The purpose of this paper is to examine the response of the chlorophyll concentration on the continental shelf to different wind forcing ranging from calm to stormy conditions. In the local study region, there are no major river inputs and thus the suspended material in the water column is derived from the action of waves on the seabed (Verspecht and Pattiaratchi, 2010). The backscatter signal recorded by the ocean glider can thus be considered as resuspension of suspended matter that may contain both organic and inorganic material. Oceanographers usually use a temperature/salinity diagram to identify water masses. In preliminary analysis of the data many combinations of the ocean glider data were used to identify a parameter that represented changes to chlorophyll concentration with time. It was found that a backscatter/chlorophyll scatterplot, that also included the depth, provided a good representation of the changes in response to changes in wind forcing. We also examined the ratio between chlorophyll fluorescence and backscatter along the cross-shelf transects. The ratio was dominated by backscatter, particularly after storm events the cross-shelf distribution of the ratio was almost identical to the backscatter distribution and hence the results are not shown here.
Meteorology and Ocean Color Satellite Images
Wind data over the study period were obtained from an Automatic Weather Station (AWS) operated by the Australian Bureau of Meteorology at Rottnest Island (Figure 1). Wind speed and direction were recorded every 30 min and were averaged to create hourly values. Storm statistics for the period 2009–2016 that covered the glider deployments were determined using the definitions proposed by Fujii and Yamanaka (2008) where a storm event is defined as when the wind speed was >2σ from a 30-day running mean (σ is the standard deviation). In a similar manner a ‘calm’ period was defined as when the wind speed was <2σ from a 30-day running mean.
Satellite derived ocean color imagery were sourced from the IMOS data portal.2 The IMOS ocean color data includes a 1 km daily product for the Australian region using the global algorithms for the estimate of surface chlorophyll. Cloud-free data corresponding to glider deployments were selected determine the surface spatial patterns.
Results
Over the study period, the three main wind regimes were identified: (1) calm winds (<5 ms–1), strong winds associated with the passage frontal systems in winter with wind speeds > 15 ms–1 with wind direction changing anti-clockwise from north to west to south-west; and, (2) summer storms with wind speeds > 15 ms–1 blowing over 2–3 days from the south. These winds are upwelling favorable. These wind conditions corresponded to distinct water column conditions: (1) vertical stratification and the presence of DSWC; (2) vertical mixing of the inner continental shelf; and, (3) upwelling at the shelf break and vertically mixed conditions on the inner continental shelf. Satellite imagery of chlorophyll indicated the synoptic surface patterns during and between these wind events, whilst the high-resolution ocean glider data allowed fine scale subsurface observations of the cross-shelf structure of temperature, salinity and optical properties (chlorophyll and backscatter). Here, the inner continental shelf region is defined from the coastline (0 km) to 25 km distance (depth < 40m), the shelf break region is located between 25 and 28 km distance from the coastline, and the offshore region is defined as offshore from 28 km.
Analysis of wind data from the Rottnest Island station over the 7 years period 2009–2016 (period of ocean glider measurements) to examine the occurrence of storm events (Fujii and Yamanaka, 2008) indicated that the mean number of storms per year was 42 (range: 39–50) whilst 40 and 25% of the storms occurred during winter and summer months, respectively. Similarly, the mean number of calm periods per year was 47 (range: 36–54) with the majority occurring during autumn and winter months. Each storm event lasted between 3 and 5 days.
Low Wind Conditions
During the month of March 2009, wind speeds rarely exceeded 10 ms–1 (Figure 3a). Calm wind conditions were experienced over the period 14–25 March 2009 during the glider deployment (Figure 3a). During the first transect (14–16 March 2009) low wind speeds between 2 and 7 ms–1 were experienced with variable direction. The winds were ∼10 ms–1 between 17 and 21 March 2009 with the initial direction changing from north to south. During the period 21–24 March 2009, the wind speeds were ∼5 ms–1 from southerly/south-westerly direction.
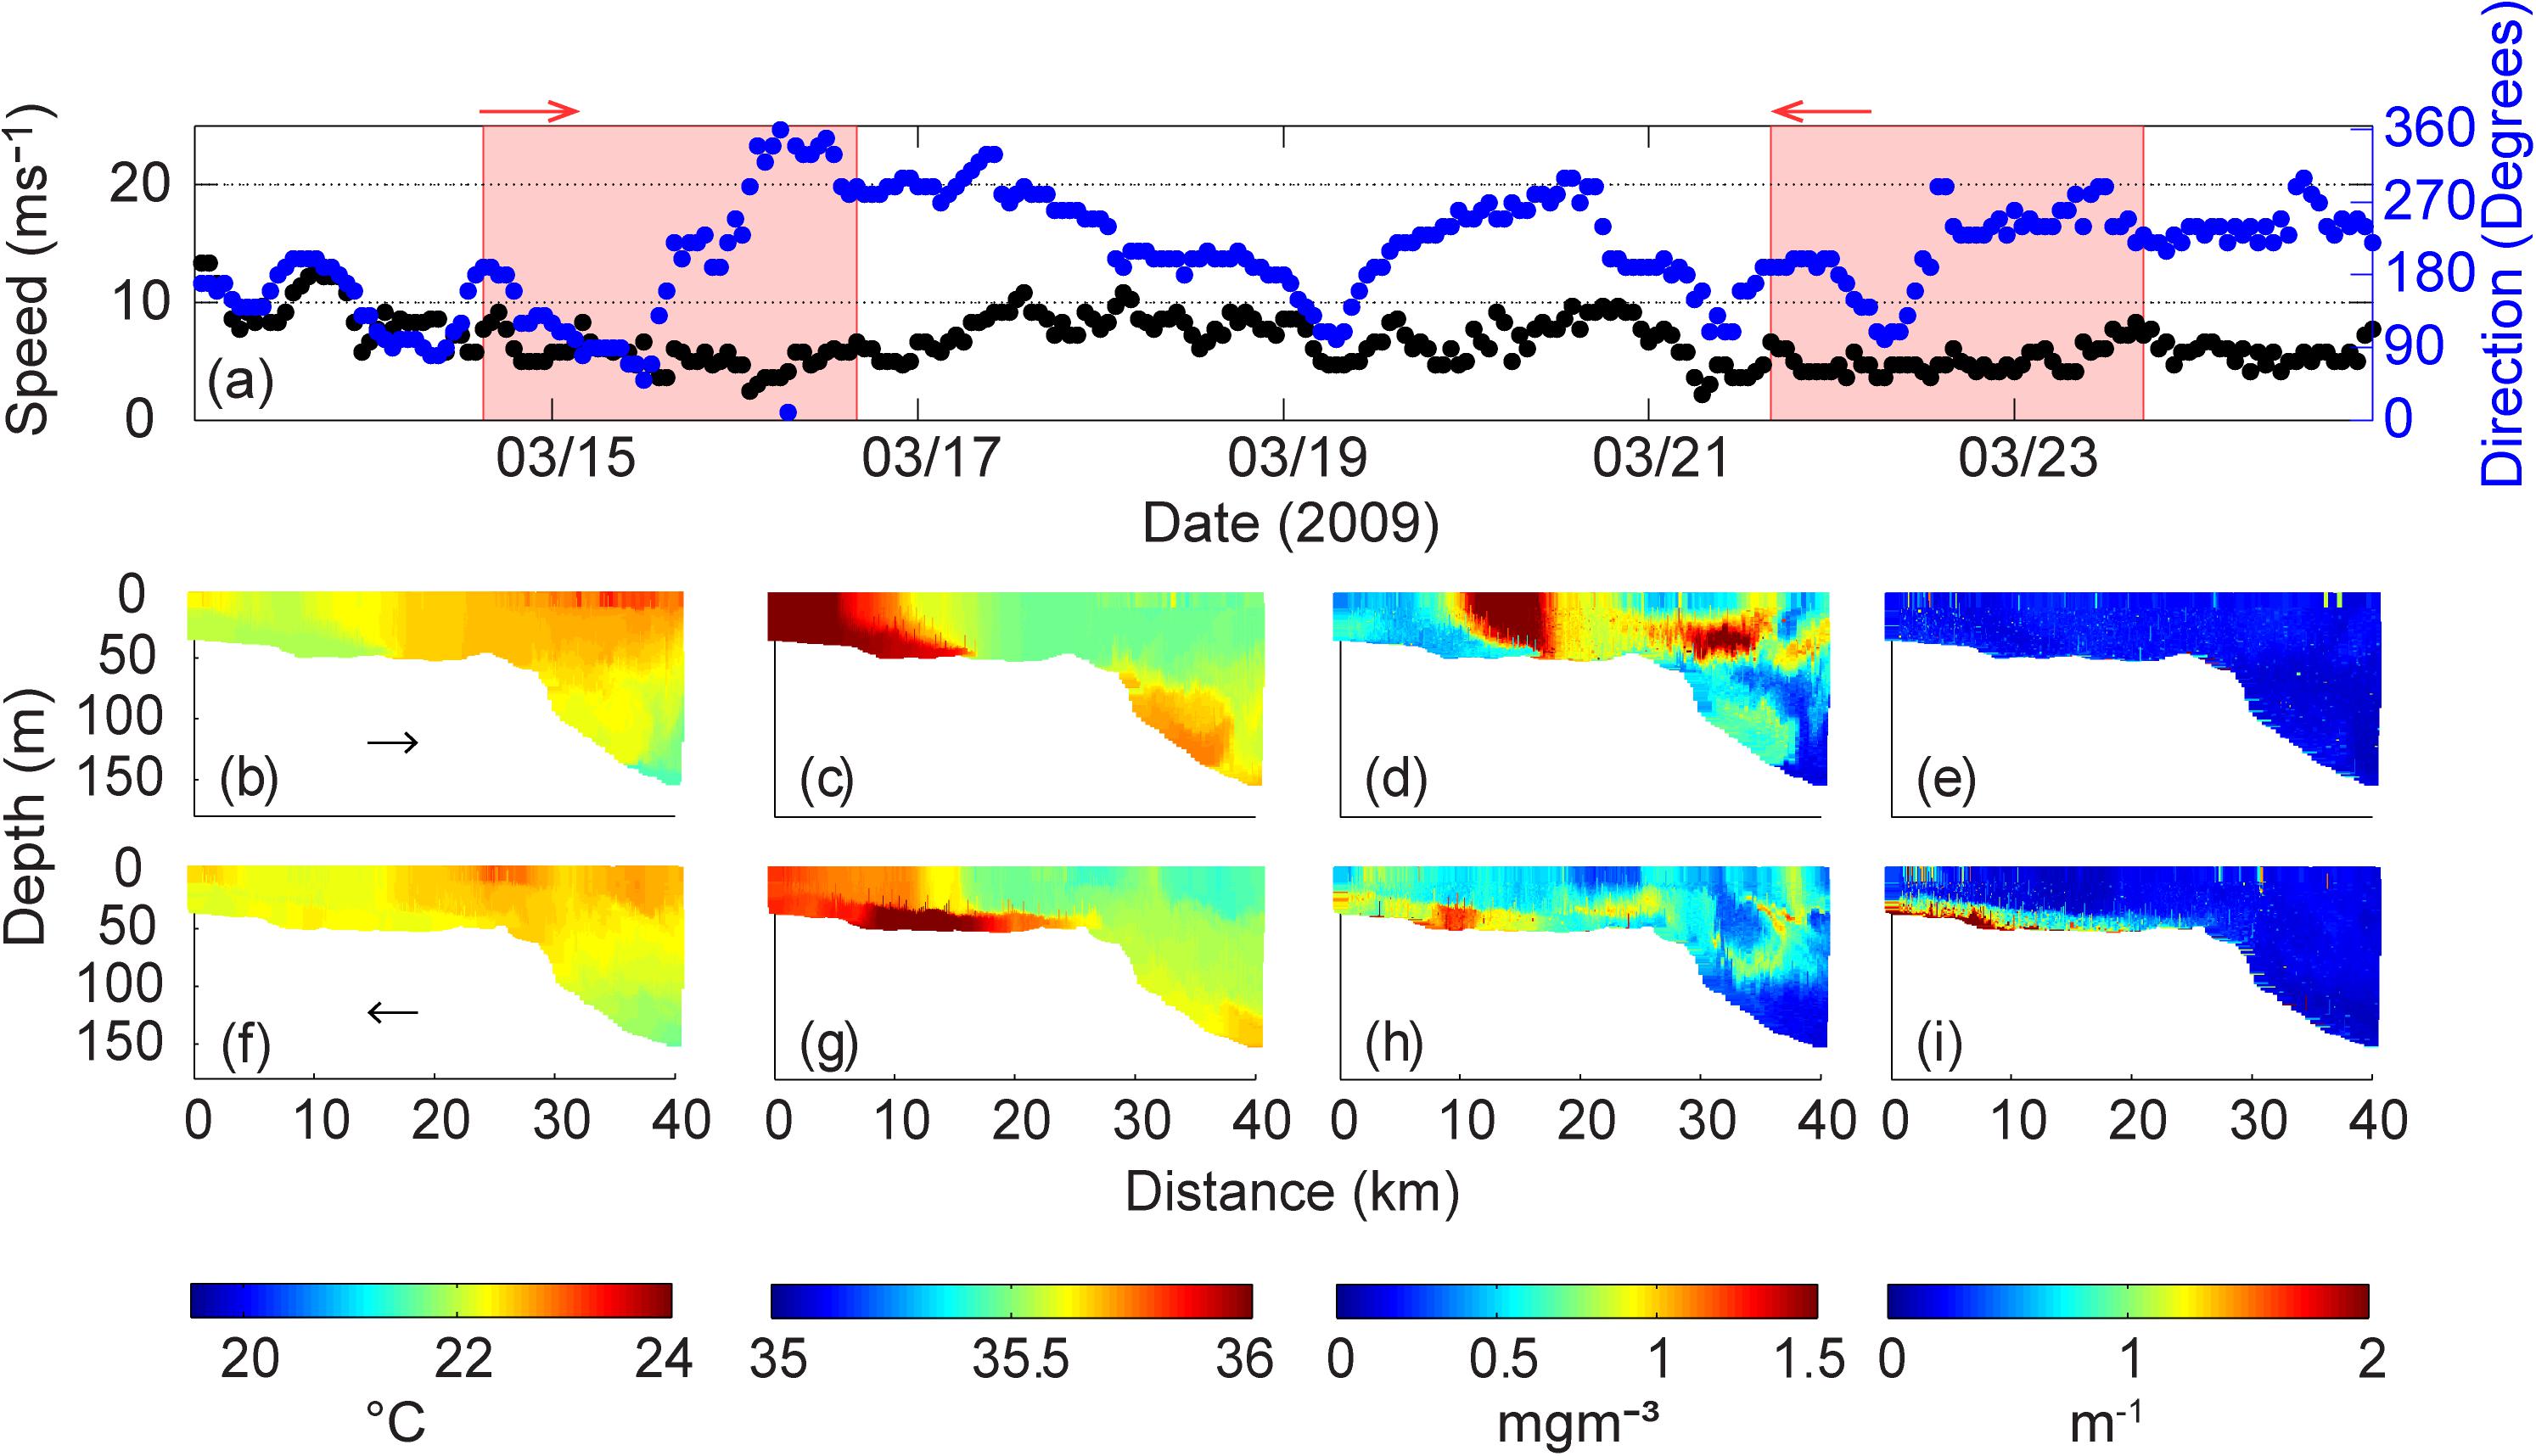
Figure 3. (a) Wind speed and direction at Rottnest Island during 14–23 March 2009. The shaded areas represent the period of ocean glider transect; Ocean glider vertical cross-sections of (b) temperature (°C); (c) salinity; (d) chlorophyll (mg m–3); and (e) backscatter (m–1) across the Rottnest continental shelf during 14–16 March 2009. (f–i) Water properties during 21–23 March 2009. The direction of the glider path is indicated by the arrow.
Under the low wind speed conditions the presence and evolution of a DSWC was observed in the distribution of temperature, salinity, chlorophyll and backscatter (Figures 3b–i). During the period 14–16 March 2009 (Figures 3b–e), cooler (22°C) and saline (36) waters relative to those offshore were present on the inner-shelf region (0–8 km distance from the coast). Cooler more saline water on the inner shelf resulted in a cross-shelf density gradient that was responsible for driving the DSWC. The DSWC extended across the shelf, along the seabed to 16 km and coincided with low wind speeds, 2–7 ms–1 (Figure 3a). The inner shelf waters contained very low chlorophyll levels, however, at the frontal region of the DSWC, where strong horizontal gradients in temperature and salinity were present, a distinct region of high chlorophyll (up to 1.5 mgm–3) was found throughout the water column but delimited by the salinity gradient (Figure 3d). Offshore, a subsurface chlorophyll maximum (SCM) was located at 20–40 m depth. The backscatter was uniformly low (0.3 × 10⁻³ m–1) across the whole transect.
In the intervening 4-day period prior to the next transect (17 and 21 March 2009), winds were ∼10 ms–1 and contributed to vertical mixing of the inshore waters (21–23 March 2009; Figures 3f–i). Higher salinity DSWC had extended to 30 km distance from the coastline and frontal feature was partially eroded (Figures 3c,g). Lower surface chlorophyll values were seen across the entire glider transect, although a layer of higher chlorophyll (up to 1.2 mgm–3) was found adjacent to the seabed from the coastline to 16 km offshore coinciding with the higher salinity water (Figure 3h). Backscatter showed a similar pattern to the chlorophyll, with higher values (>2 × 10⁻³ m–1) observed in the near-bottom higher salinity/chlorophyll waters (Figures 3h,i).
Backscatter/chlorophyll diagram highlighted the changes in chlorophyll distribution between the two transects (Figure 4). Initially (14–16 March 2009) the backscatter was generally low (<10–3 m–1) with chlorophyll concentrations ranging between 0.4 and 2 mgm–3 and was confined mainly to the in the surface waters (within the top 15 m). In the second transect, subsequent to the vertical mixing the backscatter values increased to 4 × 10⁻³ m–1 and the chlorophyll concentration decreased (<1.2 mgm–3). However, chlorophyll concentrations were distributed in the deeper waters. It appears that the higher surface chlorophyll present in the first transect associated with low backscatter was vertically mixed. Thus, the chlorophyll in the surface layer was re-distributed, subsequent to the storm, to the bottom layer (DSWC) and was associated with higher backscatter (Figure 4).
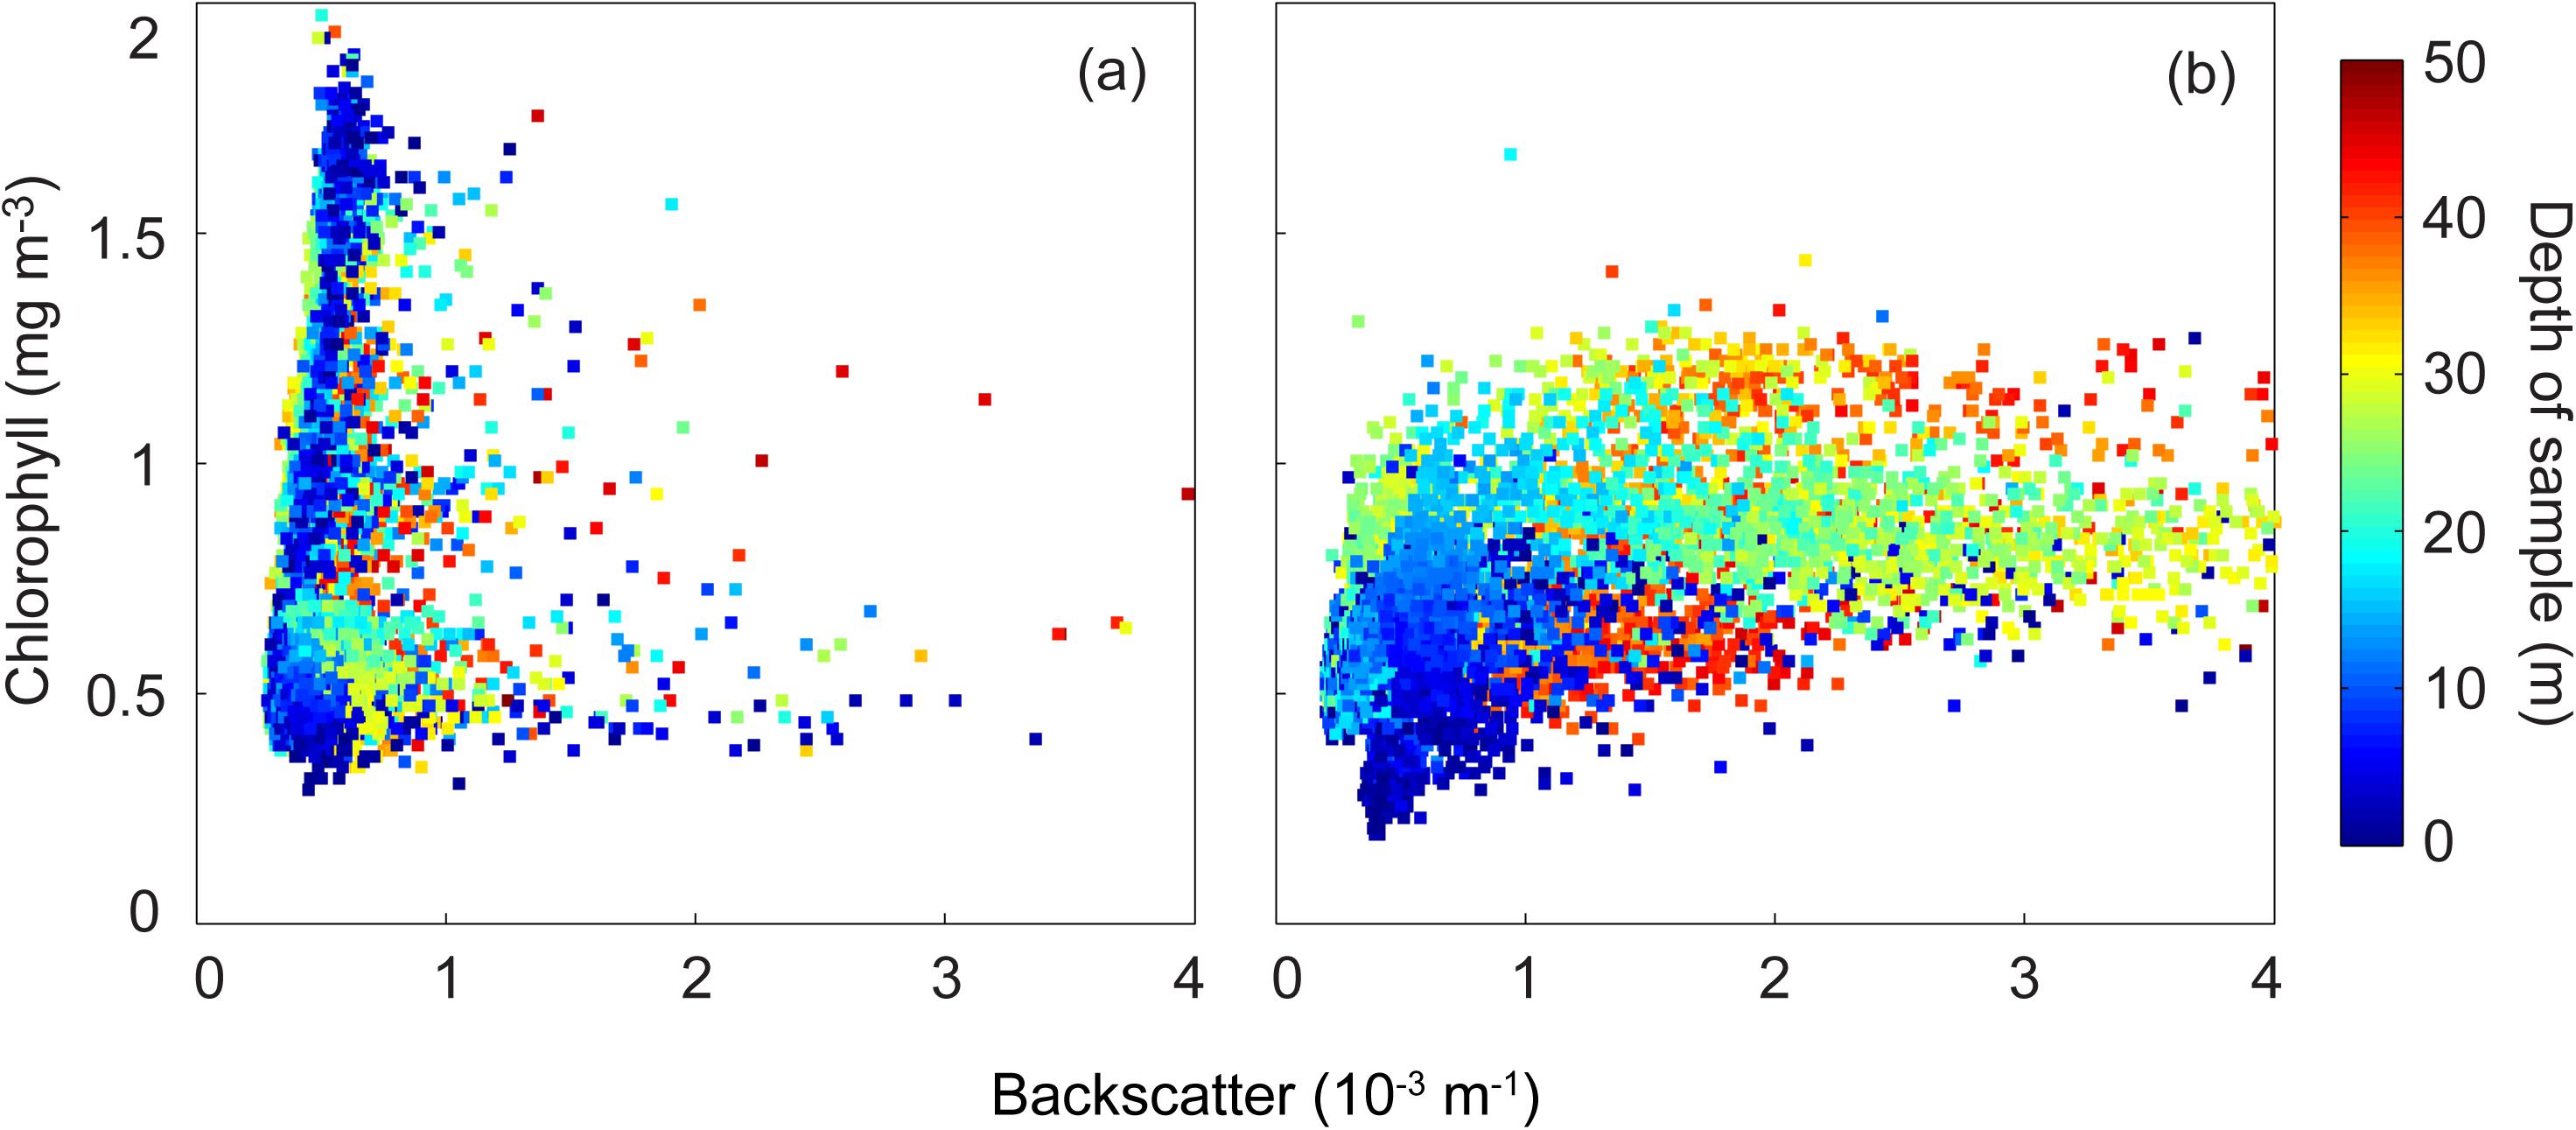
Figure 4. Backscatter (m–1) and chlorophyll (mg m–3) scatter plot. (a) 14–16 March 2009; and (b) 21–23 March 2009.
The two transects highlighted the influence of wind speed and direction on the water properties. Both transects indicated the presence of DSWC. However, the distribution of chlorophyll was very different between the two transects. Initially there was high chlorophyll in a frontal region but subsequent to a weak wind event, the frontal feature was partially eroded. In the second transect the higher chlorophyll (and backscatter) was associated with the DSWC.
Storms and Calm Winds
Over the period 16–30 September 2011, two storm events occurred with corresponding water column data captured along the Two Rocks transect by the ocean glider (Figure 5). The first storm event occurred from 17 to 19 September 2011 (max wind speed to 20 ms–1; Figure 5a), and the second event occurred from 26 to 28 September 2011 (max wind speed to 18 ms–1). Calm periods (<7 ms–1) followed each storm on 22–25 September 2011 and 28–30 September 2011, respectively. Thus, during the ocean glider deployment in September 2011, a repeated sequence of a storm followed by a calm period was captured.
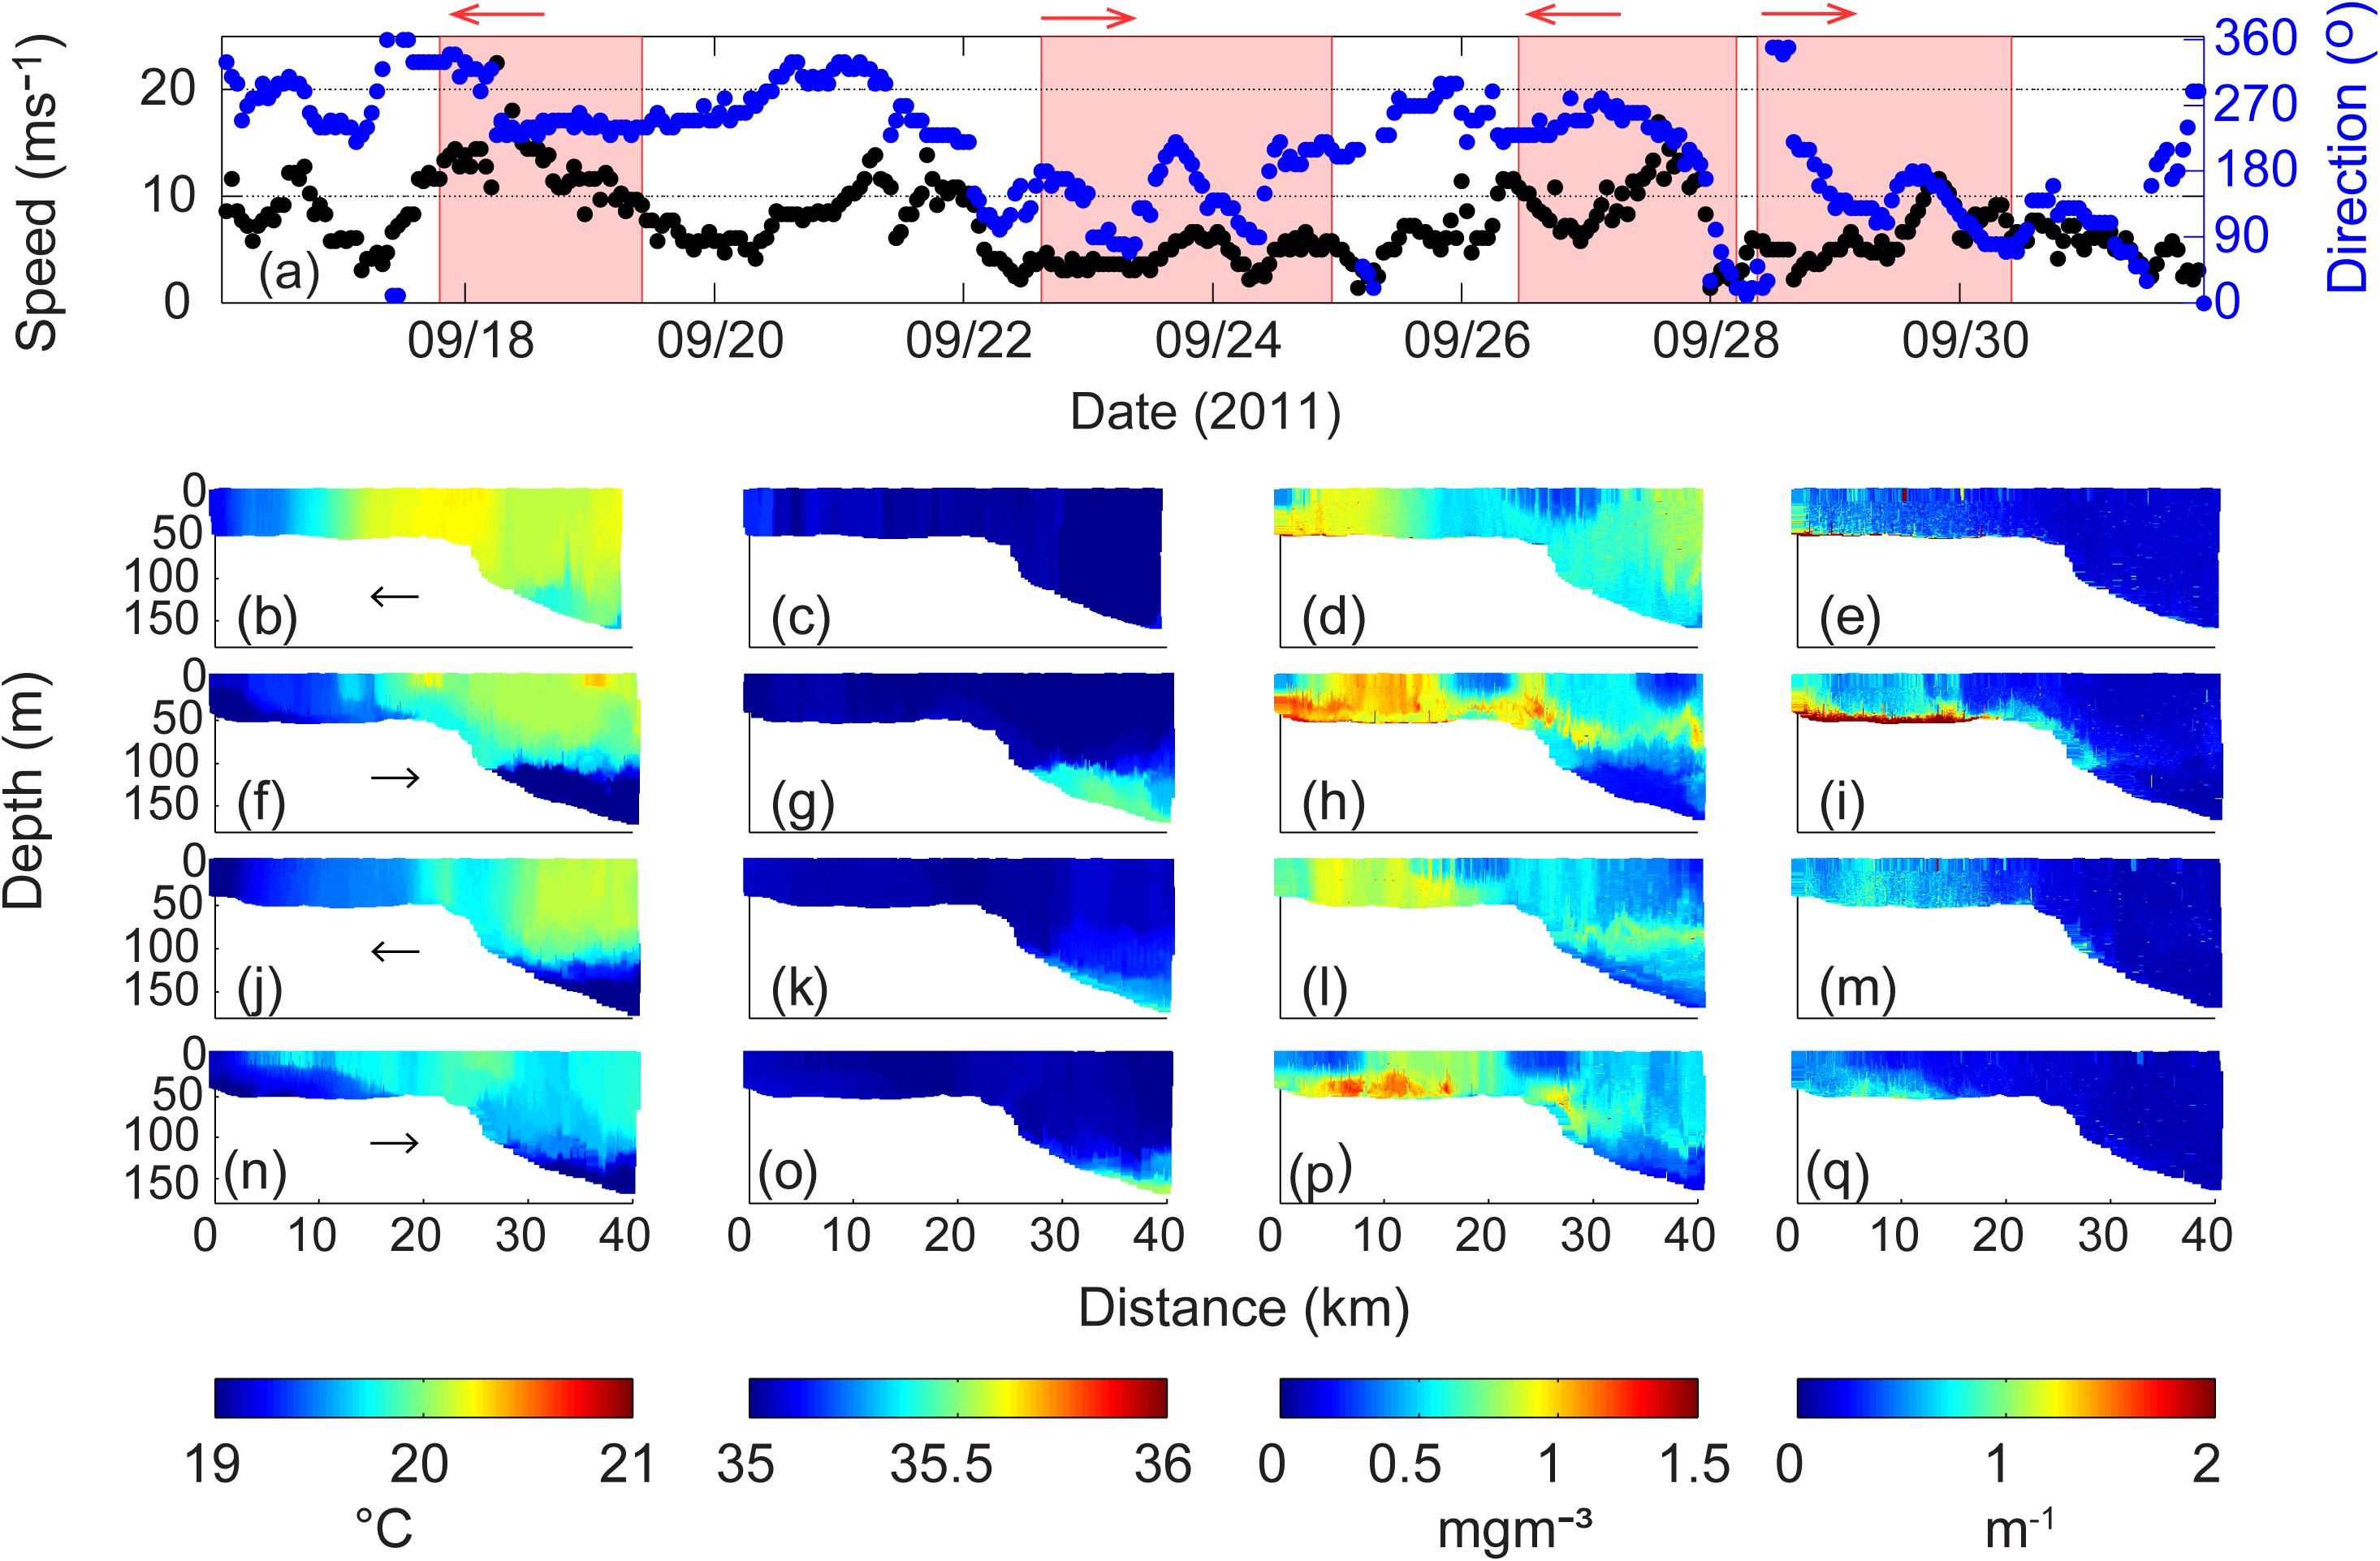
Figure 5. (a) Wind speed and direction at Rottnest Island during 17–30 September 2011. The shaded areas represent the period of ocean glider transect; Ocean glider vertical cross-sections of (b) temperature (°C); (c) salinity; (d) chlorophyll (mg m–3); and (e) backscatter (m–1) across the Rottnest continental shelf during 17–19 September 2011; (f–i) water properties during 23–25 September 2011; (j–m) water properties during 27–28 September 2011; and (n–q) water properties during 28–30 September 2011. The direction of the glider path is indicated by the arrow.
During both storm periods relatively cool (19°C) vertically well-mixed waters were present on the inner shelf region (Figures 5b,j). The passage of storm systems result in enhanced surface heat loss (in excess of 800 Wm–2) and the nearshore waters undergo cooling (see Mahjabin et al., 2019a). Salinity during the whole period was relatively uniform (Figures 5c,g,k,o). On the mid-section of the inner shelf region, the chlorophyll concentrations were higher (up to 1 mgm–3) and vertically well mixed. A region of lower surface chlorophyll concentrations was located at the shelf-break (Figure 5d). Backscatter values were generally low with slightly elevated values on the inner shelf (Figure 5e).
During the period 20–22 September 2011, between the two transects there was also a period of strong winds (>10 ms–1). During the calm wind period after these two storms (Figures 5f–i), weak vertical stratification was observed close to the coast (0–5 km distance), with the well-mixed waters located between 5 and 13 km in the upper 45 m. Beyond 13 km mark to the shelf break there was vertical stratification in temperature with evidence of DSWC (Figure 5f).
Higher chlorophyll waters were located on the inner shelf region but the values had increased to 1.3 mgm–3 (Figures 5d,h). Maximum values of chlorophyll concentrations were located on the inner shelf associated with the frontal region defined by strong horizontal gradients in temperature (Figure 5f). A layer of higher chlorophyll was found close to the seabed from the coastline to 23 km offshore and extended offshore to 40 km distance from the coastline, at 75 m water depth (Figure 5h). Backscatter showed vertically mixed values on the inner shelf with higher concentrations (to 4 × 10⁻³ m–1) on a band close to the seabed which extended beyond the shelf break (Figure 5i).
During the storm on 26–28 September 2011 the whole water column was vertically mixed with reduced values of chlorophyll concentrations across the whole transect in comparison to the previous transect but the general pattern was very similar but with a decreased horizontal temperature gradient (Figures 5j–m). The major change was that the higher backscatter close to the seabed on the inner shelf was eroded (Figure 5m).
During the subsequent calm period (28–30 September 2011) the inner shelf waters were vertically stratified in temperature across the shelf to 15 km from the coastline (Figure 5n). The inner shelf also indicated the presence of a DSWC. Maximum chlorophyll concentrations (up to 1.3 mg m–3) and higher backscatter levels were associated with the bottom waters associated with the DSWC (Figures 5p,q). The higher chlorophyll in the bottom layer is most likely due to nutrients supply from the sediments after the storm.
Backscatter/chlorophyll diagram indicated a decrease (increase) in concentrations under storm (calm) conditions (Figure 6). Initially chlorophyll concentrations were generally mixed through the water column (Figure 6a). Due to stratification, in the following calmer period, whilst the surface waters were low in chlorophyll higher values were in water depths >20 m (Figure 6b). Higher chlorophyll concentrations were also associated with higher backscatter (Figure 6d). During the next storm, the chlorophyll concentrations and backscatter values decreased and were mixed through the water column (Figure 6c). In the subsequent calm period, chlorophyll concentrations increased with higher values in deeper water (Figure 6d).
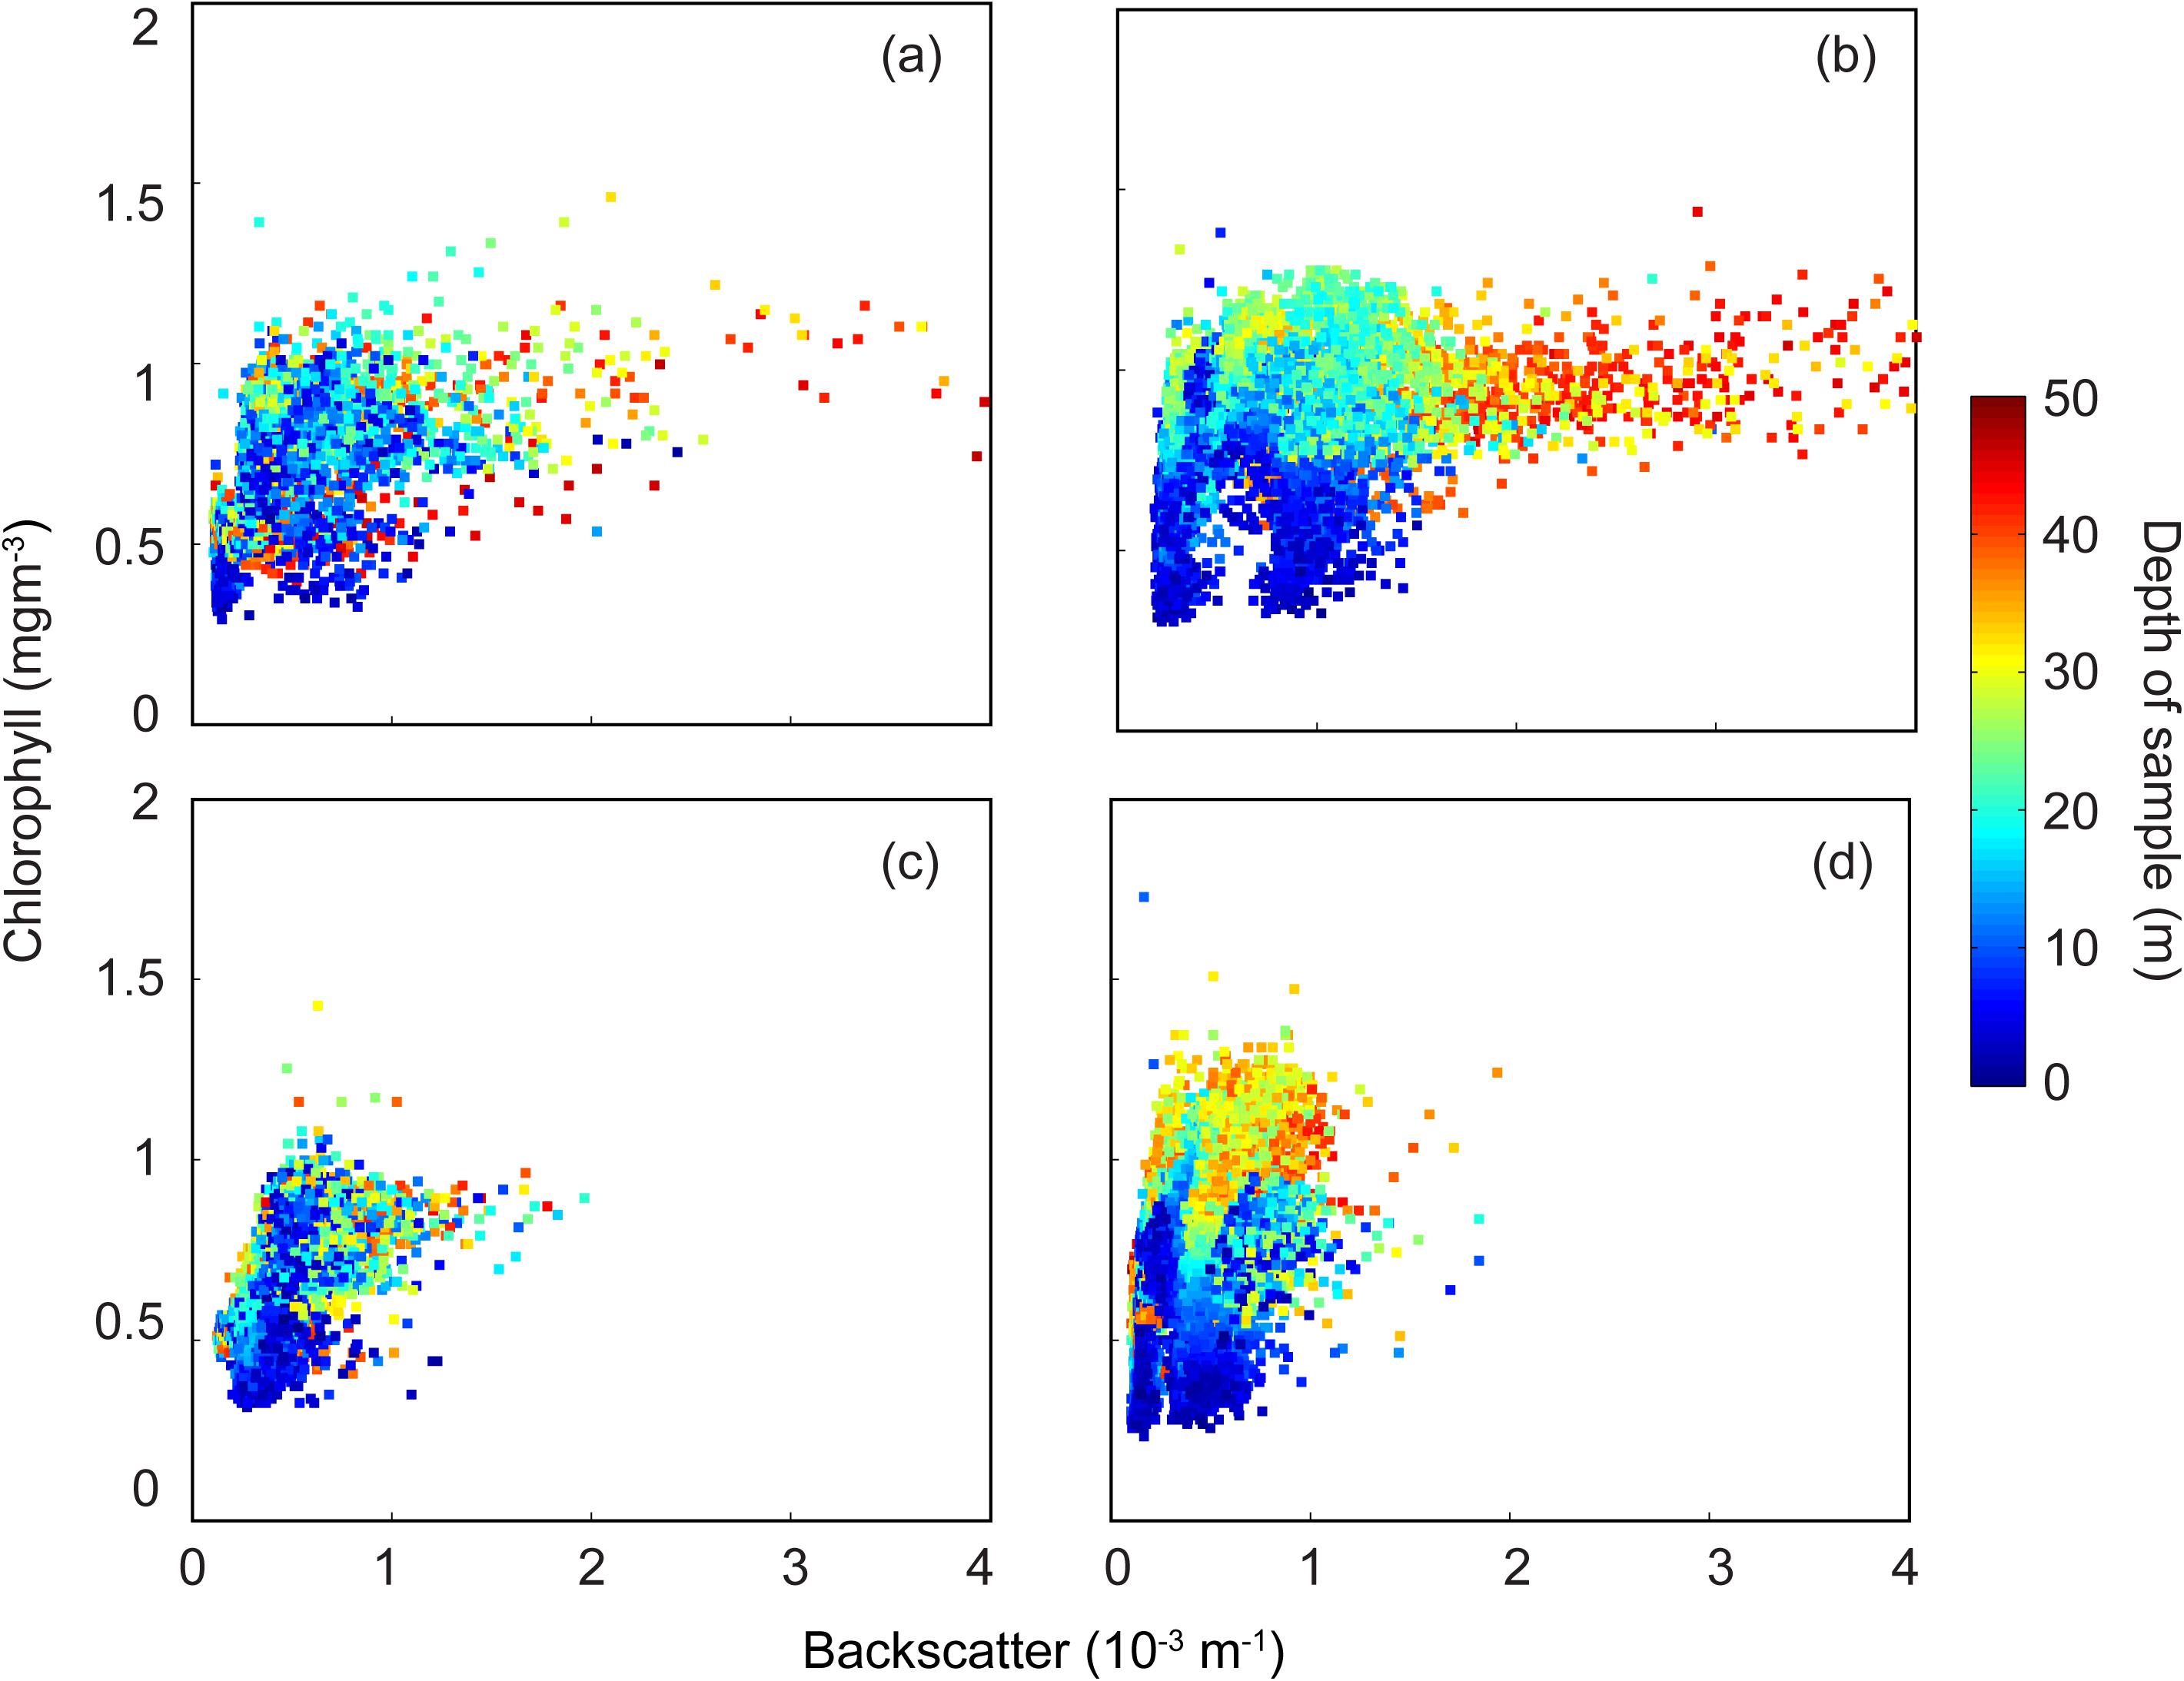
Figure 6. Backscatter (m–1) and chlorophyll (mg m–3) scatter plot. (a) 17–19 September 2011; (b) 23–25 September 2011; (c) 27–28 September 2011; and, (d) 28–30 September 2011.
Transition Between Different Wind Conditions
Low-High Winds and High-Low Winds
Over the period 19–26 May 2009, two wind transition periods occurred with water column data captured by the ocean gliders (Figure 7a). During the first transect (19–21 May 2009) under storm conditions the wind speeds increased from <5 to >10 ms–1 with the wind direction being from the north promoting downwelling conditions. During the second transect (23–25 May 2009), wind speeds decreased from >10 ms–1 to <5 ms–1 with the wind direction gradually changing from west to south and finally to east. During the intervening period (21–23 May 2009), a storm with strong sustained winds (>10 ms–1 with maxima to 20 ms–1) were experienced with the wind direction gradually moving from north to west. Thus the period of the strong winds (>7.5 ms–1) associated with the storms were always downwelling favorable.
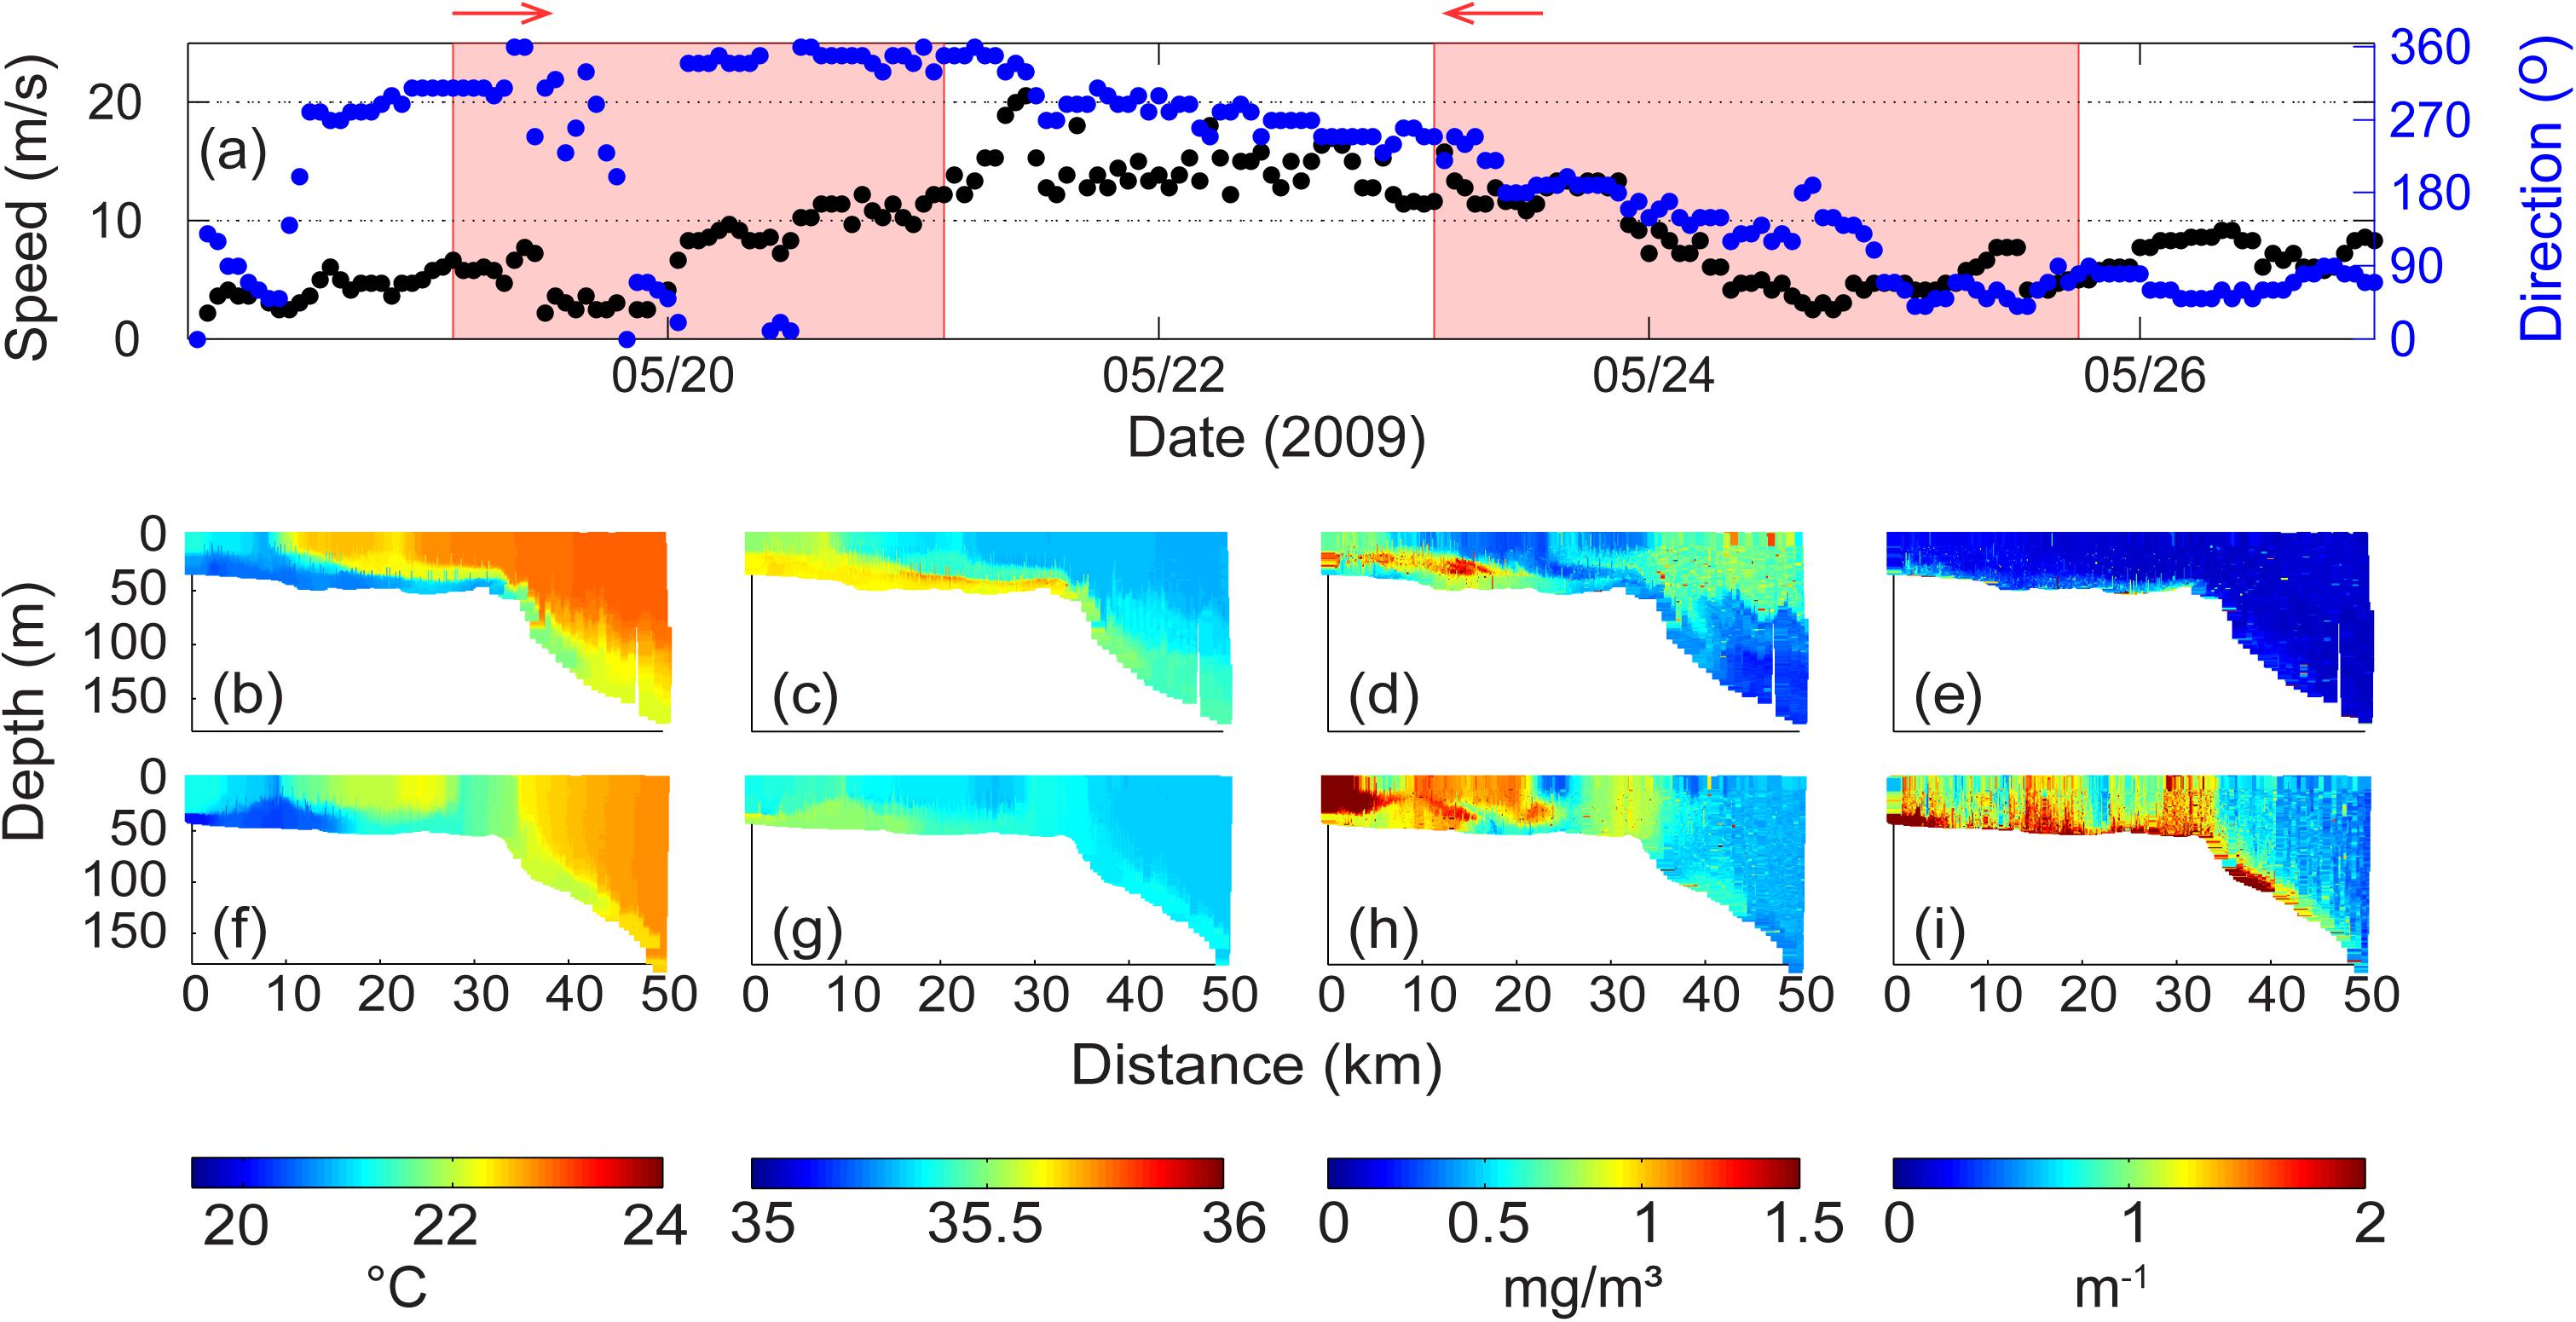
Figure 7. (a) Wind velocity and direction at Rottnest Island during 19–25 May 2009. The shaded areas represent the period of ocean glider transect; Ocean glider vertical cross-sections of (b) temperature (°C); (c) salinity; (d) chlorophyll (mg m–3); and, (e) backscatter (m–1) across the Rottnest continental shelf during 19–21 May 2009; (f–i) water properties during 23–25 May 2009. The glider flight direction is indicated by the arrow.
During the first period, the water column was vertically stratified across whole transect: the inner shelf and beyond the shelf break to water depths >150 m (Figure 7b). Salinity distribution indicated a similar structure (Figure 7c). A DSWC was well established with downwelling favorable winds driving the cascade further offshore into deeper water. In contrast, previous DSWC examples (Figures 3, 5) the cascades were restricted to the inner shelf region. On the inner shelf, there was a strong horizontal gradient in temperature and salinity at ∼10 km distance associated with a sub-meso scale eddy (a similar feature was documented by Mahjabin et al., 2019a).
There were two main regions of higher chlorophyll (Figure 7d): (1) in the surface 50 m beyond the shelf break; and, (2) associated with the DSWC in the inner shelf region. Elevated chlorophyll concentrations were associated with the cooler inshore waters to 10 km, associated with the cooler water inshore of the horizontal temperature gradient. There was also a layer of higher chlorophyll concentrations (up to 1.3 mgm–3) along the pycnocline to a distance of 20 km. The backscatter levels in the water column were low across the whole transect with slightly elevated (to 1.5 × 10⁻³ m–1) values close to the sea bed (Figure 7e).
During the second period, the temperature and salinity distributions were very similar to that during the previous transect. The main differences were (Figures 7f,g): (1) a vertically mixed water column with a width of ∼ 8 km at the shelf break; (2) cooler waters along the bottom in the 0–10 km region; (3) on the inner shelf the surface layer was cooler with water >22.6°C; and, (4) reduced thickness of the DSWC in deeper water offshore of the shelf break. It is interesting that although strong winds were experienced between the two transects the vertical stratification was present in both. This was most likely due to the downwelling component of the wind.
In contrast to the similarities in the T/S distribution between the two periods, there were large differences in both chlorophyll and backscatter distribution. The main differences in chlorophyll concentrations were (Figures 7d,h): (1) a decrease in the surface chlorophyll concentrations offshore of the shelf break. Here, the higher surface chlorophyll water appear to be mixed into the deeper water; (2) elevated chlorophyll at the shelf break associated with the well mixed water column with different temperature and salinity characteristics; (3) a ‘patch’ of low chlorophyll at the surface (∼25 km mark) associated with warmer and less saline water; (4) higher surface chlorophyll region (to 1.2 mg m–3) in the middle of the inner shelf region (8–21 km distance); and, (5) maximum chlorophyll concentrations (up to 1.5 mg m–3), in the inshore surface water (0–8 km). The backscatter values indicated significantly higher values through the water column (to 8 × 10⁻³ m–1) that were closely associated with the T/S patterns (Figure 7i): higher values (1) at the shelf break; (2) along the sea bed offshore of the shelf break corresponding to the DSWC; and (3) along the inner shelf.
The changes between the two transects identified above are clearly visible in the backscatter/chlorophyll diagram (Figure 8). During the first transect, the backscatter values were low with majority of the chlorophyll concentrations in the surface layers (Figure 9a). After sustained winds both the chlorophyll and backscatter values increased significantly (Figure 8a). It is also interesting to note the depth stratification of the chlorophyll concentrations: in water depths > 30 m, chlorophyll concentrations were in the range 0.4–0.55 mgm–3; 20–30 m depth 0.55–1.1 mgm–3; and higher values (except in the offshore waters) in the surface waters (Figure 8b).
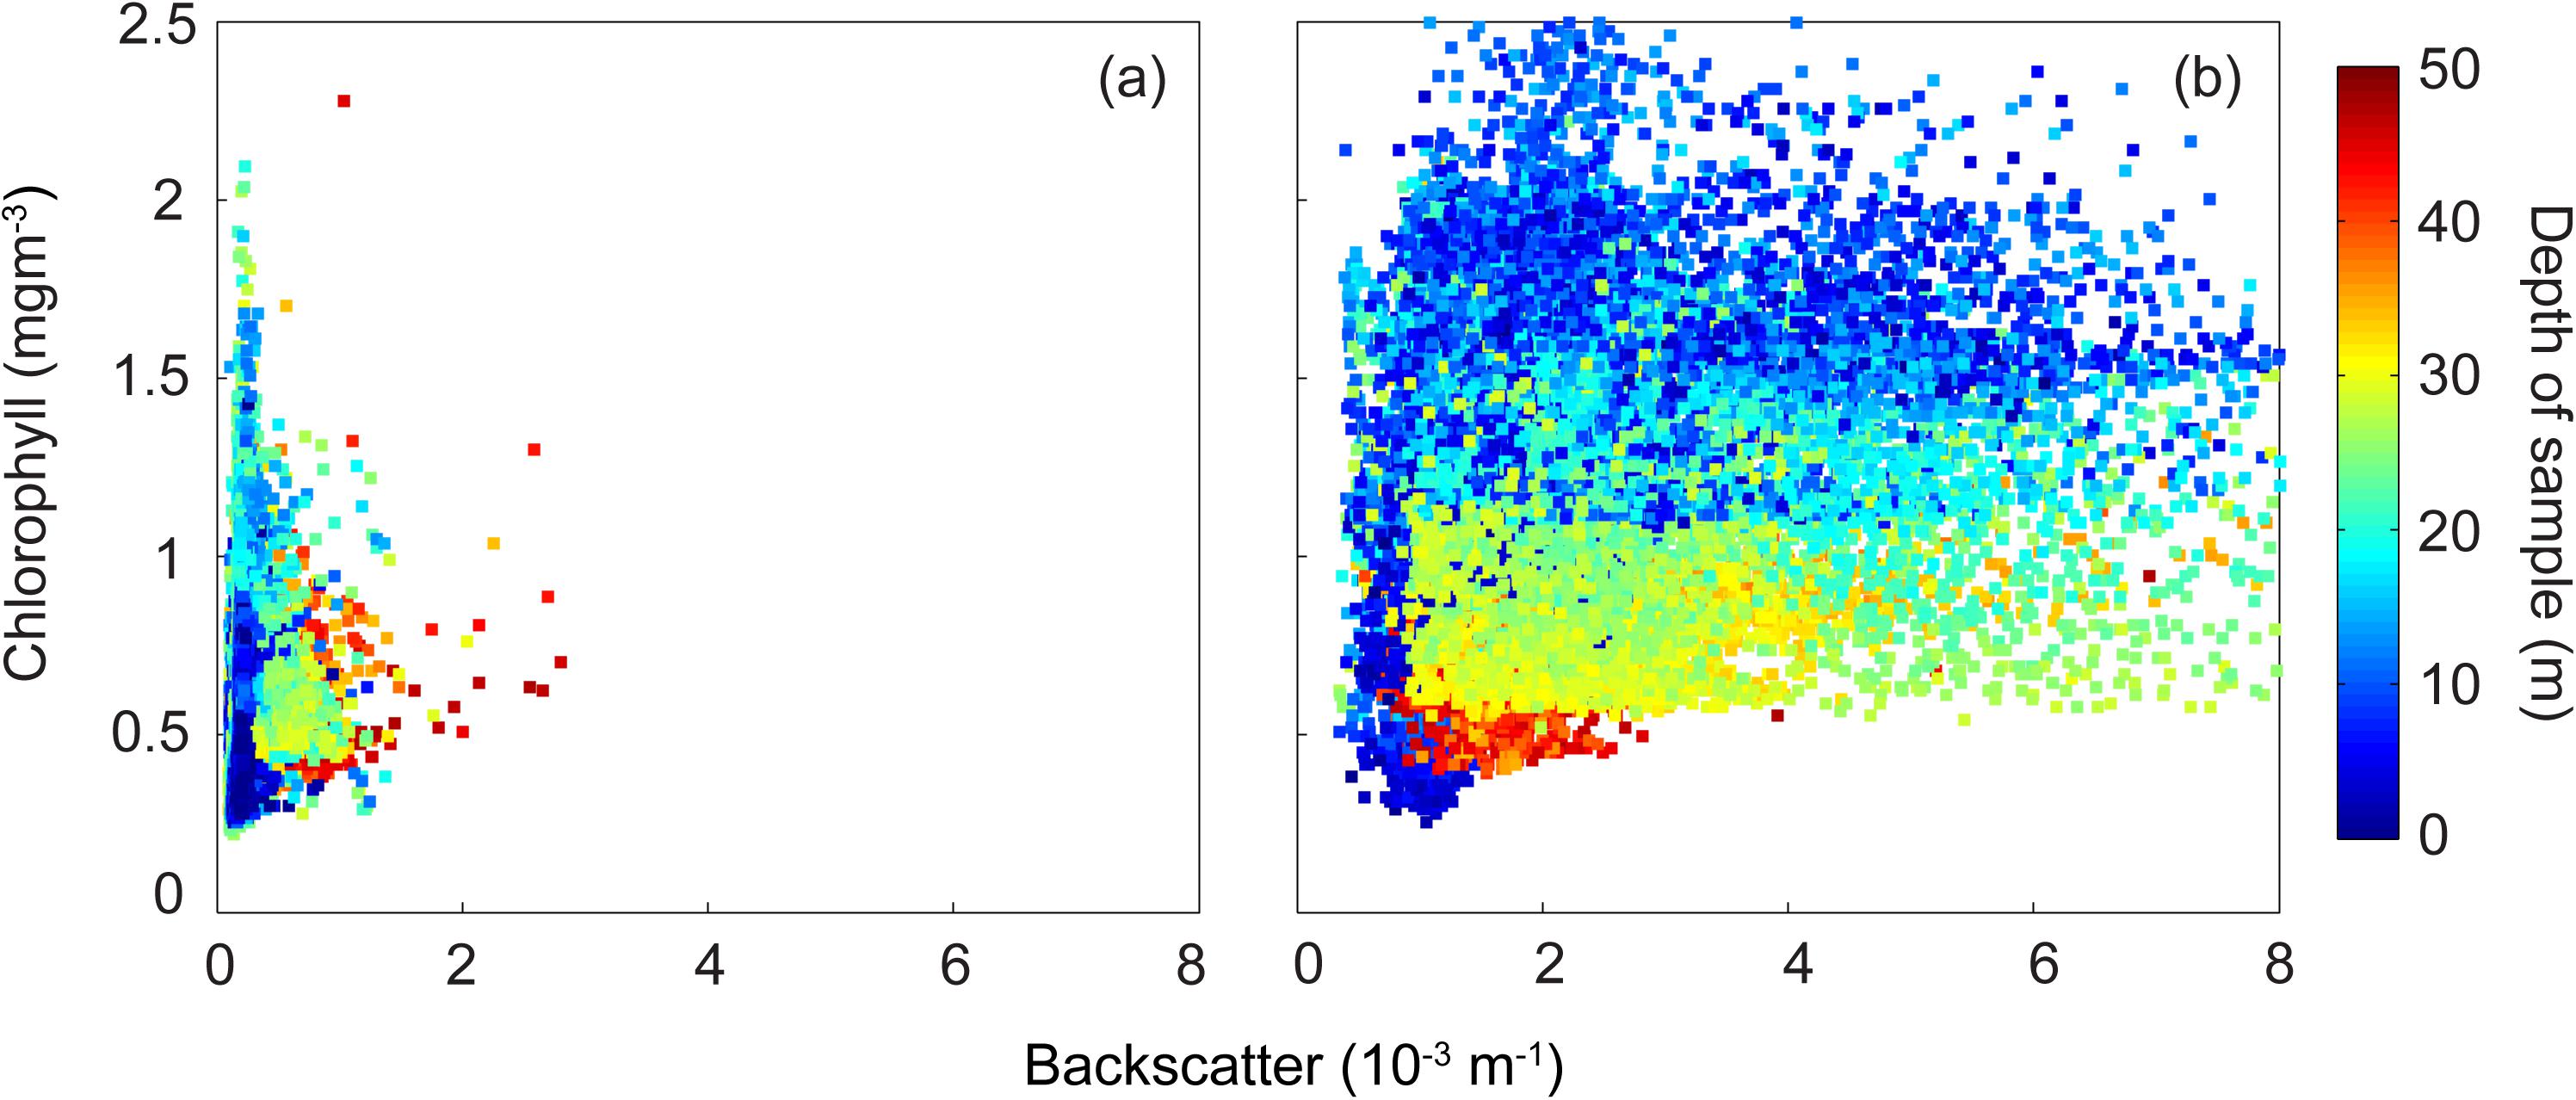
Figure 8. Backscatter (m–1) and chlorophyll (mg m–3) scatter plot. (a) 19–21 May 2009; and (b) 23–25 May 2009.
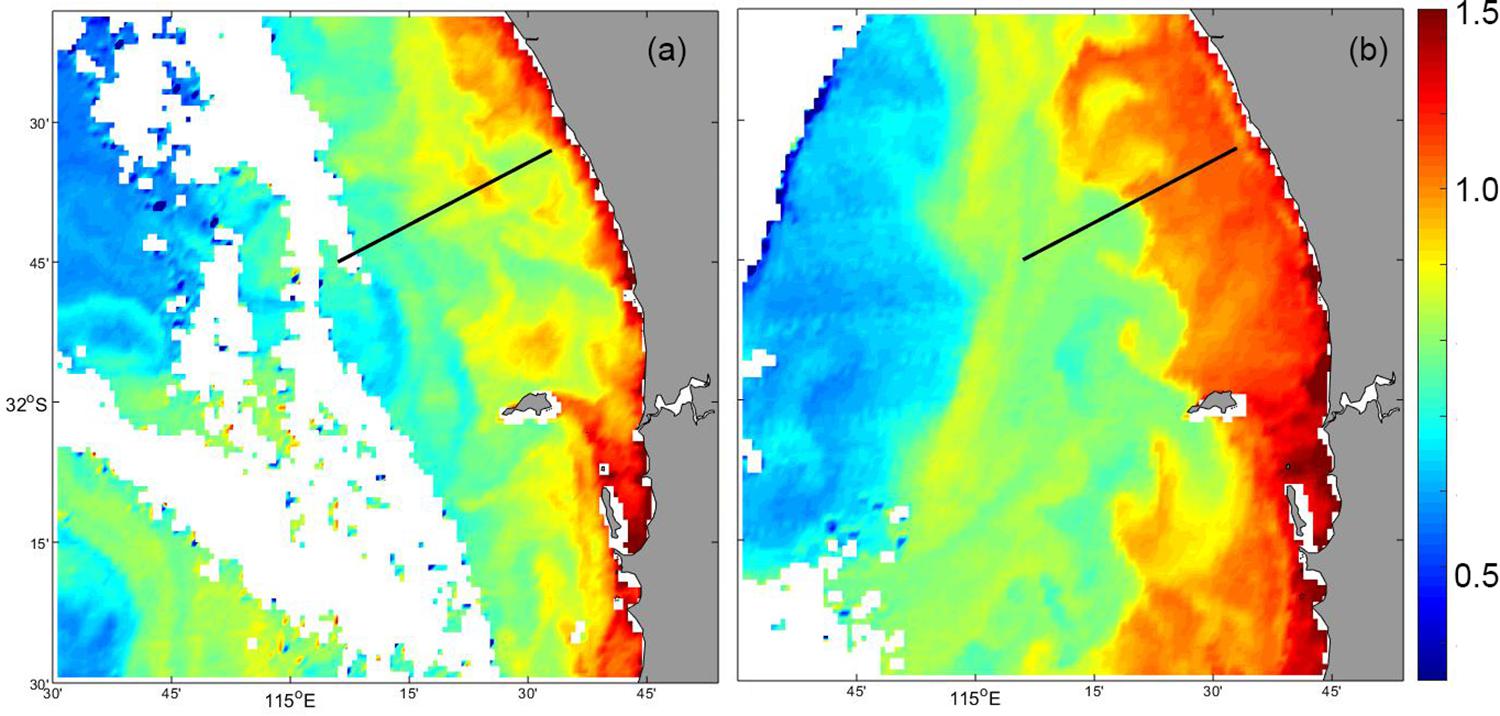
Figure 9. MODIS satellite derived surface chlorophyll concentration: (a) 18 May 2009; and (b) 29 May 2009. The glider transect is shown as the dotted line.
Satellite derived surface chlorophyll before and after the measurement indicated that the increase in chlorophyll was uniform along the coast. Both images indicate that there was band of water in the coastal region with higher chlorophyll concentration compared to that further offshore (Figure 9). However, subsequent to the storm event, chlorophyll concentration increased in the coastal region and the band of higher chlorophyll extended further offshore (Figure 9).
Calm Winds Transitioning to Two Consecutive Storms
A period of calm winds followed by two winter storms was experienced over the period 17–27 May 2016 (Figure 10a). Over the period 17–18 May 2016 the wind speeds were low (∼5 ms–1) with varying direction with onshore winds on 17–18 May changing to southerly on 19 May 2016. On 20 May winds increased to >20 ms–1 with a change in direction typical of a winter storm: northerly, north-westerly, westerly (Figure 10a). The wind speeds reduced to ∼7 ms–1 on 23 May before increasing again to >20 ms–1 with direction changing from northerly, north-westerly, westerly and then continuing westerly to the end of the measurements. It should be noted that during all 3 ocean glider transects the winds had a strong onshore component.
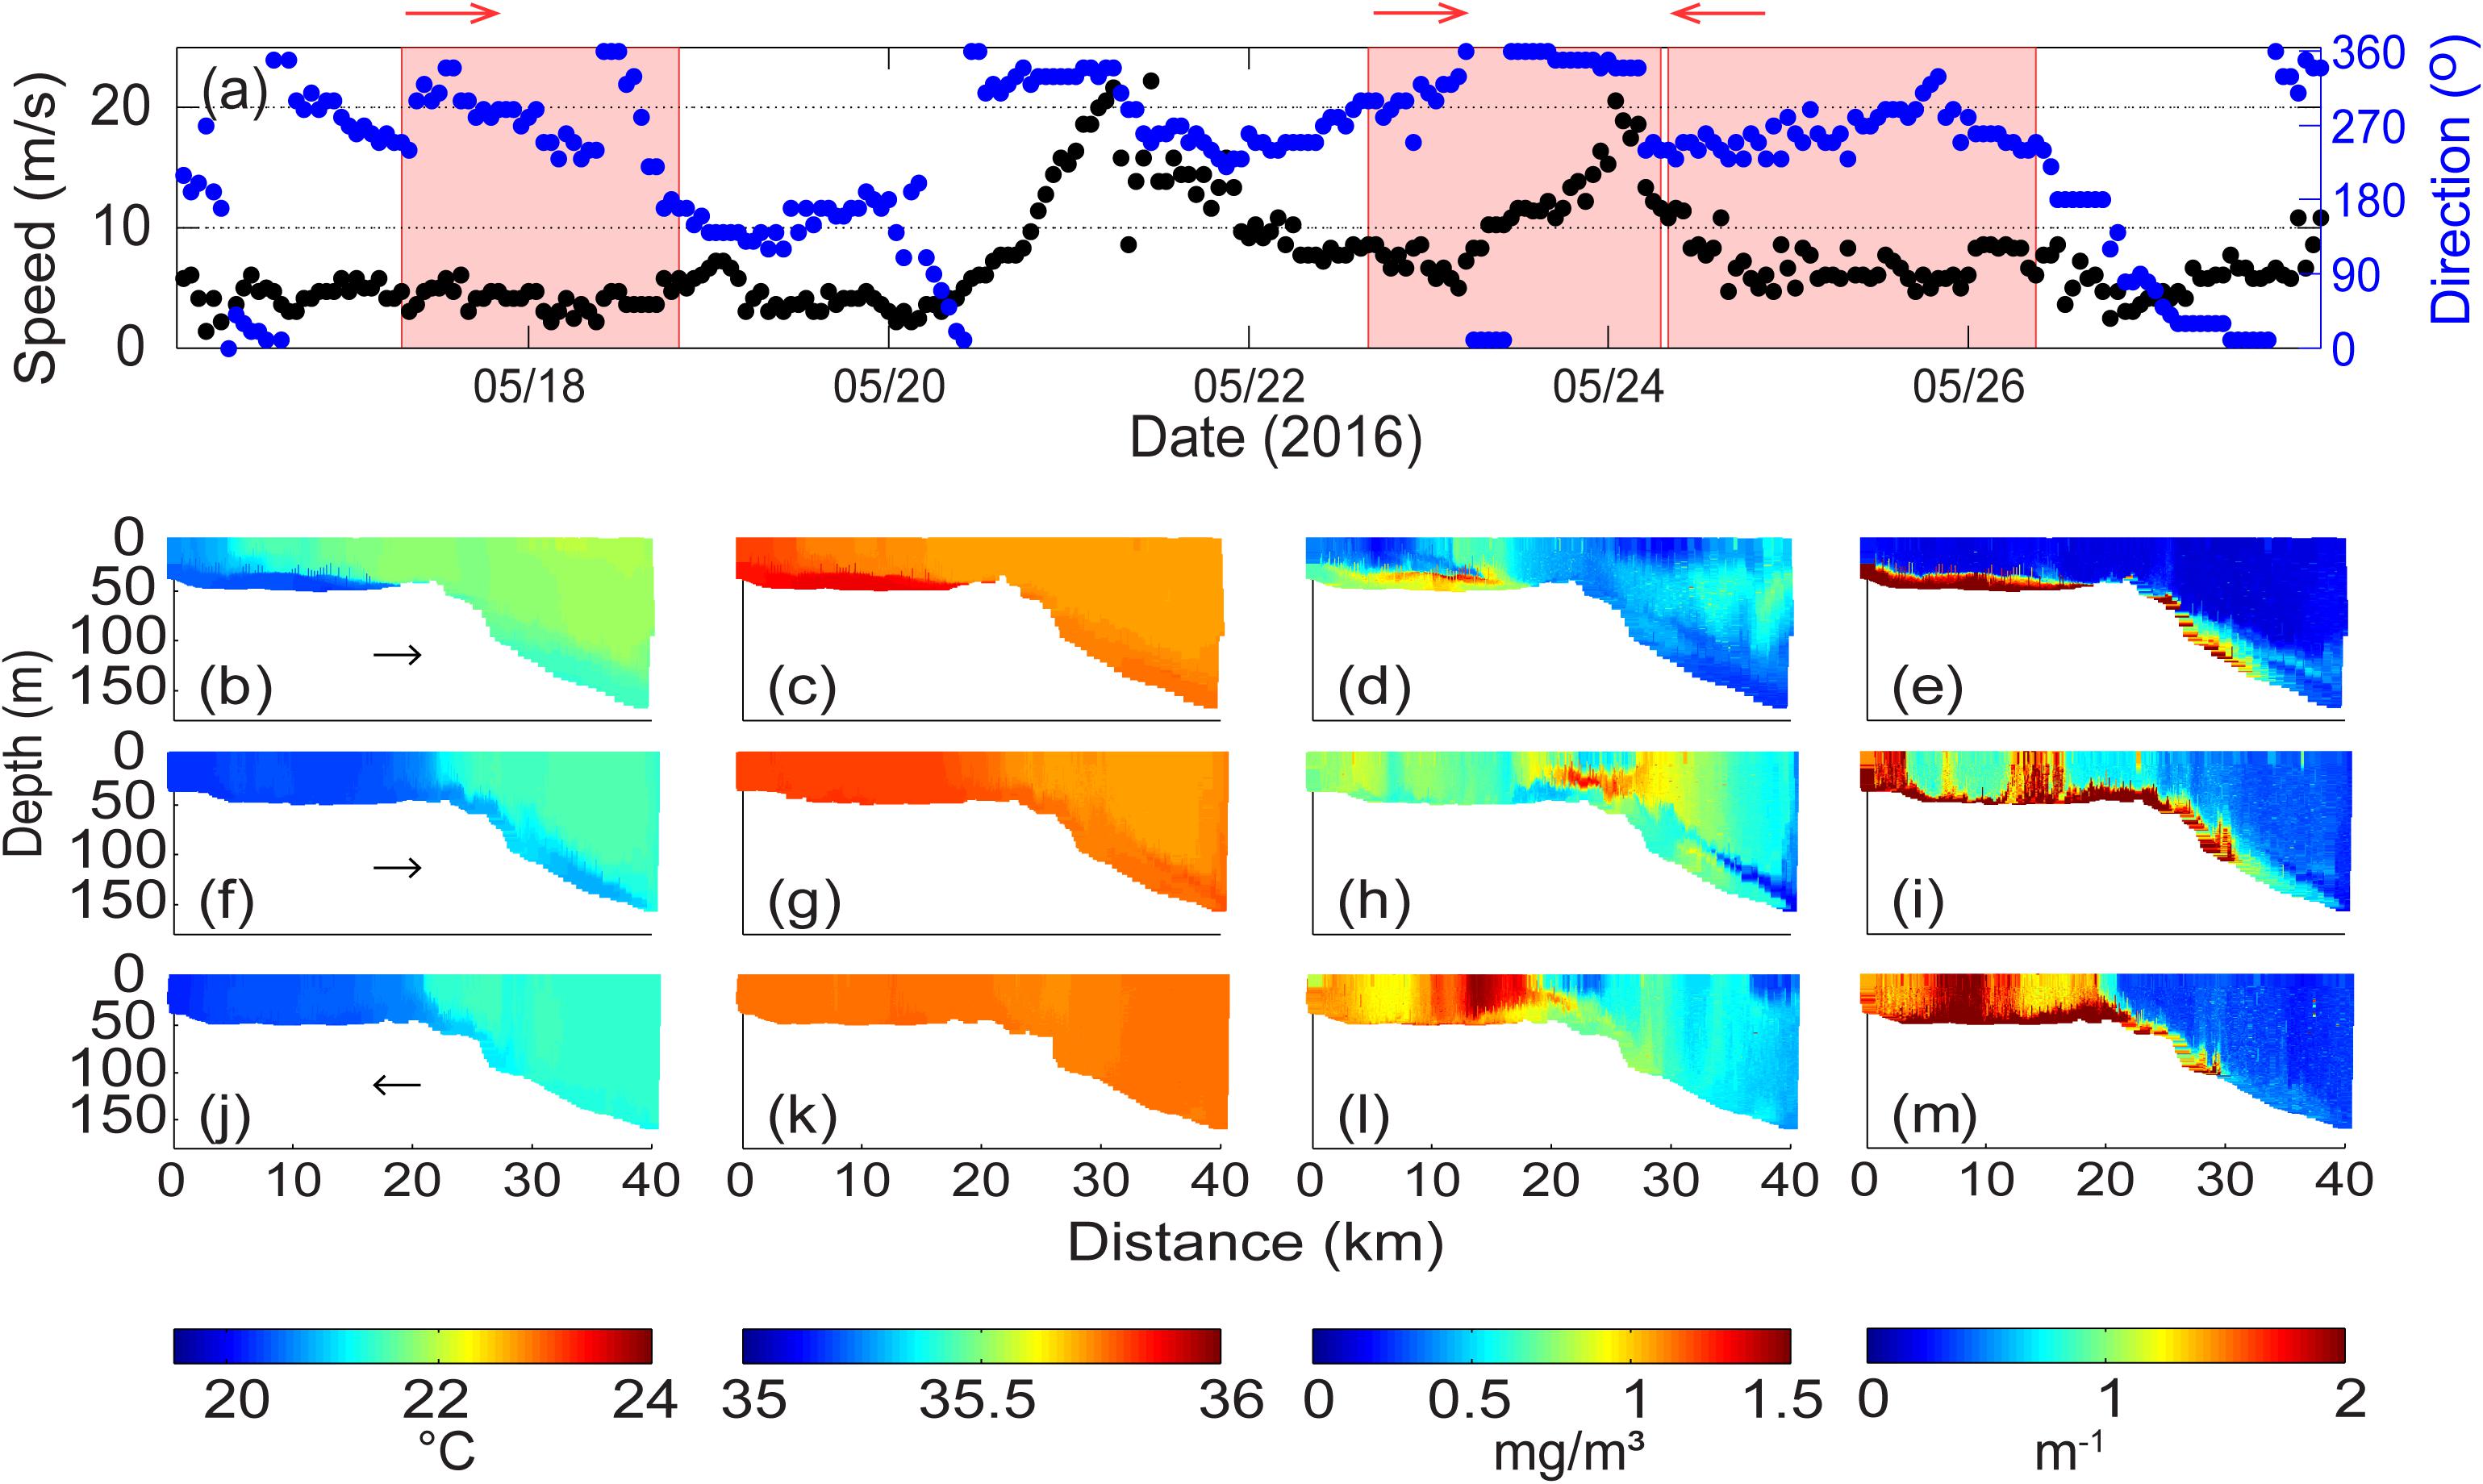
Figure 10. (a) Wind velocity and direction at Rottnest Island during 17–26 May 2016. The shaded areas represent the period of ocean glider transect; Ocean glider vertical cross-sections of (b) temperature (°C); (c) salinity; (d) chlorophyll (mgm–3); and (e) backscatter (m–1) across the Rottnest continental shelf during 17–18 May 2016; (f–i) water properties during 22–24 May 2016; and (j–m) water properties during 24–26 May 2016. The glider flight direction is indicated by the arrow.
During the first calm period (17–18 May 2016; Figures 10b–e), a well-mixed water column with cooler (∼20°C) water was present on the inner-shelf region to 5 km from the coast. Seaward of 5 km, a DSWC was present and extended along the seabed past the shelf break. The temperature distribution across the remainder of the transect was uniform (Figure 10b). The salinity distribution was uniform along majority of the transect but were slightly elevated along the DSWC (Figure 10c). On the inner shelf, chlorophyll concentrations were higher (>0.5 mgm–3) in the bottom layer of the DSWC and were lower (<0.5 mgm–3) in the surface layer. The maximum chlorophyll concentrations (to 1.2 mgm–3) were located at the pycnocline associated with the DSWC from 5 to 15 km from the coast. A vertically mixed region of chlorophyll was located at the seaward end of the DSWC. High backscatter values (to 6 × 10⁻³ m–1) were present in the DSWC and along the sea bed seaward of the shelf break to a depth 150 m beyond observed in the near-bottom high chlorophyll waters, and extended to the bottom shelf-break and offshore regions (20–40 km distance) (Figures 10d,e). In the offshore region, seaward of the shelf break, a SCM was present with lower chlorophyll values in the region close to the seabed on the slope (Figure 10d).
Data collected on 22–23 May 2016, subsequent to the first storm (Figures 10f–i), the glider was moving from inshore to offshore and the stronger winds were experienced when the glider was in deeper water. Data indicated that the inner shelf waters were vertically mixed in temperature, salinity and chlorophyll. Beyond the shelf break, there was a DSWC extending offshore to depth >150 m with cooler, more saline and higher chlorophyll and backscatter water close to the sea bed (Figures 10f–i). Here, the downwelling favorable winds have allowed for the deeper extension of the DSWC whilst on the shelf the strong winds have vertically mixed the water column. Higher chlorophyll values (to 1.2 mgm–3) were present in a mid-depth layer (depths of 10–30 m) close to the shelf break at 20–28 km (Figure 10h). Maximum backscatter values (6.3 × 10⁻³ m–1) were located inshore (0–5 km and 12–18 km distance) with uniform values through the water column (Figure 10i). The backscatter values were also higher in the layer close to the sea across the whole transect (Figure 10i).
After the passage of the second storm the wind speeds decreased (<10 ms–1) but the direction remained onshore (Figure 10a). The data indicated a similar conditions to the previous transects for temperature and salinity except that the DSWC along the slope did not extend as deep as in the previous transect (Figure 10j). In contrast, the chlorophyll and backscatter distributions were very different. Observations over the inner shelf indicated higher chlorophyll values (ranging from 0.9 to 1.5 mgm–3) throughout the water column, with offshore chlorophyll values were lower than during the previous transect. Maximum chlorophyll values (1.5 mgm–3) were located at 10–20 km (Figure 10l). On the inner shelf region, the backscatter values increased and were vertically uniform (>2 × 10⁻³ m–1) with maximum values located between 5 and 12 km (Figure 10m).
The backscatter/chlorophyll diagram reflected the influence of the storms in the chlorophyll concentrations at different depth levels. At the low wind period before the storms the surface chlorophyll concentrations were low with higher levels in the depth ranging between 20 and 30 m (Figure 11a). In deeper waters (>40 m) the chlorophyll concentrations had a mean ∼1.0 mgm–3. Subsequent to the storm the chlorophyll concentrations decreased in the deeper waters but increased in the surface waters (Figure 11b). Subsequent to the second storm depth based chlorophyll stratification re-appeared. Here, the surface and deeper water (>40 m) chlorophyll concentrations increased (Figure 11c).
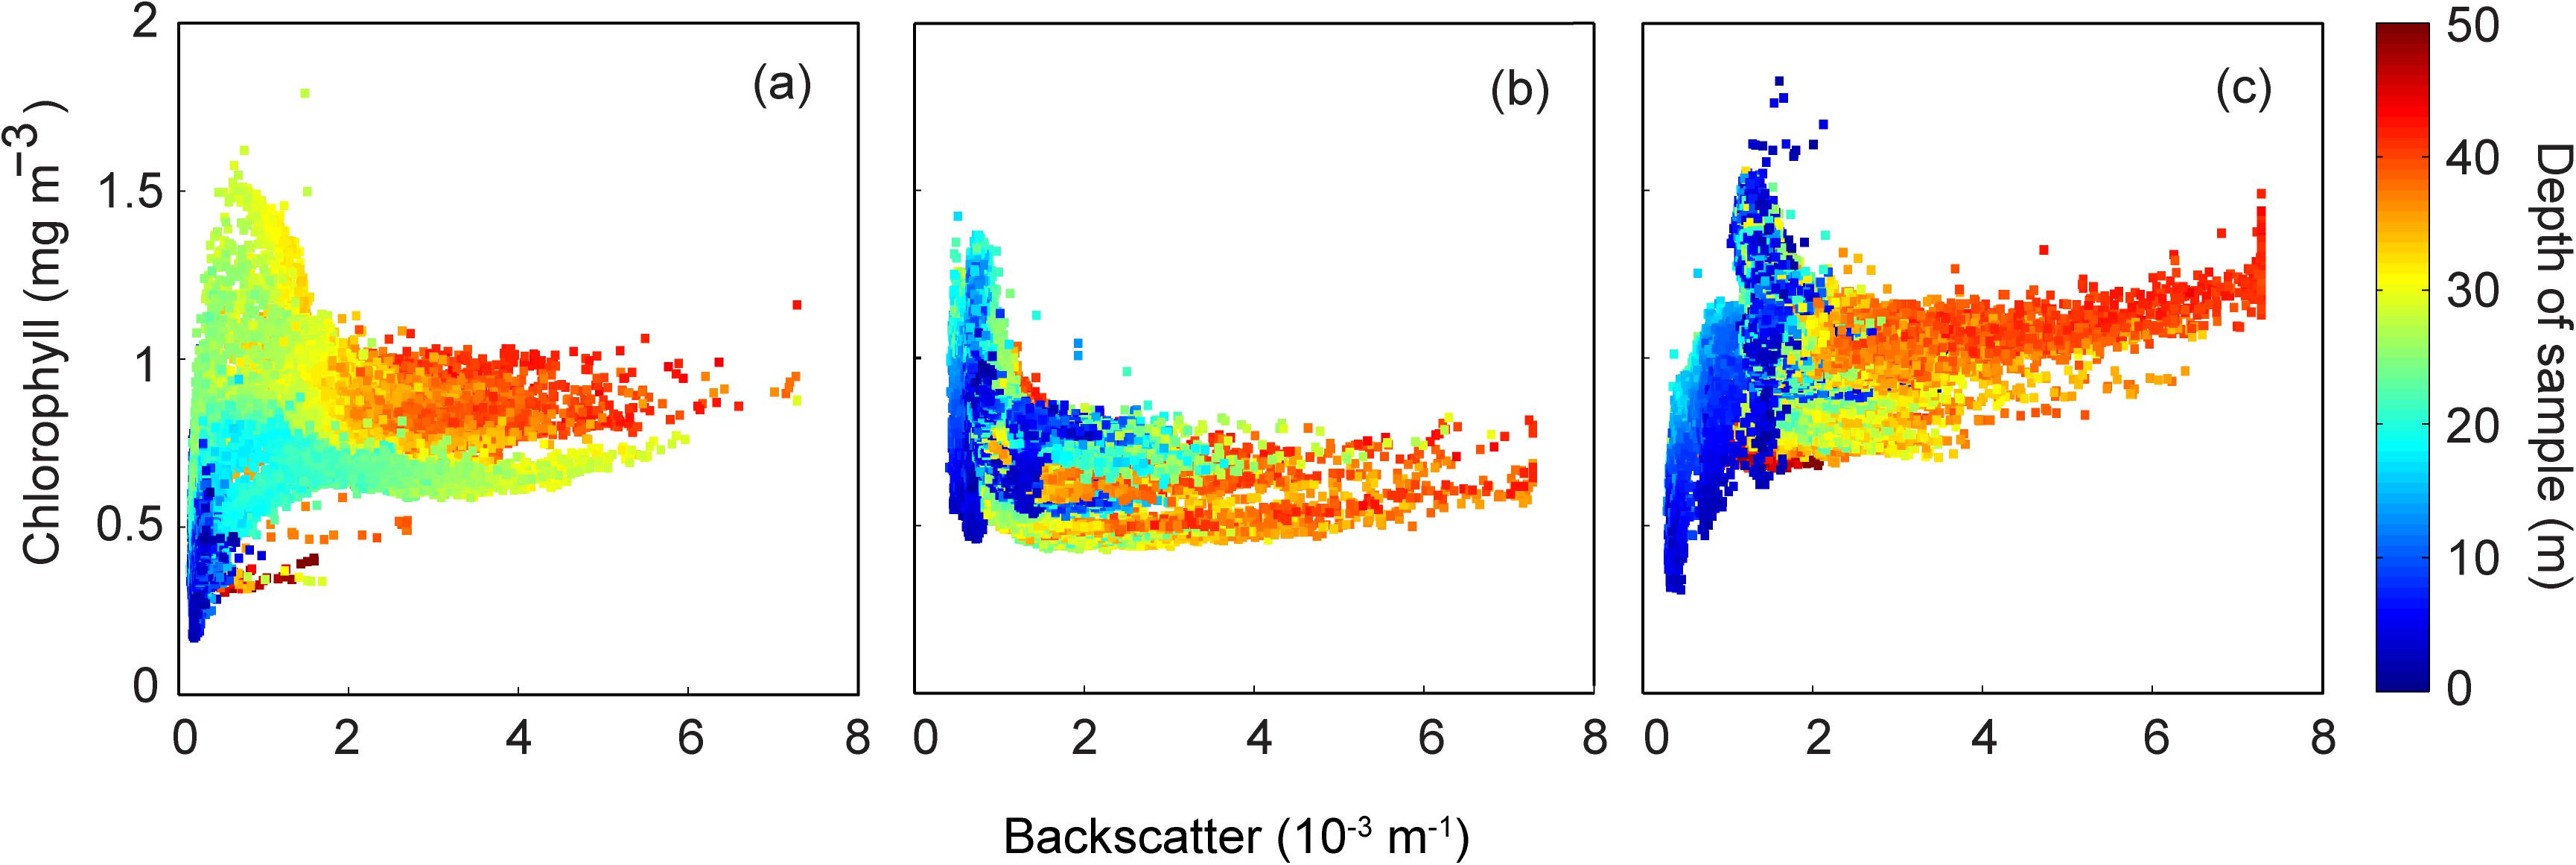
Figure 11. Backscatter (m–1) and chlorophyll (mg m–3) properties measured by ocean gliders over (a) 17–18 May 2016; (b) 22–24 May 2016; and, (c) and 24–26 May 2016.
Satellite derived surface chlorophyll concentrations before (17 May 2016: Figure 12a) and after (30 May 2016: Figure 12b), the storm event indicated that the increase in chlorophyll was uniform along the coast. Both images indicated that there was a band of water in the coastal region with higher chlorophyll concentration compared to that further offshore (Figure 12). However, subsequent to the storm event, chlorophyll concentration increased in the coastal region and the band of higher chlorophyll extended much further offshore (Figure 12b).
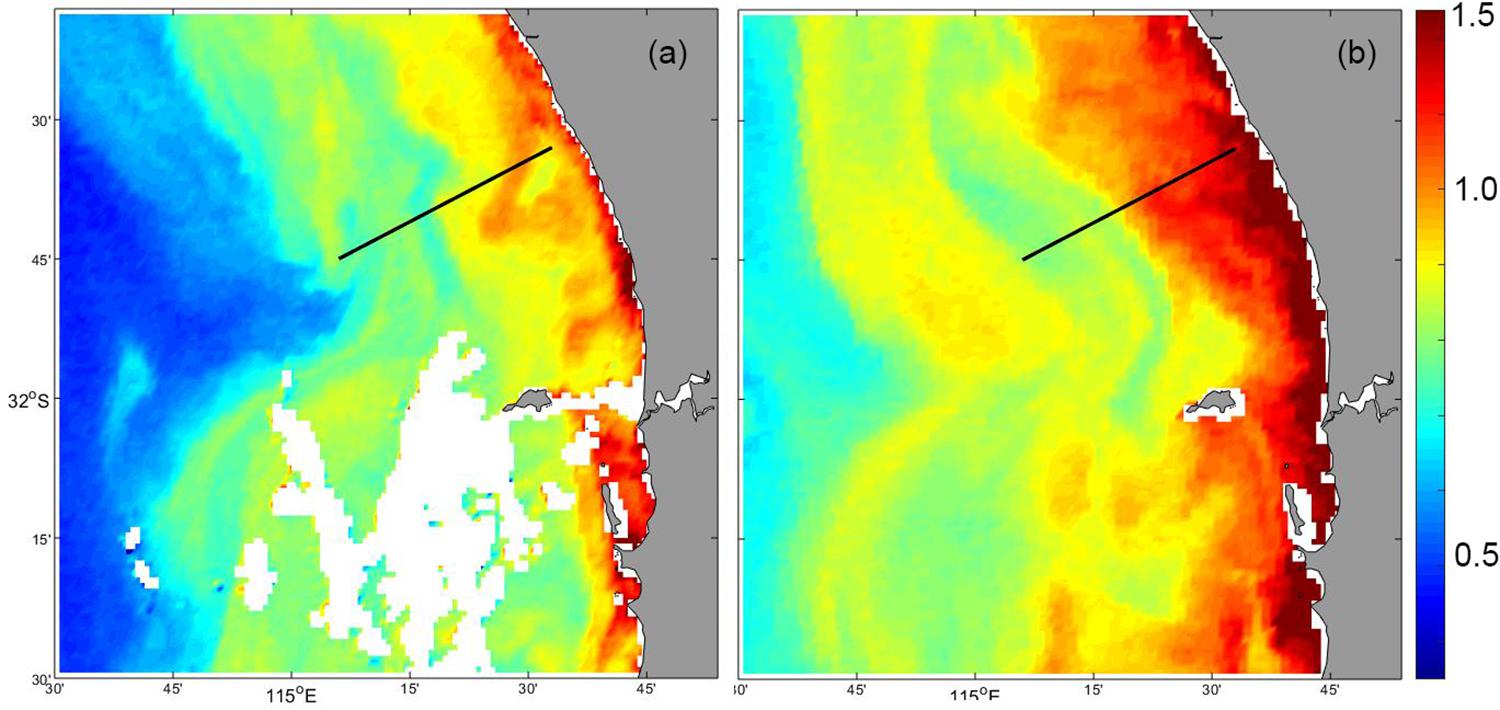
Figure 12. MODIS satellite derived surface chlorophyll concentration: (a) 17 May 2016; and (b) 30 May 2016. The glider transect is shown as the dotted line.
Summer Storm
Over the period 8–25 March 2015, predominantly southerly winds occurred (Figure 13a). Strong southerly winds (with winds up to 13 ms–1) with diurnal modulation occurred between 8 and 15 March 2015. The direction changed to westerly with a slight decrease in wind speed (<10 ms–1) during 14–17 March 2015. On 18 March winds changed to southerly and progressively increased to 15 ms–1 creating summer storm conditions by midnight 21 March. Subsequently the winds decreased to ∼5 ms–1 whilst remaining southerly by 24 March 2015.
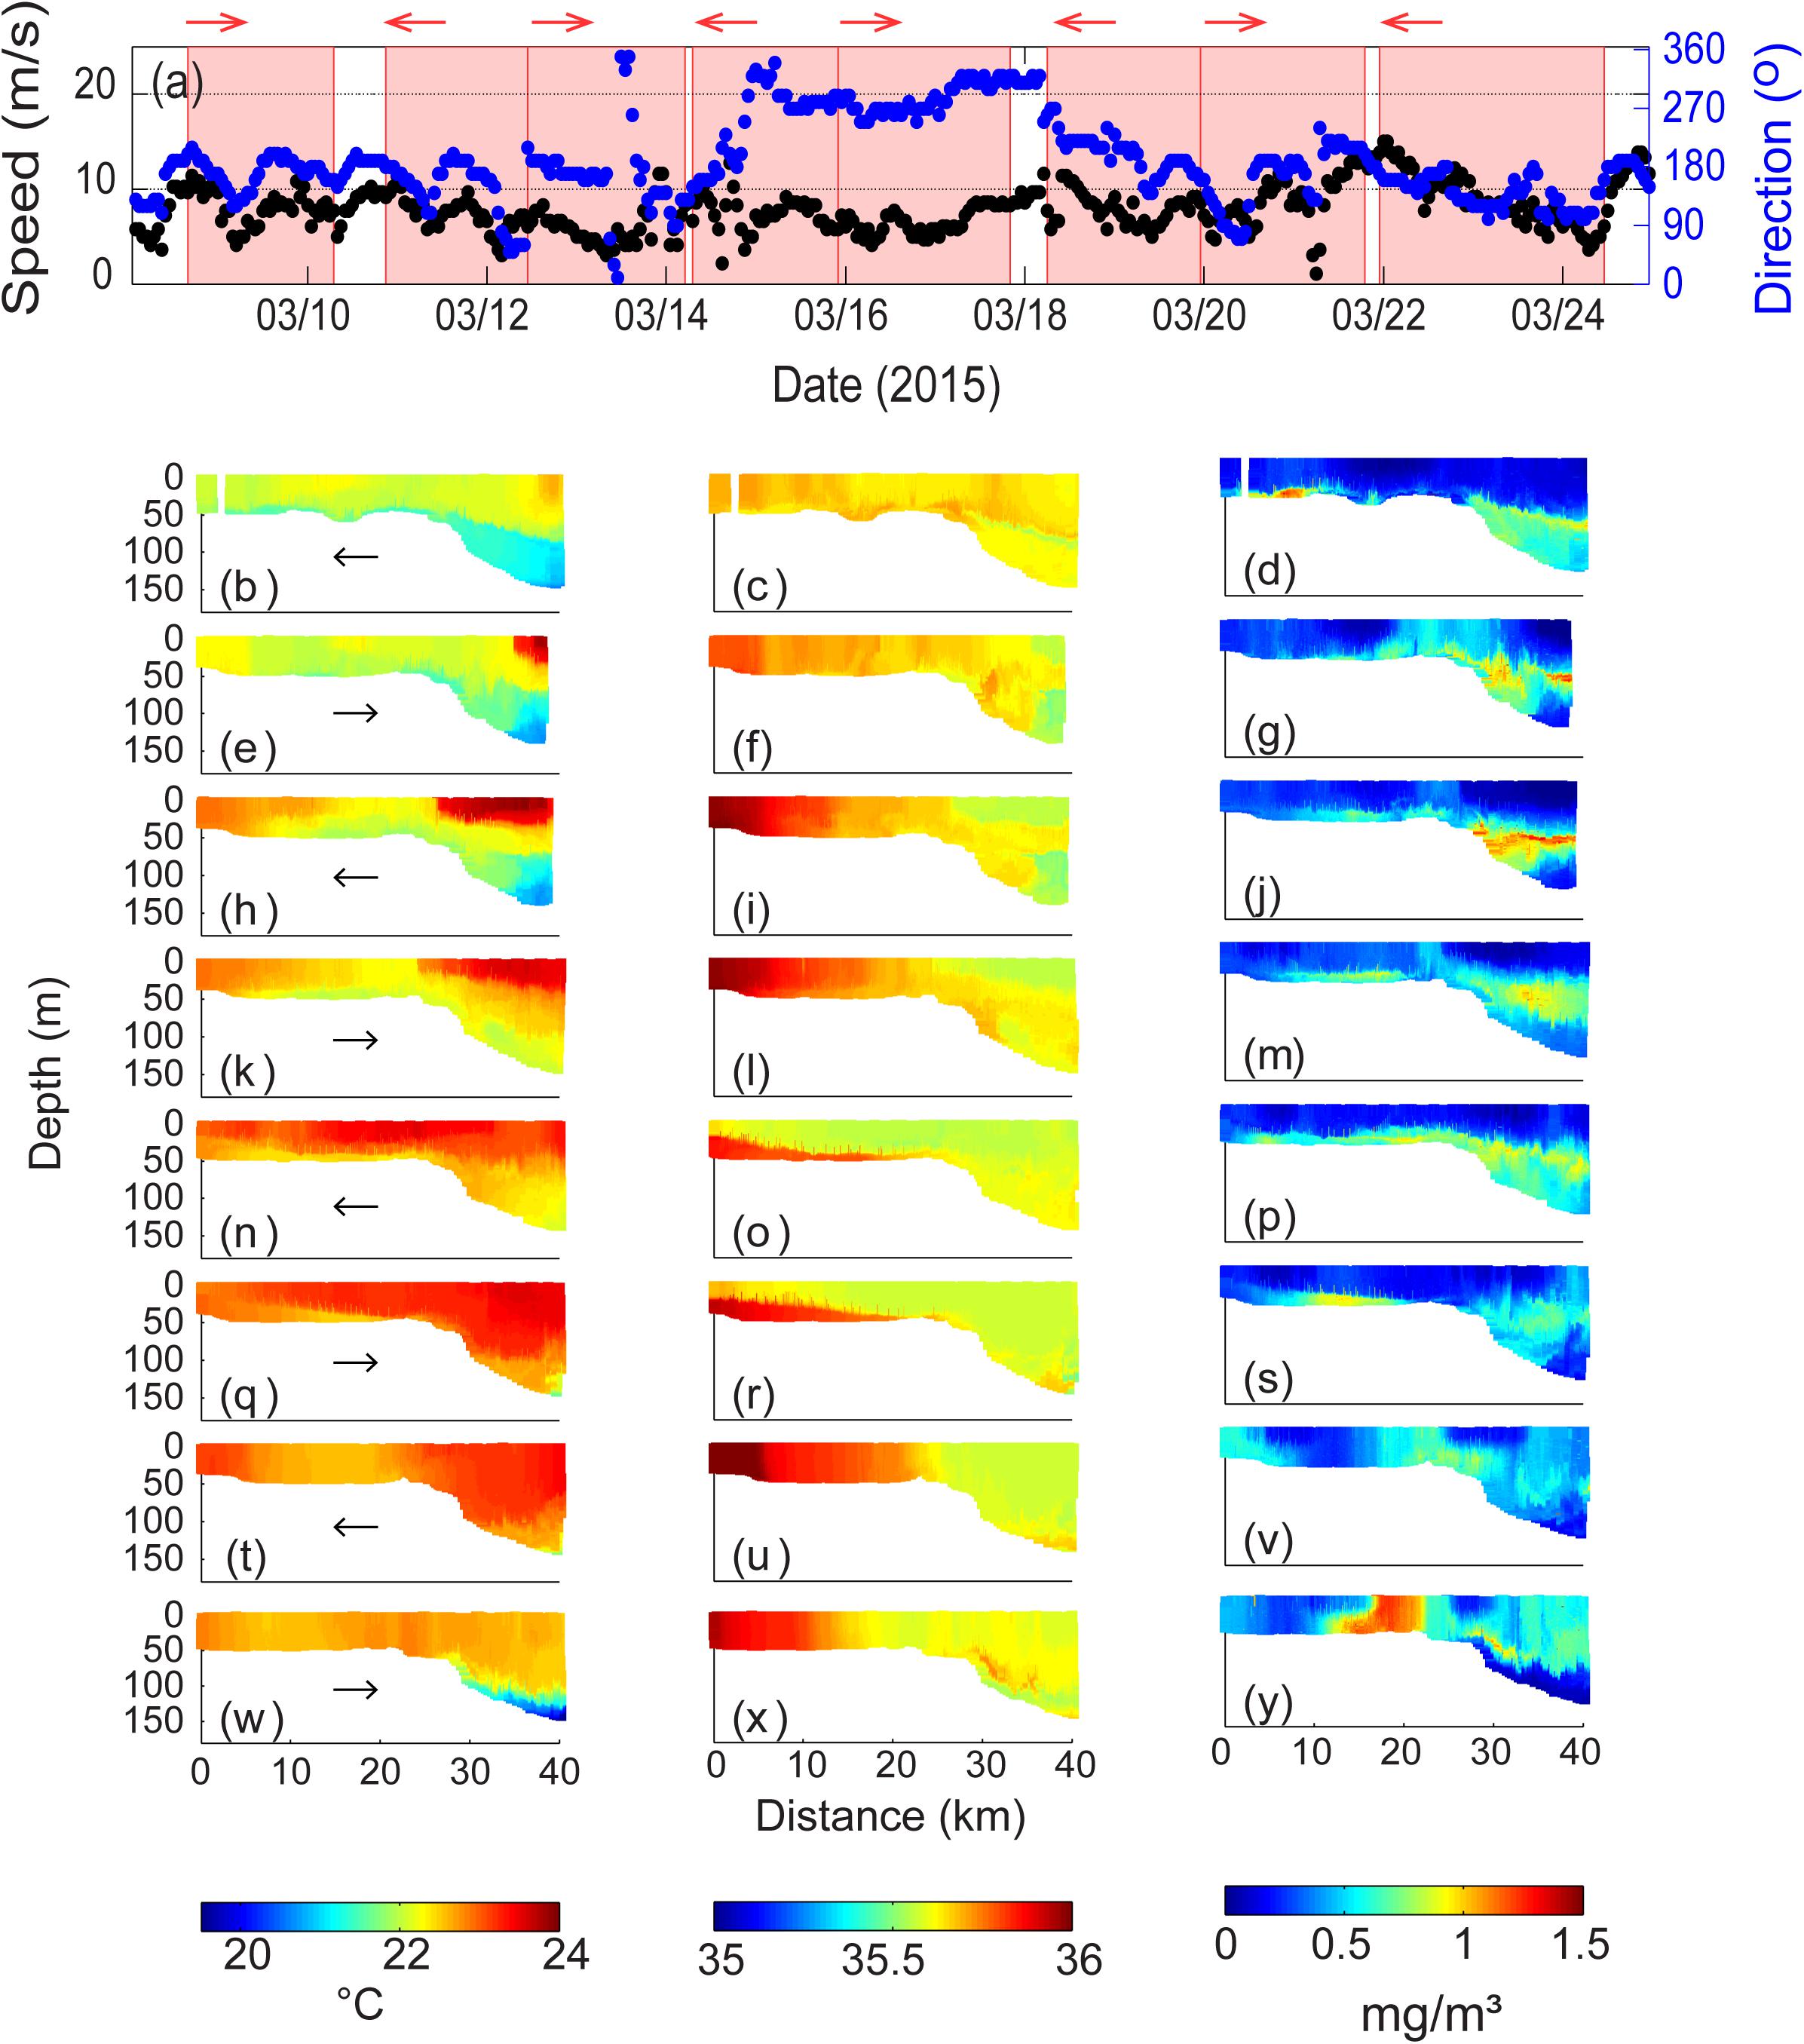
Figure 13. (a) Wind velocity and direction at Rottnest Island during 8–24 March 2015. The shaded areas represent the period of ocean glider transect; Ocean glider vertical cross-sections of (b) temperature (°C); (c) salinity; and (d) chlorophyll (mg m–3) across the Rottnest continental shelf during 8–10 March 2015; (e–g) water properties during 10–12 March 2015; (h–j) water properties during 12–14 March 2015; (k–m) water properties during 14–15 March 2015; (n–p) water properties during 15–18 March 2015; (p–s) water properties during 18–19 March 2015; (t–v) water properties during 19–21 March 2015; and (w–y) water properties during 21–24 March 2015. The glider flight direction is indicated by the arrow.
Sustained southerly winds created an upwelling environment with a strong sea breeze regime generating near-inertial waves causing vertical excursions of the thermocline (Mihanović et al., 2016). The first four transects (Figures 13b–m) represented different stages of the upwelling process with colder water moving up the shelf slope (Figures 13b,e,h,k). In the first transect, temperature distribution indicated a strong upwelling signal offshore the shelf break that extended onto the whole inner shelf as a thin layer at the bottom (Figure 13b). In the next three transects the upwelling signal appeared to have retreated offshore (Figures 13e,h,k). At the seaward end of the transect, a warmer water mass at the surface (0–40 m depth) moved onshore and by the fourth transect was located close to the shelf break (Figure 13k). Waters closer to the coast progressively became warmer and more saline. Chlorophyll concentrations indicated a consistent summer pattern with a SCM in deeper waters and along the seabed on the inner shelf with concentrations ranging 0.4–1.3 mgm–3; maximum chlorophyll levels were found adjacent to the seabed ∼8 km from the coast (Figure 13m). Higher chlorophyll concentration values on the inner shelf were associated with the colder upwelling waters. Vertical distribution of chlorophyll in the deeper waters varied with time, beginning with a well-mixed layer below the thermocline (Figure 13d); vertically mixed at the shelf break (Figure 13g); well-defined SCM (Figure 13J) and a diffuse maximum (Figure 13m).
The wind direction changed to westerly with a slight decrease in wind speed (<10 ms–1) by the fifth transect (14–17 March 2015; Figures 13n,o,p). Onshore winds resulted in warmer waters extending across the inner shelf and the development of a DSWC that is evident in the salinity distribution (Figures 13n,o). However, chlorophyll distribution was similar to that in the first transect (Figure 13p). When the DSWC was well developed (over 18–19 March 2015; Figures 13q,r), a layer of higher chlorophyll waters (up to 0.9 mgm–3) were confined to the cascaded waters (Figure 13s).
The winds reverted to southerly on 20–21 March and increased to >10 ms–1 (Figure 13a). This was associated with strong vertical mixing to ∼100 m in both temperature and salinity although there were cross-shelf changes particularly in salinity with higher salinity water close to the coast (Figures 13t,u). The strong vertical mixing was most likely associated diurnal resonance (Mihanović et al., 2016). Distribution of chlorophyll concentrations changed markedly in comparison to previous transects (Figure 13v): (1) offshore, the SCM was being mixed with chlorophyll extending to the surface at 32–40 km from the coast; (2) higher chlorophyll concentrations extending through the water column was present at shelf edge and was associated with horizontal gradients in temperature and salinity; (3) negligible chlorophyll concentrations in well-mixed waters between 8 and 15 km from the coast; and, (4) higher chlorophyll concentrations near the coast. Higher chlorophyll values close to the seabed observed in previous transects were not present. In the subsequent transect 21–24 March upwelling was developed in deeper water, with cooler (<20°C) waters located offshore close to the seabed (Figure 13w). On the inner shelf temperature and salinity were vertically mixed with a horizontal gradient in salinity (Figures 13w,x). Chlorophyll concentrations indicated lower values in the offshore upwelling water but higher values in the surface layer above the thermocline (Figure 13y). The most significant feature was the presence of a chlorophyll maximum (1.3 mgm–3) at the shelf break – a similar feature was observed in the previous transect but – here the values have increased (Figures 13v,y).
Discussion
In the absence of tidal forcing, coastal systems are mainly controlled by wind forcing, and studies to develop relationships between wind conditions and ocean biology were initiated decades ago (e.g., Denman, 1973). Many studies have highlighted that the action of storms increased coastal productivity (Shiah et al., 1999; Zhang et al., 2014; Chen et al., 2017). These studies were based mainly on satellite remote sensing and thus examined the spatial and temporal variability in the surface waters (e.g., Picado et al., 2014). Here, we investigated the role of different storm events in influencing the chlorophyll distribution (as a proxy for phytoplankton distribution) in a physically dynamic coastal region over small temporal scales (i.e., days) and included the water column up to 200 m water depth. The temporal scale of the storm events was on the order of days that manifest themselves on kilometer scales in the cross-shore and in the alongshore. The study region is dominated by three major wind regimes: calm periods (wind speeds < 5 ms–1), summer and winter storms (max. wind speeds > 15 ms–1). Water column response to these wind regimes included: (1) formation of DSWC in the inner shelf region under calm wind conditions. However, DSWC’s were intensified (with cascading water extending beyond the shelf break) under downwelling favourable winds (westerly and northerly) irrespective of the wind speed; and, (2) storm events induced strong vertical mixing, resuspension of sediment and a subsequent increase in chlorophyll values 2–3 days after storm passage. High spatial and temporal resolution glider data indicated that the physical properties and associated chlorophyll distributions responded rapidly (days) to changing wind conditions.
The ocean glider data indicated that often the maximum chlorophyll concentrations were associated with regions of strong vertical and horizontal gradients in temperature and salinity and therefore density. In the vertical, these regions appeared at the interface separating surface and bottom waters and included: (1) during DSWC on the inner shelf (e.g., Figures 7d, 10d); and, (2) formation of SCM in deeper water, during the summer (e.g., Figures 5d,g,j,m). Regions of horizontal gradients in temperature and salinity are defined as ocean fronts and are known be regions of high productivity globally (e.g., Pingree, 1975; Bowman and Esaias, 1978). Ocean glider data indicated that higher chlorophyll values on the inner shelf were often associated with fronts (e.g., Figures 3d, 5h, 9h, 10l, 12y) and often the fronts were formed subsequent to a wind event. For example, in March 2015 the front, close to the shelf break was formed subsequent to a strong wind event that de-stratified the water column (Figure 13v) and then on the next transect the chlorophyll values increased within the front (Figure 13y). A similar process was observed in May 2016 (Figure 10). In contrast in March 2009 the frontal feature on the seaward side of the DSWC was well established before the strong wind event but was dissipated after the wind event (Figure 3) resulting in a decrease in the chlorophyll concentration (Figure 4). There are many different types of coastal fronts globally with most being those associated tidal mixing and are usually persistent in time and location (Bowman and Esaias, 1978; Nahas et al., 2005). The ocean glider data have shown that in the study region that is dominated by wind forcing the frontal features were highly transient and varying in time, location and duration.
Simultaneous measurement of backscatter and chlorophyll (fluorescence) using the WETLabs BBFL2SLO optical sensor allowed for the creation of backscatter/chlorophyll scatterplots, that also included water depth, and provided a good representation of the changes in backscatter/chlorophyll in response to wind forcing. It is acknowledged that there is no direction relationship between these two parameters except that backscatter is an indicator of resuspension that could provide a source of nutrients from the seabed (Wengrove et al., 2015). However, scatterplots provided interesting features in the system as a result of the wind events: (1) reduction in chlorophyll concentration and increase in backscatter that was due dissipation of a front (Figure 4); (2) depth dependence due to a storm event. Here, the chlorophyll values are initially mixed through the water column (Figure 6a) but after the storm event the chlorophyll values were depth dependent with lower values in the upper 15 m and higher chlorophyll and backscatter in the deeper water (Figure 6b) with the similar pattern repeated after another storm event (Figures 6c,d); and, (3) in a similar case to (2) with depth dependence in chlorophyll values after the storm event except that the values in the surface 25 m increased significantly (Figure 10).
Ocean glider data presented here were obtained along a single repeated transect. In the intervening period between transects there is a strong possibility that some advection of different water masses could have occurred. To examine such changes satellite derived surface concentrations maps obtained before and after storm impacts (Figures 9, 12) were inspected. Maximum currents measured on the shelf during storm events rarely exceed 0.4 ms–1 (Mahjabin et al., 2019a, b). Assuming that the maximum currents flow parallel to the coast, either north or south, over a 3 days period yields a maximum alongshore advection scale of ∼100 km. The north-south scale of the satellite images provided (Figures 9, 12) is of the same magnitude (∼110 km). These images indicate that there is alongshore heterogeneity and that the time scales although comparable have a negligible effect.
The Influence of Wind on Chlorophyll Distribution During DSWC
Under low wind conditions (wind speeds < 5 ms–1), DSWC was the dominant feature in this study region. This reflects the findings by Pattiaratchi et al. (2011) and Mahjabin et al. (2019a; b) that DSWC was a regular occurrence in the study region particularly during autumn and winter months. In autumn, the dense water was formed through changes in salinity resulting from evaporation, whilst in winter; temperature change through surface cooling was the dominant factor (Pattiaratchi et al., 2011).
Enhanced DSWC events with cooler and more saline water extending offshore were observed and coincided with wind conditions that contained a strong onshore component (westerly and northerly) that was downwelling favorable. Under downwelling conditions surface water is transported towards the coast, sinks and then transported to the shelf-break and beyond. Chlorophyll patterns corresponded to these physical features, with maximum chlorophyll concentrations found near the bottom and confined to cascaded waters. An interesting feature was that the strong storm generated westerly and northerly winds often did not induce vertical mixing, indicating the importance of wind direction on physical properties and controlling the shape and biomass of the chlorophyll distribution. This process has been described using field and numerical model studies for the study region by Mahjabin et al. (2019a; b).
Majority of the DSWC events were associated with increased chlorophyll and backscatter in the stratified bottom waters (Figures 10b–e). Chlorophyll levels within the DSWC were likely influenced by nutrient supply from the seabed and trapped in the bottom waters, although nutrients were not measured in this study. However, there were events (e.g., March 2009, Figure 3) where the higher chlorophyll in the surface layer before the storm was replaced with lower chlorophyll after the storm with a corresponding increase in the bottom layer. Here, initially the higher salinity water associated with the DSWC was low in chlorophyll but after the wind event was higher in chlorophyll extending across the inner shelf bottom waters (Figure 3).
The Influence of Winter Storms on Chlorophyll Distribution
The passage of storm systems deliver intense atmospheric forcing that greatly influence both hydrographic and optical properties in the entire water column, and can cause resuspension of particulate matter, likely due to wave shear stress (Fanning et al., 1982; Gardner et al., 2001; Pusceddu et al., 2005; Yang et al., 2007; Verspecht and Pattiaratchi, 2010). Backscatter readings collected from gliders have been used in sediment resuspension and transport studies (Glenn et al., 2008; Miles et al., 2015; Pattiaratchi and de Oliveira, 2016). Resuspension was typically observed during storm events in this study, where high backscatter concentrations were vertically distributed. A previous study in southwestern Australia coastal waters quantified the importance of storms in the resuspension of particulate matter (Verspecht and Pattiaratchi, 2010). The main influence of storms in this oligotropic environment is likely to be through enhancement of sediment-water fluxes of remineralised nutrients associated with suspended particulate matter (SPM) and/or resuspension of heterotrophic bacteria (Amon and Benner, 1996; Hakanson, 2006; Wengrove et al., 2015). As the study located is located in a Mediterranean climate, light availability was not a limiting factor for phytoplankton growth.
Wind-induced mixing has indeed been shown to effectively determine the spread of algal blooms in coastal seas (Tian et al., 2009; Mei et al., 2010; Su et al., 2015; Schultze et al., 2020). The response of chlorophyll during wind events has been observed by satellite, to a degree, during and immediately after storm events, and elevated surface pigments are a consequence of entrainment to the surface chlorophyll - rich water and/or new production due to the injection of nutrients from below the nutricline (Koslow et al., 2008; Shropshire et al., 2016). It should be noted that the maximum chlorophyll did not always coincide with the timing of the storm impact. For example, in two glider transects (September 2011), chlorophyll levels were low (0.9 mgm–3) during storm events, and increased (to 1.2 mgm–3) 1–3 days after the passage of storms, as wind speeds decreased. Similarly, a transect from May 2009, that captured the changes in chlorophyll levels coinciding with the transition from storm (18 ms–1) to calm (5 ms–1) conditions. Here, when the winds decreased chlorophyll values increased from 0.9 to 1.5 mgm–3. Su et al. (2015) revealed that resuspension of particulate matter induced by strong winds can limit algal growth, but can also enhance productivity because of the intrusion of nutrient rich waters from sediments or bottom water layers into the whole water column. Brandini and Rebello (1994) found that turbulence induced by winds suspended sediments and benthic diatoms in the shallow waters, increasing turbidity and nutrient concentrations at the surface. During wind relaxation, mass sedimentation of previously resuspended benthic diatoms caused the increasing of chlorophyll in the subsurface layers. In oligotrophic environments, the processes that are able to transport nutrients from below the pycnocline to the upper ocean are essential for the local primary production.
The Influence of Summer Storms on Chlorophyll Distribution
Summer storms are associated with southerly winds that are upwelling favorable. Daneri et al. (2012) revealed that biological productivity can vary considerably due to short-term changes in wind conditions (during active upwelling and relaxation periods) based on field data in the upper 10 m. In this study, strong persistent southerly winds (>10 ms–1) associated with summer storms indicated upwelling of colder water at the shelf break (e.g., Figure 13). The colder water was also associated with relatively high chlorophyll concentrations (∼0.5 mgm–3) below 40 m depth; during wind relaxation (5 ms–1), chlorophyll values increased to 1.2 mgm–3 within a thin layer near the shelf break region, between 50 and 100 m depth. The study region is located where the inertial period and the wind forcing (sea breeze) are close to 24-h period resulting in a resonance condition (Mihanović et al., 2016; Chen, 2018). As a result of this resonance near-inertial waves are generated that lead to large vertical excursions in the thermocline. Diurnal wind forcing due to the sea breeze is southerly and is thus upwelling favorable and the water column responds to both albeit at different time scales. The mean southerly winds promote the classical upwelling whilst the diurnal resonance results in the changes to the upwelling plume on a daily basis (Chen, 2018). Response of the chlorophyll concentration to this combined forcing was reflected mainly along the continental slope, seaward of the shelf break, where the chlorophyll concentration was distributed over a larger depth range than further offshore (e.g., Figure 13).
Numerous studies of chlorophyll distributions in upwelling regions have been characterized by a surface chlorophyll maximum (Hanson et al., 2005; Pietri et al., 2013; Ryan et al., 2014; Zhang et al., 2015) and/or SCM (Hanson et al., 2005; Niewiadomska et al., 2008; Karstensen et al., 2014). Chlorophyll is typically associated with the pycnocline during relaxation periods and then brought into upper waters during active upwelling (Wolanski and Delesalle, 1995; Karstensen et al., 2014; Ryan et al., 2014). This classic upwelling paradigm invokes an advective and therefore reversible process. We also found this to be the case off southwestern Australia during March 2015, where high biomass was located in the deeper, colder (21°C) upwelled waters and moved onto the shelf.
Implications
The dynamic coastal ocean is a region of high global ocean primary, mainly due to different sources of nutrient supply (e.g., from terrestrial, open ocean and local regeneration) and experience variability at different time scales from O(hours) to inter-annual. In this paper, we used water column data obtained using ocean gliders at high temporal and spatial scales under storm conditions when traditional shipborne data are unavailable. The ocean glider data captured the water column structure under storms (both strength and direction) and indicated that the water column responded rapidly to changes in wind conditions, shifting between vertical stratification and mixing (e.g., mixing to DSWC; DSWC to mixing) over periods of 1–3 days. Majority of the storms occurred during winter with ∼40 storm events occurring during the winter months which are generally followed by calm periods. Previous studies have shown that extreme wind forcing (e.g., through tropical storms) have shown to stimulate higher chlorophyll levels (Bianucci et al., 2018; Schultze et al., 2020). In this study, located in an oligotrophic environment with low river run-off also indicated higher chlorophyll levels resulting from passage of storm systems that were not as severe as tropical storms (maximum wind speeds ∼25 ms–1).
Although the study region is located along the eastern boundary of south Indian Ocean and is subject to upwelling favorable winds, there is no large scale upwelling due to the presence of the Leeuwin Current that suppress upwelling and transports low nutrient water along the continental shelf (Twomey et al., 2007). The seasonal cycle of chlorophyll concentrations indicated an absence of a ‘spring’ bloom with the maximum observed between April and August (late autumn to winter) and minima in February (Chen et al., 2019). The ocean glider data indicated that 2–3 days after passage of a storm the chlorophyll concentrations increased significantly when compared to climatology. For example, the winter storms during May 2009, 2016 storm events the maximum chlorophyll concentration reached 2.5 and 1.75 mgm–3 (Figures 8, 11) in comparison to the climatology value of 1.12 mgm–3 (Figure 2). Similar increases were also observed during March and September. It is likely that stimulation of chlorophyll due to storm action is a major contributor to higher values during late autumn and winter.
Conclusion
In this study, we investigated physical water column properties and phytoplankton distributions, in response to different storm and oceanographic conditions over small time scales (i.e., days). The water column was found to respond to changes in wind conditions quickly, shifting between stratification to mixing (e.g., upwelling to DSWC; DSWC to mixing) over 1–3 days. During storm events (wind speeds > 15 ms–1) higher chlorophyll values were confined in the well-mixed waters. However, higher chlorophyll levels were observed 1–3 days after the passage of storms subsequent to sediment re-suspension. Strong onshore winds (westerly) and downwelling favourable winds (northerly) (up to 20 ms–1), did not induce mixing when a DSWC was present, suggesting that wind direction was crucial in controlling mixing and stratification than wind speed.
Data Availability Statement
The datasets analyzed for this study can be found in the Australian Ocean Data Network (https://portal.aodn.org.au).
Author Contributions
MC, CP, AG, and CH conceived the study. MC and CP performed the data analysis. MC, CP, AG, and CH interpreted the data. MC led the writing of the manuscript assisted by CP. All authors read and approved the final manuscript.
Funding
The data used in this study were obtained through the Integrated Marine Observing System (IMOS) that is enabled by the National Collaborative Research Infrastructure Strategy (NCRIS). It is operated by a consortium of institutions as an unincorporated joint venture, with the University of Tasmania as Lead Agent. MC was supported by a scholarship from the Australian Government Research Training Program (RTP) and a top-up scholarship and international research fees waiver from The University of Western Australia.
Conflict of Interest
The authors declare that the research was conducted in the absence of any commercial or financial relationships that could be construed as a potential conflict of interest.
Acknowledgments
The ocean glider data were sourced from the Integrated Marine Observing System (IMOS) ocean glider facility located at the University of Western Australia. Ocean color data were also sourced from IMOS. All IMOS data are available through the Australian Ocean Data Network (https://portal.aodn.org.au). The meteorological data were obtained by the Bureau of Meteorology. The authors acknowledge the support of Dennis Stanley, Paul Thomson, Kah Kiat Hong, and Mun Woo for the tasks associated with the deployment and recovery of the gliders, glider piloting, and conducting the QA and QC of the ocean glider data.
Footnotes
References
Amon, R. M. W., and Benner, R. (1996). Bacterial utilization of different size classes of dissolved organic matter. Limnol. Oceanogr. 41, 41–51.
Andrews, W. R. H., and Hutchings, L. (1980). Upwelling in the Southern Benguela Current. Prog. Oceanogr. 9, 1–81.
Babin, S. M., Carton, J. A., Dickey, T. D., and Wiggert, J. D. (2004). Satellite evidence of hurricane-induced phytoplankton blooms in an oceanic desert. J. Geophys. Res. 109:C03043.
Bakun, A. (1990). Global climate change and intensification of coastal ocean upwelling. Science 247, 198–201. doi: 10.1126/science.247.4939.198
Bianucci, L., Balaguru, K., Smith, R. W., Leung, L. R., and Moriarty, J. M. (2018). Contribution of hurricane-induced sediment resuspension to coastal oxygen dynamics. Sci. Res. 8:15740.
Blauw, A. N., Benincà, E., Laane, R. W. P. M., Greenwood, N., and Huisman, J. (2018). Predictability and environmental drivers of chlorophyll fluctuations vary across different time scales and regions of the North Sea. Prog. Oceanogr. 161, 1–18.
Bowman, M. J., and Esaias, W. E. (eds) (1978). Oceanic Fronts in Coastal Processes. New York, NY: Springer-Verlag, 114.
Brandini, F. P., and Rebello, J. (1994). Wind field effect on hydrography and chlorophyll dynamics in the coastal pelagial of Admiralty Bay, King George Island, Antarctica. Antar. Sci. 6, 433–442. doi: 10.1017/s0954102094000672
Bueti, M. R., Ginis, I., Rothstein, L. M., and Griffies, S. M. (2014). Tropical Cyclone–Induced Thermocline Warming and Its Regional and Global Impacts. J. Climate 27, 6978–6999. doi: 10.1175/JCLI-D-14-00152.1
Chen, D., He, L., Liu, F., and Yin, K. (2017). Effects of typhoon events on chlorophyll and carbon fixation in different regions of the East China Sea. Estuar. Coast. Shelf Sci. 194, 229–239.
Chen, M. (2018). Chlorophyll Response to Physical Forcing on the Rottnest Continental Shelf. Ph.D. thesis, The University of Western Australia, Crawley.
Chen, M., Pattiaratchi, C. B., Ghadouani, A., and Hanson, C. (2019). Seasonal and inter-annual variability of water column properties along the Rottnest continental shelf, south-west Australia. Ocean Sci. 15, 333–348.
Claustre, H., Kerhervé, P., Marty, J. C., Prieur, L., Videau, C., and Hecq, J.-H. (1994). Phytoplankton dynamics associated with a geostrophic front: ecological and biogeochemical implications. J. Mar. Res. 52, 711–742.
Cresswell, G. R., and Golding, T. J. (1980). Observations of a south-flowing current in the southeastern Indian Ocean. Deep Sea Res. Part A Oceanogr. Res. Pap. 27, 449–466.
Daneri, G., Lizárraga, L., Montero, P., González, H. E., and Tapia, F. J. (2012). Wind forcing and short-term variability of phytoplankton and heterotrophic bacterioplankton in the coastal zone of the Concepción upwelling system (Central Chile). Prog. Oceanogr. 9, 92–96.
Denman, K. L. (1973). A time-dependent model of the upper Ocean. J. Phys. Oceanogr. 3, 173–184. doi: 10.1175/1520-0485(1973)003<0173:atdmot>2.0.co;2
Fanning, K. A., Carder, K. L., and Betzer, P. R. (1982). Sediment resuspension by coastal waters: a potential mechanism for nutrient re-cycling on the ocean’s margins. Deep Sea Res. A 29, 953–965.
Ferreira Cordeiro, N. G., Dubert, J., Nolasco, R., and Desmond Barton, E. (2018). Transient response of the Northwestern Iberian upwelling regime. PLoS One 13:e0197627. doi: 10.1371/journal.pone.0197627
Freitas, F., Siegel, D. A., Washburn, L., Halewood, S., and Stassinos, E. (2016). Assessing controls on cross-shelf phytoplankton and suspended particle distributions using repeated bio-optical glider surveys. J. Geophys. Res. Oceans 121, 7776–7794.
Fujii, M., and Yamanaka, Y. (2008). Effects of storms on primary productivity and air-sea CO2 exchange in the subarctic western North Pacific: a modeling study. Biogeosciences 5, 1189–1197.
Gallop, S. L., Verspecht, F., and Pattiaratchi, C. B. (2012). Sea breezes drive currents on the inner continental shelf off southwest Western Australia. Ocean Dyn. 62, 569–583.
Gardner, W. D., Blakey, J. C., Walsh, I. D., Richardson, M. J., Pegau, S., Zaneveld, J. R. V., et al. (2001). Optics, particles, stratification, and storms on the New England continental shelf. J. Geophys. Res. 106, 9473–9497.
Gersbach, G. H., Pattiaratchi, C. B., Ivey, G. N., and Cresswell, G. R. (1999). Upwelling on the south-west coast of Australia—source of the Capes Current? Cont. Shelf Res. 19, 363–400.
Glenn, S., Jones, C., Twardowski, M., Bowers, L., Kerfoot, J., Kohut, J., et al. (2008). Glider observations of sediment resuspension in a Middle Atlantic Bight fall transition storm. Limnol. Oceanogr. 53, 2180–2196.
Hakanson, L. (2006). Suspended Particulate Matter in Lakes, Rivers, and Marine Systems. Caldwell, ID: Blackburn Press.
Hanson, C. E., Pattiaratchi, C. B., and Waite, A. M. (2005). Sporadic upwelling on a downwelling coast: phytoplankton responses to spatially variable nutrient dynamics off the Gascoyne region of Western Australia. Cont. Shelf Res. 25, 1561–1582.
Hanson, C. E., Pesant, S., Waite, A. M., and Pattiaratchi, C. B. (2007). Assessing the magnitude and significance of deep chlorophyll maxima of the coastal eastern Indian Ocean. Deep Sea Res. Part II Top. Stud. Oceanogr. 54, 884–901.
Jacob, S. D., Shay, L. K., Mariano, A. J., and Black, P. G. (2000). The 3D oceanic mixed layer response to hurricane gilbert. J. Phys. Oceanogr. 30, 1407–1429. doi: 10.1175/1520-0485(2000)030<1407:tomlrt>2.0.co;2
Karstensen, J., Liblik, T., Fischer, J., Bumke, K., and Krahmann, G. (2014). Summer upwelling at the Boknis Eck time-series station (1982 to 2012) – a combined glider and wind data analysis. Biogeosciences 11, 3603–3617.
Klinck, J. M. (1996). Circulation near submarine canyons: a modeling study. J. Geophys. Res. 101, 1211–1223.
Koslow, J. A., Pesant, S., Feng, M., Pearce, A., Fearns, P., Moore, T., et al. (2008). The effect of the Leeuwin Current on phytoplankton biomass and production off Southwestern Australia. J. Geophys. Res. 113:C07050. doi: 10.1029/2007JC004102
Kotta, D., and Kitsiou, D. (2019). Medicanes Triggering Chlorophyll Increase. J. Mar. Sci. Eng. 7, 75. doi: 10.3390/jmse7030075
Kuret, A. (2011). Seasonal Variability in Phytoplankton Biomass off the South-West of Western Australia: A Phenology of the Winter Bloom. Honour’s thesis The University of Western Australia, Crawley.
Lemay, J., Thomas, H., Craig, S. E., Burt, W. J., Fennel, K., Blair, J. W., et al. (2018). Hurricane Arthur and its effect on the short-term variability of pCO2 on the Scotian Shelf, NW Atlantic. Biogeosciences 15, 2111–2123.
Liu, F., Su, J., Moll, A., Krasemann, H., Chen, X., Pohlmann, T., et al. (2013). Assessment of the summer–autumn bloom in the Bohai Sea using satellite images to identify the roles of wind mixing and light conditions. J. Mar. Syst. 129, 303–317.
Mahjabin, T., Pattiaratchi, C., Hetzel, Y., and Janekovic, I. (2019a). Spatial and temporal variability of dense shelf water cascades along the Rottnest continental shelf in southwest Australia. J. Mar. Sci. Eng. 7:30.
Mahjabin, T., Pattiaratchi, C. B., and Hetzel, Y. (2019b). Wind effects on dense shelf water cascades in south-west Australia. Cont. Shelf Res. 189:103975. doi: 10.1016/j.csr.2019.103975
Martellucci, R., Pierattini, A., De Mendoza, F. P., Melchiorri, C., Piermattei, V., and Marcelli, M. (2018). Physical and biological water column observations during summer sea/land breeze winds in the Coastal Northern Tyrrhenian Sea. Water 10:1673. doi: 10.3390/w10111673
Mei, Z.-P., Saucier, F. J., Le Fouest, V., Zakardjian, B., Sennville, S., Xie, H., et al. (2010). Modeling the timing of spring phytoplankton bloom and biological production of the Gulf of St. Lawrence (Canada): effects of colored dissolved organic matter and temperature. Cont. Shelf Res. 30, 2027–2042.
Mihanović, H., Pattiaratchi, C., and Verspecht, F. (2016). Diurnal Sea Breezes Force Near-Inertial Waves along Rottnest Continental Shelf, Southwestern Australia. J. Phys. Oceanogr. 46, 3487–3508.
Miles, T., Seroka, G., Kohut, J., Schofield, O., and Glenn, S. (2015). Glider observations and modeling of sediment transport in Hurricane Sandy. J. Geophys. Res. Oceans 120, 1771–1791.
Moline, M. A. (1998). Photoadaptive response during the development of a coustal Antarctic diatom bloom and relationship to water column stability. Limnol. Oceanogr. 43, 146–153.
Montecino, V., and Lange, C. B. (2009). The Humboldt Current System: ecosystem components and processes, fisheries, and sediment studies. Prog. Oceanogr. 83, 65–79.
Nahas, E. L., Pattiaratchi, C. B., and Ivey, G. N. (2005). Processes controlling the position of frontal systems in Shark Bay, Western Australia. Estuar. Coast. Shelf Sci. 65, 463–474.
Niewiadomska, K., Claustre, H., Prieur, L., and d’Ortenzio, F. (2008). Submesoscale physical-biogeochemical coupling across the Ligurian current (northwestern Mediterranean) using a bio-optical glider. Limnol. Oceanogr. 53, 2210–2225.
Nykjaer, L., and Van Camp, G. (1994). Seasonal and interannual variability of coastal upwelling along Northwest Africa and Portugal from 1981 to 1991. J. Geophys. Res. 99, 14197–14207.
O’Boyle, S., and Silke, J. (2010). A review of phytoplankton ecology in estuarine and coastal waters around Ireland. J. Plankton Res. 32, 99–118.
Pattiaratchi, C., and de Oliveira, G. L. (2016). “Sediment re-suspension processes along the Australian north-west shelf revealed by ocean gliders,” in Proceedings of the 20th Australasian Fluid Mechanics Conference, Crawley.
Pattiaratchi, C., and Eliot, M. (2008). “Sea level variability in south-west Australia: from hours to decades,” in Coastal Engineering 2008, Vol. 5, ed. J. McKee Smith (Singapore: World Scientific), 1186–1198.
Pattiaratchi, C., Hegge, B., Gould, J., and Eliot, I. (1997). Impact of sea-breeze activity on nearshore and foreshore processes in southwestern Australia. Cont. Shelf Res. 17, 1539–1560.
Pattiaratchi, C., Hollings, B., Woo, M., and Welhena, T. (2011). Dense shelf water formation along the south-west Australian inner shelf. Geophys. Res. Lett. 38:L10609.
Pattiaratchi, C., and Woo, M. (2009). The mean state of the Leeuwin Current system between North West Cape and Cape Leeuwin. J. R. Soc. West. Aust. 92, 221–241.
Pattiaratchi, C., Woo, M., Thomson, P. G., Hong, K. K., and Stanley, D. (2017). Ocean glider observations around Australia. Oceanography 30, 90–91.
Pattiaratchi, C. B., Parslow, J., Pearce, A. F., and Hick, P. T. (1990). “Application of coastal zone colour scanner (CZCS) imagery for productivity and circulation studies of the Leeuwin current, Western Australia,” in Proceedings of the Fifth Australasian Remote Sensing Conference, Vol. 1, Perth, 252–255.
Pearce, A., Helleren, S., and Marinelli, M. (2000). Review of Productivity Levels of Western Australian Coastal and Estuarine Waters for Mariculture Planning Purposes, Fisheries Research Report (Perth, W.A.). Perth: Fisheries Western Australia.
Pearce, A., and Pattiaratchi, C. (1999). The Capes Current: a summer countercurrent flowing past Cape Leeuwin and Cape. Cont. Shelf Res. 19, 401–420.
Picado, A., Alvarez, I., Vaz, N., Varela, R., Gomez-Gesteira, M., and Dias, J. M. (2014). Assessment of chlorophyll variability along the North western Coast of Iberian Peninsula. J. Sea Res. 93, 2–11. doi: 10.1016/j.seares.2014.01.008
Pietri, A., Testor, P., Echevin, V., Chaigneau, A., Mortier, L., Eldin, G., et al. (2013). Finescale vertical structure of the upwelling system off Southern Peru as observed from glider data. J. Phys. Oceanogr. 43, 631–646.
Pinckney, J. L., Paerl, H. W., and Harrington, M. B. (1999). Responses of the phytoplankton community growth rate to nutrient pulses in variable estuarine environments. J. Phycol. 35, 1455–1463.
Pingree, R. (1975). The advance and retreat of the thermocline on the continental shelf. J. Mar. Biol. Assoc. U.K. 55, 965–974.
Pusceddu, A., Grémare, A., Escoubeyrou, K., Amouroux, J. M., Fiordelmondo, C., and Danovaro, R. (2005). Impact of natural (storm) and anthropogenic (trawling) sediment resuspension on particulate organic matter in coastal environments. Cont. Shelf Res. 2506–2520.
Rossi, V., Feng, M., Pattiaratchi, C., Roughan, M., and Waite, A. M. (2013). On the factors influencing the development of sporadic upwelling in the Leeuwin Current system. J. Geophys. Res. Oceans 118, 3608–3621.
Ryan, J. P., Harvey, J. B. J., Zhang, Y., and Woodson, C. B. (2014). Distributions of invertebrate larvae and phytoplankton in a coastal upwelling system retention zone and peripheral front. J. Exp. Mar. Biol. Ecol. 459, 51–60.
Sackmann, B. S., Perry, M. J., and Eriksen, C. C. (2008). Seaglider observations of variability in daytime fluorescence quenching of chlorophyll-a in Northeastern Pacific coastal waters. Biogeosci. Dis. 5, 2839–2865.
Schofield, O., Prezelin, B. B., Bidigare, R. R., and Smith, R. C. (1993). In situ photosynthetic quantum yield. Correspondence to hydrographic and optical variability within the Southern California Bight. Mar. Ecol. Prog. Ser. 93, 25–37.
Schultze, L. K. P., Merckelbach, L. M., and Carpenter, J. R. (2020). Storm-induced turbulence alters shelf sea vertical fluxes. Limnol. Oceanogr. Lett. doi: 10.1002/lol2.10139
Sharples, J., Moore, M. C., Rippeth, T. P., Holligan, P. M., Hydes, D. J., Fisher, N. R., et al. (2001). Phytoplankton distribution and survival in the thermocline. Limnol. Oceanogr. 46, 486–496.
Shiah, F.-K., Chung, S.-W., Kao, S.-J., Gong, G.-C., and Liu, K.-K. (2000). Biological and hydrographical responses to tropical cyclones (typhoons) in the continental shelf of the Taiwan Strait. Cont. Shelf Res. 20, 2029–2044.
Shiah, F.-K., Liu, K.-K., and Gong, G.-C. (1999). Temperature versus substrate limitation of heterotrophic bacterioplankton production across trophic and temperature gradients in the East China Sea. Aquatic Microbiol. Ecol. 17, 247–254. doi: 10.3354/ame017247
Shropshire, T., Li, Y., and He, R. (2016). Storm impact on sea surface temperature and chlorophyll a in the Gulf of Mexico and Sargasso Sea based on daily cloud-free satellite data reconstructions. Geophys. Res. Lett. 43:GL071178.
Smith, R. L., Huyer, A., Godfrey, J. S., and Church, J. A. (1991). The Leeuwin Current off Western Australia, 1986–1987. J. Phys. Oceanogr. 21, 323–345.
Su, J., Tian, T., Krasemann, H., Schartau, M., and Wirtz, K. (2015). Response patterns of phytoplankton growth to variations in resuspension in the German Bight revealed by daily MERIS data in 2003 and 2004. Oceanologia 57, 328–341.
Tian, T., Merico, A., Su, J., Staneva, J., Wiltshire, K., and Wirtz, K. (2009). Importance of resuspended sediment dynamics for the phytoplankton spring bloom in a coastal marine ecosystem. J. Sea Res. 62, 214–228.
Twomey, L. J., Waite, A. M., Pez, V., and Pattiaratchi, C. B. (2007). Variability in nitrogen uptake and fixation in the oligotrophic waters off the south west coast of Australia. Deep Sea Res. Part II Top. Stud. Oceanogr. 54, 925–942. doi: 10.1016/j.dsr2.2006.10.001
Ulses, C., Estournel, C., Bonnin, J., Durrieu de Madron, X., and Marsaleix, P. (2008). Impact of storms and dense water cascading on shelf-slope exchanges in the Gulf of Lion (NW Mediterranean). J. Geophys. Res. 113:C02010.
Verspecht, F., and Pattiaratchi, C. (2010). On the significance of wind event frequency for particulate resuspension and light attenuation in coastal waters. Cont. Shelf Res. 30, 1971–1982.
Walsh, J. J. (1991). Importance of continental margins in the marine biogeochemical cycling of carbon and nitrogen. Nature 350, 753–755.
Weaver, A. J., and Middleton, J. H. (1989). On the Dynamics of the Leeuwin Current. J. Phys. Oceanogr. 19, 626–648.
Wengrove, M. E., Foster, D. L., Kalnejais, L. H., Percuoco, V., and Lippmann, T. C. (2015). Field and laboratory observations of bed stress and associated nutrient release in a tidal estuary. Estuar. Coast. Shelf Sci. 161, 11–24.
Wijeratne, E. M. S., Pattiaratchi, C. B., and Proctor, R. (2018). Estimates of surface and subsurface boundary current transport around Australia. J. Geophys. Res. Oceans 123, 3444–3466.
Wolanski, E., and Delesalle, B. (1995). Upwelling by internal waves, Tahiti, French Polynesia. Cont. Shelf Res. 15, 357–368.
Woo, M. (2017). Australian National Facility for Ocean Gliders (ANFOG) Data Management User Manual. Available online at: http://imos.org.au/fileadmin/user_upload/shared/ANFOG/ANFOG_DataManagement_UsersManual_v5.01_Mar30.pdf (accessed March 30, 2017).
Woo, M., and Pattiaratchi, C. (2008). Hydrography and water masses off the western Australian coast. Deep Sea Res. Part I Oceanogr. Res. Pap. 55, 1090–1104.
Yang, Z., Lei, K., Guo, Z., and Wang, H. (2007). Effect of a Winter Storm on Sediment Transport and Resuspension in the Distal Mud Area, the East China Sea. J. Coast. Res. 310–318.
Yin, K., Zhang, J., Qian, P.-Y., Jian, W., Huang, L., Chen, J., et al. (2004). Effect of wind events on phytoplankton blooms in the Pearl River estuary during summer. Cont. Shelf Res. 24, 1909–1923.
Zhang, S., Xie, L., Hou, Y., Zhao, H., Qi, Y., and Yi, X. (2014). Tropical storm-induced turbulent mixing and chlorophyll-a enhancement in the continental shelf southeast of Hainan Island. J. Mar. Syst. 129, 405–414.
Keywords: chlorophyll, winds, storms, ocean gliders, south-west Australia
Citation: Chen M, Pattiaratchi CB, Ghadouani A and Hanson C (2020) Influence of Storm Events on Chlorophyll Distribution Along the Oligotrophic Continental Shelf Off South-Western Australia. Front. Mar. Sci. 7:287. doi: 10.3389/fmars.2020.00287
Received: 21 August 2019; Accepted: 08 April 2020;
Published: 05 May 2020.
Edited by:
Alejandro Jose Souza, Centro de Investigacion y de Estudios Avanzados – Unidad Mérida, MexicoReviewed by:
Antonio Olita, Italian National Research Council (CNR), ItalyRicardo Torres, Plymouth Marine Laboratory, United Kingdom
Copyright © 2020 Chen, Pattiaratchi, Ghadouani and Hanson. This is an open-access article distributed under the terms of the Creative Commons Attribution License (CC BY). The use, distribution or reproduction in other forums is permitted, provided the original author(s) and the copyright owner(s) are credited and that the original publication in this journal is cited, in accordance with accepted academic practice. No use, distribution or reproduction is permitted which does not comply with these terms.
*Correspondence: Miaoju Chen, cmiaoju@gmail.com; Charitha B. Pattiaratchi, chari.pattiaratchi@uwa.edu.au