Assessments of 14 Exploited Fish and Invertebrate Stocks in Chinese Waters Using the LBB Method
 Cui Liang
 Weiwei Xian
 Shude Liu4
  Daniel Pauly
- 1CAS Key Laboratory of Marine Ecology and Environmental Sciences, Institute of Oceanology, Chinese Academy of Sciences, Qingdao, China
- 2Laboratory for Marine Ecology and Environmental Science, Qingdao National Laboratory for Marine Science and Technology, Qingdao, China
- 3Center for Ocean Mega-Science, Chinese Academy of Sciences, Qingdao, China
- 4Shandong Hydrobios Resources Conservation and Management Center, Yantai, China
- 5Sea Around Us, Institute for the Oceans and Fisheries, University of British Columbia, Vancouver, BC, Canada
Due to limited data availability, only a small subset of the exploited fish and invertebrate populations have been assessed along Chinese coasts, which precludes comprehensive management of the fisheries. Here, we applied a length-based Bayesian biomass estimator (LBB) to 14 fish and invertebrate stocks in China’s coastal waters to estimate their growth, length at first capture and current relative biomass (B/B0, B/BMSY) from length-frequency (LF) data. Of the 14 populations assessed, one have collapsed, nine are grossly over-exploited, and three are overfished. Moreover, 13 populations have smaller mean lengths at first capture (Lc) than the optimal length at first capture (Lc_opt), indicating that they are suffering from growth overfishing. Thus, larger mesh sizes in commercial fishery would increase both the catch and biomass for these species, given current levels of fishing mortality. Our results confirm that fishery resources in China’s coastal waters are strongly depleted, and that stricter management measures are needed to restore the abundance of China’s marine fisheries resources.
Introduction
As a result of decades of rapid development, China has become the country with the world’s largest fishery (FAO, 2018). Currently, China’s marine catch is around 10 million metric tons, with the bottom trawl fishery accounting for five million metric tons. However, this high reported catch is associated with very low catch per unit of effort, and the “fishing down” phenomenon was also shown to occur. Thus, to effectively rebuild fishery resources in China, robust management systems are needed, based on reliable stock assessment.
Most stock assessment models are designed to estimate fisheries and population-related reference points using fisheries-independent data sets, such as catch-at-age data and biomass estimates from scientific surveys (Methot and Wetzel, 2013). However, in China, due to limited data and expertise, only a small subset of the commercially exploited stocks, such as largehead hairtail Trichiurus lepturus and yellow croaker Larimichthys polyactis, have been assessed by dedicated stock assessment (Liu et al., 2013; Zhang and Chen, 2015). This situation is similar to that of many countries in the global South, where fishery research has been languishing.
In response to this issue, two basic approaches of methods were developed to perform stock assessments in data-sparse environments. One approach was to use catch time series and ancillary data to estimate Maximum Sustainable Yield (MSY) and related statistics (Schaefer, 1954; Froese et al., 2017). The other approach uses length-frequency (LF) data for inferences on the growth, mortality and hence populations’ response to fishing; see contributions in Pauly and Morgan (1987) and Pauly (1998), and Liang and Pauly (2017b) for a recent application to China’s coastal fisheries. The latter approach has the advantage that LF data is generally easier and cheaper to acquire, which makes LF-based methods the preferred approach in many situations.
LBB is a newly developed length-based Bayesian biomass estimation method (Froese et al., 2018) requiring LF data that are representative of the fishery under study. It then uses a Bayesian Monte Carlo Markov Chain (MCMC) to estimate growth and mortality parameters and relative stock size. Thus, even in data-poor situations, LBB assessment can be used directly by fishery managers. Also, LBB results can be used as priors for stock assessment methods requiring an independent estimate of biomass relative to unfished biomass as input.
In this contribution, we applied LBB method to 14 fish and invertebrate populations in Chinese coastal waters to explore the extent of biomass depletion caused by fisheries, and to provide evidence for potential alternative harvest policies.
Materials and Methods
Data Source
The data source and basic information of the 14 fish and invertebrate populations covered here are given in Supplementary Tables S1, S2 (see Supplementary Materials). Most LF data were read off from scientific papers.
However, the LF data for spiny red gurnard Chelidonichthys spinosus, hakodate sand shrimp Crangon affinis, red tonguesole Cynoglossus joyneri, slender lizardfish Saurida elongata, southern rough shrimp Trachysalambria curvirostris were obtained from cruises performed in 2016 to 2017 on board of hired private fishing vessels operating in the Bohai Sea and North Yellow Sea, and which used the same gear as when fishing commercially.
General Description of LBB Method
The core of the LBB method is the von Bertalanffy growth function (VBGF; von Bertalanffy, 1938; Pauly, 1998), used to depict the growth in body length.
where Lt is the length at age t, Linf is the asymptotic length, i.e., the mean length that the individuals of the species and stock in question would reach if they were to grow indefinitely, K is the rate by which Linf is approached (year–1), and t0 is the age the fish would have at zero length if they always grew according to the VBGF.
Most species exploited by commercial fishery grow throughout their lives, and thus would approach Linf if it were not for mortality, which is expressed by:
where Nt1 and Nt2 are the numbers of a given cohort or a population at time 1 and 2, and Z is the instantaneous rate of total mortality, consisting of natural and fishing mortality, i.e., Z = M + F (Beverton and Holt, 1957; Pauly, 1998; Sparre and Venema, 1998).
Fishing gears have characteristic selection curves; the selection assumed in LBB is of the trawl type, i.e., very small individuals (<Lx) are not caught, all individuals past a certain size (>Lstart) are caught, while the faction caught between Lx and Lstart is an increasing function of the sizes. Such gear selectivity can be represented by
where SL is the fraction of individuals that are retained by the gear at length L. In other words, SL equals 0 when the length of individuals is less than Lx, and is 1 when individuals exceed the length where full selection occurs. When individuals are subject to partial selection, SL ranges from 0 to 1. In Eq. 3, α is the steepness of the ogive describing the length-dependent selectivity of the gear (Sparre and Venema, 1998). Thus, one can calculate the mean size at first capture (Lc), i.e., the length at which 50% of the individuals encounter the gear will be retained by it.
Combining Eqs. (1–3) and rearranging lead to:
and
where NL_i is the number of individuals at length Li,NL_i–1 refers to the number at the previous length Li–1, C is the number of individuals vulnerable to the gear, and all other parameters are as defined above. To minimize the parameter requirements of this approach method, the ratios M/K and F/M are output, instead of the absolute values of F, M, and K; note that F/M = (F/K)/(M/K).
Also note that LBB, although it refers to “mean length at first capture” (Lc) in fact accounts for gradual selection as described by Eq. 3, including accounting for the fish that are caught at very small sizes (larger than Lx, but below Lc) which are not compensated for by the larger fish that are not caught above Lc, but below Lstart (Silvestre et al., 1991).
When a species has more than one year LF data, the catch in numbers are made comparable between years by dividing both sides of Eq. 5 by their respective sums:
Then M/K and F/K can be deduced by fitting Eq. 4 to LF data.
Relative yield-per-recruit (Y′/R), as defined by Beverton and Holt (1966) can be computed, as presented by Froese et al. (2018) from:
Assuming CPUE proportional to biomass, dividing Eq. 7 by F/M gives:
Relative biomass of fish (>Lc) when F = 0 is then given by
where B0 is the unfished biomass. Thus, the ratio of fished to unfished biomass is
Also, we have
where Lopt is the length when a cohort of fish has its maximum biomass (Holt, 1958). This allows defining:
i.e., the mean length at first capture which maximizes the catch and the biomass for a given pair of F/M and M/K ratios.
A proxy for the relative biomass that can produce MSY (BMSY/B0) was obtained by re-running Eqs. 7–10 with F/M = 1 and Lc = Lc_opt. With these parameters, current relative stock size (B/BMSY) can be deduced; the nomenclature in Palomares et al. (2018) was used to convert estimates of B/BMSY into qualifiers of fisheries status.
If reliable estimates of Linf from independent sources are available, they can be used as priors in LBB analyses to decrease their uncertainty. In this contribution, we use Linf information from FishBase for fishes1 or SeaLifeBase for invertebrates2 as priors.
We used the 32.0 version of the LBB software (a package in R), which automatically generate priors for Lc using the mean of L10 and L90, where L10 and L90 are lengths at 10 and 90% of the range of the LF data, respectively. M/K is set as a default value 1.5; Z/K prior is estimated according to Beverton and Holt [1957; Z/K = (Linf – Lmean)/(Lmean – Lc)]; F/K prior equals to Z/K-M/K.
Results
Figure 1 presents the LBB analyses for the five species with original LF data obtained from field surveys conducted in the Bohai Sea and North Yellow Sea 2016–2017 (see Supplementary Tables S1, S2). As might be seen, the LBB model fit to all five species, yielding estimates of B/BMSY ranging from 0.70 to 0.11 (Table 1). Among these five stocks, that of spiny red gurnard (C. spinosus) has collapsed, and the other four stocks are overfished or grossly overfished given the definitions of stock status in Palomares et al. (2018).
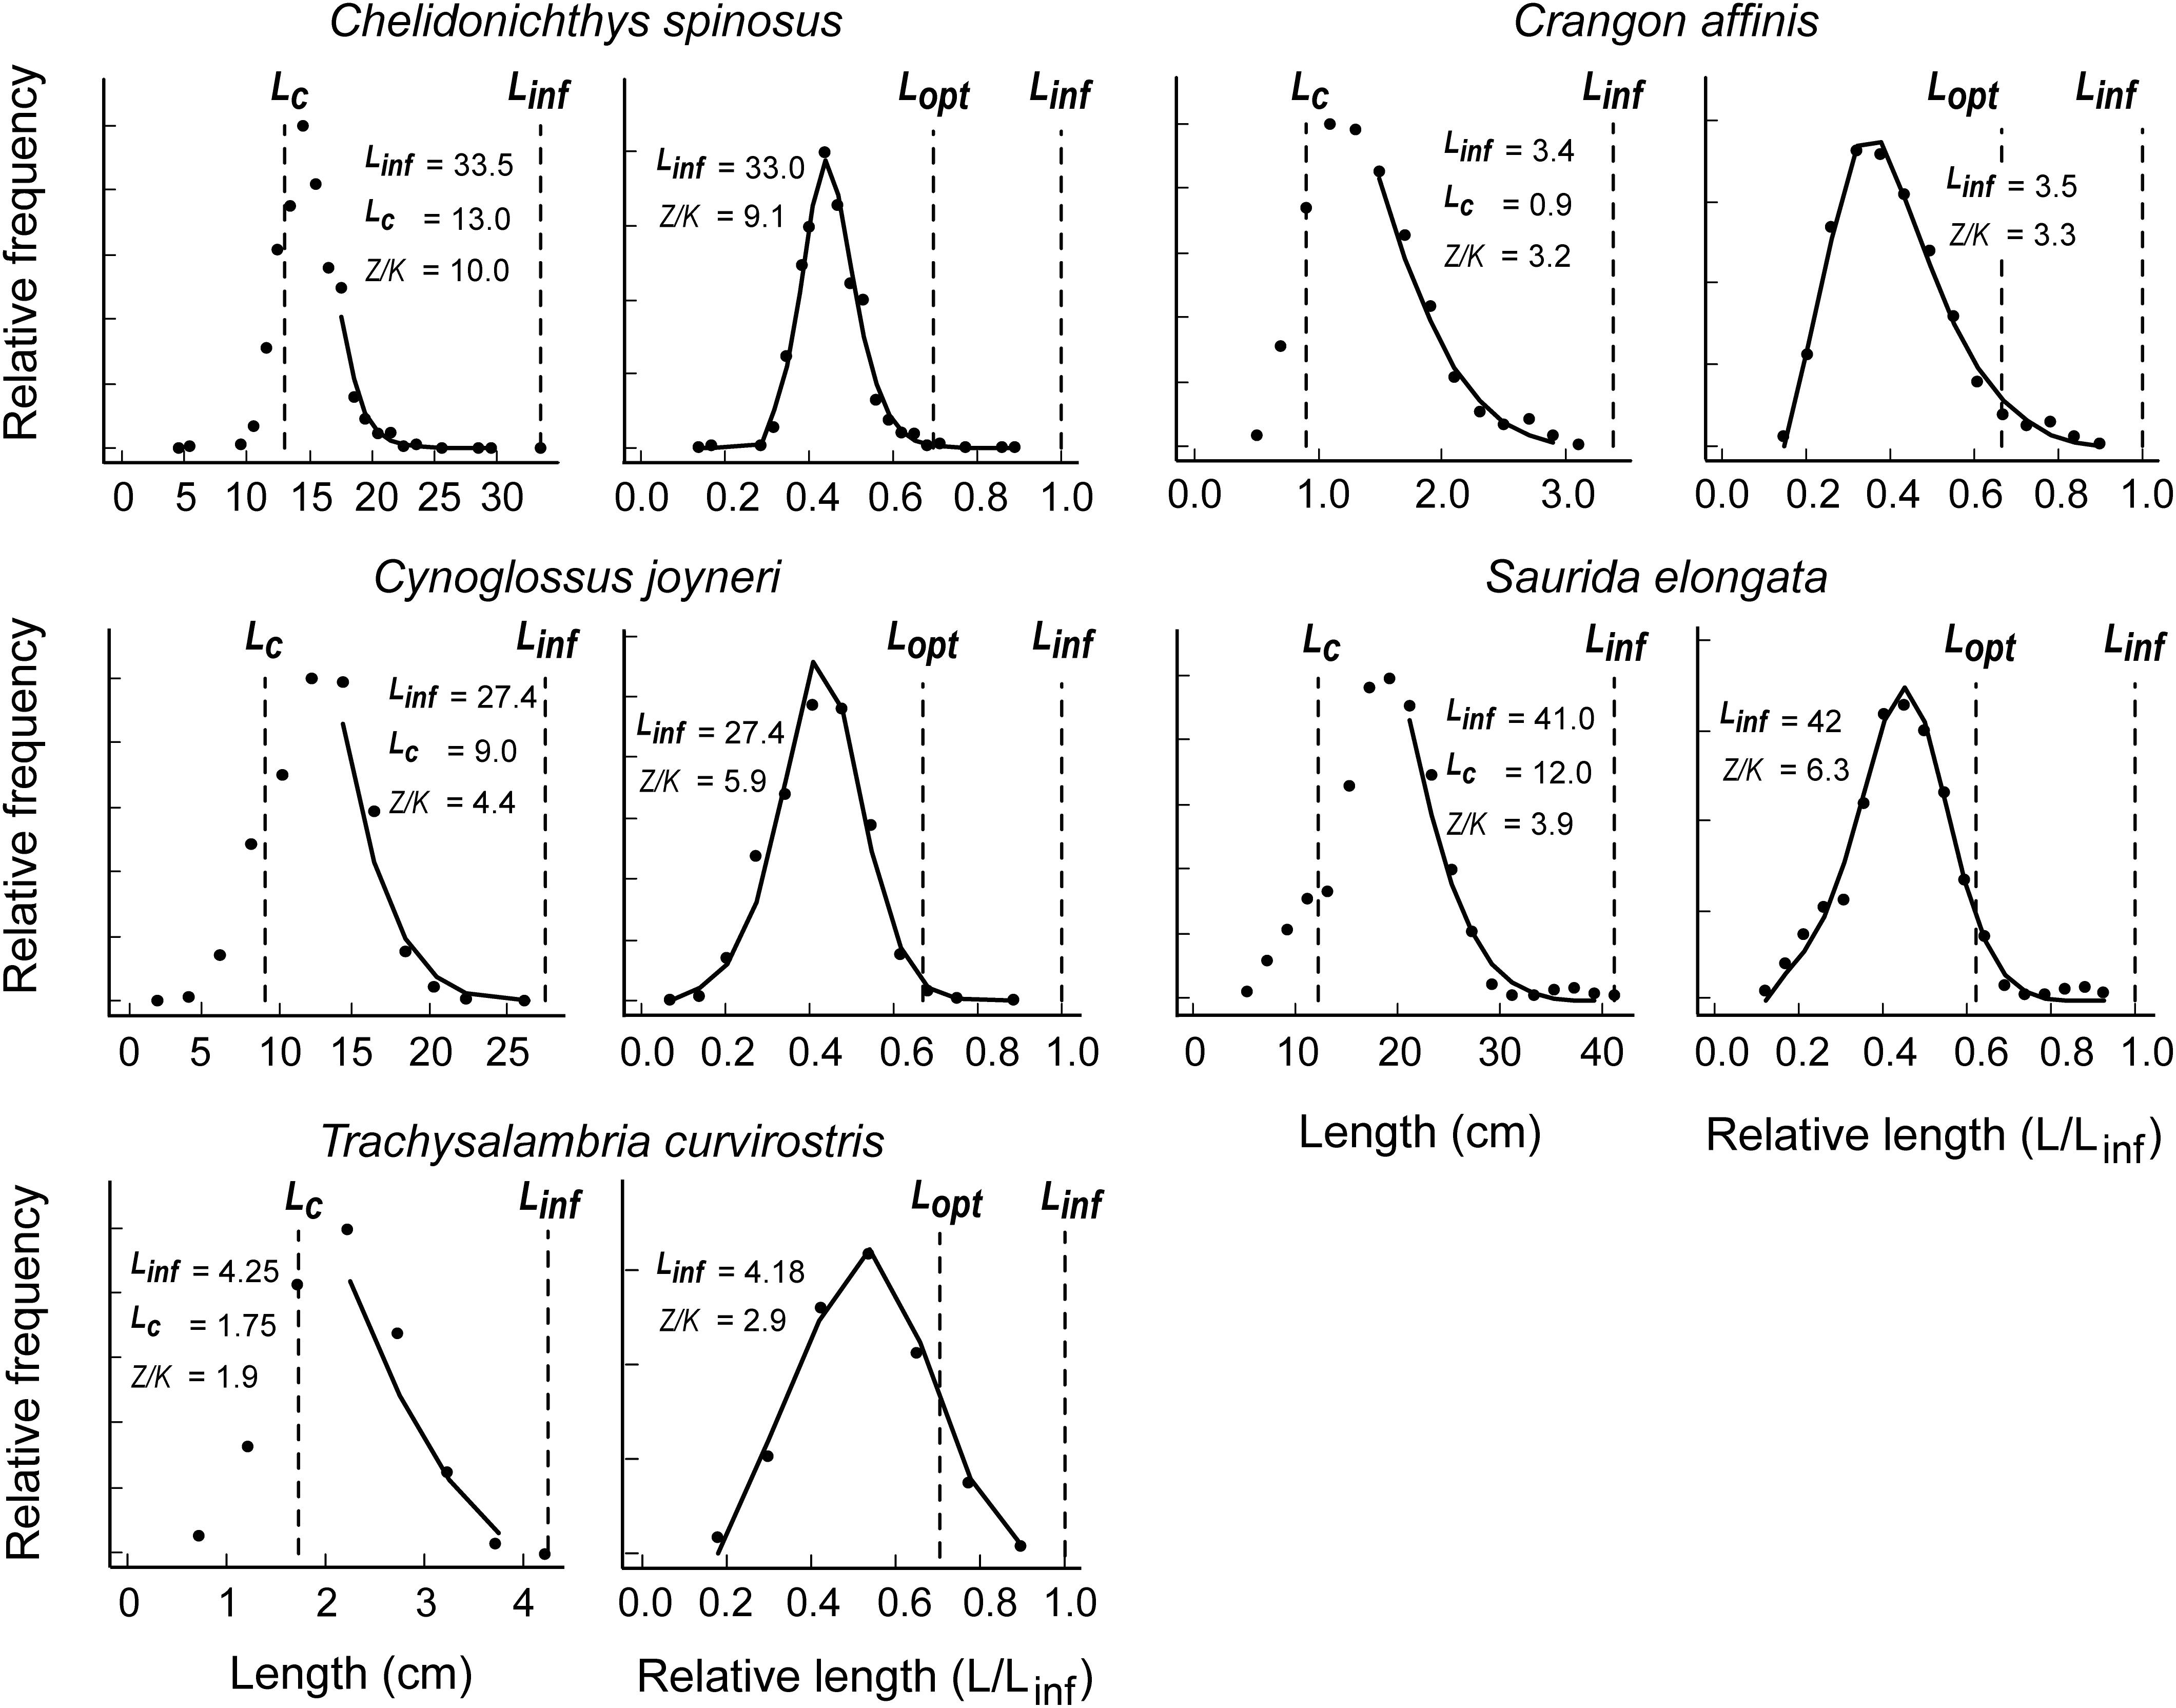
Figure 1. Application of the LBB method to five species of commercially exploited fish for which length-frequency sample were obtained from cruises (see also Table 1 and Supplementary Tables S1, S2).
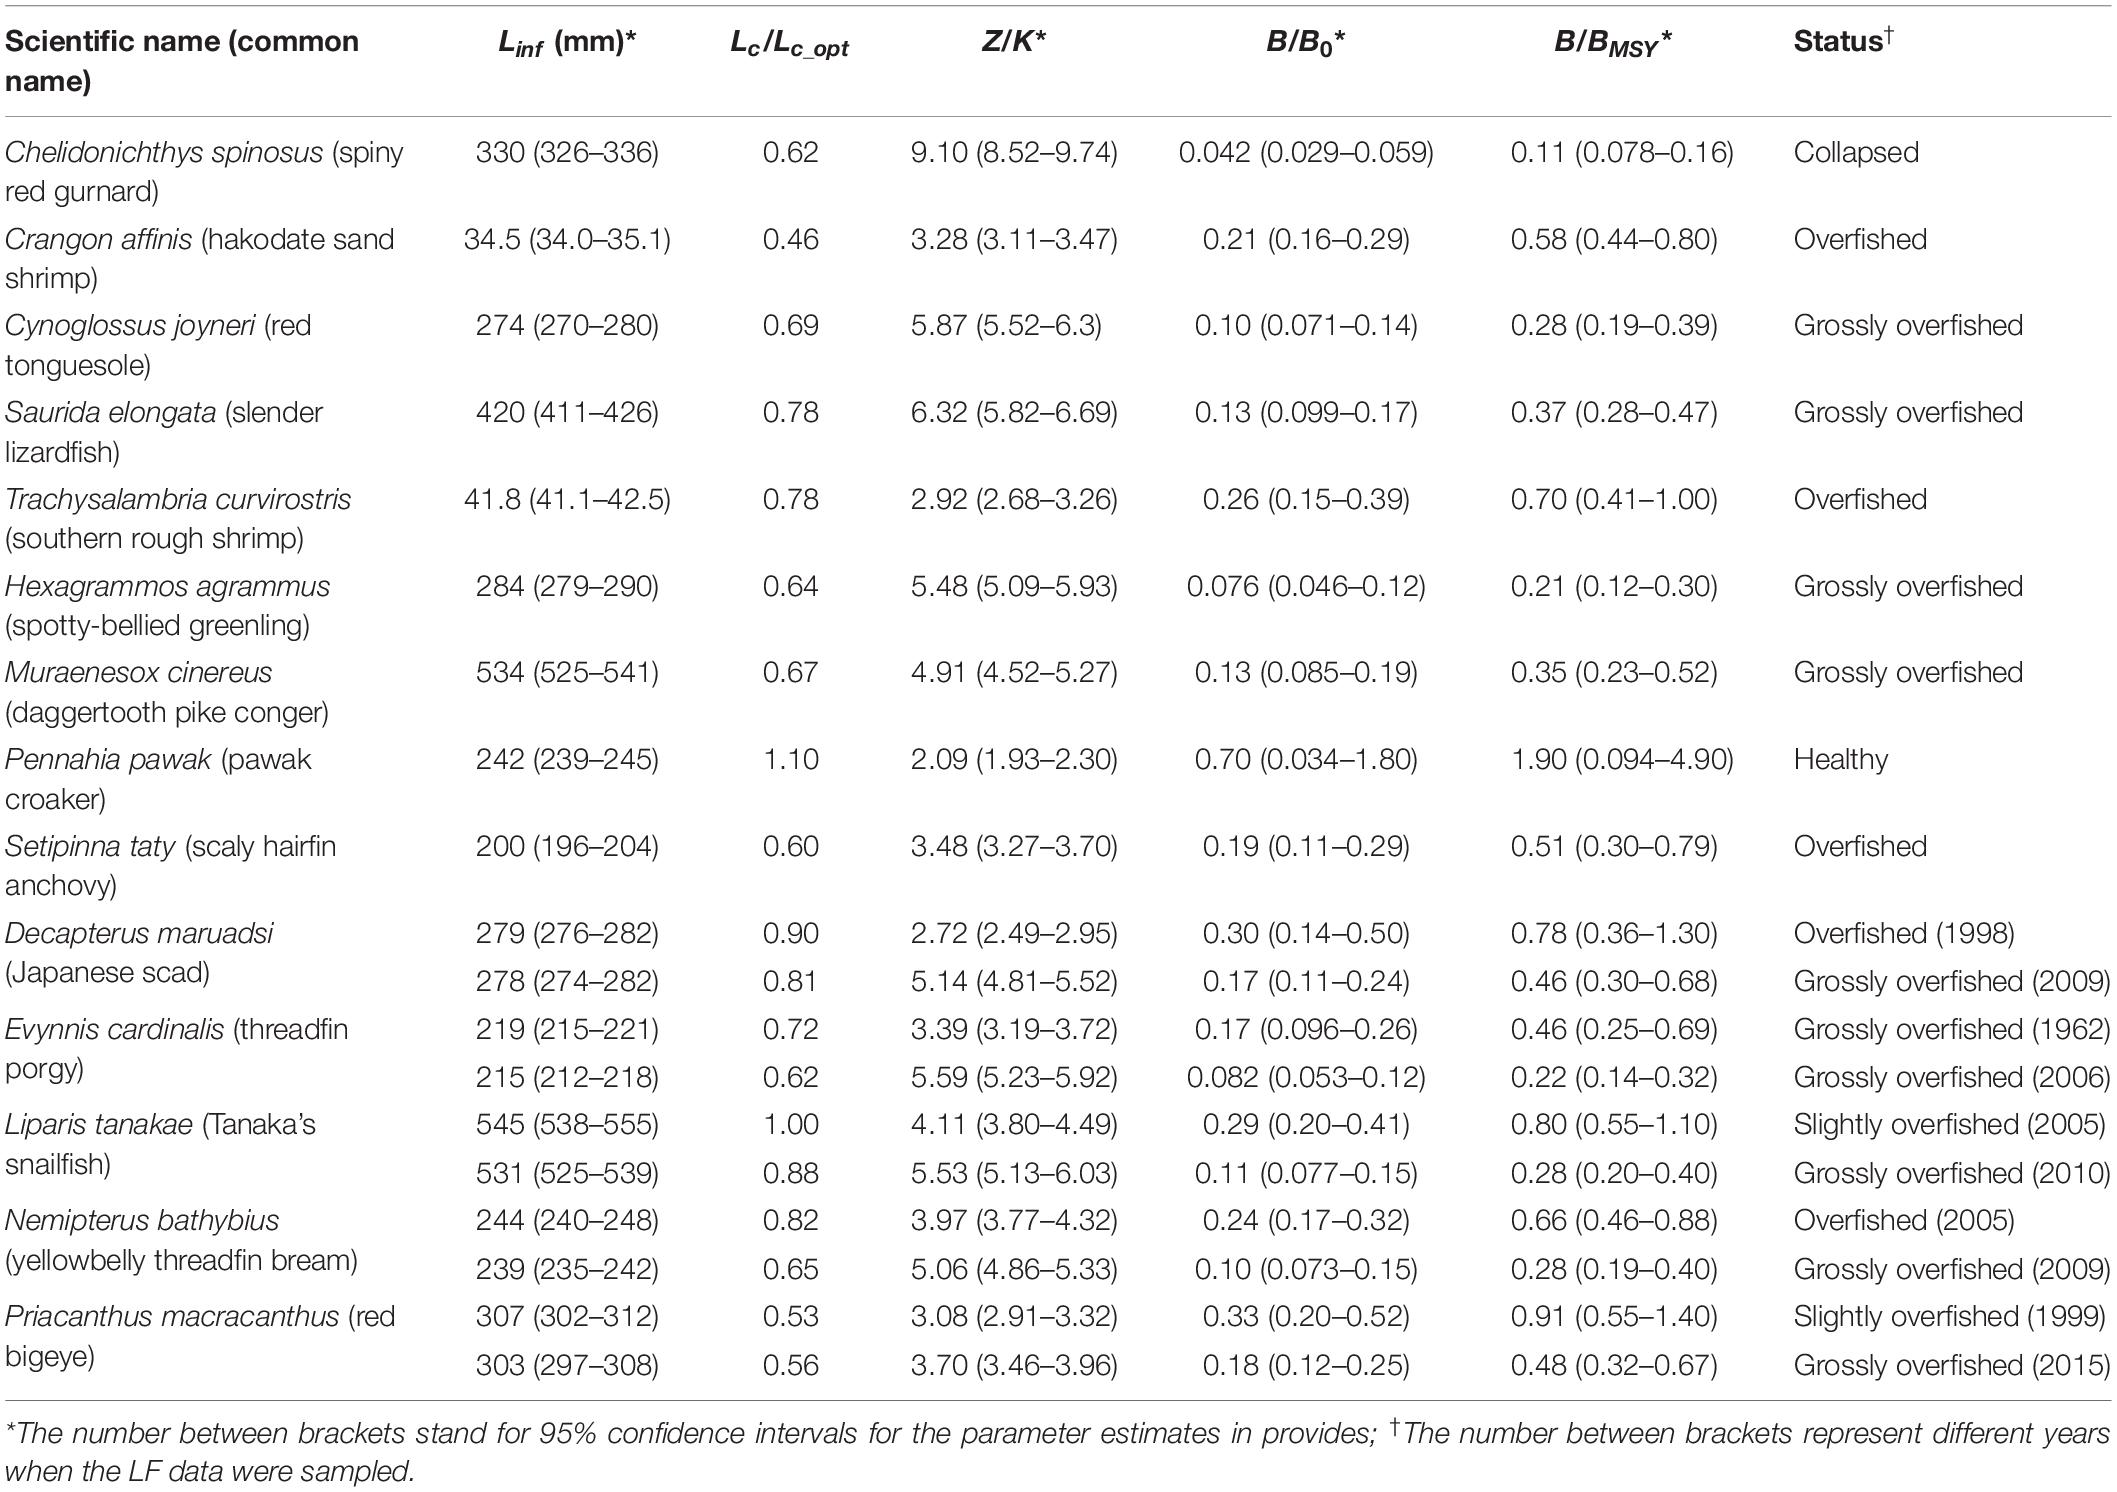
Table 1. Summary of LBB results for 14 populations.
Figure 2 presents similar results for four species with previously published LF data (see Supplementary Tables S1, S2). Here again, the LBB gives a good fit, and estimates of B/BMSY ranging from 1.90 to 0.21 (Table 1). Except for pawak croaker (Pennahia pawak), which appeared to be in a healthy state based on our estimates, the other stocks appear to be over-exploited.
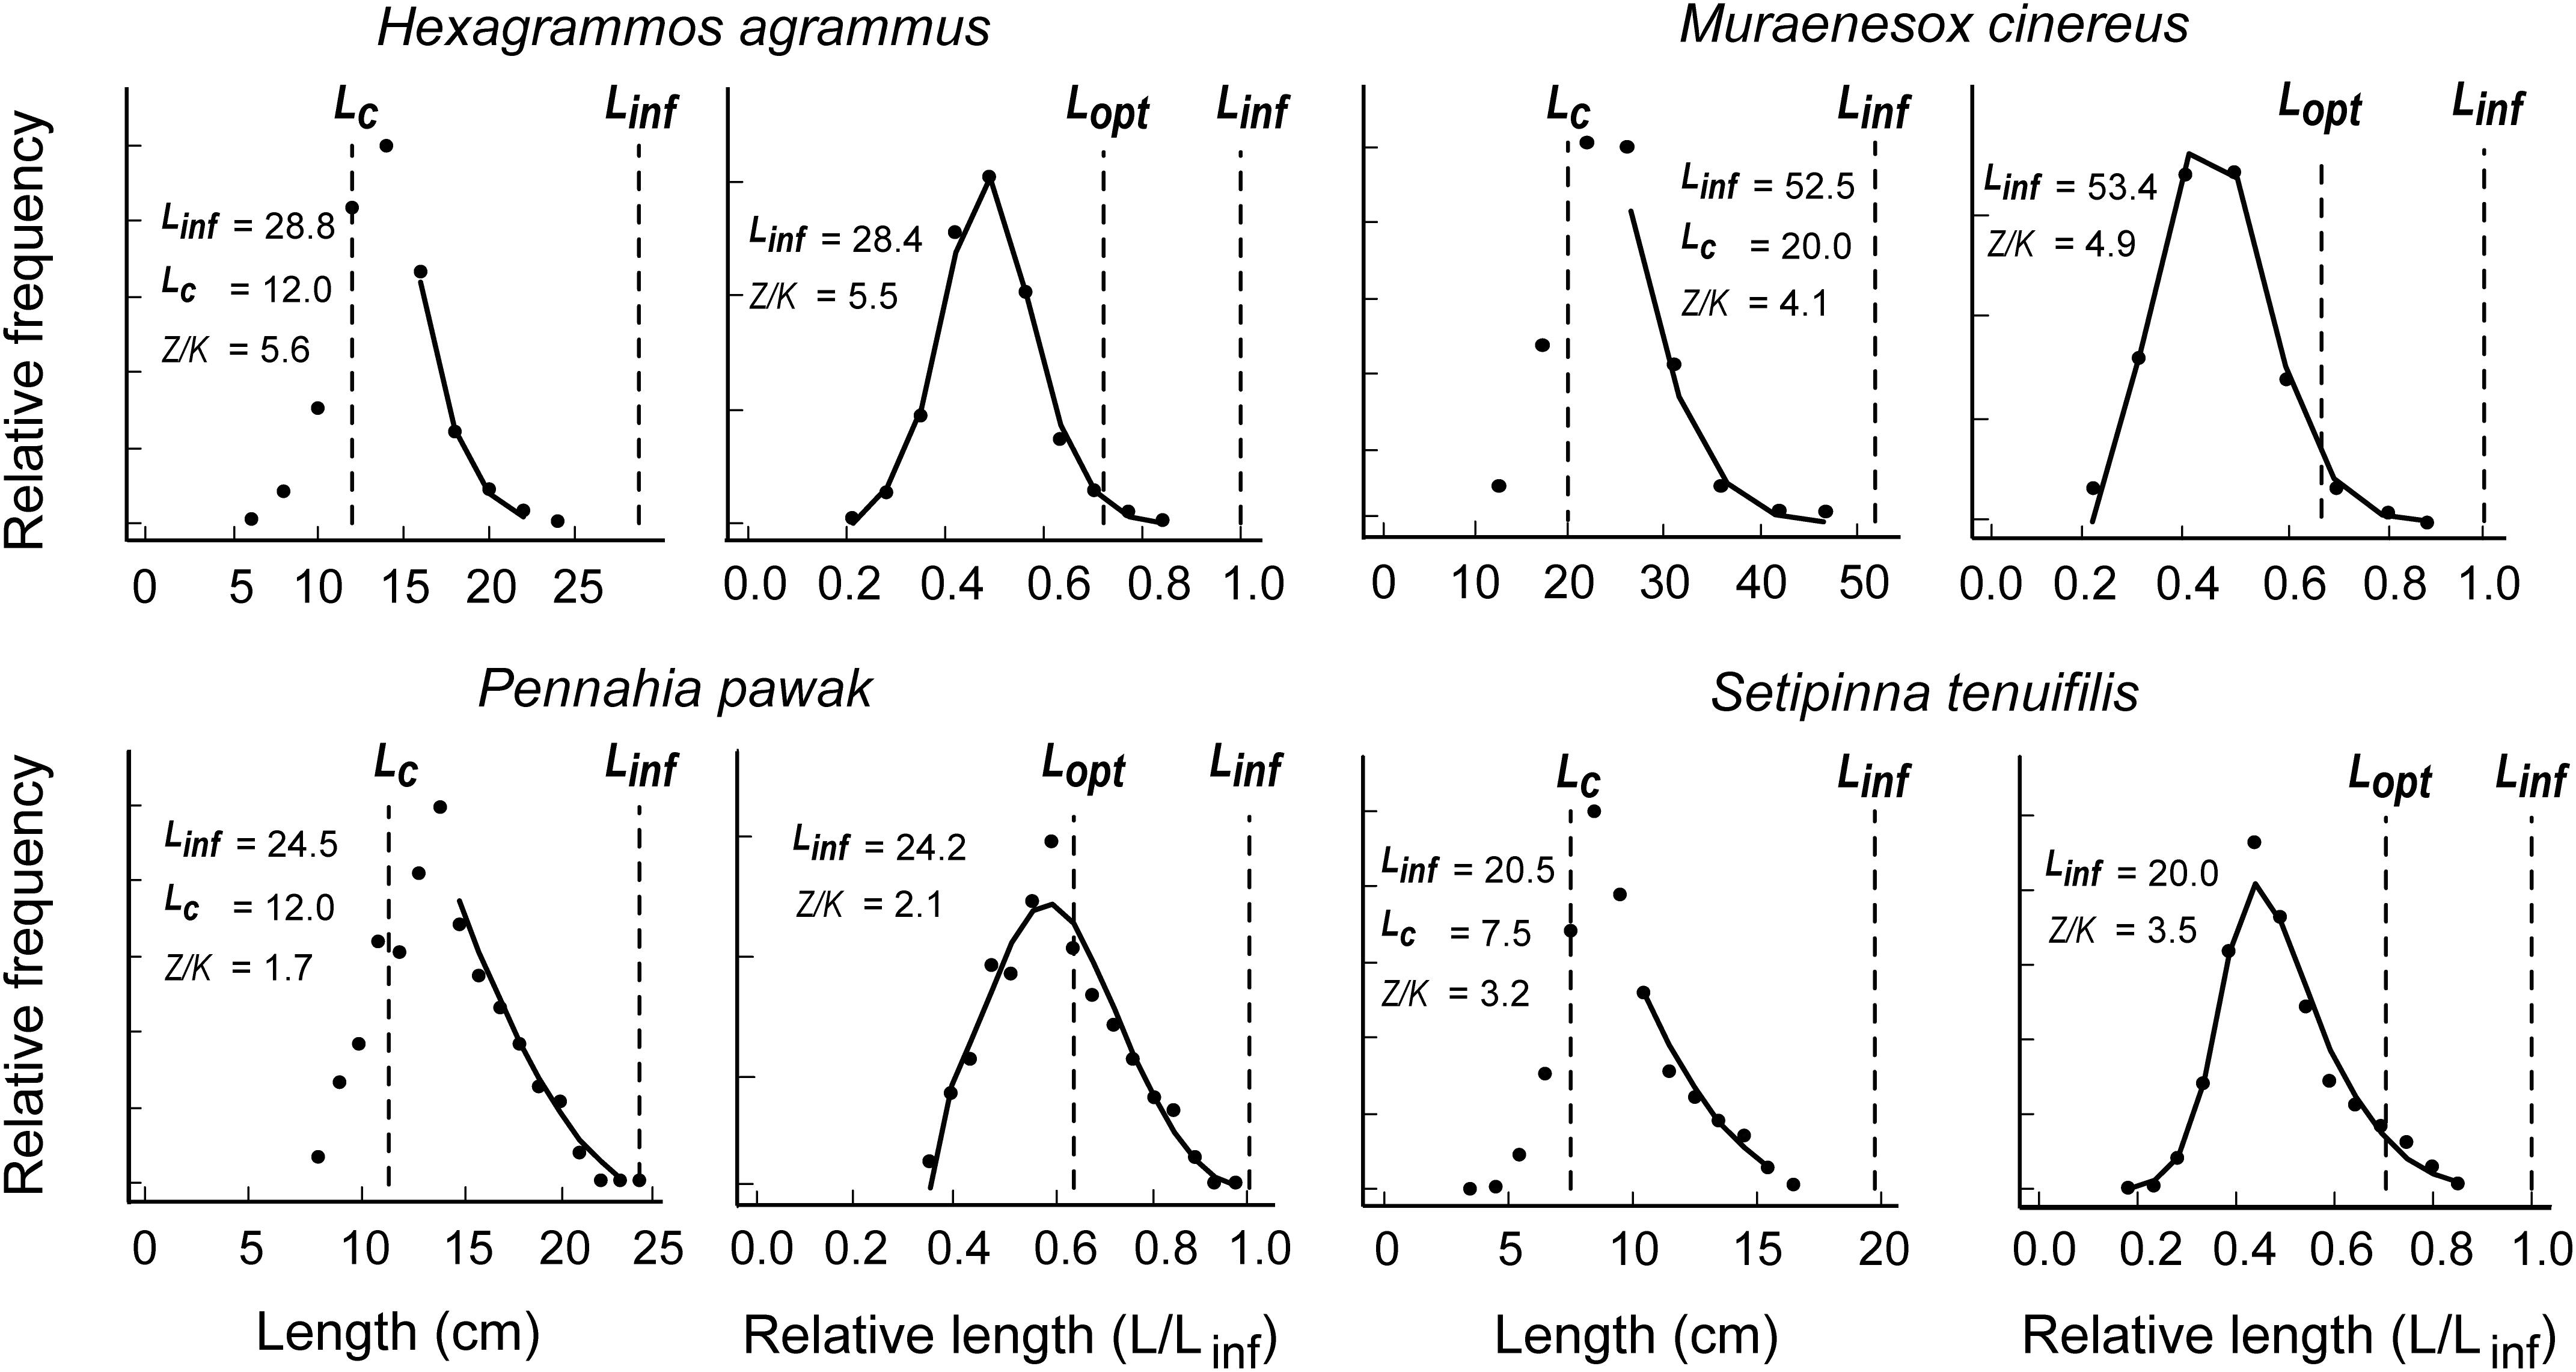
Figure 2. Application of the LBB method to 4 species of commercially exploited fish along the coast of China and for with length-frequency data were obtained from Zhou and Xu (2007), Xiong et al. (2009), Yan et al. (2011), and Ji (2014); see also Table 1 and Supplementary Tables S1, S2.
Figure 3 presents LBB applications to five species each, and for which LF data were available for two distinct periods (see also Supplementary Tables S1, S2). As might be seen, for all five species, the estimates of Linf, Lc/Lc_opt and Z/K increased (Figure 3 and Table 1), while B/BMSY decreased (Table 1), as would occur if fishing effort increased over time.
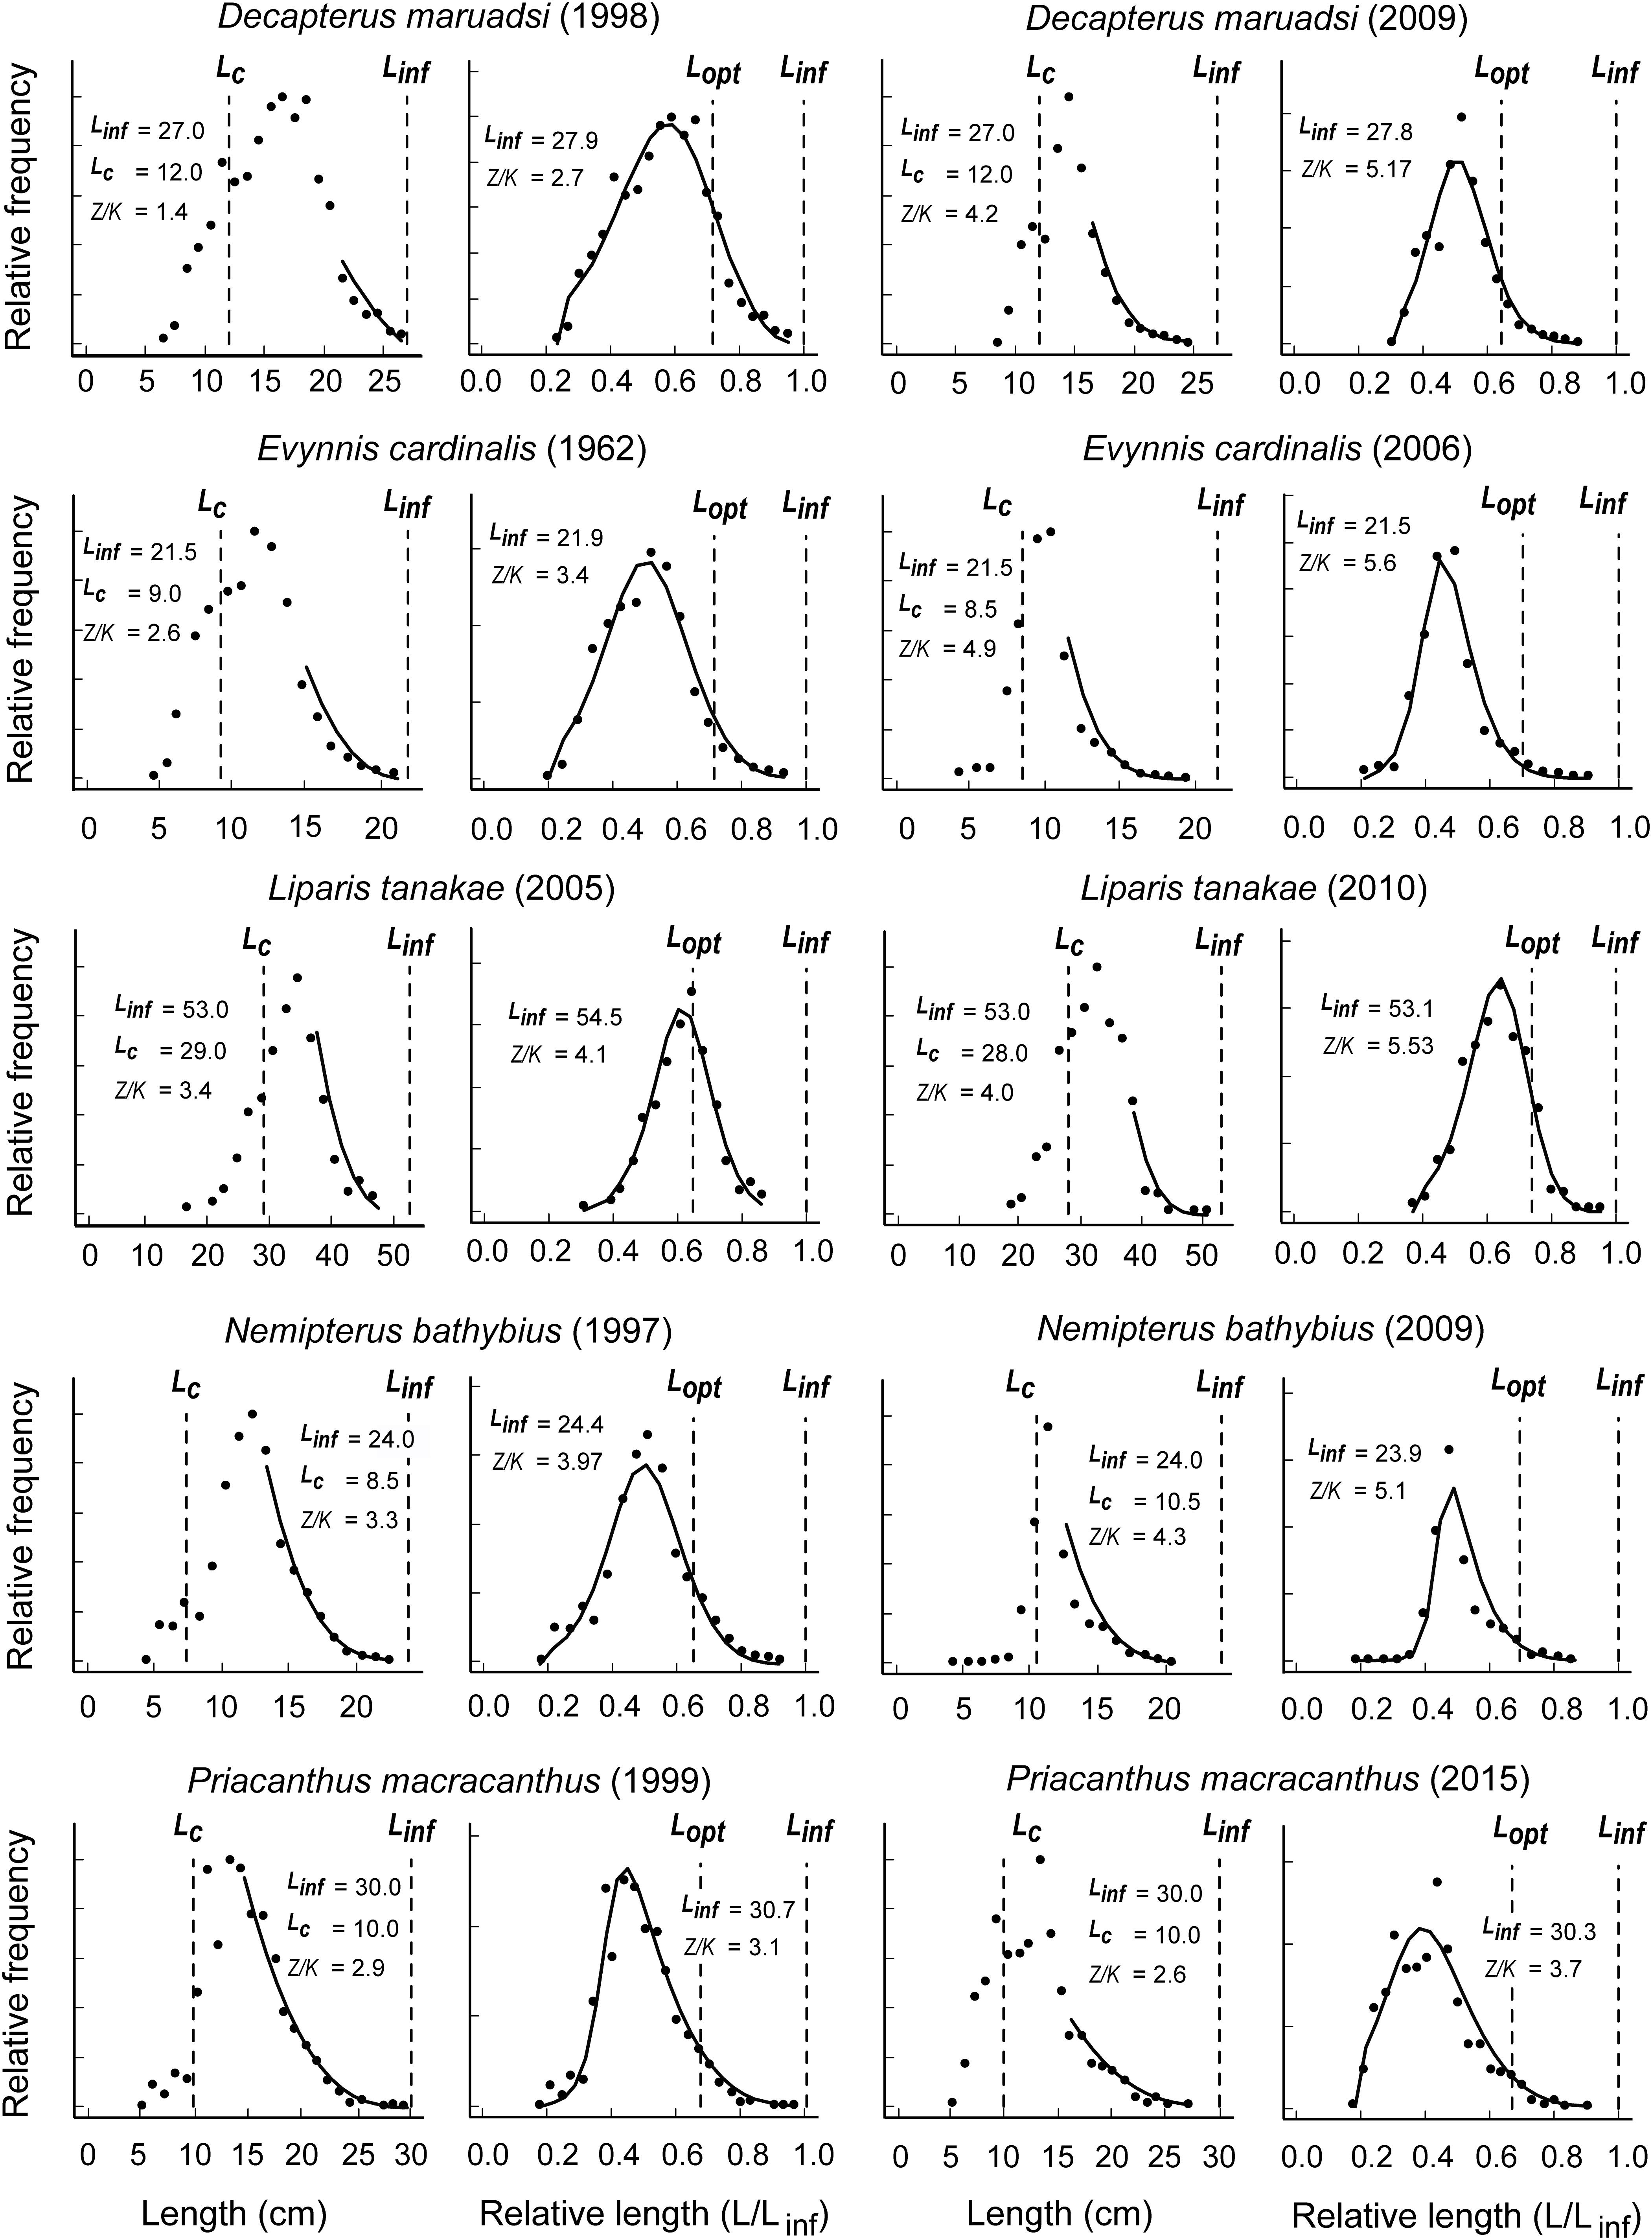
Figure 3. Application of the LBB method to 5 species of commercially exploited fish along the coast of China (Japanese scad Decapterus maruadsi, threadfin porgy Evynnis cardinalis, Tanaka’s snailfish Liparis tanakae, yellowbelly threadfin bream Nemipterus bathybius, and red bigeye Priacanthus macracanthus) and for with length-frequency data were obtained from two different time periods from Geng et al. (2018), Chen et al. (2012, 2013), and Zhang et al. (2016a, b); see Table 1 and Supplementary Tables S1, S2.
Besides pawak croaker, 13 stocks have Lc/Lc_opt less than one, implying that they are suffering from growth overfishing; thus increasing the mesh size of the gears exploiting them would lead to increases of their biomass and catch.
Discussion
Full stock assessment generally requires fisheries-independent data sets, thus constrains its application in data-poor circumstances, which is the case for most China’s coastal stocks (Geng et al., 2018). New computer-based methods came to the rescue with the advent of personal computers. One of the methods which the availability of computers made possible is the CMSY method (Froese et al., 2017), which uses a time series of catch and - if available - proxies of stock abundance (such as CPUE data) to infer MSY and fisheries reference points. However, in China, due to the fisheries catch misreporting, reliable catch data cannot be easily accessed (Jacquet et al., 2010).
The size composition (LF data) of exploited stocks has long been used to estimate exploitation rate and stock status (Beverton and Holt, 1957; Pauly and Morgan, 1987). Methods based on LF data can be either used directly in data-sparse fisheries management, or for providing prior of current relative biomass in other assessment models (Froese et al., 2017). LBB is a new Bayesian MCMC approach for the analysis of LF data from commercial catch.
The LBB method assumes constant recruitment, growth and mortality; thus it should not be used if these assumptions are strongly violated. The LBB method will also generate biased estimates if LF data are not representative, such as data sampled by gears that have a different selectivity or catchability than commercial gears, or in areas where only juveniles or adults occur. However, when reliable LF data are available, the LBB method can offer a window into the dynamics of the stocks, especially in data-poor situations.
In this contribution, we applied the LBB method to LF data of 14 fish and invertebrate populations from China’s coastal waters. Among these, and given the nomenclature in Palomares et al. (2018), one population has collapsed and nine are grossly overfished. Our results are generally consistent with what is known of China’s coastal resources, that is, the biomass of most populations are severely depleted, especially for main commercial species. The decline of fishery resources is confirmed by the decreased CPUE along Chinese coastal waters (Kang et al., 2018), the increased proportion of “trash fish” (Greenpeace, 2017; Zhang et al., 2020), and the occurrence of the “fishing down” effect in China’s coastal waters (Liang and Pauly, 2017a).
Despite the depletion of its coastal resources, China’s reported marine catch remains at a high level, which might be attributed to the illegal use of very small mesh size (∼10 mm) in commercial bottom trawl fisheries along Chinese coastal waters. Based on our results, we concluded that among 14 populations in question, 13 stocks had smaller mean sizes at first capture than Lc_opt, indicating that an increase in mesh size would increase both the catch from, and the biomass of these populations. This is in accordance with the finding of Liang and Pauly (2017b) and of Zhai and Pauly (2019).
Greenpeace (2017) released a report on China’s “trash fish” (fish that are too small for direct human consumption) fisheries, and pointed out that fishes in the larval or fingerling stages accounted for a large proportion of the catch of China’s coastal fisheries. To promote the restoration and sustainable use of marine fishery resources, China issued an announcement to regulate minimum catchable standards and juvenile fish proportion for 14 important commercial fish species, including Trichiurus japonicus, L. polyactis and Pampus argenteus (Ministry of Agriculture and Rural Affairs of the People’s Republic of China, 2018). This shows that China has taken this issue into account; how this regulation will be implemented will be crucial.
Our results show that reducing fishing mortality and increasing mesh size would benefit catch and biomass. This was backed up by Costello et al. (2016), who demonstrated that applying sound management reforms to Chinese fisheries could generate considerable increases in catch, biomass and profit relative to business as usual. In China, seafood is regarded as an excellent source of high-quality protein. The domestic consumption for seafood in China has significantly increased, from 7 kg per person in 1985 to around 25 kg per person in the early 2000s (Gao and Gao, 2005). The large demand for seafood has imposed enormous pressure on China’s coastal fisheries. However, it is obvious that the current management measures are not sufficient, and more stringent measures are needed to restore thriving coastal fisheries.
Data Availability Statement
All datasets generated for this study are included in the article/Supplementary Material.
Ethics Statement
Ethical review and approval was not required for the animal study because our manuscript was based on survey cruise data or published data, and no live vertebrates or higher invertebrates were involved.
Author Contributions
CL, WX, and SL were responsible for data collecting, formal analysis and writing original manuscript. DP contributed to the methodology, reviewing and editing the draft.
Conflict of Interest
The authors declare that the research was conducted in the absence of any commercial or financial relationships that could be construed as a potential conflict of interest.
Funding
CL and WX acknowledge financial support from National Natural Science Foundation of China (No. 31872568), NSFC-Shandong Joint Fund for Marine Ecology and Environmental Sciences (U1606404), and Qingdao Postdoctoral Applied Research Project; DP is supported by the Sea Around Us, a research initiative at UBC funded by a number of philanthropic foundations, notably the Oak, Marisla and Minderoo Foundationd.
Acknowledgments
We are grateful to Evelyn Liu for redrawing the Figures.
Supplementary Material
The Supplementary Material for this article can be found online at: https://www.frontiersin.org/articles/10.3389/fmars.2020.00314/full#supplementary-material
Footnotes
References
Beverton, R. J. H., and Holt, S. J. (1957). On the Dynamics of Exploited Fish Populations. London: Ministry of Agriculture, Fisheries and Food.
Beverton, R. J. H., and Holt, S. J. (1966). “Manual of methods for fish stock assessment, Part II – tables of yield functions,” in FAO Fisheries Technical Paper No. 38, (Rome: FAO), 10.
Chen, Y., Shan, X., Zhou, Z., Dai, F., Li, Z., and Jin, X. (2013). Interannual variation in the population dynamics of snailfish Liparis tanakae in the Yellow Sea. Acta Ecol. Sin. 33, 6227–6235.
Chen, Z., Kong, X., Xu, S., Qiu, Y., and Huang, Z. (2012). Dynamic changes of population parameters of Nemipterus bathybius in the Beibu Gulf. J. Fish. China 36, 584–591.
Costello, C., Ovando, D., Clavelle, T., Strauss, C. K., Hilborn, R., Melnychuk, M. C., et al. (2016). Global fishery prospects under contrasting management regimes. Proc. Natl. Acad. Sci. 113, 5125–5129. doi: 10.1073/pnas.1520420113
FAO (2018). The State of World Fisheries and Aquaculture 2018-Meeting the Sustainable Development Goals. Rome: FAO.
Froese, R., Demirel, N., Coro, G., Kleisner, K. M., and Winker, H. (2017). Estimating fisheries reference points from catch and resilience. Fish Fish. 18, 506–526.
Froese, R., Winker, H., Coro, G., Demirel, N., Tsikliras, A. C., Dimarchopoulou, D., et al. (2018). A new approach for estimating stock status from length frequency data. ICES J. Mar. Sci. 75, 2004–2015.
Gao, J., and Gao, X. (2005). “The import and export of China’s seafood,” in The Chinese seafood Industry: Structural Changes and Opportunities for Norwegians, eds K. B. Lindkvist, Z. Wang, G. H. Hansen, and H. Haarstad (Bergen: Samfunns- og næringslivsforskning AS), 155–164.
Geng, P., Zhang, K., Chen, Z., Xu, Y., and Sun, M. (2018). Interannual change in biological traits and exploitation rate of Decapterus maruadsi in Beibu Gulf. South China Fish. Sci. 14, 1–9.
Greenpeace (2017). The Current Status of Marine Fishing for “Trash Fish” in China and its Implications for China’s Sustainable Fisheries Development. Available online at: https://www.greenpeace.org.cn/nearly-4-million-tons-of-trash-fish-in-china-inshore-fishery-catch/
Holt, S. J. (1958). “The evaluation of fisheries resources by the dynamic analysis of stocks, and notes on the time factors involved,” in International Commission for the Northwest Atlantic Fisheries, (Vancouver: ICNAF Special Publication), 77–95.
Jacquet, J., Zeller, D., and Pauly, D. (2010). Counting fish: a typology for fisheries catch data. J. Integr. Environ. Sci. 7, 135–144.
Ji, D. (2014). Study on the Fishery Biology of Hexagrammos Agrammus and Hexagrammos Otakii in Lidao Rongcheng. Doctor dissertation, Ocean University of China, Qingdao.
Kang, B., Liu, M., Huang, X. X., Li, J., Yan, Y. R., Han, C. C., et al. (2018). Fisheries in Chinese seas: what can we learn from controversial official fisheries statistics? Rev. Fish Biol. Fish. 28, 503–519.
Liang, C., and Pauly, D. (2017a). Fisheries impacts on China’s coastal ecosystems: unmasking a pervasive ‘fishing down’effect. PloS One 12:e0173296. doi: 10.1371/journal.pone.0173296
Liang, C., and Pauly, D. (2017b). Growth and mortality of exploited fishes in China’s coastal seas and their uses for yield-per-recruit analyses. J. Appl. Ichthyol. 33, 746–756.
Liu, Z., Xie, H., Yan, L., Yuan, X., Yang, L., Li, Y., et al. (2013). Comparative population dynamics of small yellow croaker Larimichthys polyactis in Southern Yellow Sea and East China Sea. J. Dalian Ocean Univ. 28, 627–632.
Methot, R. D., and Wetzel, C. R. (2013). Stock synthesis: a biological and statistical framework for fish stock assessment and fishery management. Fish. Res. 142, 86–99.
Palomares, M. L. D., Froese, R., Derrick, B., Nöel, S.-L., Tsui, G., Woroniak, J., et al. (2018). “A preliminary global assessment of the status of exploited marine fish and invertebrate populations,” in A Report Prepared by the Sea Around Us for OCEANA, (Washington, DC: OCEANA), 64.
Pauly, D. (1998). Beyond our original horizons: the tropicalization of Beverton and Holt. Rev. Fish Biol. Fish. 8, 307–334.
Schaefer, M. B. (1954). Some aspects of the dynamics of populations important to the management of the commercial marine fisheries. Inter Am. Trop. Tuna Comm. Bull. 1, 23–56. doi: 10.1016/S0065-2881(09)56003-8
Silvestre, G., Soriano, M., and Pauly, D. (1991). Sigmoid selection and the beverton and holt equation. Asian Fish. Sci. 4, 85–98.
Sparre, P., and Venema, S. C. (1998). Introduction to Tropical Fish Stock Assessment. Part 1. Manual. FAO Fisheries Technical Paper No. 306.1, Rev. 2. Rome: FAO.
von Bertalanffy, L. (1938). A quantitative theory of organic growth (inquiries on growth laws. II.). Hum. Biol. 10, 181–213.
Xiong, Y., Tang, J., Liu, P., Zhong, X., Yan, L., Gao, Y., et al. (2009). Resource estimate on Setipinna taty in the Southern Yellow Sea. Oceanol. Limnol. Sin. 40, 500–505.
Yan, Y., Hou, G., Lu, H., and Yin, Q. (2011). Age and growth of pawak croaker Pennahia pawak in Beibu Gulf. J. Fish. Sci. China 18, 145–155.
Zhai, L., and Pauly, D. (2019). Yield-per-recruit, utility-per-recruit and relative biomass of 21 exploited fish species in China’s coastal seas. Front. Mar. Sci. 6:724. doi: 10.3389/fmars.2019.00724
Zhang, K., and Chen, Z. (2015). Using bayesian state-space modelling to assess Trichiurus lepturus stock in the East China Sea. J. Fish. Sci. China 22, 1015–1026.
Zhang, K., Chen, Z., and Qiu, Y. (2016a). Decadal changes in growth, mortality and maturity parameters of Evynnis cardinalis in Beibu Gulf. South China Fish. Sci. 12, 9–16.
Zhang, K., Chen, Z., Wang, Y., Sun, D., and Qiu, Y. (2016b). Population structure of Priacanthus macracanthus in the Beibu Gulf, and parameters for its growth, mortality and maturity. J. Trop. Oceanogr. 35, 20–28.
Zhang, W., Liu, M., Mitcheson, Y., Cao, L., Leadbitter, D., Newton, R., et al. (2020). Fishing for feed in China: Facts, impacts and implications. Fish Fish. 21, 47–62. doi: 10.1111/faf.12414
Keywords: stock assessment, data-poor stocks, length-frequency data, biomass estimation, LBB method
Citation: Liang C, Xian W, Liu S and Pauly D (2020) Assessments of 14 Exploited Fish and Invertebrate Stocks in Chinese Waters Using the LBB Method. Front. Mar. Sci. 7:314. doi: 10.3389/fmars.2020.00314
Received: 21 January 2020; Accepted: 16 April 2020;
Published: 14 May 2020.
Edited by:
JInghui Fang, Yellow Sea Fisheries Research Institute (CAFS), ChinaReviewed by:
Hiroshi Okamura, Japan Fisheries Research and Education Agency, JapanClaudio Vasapollo, National Research Council (CNR), Italy
Copyright © 2020 Liang, Xian, Liu and Pauly. This is an open-access article distributed under the terms of the Creative Commons Attribution License (CC BY). The use, distribution or reproduction in other forums is permitted, provided the original author(s) and the copyright owner(s) are credited and that the original publication in this journal is cited, in accordance with accepted academic practice. No use, distribution or reproduction is permitted which does not comply with these terms.
*Correspondence: Cui Liang, liangc@qdio.ac.cn; cui-liang@hotmail.com; Weiwei Xian, wwxian@qdio.ac.cn