Evidence of Overfishing in Small-Scale Fisheries in Madagascar
 Charlotte L. A. Gough1,2*
  Katrina M. Dewar1
  Brendan J. Godley2 Erude Zafindranosy3
  Annette C. Broderick2
- 1Blue Ventures, The Old Library, Bristol, United Kingdom
- 2Centre for Ecology and Conservation, College of Life and Environmental Sciences, University of Exeter, Cornwall, United Kingdom
- 3Louvain Cooperation, Morondava, Madagascar
Small-scale fisheries are an important source of food, income and cultural identity to millions of people worldwide. Despite many fisher people observing declining catches, a lack of data remains a barrier to understanding the status of small-scale fisheries and their effective management in many places. Where data exist, complex analyses and stock assessments are often beyond the capacity and budgets of local managers. Working with small-scale fisheries in western Madagascar, we analyze landings data to provide a description of the fishery and evaluate the top twenty most commonly caught species for evidence of overfishing. Using length composition data, we use Froese’s three simple rules: Let them spawn, let them grow and let the mega-spawners live, as well as Cope and Punt’s decision tree to infer if spawning biomass is less than target reference points. We then use length-based parameters to calculate fishing mortality and compare with published estimates of natural mortality to assess overfishing (F > M). Over 17,000 fishing trips were registered over a 2-year period (2010–2012), landing just short of 2 million individual fish. Length data were recorded for a sample of over 120,000 individuals. Fish comprised 95% of landings, with the remainder comprised of other groups including crustaceans (mostly shrimp, crab, and lobster), cephalopods, and holothurians. We provide some of the first evidence that fish species caught in the small-scale fisheries of the Menabe region of Madagascar are experiencing overfishing. The most notable result is that for 13 of the 20 most common species, fishing mortality exceeds natural mortality. Many species had a large proportion of individuals (in some cases 100%) being caught before they reached maturity. Very few species were fished at their optimal size, and there were low numbers of large individuals (mega-spawners) in catches. Overfishing in western Madagascar presents a serious threat to the income, food security and well-being of some of the most vulnerable people in the world. The results of this paper support the call for improved management. However, management approaches should take account of overlapping fisheries and be inclusive to ensure the impacts of management do not undermine the rights of small-scale fishers. Further data are needed to better understand the trends and to improve management but should not hinder pragmatic action.
Introduction
The 2018 status of the world’s fisheries (FAO, 2018) concluded that 33% of monitored stocks are currently fished beyond biologically sustainable limits. Yet, these assessed stocks represent less than 1% of all fished species, indicating that this figure is likely a vast underestimate of overfishing occurring worldwide. This is particularly true in small-scale fisheries (SSF), which in the majority of cases remain unassessed and unmanaged (Costello et al., 2012). World trade in fish and fish products continues to grow, and fisheries exports were worth an estimated $152 billion in 2017 (FAO, 2018). However, the focus on market contribution often results in an underappreciation of the importance of small-scale fisheries (Chuenpagdee et al., 2006; Grafeld et al., 2017).
The small-scale sector provides more than half of all fish for human consumption, making it a significant contributor to international food security and nutrition (World Bank, 2012). The marine sub-sector is estimated to support the livelihoods of approximately 50 million people worldwide (World Bank, 2012). In low income nations, these fisheries contribute to the development and stimulation of local and national economies, and up to 95% of the small-scale marine fisheries landings are destined for local consumption (Béné, 2006; Chuenpagdee et al., 2006; USAID, 2016; FAO, 2017; Tilley et al., 2018). Despite SSF delivering many benefits with a much smaller environmental footprint than industrial fisheries (Chuenpagdee et al., 2006; Jacquet and Pauly, 2008), SSF have received much less focus to date. Ensuring they are managed effectively is critical for maintaining income generation and food security of the coastal communities who depend on this resource.
Madagascar is the fourth largest island in the world. It has a population of almost 26 million that is currently growing at an annual rate of 2.8% (The World Bank, 2017). The country is listed as eleventh poorest in the world (International Monetary Fund, 2015). Total Gross Domestic Product (GDP) was estimated at just over US $11 billion in 2017, and the gross national income per capita is estimated at US $400. More than 80% of people live on less than $1.90 per day (The World Bank, 2017) and it is the only non-conflict country where GDP per capita has declined since it gained independence (Pilling, 2018), attributed to cycles of political crisis and being forgotten by other western nations with regard to aid (Razafindrakoto et al., 2018).
SSF are estimated to provide a livelihood for 100,000 people in Madagascar (Le Manach et al., 2011), however, the exact number of small-scale fishers operating in the country is unknown. Madagascar’s fisheries are data deficient and underreported with a recent reconstruction estimating catches to be at least twice the volume reported to the FAO (Le Manach et al., 2012). A large proportion of this underestimate was attributed to the underrepresentation of the country’s small-scale fishing sector and a later study conducted in southwest Madagascar suggested that even these estimates may be overly conservative (Barnes-Mauthe et al., 2013).
Despite the paucity of data, traditional ecological knowledge (TEK) and fisher observations are incredibly valuable and have provided evidence of changes to catches (Brenier et al., 2011; Jones, 2011; Lemahieu et al., 2018). Small-scale fishers around the world have been reporting changes in their catches, specifically observing declines in catch rates and a reduction in the size of fish caught over time (Jacquet et al., 2010; Martins et al., 2018). Yet, these observations are generally considered as complementary information rather than adequate evidence (Martins et al., 2018) and an insufficient basis on which to base policy change to support fisheries rebuilding.
The western coast of Madagascar is home to the Vezo, a semi-nomadic ethnic group of traditional fishers (Astuti, 1995) who have existed and identified as fishers in this region for their entire history (Astuti, 1991, 1995; Grenier, 2013). The Vezo harvest predominantly for subsistence with finfish providing the main protein source for local households (Barnes-Mauthe et al., 2013). However, the Vezo economy has become increasingly trade-oriented since the 1970s (Sanders, 2005), and export markets for octopus, sea cucumbers and shark fin have operated since the turn of the twenty-first century (Iida, 2005; Cripps and Gardner, 2016).
In this study, we describe the catch composition from small-scale fishing practices in the Menabe region of Madagascar. Fishers in this region have reported changes to their catches over the last few decades. They have noted both anecdotally and in structured questionnaires: observations of decreasing catches, smaller sizes of fish, and having to increase effort or change fishing gears to sustain their catch rates for income and food (Brenier et al., 2011; Jones, 2011; Lemahieu et al., 2018). However, the last studies to document catch status and composition of SSF in the Menabe region of western Madagascar where this current study is focused were conducted in 1991 and assessed catches from only two landing sites (Laroche et al., 1997). Here, we present results from across the region, summarizing catch rates, species diversity, and trophic composition for different gear types being employed in the fishery. These indicators are presented as baseline data that can be used to inform management in the future.
Given a lack of temporal data available for the SSF of Menabe, we use three approaches to assess overfishing. The first is a simple approach proposed by Froese (2004). This method relies on well-established relationships between fisheries management and life-history theory. It uses length composition data to assess catches for evidence of growth and recruitment overfishing. It uses three simple ideas of allowing all fish to spawn and grow, ensuring some survive to become mega-spawners (Froese, 2004).
In addition to Froese’s indicators we use a decision tree developed by Cope and Punt (2009). The decision tree provides a set of rules for defining when a stock is below its biological target or limit reference points. The decision tree is used to infer overfished status with respect to empirical benchmarks.
Finally, length frequency data are combined with other life history parameters to calculate the fishing mortality rate (F) for the most common species found in catches. These are compared with published figures for natural mortality (M) for those same species to provide a further estimate of which species may be experiencing overfishing (Ault et al., 2005, 2008).
Materials and Methods
Study Site
The study was conducted in the western region of Menabe, Madagascar in proximity to the city of Morondava. In this region, the climate is tropical and there are three seasons: asara (December–April; cold and dry), asotry (May–August; hot and dry) and faosa (September–November; hot and wet) (Goedefroit, 1998).
Eleven villages were selected (Figure 1), as representative of the different areas of the region. Fishing occurs primarily within the lagoon in front of each village, with fishers employing multiple gears across multiple fishing sites. Catches were measured at the village landing site(s). In villages with multiple landing sites, data collectors spent equal time at each landing site during a tidal cycle to ensure representation.
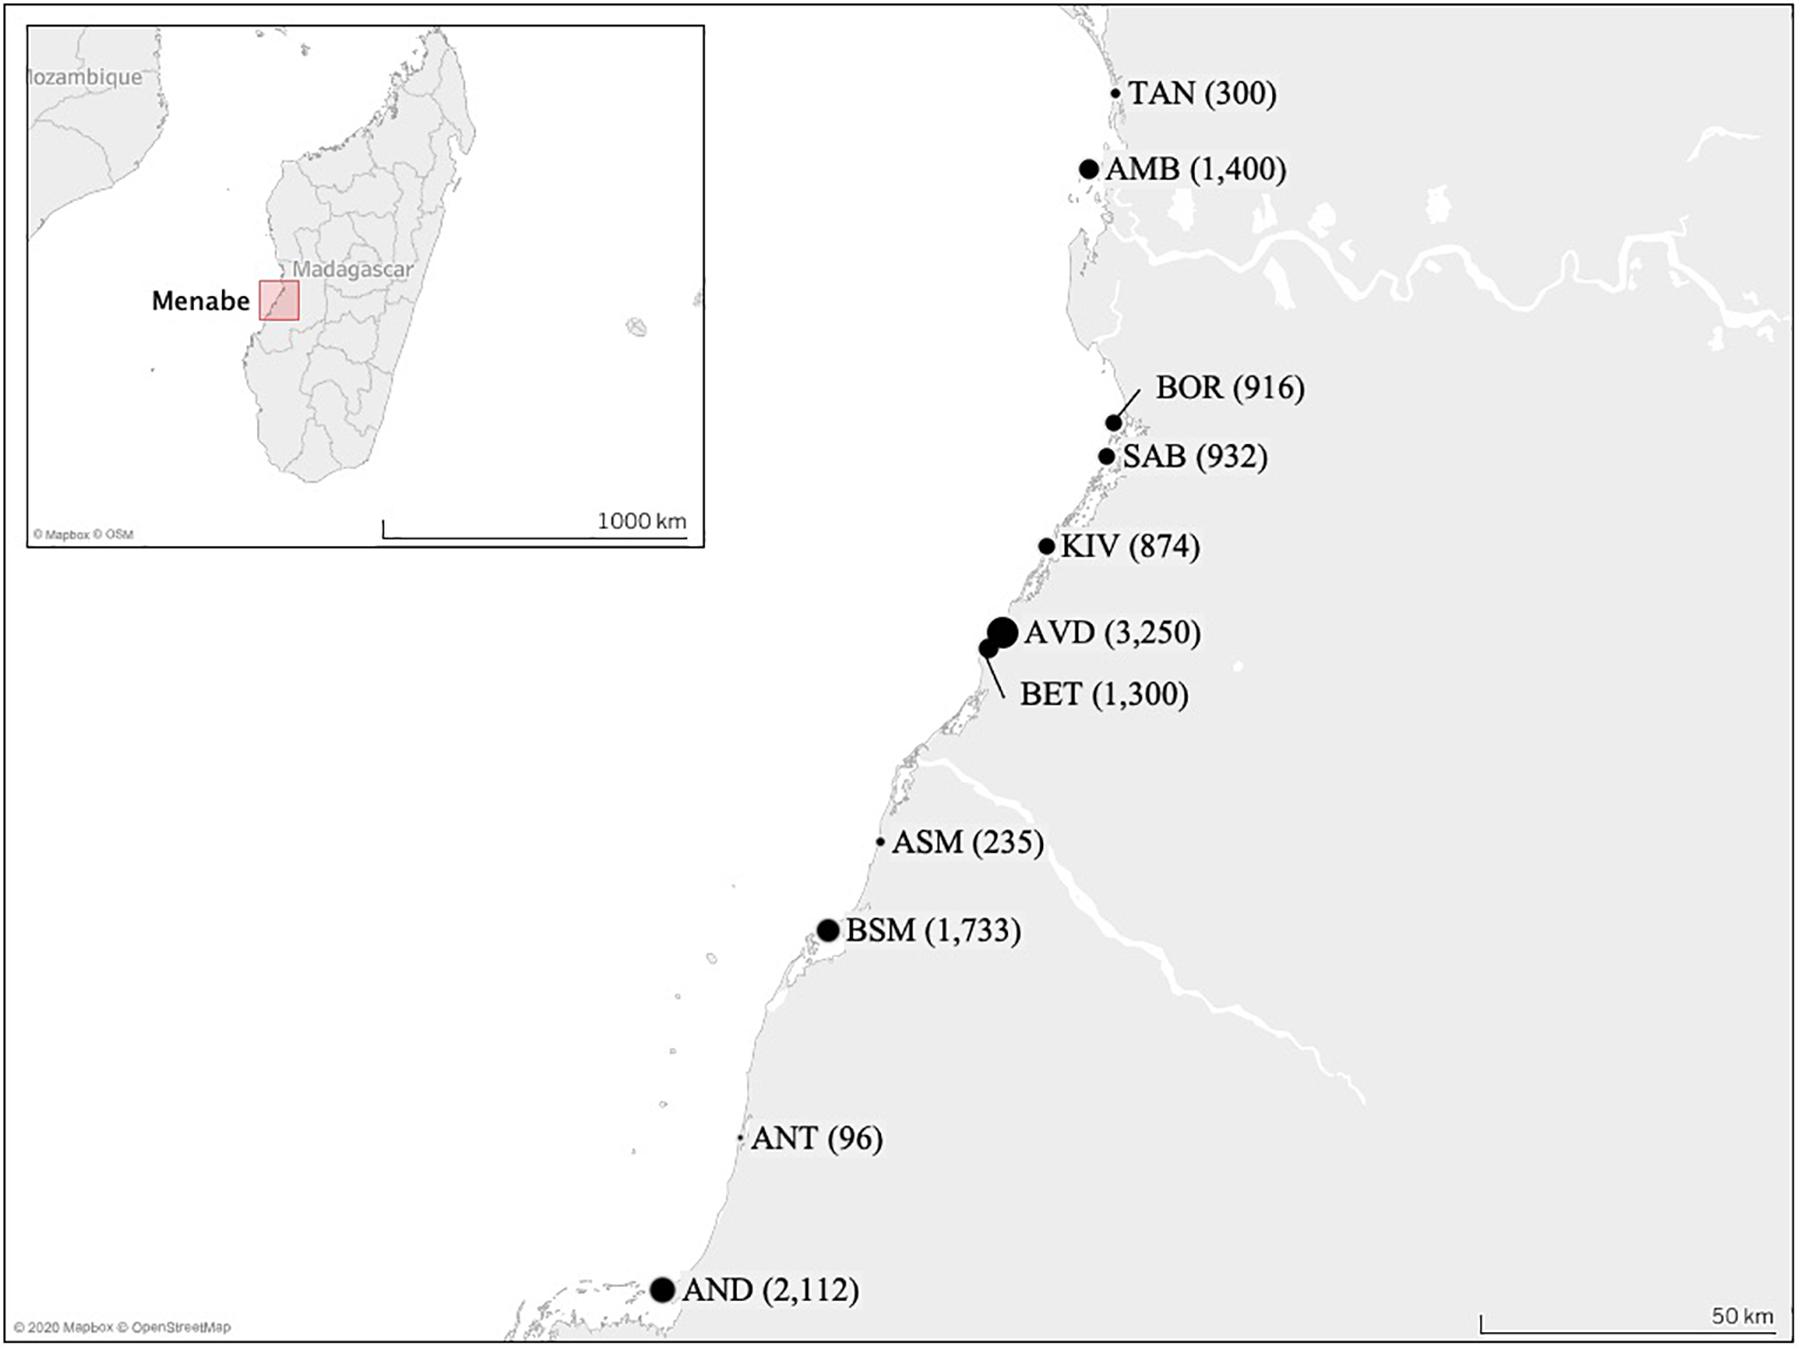
Figure 1. Map of the study area showing the positions of the 11 village landing sites sampled across the Menabe region of western Madagascar. The size of the circle represents their relative population size in 2011, this is also shown in parentheses (reported by village presidents or in Raharison, unpublished). (TAN, Tanambao Port; AMB, Ambakivao; BOR, Borongeny; SAB, Sabora; KIV, Kivalo Centre; AVD, Avaradrova; BET, Betania; ASM, Ankevo sur Mer; BSM, Belo sur Mer; ANT, Antseranandaka; AND, Andranompasy).
Fishing is the primary source of both food and income in this region and takes place on a daily basis (Laroche et al., 1997; Jones, 2011). The fishery uses traditional wooden single hulled canoes, either paddled (molanga), or rigged with a single outrigger and a square sail (lakana). Motors are rare in the traditional fishery of this region and fishers travel from their villages to and from the fishing sites under the influence of the tides. Boats are small (<10 m length), do not carry ice, and if caught in bad weather fishers may be forced to land and sell fish where they can before returning to their home village when the weather subsides. Fishing is subsequently highly dependent on a wide range of environmental conditions which affect both fisher behavior and fish abundance/availability (Astuti, 1995; Laroche et al., 1997).
Fishing Gears
Fishers employ mixed gears to catch multiple species. Fishing gears used in the nearshore coastal fishery were broadly categorized into eight groups; (1) hand-spear (HS) (2) spear-gun (SG), (3) handline (HL), (4) longline (LL), (5) gill nets (GN) for finfish (including set, drive, and drift nets) (6) shark nets (SN) (set nets with a large mesh size and made with monofilament of higher tensile strength to support capture of larger and stronger bony-fish and sharks), (7) beach seine nets (BS), and finally (8) hand nets or scoops (HN). Each gear may be employed in a variety of ways depending on the fishing season, the target species/fishery and the location being fished. Some gears are always deployed from a boat (shark nets and longlines). Others (hand-spears and drag nets) can be deployed from a boat or directly from the beach (Supplementary Table S1). Gear choice is affected by daily weather and tidal conditions as well as socio-economic factors including age, sex, wealth, and profitability of the gear. Some gears are often or solely used in conjunction with other gear types, e.g., hand-spears (voloso) are used alone or alongside nets or handlines, while scoop nets (kipao) are used to secure the fish or crab that has been caught with a handline (vinta) (updated from Gough et al., 2009).
Landings Assessment
In each village, two local data collectors were selected and employed to carry out monitoring at the main landing site (Humber et al., 2017). Data collectors completed a full week of training including testing of their identification skills. During this time, they were shadowed by the lead author or research assistants trained by the lead author and employed by Blue Ventures. Data collection was piloted in November and December 2009. Routine follow up training was performed by the lead author or research assistants to ensure data collectors were recording data effectively. Sampling was then undertaken for a minimum of 2 days per week between January 2010 and February 2012.
Data collectors prioritized working during times when boats were returning to the village and approached each boat as it landed its catch on the beach. They were stationed in locations where boats first landed their catches to ensure sampling of the entire catch. The length of the surveys was variable and dependent on the volume and diversity of catch, with a survey time between 15 and 20 min per boat. If multiple boats were landing at the same time, often fishers would wait to have their catch measured. However, this did not always happen, and some boats would not have been sampled. Surveyors received strong cooperation from fishers in providing information and accessing their catches. They reported that they surveyed around 60% of the boats on the days they were working. This suggests that this monitoring represents around 15–20% of the catches landed.
For each landing that was assessed, the number of fishers on the trip and the fishing gear type used was recorded, and total weight (g) of the catch was measured. All fish were identified to species level (where this was not possible, they were identified to genus or family level). Standard length (SL) (tip of snout to posterior end of the vertebrae) was measured for a random sample of five fish of each species represented in the catch.
Analysis
Catch Rate
Catch rate per fisher per trip (kg fisher–1 trip–1) was calculated for each gear. Catch rate per trip was used as fishers were not able to provide an accurate time for their departure, nor the time they spent fishing. As such the more granular measure was deemed unreliable for comparison.
Trophic Level
The values of the trophic level estimate for each species were computed from Fishbase values (Froese and Pauly, 2000) that are based on the diet of the species. The mean trophic level (TL) of the catch for each gear was then calculated using the following formula (Pauly et al., 2001), where Yik is the landings of species i in year k and TLi is its TL.
Species Diversity and Composition
Species richness (SpR) and Simpson’s index of diversity was calculated for the catch of each gear. Cumulative frequency distributions of abundance identified the species contributing the most to overall catch abundance. The main species were ranked in order of abundance and those contributing to cumulative abundance of 90% were retained for further analysis.
Assessments for Overfishing
Froese’s method is based on three simple ideas (Figure 2):
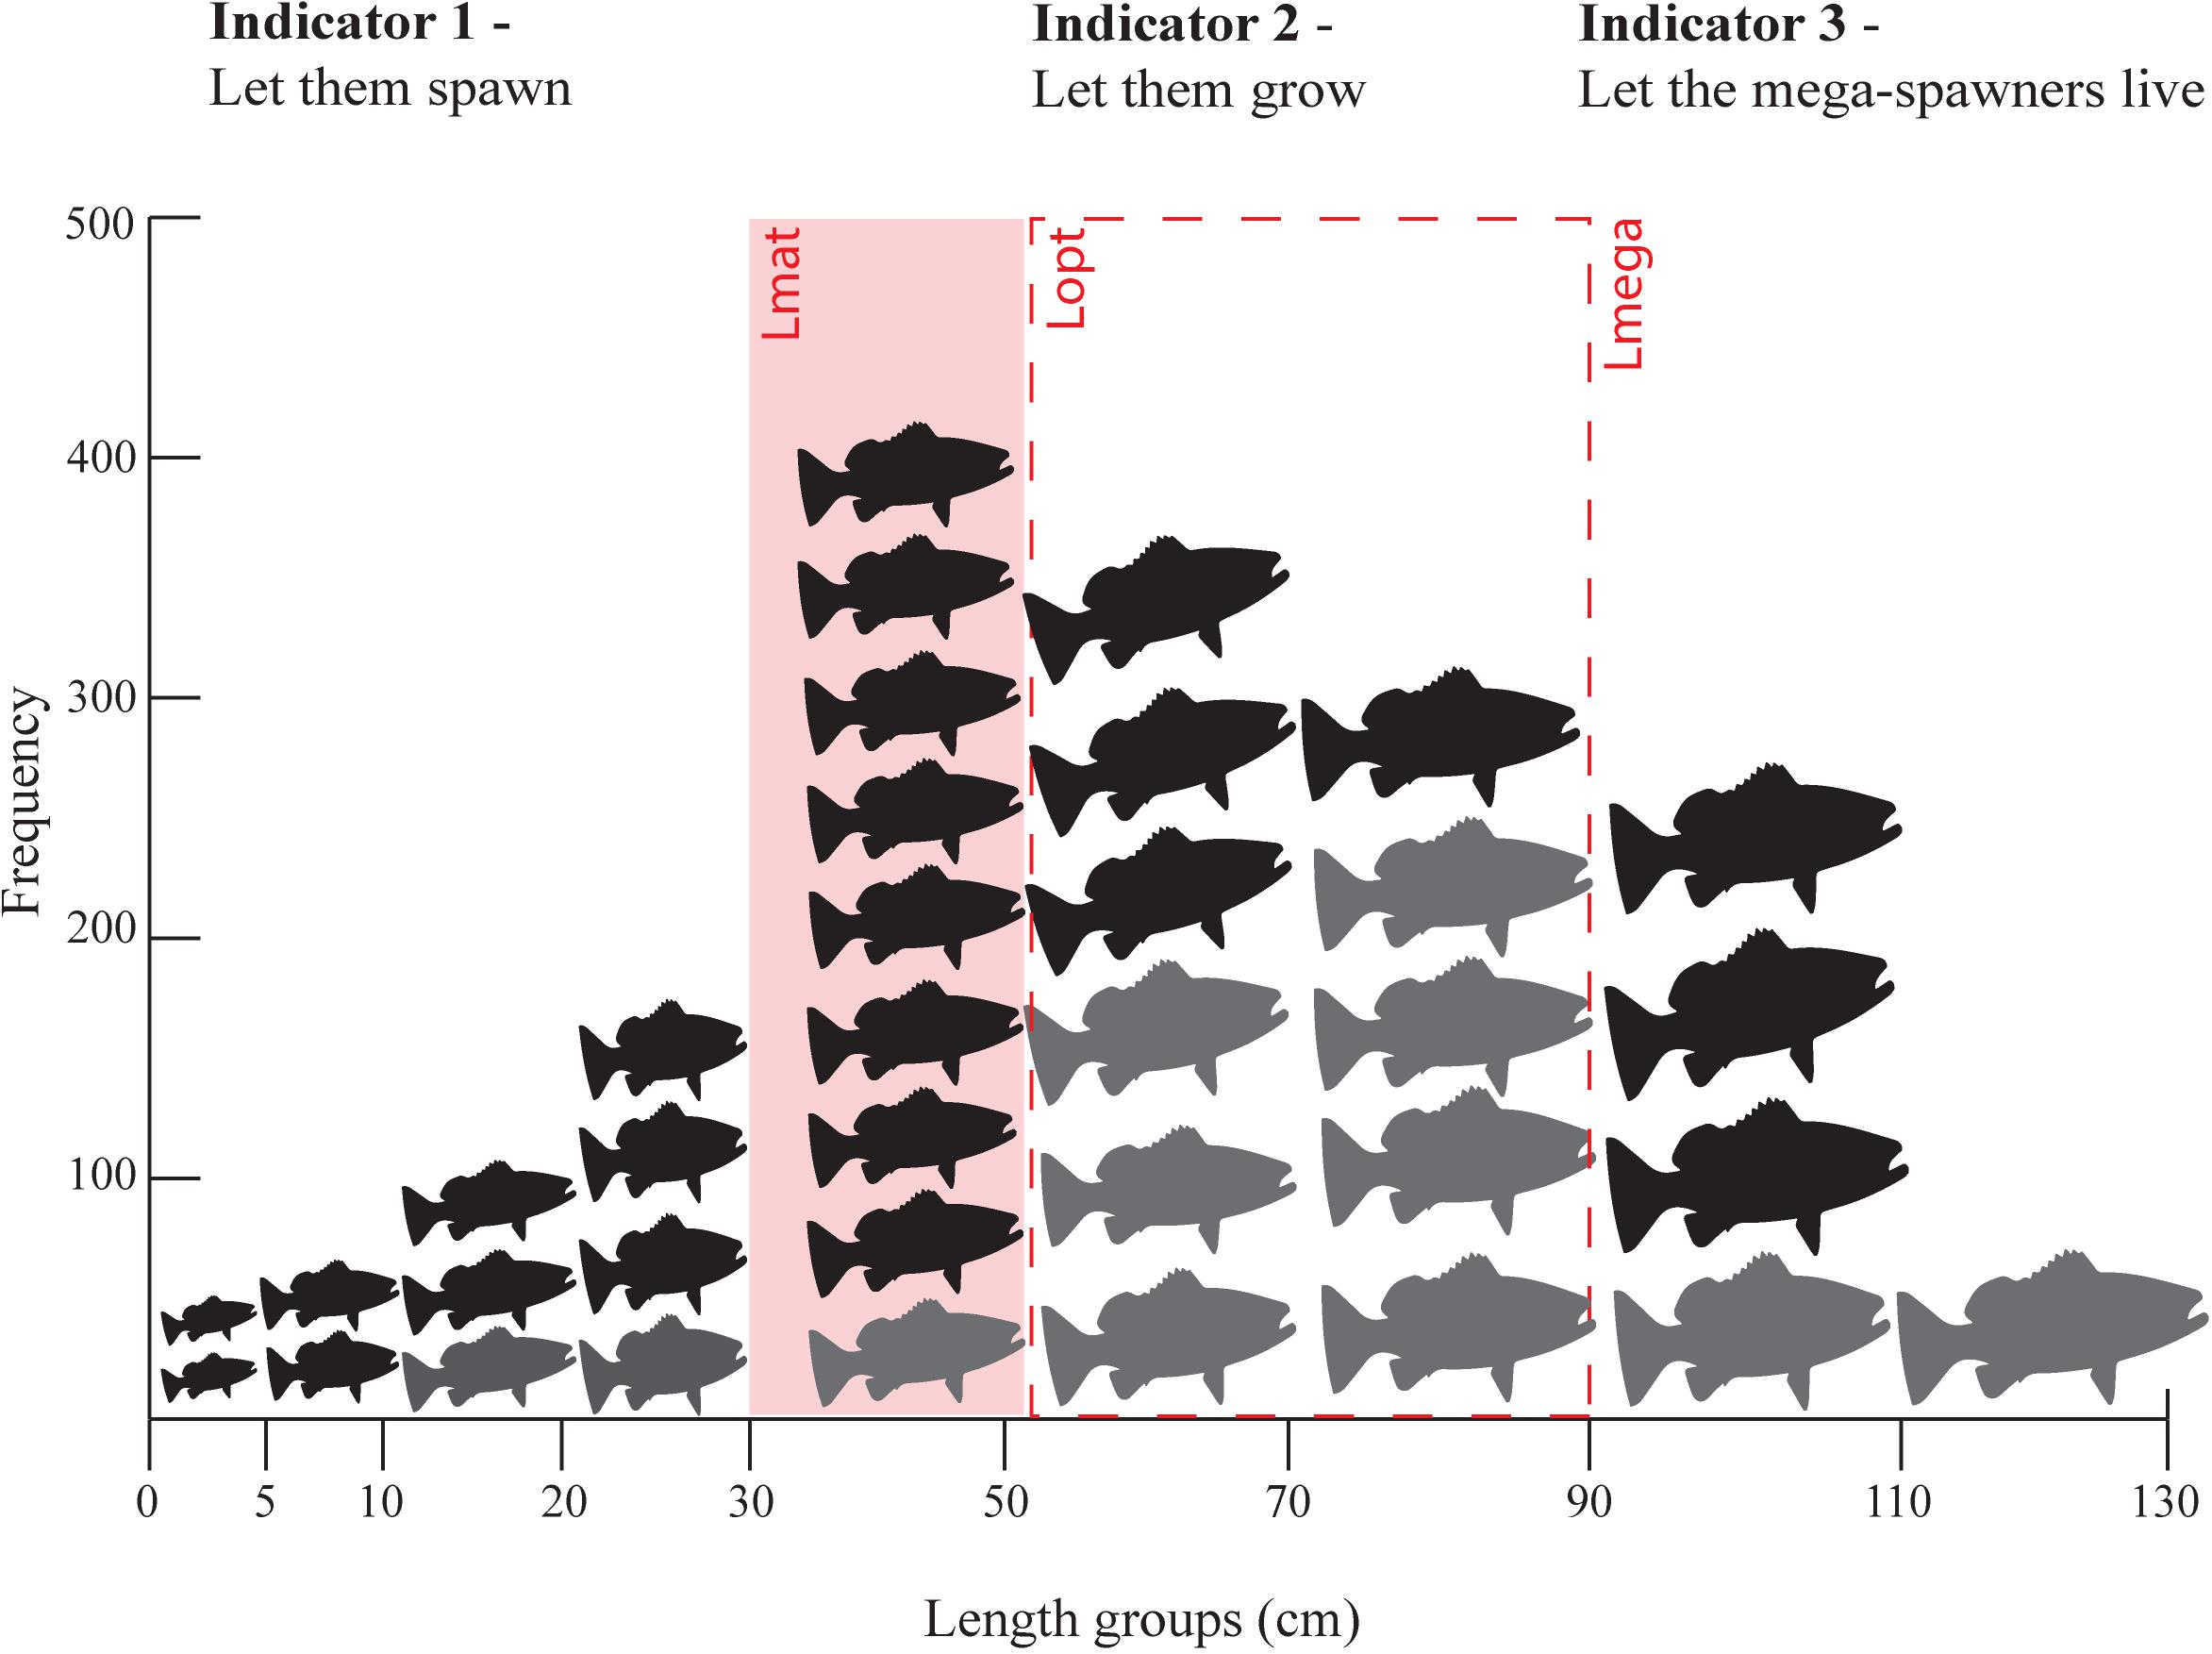
Figure 2. An example of a length frequency distribution (all fish) with Froese’s indicators of overfishing in red. Indicator 1 – Pmat proportion of fish below the length at maturity (Lmat) (fish to the left of the red rectangle are considered juvenile fish), Indicator 2 – Popt proportion of optimally sized fish, those between 0.9 and 1.10 of optimal length (Lopt) indicated by the red dotted rectangle, and Indicator 3 – Pmega proportion of fish more than 1.10 times Lopt (fish to the right of the red dotted rectange). Fish colored in grey represent the length frequency distribution that should be found in the catch in ideal conditions according to Froese’s targets (Suggested targets are 10% below Lmat, 100% at Lopt, and upto 30% Lmega).
• Indicator 1. Let them spawn! (Pmat = proportion of the catch > Lmat) – Fish should reach maturity and catches should aim to be exclusively mature fish. (Pmat target: 100% of catch are individuals below the published length at first maturity (Lmat) with 90% being a reasonable target)
• Indicator 2. Let them grow! (Popt = proportion of the catch between 0.9 Lopt and 1.10Lopt ) – Fish should reach optimal length (the length at which maximum possible yield is estimated) and catches should aim to consist primarily of fish at the size where highest yield from a cohort occurs. (Popt target: 100% of individuals within ± 10% of the published optimal length (Lopt))
• Indicator 3. Let the mega-spawners live! (Pmega = proportion of the catch greater than 1.1Lopt) – Fish should be able to mature 10% above optimum size and support recruitment as “mega-spawners.” (Pmega target: 0% of individuals 10% larger than the published optimal length (Lmega) although up to 30% would be reflective of a reasonable stock structure).
Lmat and Lopt for each species were taken from published records on Fishbase (Froese and Pauly, 2000). Where fishbase did not have published length at maturity data available for Madagascar the closest available data were used (Supplementary Table S3).
The Cope and Punt decision tree (Cope and Punt, 2009) was followed for each species. This indicated if the spawning biomass (SB) of a species was above or below that of the reference point (RP).
The sum of the catch-based length proportions was calculated (Pobj = Pmat+Popt+Pmega). The result was used in conjunction with Popt + Pmega or the value of Popt to then determine the selectivity pattern for each species as one of the following:
1. Catch small, immature fish;
2. Catch small and optimally sized fish;
3. Selectivity curve similar to the maturity ogive;
4. Catch optimally-sized and bigger fish; or
5. Catch optimally-sized fish.
Depending on the selectivity type, the ratio of length at maturity (Lmat) to optimal fishing length (Lopt) was calculated. This was then used in conjunction with either Pmat or Popt to infer if the spawning biomass (SB) was at or above the target reference point (RP). If the SB was below the RP it was inferred that the species was overfished.
This additional analysis gives a different view of the status of each species from the Froese indicators alone. If the fishery catches only small, immature fish (selectivity type 1), the reference point for Pmat is > 0.25 in the decision tree. Froese’s recommendation, however, is much more conservative. Suggesting Pmat should be equal to zero and allowing more fish to spawn.
Finally, to estimate fishing mortality (F), the total mortality (Z = F+M) was calculated from the average length (L) using the method of Beverton and Holt (1957) as modified by Ehrhardt and Ault (1992). This approach considers the potential bias of the fishery not exploiting all older age classes of fish.
Total mortality (Z) was calculated using the bheq function within the fishmethods package (Nelson, 2019) in R, and using the Ehrhardt and Ault (1992) bias-correction. The life history parameters needed for this analysis included; parameters of the Von Bertalanffy growth equation (K and L∞), length at first capture Lc (estimated as the length at which a smooth curve through the cumulative length frequency histogram reached its maximum slope), and maximum length in the fishery Lλ (the maximum observed length for each species). For some species, there were a few fish in the data set that were larger than the rest of the fish of that species; we excluded these outliers from the calculation of Lλ.
The fishing mortality rate (F) is estimated by subtracting the natural mortality rate (M) from total mortality (Z). Where F < 0, it was assumed to be zero; this was true only for two species Sardinella albella and Chirocentrus dorab. Figures for natural mortality rate (M) were taken from published values on Fishbase. The natural mortality rate is often used as a proxy for the fishing mortality rate that would maximise sustainable yield (Fmsy), and a population with F > M may be considered to be experiencing overfishing (Ault et al., 2008).
Selectivity of Gears
Knowledge of how fishing gears interact with one another, and understanding their overlap in selectivity in relation to both species and size, is important for management (Gobert, 1994). Detrended correspondence analysis (DCA) is a multivariate analytical method that ordinates similarities between groups. DCA was applied to assess the similarity in species selectivity between gears based on the abundance of each species in catches. This has been used in similar analyses in SSF in Kenya (McClanahan and Mangi, 2004). Overlap between gear in relation to size was then assessed for each of the top 20 species by comparing the median length of individuals caught by each gear with the length of maturity for that species.
Results
Data collectors surveyed a total of 17,161 fishing trips during the two-year study. The number of fishers varied between 1 and 11 on a fishing trip, resulting in a total of 22,346 fisher days. From almost 2 million individual fish recorded during the survey, length-based measures were collected from 121,954 individuals (Table 1).
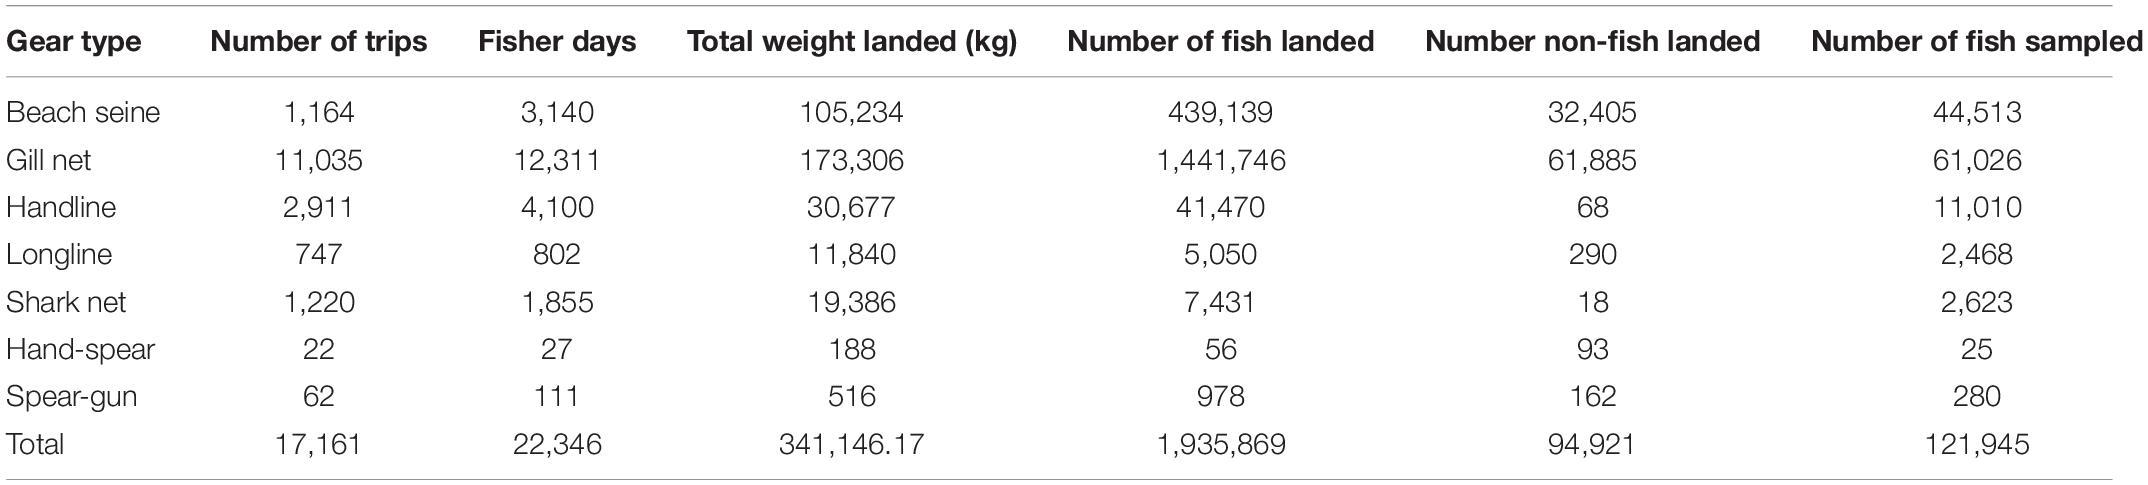
Table 1. Summary information for each gear type surveyed during the study.
Fish represented 95% of the catches overall, and comprised the majority of catch for beach seines, gill nets, handline, longlines and shark nets (Table 2). In addition, 94,921 non-fish organisms were recorded in the catches (Table 1). These were primarily shrimps and prawns (92,285 individuals and 4.5% of the total catch abundance) and predominantly caught by beach seines and gill nets. Crabs contributed to just 0.1% of total catch abundance (n = 1,727), with the majority caught by gill nets. Octopus (n = 48), squid (n = 73), and sea cucumbers (n = 588), as well as 3 dolphins and 24 turtles [23 green turtles (Chelonia mydas) and one leatherback turtle (Dermochelys coriacea)] contributed each less than 0.1% of the catch abundance (Table 2). However, despite their small contribution to overall catch abundance, octopus and sea cucumbers contributed substantially to the catches of hand-spear and spear-gun fishers (Table 2).
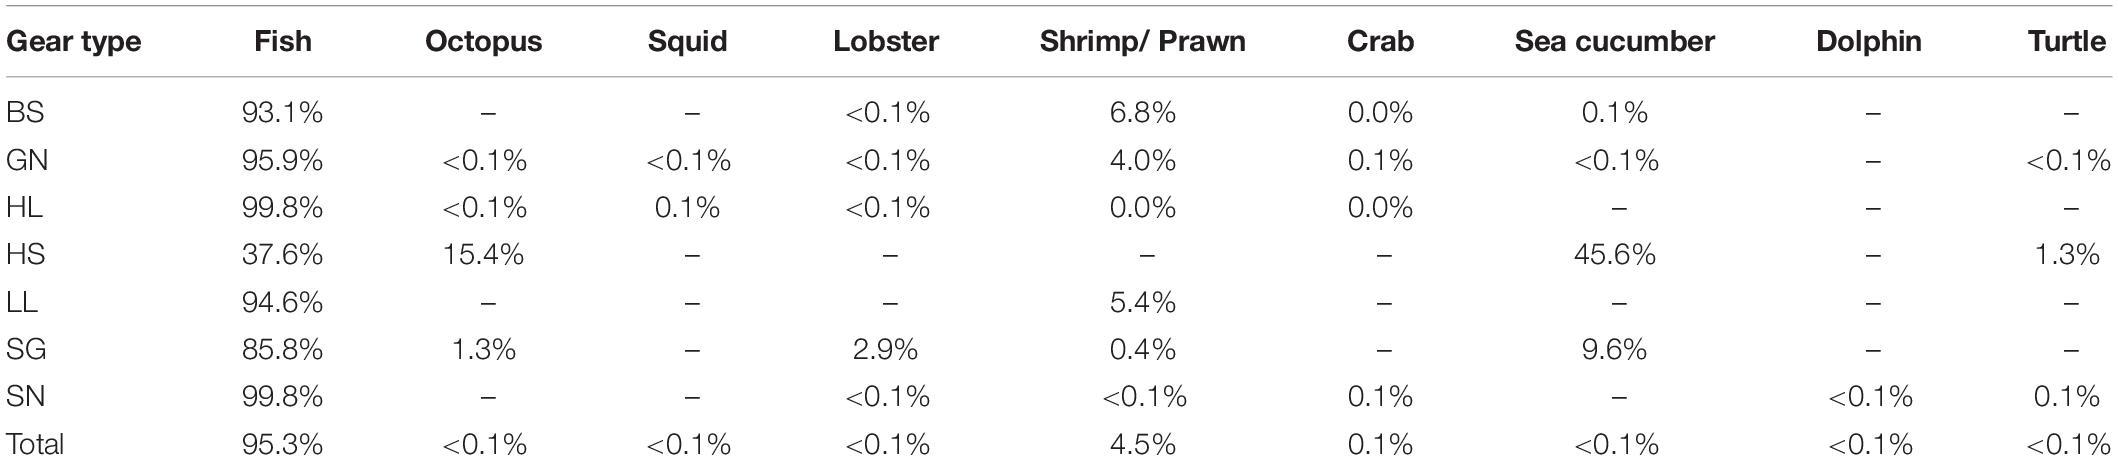
Table 2. Composition of catches including non-fish species by gear type (BS, Beach seine; GN, Gill net; HL, Handline; HS, Hand-spear; LL, Longline; SGm, Spear-gun; SN, Shark net).
These other groups were excluded from the analyses as, other than turtles, which are more commonly recognized, data collectors were not able to identify individuals consistently to species level, and length measures were not taken consistently, making them incomparable in relation to trophic level and length. In addition, data collectors also reported large catches of shrimp that they were not able to quantify, so numbers reported are likely to be an underestimate. Octopuses, squid, lobster, shrimps, prawns and crabs are all commercial species and would have been sold to local buyers (sous-collectors) or at local markets, while dolphin and turtle would have been consumed locally, either by the fisher’s family or the meat would have been sold to other households in the village (Humber et al., 2011).
Species Composition
Despite the diversity found in catches overall, cumulative frequency distribution showed that just 20 species accounted for more than 90% of the total abundance. The top 20 species were therefore retained for further analysis (Figure 3). The other 140 species contributed less than 1% of abundance each (Supplementary Table S2). Of these 20 fish species, ten accounted for 80% of total landings from all gears (Figure 3). In order of abundance these were: orange mouth anchovy (Thryssa vitrirostris), Indian mackerel (Rastrelliger kanagurta), bluestripe herring (Herklotsichthys quadrimaculatus), white sardinella (Sardinella albella), flathead gray mullet (Mugil cephalus), tigertooth croaker (Otolithes ruber), Commerson’s anchovy (Stolephorus commersonii), strongspine silver-biddy (Gerres longirostris), yellowstripe goatfish (Mulloidicthys flavolineatus), fourlined terapon (Pelates quadrilineatus). However, these top ten species were notably absent from hand-spear fisher catches, and only four were present in spear-gun catches (G. longirostris, M. flavolineatus, P. quadrilineatus and R. kanagurta), comprising a small proportion of the catch (Supplementary Figure S1).
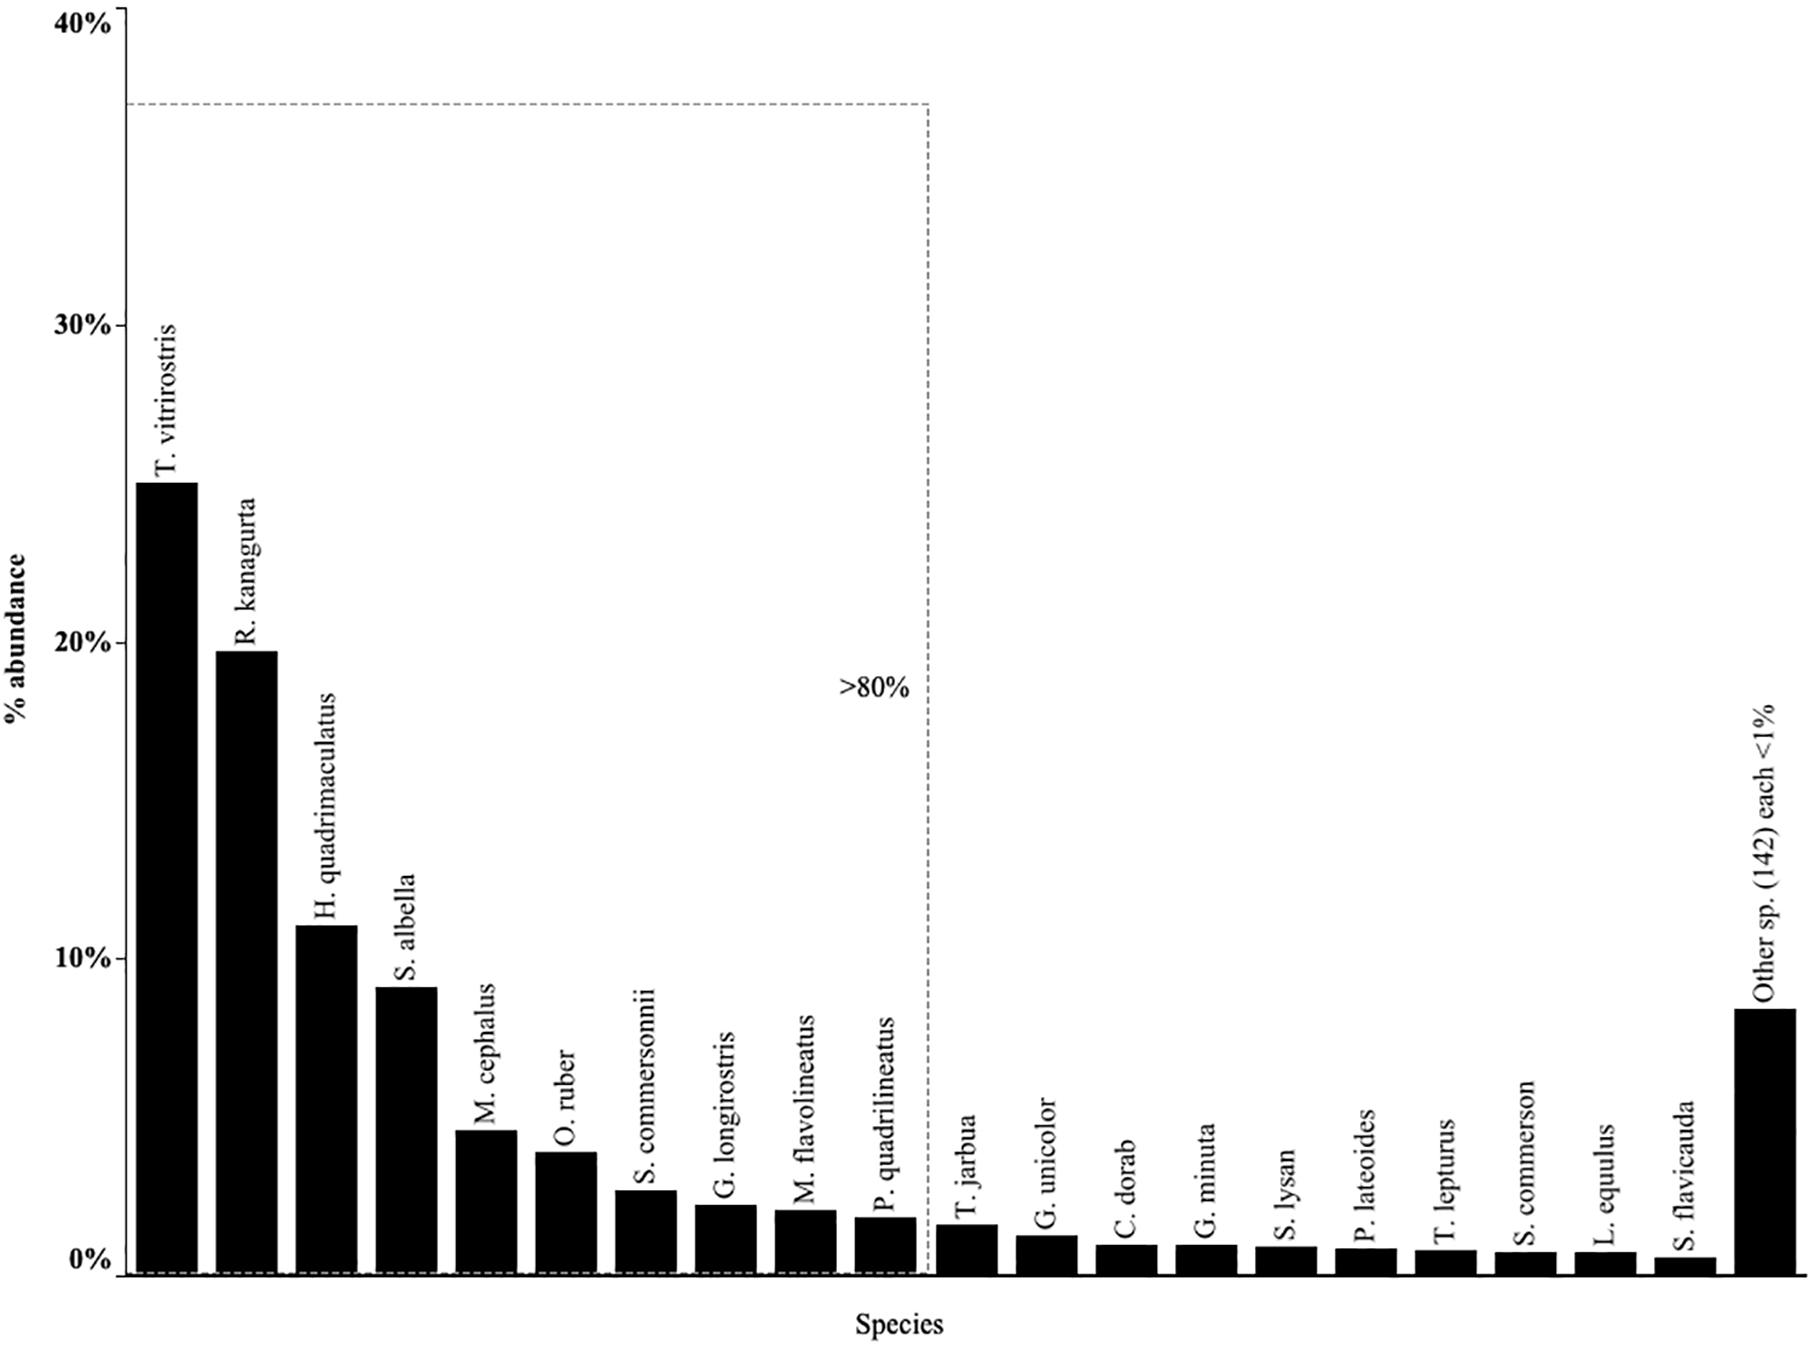
Figure 3. Relative abundance of top 20 species with the top 10 contributing more than 80% of the total abundance. Top species for each gear type given in Supplementary Figure S1 and a full species list and relative abundances by each gear type given in Supplementary Table S2.
Catch Rate
Fishing trips varied widely in their landings. Catch rates during this study were often below 10 kg per fisher per day (median 8.2 kg per fisher per day Q1 = 4.0, Q2 = 15.0). However, the exception of a few very large catches, the highest observed catch from a single trip was > 3 tones, caused a strong right skew in the data. Large catches are a rarity rather than the norm (Figure 4A). Indeed, more than 750 fishing trips (4.5%) returned without any catch, and this was recorded for all gear types. Daily catch weight also varied among gear types; beach seines had the largest daily catch rate, followed by longlines and gill nets. Spear-gun fishers had the lowest catch rates, followed by handline and hand-spear fishers (Figure 4A and Supplementary Table S4).
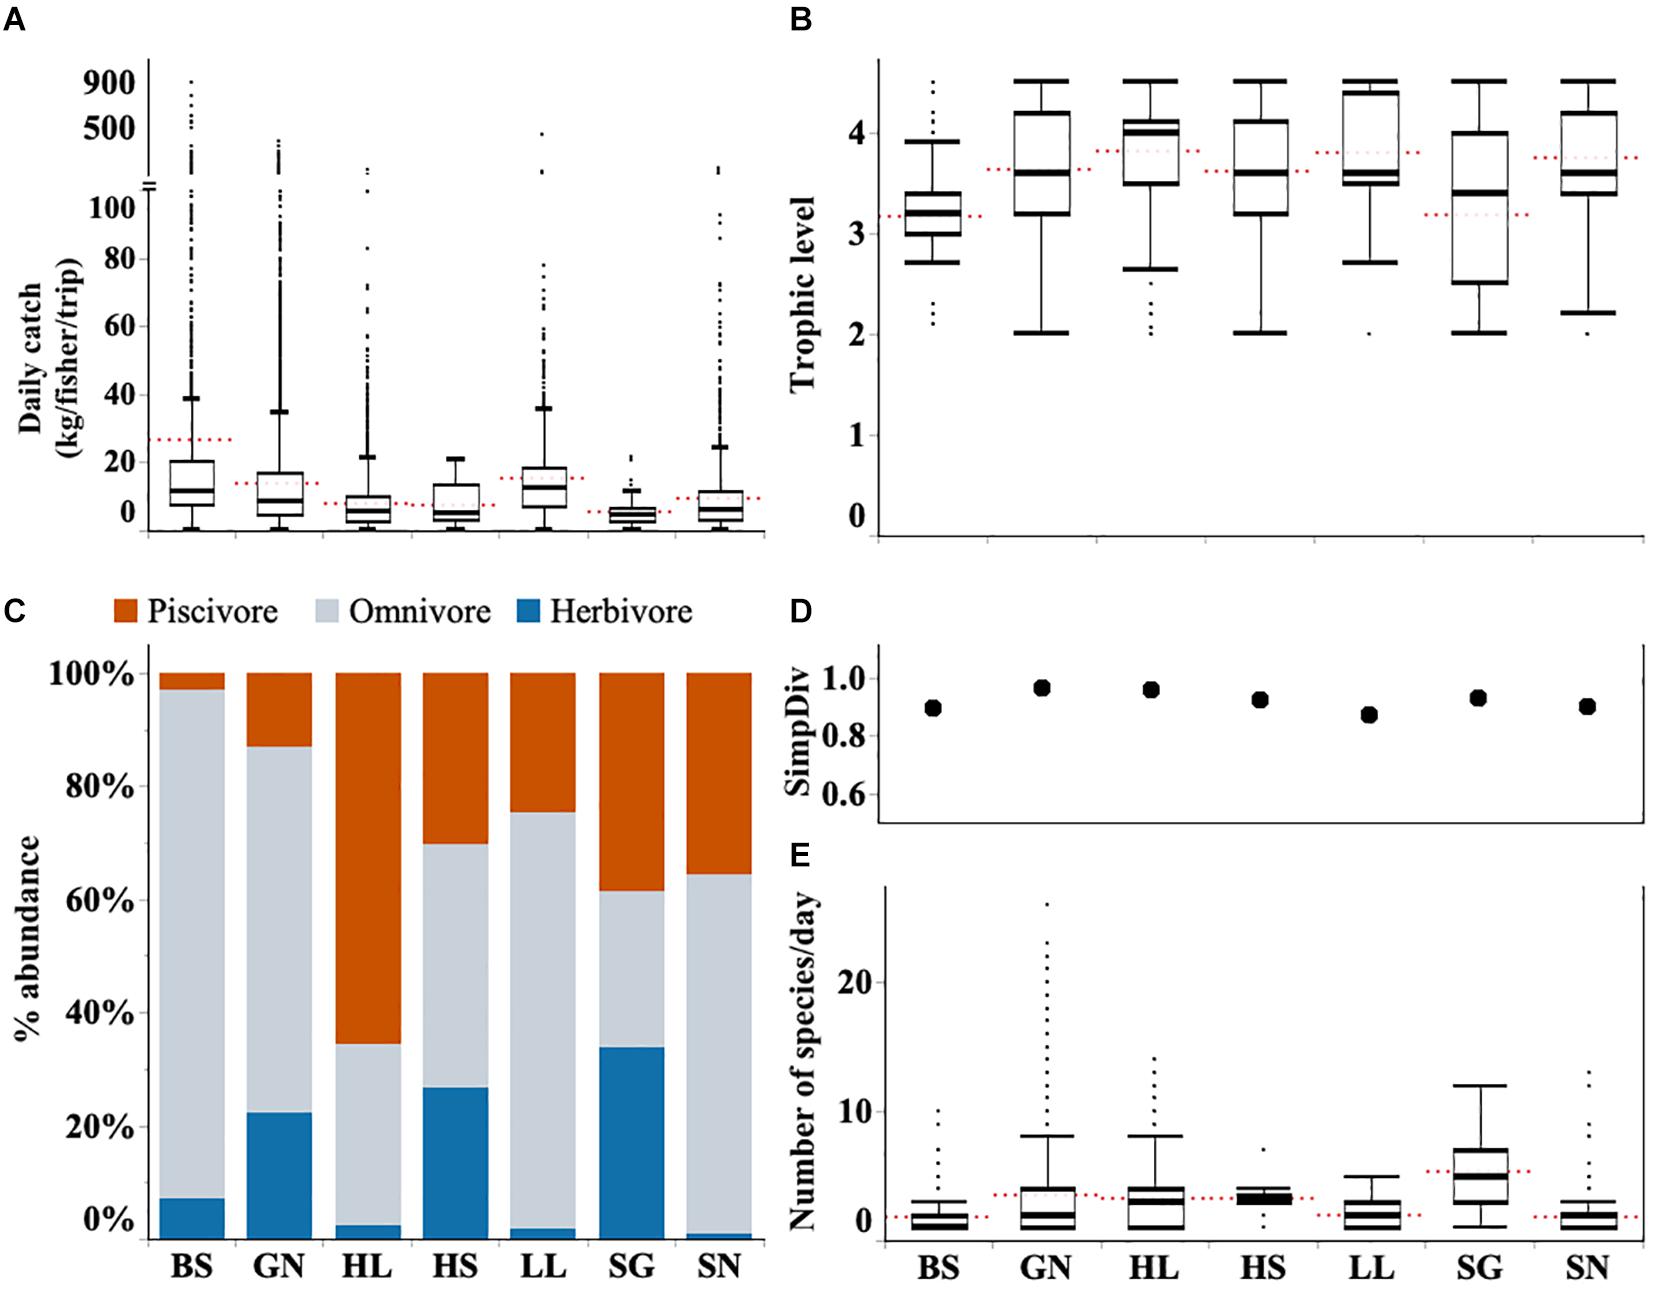
Figure 4. Graphs show (A) daily catch rate per fisher (kg/fisher/trip) (B) trophic level of catches (C) proportions of catch by trophic level (D) diversity (Simpson’s diversity index) and (E) species richness (SpR) for each gear type (BS, Beach seine; GN, Gill net; HL, Handline; HS, Hand-spear; LL, Longline, SG, Spear-gun; SN, Shark net). Boxplots show the median and the range between the percentile 25 (lower quartile) and 75 (upper quartile), and whiskers 1.5 times IQR. Red dotted line indicates the mean. Full descriptive statistics provided in Supplementary Table S4.
Trophic Level
Across all gears the median trophic level for landings was 3.6 (Q1 = 3.2; Q3 = 4.2). Catches from the different gear types ranged from 3.2 to 4.0 (Figure 4B). Higher levels such as those for gill nets are likely due to high numbers of omnivorous and piscivorous fish in their catches. Mean trophic level was lowest for spear-guns which often target herbivorous fish such as parrotfish and surgeonfish (Figure 4C and Supplementary Figure S1).
Species Diversity
Across all fishing gears, 160 fish species were identified representing 59 fish families. Gill net and handline fishers made the highest contribution to this richness catching 147 and 112 different species, respectively, throughout the study period. All other gears caught fewer species overall, including beach seines which caught just 38 different species (Supplementary Table S2). Daily catches for most gear types included just two or three different species, with the exception being spear gun fishers who landed a median of five species (Figure 4E).
Diversity was highest in landings from gill nets and handline fishers with Simpson’s index both at 0.96. Simpson’s diversity index was lowest in longline catches (0.87) followed by beach seine landings (0.89) (Figure 4D).
Gear Selectivity
There was overlap in both the size and species caught in the different gear types used in this fishery. The results from the DCA indicated the strongest overlap occurred between gill net and beach seine catches. These gears also differed from others by catching small coastal pelagic species (Supplementary Figure S3). Indeed, all species caught by beach seines were also caught by gill nets. Gill nets also caught more than 90% of species caught by other gears. Both beach seines and gill nets caught fish with the smallest mean lengths (Figure 5A). They are likely to catch individuals before they are available for capture by other gears, often before the species reach maturity.
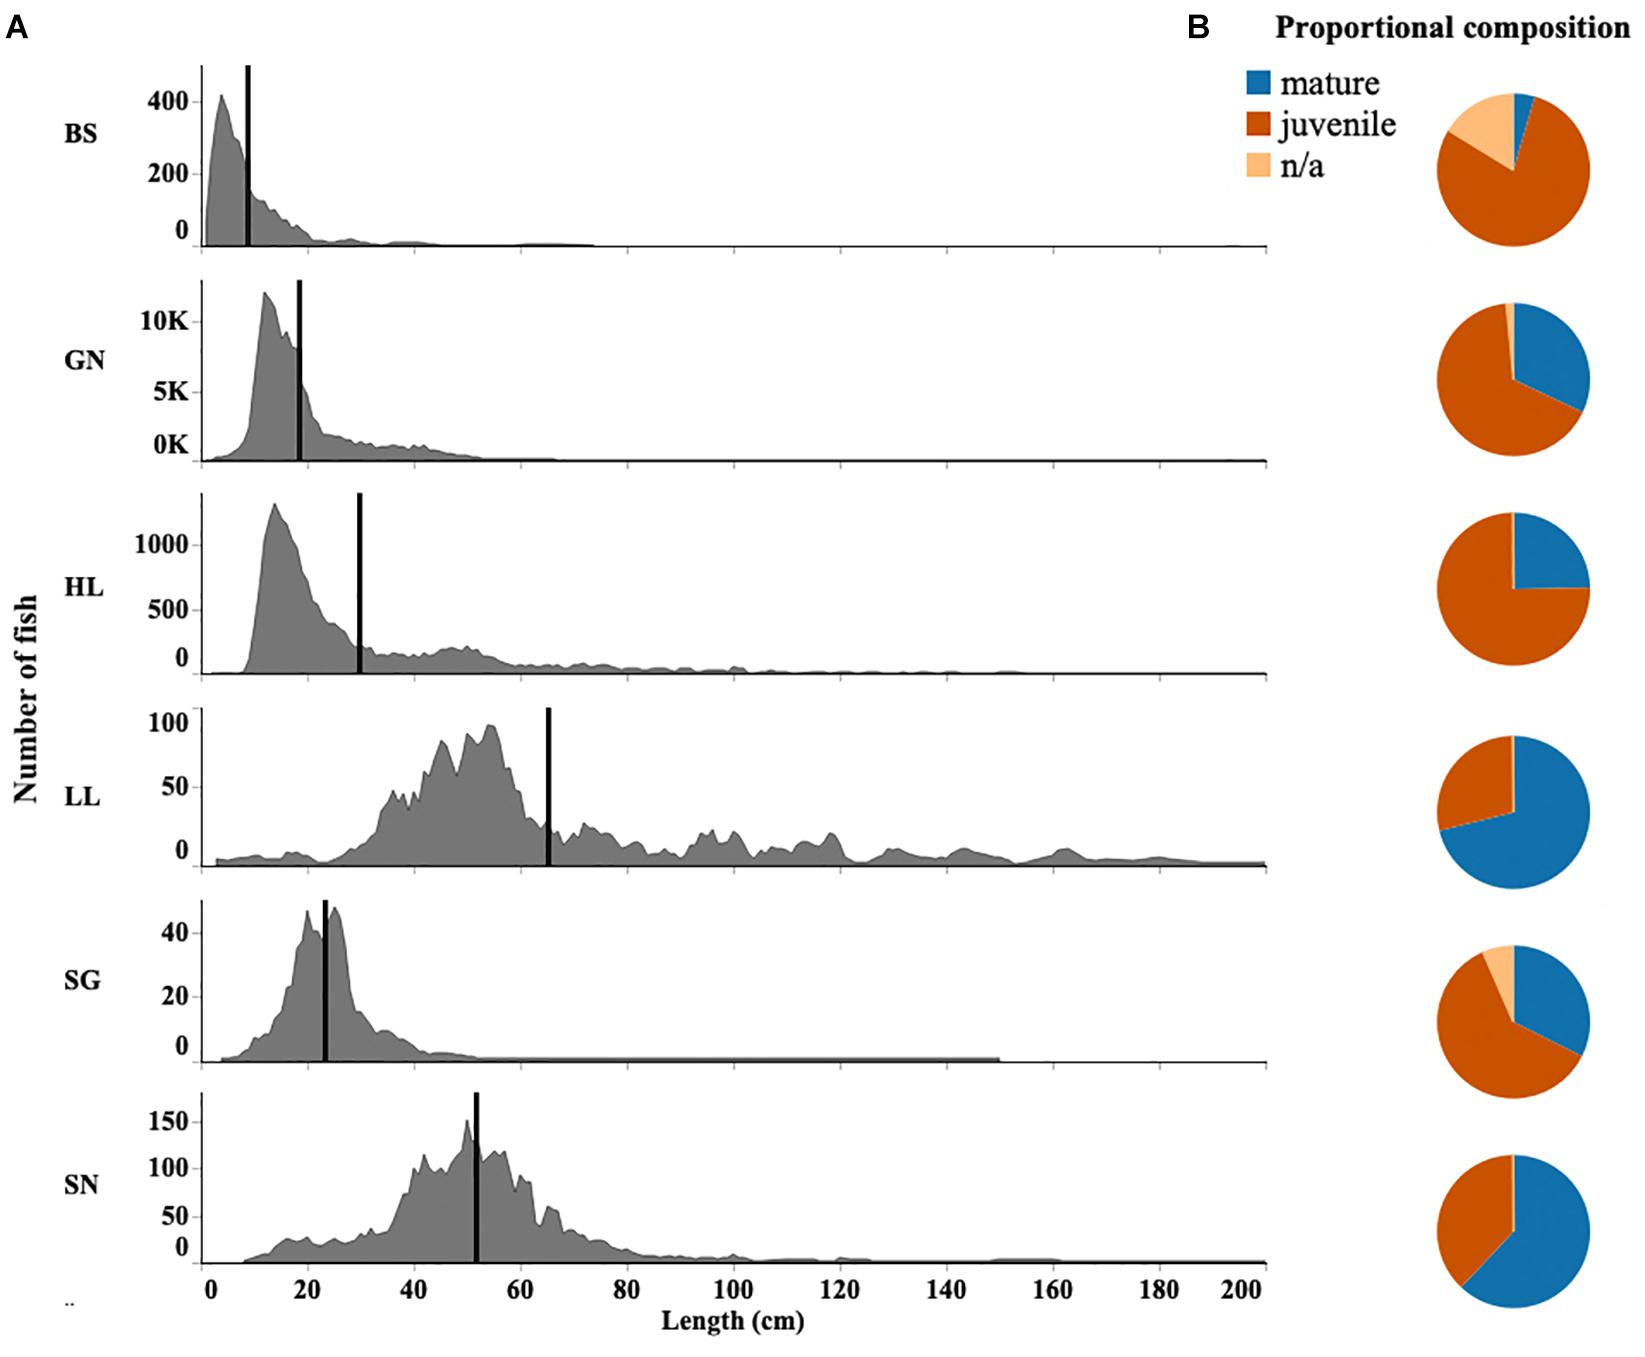
Figure 5. (A) Fish length distribution for each gear type (BS, Beach seine; GN, Gill net; HL, Handline; HS, Hand-spear; LL, Longline; SG, Spear-gun; SN, Shark net), black line indicates the mean length. (B) Proportion of juvenile and mature fish within sampled catches of each gear type. Fish length distributions for the top 10 most abundant species are given in Supplementary Figure S2.
Length-Based Assessments of Overfishing
Overall the median length of fish caught in the region was 16 cm (Q1 = 12; Q3 = 24). Fish were caught as small as 1–2 cm in length. The largest fish caught was a 490 cm shark (of unknown species) caught by a handline fisher. Beach seines generally caught the smallest fish. Gill nets and spear-guns also caught small-sized fish while handline and hand-spear fishers caught larger fish. Longlines and shark nets caught the largest fish with a median size of 54cm (Q1 = 44; Q3 = 78) and 50cm (Q1 = 40; Q3 = 59), respectively (Figure 5A).
While shark nets and longlines caught larger fish, their catches still contained a large proportion of fish below their published length at maturity, and 47 and 36% of individuals caught were identified as juvenile, respectively. Immature individuals also comprised 36% of fish caught by longlines. By contrast, 98% of fish caught by beach seines were below the length at first maturity. However, while only 36% of fish were below the size at first maturity for hand-spear catches, handlines also had a high proportion (75%) of immature individuals (Figure 5B).
Overall, using Froese’s indicators, 66.7% of fish sampled from the top 20 species were landed below their length at maturity (Lmat). Three species (G. unicolor, M. cephalus, and P. lateoides) were comprised of 100% immature individuals. A further ten species (C. dorab, G. longirostris, M. flavolineatus, O. ruber, P. quadrilineatus, S. lysan, S. commersonnii, T. jarbua, T vitrirostris, and T. lepturus) were comprised of > 80% immature individuals, and only the four species R. kanagurta, S. albella, L. equluus, and G. minuta had 20% or less immature individuals (Figure 6A and Supplementary Figure S2).
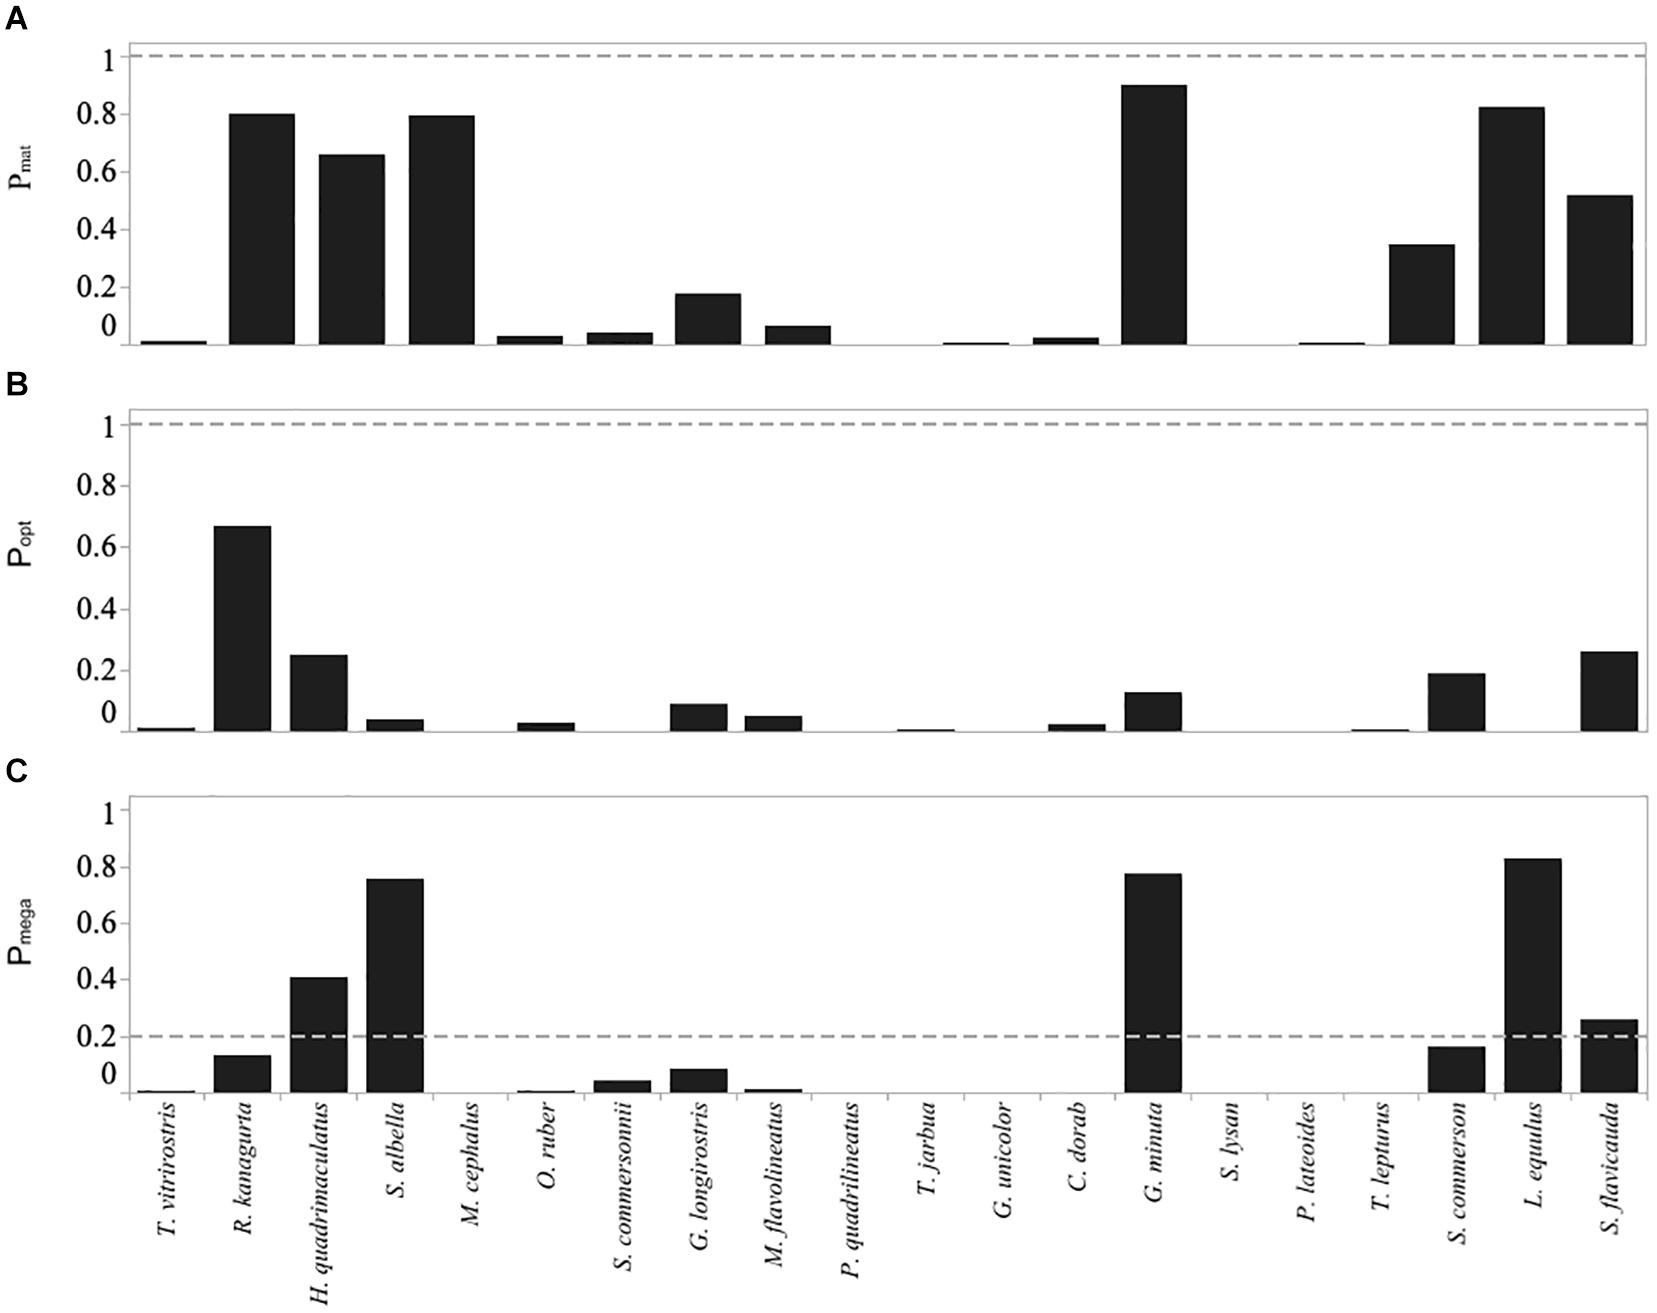
Figure 6. Froese indicators for the top twenty most abundant species caught in the Menabe small-scale fishery, including (A) Pmat the fraction of catch that is mature), (B) Popt the fraction within the optimal size range, and (C) Pmega the fraction of megaspawners. Horizontal dashed lines are target levels of the indicators as suggested by Froese (2004) (below the dashed line is not desirable).
The top 20 species were caught by most of the gear types. In some species, all gears were catching individuals below the length of maturity (G. unicolor, M. cephalus, and P. lateoides), while in other species, mature individuals were being caught by some gears only, while other gear types were mainly catching juveniles (e.g., G. minuta, H. quadrimaculatus, M. flavolineatus) (Figure 8).
The proportion of the catch at optimal size was less than 50% in all but Indian mackerel (R. kanagurta) (Figure 6B). Additionally, in 14 of the top 20 species more than 50% of the catch was smaller than the lower limit of the optimal size range.
Using the Cope and Punt decision tree, M. cephalus, P. quadrilineatus, G. unicolor, S. lysan, and P. lateroides all related to selectivity type 1 (Pobj < 1, and Popt + Pmega = 0). In all of these species the Pmat was less than the reference point of 0.25, and thus we assume that these species exhibited signs of overfishing since spawning biomass (SB) is less than the target reference point (RP) (Table 3). Ten species related to selectivity type 2 (Pobj < 1, but where Pop t+ Pmega > 0). Of these ten species, however, only one species (S. flavicauda) had a Lmat : Lopt ratio and Pmat value that suggested spawning biomass was greater than the target reference point and thus was not exhibiting signs of overfishing (Table 3). Finally, R. kanagurta, H. quadrimaculatus, S. albella, G. minuta, and L. equulus, all related to the selectivity type 3 (Fish maturity ogive – where Pobj was between 1 and 2). Lmat:Lopt ratio was greater than 0.9 in all species, however, the Pmat was only > 0.9 for G. minuta, suggesting that only this species had a spawning biomass greater than its target reference point. Suggesting that all species except G. minuta may be overfished (Table 3).
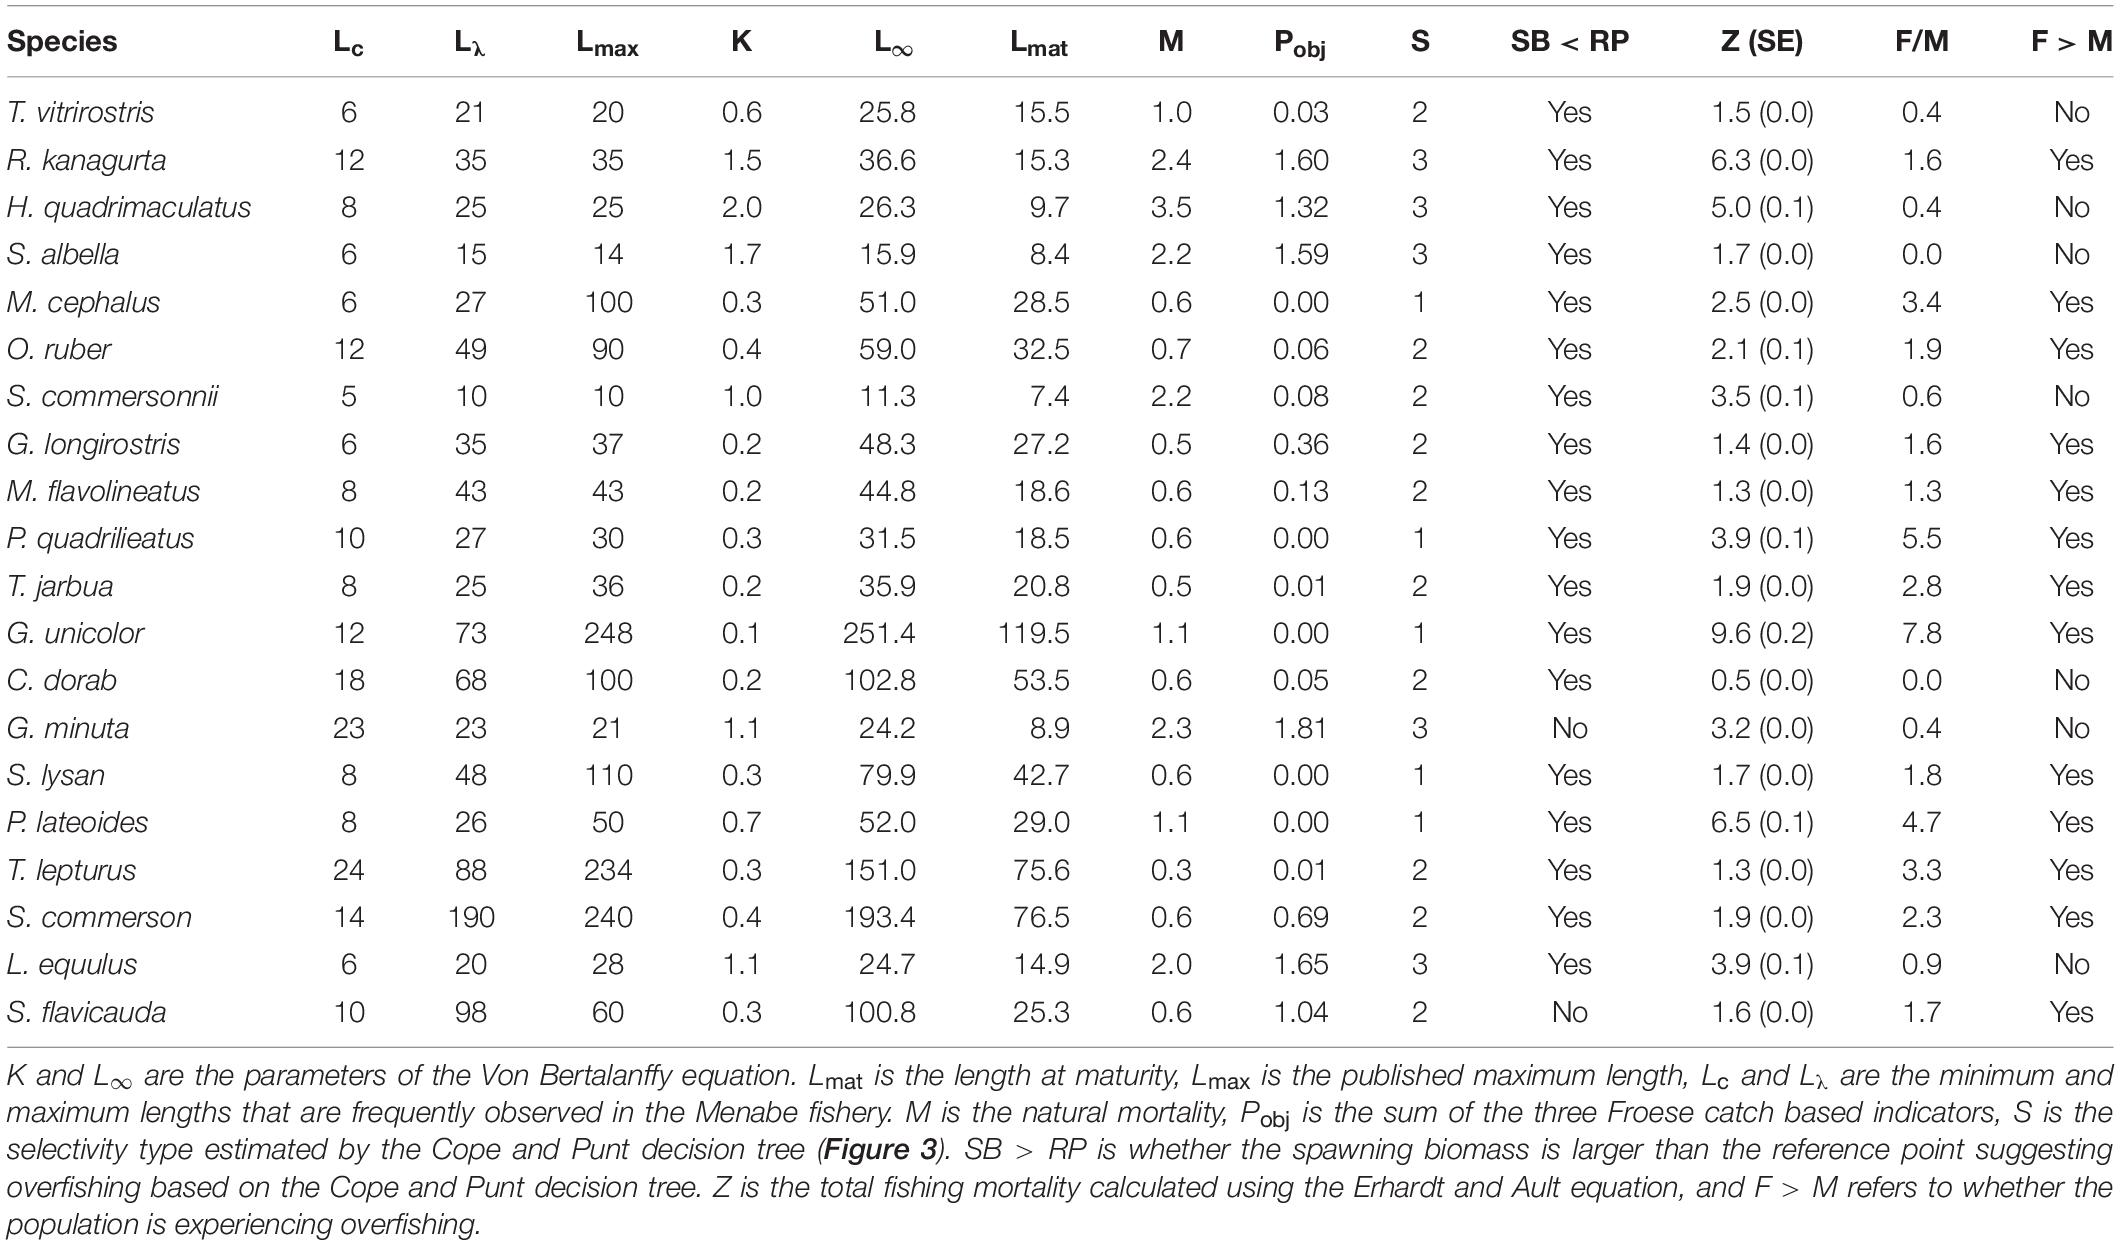
Table 3. Values of the life history parameters and indicators of overfishing.
The value of F relative to M implied that thirteen species, notably R. kanagurta, M. cephalus, O. ruber, G. longirostris, M. flavolineatus, P. quadrilineatus, G. unicolor, S. lysan, P. lateoides, T. lepturus, S. commerson, and S. flavicauda, were experiencing fishing mortality greater than natural mortality (F > M) (Table 3).
Discussion
This study uses records from more than 17,000 small-scale fishing trips sampled over a two-year period. Using catch and length data from over 120,000 individual fish we provide some of the first quantitative evidence that Madagascar’s nearshore SSF are exhibiting signs of overfishing.
Evidence of Overfishing
This study found that thirteen of the 20 most abundant species in the SSF catches of Menabe are currently overfished or experiencing overfishing. The Cope and Punt decision tree inferred that 18 of the 20 most common species had a spawning biomass below that of reference points, suggesting that they may be overfished (Table 3). There was a high proportion of juvenile fish caught for most species, suggesting they are at risk from recruitment overfishing if fishing mortality remains high. Additionally, very few individuals were fished at or above the optimal size for the species (Figure 6B). This suggests that they may also be experiencing growth overfishing. While both the Froese indicators and the Cope and Punt decision tree can be used to infer overfishing from length-frequency data, they are not a direct estimate of biomass. Results should therefore be interpreted with caution, but it is likely that they would benefit from further assessment and improved management.
Overfishing is theoretically impossible if all fish had been able to reproduce before capture (Myers and Mertz, 1998). Froese suggests that a target between 90 and 100% of fish reaching maturity would allow each fish to reproduce at least once before they are caught (Froese, 2004). In this study, none of the 20 most commonly caught species achieved Froese’s target threshold of 90% achieving maturity. (Table 3). This suggests that most of the fish being caught have not been able to replace themselves in the population, and this is quite an alarming result. Further estimates of fishing mortality (F > M) suggest that overfishing is likely for only some species. In seven of the twenty species, fishing mortality does not exceed natural mortality (Figure 7). This would suggest that the number of fish being removed by the fishery in these cases is not more than the proportion that would die from natural causes. It is notable that these species (with the exception of C. dorab) have a low vulnerability to overfishing (Cheung et al., 2005).
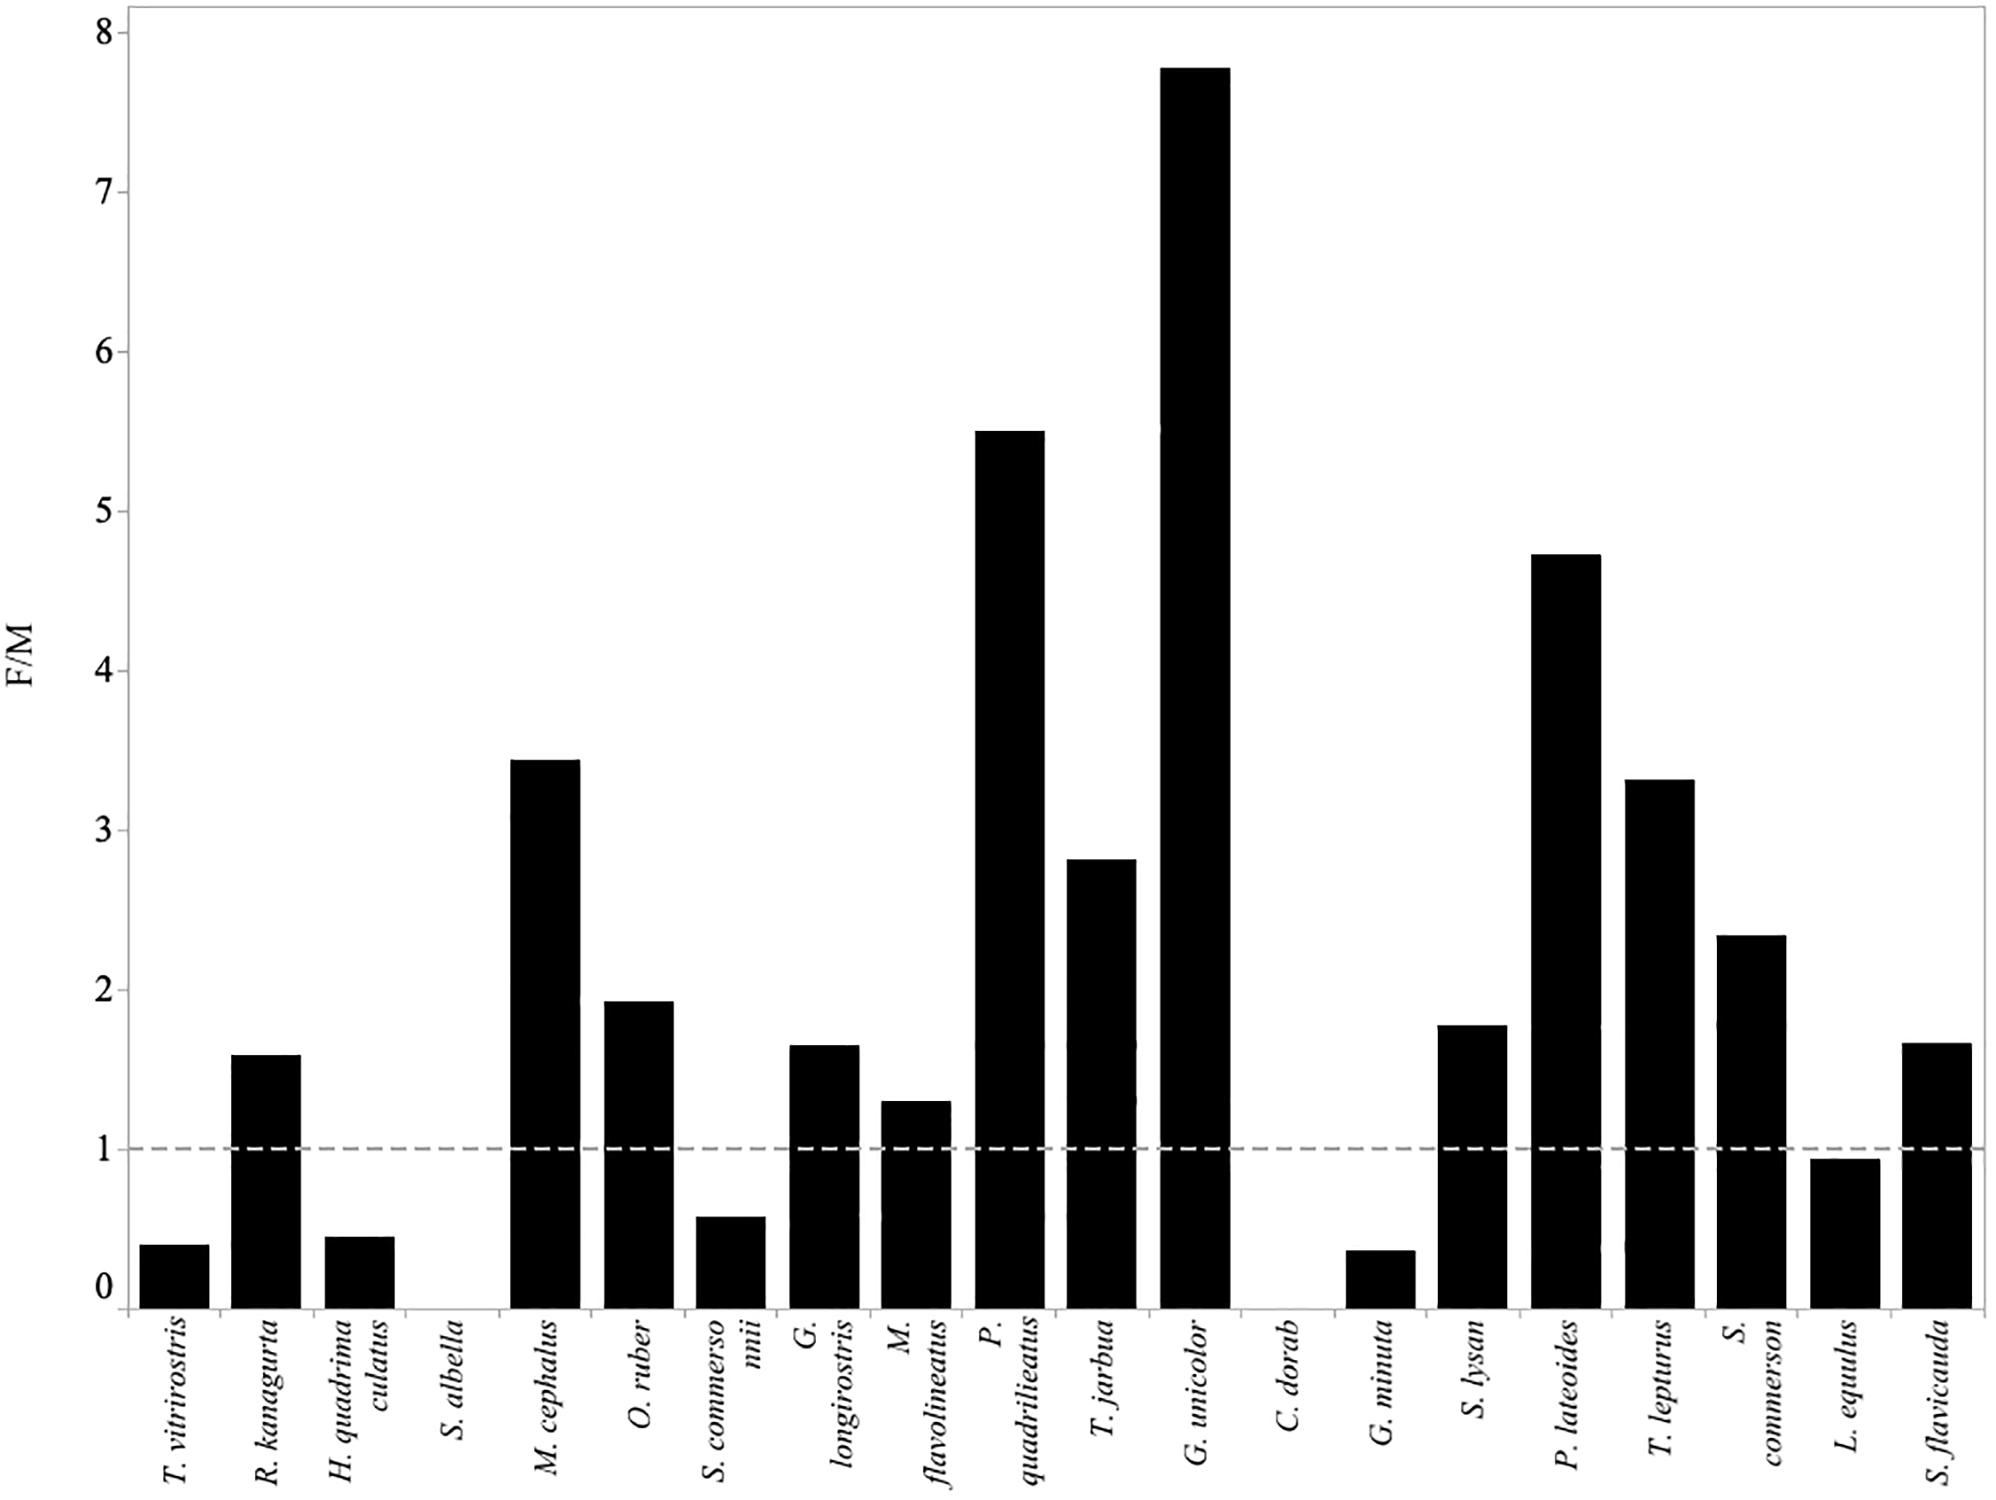
Figure 7. Fishing mortality (F) relative to natural mortality (M) for each of the twenty most abundant species in the small-scale fisheries catches of Menabe. Values above 1 (indicated by the gray dotted line) imply that the species is experiencing overfishing.
Describing the Fishery
Catch rate (CPUE) is a common index of stock status as it is assumed to be directly proportional to fish abundance (Richards and Schnute, 2008). Comparison of the catch rate for the region in the present study (mean 9.6 kg fisher–1 day–1) with those reported from two villages in the region (Betania and Avaradrova) in 1991 (mean 5.9 kg fisher–1 day–1) (Laroche et al., 1997) would suggest that catch rates have increased over time. The catch rates reported here are also higher than reported in other SSF in the north (Doukakis et al., 2009) and south of Madagascar (Davies et al., 2009; Brenier et al., 2011). Catch rates are similar to those observed in Kenya in the 1980’s (Samoilys et al., 2017). These comparisons all suggest that the Menabe fishery is still a productive fishery.
However, these comparisons should be interpreted with caution. The Laroche data is from only two villages close to the regional city and market of Morondava. Proximity to markets has been shown to have an influence on catch rates (Cinner and McClanahan, 2006), potentially making comparisons with the wider region inaccurate. Additionally, inaccuracies in the measure of effort may be masking changes in effective fishing effort (Rijnsdorp et al., 2006). For example, fishers had already reported using longer nets and smaller mesh sizes in the 1990’s (Laroche et al., 1997). However, this information is not available from the paper, and so we were unable to draw strong conclusions about how catch rates might have changed.
Almost 5% of fishing boats surveyed returned empty-handed during the present study. This is likely to be an underestimate as fishers returning empty-handed would be less likely to participate in reporting. We cannot say if this is higher than before, however, social research conducted in the same region at the time of this study provided further evidence that more than 80% of fishers have noticed a decline in their catch rates over time (Dewar, unpublished), This may be a further concern, especially in a region where coastal communities have limited access to other protein sources (Barnes-Mauthe et al., 2013).
The mean trophic level was relatively high in this fishery, ranging across gears between 3.2 and 4.0, when compared to that reported in a reef fishery in Kenya, which ranged between 2.6 and 3.5 (McClanahan and Mangi, 2004). In this study, the higher trophic level was likely due to the abundance of coastal pelagic species in the catch.
The considerable overlap observed in catches across gear types presents some further concern for the sustainability of the fishery. Notably beach seine nets and gill nets exhibited low-selectivity and caught species that were also caught by other gear types (Figure 8). These gears had the highest catch rates and caught fish at a smaller size than other gears. This means that they are likely to catch fish before they are available to other gear types. This is similar to trends observed in Kenyan fisheries (McClanahan and Mangi, 2004; Hicks and McClanahan, 2012).
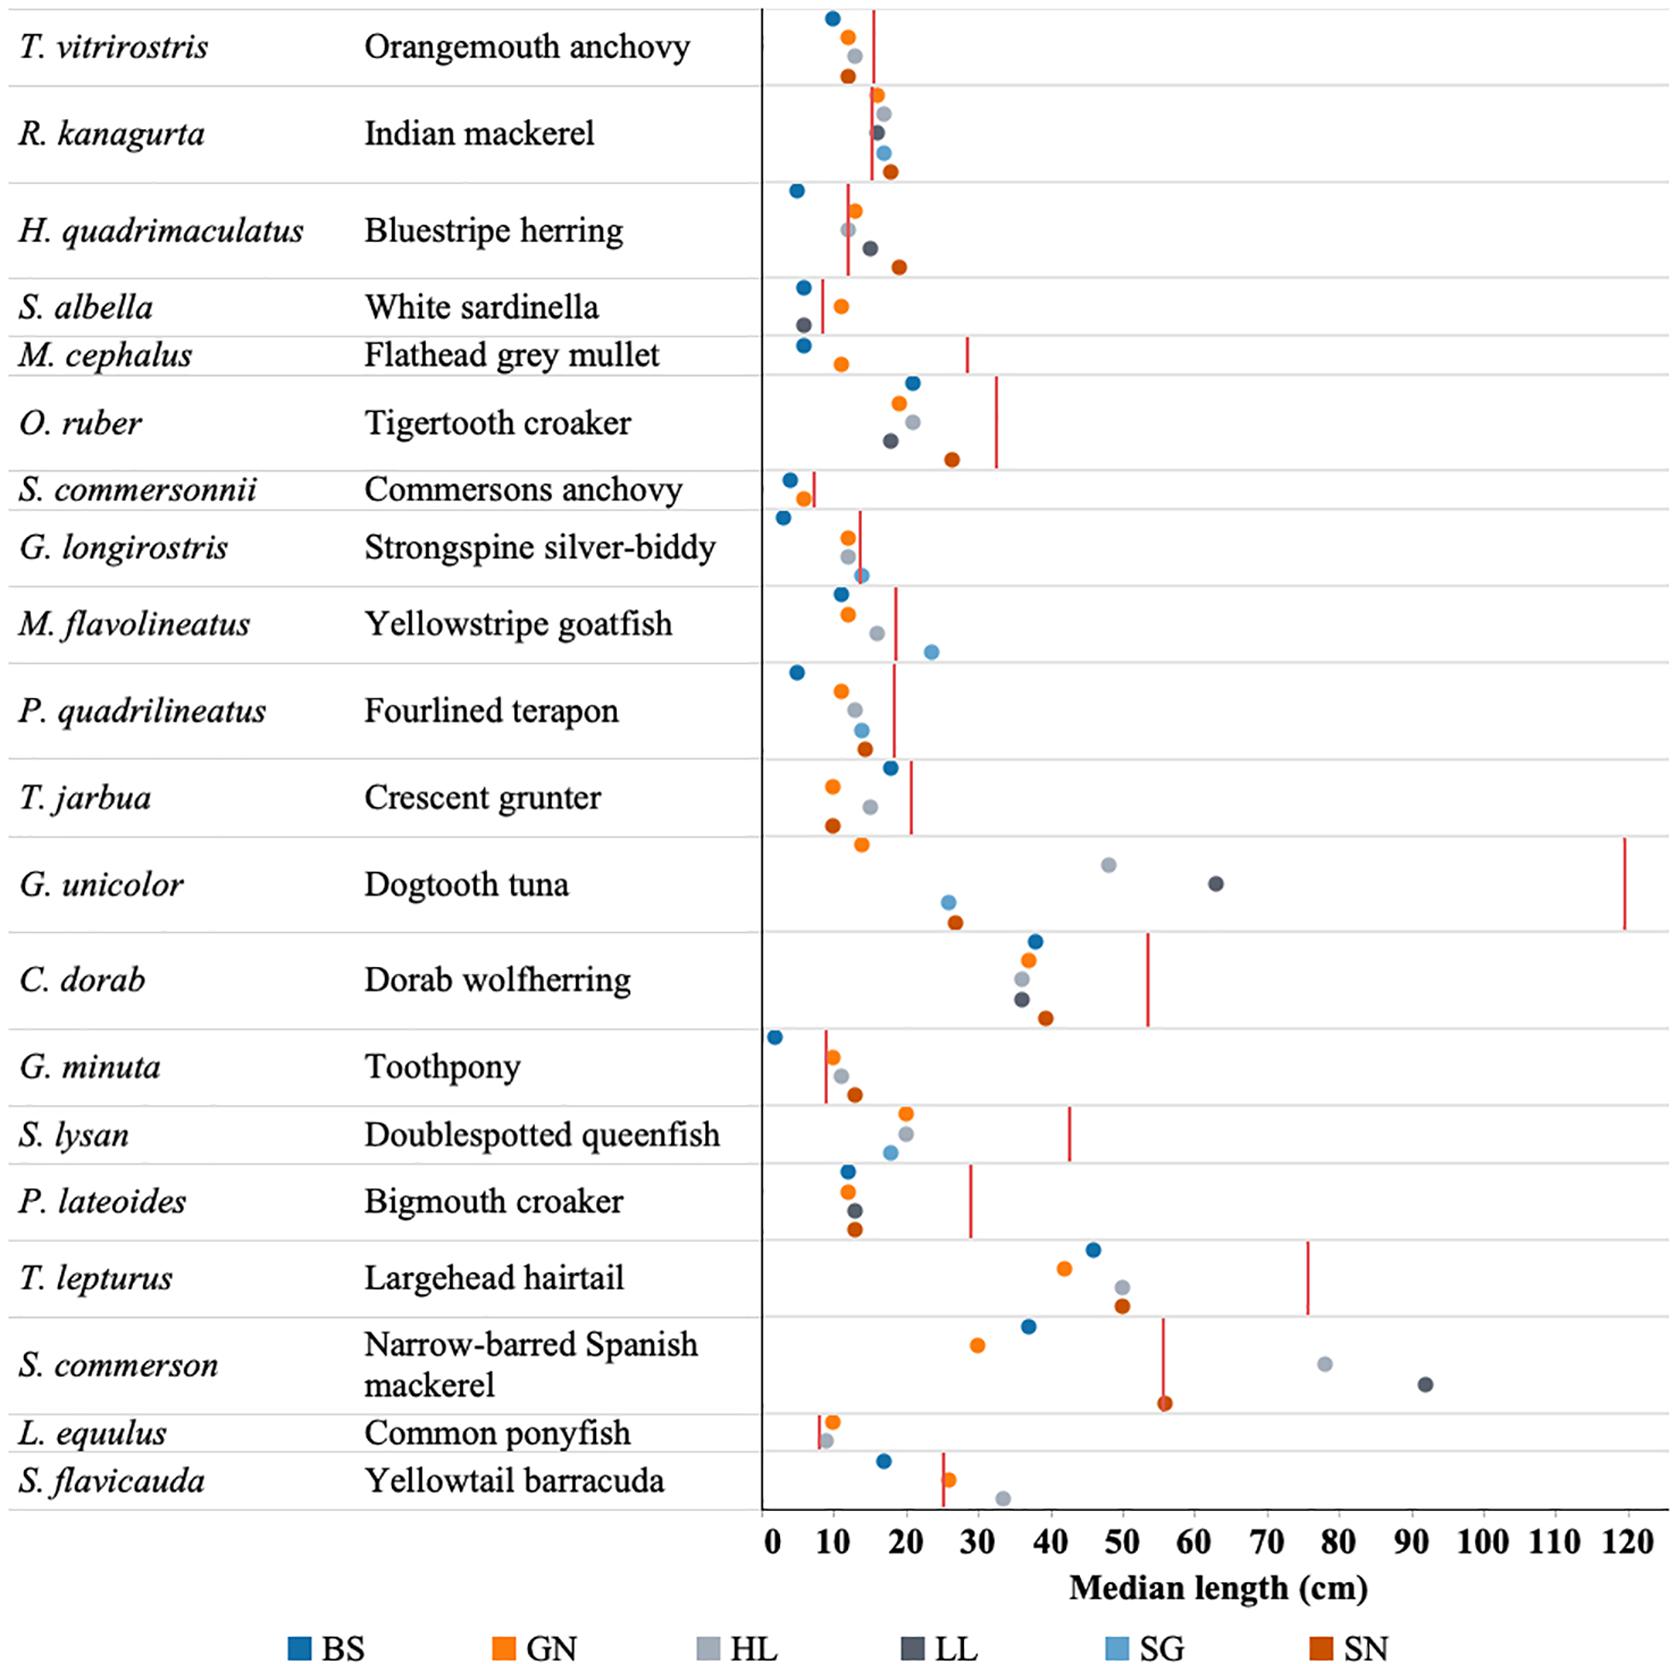
Figure 8. Median length of each of the top 20 fish species caught by each gear type (BS, Beach seine; GN, Gill net; HL, Handline; HS, Hand-spear; LL, Longline; SG, Spear-gun; SN, Shark net) in relation to that species length at maturity (Lmat) denoted by red line.
All these measures provide a useful snapshot of the fishery between 2010 and 2012. However, more recent and continuously updated data are needed to further assess trends in the fishery that might indicate overfishing or provide understanding of the drivers of overfishing.
Limitations of the Study
This study presents data collected more than 7 years ago. While fisheries monitoring has continued in a handful of villages in the region it was discontinued in villages north of Morondava and south of Belo sur Mer when project funding ended in 2012. This means we were unable to conduct temporal analyses across the region. However, these data are therefore the most comprehensive dataset currently available for the whole Menabe region. This study, due to its geographic scope and volume of data, forms an important assessment of the fisheries of Menabe. It provides a useful description of abundance, size structures and biodiversity patterns. Given the paucity of published information on the SSF of Madagascar, this study provides a useful baseline for future assessments and comparison with other studies.
Additionally, with the exception of a handful of community-led and national periodic closures focused on the mangrove mud crab fishery (Gardner et al., 2017), there has been limited changes in the management of SSF in the region since the study was conducted. The authors therefore believe that the results presented in this study continue to be relevant today.
Many methods for evaluating the status of data-deficient fisheries are dependent on assumed values of life-history parameters. Using published data from Fishbase means that the figures used [e.g., for Lmat, Lopt, and natural mortality (M)] may not be wholly accurate for the fish in the study (Patrick et al., 2014). Fish life history strategies have also been shown to be affected by location (Silva et al., 2006), fishing pressure, and fisheries management (Jennings et al., 1999; Miethe et al., 2010; Liang et al., 2014) as well as by a multitude of climate related changes (Rijnsdorp et al., 2009; Crozier and Hutchings, 2014). However, fisheries of Madagascar are highly data deficient. This study presents a pragmatic and cost-effective starting point for assessing these fisheries with respect to length-based indicators.
Froese’s indicators and high proportions of juveniles in the catch should also be interpreted with caution. Results from meta-analysis over multiple fisheries showed stock status over a range of stocks to fall below precautionary limits at 30% or more immature fish in the catch (Vasilakopoulos et al., 2011). While further studies have provided additional target indicators including the consideration of a fishery to be highly at risk when more than 50% of the fish in the catch are immature (Froese et al., 2016). If we use these perhaps more conservative targets, seven of the 20 most common species would be considered to be highly at risk of overfishing (Figure 6A).
Finally, nearshore habitats such as seagrass beds, sandy lagoons and mangrove channels, are known to be nursery areas for many fish species (Nagelkerken et al., 2002; Lefcheck et al., 2019). This may result in high numbers of juvenile fish, and low numbers of large mega-spawners in the catch as a reflection of their abundance in the habitat, rather than being reflective of the population overall. Additionally, the large number of small mesh sizes being used in the fishery may mean that larger bodied individuals are not caught, thereby causing some additional bias in the data. It should be noted, however, that fishers in this study were fishing across a selection of fishing sites both nearshore ( < 1km) and offshore (>5 km from the village). They also fished across seagrass, lagoon and reef habitats, and catches should reflect this variation. During interviews conducted by Dewar (unpublished), fishers reported a reduction in the size of fish over time. This also suggests that adult fish were previously caught by these fisheries, further supporting the theory that their absence in catches reflects their absence in the population. However, we cannot draw this conclusion without further time series data.
While not commonly used for fisheries assessment, due to availability of other data, the methods employed in the current study have been used in the assessment of other SSF. The most similar assessments were conducted in the SSF of Glovers reef in Belize (Babcock et al., 2013, 2018), and on the Pacific coast of Columbia (Herrón et al., 2018). It has also been used in assessment of swordfish and bluefin tuna stocks (Hanke, 2017). The results of fisheries assessments like our own indicated that some species were experiencing overfishing and would likely benefit from further management, including size limits or gear restrictions, while others targeted by the same fishery were not experiencing overfishing. In these fisheries, they also concluded that estimates of overfishing would be improved through the collection of additional data to inform more precise and locally relevant life history values rather than rely on values generated by Fishbase.
Implications of Overfishing
Marine ecosystems are complex and changes in single components of systems are likely to have consequences elsewhere in the same systems (Hutchings, 2000; Jackson et al., 2001; Scheffer et al., 2005). One of the biggest concerns is that intensive fishing leads to imbalances in ecosystem function which has ramifications for community structure overall (Jennings and Kaiser, 1998; Jennings et al., 1999). Both top down and bottom up processes are important in governing food webs and ecosystem function, whether that is the presence of predators or the availability of food, and it is believed that the indirect effects of fishing can be even more consequential for marine ecosystem function, structure and dynamics than simply the removal of the target organism (Botsford et al., 1997). In fisheries such as this where multiple species are being targeted by a number of different gear types, these interactions become increasingly more complex (Jennings et al., 1999; Jennings, 2005).
Overfishing does not only affect fish populations, food webs and ecosystems but it also affects the people who rely on fishing for food, income and cultural identity (Cinner et al., 2012; Daw et al., 2012; McClanahan et al., 2015; Purcell and Pomeroy, 2015; Purcell et al., 2016). Fishers in Madagascar, like in many other SSF around the world, are reported to be some of the most vulnerable in society (Béné, 2003; Barnes-Mauthe et al., 2013). Trapped in poverty cycles, fishers and their families are reliant on declining resources, and if they are unable to adapt to the shifting environment (whether brought about by climate change or overfishing) they will surely continue to get poorer (Cinner et al., 2008).
Drivers of Overfishing
With this study, we have provided evidence of overfishing in the Menabe region of Madagascar. Yet, the assessments used in this study are limited in helping us to understand the wider causes of overfishing. We were not able to attribute these results entirely to the small-scale sector, although it is probable that it makes a strong contribution.
Fishing for subsistence and local trade has occurred for centuries in Madagascar (Astuti, 1995), yet it is in the last few decades that commercial export companies serving international fisheries markets have increased trade in Madagascar, accessing more and more remote locations, and enabling fishers to sell their catches in exchange for money (Le Manach et al., 2012). In many remote coastal communities in Madagascar there is limited access to other income generating activities resulting in a high reliance on fishing. Coastal populations are growing quickly, both through high birth rates, due to lack of access to health and family planning services (Harris et al., 2012), and migration toward the coast as inland communities seek to make a living when crops fail (Cripps and Gardner, 2016). This transition from a subsistence to a commercial fishery coupled with growing coastal populations reliant on fishing has likely driven a “race to fish” which is contributing to the overfishing that we observe in this study.
In addition to increased access to markets, small-scale fishers have co-existed with industrial fisheries in Madagascar since the late 1960s when shrimp trawl fisheries were introduced (Le Manach et al., 2011). Where large-scale and small-scale fisheries sectors co-exist they often target the same species and compete in the same markets. Efforts to minimize interactions and resulting conflicts have led many nations to prohibit the large-scale fishing sector from operating within certain inshore areas reserved mainly for SSF. However, in Madagascar, a law that reserved a 2 nautical mile zone exclusively for the use of traditional fishers was rescinded in 1971. This followed a study that estimated that 85% of Madagascar’s commercially exploitable shrimp stock (Penaeus sp.) was located within the near-shore zone (Gillett, 2008). Industrial trawlers use fine-mesh (12–15 mm) nets, pulled behind the vessel to capture their target shrimp species. The dragging action of the net along with its small mesh size results in the destruction of habitat, as well as large amounts of bycatch and subsequently high discard rates (Razafindrainibe, 2010).
In an open access fishery such as Madagascar, it is likely that the commercialization of SSF, expanding reach of markets and access to new fishing technologies, coupled with growing coastal populations and the overlapping industrial fisheries, are all contributing to the serial depletion of nearshore fisheries resources and the current status of the small-scale fishery in the study region.
Management and Further Actions
Management is urgently needed if the fisheries resources of the country are to continue to feed local communities and support both the local and national economy in the future.
Local mesh size regulations could be an effective local management measure, but the implications would need to be carefully considered before implementation. The results presented by this study can be useful to communities making decisions around gear and size restrictions within their local fisheries. The results suggest that both gill nets and beach seines being used in the region are currently targeting fish before they can reproduce and before they are available for capture by other fishing gears. These results suggest that increasing the mesh sizes of gill nets would be a suitable management strategy. There are a number of such local management efforts across Madagascar and the wider Western Indian Ocean (Rocliffe et al., 2014), and other small-scale fishing communities have been able to phase out the use of less selective fishing gears (such as beach seines) through local regulations (Andriamalala and Gardner, 2010; McClanahan et al., 2014). However, there would likely be some considerable socio-economic repercussions of excluding these gears in this region, such as their seasonal use for targeting small bodied species, and the use of small mesh nets by women who have limited access to other gear types, which would need full consideration.
We need better knowledge of local fish recruitment and spawning, and local communities could be involved in collecting this information.
One of the limitations of the current study is its reliance on published length-at-maturity data rather than local data (Froese and Pauly, 2000). However, although imperfect this should not stand in the way of fishing communities putting in place local management measures that aim to allow fish to spawn at least once before they are caught.
Further methods that build on this study can be employed by local communities to improve knowledge of local fish recruitment and spawning (Prince et al., 2015; Prince, 2018) and be integrated into management measures. These straightforward methods based on spawning-potential-ratios have been shown to maintain reproductive capacity and produce useful data on sustainable yields, particularly in data poor fisheries, while also being accessible and engaging to local fishers (Prince and Hordyk, 2019).
While management is needed, accessible methods such as those presented above that enable community engagement in monitoring and local management decisions are necessary to ensure its sustainability. Yet, it should be noted that local management alone will do little to address the overall fish declines if considered and implemented in isolation. Understanding the impacts of other overlapping fisheries, notably for Menabe the bycatch and discard rates of the industrial trawl fishery, and integrating them into fisheries management would ensure that these important nearshore fisheries continue to support the local and national economy, contribute to food security, and underpin traditional cultures and traditions.
Data Availability Statement
The datasets generated for this study are available on request to the corresponding author.
Ethics Statement
Data used in this study were collected by Blue Ventures which has an accord de siege with the Madagascar Government. Data were collected as part of an ongoing project to assess small-scale fisheries in the region of Menabe with a view to improving their management. All fish were sampled as part of the legal fishery with permission granted from each fisher. No animals were harmed for the purposes of this study (normal daily catches of a working fishery were observed), and participant’s names were not recorded. We obtained verbal consent from participants before conducting landings surveys due to low literacy levels in the region. During verbal consent, participants were informed about the survey, its purpose, and how the data would be used. Ethical approval for this research has been given by the Ethics committee at the University of Exeter.
Author Contributions
CG, KD, and EZ contributed to the conception and design of the study, as well as data collection. CG conducted analyses and CG, AB, and BG developed the first drafts of the manuscript and all authors contributed to further manuscript revisions and read and approved the final version.
Funding
This study was funded by Blue Ventures Conservation with additional support from Louvain Development and the European Union’s Regional Coastal Management Programme of the Indian Ocean Countries (ReCoMaP/127769/M/ACT/RSA/005).
Conflict of Interest
The authors declare that the research was conducted in the absence of any commercial or financial relationships that could be construed as a potential conflict of interest.
Acknowledgments
We would like to especially thank all the community-based fisheries surveyors involved in this research, a particular mention to Brian Jones, Thomas Beriziny, Breton (Toto) Vernes and Eloi Gustave who supported the author in training surveyors, collecting and entering data and helping with translations. Our greatest thanks go to all the fishers who kindly allowed us to sample their catches during the study.
Supplementary Material
The Supplementary Material for this article can be found online at: https://www.frontiersin.org/articles/10.3389/fmars.2020.00317/full#supplementary-material
References
Andriamalala, G., and Gardner, C. J. (2010). L’utilisation du dina comme outil de gouvernance des ressources naturelles: leçons tirés de Velondriake, sud-ouest de Madagascar. Trop. Conserv. Sci. 3, 447–472. doi: 10.1177/194008291000300409
Astuti, R. (1991). Learning to be Vezo. The Construction of the Person among Fishing People of Western Madagascar. 1991. London: University of London.
Astuti, R. (1995). The Vezo are not a kind of people”. Identity, difference and “ethnicity” among a fishing people of western Madagascar. Am. Ethnol. 22, 464–482. doi: 10.1525/ae.1995.22.3.02a00010
Ault, J. S., Smith, S. G., and Bohnsack, J. A. (2005). Evaluation of average length as an estimator of exploitation status for the Florida coral-reef fish community. ICES J. Mar. Sci. 62, 417–423. doi: 10.1016/j.icesjms.2004.12.001
Ault, J. S., Smith, S. G., Luo, J., Monaco, M. E., and Appeldoorn, R. S. (2008). Length-based assessment of sustainability benchmarks for coral reef fishes in Puerto Rico. Environ. Conserv. 35, 221–231. doi: 10.1017/S0376892908005043
Babcock, E. A., Coleman, R., Karnauskas, M., and Gibson, J. (2013). Length-based indicators of fishery and ecosystem status: Glover’s reef marine reserve. Belize. Fish. Res. 147, 434–445. doi: 10.1016/j.fishres.2013.03.011
Babcock, E. A., Tewfik, A., and Burns-Perez, V. (2018). Fish community and single-species indicators provide evidence of unsustainable practices in a multi-gear reef fishery. Fish. Res. 208, 70–85. doi: 10.1016/J.FISHRES.2018.07.003
Barnes-Mauthe, M., Oleson, K. L. L., and Zafindrasilivonona, B. (2013). The total economic value of small-scale fisheries with a characterization of post-landing trends: an application in Madagascar with global relevance. Fish. Res. 147, 175–185. doi: 10.1016/j.fishres.2013.05.011
Béné, C. (2003). When fishery rhymes with poverty: a first step beyond the old paradigm on poverty. World Dev. 31, 949–975. doi: 10.1016/S0305-750X(03)00045-7
Béné, C. (2006). Small-Scale Fisheries: Assessing Their Contribution to Rural Livelihoods in Developing Countries. FAO Fish. Circ. No. 1008 (Rome.: Food and Agriculture Organization), 57.
Beverton, R., and Holt, S. (1957). On the Dynamics of Exploited Fish Populations. London: Chapman & Hall.
Botsford, L. W., Castilla, J. C., and Peterson, C. H. (1997). The management of fisheries and marine ecosystems. Science 277, 509–515. doi: 10.1126/SCIENCE.277.5325.509
Brenier, A., Ferraris, J., and Mahafina, J. (2011). Participatory assessment of the Toliara Bay reef fishery, southwest Madagascar. Madagascar Conserv. Dev. 6, 60–67. doi: 10.1579/0044
Cheung, W. W. L., Pitcher, T. J., and Pauly, D. (2005). A fuzzy logic expert system to estimate intrinsic extinction vulnerabilities of marine fishes to fishing. Biol. Conserv. 124, 97–111. doi: 10.1016/j.biocon.2005.01.017
Chuenpagdee, R., Liguori, L., Palomares, M. L. D., and Pauly, D. (2006). Bottom-up, global estimates of small-scale marine fisheries catches. Fish. Cent. Res. Rep. 14:105. doi: 10.14288/1.0074761
Cinner, J. E., Daw, T., and Mcclanahan, T. R. (2008). Socioeconomic factors that affect artisanal fishers’ readiness to exit a declining fishery. Conserv. Biol. 23, 124–130. doi: 10.1111/j.1523-1739.2008.01041.x
Cinner, J. E., and McClanahan, T. R. (2006). Socioeconomic factors that lead to overfishing in small-scale coral reef fisheries of Papua New Guinea. Environ. Conserv. 33, 73–80. doi: 10.1017/S0376892906002748
Cinner, J. E., McClanahan, T. R., Graham, N. A. J., Daw, T. M., Maina, J., Stead, S. M., et al. (2012). Vulnerability of coastal communities to key impacts of climate change on coral reef fisheries. Glob. Environ. Chang. 22, 12–20. doi: 10.1016/j.gloenvcha.2011.09.018
Cope, J. M., and Punt, A. E. (2009). Length-based reference points for data-limited situations: applications and restrictions. Mar. Coast. Fish. Dyn. Manag. Ecosyst. Sci. 1, 169–186. doi: 10.1577/C08-025.1
Costello, C., Ovando, D., Hilborn, R., Gaines, S. D., Deschenes, O., Lester, S. E., et al. (2012). Can catch shares prevent fisheries collapse? Science 338, 517–520. doi: 10.1126/science.1159478
Cripps, G., and Gardner, C. J. (2016). Human migration and marine protected areas: insights from Vezo fishers in Madagascar. Geoforum 74, 49–62. doi: 10.1016/j.geoforum.2016.05.010
Crozier, L. G., and Hutchings, J. A. (2014). Plastic and evolutionary responses to climate change in fish. Evol. Appl. 7, 68–87. doi: 10.1111/eva.12135
Davies, T. E., Beanjara, N., and Tregenza, T. (2009). A socio-economic perspective on gear-based management in an artisanal fishery in south-west Madagascar. Fish. Manag. Ecol. 16, 279–289. doi: 10.1111/j.1365-2400.2009.00665.x
Daw, T. M., Cinner, J. E., McClanahan, T. R., Brown, K., Stead, S. M., Graham, N. A. J., et al. (2012). To fish or not to fish: factors at multiple scales affecting artisanal fishers’ readiness to exit a declining fishery. PLoS One 7:e31460. doi: 10.1371/journal.pone.0172075
Doukakis, P., Jonahson, M., Ramahery, V., de Dieu Randriamanantsoa, B., and Harding, S. (2009). Traditional fisheries of antongil bay, Madagascar. West. Indian Ocean J. Mar. Sci. 6, 175–181. doi: 10.4314/wiojms.v6i2.48237
Ehrhardt, N. M., and Ault, J. S. (1992). Analysis of two length-based mortality models applied to bounded catch length frequencies. Trans. Am. Fish. Soc. 121, 115–122. doi: 10.1577/1548-86591992121<0115:aotlmm<2.3.co;2
FAO (2017). “Workshop on improving our knowledge on small-scale fisheries: data needs and methodologies,” in Workshop proceedings, 27–29 June 2017. Available online at: http://www.fao.org/3/a-i8134e.pdf (accessed September 17, 2018)Google Scholar
FAO (2018). The State of World Fisheries and Aquaculture 2018 – Meeting the sustainable development goals. Available online at: www.fao.org/publications (accessed August 6, 2018)Google Scholar
Froese, R., and Pauly, D. (2000). FishBase 2000: Concepts, Designs and Data Source. Los Banos, CA: ICLARM.
Froese, R., Winker, H., Gascuel, D., Sumaila, R., Pauly, D., Geomar, R. F., et al. (2016). Minimizing the impact of fishing. Fish Fish. 17, 785–802. doi: 10.1111/faf.12146
Gardner, C. J., Rocliffe, S., Gough, C., Levrel, A., Singleton, R. L., Vincke, X., et al. (2017). “Value chain challenges in two community-managed fisheries in western Madagascar: Insights for the small-scale fisheries guidelines,” in The Small-Scale Fisheries Guidelines, eds S. Jentoft, R. Chuenpagdee, M. Barragán-Paladines, and N. Franz (Cham: Springer).
Gobert, B. (1994). Size structures of demersal catches in a multispecies multigear tropical fishery. Fish. Res. 19, 87–104. doi: 10.1016/0165-7836(94)90016-7
Goedefroit, S. (1998). A l’ouest de Madagascar: Les Sakalava du Menabe. Available online at: https://books.google.co.uk/books?id=UIFbMW-dph8C&pg=PA364&lpg=PA364&dq=Asara+asotry+faosa&source=bl&ots=gd-UE-L-th&sig=-jmhuv-Q2gAoOixM2RlFtyIH7fA&hl=en&sa=X&ved=2ahUKEwjv4L6f3cncAhURM8AKHZYfDUIQ6AEwCXoECAMQAQ#v=onepage&q=Asara asotry faosa&f=false (accessed July 31, 2018).
Gough, C., Thomas, T., Humber, F., Harris, A., Cripps, G., and Peabody, S. (2009). Vezo Fishing: An Introduction to the Methods Used by Fishers in Andavadoaka Southwest Madagascar. London: Blue Ventures Conservation Report.
Grafeld, S., Oleson, K. L. L., Teneva, L., and Kittinger, J. N. (2017). Follow that fish: uncovering the hidden blue economy in coral reef fisheries. PLoS One 12:e0182104. doi: 10.1371/journal.pone.0182104
Grenier, C. (2013). Genre de vie vezo, pêche «traditionnelle» et mondialisation sur le littoral sud-ouest de Madagascar. Ann. Georgr. 123, 549–571. doi: 10.3917/ag.693.0549
Hanke, A. (2017). Length based indicators of Atlantic Swordfish and Bluefin Tuna stock status. Available online at: http://iccat.int/en/accesingdb.html (accessed March 7, 2020)Google Scholar
Harris, A., Mohan, V., Flanagan, M., and Hill, R. (2012). Integrating family planning service provision into community-based marine conservation. Oryx 46, 179–186. doi: 10.1017/S0030605311000925
Herrón, P., Mildenberger, T. K., Díaz, J. M., and Wolff, M. (2018). Assessment of the stock status of small-scale and multi-gear fisheries resources in the tropical Eastern Pacific region. Reg. Stud. Mar. Sci. 24, 311–323. doi: 10.1016/j.rsma.2018.09.008
Hicks, C. C., and McClanahan, T. R. (2012). Assessing gear modifications needed to optimize yields in a heavily exploited, multi-species, seagrass and coral reef fishery. PLoS One 7:e36022. doi: 10.1371/journal.pone.0036022
Humber, F., Andriamahaino, E. T., Beriziny, T., Botosoamananto, R., Godley, B. J., Gough, C., et al. (2017). Assessing the small-scale shark fishery of Madagascar through community-based monitoring and knowledge. Fish. Res. 186, 131–143. doi: 10.1016/J.FISHRES.2016.08.012
Humber, F., Godley, B. J., Ramahery, V., and Broderick, A. C. (2011). Using community members to assess artisanal fisheries: the marine turtle fishery in Madagascar. Anim. Conserv. 14, 175–185. doi: 10.1111/j.1469-1795.2010.00413.x
Hutchings, J. A. (2000). Collapse and recovery of marine fishes. Nature 406, 882–885. doi: 10.1038/35022565
Iida, T. (2005). The past and present of the coral reef fishing economy in madagascar: implications for self determination in resource use. Senri Ethnol. Stud. 67, 237–258. doi: 10.11560/jahp.18.2_16
International Monetary Fund (2015). World Economic Outlook Database: April 2015 Edition - GDP per Capita EU. Available online at: https://www.imf.org/external/datamapper/PPPPC@WEO/OEMDC/ADVEC/WEOWORLD (accessed September 17, 2018)Google Scholar
Jackson, J. B. C., Kirby, M. X., Berger, W. H., Bjorndal, K. A., Botsford, L. W., Bourque, B. J., et al. (2001). Historical overfishing and the recent collapse of coastal ecosystems. Science 293, 629–637. doi: 10.1126/science.1059199
Jacquet, J., Fox, H., Motta, H., Ngusaru, A., Zeller, D., and Zeller, D. (2010). Few data but many fish: marine small-scale fisheries catches for Mozambique and Tanzania. African J. Mar. Sci. 32, 197–206. doi: 10.2989/1814232X.2010.501559
Jacquet, J., and Pauly, D. (2008). Funding priorities: big barriers to small-scale fisheries. Conserv. Biol. 22, 832–835. doi: 10.1111/j.1523-1739.2008.00978.x
Jennings, S. (2005). Indicators to support an ecosystem approach to fisheries. Fish Fish. 6, 212–232. doi: 10.1111/j.1467-2979.2005.00189.x
Jennings, S., Greenstreet, S. P. R., and Reynolds, J. D. (1999). Structural change in an exploited fish community: a consequence of differential fishing effects on species with contrasting life histories. J. Anim. Ecol. 68, 617–627. doi: 10.1046/j.1365-2656.1999.00312.x
Jennings, S., and Kaiser, M. J. (1998). The effects of fishing on marine ecosystems. Adv. Mar. Biol. 34, 201–352. doi: 10.1016/S0065-2881(08)60212-6
Jones, B. (2011). Socio-Economic Monitoring: A Baseline Assessment of the Fishing Villages of the Kirindy-Mite MPA. Available online at: https://blueventures.org/wp-content/uploads/2016/05/KMT_Baseline_socio-eco_assessment.pdf (accessed September 18, 2018).
Laroche, J., Razanoelisoa, J., Fauroux, E., and Rabenevanana, M. W. (1997). The reef fisheries surrounding the south-west coastal cities of Madagascar. Fish. Manag. Ecol. 4, 285–299. doi: 10.1046/j.1365-2400.1997.00051.x
Le Manach, F., Gough, C., Harris, A., Humber, F., Harper, S., and Zeller, D. (2012). Unreported fishing, hungry people and political turmoil: the recipe for a food security crisis in Madagascar? Mar. Policy 36, 218–225. doi: 10.1016/J.MARPOL.2011.05.007
Le Manach, F., Gough, C., Humber, F., Harper, S., and Zeller, D. (2011). Reconstruction of total marine fisheries catches for madagascar (1950-2008). Fish. Cent. Res. Rep. 19, 21–37. doi: 10.1017/CBO9781107415324.004
Lefcheck, J. S., Hughes, B. B., Johnson, A. J., Pfirrmann, B. W., Rasher, D. B., Smyth, A. R., et al. (2019). Are coastal habitats important nurseries? A meta−analysis. Conserv. Lett. 12:e12645. doi: 10.1111/conl.12645
Lemahieu, A., Scott, L., Malherbe, W. S., Mahatante, P. T., Randrianarimanana, J. V., and Aswani, S. (2018). Local perceptions of environmental changes in fishing communities of southwest Madagascar. Ocean Coast. Manag. 163, 209–221. doi: 10.1016/J.OCECOAMAN.2018.06.012
Liang, Z., Sun, P., Yan, W., Huang, L., and Tang, Y. (2014). Significant effects of fishing gear selectivity on fish life history. J. Ocean Univ. China 13, 467–471. doi: 10.1007/s11802-014-2167-7
Martins, I. M., Medeiros, R. P., Di Domenico, M., and Hanazaki, N. (2018). What fishers’ local ecological knowledge can reveal about the changes in exploited fish catches. Fish. Res. 198, 109–116. doi: 10.1016/J.FISHRES.2017.10.008
McClanahan, T., Allison, E. H., and Cinner, J. E. (2015). Managing fisheries for human and food security. Fish Fish. 16, 78–103. doi: 10.1111/faf.12045
McClanahan, T. R., Cinner, J. E., Abunge, C., Rabearisoa, A., Mahatante, P., Ramahatratra, F., et al. (2014). Perceived benefits of fisheries management restrictions in Madagascar. Ecol. Soc. 19:5. doi: 10.5751/ES-06080-190105
McClanahan, T. R., and Mangi, S. C. (2004). Gear-based management of a tropical artisanal fishery based on species selectivity and capture size. Fish. Manag. Ecol. 11, 51–60. doi: 10.1111/j.1365-2400.2004.00358.x
Miethe, T., Dytham, C., Dieckmann, U., and Pitchford, J. W. (2010). Marine reserves and the evolutionary effects of fishing on size at maturation. ICES J. Mar. Sci. 67, 412–425. doi: 10.1093/icesjms/fsp248
Myers, R. A., and Mertz, G. (1998). The limits of exploitation: a precautionary approach. Ecol. Appl. 8, S165–S169.
Nagelkerken, I., Roberts, C., van der Velde, G., Dorenbosch, M., van Riel, M., de la Morinière, E. C., et al. (2002). How important are mangroves and seagrass beds for coral-reef fish? The nursery hypothesis tested on an island scale. Mar. Ecol. Prog. Ser. 244, 299–305. doi: 10.3354/meps244299
Nelson, G. A. (2019). fishmethods: Fishery Science Methods and Models. Available online at: https://cran.r-project.org/package=fishmethods (accessed February 2, 2020).
Patrick, W. S., Cope, J. M., and Thorson, J. T. (2014). Validación y mejoramiento de datos de historia de vida en FishBase. Fisheries 39, 173–176. doi: 10.1080/03632415.2014.891504
Pauly, D., Palomares, M. L., Froese, R., Sa-a, P., Vakily, M., Preikshot, D., et al. (2001). Fishing down Canadian aquatic food webs. Can. J. Fish. Aquat. Sci. 58, 51–62. doi: 10.1139/cjfas-58-1-51
Pilling, D. (2018). Madagascar Caught in Spiral of Decline After Decades of Neglect | Financial Times. Financ. Times. Available online at: https://www.ft.com/content/815b9c9a-6af1-11e8-b6eb-4acfcfb08c11 (accessed September 17, 2018)Google Scholar
Prince, J., and Hordyk, A. (2019). What to do when you have almost nothing: a simple quantitative prescription for managing extremely data-poor fisheries. Fish Fish. 20, 224–238. doi: 10.1111/faf.12335
Prince, J., Victor, S., Kloulchad, V., and Hordyk, A. (2015). Length based SPR assessment of eleven Indo-Pacific coral reef fish populations in Palau. Fish. Res. 171, 42–58.
Prince, J. D. (2018). Communicating for change informing community-based fisheries management with spawning potential surveys. SPC Fish. Newsl. 154, 43–52.
Purcell, S. W., Ngaluafe, P., Foale, S. J., Cocks, N., Cullis, B. R., and Lalavanua, W. (2016). Multiple factors affect socioeconomics and wellbeing of Artisanal Sea cucumber fishers. PLoS One 11:165633. doi: 10.1371/journal.pone.0165633
Purcell, S. W., and Pomeroy, R. S. (2015). Driving small-scale fisheries in developing countries. Front. Mar. Sci. 2:44. doi: 10.3389/fmars.2015.00044
Razafindrainibe, H. (2010). Baseline Study of the Shrimp Trawl Fishery in Madagascar and Strategies for Bycatch Management: Final Report. 1–103. Available online at: http://www.fao.org/fishery/docs/DOCUMENT/rebyc/rebyc2/madagascar/report.pdf (accessed August 17, 2018).
Razafindrakoto, M., Roubaud, F., and Wachsberger, J.-M. (2018). The Puzzle of Madagascar’s Economic Collapse Through the Lens of Social Sciences. Dialogue, La Lett. d’information DIAL 51. Available online at: https://hal.archives-ouvertes.fr/hal-01921824 (accessed March 27, 2019).
Richards, L. J., and Schnute, J. T. (2008). An experimental and statistical approach to the question: is cpue an index of abundance? Can. J. Fish. Aquat. Sci. 43, 1214–1227. doi: 10.1139/f86-151
Rijnsdorp, A. D., Daan, N., and Dekker, W. (2006). Partial fishing mortality per fishing trip: a useful indicator of effective fishing effort in mixed demersal fisheries. ICES J. Mar. Sci. 63, 556–566. doi: 10.1016/j.icesjms.2005.10.003
Rijnsdorp, A. D., Peck, M. A., Engelhard, G. H., Mollmann, C., and Pinnegar, J. K. (2009). Resolving the effect of climate change on fish populations. ICES J. Mar. Sci. 66, 1570–1583. doi: 10.1093/icesjms/fsp056
Rocliffe, S., Peabody, S., Samoilys, M., and Hawkins, J. P. (2014). Towards a network of locally managed marine areas (LMMAs) in the Western Indian Ocean. PLoS One 9:e103000. doi: 10.1371/journal.pone.0103000
Samoilys, M. A., Osuka, K., Maina, G. W., and Obura, D. O. (2017). Artisanal fisheries on Kenya’s coral reefs: decadal trends reveal management needs. Fish. Res. 186, 177–191. doi: 10.1016/j.fishres.2016.07.025
Sanders, E. F. (2005). Fombandrazana Vezo: Ethnic Identity and Subsistence Strategies Among Coastal Fishers of Western Madagascar. Available online at: https://getd.libs.uga.edu/pdfs/sanders_earl_f_200508_phd.pdf (accessed September 18, 2018).
Scheffer, M., Carpenter, S., and de Young, B. (2005). Cascading effects of overfishing marine systems. Trends Ecol. Evol. 20, 579–581. doi: 10.1016/j.tree.2005.08.018
Silva, A., Santos, M. B., Caneco, B., Pestana, G., Porteiro, C., Carrera, P., et al. (2006). Temporal and geographic variability of sardine maturity at length in the northeastern Atlantic and the western Mediterranean. ICES J. Mar. Sci. 63, 663–676. doi: 10.1016/j.icesjms.2006.01.005
The World Bank (2017). World Bank National Accounts Data, and OECD National Accounts data files. Available online at: https://data.worldbank.org/indicator/NY.GNP.PCAP.CD?locations=MG&page=1 (accessed September 18, 2018).
Tilley, A., Herrón, P., Espinosa, S., Angarita, J. L., and Box, S. (2018). Predicting vulnerability to management changes in data-limited, small-scale fisheries. Mar. Policy 94, 39–45. doi: 10.1016/j.marpol.2018.04.013
USAID (2016). Fishing for Food Security: Importance of Wild Fisheries for Food Security and Nutrition. Washington, DC: USAID.
Vasilakopoulos, P., O’Neill, F. G., and Marshall, C. T. (2011). Misspent youth: does catching immature fish affect fisheries sustainability? ICES J. Mar. Sci. 68, 1525–1534. doi: 10.1093/icesjms/fsr075
World Bank (2012). Hidden Harvest: The Global Contribution of Capture Fisheries. Available online at: http://documents.worldbank.org/curated/en/515701468152718292/Hidden-harvest-the-global-contribution-of-capture-fisheries
Keywords: small-scale fisheries, Madagascar, length-based, maturity, overfishing, management
Citation: Gough CLA, Dewar KM, Godley BJ, Zafindranosy E and Broderick AC (2020) Evidence of Overfishing in Small-Scale Fisheries in Madagascar. Front. Mar. Sci. 7:317. doi: 10.3389/fmars.2020.00317
Received: 06 November 2019; Accepted: 17 April 2020;
Published: 04 June 2020.
Edited by:
Annette Breckwoldt, Leibniz Centre for Tropical Marine Research (LG), GermanyReviewed by:
Matthias Wolff, Leibniz Centre for Tropical Marine Research (LG), GermanyCamilla Novaglio, CSIRO Oceans and Atmosphere (O&A), Australia
Copyright © 2020 Gough, Dewar, Godley, Zafindranosy and Broderick. This is an open-access article distributed under the terms of the Creative Commons Attribution License (CC BY). The use, distribution or reproduction in other forums is permitted, provided the original author(s) and the copyright owner(s) are credited and that the original publication in this journal is cited, in accordance with accepted academic practice. No use, distribution or reproduction is permitted which does not comply with these terms.
*Correspondence: Charlotte L. A. Gough, charlie@blueventures.org; cg456@exeter.ac.uk