The Importance of the Northeastern Gulf of Mexico to Foraging Loggerhead Sea Turtles
 Kristen M. Hart
 Margaret M. Lamont
 Autumn R. Iverson3,4
  Brian J. Smith
- 1U.S. Geological Survey, Wetland and Aquatic Research Center, Davie, FL, United States
- 2U.S. Geological Survey, Wetland and Aquatic Research Center, Gainesville, FL, United States
- 3Cherokee Nations Technology, Contracted to the U.S. Geological Survey, Davie, CA, United States
- 4Department of Animal Science, University of California, Davis, Davis, CA, United States
- 5Department of Wildland Resources, Utah State University, Logan, UT, United States
Identification of high-use foraging sites where imperiled sea turtles are resident remains a globally-recognized conservation priority. In the biodiverse Gulf of Mexico (GoM), recent telemetry studies highlighted post-nesting foraging sites for federally threatened loggerhead turtles (Caretta caretta). Our aim here was to discern loggerhead use of additional northern GoM regions that may serve as high-use foraging sites. Thus, we used satellite tracking and switching state-space modeling to show that the Big Bend region off the northwest Florida coast is a coastal foraging area that supports imperiled adult female loggerhead turtles tracked from different nesting subpopulations. From 2011 to 2016, we satellite-tagged 15 loggerheads that nested on four distinct beaches around the GoM: Dry Tortugas National Park, FL; Everglades National Park, FL; St. Joseph Peninsula, FL; and Gulf Shores, AL. Turtles arrived at their foraging ground in the Big Bend region between June and September and remained resident in their respective foraging sites for an average of 198 tracking days, where they established mean home ranges (95% kernel density estimate) 232.7 km2. Larger home ranges were in deeper water; 50% kernel density estimate centroid values were a mean 26.4 m deep and 52.7 km from shore. The Big Bend region provides a wide area of suitable year-round foraging habitat for loggerheads from at least 3 different nesting subpopulations. Understanding where and when threatened loggerheads forage and remain resident is key for designing both surveys of foraging resources and additional protection strategies that can impact population recovery trajectories for this imperiled species.
Introduction
Identification of high-use foraging sites where imperiled marine species congregate is important (Patterson et al., 2016; Augé et al., 2018). For threatened and endangered sea turtles, delineating these sites is a globally recognized conservation priority (Hamann et al., 2010; Rees et al., 2016). Such information factors into critical habitat designations in the U.S. by management agencies [i.e., National Oceanic and Atmospheric Administration (NOAA), National Marine Fisheries Service (NMFS), U.S. Fish & Wildlife Service (USFWS)] which can translate into regulations on human use in areas of human/turtle overlap (U.S. Fish and Wildlife Service and National Marine Fisheries Service, 2013). In particular, areas where multiple species or life stages overlap at foraging sties may receive enhanced priority rankings. Satellite tracking and isotopic tools have been frequently used to designate species-specific foraging areas of importance (see Bradshaw et al., 2017; Rees et al., 2017), and multi-species syntheses that take decades to collect are beginning to emerge (see Conners et al., In review).
Because nesting sea turtles are more easily observed, nesting beaches often receive more attention than in-water sites. However, sea turtles spend the majority of their time at sea and as such the locations where they remain resident provide the necessary resources for these imperiled species. Foraging resources contribute toward fat stores that allow females to attain sufficient body condition for reproductive migrations which are energetically demanding. Similarly, after a nesting season, female sea turtles recover from the energetically taxing nesting season and build energy reserves for vitellogenesis (Limpus and Nicholls, 2000; Hamann et al., 2002). Characteristics of foraging grounds can influence various aspects of reproduction (Hamann et al., 2002; Schofield et al., 2009; Weber et al., 2011; Vander Zanden et al., 2014). Thus, characterizing these areas is critical for proper management of this habitat which will help toward population recovery.
In the U.S. Gulf of Mexico (GoM), five species of sea turtle occupy various habitats, including several dense nesting assemblages along the coastline. Recent tracking work by Hart et al. (2014); Foley et al. (2014), and Tucker et al. (2014) highlighted post-nesting foraging site destinations for loggerheads (Caretta caretta) in the GoM, currently listed with threatened status under the U.S. Endangered Species Act (National Marine Fisheries Service and U.S. Fish and Wildlife Service, 2008, 2011). As tracking sample sizes have increased for loggerheads in the GoM, the number of questions we can address has broadened (Sequeira et al., 2019) including highlighting previously unidentified foraging areas. In the Southeastern U.S., loggerheads are considered five subpopulations (Turtle Expert Working Group, 2009) and 10 management units (Shamblin et al., 2011, 2012) based on mitochondrial DNA analyses. The subpopulations in the Dry Tortugas and northern GoM are the two smallest, with median individual nesting subpopulation estimates of 331 females and 432 females, respectively (Richards et al., 2011). Hart et al. (2012) earlier reported on the use of common coastal foraging areas for a small number of turtles tagged in these different management units. It is possible that additional tracking would highlight previously unidentified coastal areas which also serve as important foraging habitat for individuals from these same management units.
Despite several studies and relatively large sample sizes, no nesting loggerhead from the northern GoM Recovery Unit has ever been tracked outside the GoM (Hart et al., 2012; Foley et al., 2013; Lamont et al., 2015). This work highlights important foraging areas for this loggerhead subpopulation. One area that consistently emerges as important for northern GoM loggerheads are shallow waters in the northeastern GoM (Tucker, 2010; Foley et al., 2013; Hardy et al., 2014; Hart et al., 2014).
The northeastern GoM, also known as the Big Bend region of Florida, lies upon the West Florida Shelf which represents 75% of the U.S. GoM shelf area and includes “ecologically productive and biologically rich marine habitat” (Coleman et al., 2011). This region provides important nursery habitat for several ecologically and economically important species including many fish and shellfish species (Todd et al., 2014). This area has low-energy shorelines and habitat that includes seagrass beds, salt marshes, and oyster reefs (Seavey et al., 2011; Kaplan et al., 2016). The Big Bend region provides foraging habitat for juvenile sea turtles (Schmid and Barichivich, 2005), but little is known of the use of this area by other sea turtle life stages. Dramatic environmental changes in the Big Bend area have recently occurred including large decreases in oyster reef habitat (Seavey et al., 2011) and it lies adjacent to the track of Category 5 Hurricane Michael (2018, 10 October, National Weather Service)1. The impact of these changes to foraging turtles is currently unknown.
In 2013, the USFWS and NMFS designated critical habitat for Western Atlantic loggerheads (U.S. Fish and Wildlife Service and National Marine Fisheries Service, 2013). Since Hart et al. (2012), we continued tracking nesting loggerhead turtles from two genetically distinct subpopulations to evaluate use of foraging habitat in the northeastern GoM. Here, we report on another year-round common coastal foraging area that supports these turtles. Highlighting in-water foraging habitat should aid in future designations of critical habitat for this imperiled species.
Materials and Methods
Field Methods
We tagged turtles at Dry Tortugas National Park, FL; Everglades National Park, FL; St. Joseph Peninsula, FL; and Gulf Shores, AL (Figure 1). Full details on turtle capture and satellite-tagging can be found in Hart et al. (2013, 2018). Briefly, we corralled turtles on the beach after nesting was complete and followed established protocols for sampling and tagging (National Marine Fisheries Service Southeast Fisheries Science Center, 2008). The corral was removed after tagging was completed allowing the turtle to return to the water. We used SPOT5, SPOT6, or SPLASH10 PTTs from Wildlife Computers (Redmond, WA, United States) and duty-cycled tags to transmit every 3rd day during November-April to prolong battery life. We defined the Big Bend region as the neritic zone of the GoM stretching from St. Andrew Bay at the northern end to Tampa Bay at the southern end (see Figure 1). We only considered tracks for this analysis that had foraging locations within this region.
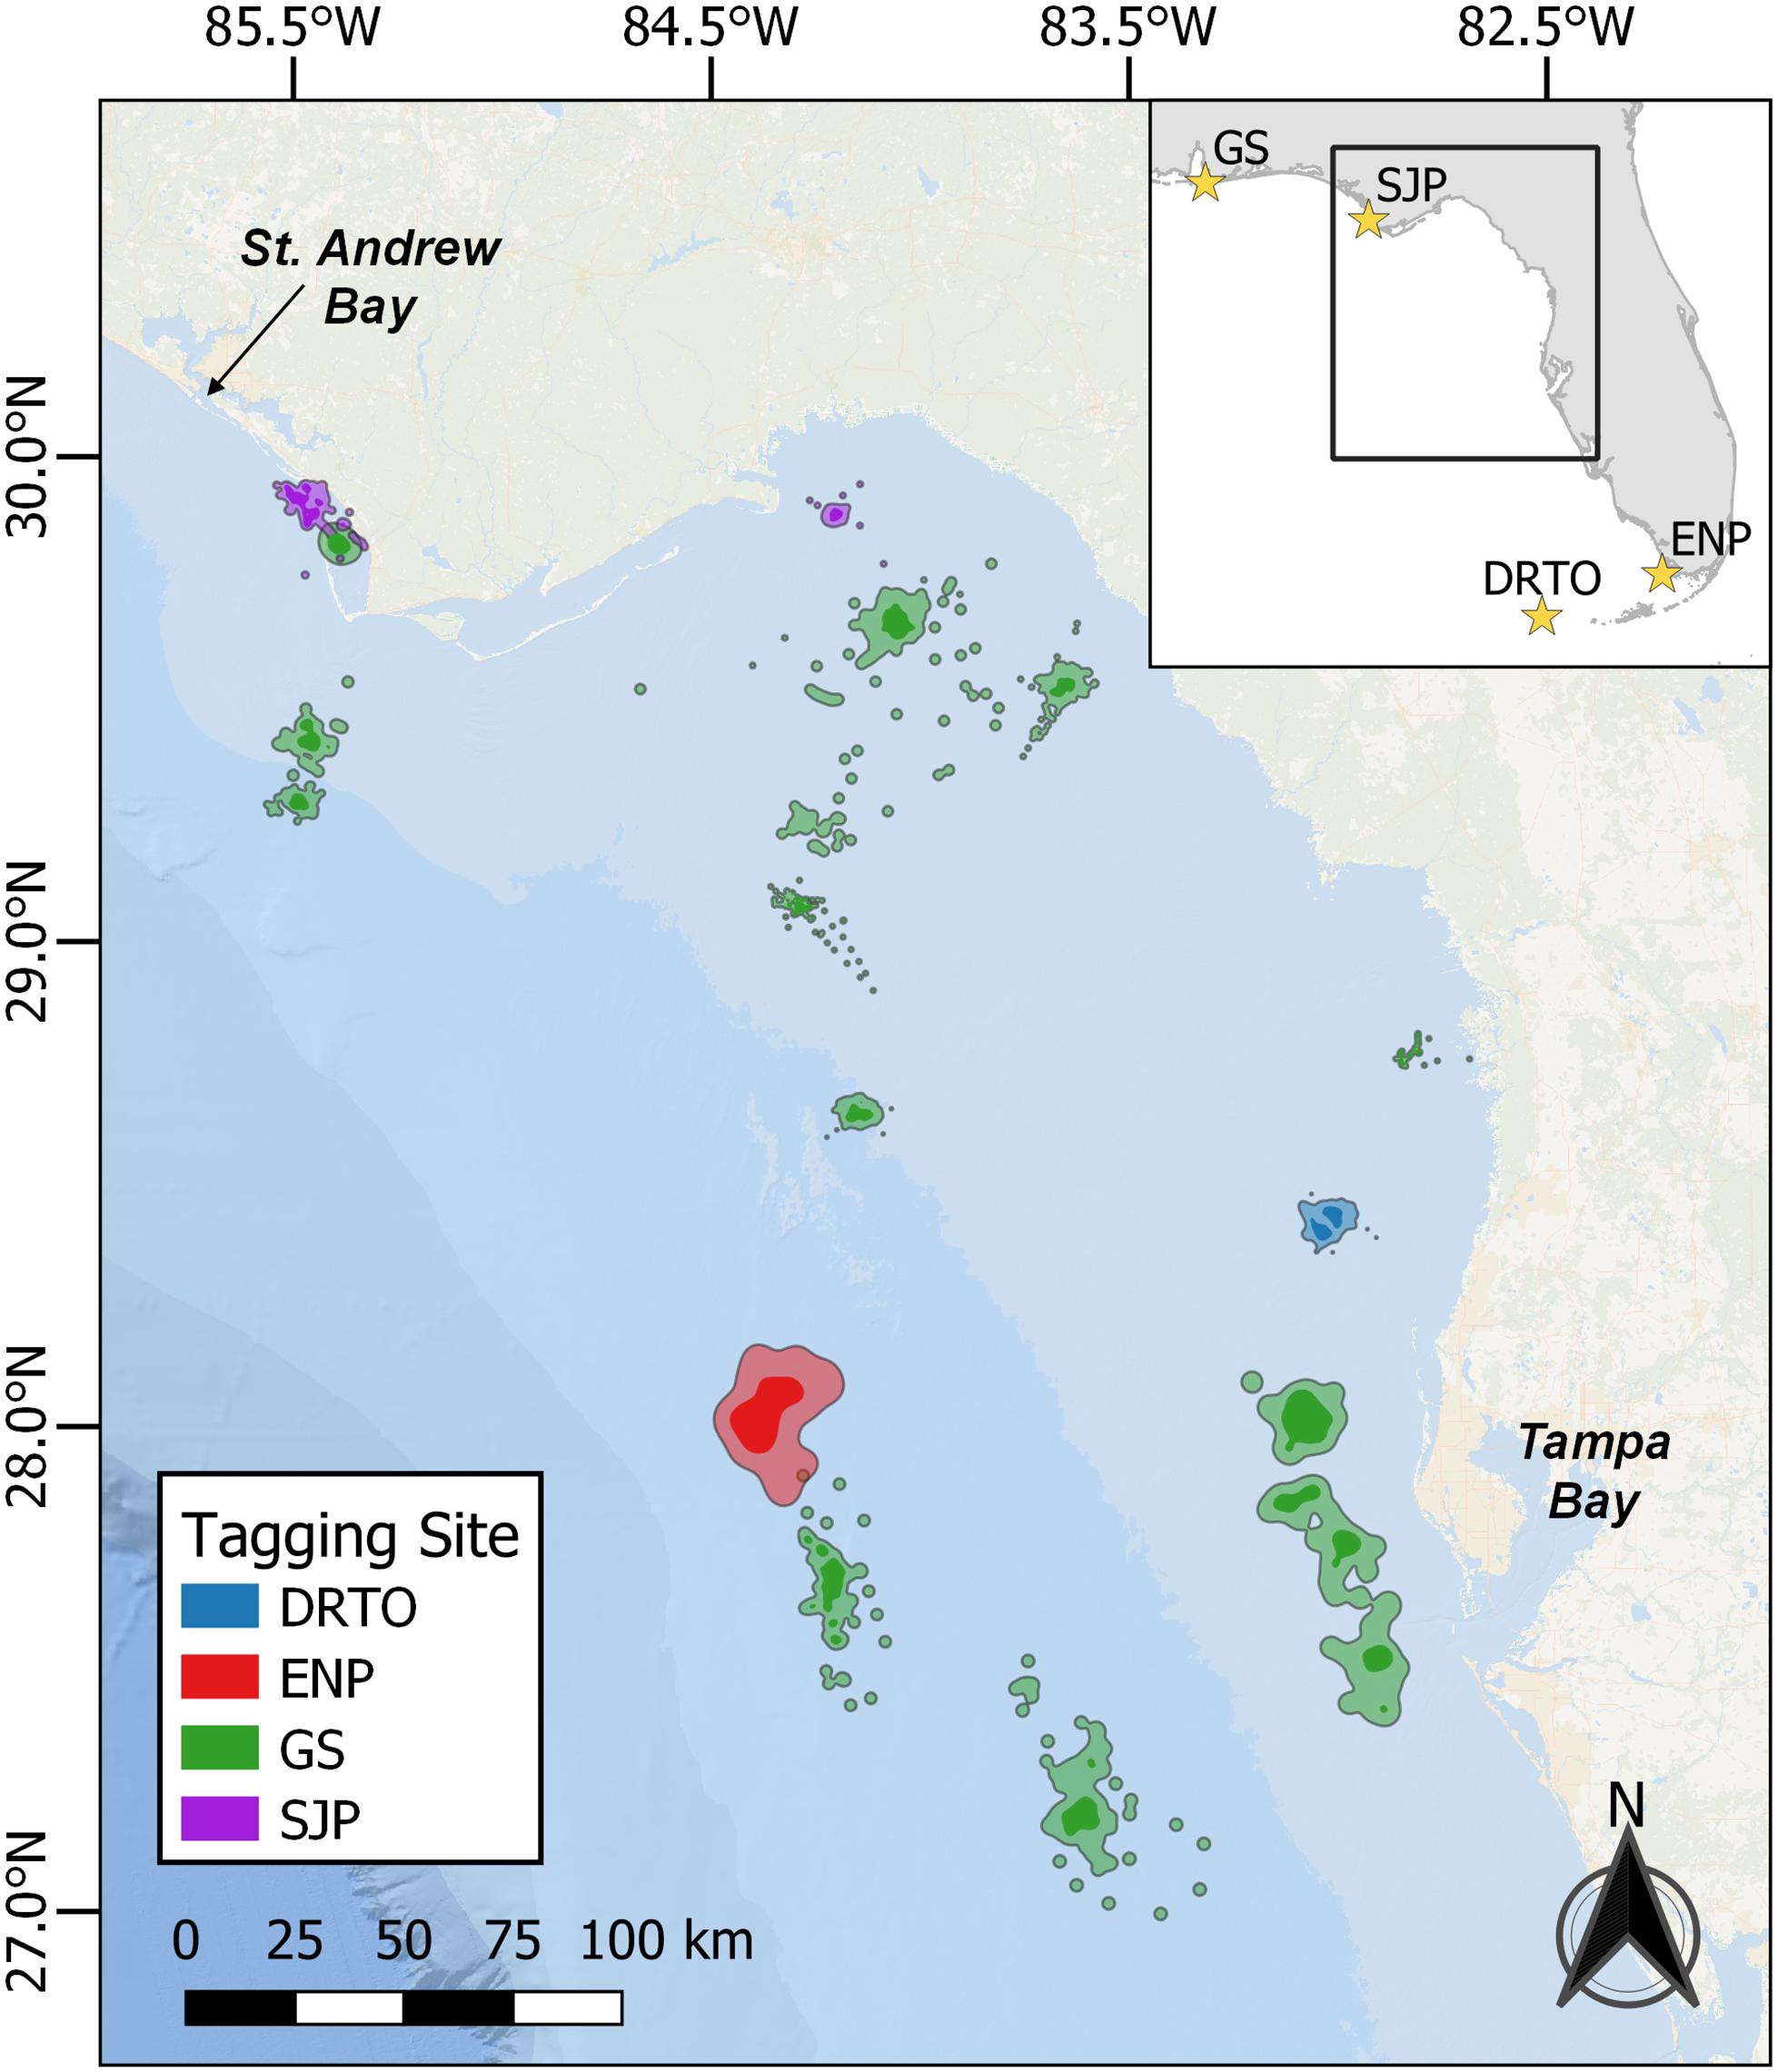
Figure 1. Home range and core-use areas for loggerhead sea turtle (Caretta caretta) foraging periods occurring within the Big Bend region (inset box), from Tampa Bay to St. Andrew Bay. Tagging locations are shown as yellow stars on the inset map; turtles were satellite-tagged at four sites in the Gulf of Mexico and colors correspond to tagging location: Dry Tortugas National Park, Florida (DRTO, n = 1, blue); Everglades National Park, Florida (ENP, n = 1, red); Gulf Shores, Alabama (GS, n = 11, green); St. Joseph Peninsula, Florida (SJP, n = 2, purple). Kernel Density Estimates (KDEs) are shown for each turtle as lighter polygons (95% KDE; home range) with a darker color inside (50% KDE; core-use area).
Data Analysis
Processing Tracking Data
We used the raw tracking data to fit a hierarchical, behavior-switching state-space model (SSM; Jonsen, 2016), allowing us to estimate the behavioral modes of individual turtles, regularize the locations in time, and account for location error. This hierarchical SSM is similar to the model of Jonsen et al. (2005), but jointly estimates the movement parameters that define the behavioral states across all individuals, thus improving the behavioral state estimation. Using the R package “bsam” (Jonsen et al., 2017; R Core Team, 2019), we fit the SSMs then used MCMC parameters following our previous studies (see Hart et al., 2012), including adaptive sampling (and burn-in) for 7,000 samples, then 10,000 samples from the posterior distribution, thinned by 5 to reduce MCMC autocorrelation. As opposed to our previous studies, here we used a time step of 1 day, rather than 6 h, to reduce the autocorrelation in our home range estimation.
Large gaps in the raw data force the SSM to estimate a correlated random walk uninformed by data. These location estimates are less reliable the longer the gap becomes. To deal with this, we split individual tracks at gaps of 25 days or longer, and we passed these tracks to the model as if they were separate individuals. After fitting the SSM, we recombined the modeled daily locations for each turtle.
Delimiting Foraging Areas
The SSM separated turtle behaviors into two categories: (1) area-restricted search (ARS) which was characterized by relatively tortuous tracks and slow swim speeds; and (2) migration which was characterized by relatively straight tracks and fast swim speeds. We tagged turtles during the nesting season, so we can interpret the ARS mode to be either “inter-nesting” or “foraging.” We defined “foraging” as all the locations recorded from after the final “migration” location until the end of the tracking duration.
Home Ranges
We used all the foraging locations to fit home ranges for each turtle. We used the kernel density estimator (KDE), a common home range metric based on estimating the animal’s utilization distribution in discrete space (Worton, 1989; Kie et al., 2010). We used the R package “adehabitatHR” (Calenge, 2006) to estimate KDEs, using least squares cross-validation to select the bandwidth parameter, h (Worton, 1995; Seaman and Powell, 1996). We represented the overall home range with 95% KDEs and the core area of activity with 50% KDEs (Hooge et al., 2001).
For each turtle, we calculated the centroid of the 50% KDE polygon, and from that centroid, we calculated distance to shore and depth. We estimated distance to shore by using the function “gDistance()” from the R package “rgeos” (Bivand and Rundel, 2019) to calculate the distance between the centroid and the intermediate-resolution shoreline polygon from the Global Self-consistent Hierarchical High-resolution Geography database (GSHHG; Wessel and Smith, 1996). We estimated depth by extracting the value at the centroid from the ETOPO1 Global Relief model (Amante and Eakins, 2009). We estimated the relationship between home range size (area of the 95% KDE) and depth by fitting a linear model where ln(area) depended on ln(depth).
Eleven home ranges were previously published in Hart et al. (2014). In that paper, however, authors used SSM only to define time periods of migration and foraging; they then used original filtered Argos locations from within those SSM-defined time periods for analysis. Here, in contrast and as stated above, we use predicted ARS locations instead of original filtered locations, and we added additional tracking days for several turtles (after the cutoff in Hart et al., 2014). In addition, we acknowledge that aspects of one turtle’s movement is also in Hart et al. (2018), thus here we re-visited the data for these previously published home ranges, adding in additional locations for five of these turtles. We also report on three new loggerheads that were tracked to this region.
Results
We documented 15 individuals using the Big Bend region from our four tagging sites: Dry Tortugas National Park, FL (n = 1); Everglades National Park, FL (n = 1); St. Joseph Peninsula, FL (n = 2); and Gulf Shores, AL (n = 11; Table 1). These adult female loggerhead turtles ranged in size from 87.0–106.0 cm curved carapace length (CCL; mean + SD = 94.9 + 4.4 cm).
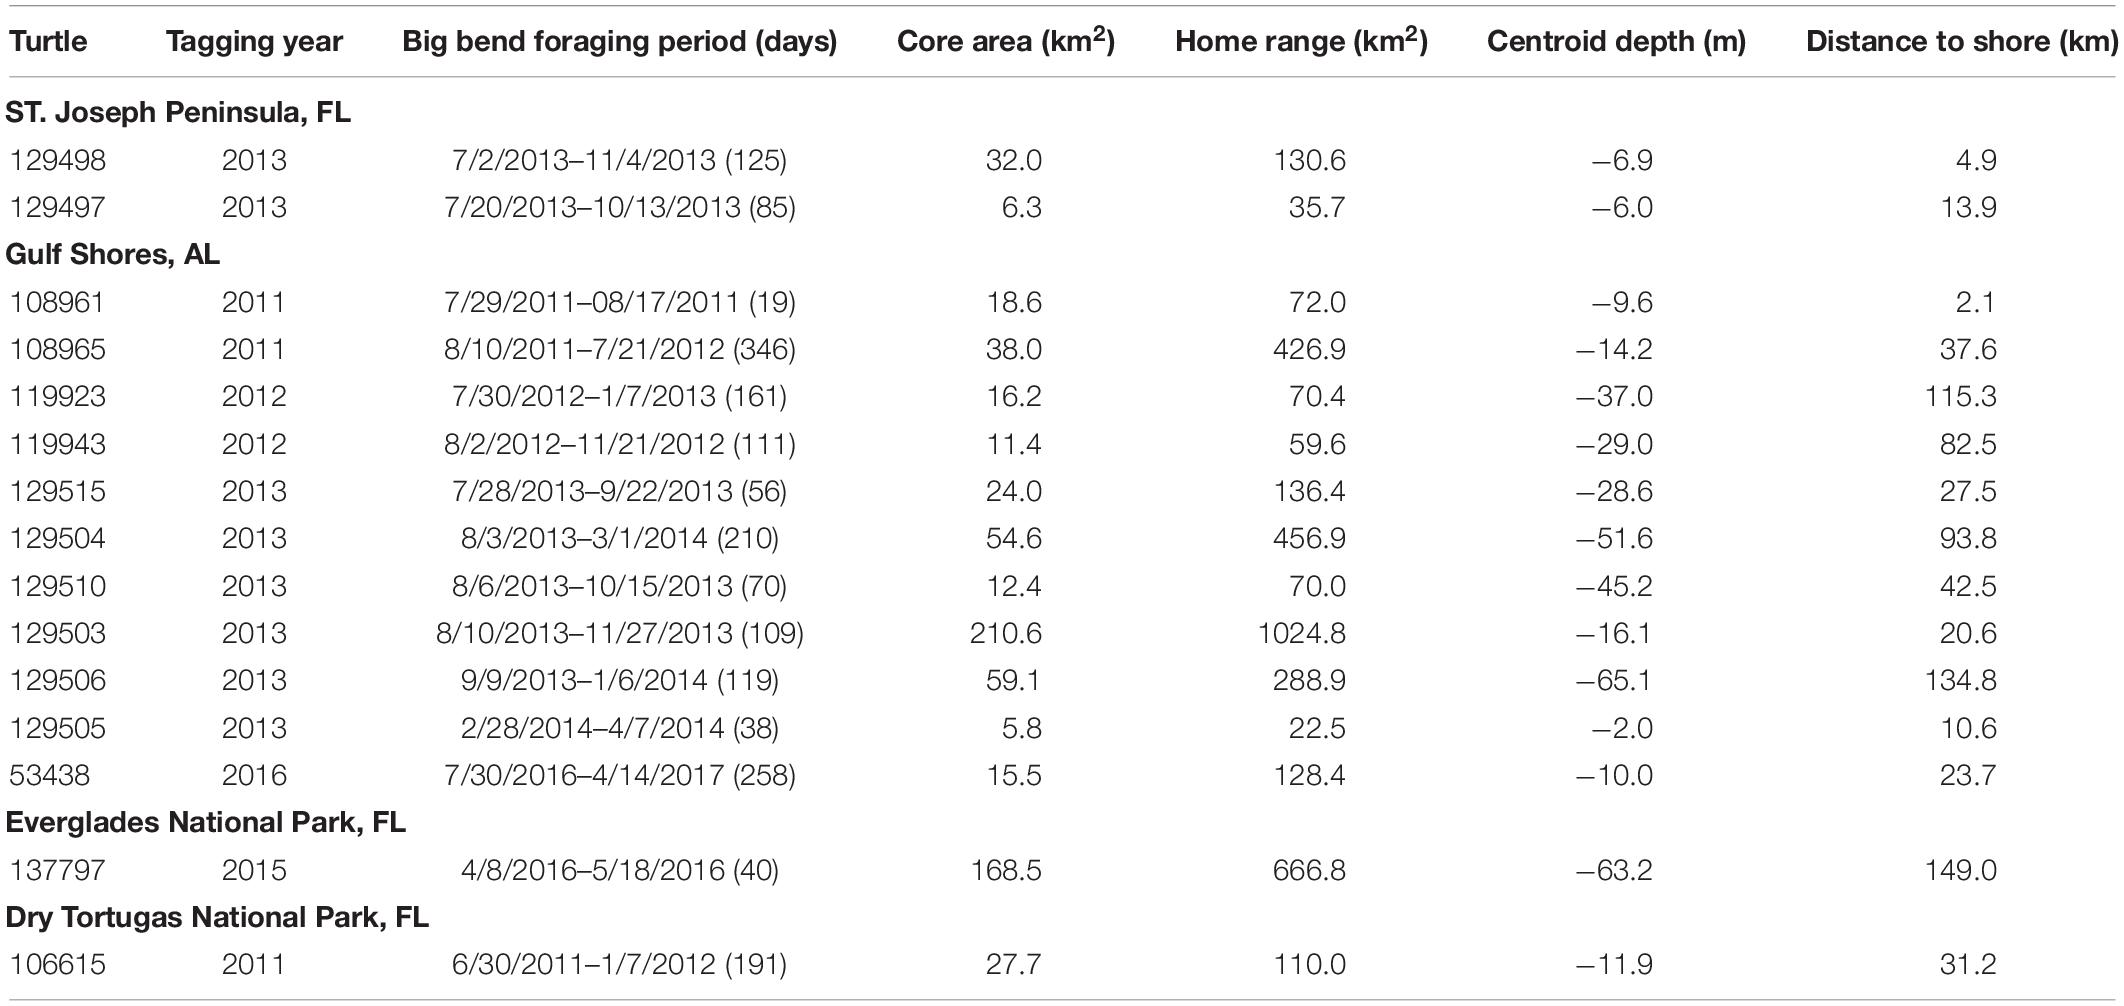
Table 1. Tagging and kernel density estimate (KDE) details for adult female loggerheads with resident foraging areas in the Big Bend region.
We received a total of 17419 raw Argos locations for all turtles. Mean locations per turtle was 1161 (SD = 413, range = 390–1791). A single turtle (108965) had a gap of at least 25 days, so we split her track into two prior to fitting the SSM. After fitting the SSM, we were left with 2974 daily locations for all turtles. Mean daily locations per turtle was 198 (SD = 86, range = 26–317). Of those, we identified 1881 as foraging locations, and the mean daily foraging locations per turtle was 125 (SD = 80, range = 20–275). Turtles arrived in their foraging location in dates during June (n = 1), July (n = 6), August (n = 5), and September (n = 1); two turtles were tracked later at foraging areas in the Big Bend.
We used the SSM-derived daily ARS (i.e., foraging) locations to fit home ranges (95% KDE) and core areas (50% KDE) for each turtle. Our LSCV routine to select the bandwidth parameter converged for all turtles. The mean home range size was 246.7 km2 (SD = 285.5, range = 22.5–1024.8 km2). The mean core area size was 46.7 km2 (SD = 60.7, range = 5.8–210.6 km2). Individual home ranges were distributed throughout the Big Bend region (Figure 1). Depth of 50% KDE centroids ranged from 2.0 to 65.1 m (mean 26.4 m, SD 21.3) and distance to shore values for 50% KDE centroids ranged from 2.1 to 149.0 km (mean 52.7 km, SD 49.2). The relationship between ln(area) and ln(depth) was significant (p = 0.04), and this simple model explained nearly a quarter of the variation in home range size (adj-R2 = 0.23; Figure 2).
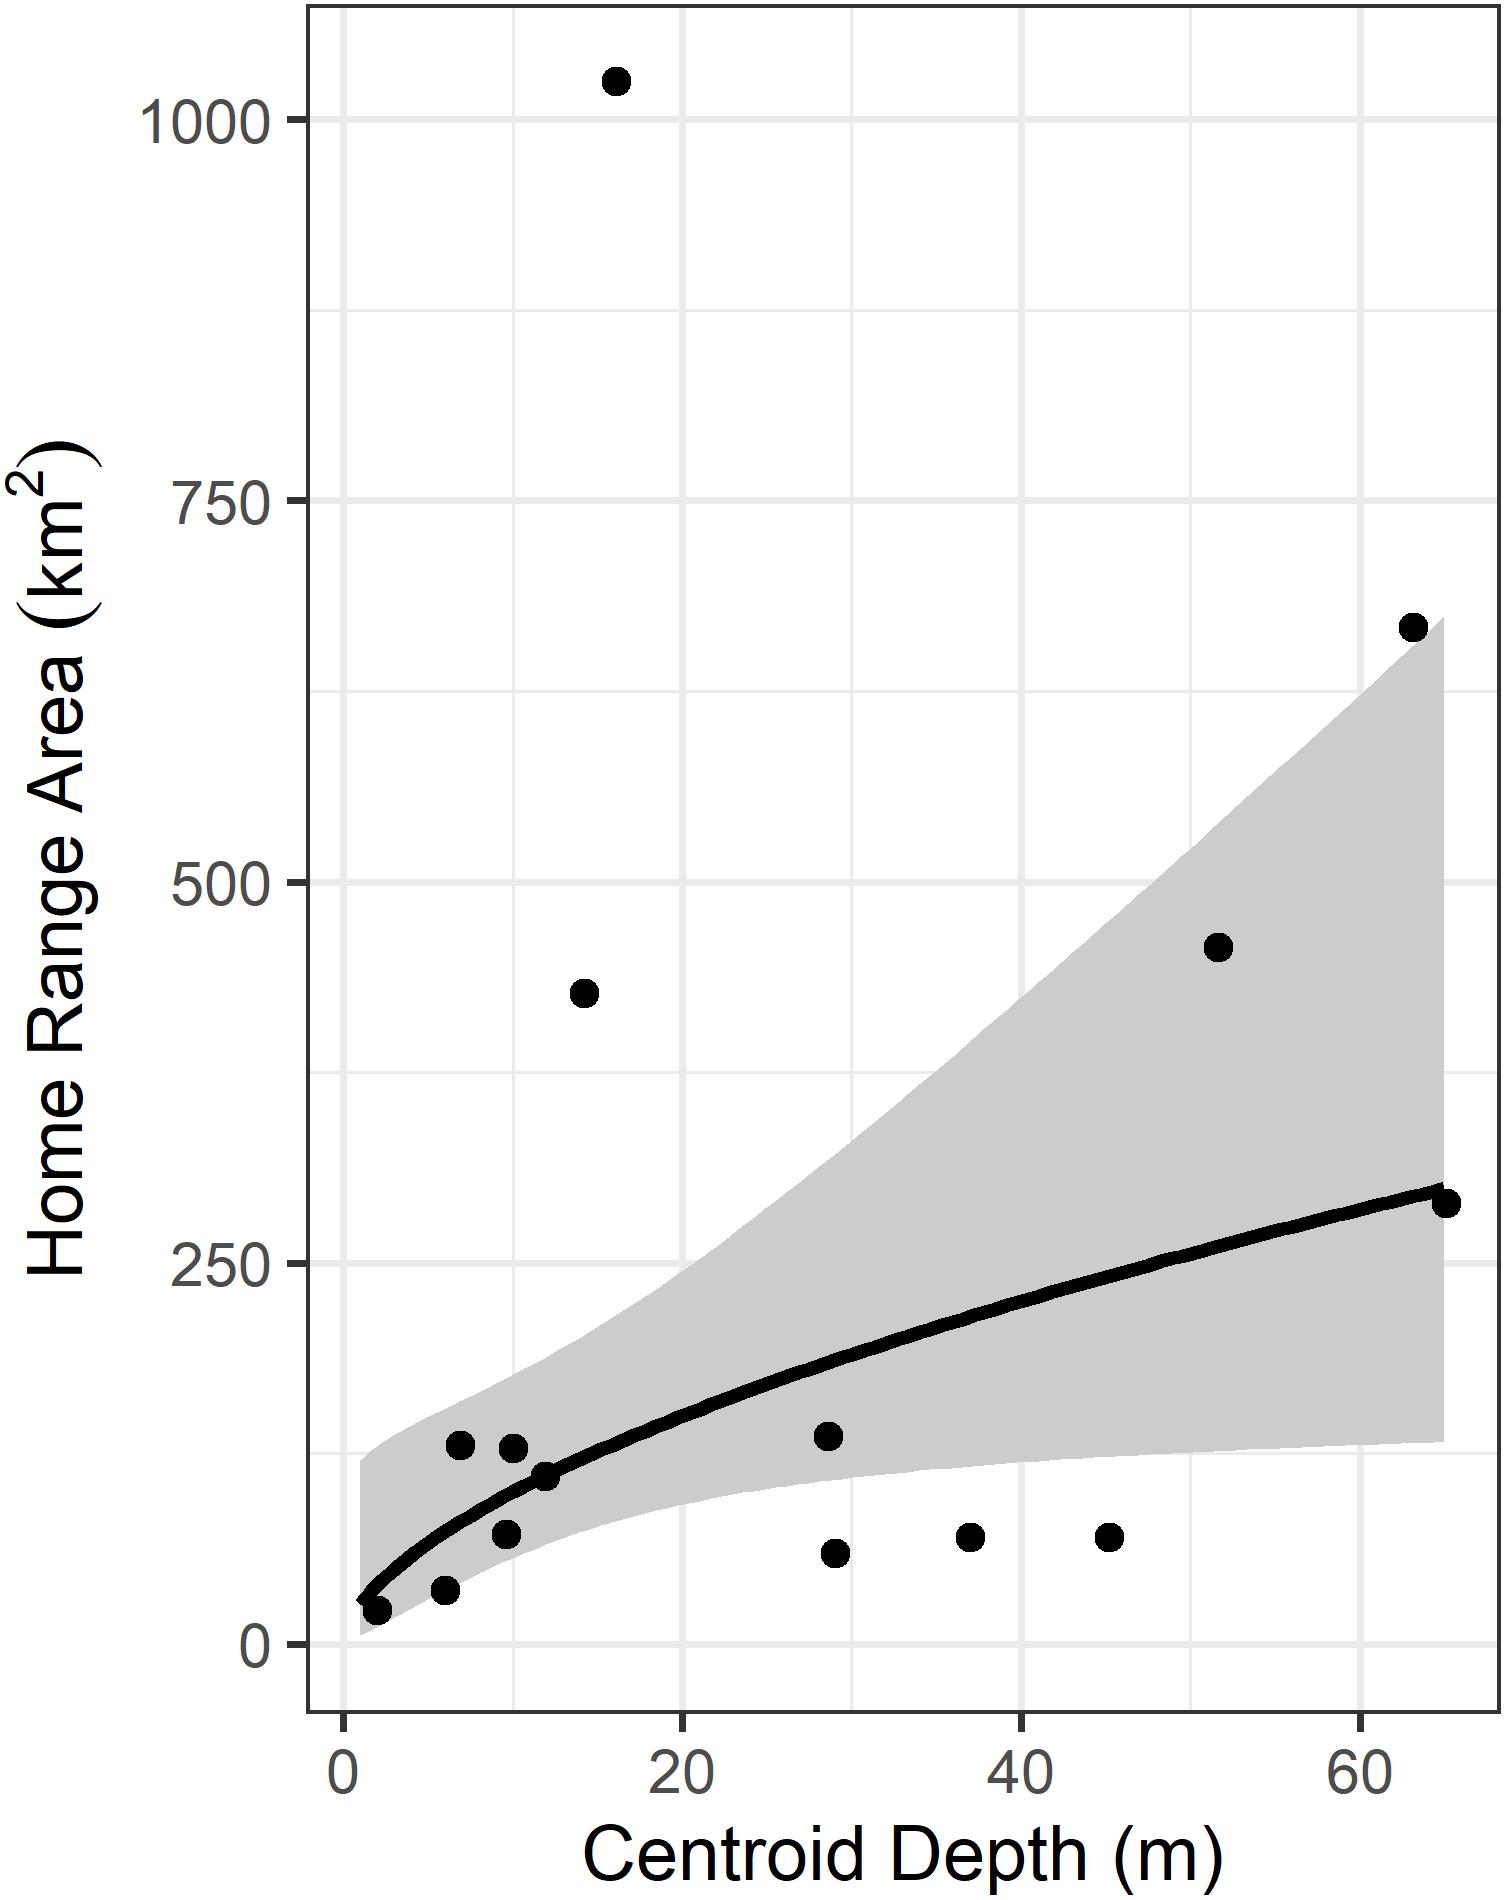
Figure 2. Relationship between home range size (95% KDE) and depth. Fit line is from a linear model where ln(area) depends on ln(depth) and is significant (p = 0.04, adj-R2 = 0.23). Shaded envelope represents the 95% confidence interval around the fit line.
Discussion
Tracking studies can provide critical data for policy makers particularly when targeting specific needs and data gaps (Hays et al., 2019). This work highlights use of Florida’s Big Bend region as foraging habitat by threatened adult female loggerheads from four separate nesting beaches, representing several different distinct population segments and management units. It contributes toward recognizing relative importance of foraging areas in the northern Gulf of Mexico, which has a paucity of defined foraging areas for comparison. We suspect that additional tracks in future years will complement this summary, which is derived from multiple different tracking projects across study sites and years. This summary provided here took 2011–2017 tracking data to collate, thus future effort to track additional Gulf turtles to this region would be valuable for understanding the relative use of this area by individuals from different nesting populations. We do not have foraging centroids for additional turtles shown in Foley et al. (2014; n = 3) and Tucker et al. (2014, n = ∼13), but it is clear that other loggerheads migrate to this region and remain resident there in at least low numbers.
We observed quite a span of individual variation in home range size (Figure 2), which does not appear to be a sampling artifact [i.e., it is not that large home ranges were generated due to low quality Argos locations (e.g., lots of class B and class 0 locations), as we used SSM here]. Rather, this variation reflects something real about foraging site selection, complementing previous work on loggerheads in the Mediterranean (e.g., Schofield et al., 2010), where loggerhead home ranges that were deeper and farther offshore were larger. Here, the pattern observed in Schofield et al. (2010) also holds true, as our simple linear model explained nearly a quarter of the variation we observed in home range sizes for loggerheads females in the Big Bend region. Mean values of two measurable characteristics of core use areas reported here are similar to those previously reported in Hart et al. (2014): 47.6 km mean distance to shore and 32.5 m depth, as well as a previously determined for a common coastal foraging area in the GoM, but south of the Big Bend (Hart et al., 2012; foraging centroids in that study were in waters < 50 m deep and within a mean distance of 58.5 km to nearest coastline.
The quantitative spatial ecological summary on individual home ranges presented here is key information for managers to consider as loggerhead critical habitat designations in the U.S. are refined. Recent other tracking studies highlighted areas in the GoM that serve as important foraging habitat for loggerheads (Girard et al., 2009; Foley et al., 2014; Hart et al., 2014; Tucker et al., 2014), yet it was not obvious in previous regional tracking summaries that the Big Bend was another important year-round foraging area for loggerheads from multiple distinct population segments. Our summary here also includes the first published Everglades loggerhead track (turtle 137797), representing new information for that understudied nesting sub-population.
Recently, Wildermann et al. (2019) showed the value of this area to other sea turtle species: satellite-tagged green turtles (Chelonia mydas), Kemp’s ridleys (Lepidochelys kempii), and loggerheads partitioned habitat off of the northwest Florida Shelf. In another tracking study it was revealed that juveniles of these three species also shared habitat in coastal bays off of Northwest Florida (Lamont and Iverson, 2018). These results together highlight the potential for this area to serve as a foraging hotspot for multiple sea turtle species. Identification and delineation of foraging hotspots, particularly those used long-term and year-round like those here, are important for defining the extent of U.S. critical habitat and areas for potential protection.
Tracking studies are critical to establishment and maintenance of these protected areas (Cuevas et al., 2008; Méndez et al., 2013; Hays et al., 2019). The word “hotspot” was originated by Myers (1988) to identify areas of “exceptional concentrations” of endemic species currently experiencing exceptional loss of habitat. The goal in that paper was to highlight areas where the greatest number of species could be protected per conservation dollar (Myers, 1988, 1990, 2003; Briscoe et al., 2016). Our tracking results, coupled with previous studies that show use of this region by multiple taxa [Kemp’s ridleys (Schmid and Barichivich, 2005), invertebrates (Posey et al., 1998); reef fish (Coleman et al., 2011); dolphins (Tyson et al., 2011); sharks (Bethea et al., 2015)] indicate that the Big Bend represents an important marine hotspot in the northeastern GoM. This work contributes to ongoing discussions of critical habitat designations for sea turtles in the Southeastern U.S. and highlights the importance of considering nearshore habitats on the continental shelf in these discussions, as currently, these habitats are not included in loggerhead critical habitat (U.S. Fish and Wildlife Service and National Marine Fisheries Service, 2013).
Data Availability Statement
All datasets generated for this study are included in the article/supplementary material.
Ethics Statement
This study was carried out in accordance with the guidelines of the USGS Institutional Animal Care and Use committee who also approved the study protocol (USGS-SESC-IACUC-2011-05). In addition, all federal and state permits required were obtained for this research on turtles at Gulf Shores (USFWS permit TE206903-1 and Bon Secour Special Use Permit 12-006S); and Florida [Marine Turtle Permits #176 (issued to KH) and #118 (issued to ML)]; Dry Tortugas National Park permits DRTO-2008-SCI-0008, DRTO-2010-SCI-0009, and DRTO-2012-SCI-0008 (issued to KH).
Author Contributions
KH and ML contributed to the conception and design of the study. BS performed the state-space modeling. BS and AI created the figures. All authors contributed to the writing of the manuscript, and read and approved the submitted version.
Funding
Funding for this work was provided by the USGS Priority Ecosystem Studies program, USGS Ecosystems Program, and the Deepwater Horizon Natural Resource Damage Assessment (NRDA).
Conflict of Interest
AI and BS were employed by the company Cherokee Nations Technology.
The remaining authors declare that the research was conducted in the absence of any commercial or financial relationships that could be construed as a potential conflict of interest.
Acknowledgments
We thank M. Arias for help formatting references. Any use of trade, product, or firm names is for descriptive purposes only and does not imply endorsement by the U.S. Government.
Footnotes
References
Amante, C., and Eakins, B. W. (2009). ETOPO1 1 Arc-Minute Global Relief Model: Procedures, Data Sources and Analysis. NOAA Technical Memorandum NESDIS NGDC-24. National Geophysical Data Center. Silver Spring, MD: NOAA. doi: 10.7289/V5C8276M
Augé, A. A., Dias, M. P., Lascelles, B., Baylis, A. M. M., Black, A., Boersma, P. D., et al. (2018). Framework for mapping key areas for marine megafauna to inform marine spatial planning: the Falkland Islands case study. Mar. Policy 92, 61–72.
Bethea, D. M., Ajemian, M. J., Carlson, J. K., Hoffmayer, E. R., Imhoff, J. L., Grubbs, R. D., et al. (2015). Distribution and community structure of coastal sharks in the northeastern Gulf of Mexico. Environ. Biol. Fishes 98, 1233–1254.
Bivand, R., and Rundel, C. (2019). rgeos: Interface to Geometry Engine – Open Source (‘GEOS’). R package version 0.5-2. Available online at: https://CRAN.R-project.org/package=rgeos (accessed October 3, 2019).
Bradshaw, P. J., Broderick, A. C., Carreras, C., Inger, R., Fuller, W., Snape, R., et al. (2017). Satellite tracking and stable isotope analysis highlight differential recruitment among foraging areas in green turtles. Mar. Ecol. Prog. Ser. 582, 201–214.
Briscoe, D., Maxwell, S., Kudela, R., Crowder, L., and Croll, D. (2016). Are we missing important areas in pelagic marine conservation? Redefining conservation hotspots in the ocean. Endanger. Species Res. 29, 229–237.
Calenge, C. (2006). The package “adehabitat” for the R software: a tool for the analysis of space and habitat use by animals. Ecol. Modell. 197, 516–519.
Coleman, F. C., Scanlon, K. M., and Koenig, C. C. (2011). Groupers on the edge: shelf edge spawning habitat in and around marine reserves of the northeastern gulf of Mexico. Prof. Geogr. 63, 456–474.
Cuevas, E., Abreau-Grobois, F. A., Guzman-Hernandez, V., Liceaga-Correa, M. A., and Van Dam, R. (2008). Post-nesting migratory movements of hawksbill turtles (Eretmochelys imbricata) around the Yucatan Peninsula, Mexico. Endanger. Species Res. 10, 123–13349.
Foley, A., Schroeder, B., Hardy, R., MacPherson, S., Nicholas, M., and Coyne, M. (2013). Postnesting migratory behavior of loggerhead sea turtles Caretta caretta from three Florida rookeries. Endanger. Species Res. 21, 129–142.
Foley, A. M., Schroeder, B. A., Hardy, R., MacPherson, S. L., and Nicholas, M. (2014). Long-term behavior at foraging sites of adult female loggerhead sea turtles (Caretta caretta) from three Florida rookeries. Mar. Biol. 161, 1251–1262. doi: 10.1007/s00227-014-2415-9
Girard, C., Tucker, A. D., and Calmettes, B. (2009). Post-nesting migrations of loggerhead sea turtles in the Gulf of Mexico: dispersal in highly dynamic conditions. Mar. Biol. 156, 1827–1839.
Hamann, M., Godfrey, M., Seminoff, J., Arthur, K., Barata, P., Bjorndal, K., et al. (2010). Global research priorities for sea turtles: informing management and conservation in the 21st century. Endanger. Species Res. 11, 245–269.
Hamann, M., Limpus, C., and Whittier, J. M. (2002). Patterns of lipid storage and mobilisation in the female green sea turtle (Chelonia mydas). J. Comp. Physiol. B Biochem. Syst. Environ. Physiol. 172, 485–493. doi: 10.1007/s00360-002-0271-2
Hardy, R. F., Tucker, A. D., Foley, A. M., Schroeder, B. A., Giove, R. J., and Meylan, A. B. (2014). Spatiotemporal occurrence of loggerhead turtles (Caretta caretta) on the West Florida shelf and apparent overlap with a commercial fishery. Can. J. Fish. Aquat. Sci. 71, 1924–1933.
Hart, K. M., Iverson, A. R., Fujisaki, I., Lamont, M. M., Bucklin, D., and Shaver, D. J. (2018). Sympatry or syntopy? Investigating drivers of distribution and co-occurrence for two imperiled sea turtle species in Gulf of Mexico neritic waters. Ecol. Evol. 8, 12656–12669. doi: 10.1002/ece3.4691
Hart, K. M., Lamont, M. L., Sartain, A. R., and Fujisaki, I. (2014). Migration, foraging, and residency patters of Northern Gulf loggerheads: implications of local threats and international movements. PLoS One 9:e103453. doi: 10.1371/journal.pone.0103453
Hart, K. M., Lamont, M. M., Fujisaki, I., Tucker, A. D., and Carthy, R. R. (2012). Common coastal foraging areas for loggerheads in the Gulf of Mexico: opportunities for marine conservation. Biol. Conserv. 145, 185–194.
Hart, K. M., Lamont, M. M., Sartain, A. R., Fujisaki, I., and Stephens, B. S. (2013). Movements and habitat-use of loggerhead sea turtles in the northern Gulf of Mexico during the reproductive period. PLoS ONE 8:e66921. doi: 10.1371/journal.pone.0066921
Hays, G. C., Bailey, H., Bograd, S. J., Bowen, W. D., Campagna, C., Carmichael, R. H., et al. (2019). Translating marine animal tracking data into conservation policy and management. Ecol. Evol. 34, 459–473. doi: 10.1016/j.tree.2019.01.009
Hooge, P. N., Eichenlaub, W., and Hooge, E. R. (2001). Animal Movement 2.5. Anchorage, AK: Alaska Biological Science Center.
Jonsen, I. (2016). Joint estimation over multiple individuals improves behavioural state inference from animal movement data. Sci. Rep. 6:20625. doi: 10.1038/srep20625
Jonsen, I., Bestley, S., Wotherspoon, S., Sumner, M., and Flemming, J. M. (2017). bsam: Bayesian State-Space Models for Animal Movement. Available online at: https://cran.r-project.org/web/packages/bsam/index.html (accessed July 1, 2017).
Jonsen, I. D., Flemming, J. M., and Myers, R. A. (2005). Robust state-space modeling of animal movement data. Ecology 86, 2874–2880.
Kaplan, D. A., Olabarrieta, M., Frederick, P., and Valle-Levinson, A. (2016). Freshwater detention by oyster reefs: quantifying a keystone ecosystem service. PLoS One 11:e0167694. doi: 10.1371/journal.pone.0167694
Kie, J. G., Matthiopoulos, J., Fieberg, J., Powell, R. A., Cagnacci, F., Mitchell, M. S., et al. (2010). The home-range concept: are traditional estimators still relevant with modern telemetry technology? Philos. Trans. R. Soc. B Biol. Sci. 365, 2221–2231. doi: 10.1098/rstb.2010.0093
Lamont, M., and Iverson, A. (2018). Shared habitat use by juveniles of three sea turtle species. Mar. Ecol. Prog. Ser. 606, 187–200.
Lamont, M. M., Putnam, N. F., Fujisaki, I., and Hart, K. M. (2015). Spatial requirements of different life-stages of the loggerhead turtle (Caretta caretta) from a distinct population segment in the northern Gulf of Mexico. Herpetol. Conserv. Biol. 10, 26–43.
Limpus, C., and Nicholls, N. (2000). “ENSO regulation of indo-pacific green turtle populations,” in Applications of Seasonal Climate Forecasting in Agricultural and Natural Ecosystems. Atmospheric and Oceanographic Sciences Library, Vol. 21, eds G. L. Hammer, N. Nicholls, and C. Mitchell (Dordrecht: Springer), 399–408.
Méndez, D., Cuevas, E., Navarro, J., Gonzalez-Garza, B. I., and Guzman-Herndandez, V. (2013). Rastreo satelital de tortugas blanca hembra Chelonia mydas, y evaluación de sus ámbitos hogareños en la costa norte de la península de Yucatán, México. Rev. Biol. Mar. Oceanogr. 3, 497–509.
Myers, N. (1988). Threatened biotas: “hot spots” in tropical forests. Environmentalist 8, 187–208. doi: 10.1007/bf02240252
Myers, N. (1990). The biodiversity challenge: expanded hot-spots analysis. Environmentalist 10, 243–256. doi: 10.1007/bf02239720
National Marine Fisheries Service and U.S. Fish and Wildlife Service (2008). Recovery Plan for the Northwest Atlantic Population of the Loggerhead Turtle (Caretta caretta), 2nd Edn. Silver Spring, MD: National Marine Fisheries Service and US Fish and Wildlife Service.
National Marine Fisheries Service Southeast Fisheries Science Center (2008). Sea Turtle Research Techniques Manual. NOAA Technical Memorandum NMFSSEFSC-579. Washington, DC: NOAA Technical Memorandum.
National Marine Fisheries Service and U.S. Fish and Wildlife Service (2011). Endangered and threatened species; determination of nine distinct population segments of loggerhead sea turtles as endangered or threatened. Fed. Regist. 76, 58868–58952.
Patterson, T. A., Sharples, R. J., Raymond, B., Welsford, D. C., Andrews-Goff, V., Lea, M. A., et al. (2016). Foraging distribution overlap and marine reserve usage amongst sub-Antarctic predators inferred from a multi-species satellite tagging experiment. Ecol. Indic. 70, 531–544.
Posey, M. H., Alphin, T. D., Banner, S., Vose, F., and Lindberg, W. (1998). Temporal variability, diversity and guild structure of a benthic community in the northeastern gulf of Mexico. Bull. Mar. Sci. 63, 143–155.
R Core Team (2019). R: A Language and Environment for Statistical Computing. Vienna: R Foundation for Statistical Computing.
Rees, A., Alfaro-Shigueto, J., Barata, P., Bjorndal, K., Bolten, A., Bourjea, J., et al. (2016). Are we working towards global research priorities for management and conservation of sea turtles? Endanger. Species Res. 31, 337–382.
Rees, A. F., Carreras, C., Broderick, A. C., Margaritoulis, D., Stringell, T. B., and Godley, B. J. (2017). Linking loggerhead locations: using multiple methods to determine the origin of sea turtles in feeding grounds. Mar. Biol. 164:30. doi: 10.1007/s00227-016-3055-z
Richards, P., Epperly, S., Heppell, S., King, R., Sasso, C., Moncada, F., et al. (2011). Sea turtle population estimates incorporating uncertainty: a new approach applied to western North Atlantic loggerheads Caretta caretta. Endanger. Species Res. 15, 151–158.
Schmid, J. R., and Barichivich, W. J. (2005). Developmental biology and ecology of the Kemp’s ridley sea turtle. Lepidochelys kempii, in the eastern Gulf of Mexico. Chelonian Conserv. Biol. 4, 828–834.
Schofield, G., Bishop, C. M., Katselidis, K. A., Dimopoulos, P., Pantis, J. D., and Hays, G. C. (2009). Microhabitat selection by sea turtles in a dynamic thermal marine environment. J. Anim. Ecol. 78, 14–21. doi: 10.1111/j.1365-2656.2008.01454.x
Schofield, G., Hobson, V. J., Fossette, S., Lilley, M. K. S., Katselidis, K. A., and Hays, G. C. (2010). Fidelity to foraging sites, consistency of migration routes and habitat modulation of home range by sea turtles. Divers. Distrib. 16, 840–853.
Seaman, D. E., and Powell, R. A. (1996). An evaluation of the accuracy of kernel density estimators for home range analysis. Ecology 77, 2075–2085.
Seavey, J. R., Pine, W. E., Frederick, P., Sturmer, L., and Berrigan, M. (2011). Decadal changes in oyster reefs in the big bend of Florida’s Gulf Coast. Ecosphere 2:art114.
Sequeira, A. M. M., Heupel, M. R., Lea, M.-A., Eguiluz, V. M., Duarte, C. M., Meekan, M. G., et al. (2019). The importance of sample size in marine megafauna tagging studies. Ecol. Appl. 29:e01947. doi: 10.1002/eap.1947
Shamblin, B., Bolten, A., Bjorndal, K., Dutton, P., Nielsen, J., Abreu-Grobois, F., et al. (2012). Expanded mitochondrial control region sequences increase resolution of stock structure among North Atlantic loggerhead turtle rookeries. Mar. Ecol. Prog. Ser. 469, 145–160. doi: 10.1371/journal.pone.0085956
Shamblin, B. M., Dodd, M. G., Bagley, D. A., Ehrhart, L. M., Tucker, A. D., Johnson, C., et al. (2011). Genetic structure of the southeastern United States loggerhead turtle nesting aggregation: evidence of additional structure within the peninsular Florida recovery unit. Mar. Biol. 158, 571–587.
Todd, A. C., Morey, S. L., and Chassignet, E. P. (2014). Circulation and cross-shelf transport in the Florida Big Bend. J. Mar. Res. 72, 445–475.
Tucker, A., MacDonald, B., and Seminoff, J. (2014). Foraging site fidelity and stable isotope values of loggerhead turtles tracked in the Gulf of Mexico and northwest Caribbean. Mar. Ecol. Prog. Ser. 502, 267–279.
Tucker, A. D. (2010). Nest site fidelity and clutch frequency of loggerhead turtles are better elucidated by satellite telemetry than by nocturnal tagging efforts: implications for stock estimation. J. Exp. Mar. Bio. Ecol. 383, 48–55.
Turtle Expert Working Group (2009). An Assessment of the Loggerhead Turtle Population in the Western North Atlantic Ocean. NOAA Tech. Memo. NMFS-SEFSC-575. Washington, DC: NOAA Technical Memorandum.
Tyson, R., Nowacek, S., and Nowacek, D. (2011). Community structure and abundance of bottlenose dolphins Tursiops truncatus in coastal waters of the northeast Gulf of Mexico. Mar. Ecol. Prog. Ser. 438, 253–265. doi: 10.1111/j.1365-294X.2009.04413.x
U.S. Fish and Wildlife Service and National Marine Fisheries Service (2013). Endangered and threatened wildlife and plants; designation of critical habitat for the Northwest Atlantic Ocean distinct population segment of the loggerhead sea turtle (Caretta caretta). Fed. Regist. 78, 18000–18081.
Vander Zanden, H. B., Pfaller, J. B., Reich, K. J., Pajuelo, M., Bolten, A. B., Williams, K. L., et al. (2014). Foraging areas differentially affect reproductive output and interpretation of trends in abundance of loggerhead turtles. Mar. Biol. 161, 585–598.
Weber, S. B., Broderick, A. C., Groothuis, T. G. G., Ellick, J., Godley, B. J., and Blount, J. D. (2011). Fine-scale thermal adaptation in a green turtle nesting population. Proc. R. Soc. B Biol. Sci. 279, 1077–1084. doi: 10.1098/rspb.2011.1238
Wessel, P., and Smith, W. H. F. (1996). A global, self-consistent, hierarchical, high-resolution shoreline database. J. Geophys. Res. Solid Earth 101, 8741–8743.
Wildermann, N. E., Sasso, C. R., Stokes, L. W., Snodgrass, D., and Fuentes, M. M. P. B. (2019). Habitat use and behavior of multiple species of marine turtles at a foraging area in the Northeastern Gulf of Mexico. Front. Mar. Sci. 6:155. doi: 10.3389/fmars.2019.00155
Worton, B. J. (1989). Kernel methods for estimating the utilization distribution in home-range studies. Ecology 70, 164–168.
Keywords: Big Bend, foraging areas, home range, loggerhead, state-space modeling
Citation: Hart KM, Lamont MM, Iverson AR and Smith BJ (2020) The Importance of the Northeastern Gulf of Mexico to Foraging Loggerhead Sea Turtles. Front. Mar. Sci. 7:330. doi: 10.3389/fmars.2020.00330
Received: 21 January 2020; Accepted: 21 April 2020;
Published: 15 May 2020.
Edited by:
Alastair Martin Mitri Baylis, South Atlantic Environmental Research Institute, Falkland IslandsReviewed by:
Gail Schofield, Queen Mary University of London, United KingdomGraeme Clive Hays, Deakin University, Australia
Copyright © 2020 Hart, Lamont, Iverson and Smith. This is an open-access article distributed under the terms of the Creative Commons Attribution License (CC BY). The use, distribution or reproduction in other forums is permitted, provided the original author(s) and the copyright owner(s) are credited and that the original publication in this journal is cited, in accordance with accepted academic practice. No use, distribution or reproduction is permitted which does not comply with these terms.
*Correspondence: Kristen M. Hart, kristen_hart@usgs.gov