Current and Future Remote Sensing of Harmful Algal Blooms in the Chesapeake Bay to Support the Shellfish Industry
 Jennifer L. Wolny1*
  Michelle C. Tomlinson2
  Stephanie Schollaert Uz3
  Todd A. Egerton4
  John R. McKay5
  Andrew Meredith6 Kimberly S. Reece7 Gail P. Scott7
  Richard P. Stumpf2
- 1Resource Assessment Service, Maryland Department of Natural Resources, Annapolis, MD, United States
- 2National Centers for Coastal Ocean Science, National Oceanic and Atmospheric Administration, Silver Spring, MD, United States
- 3Earth Science Division, Goddard Space Flight Center, National Aeronautics and Space Administration, Greenbelt, MD, United States
- 4Division of Shellfish Safety, Virginia Department of Health, Norfolk, VA, United States
- 5Water and Science Administration, Maryland Department of the Environment, Annapolis, MD, United States
- 6Consolidated Safety Services, Inc., Fairfax, VA, United States
- 7Aquatic Health Sciences, Virginia Institute of Marine Science, William & Mary, Gloucester Point, VA, United States
Harmful algal bloom (HAB) species in the Chesapeake Bay can negatively impact fish, shellfish, and human health via the production of toxins and the degradation of water quality. Due to the deleterious effects of HAB species on economically and environmentally important resources, such as oyster reef systems, Bay area resource managers are seeking ways to monitor HABs and water quality at large spatial and fine temporal scales. The use of satellite ocean color imagery has proven to be a beneficial tool for resource management in other locations around the world where high-biomass, nearly monospecific HABs occur. However, remotely monitoring HABs in the Chesapeake Bay is complicated by the presence of multiple, often co-occurring, species and optically complex waters. Here we present a summary of common marine and estuarine HAB species found in the Chesapeake Bay, Alexandrium monilatum, Karlodinium veneficum, Margalefidinium polykrikoides, and Prorocentrum minimum, that have been detected from space using multispectral data products from the Ocean and Land Colour Imager (OLCI) sensor on the Sentinel-3 satellites and identified based on in situ phytoplankton data and ecological associations. We review how future hyperspectral instruments will improve discrimination of potentially harmful species from other phytoplankton communities and present a framework in which satellite data products could aid Chesapeake Bay resource managers with monitoring water quality and protecting shellfish resources.
Introduction
The Chesapeake Bay is the largest estuary in the United States. The annual temperature cycle combined with numerous freshwater inputs and the tidal influx of high salinity ocean water makes it a suitable habitat for many juvenile and adult stages of important commercial and recreational fish and shellfish species and one of the country’s most productive estuaries. Maintaining a viable, Bay-wide population of the eastern oyster (Crassostrea virginica) is of particular concern because of its role in supporting ecosystem health (Kennedy et al., 2011; Grabowski et al., 2012) and regional economies (Hicks et al., 2004; Haddaway-Riccio, 2019). Virginia shellfish aquaculture, which produces the most eastern oysters on the United States East Coast, had a farm gate value of $53.3 million in 2018 and is first in the United States for production of hard clams (Mercenaria mercenaria) (Hudson, 2019). Similarly, Maryland’s oyster industry was valued at $10.6 million between 2016 and 2017 (Tarnowski, 2017) and Maryland has modest soft shell (Mya arenaria), stout razor (Tagelus plebeius), and hard clam industries (Roegner and Mann, 1991; Glaspie et al., 2018).
Abundant Chesapeake Bay oyster populations were cataloged in the early 1900s, with approximately 250,000 acres of oyster reefs in both Maryland and Virginia (Mann, 2000). However, beginning in the late 1950s extensive oyster mortality events occurred Bay-wide due to outbreaks of the diseases MSX (Haplosporidium nelsoni) and Dermo (Perkinsus marinus) as drought conditions changed salinity gradients in the Bay and its tributaries (Mann, 2000; Carnegie and Burreson, 2011). While the threat from disease remains (Powell et al., 2012; Tarnowski, 2017), over the past 15–20 years oyster populations have been additionally stressed by reduced water quality and habitat loss (Kemp et al., 2005; Harding et al., 2019) and episodic harmful algal blooms (HABs) (Tango et al., 2005; Glibert et al., 2007; Mulholland et al., 2009; May et al., 2010; Griffith and Gobler, 2020).
Assessment of the state of the health of the Chesapeake Bay includes results from routine water quality and phytoplankton monitoring. Monthly water quality and phytoplankton monitoring throughout the Chesapeake Bay has occurred since the mid-1980s through the auspices of the Chesapeake Bay Program (CBP) (Marshall et al., 2005, 2009) by officials at the Maryland Department of Natural Resources (MDNR), Morgan State University (MSU), Old Dominion University (ODU) and the Virginia Department of Environmental Quality (VDEQ). Currently, the phytoplankton community at 32 stations in the Chesapeake Bay and its tributaries is monitored monthly from above pycnocline or from whole water column composited samples1. Surface water samples collected routinely throughout the Bay and its tributaries are also examined for phytoplankton community composition as part of monitoring and research programs at MDNR, ODU, the Virginia Department of Health (VDH), and the Virginia Institute of Marine Science (VIMS). In Maryland, Chesapeake Bay shellfish harvesting areas are monitored by the Maryland Department of Environment (MDE) for water quality and bacteria concentrations. In Virginia these activities are conducted by VDH. The state agencies responsible for shellfish health and safety regularly monitor for fecal coliforms at 800 sites in Maryland and 2,500 sites in Virginia for the purpose of classifying shellfish growing areas for wild harvest and aquaculture in the Bay and estuarine portion of its tributaries. This routine sampling is based off guidelines provided in the National Shellfish Sanitation Program (NSSP) in which a systematic random sampling strategy is used to visit shellfish sites six to twelve times per year (National Shellfish Sanitation Program [NSSP], 2017). Additionally, in accordance with NSSP guidelines, each state has a marine biotoxin contingency plan to facilitate response and monitoring strategies in the event of a toxigenic HAB outbreak and/or human illness.
Phytoplankton data collected via the CBP between 1984 and 2004 indicated a phytoplankton community dominated by diatoms throughout the year with periodic dinoflagellate blooms (Kemp et al., 2005; Marshall et al., 2005, 2009). In 2002, a bloom of the dinoflagellate Dinophysis acuminata in the Potomac River and its sub-estuaries at concentrations > 200,000 cells⋅L–1 caused the first and only precautionary closure of Chesapeake Bay shellfish harvesting areas due to a toxigenic algal species (Marshall et al., 2004; Tango et al., 2004). This precautionary closure of regional oyster harvesting areas in the Potomac River was issued while water samples and oyster tissues were assayed for the presence of okadaic acid (OA), a diarrhetic shellfish poisoning (DSP) toxin produced by many Dinophysis species. Marshall and Egerton (2009a, b), Li et al. (2015), and Wolny et al. (2020) have summarized common marine and estuarine HAB species in Bay waters that have historically been present but are increasing in abundance and extent: Alexandrium monilatum, Dinophysis acuminata, Karlodinium veneficum, Margalefidinium polykrikoides, and Prorocentrum minimum. Each of these bloom-forming dinoflagellate species have different harmful or toxic properties that can negatively impact larval oyster development and recruitment and cause physiological stress in adult oysters or threaten human health due to toxin accumulation in shellfish harvested for consumption. Additionally, Chesapeake Bay populations of A. monilatum and M. polykrikoides have been shown to produce cysts, a resting stage that ensures long-term survival and can seed future blooms (Seaborn and Marshall, 2008; Pease, 2016; Van Hauwaert, 2016).
Both Marshall and Egerton (2009b) and Li et al. (2015) reported that HABs occur more frequently in the mesohaline and polyhaline regions of the tributaries and the Bay shoreline than in the mainstem of the Chesapeake. These are the same geographic regions that are conducive to productive oyster reefs (Smith et al., 2005; Carnegie and Burreson, 2011). In the mid-2000s, meetings and surveys conducted jointly with government officials and shellfish growers from Maryland and Virginia identified several needs of the shellfish industry. One of the most critical needs identified was the establishment and maintenance of good water quality specific to the shellfish species being grown (Oesterling and Luckenbach, 2008; Webster, 2009). Growers also identified a need for technology that would detect blooms more rapidly in order to better assess human health risks and respond if there was a need to conduct shellfish relays between aquaculture sites (Webster, 2009; Sea Grant Association [SGA], 2016). Incorporating satellite technology to improve monitoring for HAB communities was outlined as a priority by the Interstate Shellfish Sanitation Commission (Interstate Shellfish Sanitation Commission [ISSC], 2016). Shellfish industry members want government agencies to provide timely information about water quality and HABs from remote sensing, yet challenges remain (Schaeffer et al., 2013; National Aeronautics and Space Administration Goddard Space Flight Center [NASA GSFC], 2018, 2019; Schollaert Uz et al., 2019). However, the need for near-real time and high-resolution water quality and HAB data is expected to grow as the shellfish industry is projected to increase in economic value and geographic expanse into the next decade in both Maryland (Kobell, 2017) and Virginia (Hudson, 2019).
While the sampling approaches currently used by state agencies appear to be historically successful, and no biotoxin-related human illnesses resulting from shellfish consumption have been reported from either state, the scale and variability of algal blooms exceeds what is fully captured by the states’ phytoplankton, water quality, and shellfish health monitoring programs. HAB species can remain cryptic in the environment, blooms can initiate and intensify over the course of days or weeks, and may occur in areas that are not routinely monitored by state agencies (Anderson et al., 2012). Bloom patterns also respond to regional climatic variations (Miller and Harding, 2007; Morse et al., 2014). Hence, state officials could augment current monitoring systems with greater spatial and temporal coverage from satellites. During blooms, a timely view from space could guide resource manager sampling strategies and help inform the decision-making process that safeguard natural resources, shellfish industry assets, and the public. Satellite data can also be used to fill data gaps when routine in situ monitoring plans are seriously interrupted, such as during the COVID-19 outbreak that disrupted the United States workforce beginning in March 2020.
Over the past decade, satellite ocean color imagery has proven to be a useful tool to identify and track HABs globally (Stumpf and Tomlinson, 2005; Davidson et al., 2016). In the United States, several optical techniques pertaining to absorption, backscatter, and chlorophyll-a (chl-a) anomalies have been used for the detection of the toxic dinoflagellate Karenia brevis in the Gulf of Mexico (Tomlinson et al., 2004, 2009; Cannizzaro et al., 2008; Soto et al., 2015). Currently, shellfish resource managers in Florida incorporate satellite data products produced by the National Oceanic and Atmospheric Administration (NOAA) and the National Atmospheric and Space Administration (NASA) into their decision-making processes when monitoring for K. brevis blooms (Heil, 2009). In California, a joint academic and government monitoring program, the California-Harmful Algae Risk Mapping (C-HARM) System, incorporates ecological models, Moderate Resolution Imaging Spectroradiometer (MODIS) remote sensing reflectance (Rrs) ratios and chl-a data to better inform coastal resource managers about Pseudo-nitzschia blooms and domoic acid toxicity risks (Anderson et al., 2011, 2016). A spectral shape algorithm that identifies the unique spectral signature of cyanobacteria is being used to forecast Microcystis aeruginosa blooms in Lake Erie, as well as to monitor cyanobacteria blooms in other large lakes around the United States (Wynne et al., 2010, 2013; Schaeffer et al., 2015; Clark et al., 2017). The Ohio Environmental Protection Agency has incorporated the use of this cyanobacteria-specific satellite data product into the monitoring plan for the state’s public drinking water supply (Ohio Environmental Protection Agency [Ohio EPA], 2019).
The suitability of similar data products for the Chesapeake Bay region is still being investigated as both a research application and a monitoring tool. New hyperspectral sensors currently being studied, designed, and built for satellites will change the way we monitor water quality from space with increased spectral, temporal, and spatial resolution. The NASA Plankton, Aerosol, Cloud, ocean Ecosystem (PACE) mission, scheduled to launch by 2023, will fly the Ocean Color Imager (OCI) with a spatial resolution of 1 km, 1–2 days global repeat, spanning 340 to 890 nm with a spectral resolution (bandwidth) of 5 nm, plus seven short-wave infrared bands at wider spectral resolution. The OCI instrument performance specifications for water-leaving reflectances constrain the errors, i.e., 350–400 nm at 20% uncertainty; 400–600 nm at 5% uncertainty; 600–710 nm at 10% uncertainty (Werdell et al., 2019). This sensitivity will enable PACE to improve the identification of phytoplankton community composition and to separate phytoplankton pigment absorption from that of colored dissolved organic matter (CDOM) (Blough and Del Vecchio, 2002; Catlett and Siegel, 2018). Furthermore, the spectral slope of CDOM absorption will provide an indication of its terrestrial or aquatic source (Siegel et al., 2002, 2005). Less sensitive, the Geostationary Littoral Imaging and Monitoring Radiometer (GLIMR) instrument will be delivered to NASA in 2023/2024 and launched into geosynchronous orbit above the Gulf of Mexico and southeastern United States, including the Chesapeake Bay, with the potential for up to seven observations per day at 300 m spatial resolution, 350–890 nm spectral resolution at less than 10 nm, plus one near-infrared band at 1020 nm (National Aeronautics and Space Administration [NASA], 2019). A NASA Surface Biology and Geology observable platform recommended in the 2017 Decadal Survey (National Academies of Sciences, Engineering, and Medicine [NASEM], 2018) for studying coastal and inland aquatic ecosystems worldwide, among other variables, is currently in architecture study with a potential launch around 2027 and is likely to have PACE-like spectral range and sensitivity with higher spatial resolution (tens of meters) but less frequent revisit (16-day). Combining these new observations with others from sub-orbital and in situ sensors through assimilation and modeling will help overcome limitations, such as cloud gaps.
In advance of the expanded capability afforded by these future hyperspectral missions, we examined the suitability of existing multispectral satellite ocean color products, particularly from the Ocean Land Colour Instrument (OLCI) on the Copernicus Sentinel-3 satellite constellation, to detect the spatial and temporal extent of several HAB species common to the Chesapeake Bay. OLCI currently has the most spectral bands of any satellite-based routine monitoring sensor, as well as nearly daily coverage, making it the best sensor for timely response and for evaluation of capabilities that will only be enhanced with the hyperspectral data products that are anticipated after 2022. Red-edge algorithms, which use the strong spectral variability in chlorophyll and reflectance from 650 to 750 nm, have been developed with OLCI. Some algorithms, such as the Maximum Chlorophyll Index (MCI) of Gower et al. (2008) and the Red Band Difference (RBD) of Amin et al. (2009), do not require a full atmospheric correction and have also been designed specifically to locate algal blooms. As red-edge bands are much less sensitive to interference by non-algal pigments (dissolved or particulate), they can provide more specific information on algal blooms. However, scattering by sediments may still interfere with algorithms like the MCI (Zeng and Binding, 2019), a potential problem in an estuary, such as Chesapeake Bay, with large tributary rivers and multiple turbidity maxima. The RBD was designed to detect chl-a fluorescence in a harmful algal bloom (K. brevis) without interference from sediment (Amin et al., 2009). This method, applied to OLCI data, provides a HAB monitoring tool for resource managers supporting aquaculture in the Chesapeake Bay. Here, we present some preliminary work that shows the use of multispectral OLCI data from the Sentinel-3 satellite constellation to detect HABs in Chesapeake Bay and we propose how model development and hyperspectral data will improve bloom detection.
Materials and Methods
Satellite Product Generation
Imagery from OLCI on the Sentinel-3 satellites covering Chesapeake Bay (36–39°N, 75–77°W) were obtained from EUMETSAT. OLCI has 300 m pixels, which provide useful information for the Chesapeake Bay and its tributaries. The level 1 granules were processed using the NOAA satellite automated processing system, which incorporates the NASA standard ocean color satellite processing software distributed within the Sea-viewing Wide Field-of-view Sensor (SeaWiFS) Data Analysis System (SeaDAS) package (version 7.5.3) and the European Space Agency’s (ESA) Sentinel Application Platform (SNAP) package (version 6). The Rrs and top-of-atmosphere reflectance (Rrhos) products corrected for molecular scattering (Rayleigh) and absorption were created for the visible and near-infrared bands using SeaDAS l2gen with the system defaults except for cloud, stray light, and high light masking disabled. Products were mapped to a Universal Transverse Mercator (zone 18N) projection at 300 m pixel resolution to produce level 3 multi-band GeoTiffs. Multiple granules overlapping the area of interest from the same day were composited based on time of swath.
During product generation from the level 3 files, a custom flagging algorithm was applied to identify clouds, glint, mixed pixels, and snow and ice (Wynne et al., 2018). Clouds were flagged using NIR albedo, with the threshold adjusted for the presence of turbid water. For atmospheric correction, we used Rrs determined from Rrhos with a fixed maritime aerosol (Stumpf and Pennock, 1989, after Gordon et al., 1983). With dense, highly reflective biomass and the optically complex water of Chesapeake Bay, the standard (complex) coastal atmospheric corrections often lead to areas of negative or anomalous Rrs fields. As a result, algorithms that require accurate Rrs of the water, such as the neural network algorithms available for Sentinel-3, perform inconsistently or can fail.
The typical ocean color algorithms developed for open ocean waters use blue and green spectral bands to determine chl-a concentration. These algorithms confuse CDOM and sediment as chlorophyll, which can lead to high rates of false positive bloom detections. Chl-a fluorescence in the red has been shown to be useful in detecting dense blooms of K. brevis, providing a way to avoid high CDOM conditions (Hu et al., 2005; Amin et al., 2009). While some fluorescence algorithms also respond to sediment, the RBD fluorescence algorithm described in Amin et al. (2009) is insensitive to interference from sediment, making it a particularly useful detection method in Chesapeake Bay, which frequently has strong sediment/turbidity gradients near areas of dense blooms. The RBD was modified for OLCI Rrhos bands as:
to highlight areas of high algal biomass, using only pixels within the valid Rrhos range (0–1). The differencing method is a variant of a derivative, which produces an implicit atmospheric correction over this short (16 nm) difference in wavelength (Philpot, 1991). Due to the increase in reflectance caused by chl-a fluorescence at 681 nm, the RBD will be positive in areas of chl-a fluorescence.
The Cyanobacteria Index (CI), an algorithm developed by Wynne et al. (2008), identifies blooms that combine strong scattering and chl-a absorption with weak chl-a fluorescence – optical characteristics of cyanobacterial blooms (Stumpf et al., 2016). The CI has also proven useful in identifying weakly fluorescing algae within the Chesapeake Bay (detailed in Wynne et al., 2018). To summarize, the spectral shape around 681 nm [SS(681)] product, later renamed the Cyanobacteria Index by Wynne et al. (2010), was developed for Lake Erie using Medium Resolution Imaging Spectrometer (MERIS) data to detect large monospecific blooms of cyanobacteria, primarily M. aeruginosa. Cyanobacteria typically show negligible chl-a fluorescence at 681 nm, so the CI captures the chl-a absorption peak, which also occurs around 681 nm. The CI is calculated based on a spectral shape (SS) around 681 nm using the following equation:
Where ρλ is the Rrhos measured at wavelength λ, and subscripts 1 = 665 nm, 2 = 681 nm, and 3 = 709 nm, and values less than zero are assumed to be non-detect and linearly related to the biomass (Lunetta et al., 2015). While the CI was developed for blooms of cyanobacteria in Lake Erie, it will detect strongly scattering and weakly fluorescing algae (Stumpf et al., 2016). As such it can be applied to areas with more complex phytoplankton assemblages, such as Chesapeake Bay, to look for potential physiological (fluorescence) differences in the algal blooms, even where there are no reported occurrences of cyanobacteria.
In situ Data
Phytoplankton and water quality data collected between 2016 and 2018 through the CBP were downloaded from https://datahub.chesapeakebay.net/ and sorted for cell concentrations of A. monilatum, K. veneficum, M. polykrikoides, and P. minimum. Cell concentration data collected at the same station location, on the same date, and at sampling depths ≤ 1.0 m were selected for satellite ocean color imagery match ups. Additional phytoplankton and water quality observations collected between 2016 and 2020 as part of Maryland2 and Virginia3 routine environmental monitoring and HAB event response activities were also included to increase the spatial and temporal distribution of in situ cell concentration data. Data retrieval parameters for these data were the same as described above for the CBP data. The phytoplankton cell concentration data retrieved from the CBP, MDNR, and VDH data portals are comparable as the sample processing methods between these agencies are similar. Phytoplankton samples (0.5–1 L) were preserved with a 5% Lugol’s iodine solution. A known sample volume was allowed to settle in a settling chamber for a minimum of 60 min before species were identified and enumerated using an inverted light microscope, following the modified Utermöhl method of Marshall and Alden (1990). Species identifications were based on morphological characteristics (see Tomas, 1997), enumerated as individual cells per volume, and then extrapolated to a per L concentration.
In situ phytoplankton cell concentration data determined using light microscopy were augmented with cell concentration data obtained through quantitative PCR (qPCR) assays. For each sample a known volume of water, 25–100 ml, was filtered through a 3 μm Isopore membrane filter (Millipore Corp., Darmstadt, Germany) using sterile technique for DNA extraction and PCR analysis. Filters were placed into 5 ml centrifuge tubes and frozen at −20°C until DNA extraction. DNA was extracted from the filters using the QIAamp Fast Stool Mini Kit (QIAGEN, Inc., Germantown, MD, United States) according to the manufacturer’s protocol with the following modifications. Rather than centrifuging the sample and using only 200 μL of the lysate, per the manufacturer’s instructions, the entire sample was retained and carried through the extraction protocol. Reagent volumes were increased in the subsequent steps to maintain a ratio of sample to reagent consistent with that in the manufacturer’s protocol. The eluted DNA was stored at −20°C until needed. A “blank” extraction (reagents only) was performed alongside each set of environmental samples to ensure there was no contamination.
A previously published TaqMan® qPCR assay was used to target A. monilatum (see Vandersea et al., 2017). We developed a new TaqMan qPCR assay to target M. polykrikoides. The M. polykrikoides primers are MpolyLSU_703F (5′-TCTTTCCGACCCGTCTTGAA-3′) and MpolyLSU_875R (5′-CCATCTTTCGGGTCCTAGCA-3′). The probe is MpolyLSU 828Pr (5′FAM -TTGCGAGACGTTTGAGTGTG-3′ MGBNFQ). Stock cultures of York River A. monilatum and M. polykrikoides were maintained at VIMS. The cell concentration of A. monilatum and M. polykrikoides cultures were determined and DNA was extracted from a known number of cells to use as positive control material and to generate standard curves by serially diluting the DNA to achieve a range of cell number equivalents. The qPCR assays were done on 7500 Fast, QuantStudio 6, or QuantStudio 3 Real-Time PCR systems (Applied Biosystems, Thermo Fisher, Foster City, CA, United States) using the following cycling parameters: an initial denaturation step at 95°C for 20 s followed by 40 cycles of 95°C for 3 s to denature and 60°C for 30 s to anneal and extend. All reactions were run in duplicate with reagent concentrations for each reaction at 0.9 μM for each primer, 0.1 μM for the probe, and 1X of the TaqMan Fast Advanced Master Mix (Applied Biosystems, Thermo Fisher) in a 10 μL final volume.
Satellite Imagery Comparison With in situ Data
In situ field data were used to perform same day pixel extractions from imagery at bloom sample locations. Cell concentration data > 50,000 cells⋅L–1 [the limit of detection for Gulf of Mexico K. brevis blooms via legacy satellites (Tester et al., 1998)] were compared with same day Sentinel-3 scenes. The mean Rrhos spectra from the level 3 OLCI satellite data products within a 3 pixel × 3 pixel window centered on the location of each field sample were extracted and plotted for each wavelength, by individual species (Figure 1). Match ups containing invalid pixels (e.g., cloud, land, and mixed pixels) were excluded. Separate spectral plots from the match up data were created for A. monilatum, K. veneficum, M. polykrikoides, and P. minimum.
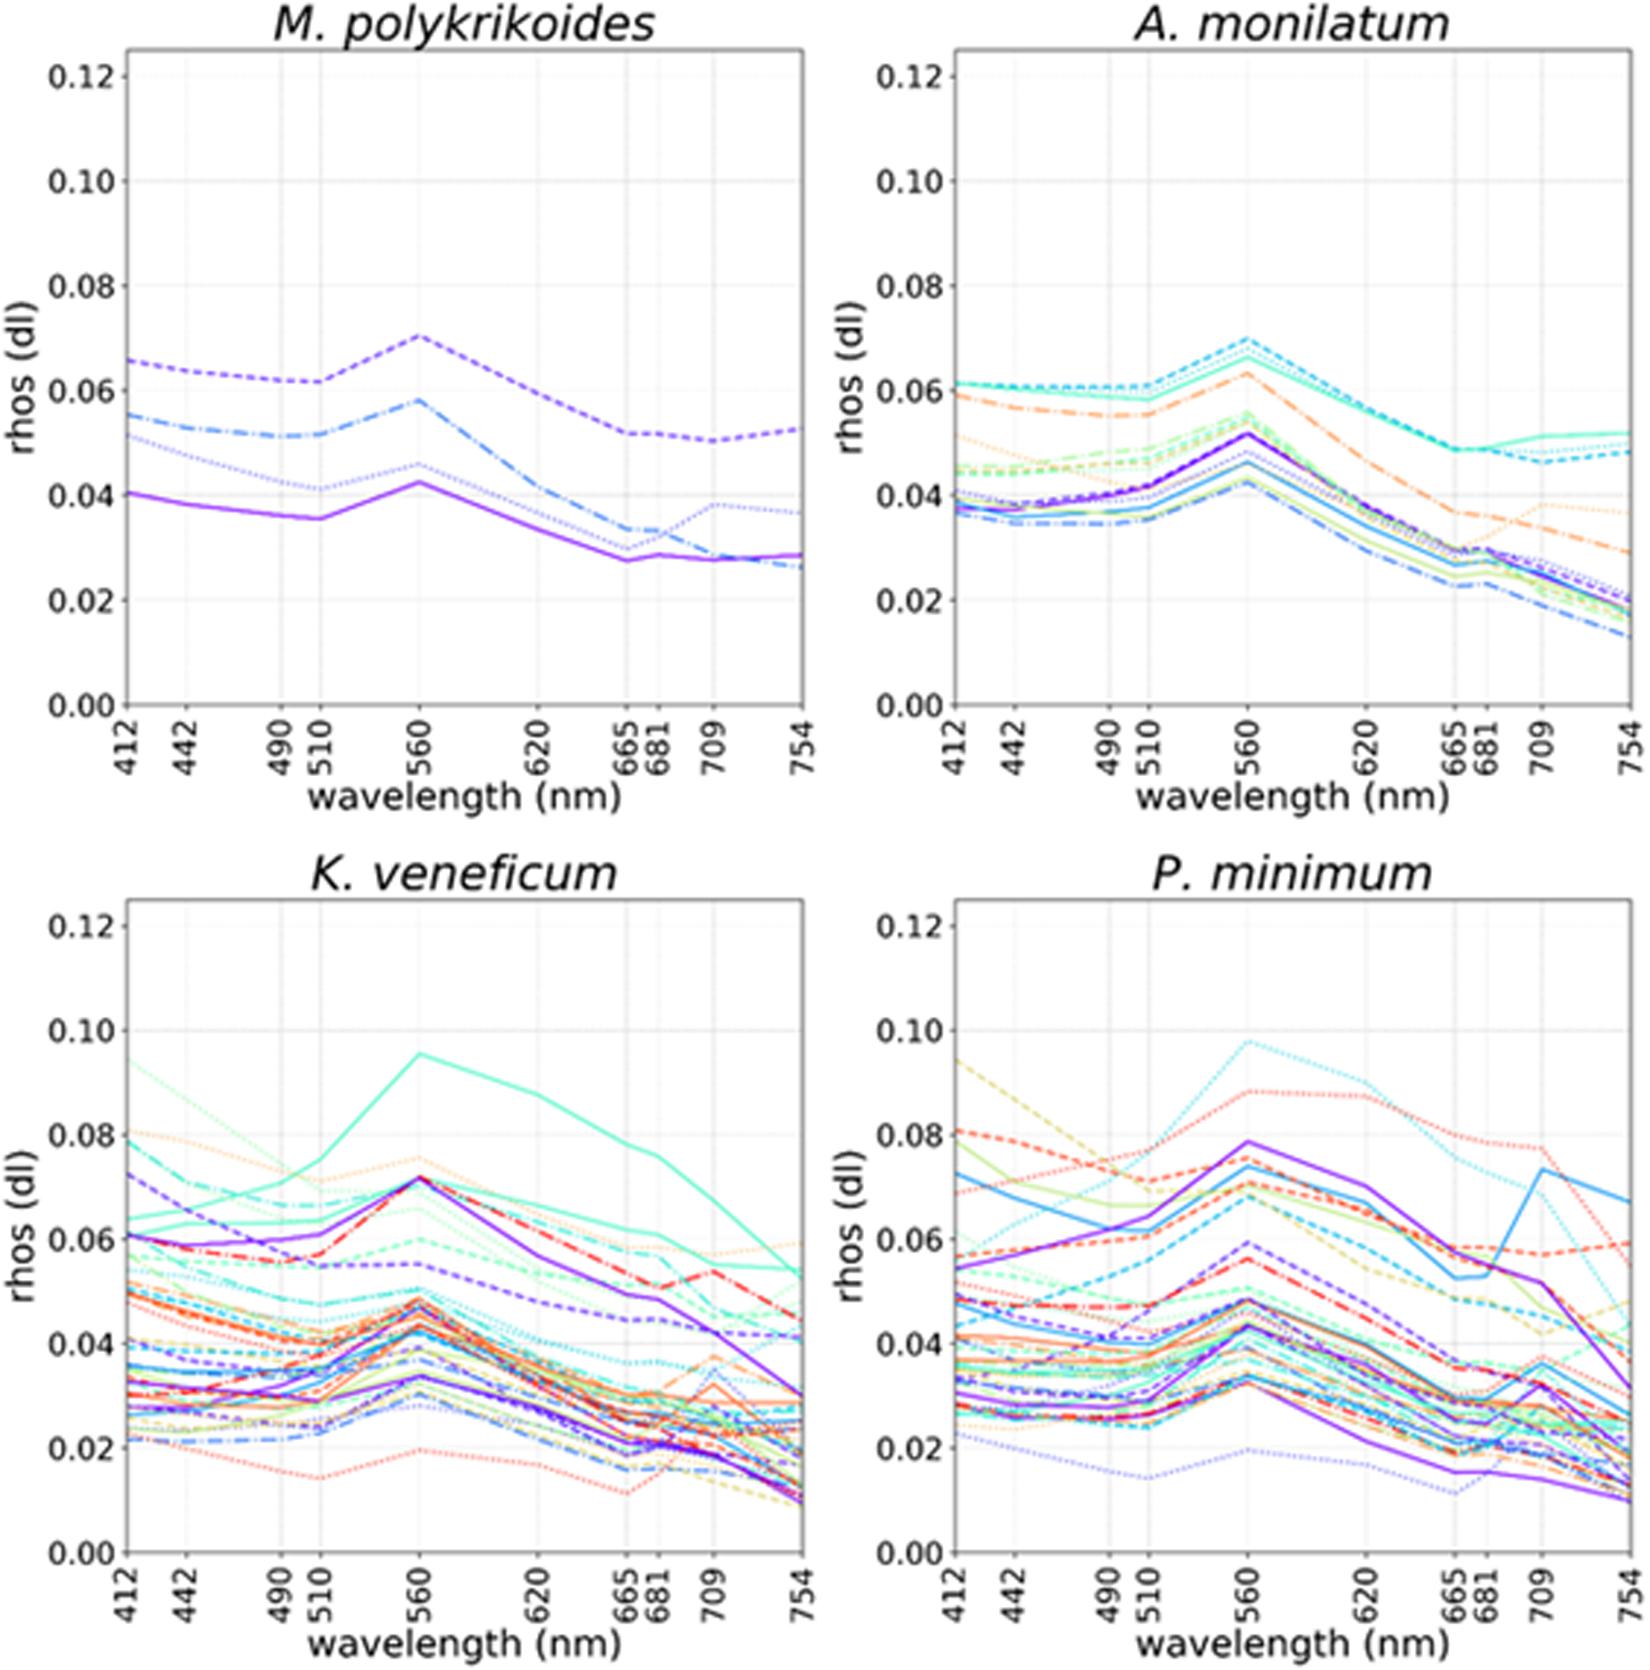
Figure 1. Ocean and Land Colour Imager (OLCI) Rrhos spectral plots coinciding with locations of in situ cell concentrations > 50,000 cells L–1 collected on the same day for Margelefidinium polykrikoides (top left), Alexandrium monilatum (top right), Karlodinium veneficum (bottom left), and Prorocentrum minimum (bottom right). Colored lines and random linestyles were used for better separation of individual spectra.
Results and Discussion
While the analysis of historic phytoplankton datasets indicates a phytoplankton community dominated by diatoms, the Chesapeake Bay can experience blooms dominated by the dinoflagellates A. monilatum, K. veneficum, M. polykrikoides, and P. minimum, throughout the year. Each of these species have unique harmful or toxic properties which are of concern for the region’s shellfish industry. Due to the optical complexity of Chesapeake Bay waters, remote sensing has not previously been used extensively to detect and track these blooms for resource management applications. However, the 2016 launch of the Copernicus Sentinel-3 constellation of satellites that are flying the OLCI sensor has given us the opportunity to investigate the possibility of monitoring these species in the Chesapeake Bay using multispectral ocean color satellite data. We speculate how the hyperspectral assets expected after 2022, through the launch of several new NASA satellites, will improve our ability to monitor blooms and will increase the data available to couple ocean color satellite imagery, water quality, and ecological associations.
Alexandrium monilatum and Margalefidinium polykrikoides
Margalefidinium polykrikoides (formerly Cochlodinium polykrikoides and C. heterolobatum) blooms have been reported in the York River, Virginia since the 1960s (Mackiernan, 1968). Since the 1990s there has been an increase in bloom occurrence and intensity throughout Virginia waters (Marshall, 1996; Marshall et al., 2005) with a geographic expansion of the blooms from the York River, primarily southwards to the James River (Marshall and Egerton, 2009a), and to a lesser degree northwards to the Rappahannock River (Marshall and Egerton, 2009b). Globally, M. polykrikoides blooms upward of 106 cells⋅L–1 generally occur when the water temperature is >20°C and when the salinity ranges from 30–33 (Kudela et al., 2008; Kudela and Gobler, 2012). However, in the Chesapeake Bay these blooms occur at lower salinities (21–28) (Mulholland et al., 2009). Mulholland et al. (2009) documented that M. polykrikoides blooms caused mortalities in both juvenile oysters and fish exposed to live cells. Tang and Gobler (2009) demonstrated that cell toxicity was tied to bloom stage, with the early exponential growth phase being more toxic than late exponential growth or stationary phases. More recently Griffith et al. (2019) showed, using juvenile oysters, hard clams, and bay scallops (Argopecten irradians) contained in bags on grow-out rafts, that shellfish position within the water column impacts animal susceptibility to M. polykrikoides blooms. In their study, animals in surface waters had higher mortality rates than those at depth and reduced growth rates were exhibited in animals exposed to M. polykrikoides blooms, regardless of position in the water column, thus having implications for aquaculture management in regions where M. polykrikoides blooms are common (Griffith et al., 2019). The timing of M. polykrikoides blooms often coincide with the region’s maximum water temperatures (July–September) and blooms intensify after strong rain events during drought conditions (Mulholland et al., 2009). These are climatic scenarios predicted to increase in frequency within the Chesapeake Bay region (Najjar et al., 2010; Reidmiller et al., 2018); Mulholland et al. (2009) and Griffith and Gobler (2016) hypothesize that this shift could cause a longer and more toxic M. polykrikoides bloom season that would overlap with the shellfish larval recruitment and growing season within Chesapeake Bay.
In 2007, A. monilatum blooms were first reported in the York River (Harding et al., 2009; Marshall and Egerton, 2009b). Since 2007, A. monilatum has bloomed nearly annually in the late summer, typically co-occurring with or following M. polykrikoides blooms, when water temperatures are >24°C and the salinity is 18–24 (Mulholland et al., 2018). Blooms have been measured at concentrations > 108 cells⋅L–1 and have intensified and expanded from the York River basin southwards to the Hampton Roads area and Virginia Beach coastline (Pease, 2016; Robison, 2019). The 2007 bloom in the lower York River was responsible for a veined rapa whelk (Rapana venosa) mortality event wherein whelk tissues tested positive for elevated concentrations of the hemolytic and neurotoxic toxin goniodomin A, produced by A. monilatum (Harding et al., 2009). Subsequent laboratory experiments conducted by May et al. (2010) indicated that adult oysters exposed to A. monilatum cells and cell extracts had decreased clearance rates and reduced valve gapes, which influences the animals’ pumping rate. In studies focusing on larval oysters May et al. (2010) demonstrated that animals were not affected by the presence of A. monilatum cells, but that larval mortality rates increased when exposed to A. monilatum cell extracts that contained extracellular toxins. Through field and laboratory studies, Pease (2016) found that extended exposure (>96 h) to both A. monilatum cells and cell extracts caused erosion to gill and mantle tissues in 94% of adult oysters and led to a 67% mortality rate.
Alexandrium monilatum and M. polykrikoides bloom in the same geographic regions of the lower Chesapeake Bay and at similar times of the year. While these blooms are detectable by satellite imagery through the RBD algorithm (Figures 2A,B), they cannot be distinguished from each other with existing satellite ocean color data products alone (Figure 1). In situ monitoring by state agencies is needed to confirm species identification. Currently, by applying the RBD algorithm to Sentinel-3 image products, NOAA officials are able to alert resource managers to the presence of a high biomass phytoplankton bloom in these areas. With the addition of space-based hyperspectral sensors in the future, we hope to develop the capability to further differentiate these blooms. From a resource management perspective, knowing which dinoflagellate species is blooming, where it is blooming, and the duration of blooms for each species would be useful to shellfish industry partners who may be able to mitigate damage to shellfish crops by adjusting spat planting schedules, conducting shellfish relays, adjusting crop position in the water column, or avoiding moving shellfish crops or gear from areas with blooms to areas without blooms to limit the spread of HAB cells or cysts.
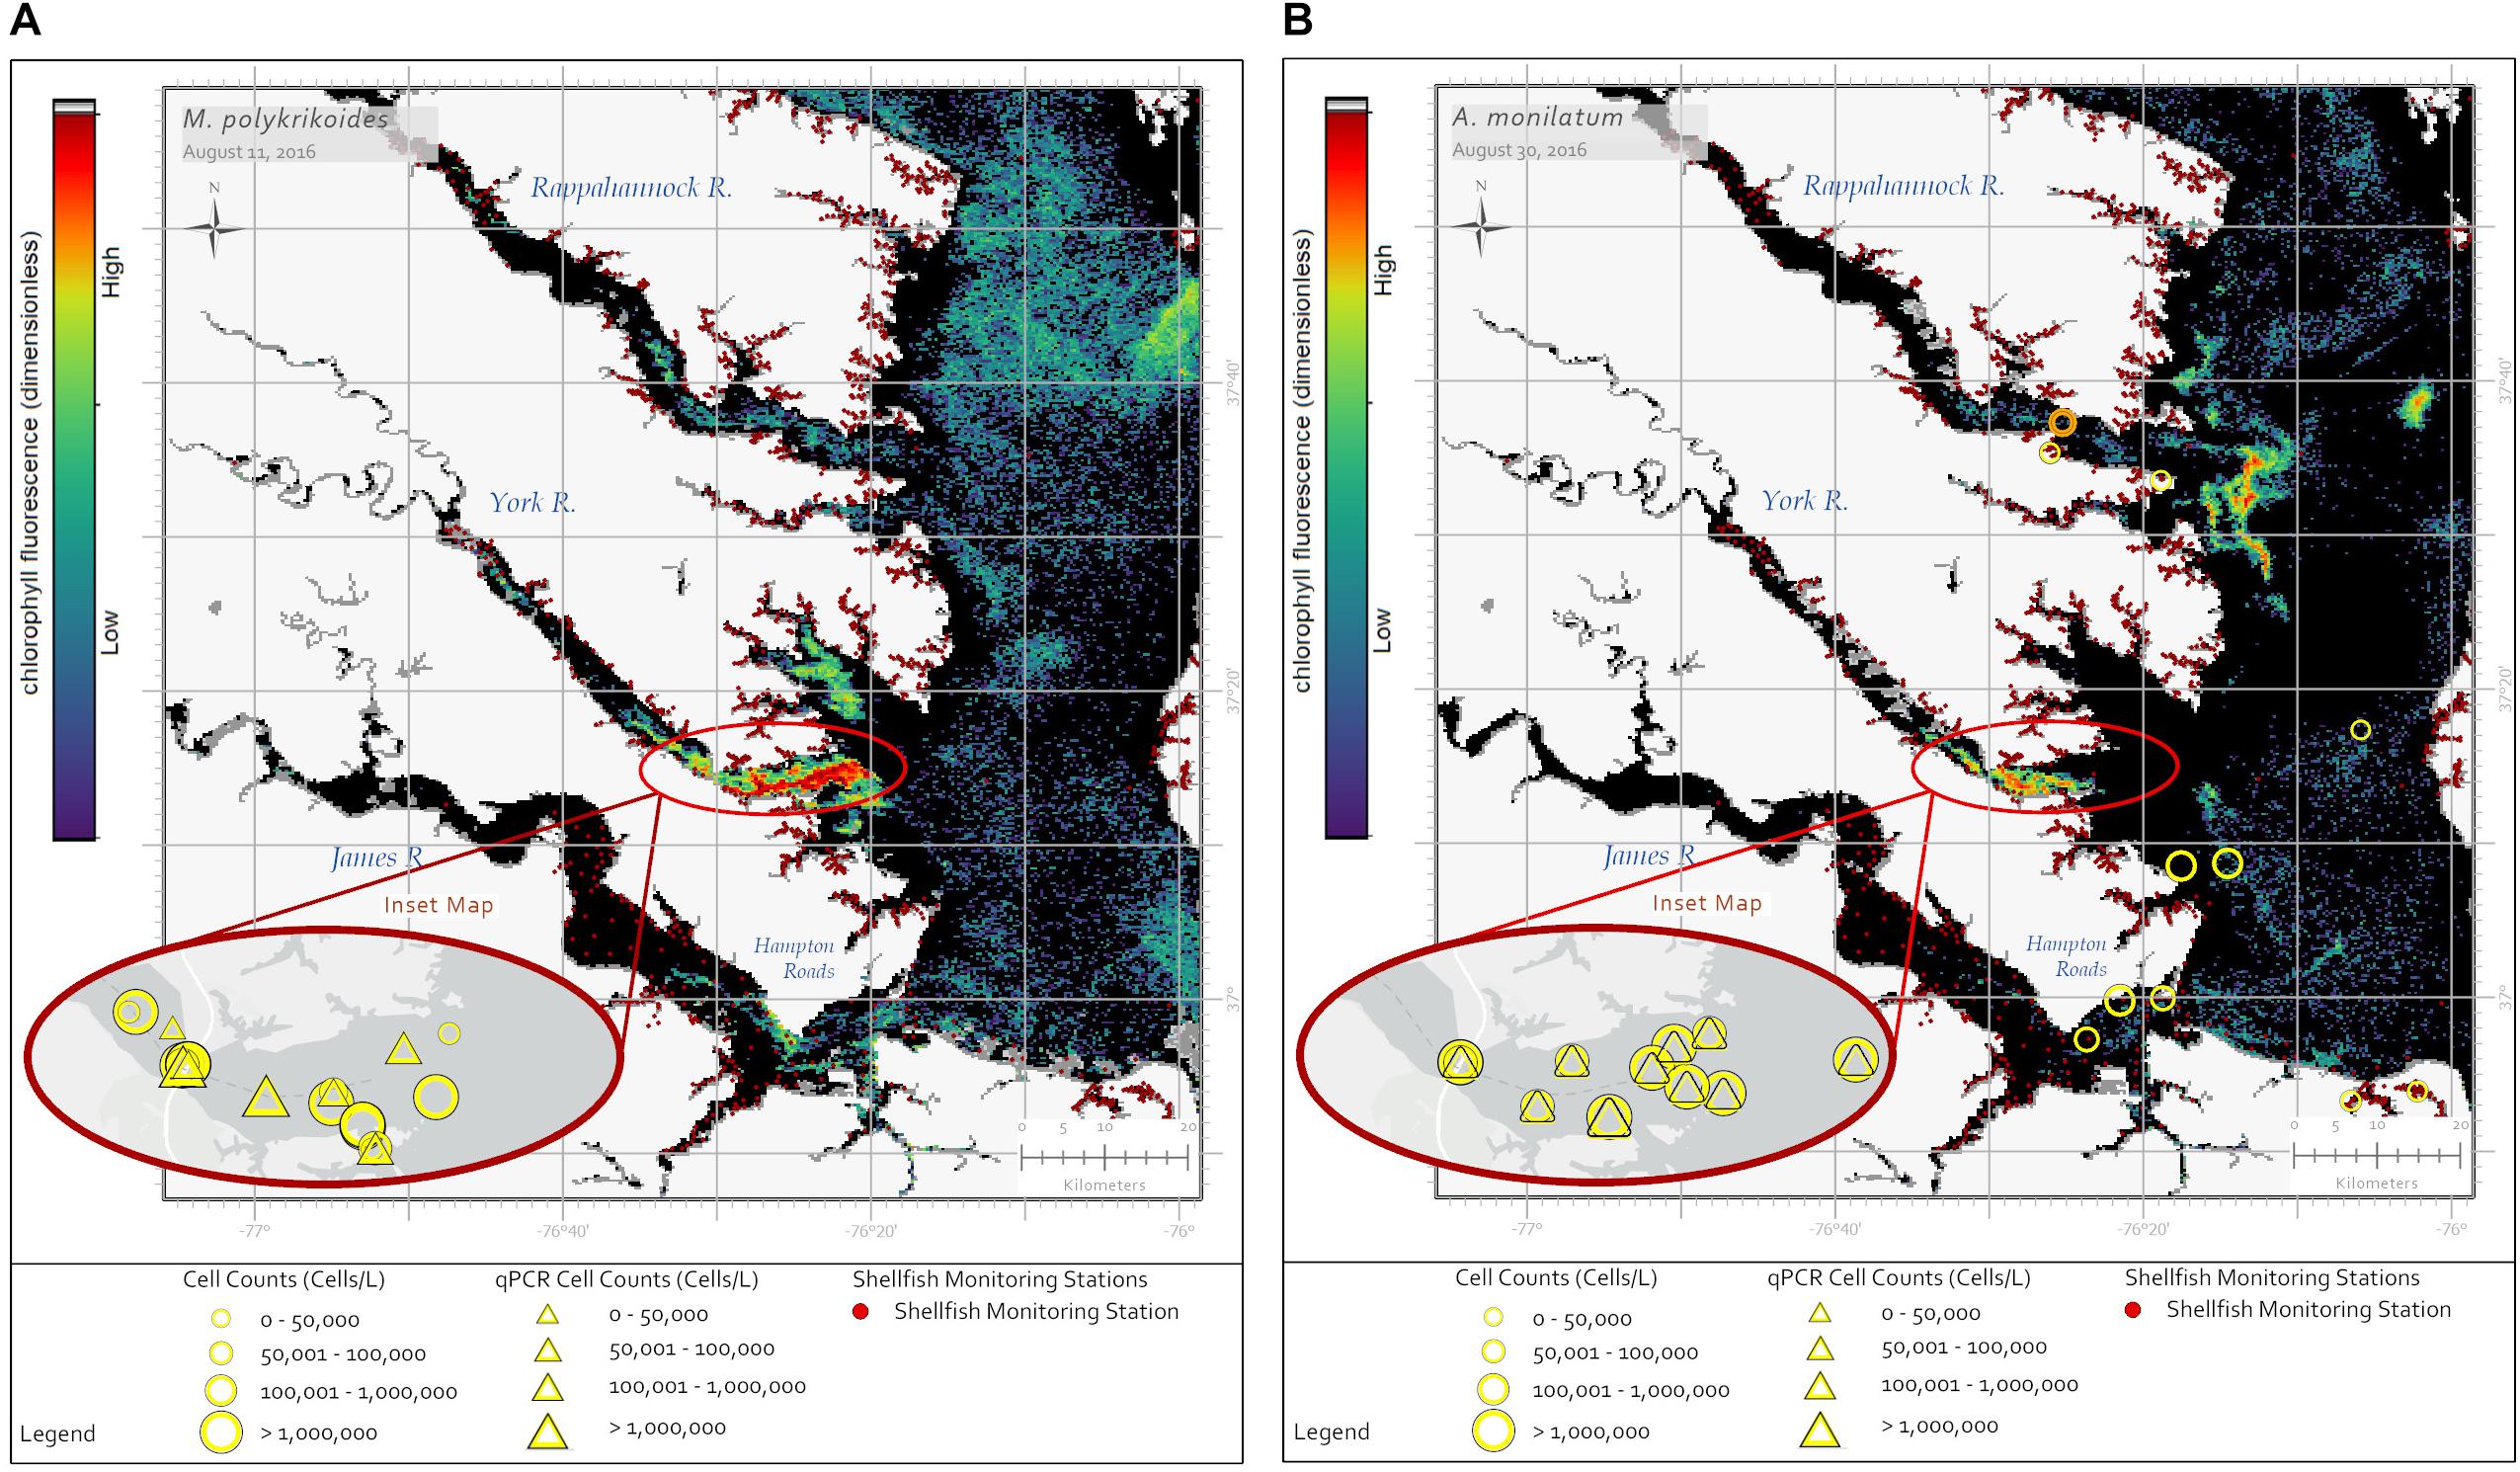
Figure 2. Sentinel-3a OLCI images with RBD algorithm captured two dinoflagellate blooms in late summer 2016. (A) The image from August 11, 2016 shows a bloom of M. polykrikoides in the southern Chesapeake Bay with a concentrated bloom patch off the York River. Yellow circles show in situ cell concentration data obtained using light microscopy for water samples collected August 11–15, 2016. Yellow triangles represent cell concentrations measured using qPCR for the same date range. (B) The image from August 30, 2016 shows a bloom of A. monilatum in the Rappahannock, York, and James Rivers. Yellow circles show in situ cell concentration data obtained using light microscopy for water samples collected August 28 – September 02, 2016. Yellow triangles represent cell concentrations measured using qPCR for the same date range. Data from September 09, 2016 (orange circle) indicate A. monilatum was confirmed in the Rappahannock River a week later. Black pixels indicate no bloom detected. Yellow symbol size represents cell concentration ranges for in situ data. The dark red dots indicate shellfish growing area classification locations.
Karlodinium veneficum
Discolored water caused by a bloom of K. veneficum (reported as Gyrodinium galatheanum) was first noted in the Chesapeake Bay in 1994 (Li et al., 2000). In 1996, a striped bass (Morone spp.) mortality event was caused by this same organism (reported as Karlodinium micrum) in an aquaculture facility on the Bay’s eastern coast (Deeds et al., 2002). This mixotrophic dinoflagellate was identified (as Gymnodinium estuariale and Gyrodinium estuariale) in the Chesapeake Bay phytoplankton community in the late 1970s by Marshall (1980) and Chrost and Faust (1983); however, annual blooms were not reported until the mid-2000s (Marshall et al., 2005; Place et al., 2012). Since the mid-2000s there has been an increase in bloom occurrence and intensity, though fish kills remain sporadic as K. veneficum toxicity seems to be regulated by a series of environmental conditions such as increased CO2 concentrations and P-limitation (Fu et al., 2010), water column stratification that alters salinity and nutrient flow regimes (Hall et al., 2008), and the abundance and nutritional status of cryptophyte prey (Adolf et al., 2008; Lin et al., 2017). Since first being documented in the mainstem of the Chesapeake Bay and in the Tangier Sound region of the Bay’s eastern coast, K. veneficum has been found as far north as the Bush River in Maryland and as far south as the western branch of the Elizabeth River in Virginia. While K. veneficum cells can be found year-round in waters with temperatures of 7–28°C and salinities of 3–29, blooms with cell concentrations > 5 × 10⁵ cells⋅L–1 typically occur between May and September (Glibert et al., 2007; Li et al., 2015), though more recently blooms also have been detected in Maryland waters in winter months (November–December) (J. Wolny, unpublished data).
Karlodinium veneficum produces strong ichthyotoxic and hemolytic compounds, called karlotoxins, that disrupt osmoregulatory processes across gill tissues and lead to acute fish kills, as well as cause deformations in shellfish larvae that impact larval development, dispersal, and recruitment (Deeds et al., 2006; Glibert et al., 2007). Thus, K. veneficum blooms pose a risk to both finfish and shellfish populations, but are not a risk to human health (Place et al., 2012, 2014). Deeds et al. (2002, 2006) showed that larval, juvenile, and adult stages of various finfish species are all susceptible to the effects of karlotoxin. Pre-bloom concentrations as low as 6.2 × 10⁴ cells⋅L–1 increased immune system stress responses in adult blue mussels (Mytilus edulis) indicating that exposure to background concentrations of K. veneficum may negatively impact shellfish health before blooms occur (Galimany et al., 2008). Brownlee et al. (2008) showed that oyster spat exposed to K. veneficum cells at a concentration of 107 cells⋅L–1 had depressed growth rates and reduced organ development. Glibert et al. (2007) and Lin et al. (2017) demonstrated that oyster spawning and the early life stages of oysters are very susceptible (as shown through larval deformation and mortality > 80%) to K. veneficum cells and to karlotoxin exposure at concentrations of 107 cells⋅L–1 and that the nutritional status of the cryptophyte prey plays a role in K. veneficum toxicity. Because the risk to finfish and shellfish can be severe and acute at both high (>107 cells⋅L–1) and low (105 cells⋅L–1) K. veneficum cell densities, monitoring schemes that identify temperature and salinity fronts, assess nutrient concentrations, and cryptophyte abundance may be more critical than monitoring for K. veneficum cell concentrations alone if toxin risks are to be forecasted or mitigated for the aquaculture industry.
Currently, K. veneficum blooms are identified by resource managers as fish kills occur and are reported to state agencies. However, recent blooms of K. veneficum have been identified through remote sensing using both the RBD (fluorescence) (Figure 3A) and CI (weakly fluorescing) algorithms (Figure 3B). While this result appears contradictory and OLCI spectra from K. veneficum blooms are inconsistent in the red bands (Figure 1), it may be explained by a few simple hypotheses. The detection of bloom presence with the RBD algorithm indicates some chl-a fluorescence, as the radiance returned at 681 nm is greater than that returned from 665 nm, even though 681 nm also includes strong chl-a absorption. Near-surface blooms reflect the red-edge, 709 nm band, strongly. A weakly fluorescing bloom would combine a slight increase in 681 nm with a large increase at 709 nm, leading to identification with the CI algorithm.
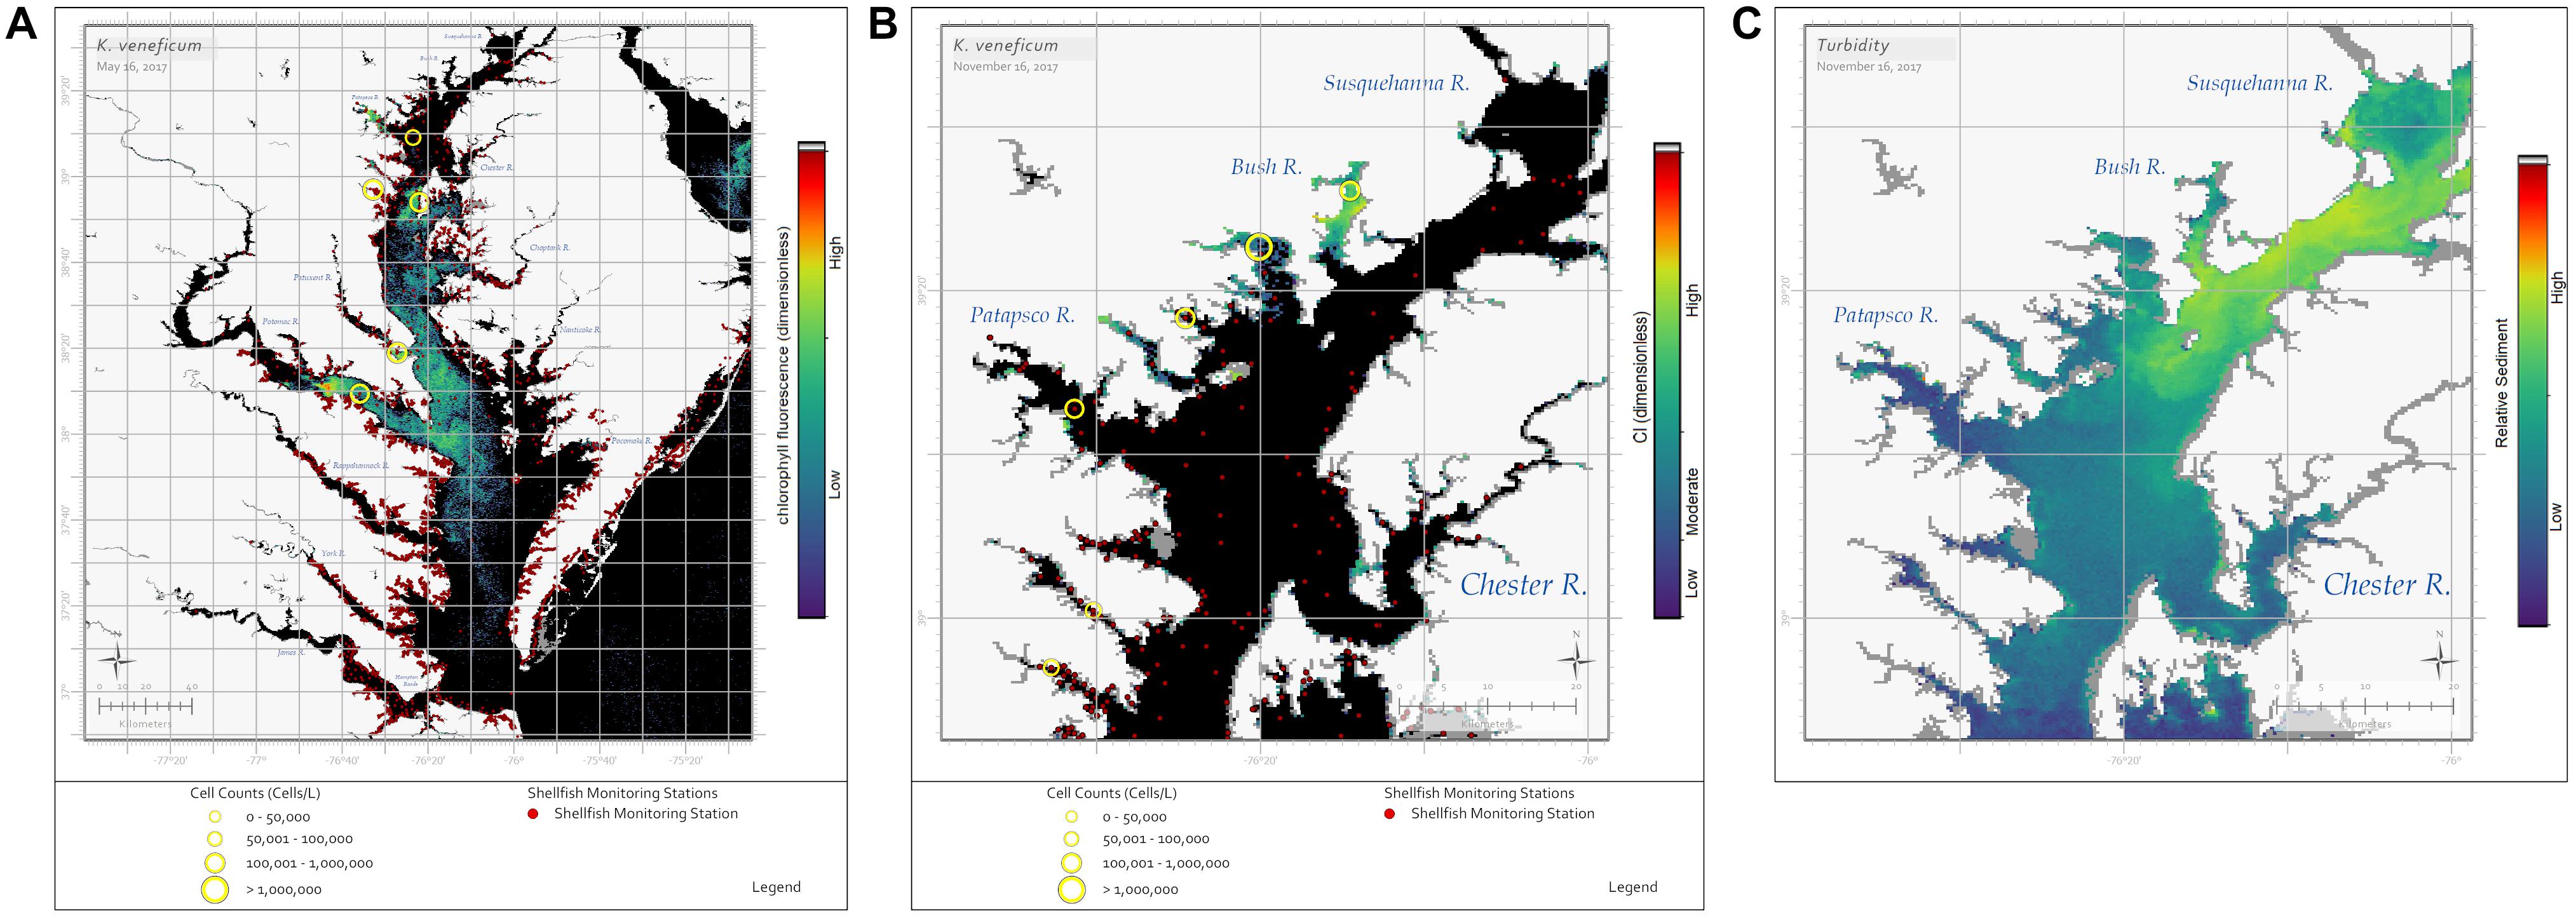
Figure 3. Sentinel-3a OLCI images showing blooms of the dinoflagellate K. veneficum. (A) The RBD algorithm captured a bloom on May 16, 2017 throughout the Maryland portion of the Chesapeake Bay. Yellow circles indicate in situ cell concentrations determined using light microscopy for water samples collected on the same day, with symbol size representing cell concentration ranges. (B) The CI algorithm captured a bloom on November 16, 2017 in the Bush River, Maryland. Yellow circles indicate in situ cell concentrations determined using light microscopy for water samples collected November 13–16, 2017, with symbol size representing cell concentration ranges. K. veneficum cells in the Bush River bloom were documented to be actively feeding on cryptophyte prey. (C) The Rrs(665 nm) image from November 16, 2017 shows a sediment plume from the Susquehanna River, with warmer colors indicating higher sediment concentrations. Black pixels indicate no bloom detected. The dark red dots on (A,B) indicate shellfish growing area classification locations.
Why might this occur with K. veneficum blooms? Field and laboratory studies need to be conducted with K. veneficum specifically, but Dower and Lucas (1993) and Gasol et al. (2016) suggested that photosynthetic irradiance measurements could provide information about spatial and temporal variability in light-dependent phytoplankton reactions. This information would aid in explaining the factors influencing the variability, including regionality and seasonality in environmental or growth conditions. Accordingly, at least four hypotheses could be considered when examining K. veneficum blooms with RBD and CI algorithms: heterotrophy vs. autotrophy, turbidity, seasonal light availability, and/or nutrient availability. K. veneficum blooms only fluoresce when cells are photosynthesizing and their optical characteristics change to a high-biomass, non-fluorescing algae under heterotrophic conditions. However, we cannot dismiss ecological considerations; K. veneficum blooms occur in high turbidity areas within Chesapeake Bay tributaries and may not receive enough light to emit excess photons as fluorescence. For example, on November 16, 2017 OLCI imagery showed a sediment plume [as shown by Rrs(665 nm)] from the Susquehanna River impacting the Bay’s northwestern tributaries where the CI algorithm more accurately identified K. veneficum blooms (Figures 3B,C). Similarly, time of year could also be a factor due to light availability (low light near the winter solstice). Figure 3A shows an example where K. veneficum appears to be detected using the RBD algorithm in mid-spring (May); however, the CI algorithm was more useful in detecting it in late fall (November) when Karlodinium cells were documented to be actively feeding on cryptophytes (Figure 3B). Finally, the concentration and availability of nutrients may influence how K. veneficum cells respond to light. Gameiro et al. (2011) demonstrated that increased water column turbidity led to increased photosynthetic efficiency and low light-saturation photosynthetic rates in algal cells. Vonshak et al. (2000) showed an increase in photosynthetic efficiency when cultured algal cells were grown mixotrophically as opposed to phototrophically. Similarly, Skovgaard et al. (2000) showed that when the prey of the dinoflagellate Fragilidium subglobosum is abundant most of the carbon uptake occurs through mixotrophic feeding, not photosynthesis, even when photosynthetic irradiance is at sufficient levels. In a laboratory study with phototrophically grown K. veneficum cultures, Cui et al. (2017) showed that the capacity to dissipate excess light energy was correlated with phosphorus concentrations; in Chesapeake Bay the availability of phosphorus varies seasonally (Li et al., 2017). If the cells’ feeding state is a factor, it may be possible to use the visualization of the bloom with the RBD or CI algorithm to estimate high or low toxicity risks as K. veneficum is known to be more toxic when in a heterotrophic state (Adolf et al., 2008, 2009; Place et al., 2012).
Prorocentrum minimum
In his summary of 30 years of phytoplankton data, Marshall (1996) reported P. minimum as the most common dinoflagellate in the Chesapeake Bay. Reports of P. minimum blooms within Bay and tributary waters date back to the 1960s (Mackiernan, 1968). In a more recent analysis using Chesapeake Bay Program data, Li et al. (2015) determined that in the 1990s an average of 13 P. minimum blooms (cell concentrations ≥ 108 cells⋅L–1) were reported annually and in the 2000s this number increased to 23 blooms annually. While P. minimum is found throughout the year in the Bay and its tributaries when water temperatures are between 6–28°C and 5–14 salinity, blooms occur most frequently April through June when waters are between 13–19°C and 6–10 salinity (Marshall and Egerton, 2009a; Li et al., 2015). Recently, high biomass blooms (108 cells⋅L–1) of P. minimum were documented in the Maryland portion of the Bay from December 2017 to January 2018 and again in December 2019 to January 2020 (Figure 4). Both Tango et al. (2005) and Marshall and Egerton (2009a) reported that the cell concentrations of P. minimum blooms were considerably greater in the 2000s (107–108 cells⋅L–1) than in the 1980s and 1990s (106 cells⋅L–1) and that temporally extensive blooms contributed to degraded water quality conditions, especially with regards to dissolved oxygen concentrations, which lead to finfish and shellfish mortalities and the loss of submerged aquatic vegetation due to decreased water clarity.
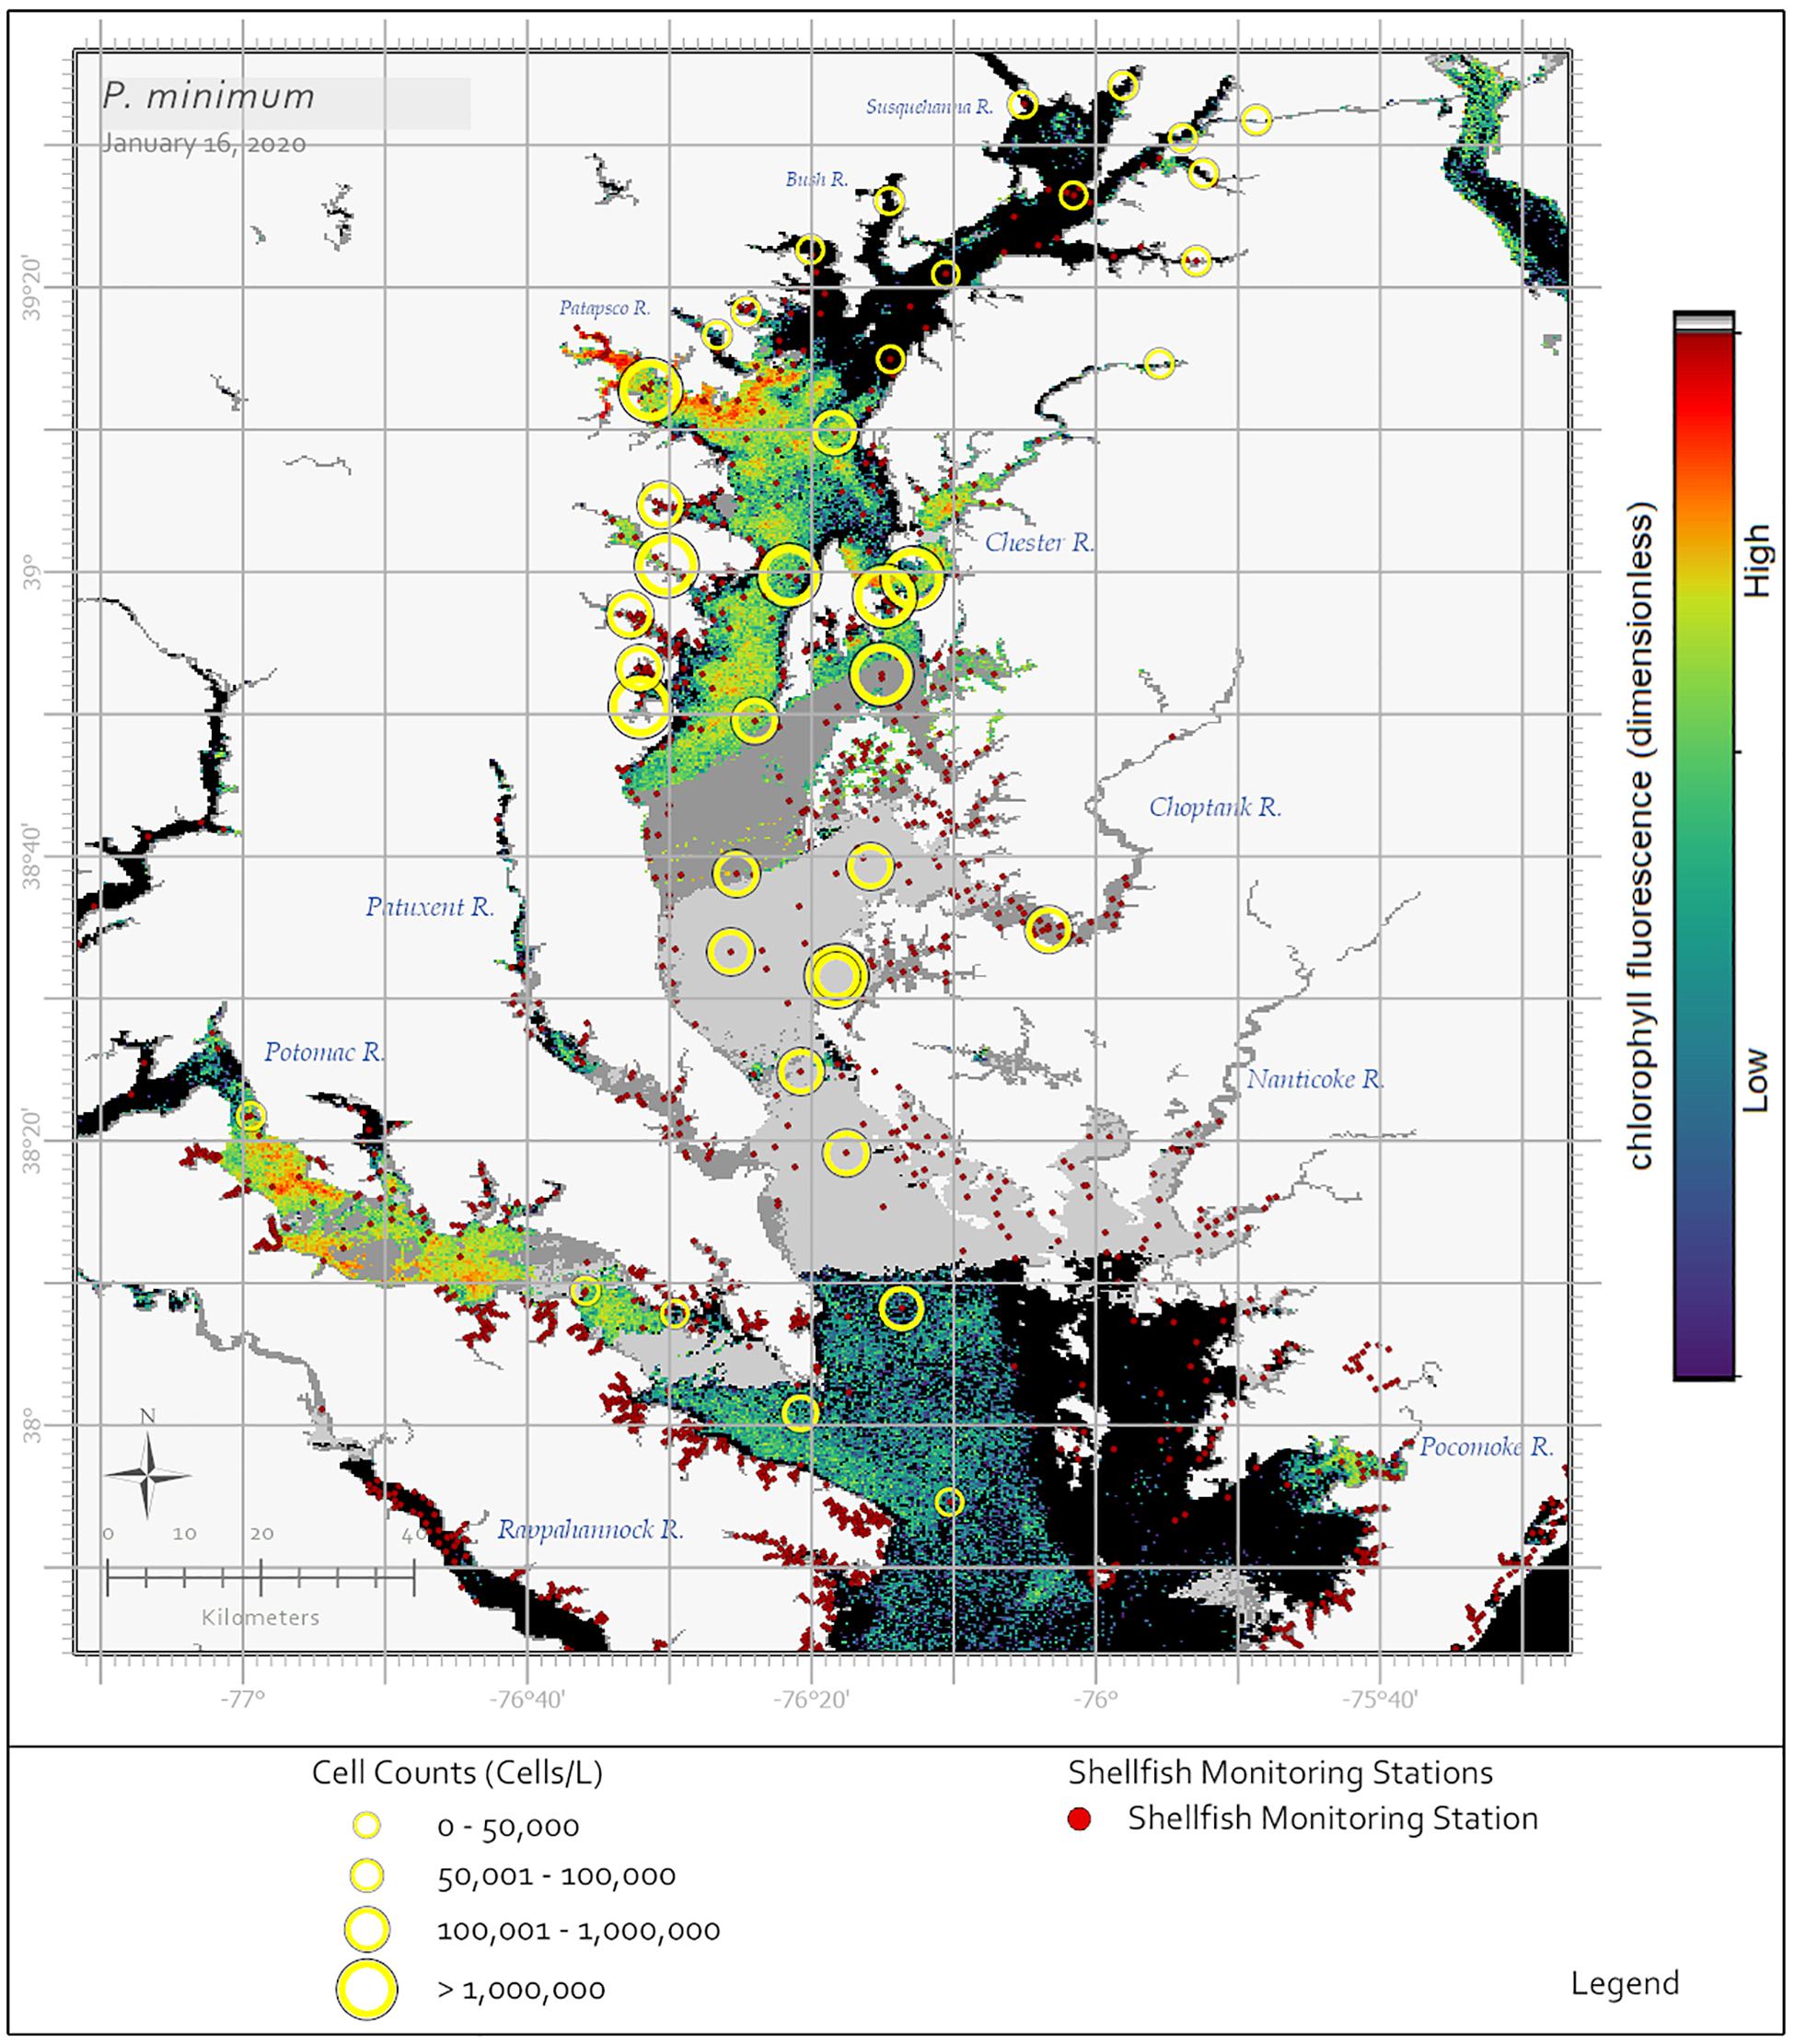
Figure 4. Sentinel-3a OLCI image with RBD algorithm captured on January 16, 2020 showing a bloom of the dinoflagellate P. minimum throughout the Maryland portion of the Chesapeake Bay. In situ data indicated a widespread P. minimum bloom, however, the satellite ocean color data collected during this time were limited by cloud cover. Yellow circles indicate cell concentrations determined using light microscopy for samples collected January 13–16, 2020, with symbol size representing cell concentration ranges. Medium and dark gray pixels represent no retrievals due to clouds. Black pixels indicate no bloom detected. The dark red dots indicate shellfish growing area classification locations.
In short-term (2–3 days) laboratory exposure experiments, embryonic, juvenile, and adult oysters exposed to P. minimum concentrations ≤ 107 cells⋅L–1 did not exhibit any negative impacts to growth or survival (Stoecker et al., 2008). Similarly, Brownlee et al. (2005, 2008) found that growth rates of oyster spat were comparable between P. minimum and a commercial hatchery food mix in both laboratory and field settings. However, Glibert et al. (2007) reported that at a cell concentration of 107 cells⋅L–1 P. minimum caused the mortality of days-old oysters after a 48 h exposure and reduced motility after 2-week-old oysters were exposed for 72 h. Tango et al. (2005) reported that a week-long P. minimum bloom in the lower Potomac River caused the mortality of 78% of juvenile oysters at an aquaculture facility. The different effects of P. minimum on shellfish has been hypothesized to be the result of the growth stage of the bloom, with blooms in decline to be more detrimental than those exponentially growing (Wikfors, 2005). If the stage of the bloom is as critical as monitoring for cell concentrations, then future remote sensing assets that offer greater spectral, temporal, and spatial coverage should aid the monitoring of P. minimum blooms within the framework of safeguarding aquaculture interests. As dinoflagellates tend to produce ultraviolet photo-protective mycosporine-like amino acids (MAAs), UV remote sensing from instruments like OCI on PACE may help in distinguishing these blooms and associated physiological effects (Korbee et al., 2010; Carreto et al., 2018).
Future Remote Sensing Strategies
In addition to distinguishing HABs that have unique spectral signatures, it may be possible to detect indicators of harmful species through other means, such as the unique optical signatures of prey and associated environmental monitoring. For example, multiple species within the heterotrophic genus Dinophysis have been reported in the lower Chesapeake Bay since the late 1970s (Marshall, 1980, 1982). Dinophysis can produce OA and/or dinophysistoxins (DTXs), all of which contribute to DSP, a human illness consisting of severe vomiting, diarrhea, and abdominal pain shortly after the consumption of contaminated shellfish (Barceloux, 2008). The region’s first D. acuminata bloom and precautionary shellfish harvesting area closure occurred in 2002 (Marshall et al., 2004; Tango et al., 2004). Dinophysis can be toxic at cell concentrations well below the limit of detection by satellite sensors (e.g., 200 cells⋅L–1 for Dinophysis fortii; Yasumoto et al., 1985). To date, the toxicity of Dinophysis spp. in Maryland and Virginia waters appears to be minimal compared to other regions (Wolny et al., 2020). However, there recently has been a precedent for blooms of these species to intensify in cell concentration and toxicity in New York and New England waters (Hattenrath-Lehmann et al., 2013, 2015; J. Deeds, unpublished data). This elevated human health risk necessitates a more robust monitoring system.
The use of ocean color imagery to visualize Dinophysis blooms directly for resource management applications is unlikely as these species can be highly toxic at low cell densities. The detection of D. acuminata within the phytoplankton community at the low concentrations it is typically found in the Chesapeake Bay region (average of 403 cells⋅L–1; Wolny et al., 2020), may be aided by using its prey items as a proxy. Dinophysis prey, the ciliate Mesodinium rubrum which feeds on cryptophytes, has unique bio-optical properties (Guzmán et al., 2016) and can co-occur with Dinophysis in thin layers within the water column (González-Gil et al., 2010; Sjöqvist and Lindholm, 2011) or can form distinctive surface features (Dierssen et al., 2015; Guzmán et al., 2016). Because M. rubrum is found in Chesapeake Bay waters year-round (Johnson et al., 2013) detection of M. rubrum blooms with satellite imagery would have to be coupled with regionally tuned ecological models that characterize both the Dinophysis and Mesodinium population patterns observed in this region. Using the ecological patterns of M. rubrum blooms as predictive guidelines for Dinophysis ovum blooms has proven successful along the Texas coast (Harred and Campbell, 2014). Over the past two decades artificial neural networks, hydrodynamic and lagrangian models, as well as satellite-derived sea surface temperature (SST) data has been used to predict blooms of Dinophysis along the European Atlantic coast (Velo-Suárez and Gutiérrez-Estrada, 2007; Reguera et al., 2014; Díaz et al., 2016; Moita et al., 2016; Ruiz-Villarreal et al., 2016). Dierssen et al. (2015) demonstrated the successful use of the Hyperspectral Imager for the Coastal Ocean (HICO) that flew aboard the International Space Station from 2009 to 2014 to detect a bloom of M. rubrum in Long Island Sound, NY. The successful exploitation of future hyperspectral satellite missions to distinguish a HAB, such as Dinophysis, from above a background community in the optically complex Chesapeake Bay and to differentiate M. rubrum and cryptophytes from other phytoplankton constituents, will require a combination of efforts and many in situ observations for validation. Finer-scale oceanographic observations available through a combination of future satellite platforms may aid in the development of similar systems for the Chesapeake Bay that have proven beneficial in other waters.
Summary
We have outlined emerging optical remote sensing techniques being used to identify the most common marine and estuarine HABs in the Chesapeake Bay. Although challenges remain, the methodology continues to improve with the implementation of new technology and the incorporation of ecological data either gathered from long-standing data archives (i.e., Chesapeake Bay Program, 2019) or in real-time (i.e., radiometry) as blooms occur. Utilizing remote sensing to its maximum potential is of increased importance as more frequent, potentially toxic blooms are projected to occur at the same time that the region’s shellfish aquaculture industry is growing. Additionally, the state agencies that manage these resources need to increase their efficiencies in order to monitor these systems more often with fewer assets and funding. The launch of orbiting and geostationary satellites with hyperspectral sensors after 2022 could further enhance our ability to distinguish blooms and improve upon these efforts. The HAB detection and monitoring systems developed for the optically complex Chesapeake Bay have the potential to provide a framework for monitoring HABs in other bodies of water with mixed harmful algae assemblages, elevated turbidity, and frequent sediment plumes.
The preliminary use of the RBD algorithm to help guide state agencies in detecting and monitoring dinoflagellate blooms in the Chesapeake Bay has been presented here. Our cursory examination of other algorithms in the red-edge portion of the electromagnetic spectrum, such as the Algal Bloom Index (ABI; Hu and Feng, 2016), which is another algorithm that includes fluorescence, and Maximum Peak Height (MPH) chlorophyll (Matthews and Odermatt, 2015) indicates that RBD is more useful at delineating these blooms when they are fluorescing. The RBD, as a fluorescence algorithm, requires algae to fluoresce to be detected, so false negatives are possible for blooms that are not fluorescing. Additionally, while the RBD algorithm is successful in detecting large biomass blooms, mismatches between in situ data and satellite imagery have occurred (e.g., within the August 2016 A. monilatum bloom, Figure 2B). This is also visible in the variability in the slope between 665 and 681 nm in Figure 1, indicative of the RBD algorithm. Patchiness of these dinoflagellate blooms (Mackiernan, 1968; Marshall and Egerton, 2009a; Mulholland et al., 2009) or sub-pixel variability, coupled with tidal flow and the difference between the time of in situ data collection and satellite overpass may be causing these discrepancies. More work will need to be done to determine the frequency of these mismatches in shellfish aquaculture areas. Numerous studies have shown the utility and statistical rigor of determining cell concentrations using qPCR compared to other visual detection methods for the HAB species presented here (e.g., Handy et al., 2008; Eckford-Soper and Daugbjerg, 2015; Lee et al., 2017; Vandersea et al., 2017). Our preliminary assessment of A. monilatum and M. polykrikoides in situ cell concentrations collected using both qPCR and light microscopy versus relative cell abundance determined from pixel retrievals shows promise for the algorithms under development. This review highlights current uses of the RBD algorithm for fluorescing algal blooms in the Chesapeake Bay. A more rigorous analysis is underway to determine the success of the method for not only detecting, but for quantifying these HABs.
Higher spatial resolution can be of value in smaller tributaries. The Multispectral Imager (MSI) on the Sentinel-2 satellites has some red-edge bands, with 20 m pixels and 5-day repeat but is potentially glint-limited in summer, when the majority of Chesapeake Bay HABs occur. Landsat-8, while having 30 m pixels, has only 16-day repeat, and only one red band, greatly limiting its value for monitoring blooms. The MSI does not have a band at the chl-a fluorescence peak, but other red-edge algorithms have been applied to the MSI data. Algorithms, such as the ratio of 704–665 nm (Gilerson et al., 2010) and a form of the MCI from Gower et al. (2008), can be applied to Sentinel-2/MSI data and have the potential for identifying high biomass blooms in Chesapeake Bay. Gernez et al. (2017) demonstrated how satellite data could be used to monitor shellfish health through a unique application of suspended particulate matter and chl-a algorithms to Sentinel-2 imagery. The resulting model allowed the effects of tide-driven dynamics on oyster feeding rates to be examined in Bourgneuf Bay, along the French Atlantic coast. Further validation studies of these various approaches and the utility of higher spatial resolution (20 m) Sentinel-2 products are warranted to provide increased monitoring into narrower portions of Chesapeake Bay tributaries where aquaculture operations often occur. A key question for future research will be to determine the minimum algal cell concentrations that can be detected with these different algorithms.
The CI algorithm has also been proposed as a way to detect weakly fluorescing blooms, which occasionally occur in Chesapeake Bay estuarine waters. A more rigorous validation to determine accuracy in detection and a detailed comparison with these other algorithms is underway. It is possible that an ensemble approach, including turbidity, SST, and salinity, may provide improved bloom separation during scenarios when algal cells are weakly fluorescing and the RBD algorithm fails. In addition, these other algorithms are being investigated to provide general chlorophyll concentration information for the Bay as the currently available ocean color algorithms are insufficient in these complex waters.
While many of the high-biomass algal blooms in the optically complex Chesapeake Bay are detected with OLCI image products, such as the RBD and CI, further discrimination to genus or species level is unlikely with current satellite-derived products. The alternative is to combine ecological associations (i.e., salinity/temperature regimes, nutrient preferences, time of year, and location within Chesapeake Bay), with near real-time daily satellite imagery. This combination would allow us to develop a monitoring system for individual blooms across the Bay. Such an approach was developed to detect K. brevis blooms along the Florida West Coast (Stumpf et al., 2003), where seasonality and geography were combined with an algorithm for bloom detection. Habitat models are also being applied for Pseudo-nitzschia blooms and domoic acid events in California (Anderson et al., 2011, 2016) and are likely suitable for some HAB species found in Chesapeake Bay (Brown et al., 2013). The output of these heuristic (rule-based) models can be further combined with remote-sensing products to develop a classified product for individual blooms. Therefore, future work will investigate combinations of model outputs and remote-sensing products that could provide resource managers and the shellfish industry a method to monitor a suite of potentially harmful species throughout Chesapeake Bay. The launch of satellites with hyperspectral sensors after 2022 will further enhance these efforts.
Data Availability Statement
The datasets generated for this study are available on request to the corresponding author.
Author Contributions
JW, TE, JM, GS, and KR participated in the collection and analysis of field and laboratory in situ data. MT, SS, AM, and RS participated in the analysis and presentation of ocean color satellite data. JW, MT, and SS wrote the first draft of the manuscript. All authors contributed to manuscript revisions and approved the submitted version.
Funding
Support for data collection was provided by the Virginia Department of Environmental Quality (Grant #16879), Virginia Department of Health (Grants #VIMSHAB617 and #VDH-20-102-0046), and through the NOAA ECOHAB grant #NA17NOS4780182 to KR (VIMS). This is VIMS contribution #3896 and ECOHAB contribution #958.
Conflict of Interest
AM was employed by company Consolidated Safety Services, Inc.
The remaining authors declare that the research was conducted in the absence of any commercial or financial relationships that could be construed as a potential conflict of interest.
Acknowledgments
In memory of Hunter M. Horn (1994–2020), MDNR colleague and friend.
We gratefully acknowledge Ann McManus (MDE) for her assistance with creating the satellite image figures. James Bailey and Kerry Maguire (MDNR) were invaluable in providing in situ data and data management. Field staff at MDNR, MDE, ODU, VDH, VDEQ, and VIMS are thanked for their efforts to collect and process bloom samples. Thoughtful input from two peer reviewers and Amy Hamilton (MDNR) helped to improve this manuscript. We also acknowledge the support of the NASA Earth Science Division and collaborations developed through the Interagency Chesapeake Bay Group hosted at NASA GSFC.
Footnotes
- ^ https://www.chesapeakebay.net/what/downloads/baywide_cbp_plankton_database for sample collection metadata
- ^ http://eyesonthebay.dnr.maryland.gov/eyesonthebay/DataInfo.cfm
- ^ http://www.vdh.virginia.gov/environmental-health/environmental-health-services/shellfish-safety/
References
Adolf, J. E., Bachvaroff, T. R., and Place, A. R. (2008). Can cryptophyte abundance trigger toxic Karlodinium veneficum blooms in eutrophic estuaries? Harmful Algae 8, 119–128.
Adolf, J. E., Bachvaroff, T. R., and Place, A. R. (2009). Environmental modulation of karlotoxin levels in strains of the cosmopolitan dinoflagellate, Karlodinium veneficum (Dinophyceae). J. Phycol. 45, 176–192. doi: 10.1111/j.1529-8817.2008.00641.x
Amin, R., Zhou, J., Gilerson, A., Moshary, F., and Ahmed, S. (2009). Novel optical techniques for detecting and classifying toxic dinoflagellate Karenia brevis blooms using satellite imagery. Opt. Express 17, 9126–9144. doi: 10.1364/oe.17.009126
Anderson, C. R., Kudela, R. M., Benitez-Nelson, C., Sekula-Wood, E., Burrell, C. T., Chao, Y., et al. (2011). Detecting toxic diatom blooms from ocean color and a regional ocean model. Geophys. Res. Lett. 38:LO4603. doi: 10.1029/2010GL045858
Anderson, C. R., Kudela, R. M., Kahru, M., Chao, Y., Rosenfeld, L. K., Bahr, F. L., et al. (2016). Initial skill assessment of the California harmful algae risk mapping (C-HARM) System. Harmful Algae 59, 1–18. doi: 10.1016/j.hal.2016.08.006
Anderson, D. M., Cembella, A. D., and Hallegraeff, G. M. (2012). Progress in understanding harmful algal blooms (HABs): paradigm shifts and new technologies for research, monitoring and management. Ann. Rev. Mar. Sci. 4, 143–176. doi: 10.1146/annurev-marine-120308-081121
Barceloux, D. G. (2008). “Diarrhetic shellfish poisoning and okadaic acid,” in Medical Toxicology of Natural Substances: Foods, Fungi, Medicinal Herbs, Plants, and Venomous Animals. Hoboken, NJ: John Wiley & Sons, 222–226.
Blough, N. V., and Del Vecchio, R. (2002). “Chromophoric DOM in the coastal environment,” in Biogeochemistry of Marine Dissolved Organic Matter, eds D. A. Hansell and C. A. Carlson (San Diego, CA: Academic Press), 509–545.
Brown, C. W., Hood, R. R., Long, W., Jacobs, J., Ramers, D. L., Wazniak, C., et al. (2013). Ecological forecasting in Chesapeake Bay: using a mechanistic-empirical modeling approach. J. Mar. Syst. 125, 113–125.
Brownlee, E. F., Sellner, S. G., and Sellner, K. G. (2005). Prorocentrum minimum blooms: potential impacts on dissolved oxygen and Chesapeake Bay oyster settlement and growth. Harmful Algae 4, 593–602.
Brownlee, E. F., Sellner, S. G., Sellner, K. G., Nonogaki, H., Adolf, J. E., Bachvaroff, T. R., et al. (2008). Responses of Crassostrea virginica (Gmelin) and C. ariakensis (Fujita) to bloom-forming phytoplankton including ichthyotoxic Karlodinium veneficum (Ballantine). J. Shellfish Res. 27, 581–591.
Cannizzaro, J. P., Carder, K. L., Chen, F. R., Heil, C. A., and Vargo, G. A. (2008). A novel technique for detection of the toxic dinoflagellate, Karenia brevis, in the Gulf of Mexico from remotely sensed ocean color data. Cont. Shelf. Res. 28, 137–158.
Carnegie, R. B., and Burreson, E. M. (2011). Declining impact of an introduced pathogen: Haplosporidium nelsoni in the oyster Crassostrea virginica in Chesapeake Bay. Mar. Ecol. Prog. Ser. 432, 1–5.
Carreto, J. I., Carignan, M. O., Montoya, N. G., Cozzolino, E., and Akselman, R. (2018). Mycosporine-like amino acids and xanthophyll-cycle pigments favour a massive spring bloom development of the dinoflagellate Prorocentrum minimum in Grande Bay (Argentina), an ozone hole affected area. J. Mar. Syst. 178, 15–28.
Catlett, D., and Siegel, D. A. (2018). Phytoplankton pigment communities can be modeled using unique relationships with spectral absorption signatures in a dynamic coastal environment. J. Geophys. Res. Oceans 123, 246–264.
Chesapeake Bay Program (2019). Baywide CBP Plankton Database. Available online at: https://www.chesapeakebay.net/what/downloads/baywide_cbp_plankton_database (accessed November, 3 2019).
Chrost, R. H., and Faust, M. A. (1983). Organic carbon release by phytoplankton: its composition and utilization by bacterioplankton. J. Plankton Res. 5, 477–493.
Clark, J. M., Schaeffer, B. A., Darling, J. A., Urquhart, E. A., Johnston, J. M., Ignatius, A. R., et al. (2017). Satellite monitoring of cyanobacterial harmful algal bloom frequency in recreational waters and drinking water sources. Ecol. Indic. 80, 84–95. doi: 10.1016/j.ecolind.2017.04.046
Cui, Y., Zhang, H., and Lin, S. (2017). Enhancement of non-photochemical quenching as an adaptive strategy under phosphorus deprivation in the dinoflagellate Karlodinium veneficum. Front. Microbiol. 8:404. doi: 10.3389/fmicb.2017.00404
Davidson, J., Mateus, M., Reguera, B., Silke, J., and Sourisseau, M. (2016). Applied simulations and integrated modelling for the understanding of toxic and harmful algal blooms (ASIMUTH). Harmful Algae 53, 1–166. doi: 10.1016/j.hal.2015.11.006
Deeds, J. R., Reimschuessel, R., and Place, A. R. (2006). Histophathological effects in fish exposed to the toxins from Karlodinium micrum. J. Aquat. Anim. Health 18, 136–148.
Deeds, J. R., Terlizzi, D. E., Adolf, J. E., Stoecker, D. K., and Place, A. R. (2002). Toxic activity from cultures of Karlodinium micrum (=Gyrodinium galatheanum) (Dinophyceae) – a dinoflagellate associated with fish mortalities in an estuarine aquaculture facility. Harmful Algae 1, 169–189.
Díaz, P. A., Ruiz-Villarreal, M., Pazos, Y., Moita, M. T., and Reguera, B. (2016). Climate variability and Dinophysis acuta blooms in an upwelling system. Harmful Algae 53, 145–159. doi: 10.1016/j.hal.2015.11.007
Dierssen, H., McManus, G. B., Chlus, A., Qiu, D., Gao, B.-C., and Lin, S. (2015). Space station image captures a red tide ciliate bloom at high spectral and spatial resolution. Proc. Natl. Acad. Sci. U.S.A. 112, 14783–14787. doi: 10.1073/pnas.1512538112
Dower, K. M., and Lucas, M. I. (1993). Photosynthesis-irradiance relationships and production associated with a warm-core ring shed from the Agulhas Retroflection south of Africa. Mar. Ecol. Prog. Ser. 95, 141–154.
Eckford-Soper, L. K., and Daugbjerg, N. (2015). Development of a multiplex real-time qPCR assay for simultaneous enumeration of up to four marine toxic bloom-forming microalgal species. Harmful Algae 48, 37–43. doi: 10.1016/j.hal.2015.06.009
Fu, F. X., Place, A. R., Garcia, N. S., and Hutchins, D. A. (2010). CO2 and phosphate availability control the toxicity of the harmful bloom dinoflagellate Karlodinium veneficum. Aquat. Microb. Ecol. 59, 55–65.
Galimany, E., Place, A. R., Ramón, M., Jutson, M., and Pipe, R. K. (2008). The effects of feeding Karlodinium veneficum (PLY #103; Gymnodinium veneficum Ballantine) to the blue mussel Mytilus edulis. Harmful Algae 7, 91–98.
Gameiro, C., Zwolinski, J., and Brotas, V. (2011). Light control on phytoplankton production in a shallow and turbid estuarine system. Hydrobiologia 669, 249–263.
Gasol, J. M., Cardelús, C., Morán, X. A. G., Balagué, V., Forn, I., Marrasé, C., et al. (2016). Seasonal patterns in phytoplankton photosynthetic parameters and primary production at a coastal NW Mediterranean site. Sci. Mar. 80S1, 63–77.
Gernez, P., Doxaran, D., and Barille, L. (2017). Shellfish aquaculture from space: potential of Sentinel2 to monitor tide-driven changes in turbidity, chlorophyll concentrations and oyster physiological response at the scale of an oyster farm. Front. Mar. Sci. 4:137. doi: 10.3389/fmars.2017.00137
Gilerson, A. A., Zhou, J., Gurlin, D., Moses, W., Iannou, I., and Ahmed, S. (2010). Algorithms for remote estimation of chlorophyll-a in coastal and inland waters using red and near infrared bands. Opt. Express 18, 24109–24124. doi: 10.1364/OE.18.024109
Glaspie, C. N., Seitz, R. D., Ogburn, M. B., Dungan, C. F., and Hines, A. H. (2018). Impacts of habitat, predators, recruitment, and disease on soft-shell clams Mya arenaria and stout razor clams Tagelus plebeius in Chesapeake Bay. Mar. Ecol. Prog. Ser. 603, 117–133.
Glibert, P. M., Alexander, J., Meritt, D. M., North, E. W., and Stoecker, D. K. (2007). Harmful algae pose additional challenges for oyster restoration: impacts of the harmful algae Karlodinium veneficum and Prorocentrum minimum on early life stages of the oyster Crassostrea virginica and Crassostrea ariakensis. J. Shellfish Res. 26, 919–925.
González-Gil, S., Velo-Suárez, L., Gentien, P., Ramilo, I., and Reguera, B. (2010). Phytoplankton assemblages and characterization of a Dinophysis acuminata population during an upwelling-downwelling cycle. Aquat. Microb. Ecol. 58, 273–286. doi: 10.3354/ame01372
Gordon, H. R., Clark, D. K., Brown, J. W., Brown, O. B., Evans, R. H., and Broenkow, W. W. (1983). Phytoplankton pigment concentrations in the Middle Atlantic Bight: comparison of ship determinations and CZCS estimates. Appl. Opt. 22, 20–36. doi: 10.1364/ao.22.000020
Gower, J., King, S., and Goncalves, P. (2008). Global monitoring of plankton blooms using MERIS MCI. Int. J. Remote Sens. 29, 6209–6216.
Grabowski, J. H., Brumbaugh, R. D., Conrad, R. F., Keeler, A. G., Opaluch, J. J., Peterson, C. H., et al. (2012). Economic valuation of ecosystem services provided by oyster reefs. Bioscience 62, 900–909. doi: 10.1371/journal.pone.0167694
Griffith, A. W., and Gobler, C. J. (2016). Temperature controls the toxicity of the ichthyotoxic dinoflagellate Cochlodinium polykrikoides. Mar. Ecol. Prog. Ser. 545, 63–76.
Griffith, A. W., and Gobler, C. J. (2020). Harmful algal blooms: a climate change co-stressor in marine and freshwater ecosystems. Harmful Algae 91:101590. doi: 10.1016/j.hal.2019.03.008
Griffith, A. W., Shumway, S. E., and Gobler, C. J. (2019). Differential mortality of North Atlantic bivalve molluscs during harmful algal blooms caused by the dinoflagellate, Cochlodinium (a.k.a. Margalefidinium) polykrikoides. Estuar. Coast. 42, 190–203.
Guzmán, L., Varela, R., Muller-Karger, F., and Lorenzoni, L. (2016). Bio-optical characteristics of a red tide induced by Mesodinium rubrum in the Cariaco Basin. Venezuela. J. Marine Syst. 160, 17–25.
Haddaway-Riccio, J. (2019). Maryland Oyster Management Plan. Annapolis, MD: Maryland Department of Natural Resources Report No. 17-012319-117. 93.
Hall, N. S., Litaker, R. W., Fensin, E., Adolf, J. E., Bowers, H. A., Place, A. R., et al. (2008). Environmental factors contributing to the development and demise of a toxic dinoflagellate (Karlodinium veneficum) bloom in a shallow, eutrophic, lagoonal estuary. Estuar. Coast. 31, 402–418.
Handy, S. M., Demir, E., Hutchins, D. A., Portune, K. J., Whereat, E. B., Hare, C. E., et al. (2008). Using quantitative real-time PCR to study competition and community dynamics among Delaware Inland Bays harmful algae in field and laboratory studies. Harmful Algae 7, 599–613.
Harding, J. M., Mann, R., Moeller, P., and Hsia, M. (2009). Mortality of the veined rapa whelk, Rapana venosa, in relation to a bloom of Alexandrium monilatum in the York River, United States. J. Shellfish Res. 28, 363–367.
Harding, L. W., Mallonee, M. E., Perry, E. S., Miller, W. D., Adolf, J. E., Gallegos, C. L., et al. (2019). Long-term trends, current status, and transitions of water quality in Chesapeake Bay. Sci. Rep. 9:6709. doi: 10.1038/s41598-019-43036-6
Harred, L. B., and Campbell, L. (2014). Predicting harmful algal blooms: a case study with Dinophysis ovum in the Gulf of Mexico. J. Plankton Res. 36, 1434–1445.
Hattenrath-Lehmann, T. K., Marcoval, M. A., Berry, D. L., Fire, S., Wang, Z., Morton, S. L., et al. (2013). The emergence of Dinophysis acuminata blooms and DSP toxins in shellfish in New York waters. Harmful Algae 26, 33–44.
Hattenrath-Lehmann, T. K., Marcoval, M. A., Mittlesdorf, H., Goleski, J. A., Wang, Z., Haynes, B., et al. (2015). Nitrogenous nutrients promote the growth and toxicity of Dinophysis acuminata during estuarine bloom events. PLoS One 10:e0124148. doi: 10.1371/journal.pone.0124148
Heil, D. C. (2009). Karenia brevis monitoring, management, and mitigation for Florida molluscan shellfish harvesting areas. Harmful Algae 8, 608–610.
Hicks, R. L., Haab, T. C., and Lipton, D. (2004). The Economic Benefits of Oyster Reef Restoration in the Chesapeake Bay. Annapolis, MD: Chesapeake Bay Foundation. 113.
Hu, C., and Feng, L. (2016). Modified MODIS fluorescence line height data product to improve image interpretation for red tide monitoring in the eastern Gulf of Mexico. J. Appl. Remote Sens. 11:012003. doi: 10.1117/1.JRS.11.012003
Hu, C., Muller-Karger, F. E., Taylor, C. J., Carder, K. L., Kelble, C., Johns, E., et al. (2005). Red tide detection and tracing using MODIS fluorescence data: a regional example in SW Florida coastal waters. Remote Sens. Environ. 97, 311–321.
Hudson, K. (2019). Virginia Shellfish Aquaculture Situation and Outlook Report: Results of the 2018 Virginia Shellfish Aquaculture Crop Reporting Survey. VIMS Marine Resource Report No. 2019-8. Gloucester Point, VA: Virginia Sea Grant. 20.
Interstate Shellfish Sanitation Commission [ISSC] (2016). ISSC Priorities to Improve Shellfish Monitoring for Harmful Algal Bloom Toxins. Available online at: http://www.issc.org/harmfulalgaebloominformation (accessed November 3, 2019).
Johnson, M. D., Stoecker, D. K., and Marshall, H. G. (2013). Seasonal dynamics of Mesodinium rubrum in Chesapeake Bay. J. Plankton Res. 35, 877–893.
Kemp, W. M., Boynton, W. R., Adolf, J. E., Boesch, D. F., Boicourt, W. C., Brusch, G., et al. (2005). Eutrophication of Chesapeake Bay: historical trends and ecological interactions. Mar. Ecol. Prog. Ser. 303, 1–29.
Kennedy, V. S., Breitburg, D. L., Christman, M. C., Luckenbach, M. W., Paynter, K., Kramer, J., et al. (2011). Lessons learned from efforts to restore oyster populations in Maryland and Virginia, 1990-2007. J. Shellfish Res. 30, 719–731.
Korbee, N., Mata, M. T., and Figueroa, F. L. (2010). Photoprotection mechanisms against ultraviolet radiation in Heterocapsa sp. (Dinophyceae) are influenced by nitrogen availability: Mycosporine-like amino acids vs. xanthophyll cycle. Limnol. Oceanogr. 55, 899–908.
Kudela, R. M., and Gobler, C. J. (2012). Harmful dinoflagellate blooms caused by Cochlodinium sp.: Global expansion and ecological strategies facilitating bloom formation. Harmful Algae 14, 71–86.
Kudela, R. M., Ryan, J. P., Blakely, M. D., Lane, J. Q., and Peterson, T. D. (2008). Linking the physiology and ecology of Cochlodinium to better understand harmful algal bloom events: a comparative approach. Harmful Algae 7, 278–292.
Lee, S. Y., Jeong, H. J., Seong, K. A., Lim, A. S., Kim, J. H., Lee, K. H., et al. (2017). Improved real-time PCR method for quantification of the abundance of all known ribotypes of the ichthyotoxic dinoflagellate Cochlodinium polykrikoides by comparing 4 different preparation methods. Harmful Algae 63, 23–31. doi: 10.1016/j.hal.2017.01.006
Li, A., Stoecker, D. K., and Coats, D. W. (2000). Spatial and temporal aspects of Gyrodinium galatheanum in Chesapeake Bay: distribution and mixotrophy. J. Plankton Res. 22, 2105–2124.
Li, J., Bai, Y., Bear, K., Joshi, S., and Jaisi, D. (2017). Phosphorus availability and turnover in the Chesapeake Bay: insights from nutrient stoichiometry and phosphate oxygen isotope ratios. J. Geophys. Res. Biogeol. 122, 811–824.
Li, J., Glibert, P. M., and Gao, Y. (2015). Temporal and spatial changes in Chesapeake Bay water quality and relationships to Prorocentrum minimum, Karlodinium veneficum, and CyanoHAB events, 1991-2008. Harmful Algae 42, 1–14.
Lin, C. H. M., Accoroni, S., and Glibert, P. M. (2017). Karlodinium veneficum feeding responses and effects on larvae of the eastern oyster Crassostrea virginica under variable nitrogen:phosphorus stoichiometry. Aquat. Microb. Ecol. 79, 101–114.
Lunetta, R. S., Schaeffer, B. A., Stumpf, R. P., Keith, D., Jacobs, S. A., and Murphy, M. S. (2015). Evaluation of cyanobacteria cell count detection derived from MERIS imagery across the eastern USA. Remote Sens. Environ. 157, 24–34.
Mackiernan, G. B. (1968). Seasonal Distribution of Dinoflagellates in the Lower York River, Virginia. M.A. Thesis, William & Mary, Williamsburg, VA, 104.
Mann, R. (2000). Restoring the oyster reef communities in the Chesapeake Bay: a commentary. J. Shellfish Res. 19, 335–339.
Marshall, H., and Alden, R. (1990). A comparison of phytoplankton assemblages and environmental relationships in three estuarine rivers of the lower Chesapeake Bay. Estuaries 13, 287–300.
Marshall, H. G. (1980). Phytoplankton composition in the lower Chesapeake Bay and Old Plantation Creek, Cape Charles, Virginia. Estuaries 3, 207–216.
Marshall, H. G. (1982). The composition of phytoplankton within the Chesapeake Bay Plume and adjacent waters off the Virginia coast, USA. Estuar. Coast. Shelf Sci. 15, 29–43.
Marshall, H. G., Burchardt, L., and Lacouture, R. (2005). A review of phytoplankton composition within Chesapeake Bay and its tidal estuaries. J. Plankton Res. 27, 1083–1102.
Marshall, H. G., Egerton, T., Stem, T., Hicks, J., and Kokocinski, M. (2004). “Extended bloom concentration of the toxic dinoflagellate Dinophysis acuminata in Virginia estuaries during late winter through early spring 2002,” in Harmful Algae 2002, eds K. A. Steidinger, J. H. Landsberg, C. R. Tomas, and G. A. Vargo (Tallahassee, FL: Florida Fish and Wildlife Conservation Commission), 364–366.
Marshall, H. G., and Egerton, T. A. (2009a). “Increasing occurrence and development of potentially harmful algal blooms in Virginia tidal rivers,” in Proceedings of the Water Resources in Changing Climates. Virginia Water Research Conference October 15-16, 2009, ed. P. Fay (Virginia: Virginia Polytechnic Institute and State University), 89–99.
Marshall, H. G., and Egerton, T. A. (2009b). Phytoplankton blooms: their occurrence and composition within Virginia’s tidal tributaries. VA. J. Sci. 60, 149–164.
Marshall, H. G., Lane, M. F., Nesius, K. K., and Burchardt, L. (2009). Assessment and significance of phytoplankton species composition within Chesapeake Bay and Virginia tributaries through a long-term monitoring program. Environ. Monit. Assess. 150, 143–155. doi: 10.1007/s10661-008-0680-0
Matthews, M. W., and Odermatt, D. (2015). Improved algorithm for routine monitoring of cyanobacteria and eutrophication in inland and near-coastal waters. Remote Sens. Environ. 156, 374–382.
May, S. P., Burkholder, J. M., Shumway, S. E., Hegaret, H., Wikfors, G. H., and Frank, D. (2010). Effects of the toxic dinoflagellate Alexandrium monilatum on survival, grazing and behavioral response of three ecologically important bivalve molluscs. Harmful Algae 9, 281–293.
Miller, W. D., and Harding, L. W. Jr. (2007). Climate forcing of the spring bloom in Chesapeake Bay. Mar. Ecol. Prog. Ser. 331, 11–22.
Moita, M. T., Pazos, Y., Rocha, C., Nolasco, R., and Oliveira, P. B. (2016). Towards predicting Dinophysis blooms off NW Iberia: a decade of events. Harmful Algae 52, 17–32. doi: 10.1016/j.hal.2015.12.002
Morse, R. E., Mulholland, M. R., Egerton, T. A., and Marshall, H. G. (2014). Phytoplankton and nutrient dynamics in a tidally dominated eutrophic estuary: daily variability and controls on bloom formation. Mar. Ecol. Prog. Ser. 503, 59–74.
Mulholland, M. R., Morse, R., Egerton, T., Bernhardt, P. W., and Filippino, K. C. (2018). Blooms of dinoflagellate mixotrophs in a lower Chesapeake Bay tributary: carbon and nitrogen uptake over diurnal, seasonal, and interannual timescales. Estuar. Coast. 41, 1744–1765.
Mulholland, M. R., Morse, R. E., Boneillo, G. E., Bernhardt, P. W., Filippino, K. C., Procise, L. A., et al. (2009). Understanding causes and impacts of the dinoflagellate, Cochlodinium polykrikoides, blooms in the Chesapeake Bay. Estuar. Coast. 32, 734–747.
Najjar, G., Pyke, C. R., Adams, M. B., Breitburg, D., Hershner, C., Kemp, M., et al. (2010). Potential climate-change impacts on the Chesapeake Bay. Estuar. Coast. Shelf Sci. 86, 1–20.
National Academies of Sciences, Engineering, and Medicine [NASEM] (2018). Thriving on Our Changing Planet: A Decadal Strategy for Earth Observation from Space. Washington, DC: The National Academies Press, doi: 10.17226/24938
National Aeronautics and Space Administration [NASA] (2019). NASA Targets Coastal Ecosystems with New Space Sensor, NASA Press Release, 1 Aug. 2019. Available online at: https://www.nasa.gov/press-release/nasa-targets-coastal-ecosystems-with-new-space-sensor (accessed October 21, 2019).
National Aeronautics and Space Administration Goddard Space Flight Center [NASA GSFC] (2018). Interagency Workshop on Societal Applications of Satellite Data for the Chesapeake Bay. Available online at: https://science.gsfc.nasa.gov/610/applied-sciences/chesapeake_bay_workshop.html (accessed November 28, 2019).
National Aeronautics and Space Administration Goddard Space Flight Center [NASA GSFC] (2019). Interagency Chesapeake Bay Water Quality Modelling Workshop. Available online at: https://science.gsfc.nasa.gov/610/applied-sciences/chesapeake_bay_modeling_workshop.html (accessed November 28, 2019).
National Shellfish Sanitation Program [NSSP] (2017). Guide for the Control of Molluscan Shellfish 2017 Revision. Available online at: http://www.fda.gov/Food/GuidanceRegulation/FederalStateFoodPrograms/ucm2006754.htm (accessed November 3, 2019).
Oesterling, M., and Luckenbach, M. (2008). Best Management Practices for the Virginia Shellfish Culture Industry. Marine Resource Report No. 2008-10. Silver Spring, MA: NOAA, 12.
Ohio Environmental Protection Agency [Ohio EPA] (2019). Public Water System Harmful Algal Bloom Response Strategy. Available online at: https://epa.ohio.gov/Portals/28/documents/habs/2019-PWS-HAB-Response-Strategy.pdf (accessed November 4, 2019).
Pease, S. K. (2016). Alexandrium monilatum in the Lower Chesapeake Bay: Sediment Cyst Distribution and Potential Health Impacts on Crassostrea virginica. Master’s Thesis, William & Mary, Williamsburg, VA, 158.
Philpot, W. D. (1991). The derivative ratio algorithm: avoiding atmospheric effects in remote sensing. IEEE Trans. Geosci. Remote Sens. 29, 350–357.
Place, A. R., Bowers, H. A., Bachvaroff, T. R., Adolf, J. E., Deeds, J. R., and Sheng, J. (2012). Karlodinium veneficum—The little dinoflagellate with a big bite. Harmful Algae 14, 179–195.
Place, A. R., Munday, R., and Munday, J. S. (2014). Acute toxicity of karlotoxins to mice. Toxicon 90, 184–190. doi: 10.1016/j.toxicon.2014.08.003
Powell, E. N., Klinck, J. M., Ashton-Alcox, K., Hofmann, E. F., and Morson, J. (2012). The rise and fall of Crassostrea virginica oyster reefs: the role of disease and fishing in their demise and a vignette on their management. J. Mar. Res. 70, 505–558.
Reguera, B., Velo-Suárez, L., Raine, R., and Park, M. G. (2014). Harmful Dinophysis species: a review. Harmful Algae 14, 87–106.
Reidmiller, D. R., Avery, C. W., Easterling, D. R., Kunkel, K. E., Lewis, K. L. M., Maycock, T. K., et al. (2018). Impacts, Risks, and Adaptation in the United States: Fourth National Climate Assessment, U.S. Washington, DC: Global Change Research Program, doi: 10.7930/NCA4.2018
Robison, C. L. (2019). Impacts of Margalefidinium polykrikoides and Alexandrium monilatum on oysters cultured in lower Chesapeake Bay. Master’s Thesis, William & Mary, Williamsburg, VA, 103.
Roegner, G. C., and Mann, R. (1991). “Hard clam Mercenaria mercenaria,” in Habitat Requirements for Chesapeake Bay Living Resources, eds S. L. Funderburk, J. A. Mihursky, S. J. Jordan, and D. Riley (Pasadena, MD: Chesapeake Research Consortium, Inc), 19.
Ruiz-Villarreal, M., García-García, L. M., Cobas, M., Díaz, P. A., and Reguera, B. (2016). Modelling the hydrodynamic conditions associated with Dinophysis blooms in Galicia (NW Spain). Harmful Algae 53, 40–52. doi: 10.1016/j.hal.2015.12.003
Schaeffer, B. A., Loftin, K. A., Stumpf, R. P., and Werdell, P. J. (2015). Agencies collaborate, develop a cyanobacteria assessment network. Eos, Earth Space Sci. News 96, 16–20.
Schaeffer, B. A., Schaeffer, K. G., Keith, D., Lunetta, R. S., Conmy, R., and Gould, R. W. (2013). Barriers to adopting satellite remote sensing for water quality management. Int. J. Rem. Sens. 34, 7534–7544.
Schollaert Uz, S., Kim, G., Mannino, A., Werdell, P. J., and Tzortziou, M. (2019). Developing a community of practice for applied uses of future PACE data to address marine food security challenges. Front. Earth Sci. 7:283. doi: 10.3389/feart.2019.00283
Sea Grant Association [SGA] (2016). NOAA Sea Grant 10-Year Aquaculture Vision. MASGP-16-015. Ocean Springs, MS: Sea Grant Association, 16.
Seaborn, D. W., and Marshall, H. G. (2008). Dinoflagellate cysts within sediment collections from the southern Chesapeake Bay, and tidal regions of the James. York, and Rappahannock Rivers, Virginia. VA J. Sci. 59, 138–141.
Siegel, D. A., Maritorena, S., Nelson, N. B., and Behrenfeld, M. J. (2005). Independence and interdependencies among global ocean color properties: reassessing the bio-optical assumption. J. Geophys. Res. 110:C07011. doi: 10.1029/2004JC002527
Siegel, D. A., Maritorena, S., Nelson, N. B., Hansell, D. A., and Lorenzi-Kayser, M. (2002). Global distribution and dynamics of colored dissolved and detrital organic materials. J. Geophys. Res. 107:3228. doi: 10.1029/2001JC000965
Sjöqvist, C. O., and Lindholm, T. J. (2011). Natural co-occurrence of Dinophysis acuminata (Dinoflagellata) and Mesodinium rubrum (Ciliophora) in thin layers in a coastal inlet. J. Eukaryot. Microbiol. 58, 365–372. doi: 10.1111/j.1550-7408.2011.00559.x
Skovgaard, A., Hansen, P. J., and Stoecker, D. K. (2000). Physiology of the mixotrophic dinoflagellate Fragilidium subglobosum. I. Effects of phagotrophy and irradiance on photosynthesis and carbon content. Mar. Ecol. Prog. Ser. 201, 129–136.
Smith, G. F., Bruce, D. G., Roach, E. B., Hansen, A., Newell, R. I. E., and McManus, A. M. (2005). Assessment of recent habitat conditions of Eastern Oyster Crassostrea virginica bars in mesohaline Chesapeake Bay. N. Am. J. Fish. Manag. 25, 1569–1590. doi: 10.1577/m04-058.1
Soto, I. M., Cannizarro, J., Muller-Karger, F. E., Hu, C., Wolny, J., and Goldgof, D. (2015). Evaluation and optimization of remote sensing techniques for detection of Karenia brevis blooms on the West Florida Shelf. Remote Sens. Environ. 170, 239–254.
Stoecker, D. K., Adolf, J. E., Place, A. R., Glibert, P. M., and Merritt, D. W. (2008). Effects of the dinoflagellates Karlodinium veneficum and Prorocentrum minimum on early life stages of the eastern oyster (Crassostrea virginica). Mar. Biol. 154, 81–90.
Stumpf, R. P., Culver, M. E., Tester, P. A., Tomlinson, M. C., Kirkpatrick, G. J., Pederson, B. A., et al. (2003). Monitoring Karenia brevis blooms in the Gulf of Mexico using satellite ocean color imagery and other data. Harmful Algae 2, 147–160.
Stumpf, R. P., Davis, T. W., Wynne, T. T., Graham, J. L., Loftin, K. A., Johengen, T. H., et al. (2016). Challenges for mapping cyanotoxin patterns from remote sensing of cyanobacteria. Harmful Algae 54, 160–173. doi: 10.1016/j.hal.2016.01.005
Stumpf, R. P., and Pennock, J. R. (1989). Calibration of a general optical equation for remote sensing of suspended sediments in a moderately turbid estuary. J. Geophys. Res. 94, 14363–14371.
Stumpf, R. P., and Tomlinson, M. C. (2005). “Remote sensing of harmful algal blooms,” in Remote Sensing of Coastal Aquatic Environments, eds R. L. Miller, C. E. del Castillo, and B. A. McKee (Dordrecht: Springer), 347. doi: 10.2175/106143014x13975035526149
Tang, Y. T., and Gobler, C. J. (2009). Characterization of the toxicity of Cochlodinium polykrikoides isolates from Northeast US estuaries to finfish and shellfish. Harmful Algae 8, 454–462.
Tango, P., Butler, W., Lacouture, R., Goshorn, D., Magnien, R., Michael, B., et al. (2004). “An unprecedented bloom of Dinophysis acuminata in Chesapeake Bay,” in Harmful Algae 2002, eds K. A. Steidinger, J. H. Landsberg, C. R. Tomas, and G. A. Vargo (Tallahassee, FL: Florida Fish and Wildlife Conservation Commission), 358–360.
Tango, P. J., Magnien, R., Butler, W., Luckett, C., Luckenbach, M., Lacouture, R., et al. (2005). Impacts and potential effects due to Prorocentrum minimum blooms in Chesapeake Bay. Harmful Algae 4, 525–531.
Tarnowski, M. (2017). Maryland Oyster Population Status Report. Annapolis, MD: Chesapeake Bay Foundation, 64.
Tester, P. A., Stumpf, R. P., and Steidinger, K. A. (1998). “Ocean color imagery: what is the minimum detection level for Gymnodinium breve blooms?,” in Harmful Algae, Proceedings of the VII International Conference on Harmful Algae, eds B. Reguera, J. Blanco, and M. Fernandez (Paris: Xunta de Galicia and Intergovernmental Oceanographic Commission of UNESCO), 149–151.
Tomlinson, M. C., Stumpf, R. P., Ransibrahmanakul, V., Truby, E. W., Kirkpatrick, G. J., Pederson, B. A., et al. (2004). Evaluation of the use of SeaWiFS imagery for detecting Karenia brevis harmful algal blooms in the eastern Gulf of Mexico. Remote Sens. Environ. 91, 293–303.
Tomlinson, M. C., Wynne, T. T., and Stumpf, R. P. (2009). An evaluation of remote sensing techniques for enhanced detection of the toxic dinoflagellate, Karenia brevis. Remote Sens. Environ. 113, 598–609.
Van Hauwaert, T. (2016). Recent dinoflagellate cysts from the Chesapeake estuary (Maryland and Virginia, USA): taxonomy and ecological preferences. Master’s Thesis, University of Ghent, 97.
Vandersea, M. W., Kibler, S. R., Van Sant, S. B., Tester, P. A., Sullivan, K., Eckert, G., et al. (2017). qPCR assays for Alexandrium fundyense and A. ostenfeldii (Dinophyceae) identified from Alaskan waters and a review of species-specific Alexandrium molecular assays. Phycologia 56, 303–320.
Velo-Suárez, L., and Gutiérrez-Estrada, J. C. (2007). Artificial neural network approaches to one-step weekly prediction of Dinophysis acuminata blooms in Huelva (Western Andalucía Spain). Harmful Algae 6, 361–371.
Vonshak, A., Cheung, S. M., and Chen, F. (2000). Mixotrophic growth modifies the response of Spirulina (Arthospira) platensis (Cyanobacteria) cells to light. J. Phycol. 36, 675–679. doi: 10.1046/j.1529-8817.2000.99198.x
Webster, D. (2009). Shellfish Aquaculture Development in Maryland and Virginia. Silver Spring, MD: NOAA SeaGrant Report No. NA06OAR4171076, 47.
Werdell, P. J., Behrenfeld, M. J., Bontempi, P. S., Boss, E., Cairns, B., Davis, G. T., et al. (2019). The Plankton, Aerosol, Cloud, ocean Ecosystem (PACE) mission: status, science, advances. Bull. Amer. Meteorol. Soc. 100, 1775–1794. doi: 10.1175/BAMS-D-18-0056.1
Wikfors, G. H. (2005). A review and new analysis of trophic interactions between Prorocentrum minimum and clams, scallops, and oysters. Harmful Algae 4, 585–592.
Wolny, J. L., Egerton, T. A., Handy, S. M., Stutts, W. L., Smith, J. L., Whereat, E. B., et al. (2020). Characterization of Dinophysis spp. (Dinophyceae, Dinophysiales) from the mid-Atlantic region of the United States. J. Phycol. 56, 404–424. doi: 10.1111/jpy.12966
Wynne, T., Meredith, A., Briggs, T., Litaker, W., and Stumpf, R. (2018). “Harmful algal bloom forecasting branch ocean color satellite imagery processing guidelines,” in Proceedings of the NOAA Technical Memorandum NOS NCCOS 252, Silver Spring, MD, 48. doi: 10.25923/twc0-f025
Wynne, T. T., Stumpf, R. P., Tomlinson, M. C., and Dyble, J. (2010). Characterizing a cyanobacterial bloom in western Lake Erie using satellite imagery and meteorological data. Limnol. Oceanogr. 55, 2025–2036.
Wynne, T. T., Stumpf, R. P., Tomlinson, M. C., Fahnenstiel, G. L., Dyble, J., Schwab, D. J., et al. (2013). Evolution of a cyanobacterial bloom forecast system in western Lake Erie: development and initial evaluation. J. Great Lakes Res. 39, 90–99.
Wynne, T. T., Stumpf, R. P., Tomlinson, M. C., Warner, R. A., Tester, P. A., Dyble, J., et al. (2008). Relating spectral shape to cyanobacterial blooms in the Laurentian Great Lakes. Int. J. Remote Sens. 29, 3665–3672.
Yasumoto, T., Murata, M., Oshima, Y., Sano, M., Matsumoto, G., and Clardy, J. (1985). Diarrhetic shellfish toxins. Tetrahedron 41, 1019–1025.
Keywords: aquaculture, Chesapeake Bay, harmful algal bloom (HAB), ocean color, OLCI, remote sensing, shellfish
Citation: Wolny JL, Tomlinson MC, Schollaert Uz S, Egerton TA, McKay JR, Meredith A, Reece KS, Scott GP and Stumpf RP (2020) Current and Future Remote Sensing of Harmful Algal Blooms in the Chesapeake Bay to Support the Shellfish Industry. Front. Mar. Sci. 7:337. doi: 10.3389/fmars.2020.00337
Received: 07 December 2019; Accepted: 22 April 2020;
Published: 26 May 2020.
Edited by:
Pierre Gernez, Université de Nantes, FranceReviewed by:
Clarissa Anderson, University of California, San Diego, United StatesHayley Louise Evers-King, Plymouth Marine Laboratory, United Kingdom
Copyright © 2020 Wolny, Tomlinson, Schollaert Uz, Egerton, McKay, Meredith, Reece, Scott and Stumpf. This is an open-access article distributed under the terms of the Creative Commons Attribution License (CC BY). The use, distribution or reproduction in other forums is permitted, provided the original author(s) and the copyright owner(s) are credited and that the original publication in this journal is cited, in accordance with accepted academic practice. No use, distribution or reproduction is permitted which does not comply with these terms.
*Correspondence: Jennifer L. Wolny, jennifer.wolny@maryland.gov