Interaction of the Antarctic Circumpolar Current With Seamounts Fuels Moderate Blooms but Vast Foraging Grounds for Multiple Marine Predators
 Sara Sergi
 Alberto Baudena
 Cédric Cotté
 Mathieu Ardyna
 Stéphane Blain
 Francesco d’Ovidio
- 1Sorbonne Université, CNRS, IRD, MNHN, Laboratoire d’Océanographie et du Climat: Expérimentations et Approches Numériques (LOCEAN-IPSL), Paris, France
- 2Laboratoire d’Océanographie de Villefranche (LOV), Sorbonne Université, CNRS, Villefranche-sur-Mer, France
- 3Department of Earth System Science, Stanford University, Stanford, CA, United States
- 4Laboratoire d’Océanographie Microbienne (LOMIC), Sorbonne Université, CNRS, Banyuls-sur-Mer, France
In the Antarctic Circumpolar Current region of the Southern Ocean, the massive phytoplankton blooms stemming from islands support large trophic chains. Contrary to islands, open ocean seamounts appear to sustain blooms of lesser intensity and, consequently, are expected to play a negligible role in the productivity of this area. Here we revisit this assumption by focusing on a region of the Antarctic Circumpolar Current zone which is massively targeted by marine predators, even if no island fertilizes this area. By combining high resolution bathymetric data, Lagrangian analyses of altimetry-derived velocities and chlorophyll a observations derived from BGC-Argo floats and ocean color images, we reveal that the oligotrophic nature of the study region considered in low chlorophyll a climatological maps hides in reality a much more complex environment. Significant (chlorophyll a in excess of 0.6 mg/m3) phytoplankton blooms spread over thousands of kilometers and have bio-optical signatures similar to the ones stemming from island systems. By adopting a Lagrangian approach, we demonstrate that these moderate blooms (i) originate at specific sites where the Antarctic Circumpolar Current interacts with seamounts, and (ii) coincide with foraging areas of five megafauna species. These findings underline the ecological importance of the open ocean subantarctic waters and advocate for a connected vision of future conservation actions along the Antarctic Circumpolar Current.
Introduction
Marine phytoplankton production drives ecosystem trophic structures (Iverson, 1990; Frederiksen et al., 2006; Boersma et al., 2009; Block et al., 2011) and ecosystem services, ranging from carbon export (Michaels and Silver, 1988; Legendre and Rassoulzadegan, 1995; Heinze et al., 2015) to fisheries production (Chassot et al., 2010). Consequently, understanding the factors underpinning phytoplankton productivity has major implications for process studies. These include the parameterization of nutrient input adopted in biogeochemical models (Aumont and Bopp, 2006; Lancelot et al., 2009; Tagliabue et al., 2014) and the identification of biological hotspots for the management and conservation of marine living resources (Gove et al., 2016; Santora et al., 2017).
In the Atlantic and Indian sectors of the Antarctic Circumpolar Current (ACC) region (Figure 1A), iron limitation generates intense contrasts in the biological productivity (e.g., Martin, 1990; Sullivan et al., 1993; De Baar et al., 1995; Boyd et al., 2000) affecting the distribution of pelagic ecosystems, from primary producers to upper predators (De Broyer et al., 2014). The major source of iron for the shallow ocean is provided by the interaction of the eastward ACC flow with the shallow bathymetry around islands (Sullivan et al., 1993; Thomalla et al., 2011; Ardyna et al., 2017). The island mass effect stimulates dramatic phytoplankton blooms, such as the ones occurring downstream of South Georgia, Crozet, and the Kerguelen Plateau (Sohrin et al., 2000; Blain et al., 2001, 2007; Moore and Abbott, 2002; Lancelot et al., 2009; Pollard et al., 2009; Borrione et al., 2014; d’Ovidio et al., 2015; see also Figure 1A). This large phytoplankton biomass is at the basis of the pelagic food web which sustains numerous colonies of predators breeding in the subantarctic islands (De Broyer et al., 2014). Pinnipeds and seabirds intensively forage in the phytoplankton plumes extending in the Antarctic Polar Front (PF) region downstream of South Georgia (Barlow and Croxall, 2002; Staniland et al., 2004; Scheffer et al., 2010; Rogers et al., 2015) and the Kerguelen Plateau (Guinet et al., 2001; Lea et al., 2006; Cotté et al., 2015; O’Toole et al., 2017).
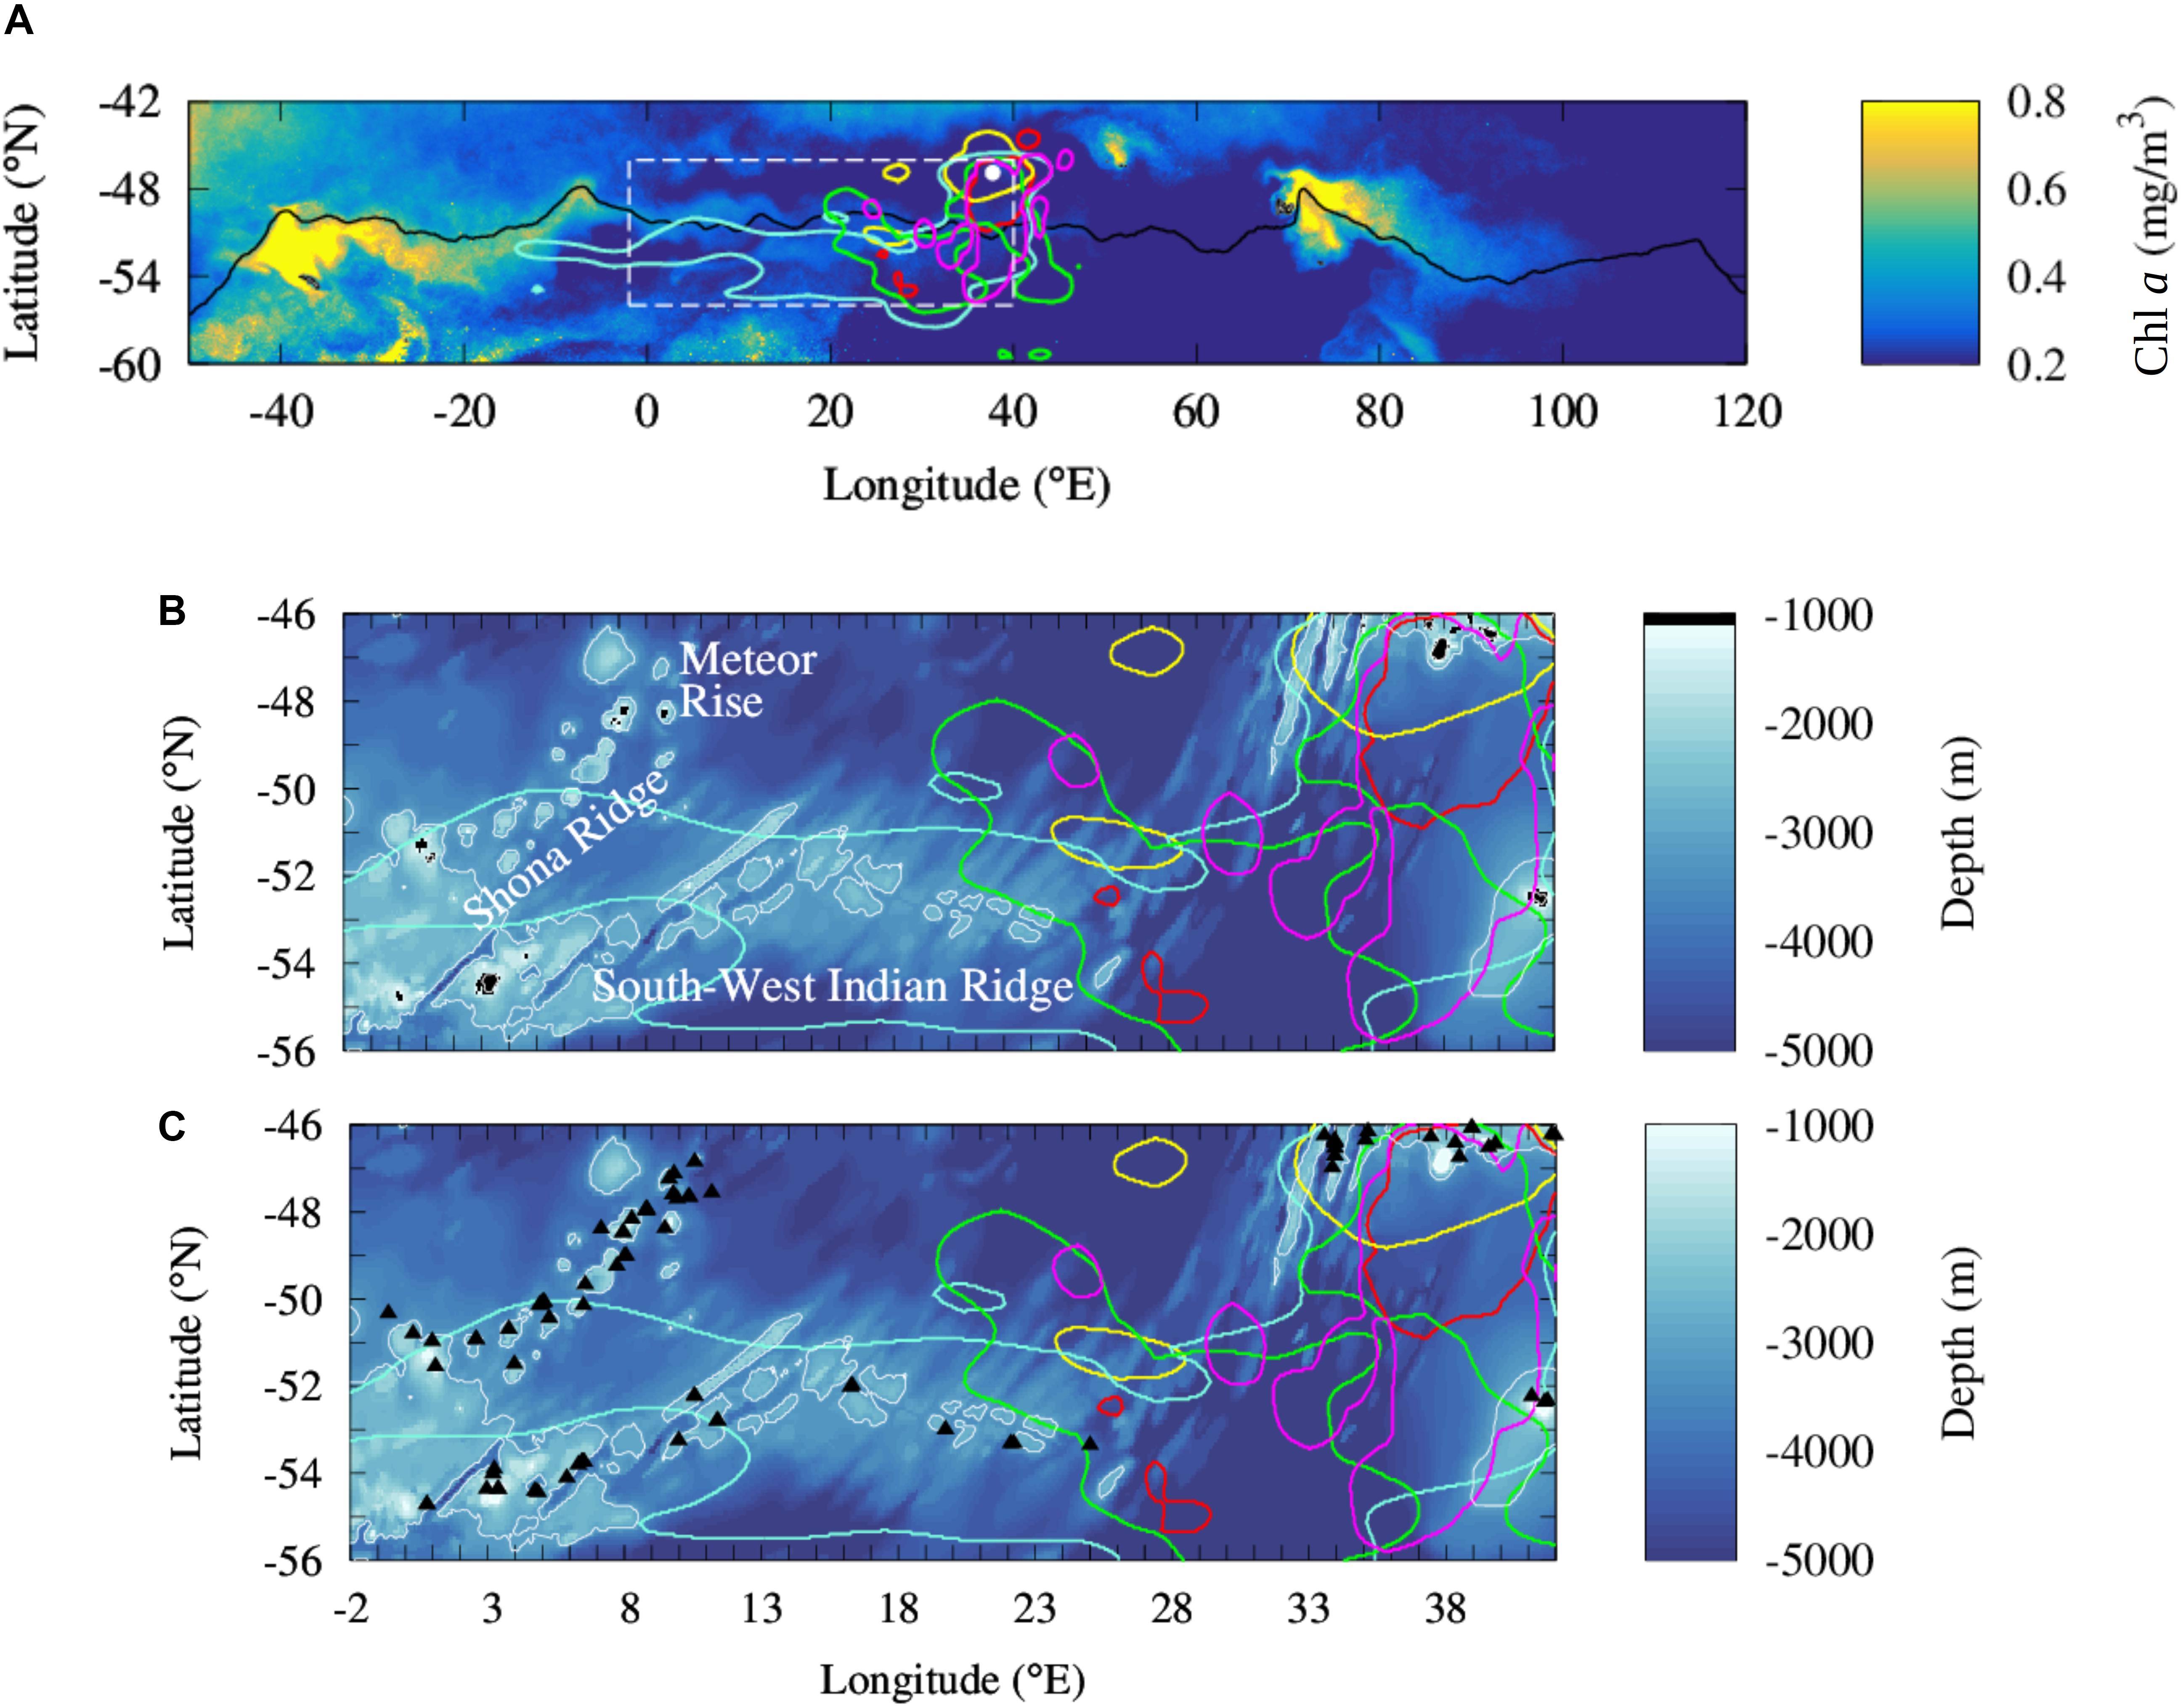
Figure 1. Comparison of the at-sea distribution of five species of predators from the Prince Edward Islands to the distribution of regional phytoplankton biomass and shallow topographies in the southern Agulhas Basin. (A) Large scale climatology of concentration in chlorophyll a in the Atlantic and Indian sectors of the Southern Ocean during the bloom period (from November to January) between 2000 and 2015. Intense chlorophyll a blooms spread downstream of South Georgia (36 °W; 54 °S) and Kerguelen Plateau (70°E; 49°S) transported by the ACC. The solid black line locates an intense ACC core, the Polar Front. Dashed white box locates the study region shown in the bottom panels. (B,C) Comparison of shallow topography (<1000 m depth) identified in a global bathymetric product (B, black areas) and seamounts shallower of 1000 m located by Yesson et al. (2011) (C, black triangles) in the southern Agulhas Basin. Colored contour lines locate the at-sea habitat of Antarctic Fur Seals (Arctocephalus gazella; red), Southern Elephants Seals (Mirounga leonina; yellow), King Penguins (Aptenodytes patagonicus; cyan), Macaroni Penguins (Eudyptes chrysolophus; green) and Southern Rockhopper Penguins (Eudyptes chrysocome chrysocome; magenta) from the Prince Edward Islands (white dot in the A) [data are reproduced from Reisinger et al. (2018)].
Away from the islands, the interaction of the ACC with large and deep (>2500 m) topographic features, as mid-ocean ridges, is recognized to generate intense upward movements (Sokolov and Rintoul, 2007; Rintoul, 2018). These vertical motions regularly sustain some phytoplankton productivity through the injection of iron into the euphotic layer (Sokolov and Rintoul, 2007). However, with the notable exception of isolated contributions from hydrothermal vents (Ardyna et al., 2019), these vast open ocean regions show a yearly averaged phytoplankton biomass much lower than the island systems. Thereby, their contribution to the primary production of the ACC region is considered comparatively negligible (Graham et al., 2015; Ardyna et al., 2017). Furthermore, these regionally contrasted quantitative assessments of primary production are accompanied by differences in phytoplankton community composition. Islands blooms are dominated by diatoms, while the open ocean low productive (low phytoplankton) regions are generally described by other lower size (nano-, pico-plankton) phytoplankton communities, like for instance Phaeocystis (Detmer and Bathmann, 1997; Gervais et al., 2002; Smetacek et al., 2004; Queguiner, 2013). These High Nutrient Low Chlorophyll (HNLC) communities are less likely to support pelagic ecosystems that include large predators as marine mammals or seabirds (Cushing, 1989; Moline et al., 2004; Pakhomov et al., 2019).
It is becoming therefore tempting to see the ACC as an (iron limited) HNLC phytoplankton-desert, punctuated by oases in the wake of islands or hydrothermal vents. However, this view is not consistent with megafauna observations. One of the supposedly low productive regions has been recently associated to intense foraging activity of five species of swimming predators breeding at the Prince Edward Islands: Antarctic Fur Seals (Arctocephalus gazella), Southern Elephants Seals (Mirounga leonina), King Penguins (Aptenodytes patagonicus), Macaroni Penguins (Eudyptes chrysolophus), and Southern Rockhopper Penguins (Eudyptes chrysocome chrysocome) (Arthur et al., 2017; Pistorius et al., 2017; Reisinger et al., 2018). Differently from the colonies of the South Georgia and Kerguelen Islands, penguins and seals, after moving to the PF region, travel upstream and explore an apparently oligotrophic area (Figure 1A). Although some of the animals focus on an area associated to intense phytoplankton blooms sustained by upwelled water masses enriched by hydrothermal iron (downstream of 30°E; Ardyna et al., 2019), some others travel and forage further upstream, in the supposedly HNLC biologically-desert area. These long trips are recurrent and energy-consuming and require to be balanced by profitable prey captures. But what is the origin of the phytoplankton production sustaining this prey field?
This paper addresses this question, reassessing from an ecological viewpoint the productivity and nutrient delivery of vast open ocean regions in the ACC area. In particular, our work proposes to extend the biogeochemical island mass effect to the numerous seamounts located upstream of the foraging grounds of marine high-level predators (Figure 1C). In respect to previous studies which assessed the seamounts effect as negligible compared with the island one (e.g., Graham et al., 2015; Ardyna et al., 2017), we propose to investigate it further through two new main datasets. First of all, we use the high resolution seamount inventory provided by Yesson et al. (2011) (an illustrative example is depicted in the bottom panels of Figure 1). Previous studies analyzed coarser bathymetric dataset, thus not allowing to identify most of the seamounts. Secondly, we assume a regional ecological perspective, while previous works had a large-scale biogeochemical focus (Graham et al., 2015; Ardyna et al., 2017). In this aim, we investigate the seamount effect over seasonal time scales and we complement the satellite images with profiling floats’ observations, which allow us to infer the total phytoplankton biomass contained in the water column. Indeed, from a circumpolar biogeochemical viewpoint, moderate phytoplankton biomass may appear almost invisible on annual mean climatology when compared to the dramatic production occurring in the wake of the subantarctic islands. However, from an ecological perspective, seasonal secondary blooms may represent a critical input of biomass for local trophic chains. This is especially true when considering the possible effect of these blooms in sustaining foraging grounds of predators who are tied to a specific region for energetic or physiological purposes.
We stress that understanding the factors behind the foraging activity of land-breeding predators is of urgent concern, given the increasing attention that the subantarctic open ocean is receiving within the Commission for the Conservation of Antarctic Marine Living Resources (e.g., Sc-Camlr-XXXVII (2018), Annex 7, para. 3.74; Ccamlr-XXXVII (2018), para. 6.60). A key step to that end is to improve our comprehension of the biophysical processes which sustain biological productivity up to megafauna species. Using a Lagrangian approach (Lehahn et al., 2018), we propose here to test how seamounts complement the island mass effect in fueling pelagic ecosystems within the ACC domain and how they affect the biological production inferred from land-based top predators.
Materials and Methods
Predators Distribution
Predators distribution is estimated from tracking data of seabirds and seals from the Prince Edward Islands between 2003 and 2014 and collected from research programs supported by the National Research Foundation and the South African Department of Environmental Affairs (Reisinger et al., 2017)1. The animals’ trajectories we use in this work have been analyzed in detail in Reisinger et al. (2018): here we report only the information relevant for our study, which is the large-scale geographical extension of their habitat utilization, i.e., the whole smoothed spatial range of predators. In this study we consider only the tracking data of seals and penguins, because they display a more selective habitat than flying seabirds (Reisinger et al., 2018). The Subantarctic Fur Seals (Arctocephalus tropicalis) are not considered because the at-sea distribution of this colony is mostly located north of the Subantarctic Front which bound our study region [see Figure 2 in Reisinger et al. (2018)]. Kernel densities of Antarctic Fur Seals (Arctocephalus gazella), Southern Elephants Seals (Mirounga leonina), King Penguins (Aptenodytes patagonicus), Macaroni Penguins (Eudyptes chrysolophus) and Southern Rockhopper Penguins (Eudyptes chrysocome chrysocome) from the Prince Edward Islands were calculated using the “kde2d” function from the R-package “MASS” on the observed tracks (Venables and Ripley, 2002). The habitat utilization for each colony is identified with a threshold of 95% of each predator density (complete kernel utilization distributions are available for each species in Reisinger et al., 2018; Figure 2). This allows us to identify the whole spatial range used by multiple subantarctic predators including different phases and behavior of their trajectories (usually traveling and foraging).
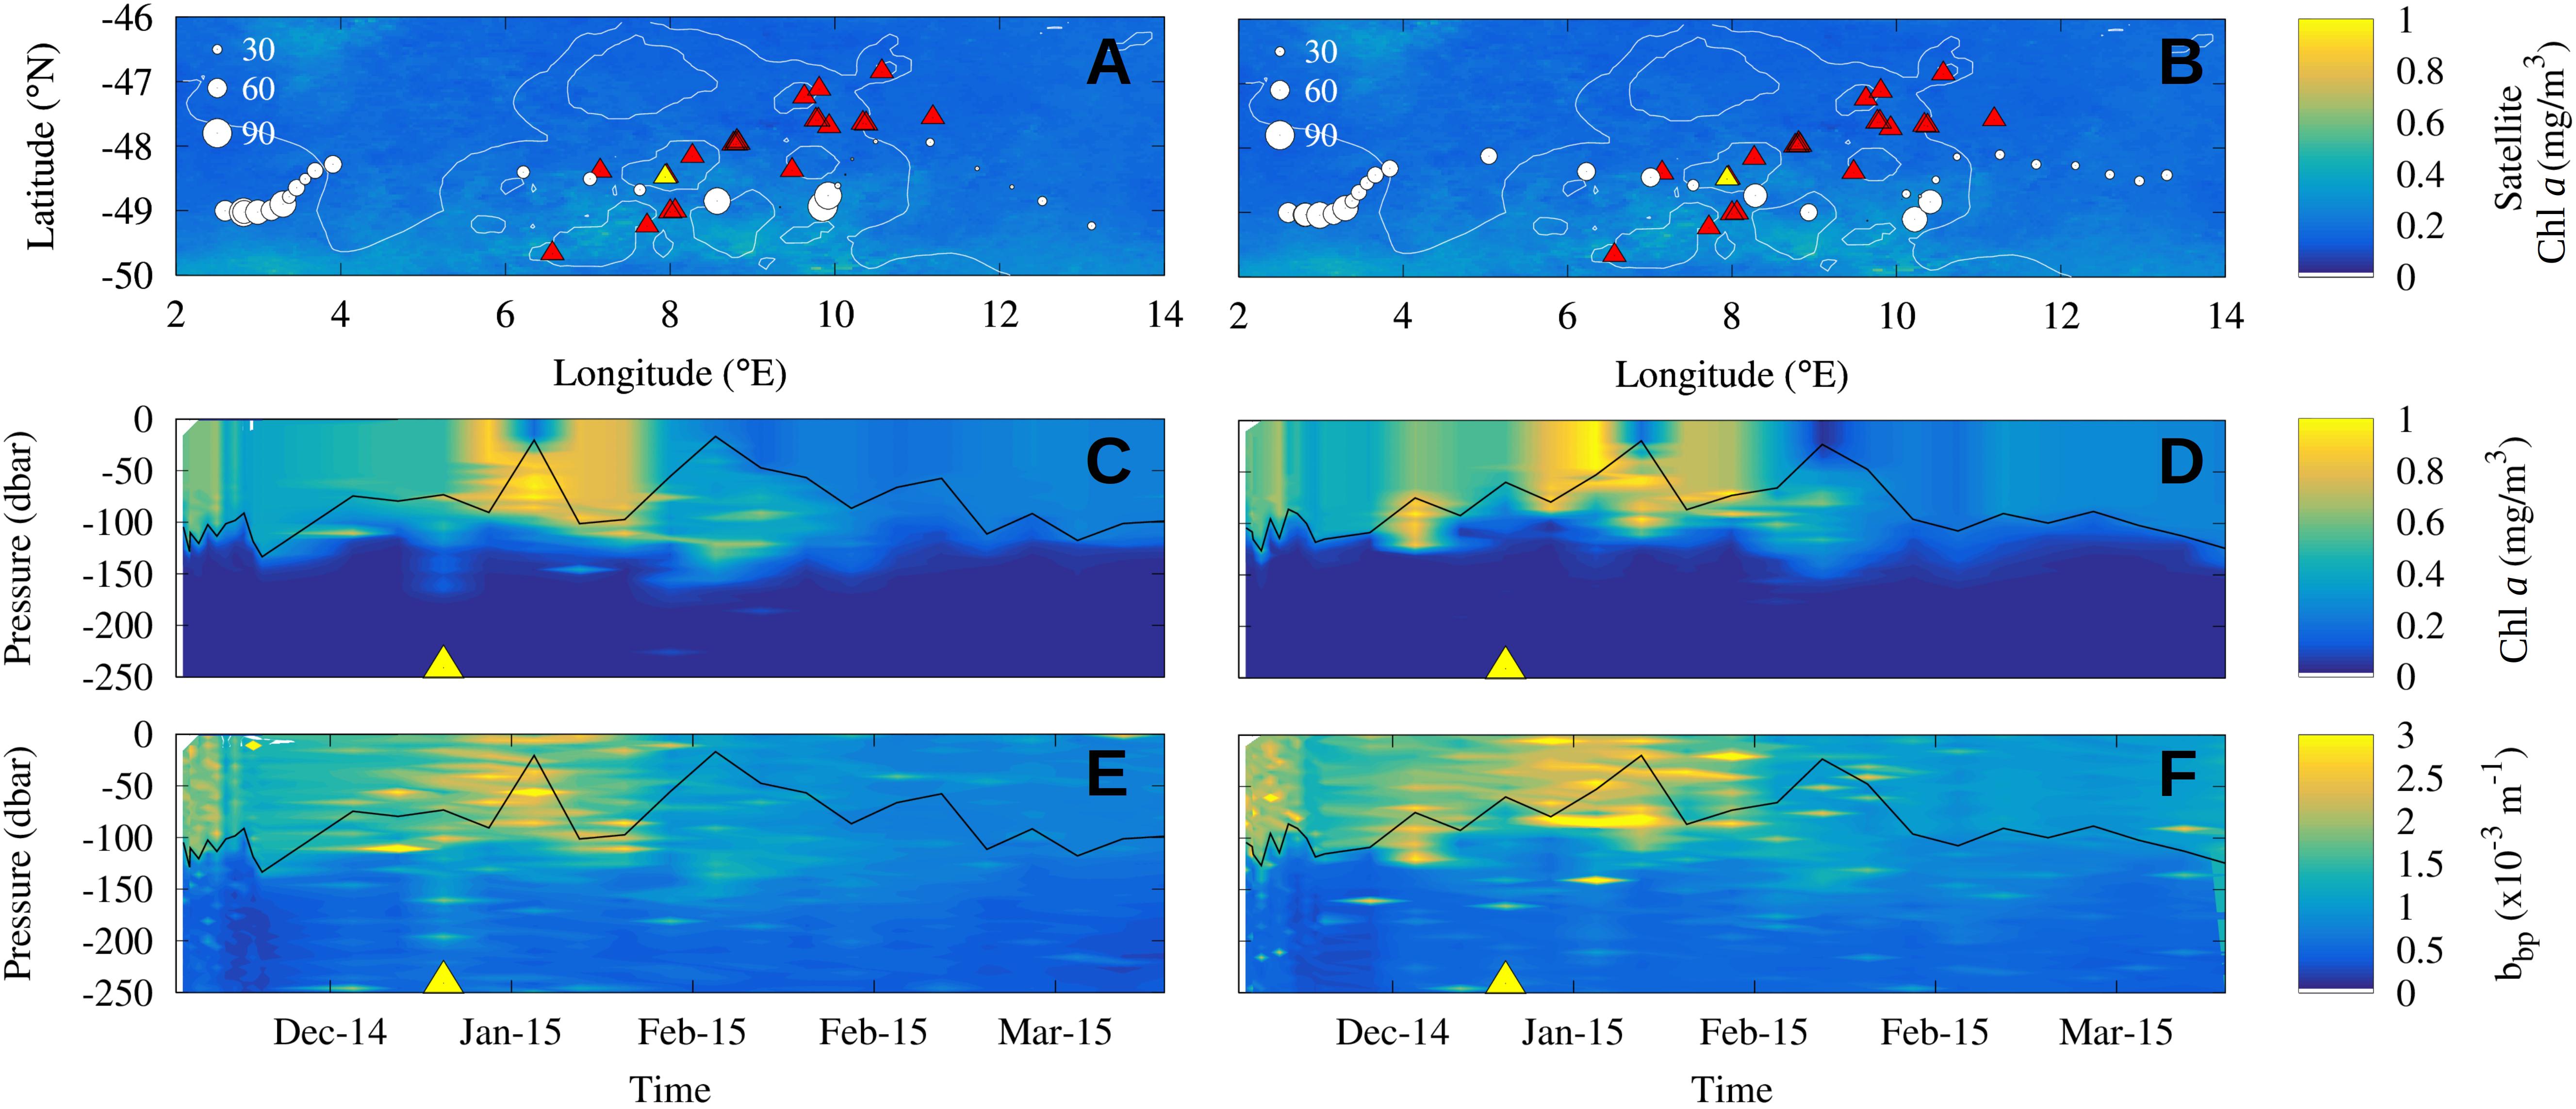
Figure 2. Observed Chl a enhancement in the wake of seamounts by BGC-Argo WMO 6901688 (A,C,E) and WMO 6901585 (B,D,F) during the summer season 2014/2015. (A,B) Maps of the floats trajectory across the Shona Ridge System: each circle represents a vertical profile and its size is proportional to Chl a integrated over the mixed layer [the mixed layer depth is shown in the panels (C–F) with the solid black line]. Color scale shows the Chl a observed by satellite in January 2015 and red triangles the seamounts location. (C,D) Time series of the vertical distribution of Chl a concentration measured from the BGC-Argo floats along their trajectories. (E,F) Vertical profiles of backscattering measured from the BGC-Argo floats along their trajectories. Yellow triangles in the middle and bottom panels locate the time of the float closest position to the yellow seamount in the top panels. This may be interpreted as the contact of the BGC-Argo with the axis of the seamount chain.
Seamounts
Seamounts are defined as geomorphological features having a vertical elevation of more than 1000 m from the seafloor with limited extent across the top summit region (Menard, 1964; Staudigel et al., 2010). The seamounts’ summit location is extracted from Yesson et al. (2011). We retain here only the shallower structures having a maximal water depth of 1000 m, in order to compare them with the ocean upper layer horizontal velocity fields derived from altimetry. In the following, a seamount is defined by a disk centered in the seamount summit and with a 70 km radius. In the same way, the region under the influence of Bouvet Island is defined by a disk centered in the island (3.36°E; 54.42°S) with a 70 km radius.
Satellite Observations and Reanalysis Data
Geostrophic velocities, surface chlorophyll a (Chl a) and temperature reanalysis are evaluated between 2000 and 2015 from different products distributed by the European Copernicus Marine Environment Monitoring Service2.
Geostrophic currents are quantified through an altimetry multi-satellite global product (product id: SEALEVEL_GLO_ PHY_L4_REP_OBSERVATIONS_008_047) produced by SSALTO/DUACS. This product processes data from all altimeter missions (Jason-3, Sentinel-3A, HY-2A, Saral/AltiKa, CryoSat-2, Jason-2, Jason-1, T/P, ENVISAT, GFO, ERS1/2) and has temporal and spatial resolutions of, respectively, 1 day and 1/4°. Trajectories are derived by applying a Runge–Kutta fourth order scheme with a time step of 6 h. Velocity fields are linearly interpolated in both space and time.
Satellite surface Chl a concentration is analyzed with the Global Ocean Color product (product id: OCEANCOLOUR_ GLO_CHL_L4_REP_OBSERVATIONS_009_082) produced by ACRI-ST. The product evaluated has a 1/24° spatial resolution. Here, we consider monthly-mean composites in order to reduce the cloud coverage and at the same time preserve the mesoscale variability of the Chl a blooms. Similarly to previous studies, the term “bloom” refers to regions of relative elevated Chl a compared to the background concentration (Sokolov and Rintoul, 2007). The statistical significance of the Chl a enhancement is evaluated with the bootstrap method (a detailed description of the method used for the identification of Chl a blooms is provided in the section “Seamount Mass Effect: Detection of the Lagrangian Plume Stemming From the Seamounts”). Chl a values are investigated in spring and summer (from October to February) ahead of the maximum feeding activities of higher trophic levels (Laws, 1985; Moline et al., 2004; De Broyer et al., 2014).
Phytoplankton dominance is evaluated from the PHYSAT observations (Alvain et al., 2005, 2008) between 2000 and 2011 from the month of December and January, when we expect a larger diatoms dominance (Smetacek et al., 1990; Alvain et al., 2008). The PHYSAT method has already been validated at the global and regional scale in the Southern Ocean (Alvain et al., 2005, 2008, 2013; see in particular d’Ovidio et al., 2010 Supplementary Material for a validation at the latitudes used here). The method identifies probable specific dominant phytoplankton groups based on the analysis of spectral measurements computed by ocean-color sensors. These are nano-eukaryotes, Prochlorococcus, Synechococcus, diatoms, Phaeocystis-like and coccolithophores. Note that a phytoplankton group is defined as dominant when it is a major contributor to the total pigment (Alvain et al., 2005). As demonstrated in Della Penna et al. (2018), a large number of pixels of PHYSAT daily maps are flagged as not classified in this oceanic region, so that composite maps must span very large periods in order to provide meaningful spatial patterns. For this reason, and because we study large scale features, in our analysis we have used multi-year PHYSAT composites, without resolving interannual variability.
Vertical distribution of temperatures is evaluated with the global ocean reanalysis GLORYS2V4 produced by Mercator Ocean for the Global Ocean and Sea Ice Physics (product id: GLOBAL_REANALYSIS_PHY_001_025). This product is performed with NEMOv3.1 ocean model in configuration ORCA025_LIM and has horizontal spatial resolution of 1/4° with 75 vertical levels. For the analyses we used the product version averaged by month. The water masses associated to the position of the Antarctic Polar Front (PF) are identified as the northern extent of the presence of the 2°C isotherm minimum in the subsurface (0–500 m depth) (Botnikov, 1963).
Biogeochemical Argo Floats
The vertical profiles of Chl a concentration and backscattering measured from the Biogeochemical Argo (thereafter BGC-Argo) floats have been extracted from the CORIOLIS Global Data Assembly Center3. Quality control tests have been achieved on the Chl a and backscattering data (Schmechtig et al., 2014, 2018). Non-photochemical quenching on daytime profiles are also corrected on the Chl a data following (Xing et al., 2012). In this aim, the maximal Chl a value above the mixed layer depth is extrapolated until the surface and corrected with a specific correction factor. In order to adapt the correction procedure to the study region, the non-photochemical quenching is corrected with the calibration factor of 3.3 used by Ardyna et al. (2019) in the same region. The mixed layer depth is evaluated in each profile as the depth of a density difference of 0.03 kg/m3 in respect to the density at 10 m depth. The density is computed based on International Thermodynamic Equation of Seawater (Sérazin, 2011).
Seamount Mass Effect: Detection of the Lagrangian Plume Stemming From the Seamounts
In order to identify the effects of seamounts on phytoplanktonic blooms we analyze whether possible water parcels displaying enhanced Chl a have, or have not, been in contact with the seamounts. To achieve this, we compute a backward-in-time, altimetry-based Lagrangian calculation from the bloom periods. This calculation allows us to identify the water parcels that transited over a seamounts area, defined here as a disk of 70 km radius. This value is chosen considering that altimetry data are expected to resolve features on the order of 70 km or larger (Pascual et al., 2006). The aim is to compare the water dispersion pathways computed downstream of the seamounts, in the following referred to as the Lagrangian water plume, to the Chl a plume. This approach has already been validated for the island mass effect, to reproduce the Kerguelen bloom (d’Ovidio et al., 2015; Sanial et al., 2015) and the Crozet bloom (Sanial et al., 2014) at mesoscale precision.
For each studied period the analysis is conducted in two steps:
(1) Identification of the seamounts that are located within deep iron-enriched hydrographic regions. For each seamount we verify if, in the 4 months before the bloom, it was located within the PF. This current core of the ACC is associated to enhanced dissolved iron concentrations (De Baar et al., 1995; Löscher et al., 1997; Measures and Vink, 2001; Mengelt et al., 2001; Viljoen et al., 2018) presumably upwelled from the deep layer (Sokolov and Rintoul, 2007). The PF is identified for the whole period in the vertical temperature reanalysis as described in section “Satellite Observations and Reanalysis Data.” We applied the same approach to the water parcels that have been in contact with Bouvet Island, which is also a potential source of iron to the environment (Perissinotto et al., 1992; Croot et al., 2004). The latter contact is estimated by detecting the water masses which transited over the island in the 4 months before the bloom.
(2) Identification of the Lagrangian water plume from the selected seamounts. Each water parcel of the study region is advected backward-in-time from the blooming period for 4 months. The parcels which are found to come from an area where a seamount is present are then given a timestamp with the time, in days, since they left that topographic features. The 4-month time window chosen for the integration assumes that the extension springtime bloom is pre-conditioned by the winter-time advection of iron rich waters (Mongin et al., 2009).
The enhancement of the Chl a concentration within the 100-day Lagrangian water plume is evaluated with the bootstrap method in order to obtain its statistical significance. The bootstrap is conducted on sub-sampled Chl a maps, selecting one pixel each five both in longitude and latitude directions. This is done to remove spatial correlations of the order of the typical size of a mesoscale eddy of this region (about 100 km). For the region under the influence of Bouvet, the Lagrangian water plume spreading downstream of the island is removed from the Lagrangian water plume reconstructed with the seamounts. This allows us to distinguish the plume from the seamounts in respect to the one induced by the island.
Results
Chlorophyll a Enhancement Observed From BGC-Argo Downstream of Seamounts
Two BGC-Argo floats (WMO 6901585 and 6901688) sampled the Shona Ridge region. They crossed the seamount chain around 49°S between the end of December 2014 and January 2015 with a time lag of a few days (Figure 2). A local increase of the depth-integrated biomass over the mixed layer downstream of seamounts (8–10°E) is recorded by the profiling floats: the Chl a content doubled in the float WMO 6901585 (Figure 2A) and increased by approximately one third in the float WMO 6801688 (Figure 2B). These observations contrast with the homogeneous low Chl a concentration (about 0.3 mg/m3) observed by satellite in January 2015 in the near surface (background images in Figures 2A,B). When looking at the Chl a content in the water column, neglecting the variability of the mixed layer depth which is deeper than 100 m upstream of the seamounts and shallower than 40 m over them, the intensification of the Chl a signature downstream of the seamounts is evident in both floats (Figures 2C,D). The vertical profiles depict an increase in Chl a and backscattering values in the first 100 m depth downstream of the seamounts (respectively, about 1 mg/m3 and 3.0 × 10⁻³ m–1) compared to the water masses upstream (respectively, about 0.6 mg/m3 and 2.0 × 10⁻³ m–1). Note that the yellow triangles in Figures 2C,E (respectively, Figures 2D,F) locate the time of the closest position of the BGC Argos trajectories with the yellow seamount in Figure 2A (respectively, Figure 2B). They symbolize the crossing of the seamount chain. The phytoplankton enhancement downstream of seamounts is further investigate with satellite observations which have larger spatial and temporal covers.
Altimetry-Based Lagrangian Reconstruction of the Seamount Mass Effect
We assume here the hypothesis of a seamount mass effect on phytoplankton biomass, in analogy to the well known island mass effect. This hypothesis implies the formation of phytoplanktonic blooms induced by natural iron fertilization spreading downstream of the seamounts. We discuss the possible mechanisms of iron upwelling in section “Discussion”.
Two seamount chains are susceptible to lift iron-laden deep waters to the surface layer and consequently enhance the phytoplankton biomass in the studied region: the Shona Ridge System (SRS), which is composed by the Shona Ridge and the Meteor Rise, and the South-West Indian Ridge (SWIR) (see Figures 1B,C for their localization). Yesson et al. (2011) identified 36 seamounts shallower than 1000 meters depth associated with the SRS, with one third of them shallower than 100 m depth, and 26 seamounts shallower than 1000 m associated to the SWIR in the study region (between 0 and 30°E). When looking at Chl a images not yearly averaged, but over time periods of 1 month during spring or summer, Chl a signatures significantly above the background (around 2-fold) do appear downstream of both the seamount chains (as illustrated in Figures 3A,B, 4A).
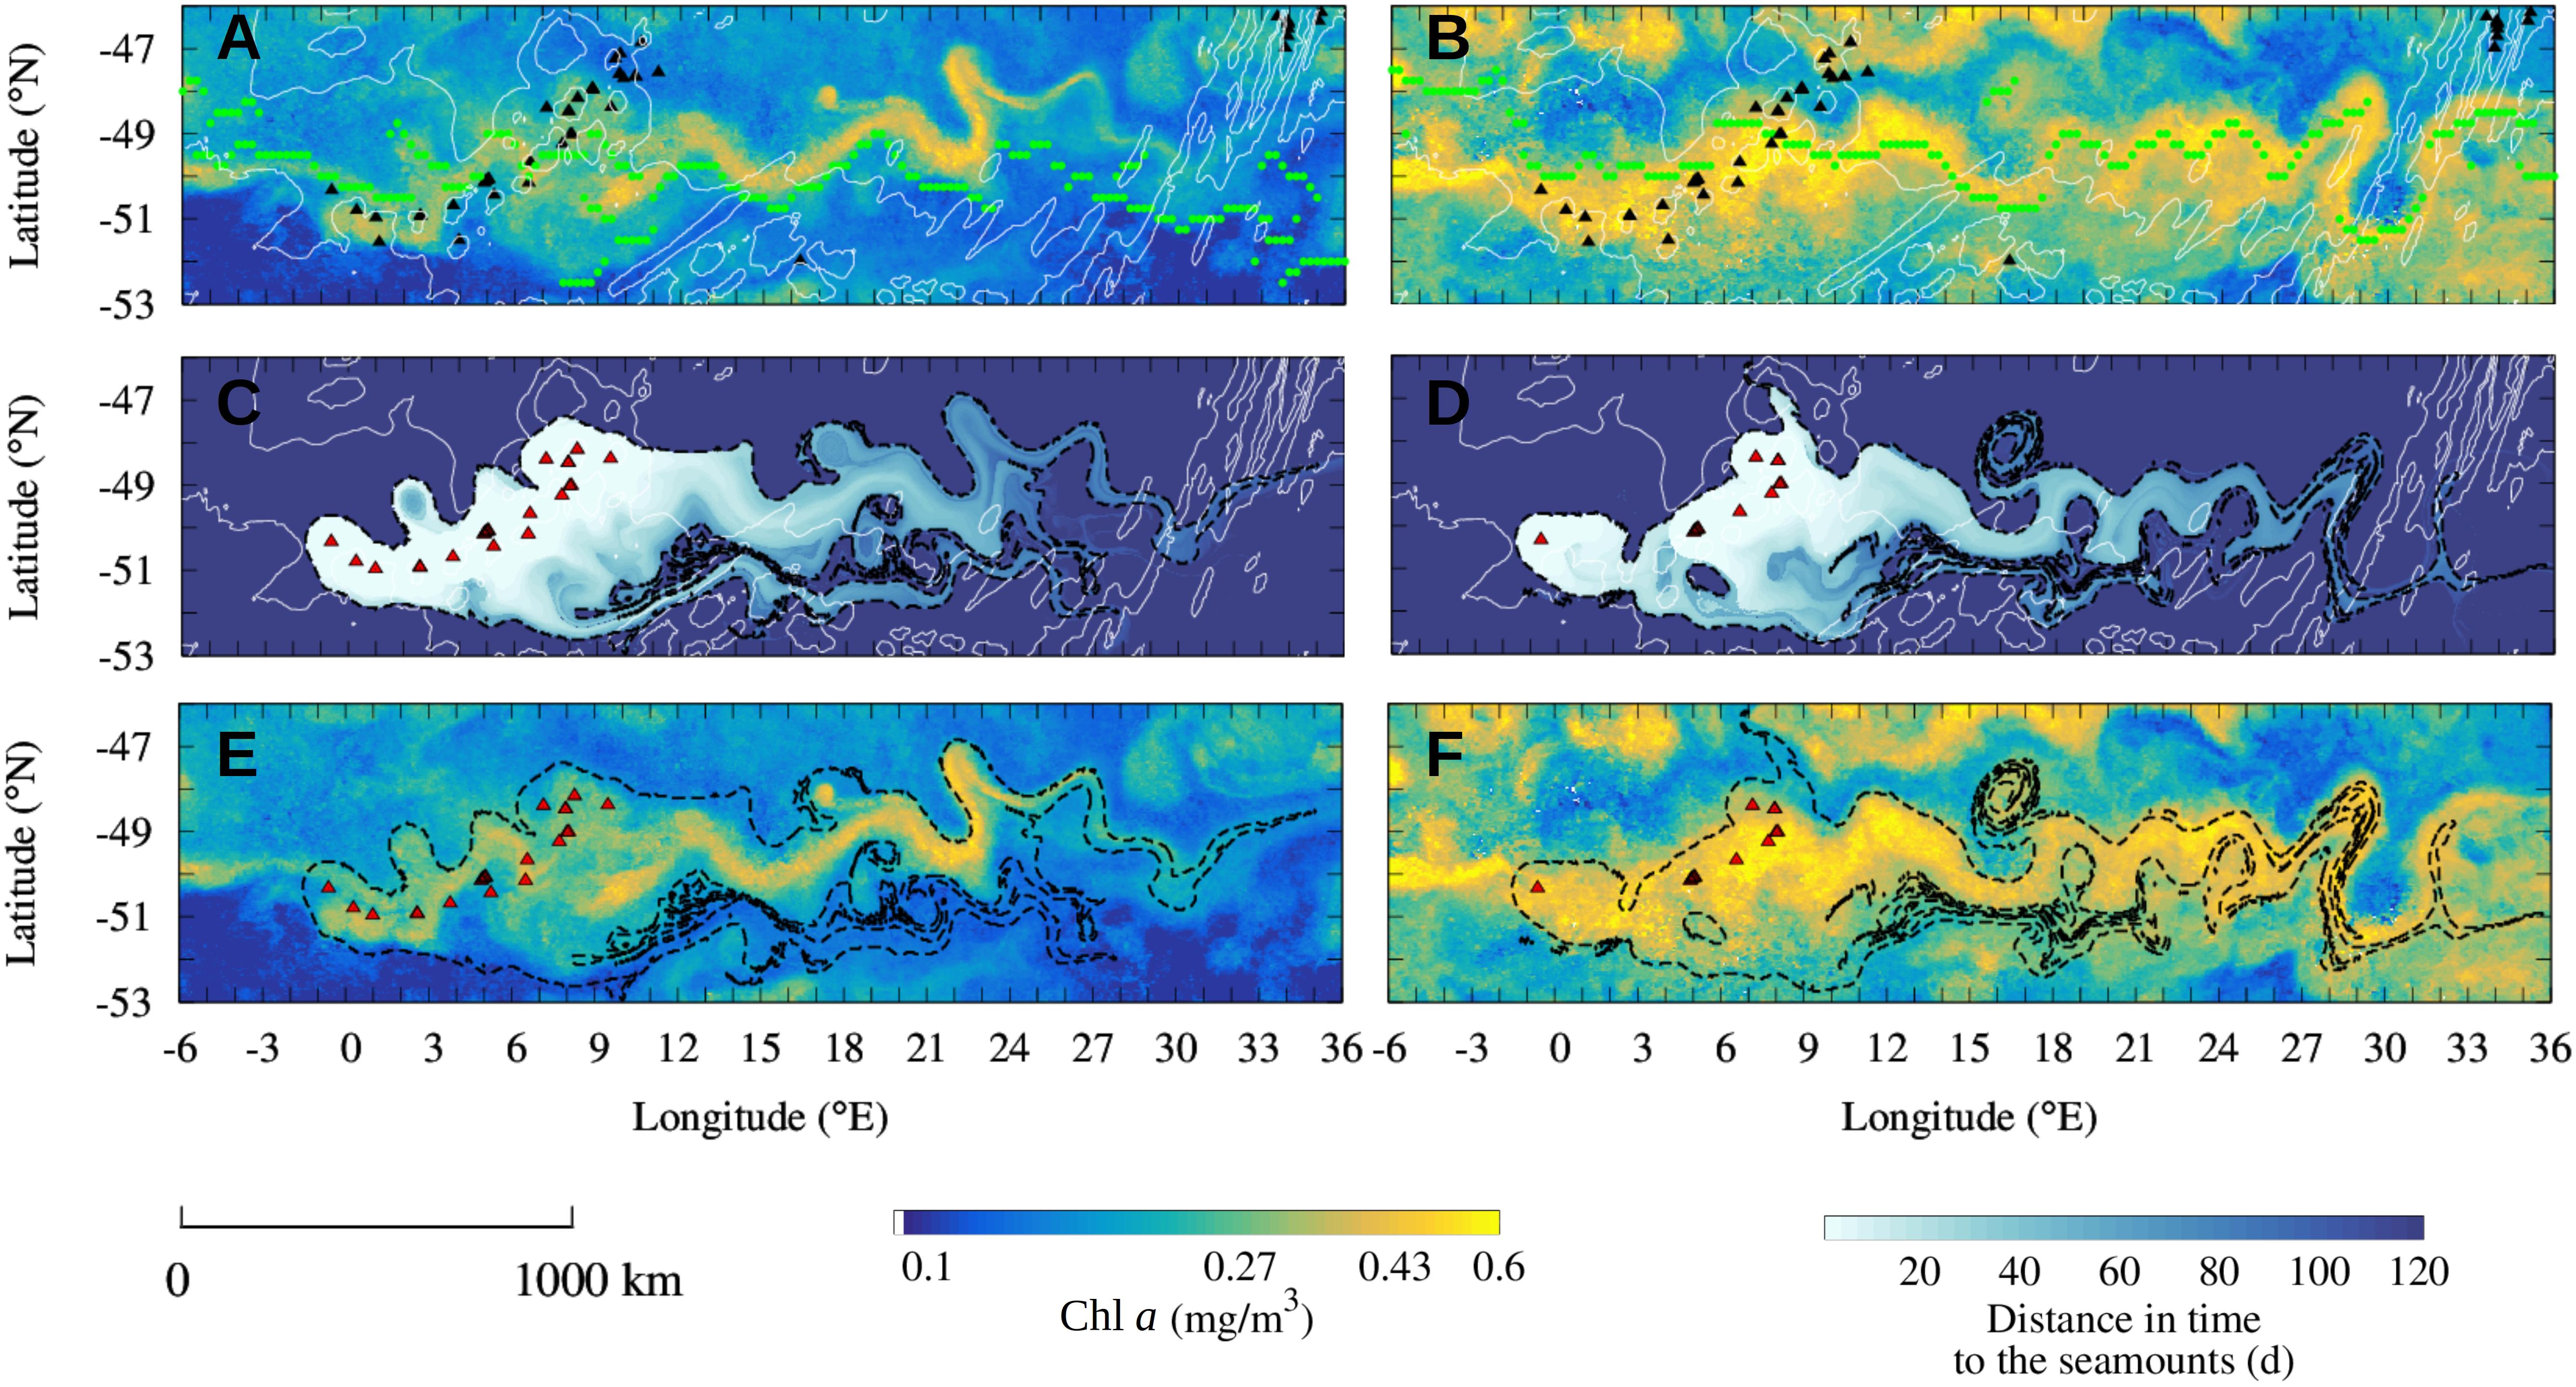
Figure 3. Observation of the seamount mass effect on the Shona Ridge System in February 2004 (A,C,E) and in December 2004 (B,D,F). (A,B) Observation of Chl a plumes downstream of the shallow seamounts of the SRS (black triangles) in February 2004 (A) and December 2004 (B). The Chl a plumes spread over thousands of kilometers aligned with the PF current core (green dots). (C,D) Reconstruction of the Lagrangian plumes from the seamounts of the SRS selected for the study periods (red triangles). Black contours indicate the water masses that have been in contact in the 100 days before the blooms event with the selected seamounts. (E,F) Comparison of the Chl a plume observed in the monthly-mean composite images with the Lagrangian plumes estimated from altimetry [black contours extracted from panels (C,D)]. Shallow seamounts identified in each time period for the Lagrangian analysis are shown in red (C–F). Isobaths of bottom topography of 3000 m and 4100 m depths are shown in white (A–D). Note the logarithmic scale for the Chl a images.
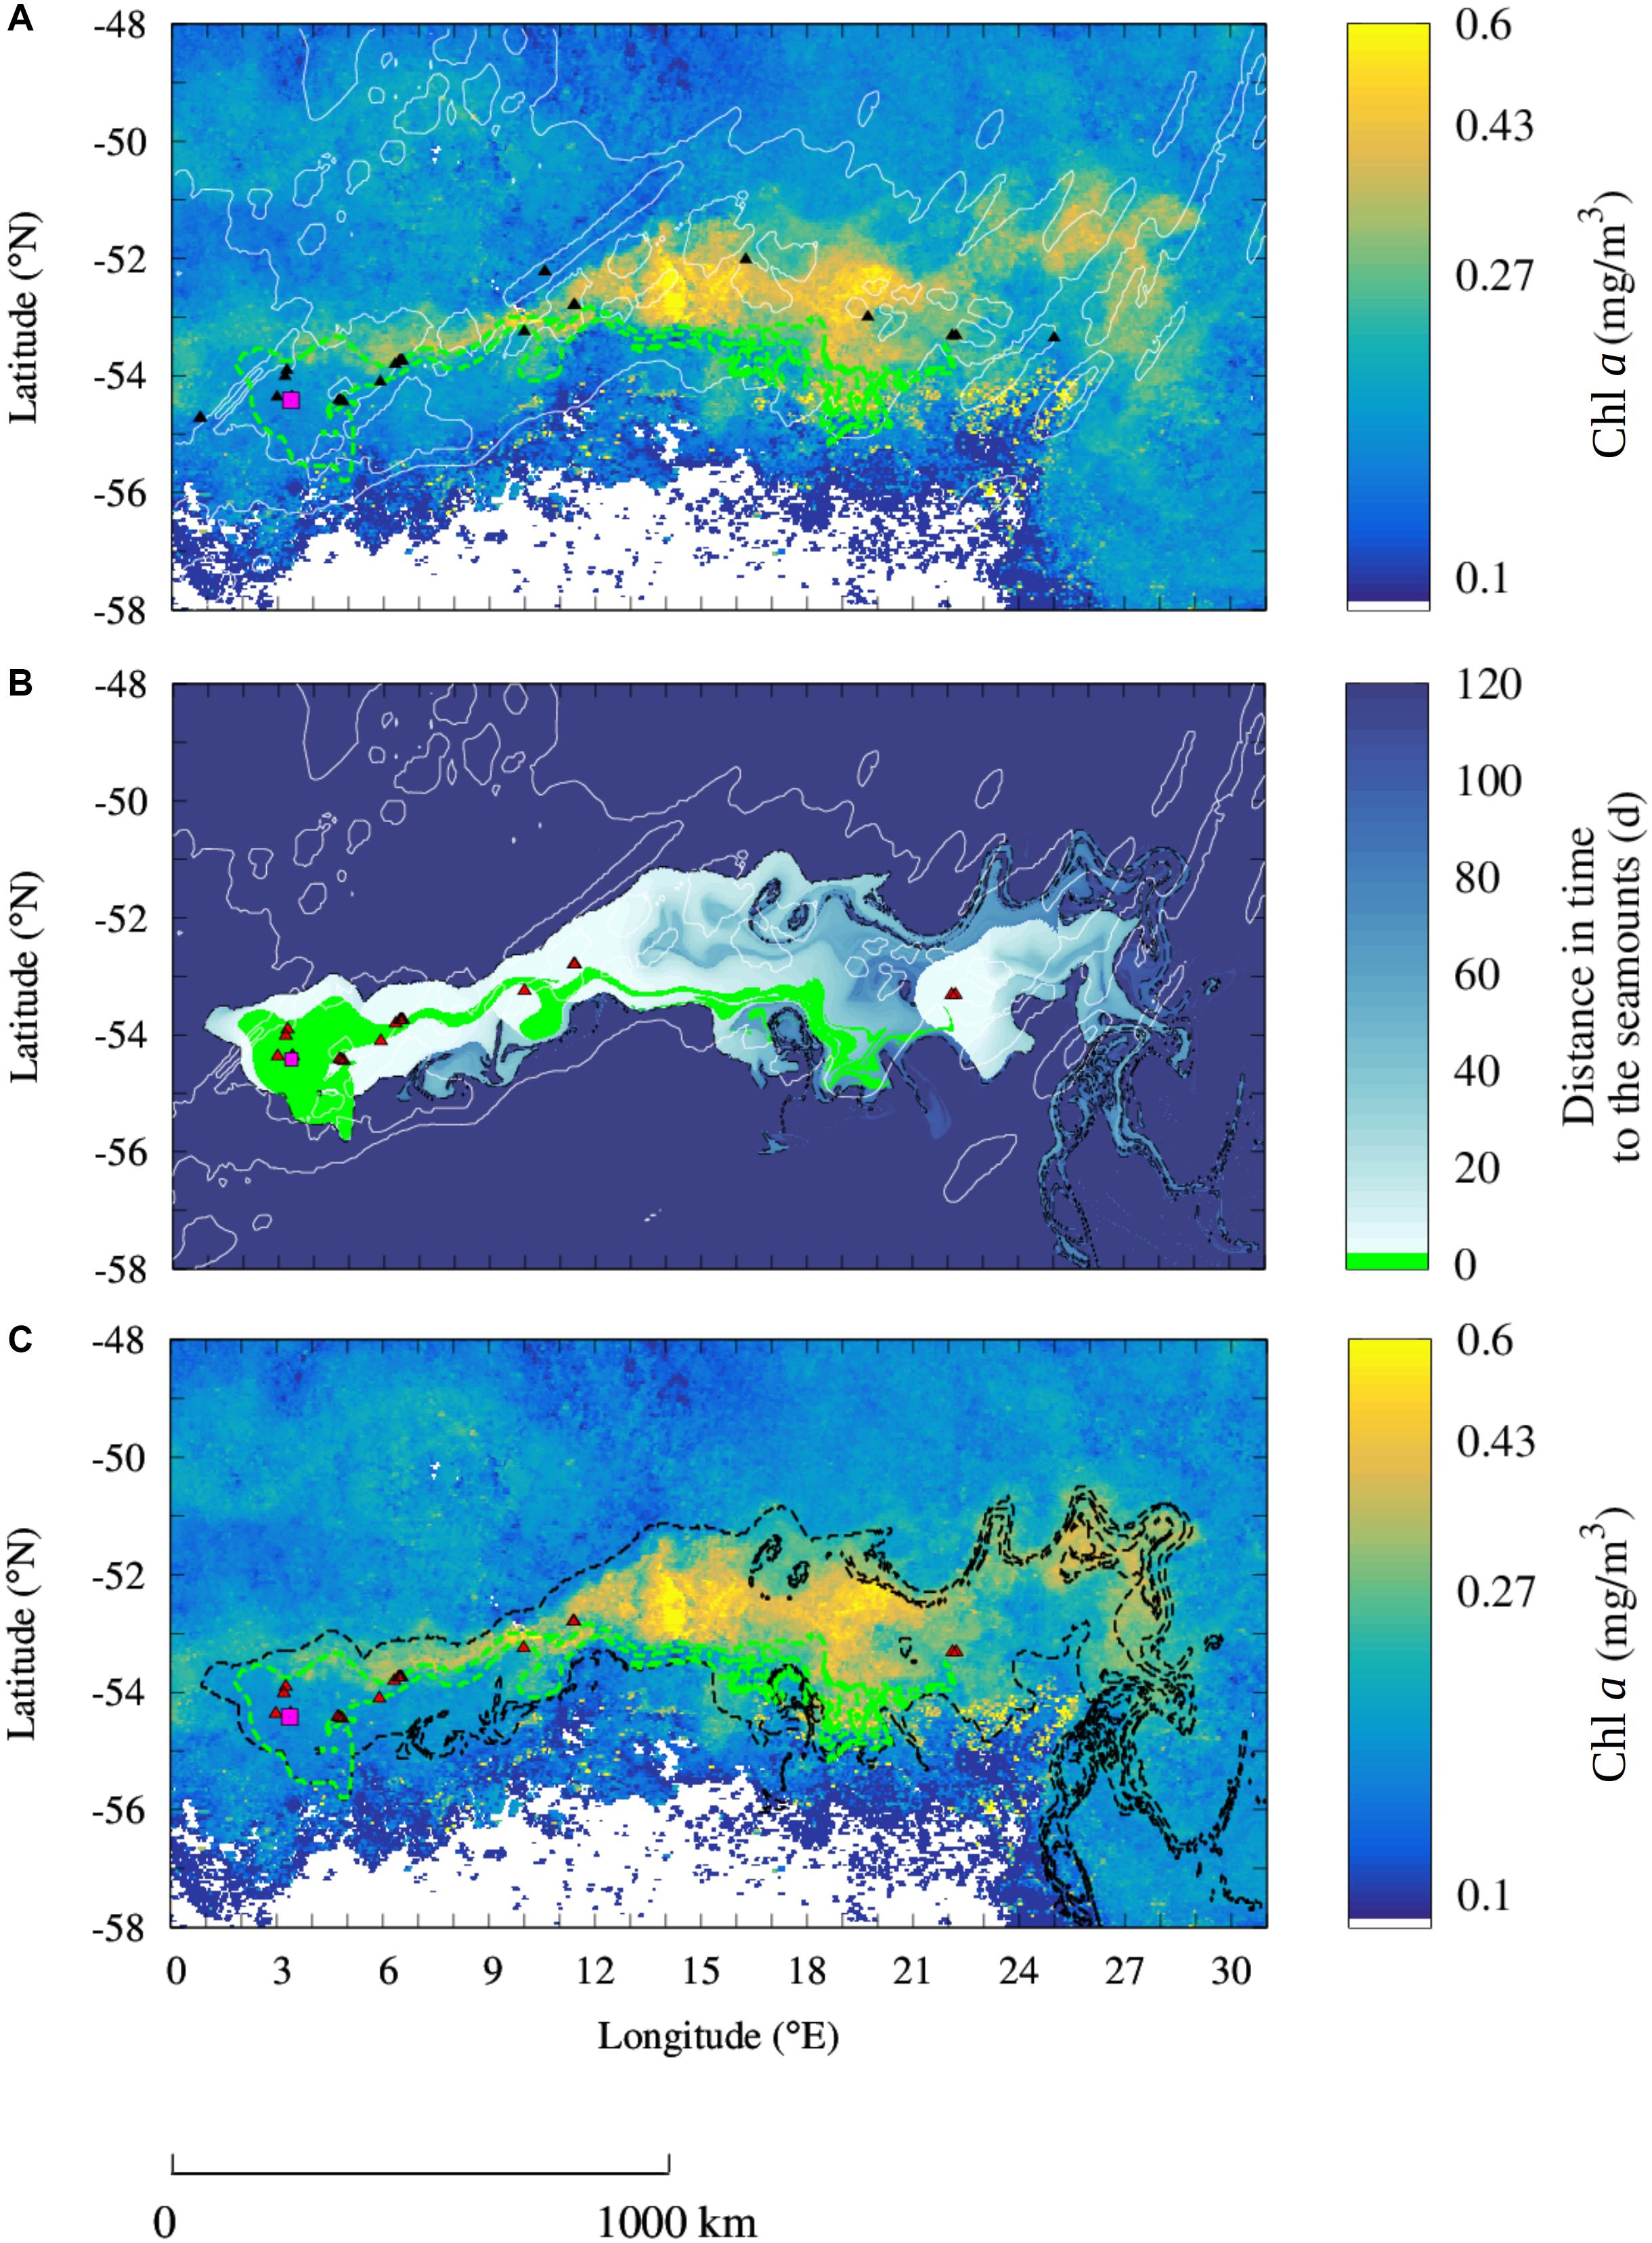
Figure 4. Observation of seamount mass effect from the SWIR complex. (A) Observation of a Chl a plume downstream of the shallow seamounts of the SWIR (black triangles) in October 2002. (B) Reconstruction of the Lagrangian plume from the seamount of the SWIR selected for the study period (red triangles). Black contours indicate the water masses that have been in contact in the 100 days before the bloom event with the selected seamounts. (C) Comparison of the Chl a plume observed in the monthly-mean composite image with the Lagrangian plume estimated from altimetry [black contour extracted from panel (B)]. The Lagrangian plume stemming from Bouvet Island (magenta square) and computed over the 4 months before the bloom is overlapped in all the panels [green contours in panels (A,C) and green area in panel (B)]. Shallow seamounts identified at the study period for the Lagrangian analysis are shown in red (B,C). Isobaths of bottom topography of 3000 and 4100 m depths are shown in white (B,C). Note the logarithmic scale for the Chl a images. Whites areas in Chl a images (A,C) correspond to unidentified regions.
In order to further sustain the hypothesis of a seamount mass effect, we study the morphology of the satellite-observed Chl a plumes detected in the vicinity of seamounts. In particular, we analyze whether the shape of these plumes is consistent with a dispersal pattern stemming from a seamount. In order to achieve this, we reproduce the Lagrangian plumes associated with the seamounts during the blooms event using altimetry-derived currents. The analysis consists in detecting the water parcels which transited above the seamounts in a certain time period with a Lagrangian approach. As explained in section (Seamount Mass Effect: Detection of the Lagrangian Plume Stemming From the Seamounts), for each bloom period the Lagrangian plumes are derived only from the subset of seamounts which were in contact with potentially deep iron-enriched hydrographic provinces. Here we consider two regions that have been identified in the literature for displaying higher iron concentration, the water masses downstream of Bouvet Island (Perissinotto et al., 1992; Croot et al., 2004) and the water masses located in the ACC along the jet associated with the PF (De Baar et al., 1995; Löscher et al., 1997; Measures and Vink, 2001; Mengelt et al., 2001; Viljoen et al., 2018). This hypothesis will be discussed in section “Drivers of the Seamount Mass Effect.” We illustrate the analysis region by region.
Shona Ridge System
The ACC crosses longitudinally the SRS between 0 and 10°E. In both February and December 2004, a distinct Chl a plume topping at 0.6 mg/m3 spreads downstream of the SRS aligned with the PF current core (Figures 3A,B). The monthly-mean composite images of Chl a are compared to the altimetry-derived Lagrangian reconstruction of the water plumes emanating from the seamounts of the SRS which have been in contact with iron-enriched water masses (Figures 3C,D). These plumes represent the water transported by the ACC which has transited over shallow seamounts in the 4 months before the blooms. The color of Figures 3C,D represents the number of days since last contact, i.e., a pixel color coded with “30 days” was on the top of a seamount 30 days before the date of the image. The 100-day Lagrangian water plumes (black contours in Figures 3C,D) are overlapped to the Chl a plumes (Figures 3E,F). The Lagrangian analysis reveals that, in both studied periods, the Chl a plume extending downstream of the seamounts matches up to fine details the reconstructed water masses that transited over the seamounts few months previous the bloom.
The good prediction of the extension and shape of Chl a gives us confidence about the role of the selected seamounts. Remarkable examples of the match between ocean-color and altimetry-derived features are the correspondence of meanders and mesoscale features between the two signatures, such as the distinct Chl a patch trapped by a mesoscale eddy around 17°E 48.5°S in February 2004 (Figure 3A). Note that even if the Chl a plume is aligned with the PF current core, particularly in December 2004 (Figure 3D), the complexity of the Chl a plume is captured just with the advection of water masses that surrounded the seamounts. This is the case for instance for the latitudinal extension of the plume close to the SRS, between 3 and 9°E, in December 2004 (Figures 3D,F) or the extension of the plume between 15 and 30°E in February 2004 (Figures 3A,C). We remark also that the selected seamounts are different in February and December 2004 and that similarly, the same seamounts may be located in different productivity regimes at the two periods. For instance, in December 2004 the shallow seamounts at 48 °S were not in contact with the current core of the ACC (they are not identified in Figure 3D) and seems to not display enhanced phytoplankton biomass (Figure 3F). Conversely, the same seamounts are associated by the Lagrangian analysis to the Chl a plume in February 2004 (Figures 3C,E). This different behavior suggests a temporal variability of the biological response associated to submerged topography features.
During the study periods, February 2004 and December 2004, the mean Chl a concentration in the water masses that transited in the last 100 days over seamounts in contact with the current core is, respectively, 49 and 40% higher than elsewhere in the region depicted in Figure 3. In order to test whether the observed differences in the Chl a content inside and outside of the Lagrangian plumes are significant, a bootstrap sampling is carried out for each studied period over the whole image size. The null hypothesis states that the observed difference in Chl a content inside and outside the Lagrangian plume is not significant. Standard deviation of the bootstrap distributions inside and outside the plumes are, respectively, 1.2 × 10⁻³ and 5.0 × 10⁻⁴ mg/m3 for the year 2003/2004 and 2.1 × 10⁻³ and 7.1 × 10⁻⁴ mg/m3 for the year 2004/2005. In all the study cases the null hypothesis is rejected with >99% confidence. These analyses provide observational evidence of a seamount mass effect associated to the SRS.
South-West Indian Ridge
Bouvet Island (3.36°E and 54.42°S, indicated by a square in Figure 4) lies on a volcanic system about 50 km west to the SWIR (Georgen et al., 2001) and represents a known iron input in the south-west of the study region (Croot et al., 2004). The island has been associated with enhanced Chl a concentrations and primary production compared to the surrounding areas. However, its effect seems to be locally restricted (e.g., Perissinotto et al., 1992; Croot et al., 2004, refers also to Figure 1A). Differently to what was found in previous studies, in October 2002 a Chl a plume spreads over almost 2000 km downstream of Bouvet Island (Figure 4A). However, the altimetry-derived Lagrangian plume stemming from Bouvet Island (green area in Figure 4A) overlaps only partially the Chl a plume observed from the satellite in this period. Indeed, the Chl a plume extended over a much larger area nearby 26 seamounts shallower than 1000 m (Figure 4A).
Similarly, to the analysis of the SRS, here we consider whether the seamounts of the SWIR may explain the Chl a enhancement which is not explained by the island alone. Specifically, we reproduce the altimetry-derived Lagrangian plume from the seamounts that have been in contact with the water masses enriched in iron at Bouvet Island in the few months before the bloom. Indeed, the few seamounts in the north edge of the SWIR that were not in contact with the iron-enriched water masses stemming from the island did not display enhanced Chl a concentrations. The Lagrangian water plume emanating from the selected seamounts allows us to reproduce the Chl a plume integrally (black contour in Figure 4C), differently to the island Lagrangian plume (green contour). As for the SRS, the Chl a plume and the Lagrangian plume stemming from the seamounts are qualitatively very similar. In addition, the mean Chl a concentration inside the Lagrangian plume is two thirds higher than the mean concentration outside (respectively, 0.26 ± 0.098 mg/m3 inside and 0.16 ± 0.071 mg/m3 outside). Therefore, we infer that the region with highest Chl a values corresponds to water masses that transited, in the 100 days before the bloom, over the seamounts (black contours in Figures 4B,C). A bootstrap sampling carried out on the part of the SWIR plume which is not superposed with the island’s plume rejects the null hypothesis with >99% confidence. Standard deviation of the bootstrap distributions inside and outside the plumes are, respectively, 2.4 × 10⁻³ and 4.8 × 10⁻⁴ mg/m3.
Comparison of Predators’ Distribution, Phytoplankton Biomass and Seamounts Locations in the Southern Agulhas Basin
A 15-year climatology of the December Chl a concentration in the southern Agulhas Basin is shown in Figure 5, which corresponds to the time of Chl a peak in the region (Sokolov and Rintoul, 2007). A 15-year climatology of the Lagrangian water plume issued from the seamounts from the SHS and the SWIR (black triangles), computed as in section “Altimetry-Based Lagrangian Reconstruction of the Seamount Mass Effect,” is overlapped to the Chl a map (black contour). The region covered by the Lagrangian water plume is upstream of the pinnipeds and penguins ranges (white contours). This indicates that the water masses targeted by the predators’ colonies have been under the influence of the seamounts in the previous months (the Lagrangian water plume is represented with a 100-day threshold, as in the analyses of section “Altimetry-Based Lagrangian Reconstruction of the Seamount Mass Effect”). The similarity between the climatological Chl a and Lagrangian plumes is less evident compared to the monthly analyses previously considered. This is primarily due to the smoothed signal in the Chl a climatology. However, where the mean pigment distribution is more contrasted, as in the northern edge of the Lagrangian plume, the two signals appear to have qualitatively similar patterns.
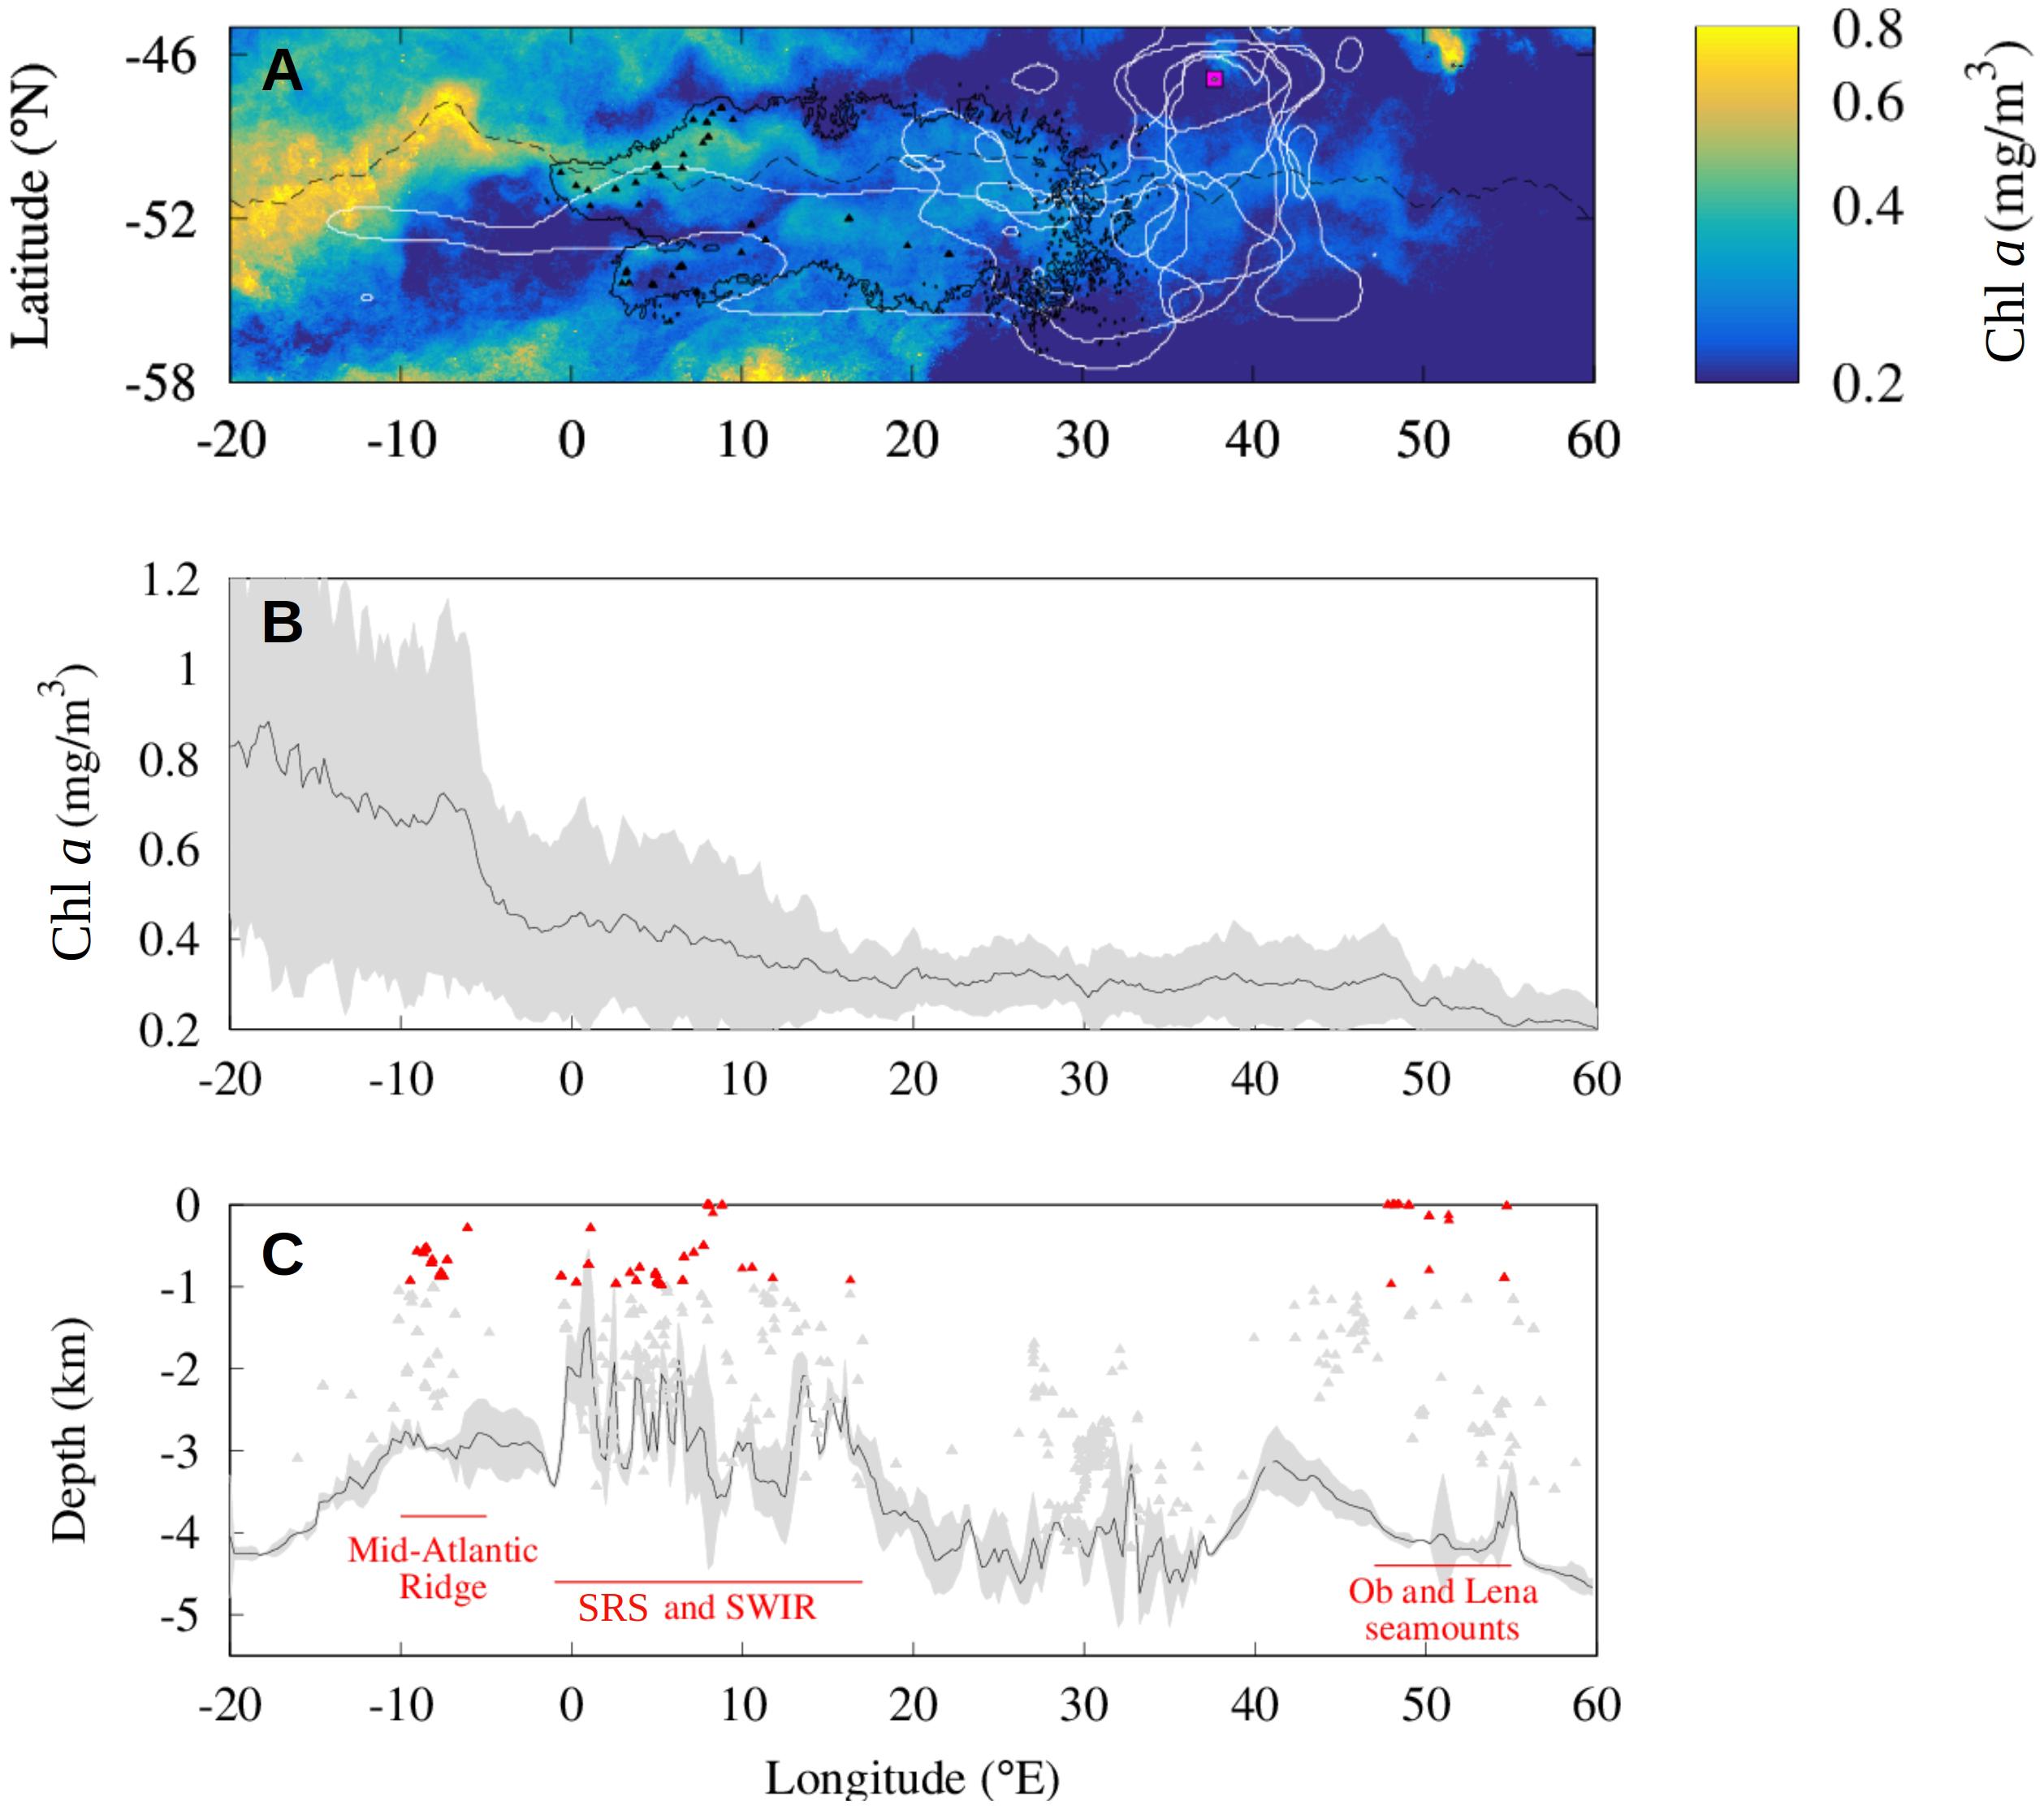
Figure 5. Distribution of predators, Chl a concentration and seamount mass effect during December between 2000 and 2015 around the PF current core. (A) The distribution of top predators (white lines) from the Prince Edward Islands (magenta square) is compared to the distribution of the Lagrangian plumes (black solid line) constructed from the seamounts (black triangles) for every December between 2000 and 2015. Data are displayed with the Chl a climatology and the PF position (black dashed line) during December between 2000 and 2015. (B,C) Mean Chl a concentration (B) and mean shallowest depth (C) in a latitudinal band of 1° north and 1° south of the current core for every December from 2000 until 2015. Shaded areas show standard deviation associated with these lines. Gray and red triangles indicate the depth of the seamounts (respectively, deeper and shallower of 1000 m) identified by Yesson et al. (2011) in the same region (C).
In order to investigate the signal of the seamounts in the climatological phytoplankton biomass we compute the mean Chl a concentration in a 2° latitude narrow band centered on the current core of the ACC which we identify by the PF, between 2000 and 2015 (Figure 5B). Figure 5B shows that the highest values (mean Chl a about 0.7 mg/m3) are observed upstream of the study region, between 20 and 5°W and decrease eastward. Intense Chl a concentrations extend downstream of South Georgia (36°W, 54°S) over wide distances due to the intense transport (e.g., Korb et al., 2004; Sokolov and Rintoul, 2007; De Jong et al., 2012; Borrione et al., 2014; Graham et al., 2015) and to the regular iron inputs linked to flow-topography interactions (Sokolov and Rintoul, 2007). The averaged Chl a level do not significantly increase in correspondence of the interaction between the ACC and the shallow seamounts of the SRS (Figure 5B). However, we note the high standard deviation of the signal between 0 and 15°E compared to the downstream signal (respectively, σ ≈ 0.2 mg/m3 and σ ≈ and 0.1 mg/m3) indicating an important interannual variability. Compared to the SHS, the Ob and Lena seamounts close to 50°E display a lower mean Chl a concentration (Δμ ≈ 0.1 mg/m3) and a lower standard deviation (Δσ ≈ 0.1 mg/m3), indicating a lower phytoplankton biomass and a low temporal variability.
Phytoplankton Composition: Comparison of the Seamount Region, Kerguelen Bloom and Open Ocean Region
The possibility for primary production of sustaining the large trophic chain up to megafauna, is known to largely depend not only on its abundance but also on the phytoplankton composition (e.g., Moline et al., 2004). We thus analyze our study region with maps produced with the PHYSAT algorithm (Alvain et al., 2005, 2008). The latter cluster together the ocean color spectral signal into classes associated to typical phytoplanktonic types which are statistically dominant for those bio-optical anomalies.
PHYSAT patterns downstream of the SRS and SWIR seamounts (0–30°E, 50–53°S in Figure 6) mainly contain the same classes found in island-induced blooms (70–100°E, 50–53°S in Figure 6) and differ from the type classes found in the Australian-Antarctic Basin (i.e., downstream of the Kerguelen bloom about 100–130°E) (Figure 6A). According to the PHYSAT observations, during December and January between 2000 and 2011, the seamount region is dominated more than 55% of the time by diatoms (σ = 30%) and less than 1% of the time by Phaeocystis (σ = 5%). By comparison, the Kerguelen bloom (and respectively, the offshore region downstream of this bloom) is dominated 70% (respectively 16%) of the time by diatoms and 3% (respectively 80%) of the time by the small Phaeocystis (Figures 6B–D).
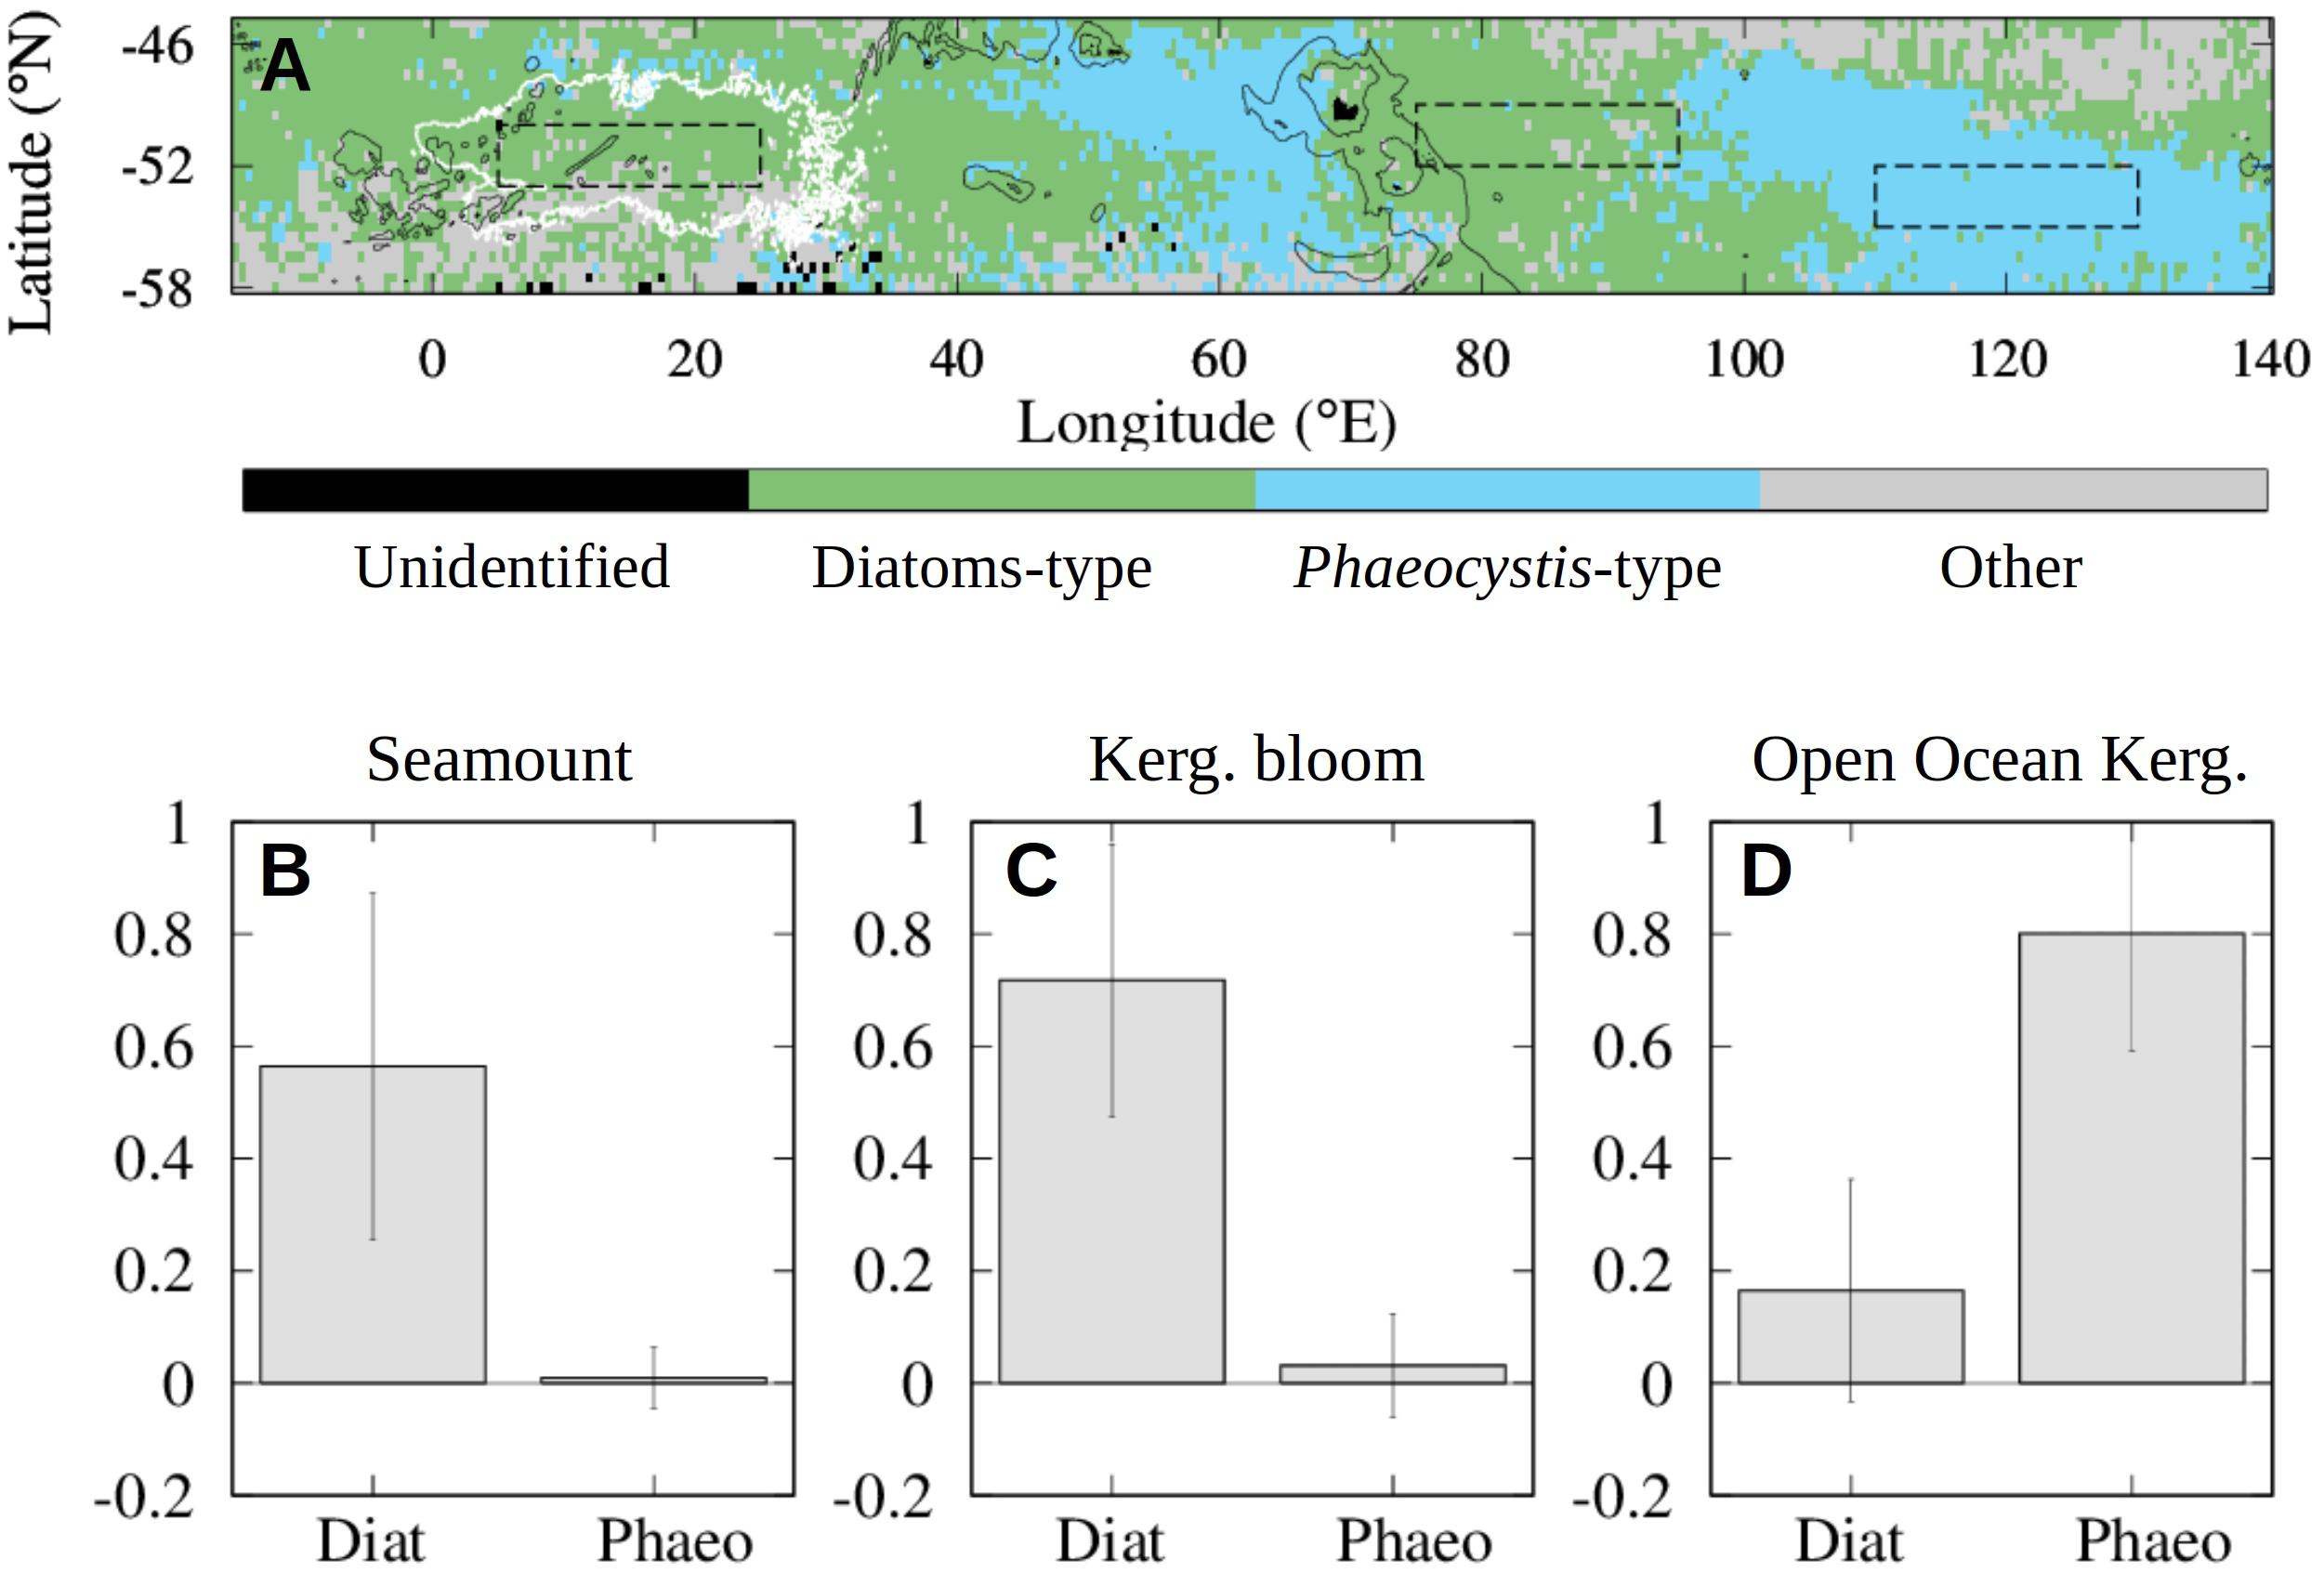
Figure 6. Climatology maps (2000–2011) of dominant phytoplankton groups in December and January estimated using PHYSAT. (A) Most abundant phytoplankton type estimated from PHYSAT over the 2000–2011 time period. The distribution of the Lagrangian plumes from the seamounts (white solid line) is shown as in Figure 5. (B–D) Mean percentage of time that the seamount region (B), Kerguelen (abbreviated Kerg. in the image) bloom region bloom region (C) and open ocean region downstream of it (D) are dominated by diatoms or phaeocystis types (respectively abbreviated Diat and Phaeo in the image) during December and January between 2000 and 2011. The three regions are located in the dashed black contours in the top panel. From left to the right these are: seamount region (B), Kerguelen bloom region (C) and open ocean region downstream of it (D). Error bars indicate the standard deviation over each region.
Discussion
Enhanced primary production has been episodically reported in the past over some deep (>2000 m depth) submerged topographic features of the Southern Ocean, such as the Northwest Georgia Rise (Meredith et al., 2003) and the Maud Rise in the Weddell Gyre (Van Bennekom et al., 1988). At a circumpolar scale, Sokolov and Rintoul (2007) observed that blooms are initiated where the ACC crosses most of the deep bathymetric features and they persist for long distances. However, the biogeochemical focus of subsequent works has led to the conclusion that Chl a enhancements downstream of submerged features are negligible because on average they are much less intense than the ones in the wake of the subantarctic islands (e.g., Graham et al., 2015; Ardyna et al., 2017). These ideas have reinforced the view of the region in between the subantarctic islands as a HNLC phytoplankton-desert area. Here we revisit this apparently low chlorophyll region investigating its ecological implications, in particular for land breeding marine predators for which the possibility of accessing a large islands’ bloom far away from their colony may be associated to excessive energetic locomotion costs. This is the case for instance with several species of penguins and pinnipeds breeding at the Prince Edward Islands. A very limited island mass effect is observed around and downstream Prince Edward Islands because of its very narrow plateau (Perissinotto et al., 2000). Competition for food is thus expected to be high in this small productive area. Animals colonizing this island appear indeed to prefer the lower productive but extended inter-island waters than other targets, such as the small productive area around Prince Edward Islands (where competition may be high) or the larger blooms further away, costly to reach.
Our study targets two topographic systems of the southern Agulhas Basin: the Shona Ridge System and part of the South-West Indian Ridge, between 0° and 30°E. By focusing on shorter time scales and on higher bathymetric resolution than former studies, our results identify new phytoplankton blooms associated to the water masses that transited over these shallow topographic highs and provide a detailed description of them. Firstly, an increase in phytoplankton biomass is observed by BGC-Argo floats in the wake of the seamounts during the summer period, between the middle of January and the middle of February. This late Chl a enhancement suggests a possible positive biological effect linked to the presence of the topographic highs which is not simply linked to the seasonal bloom phenology (Sallée et al., 2015; Ardyna et al., 2017). Due to the important limitation of the primary production by iron in this region (e.g., Martin, 1990; Sullivan et al., 1993; De Baar et al., 1995), a relative enhancement of the Chl a values should be related to iron inputs in the surface waters. Secondly, the seamount effect is further investigated with satellite observations which have larger spatial and temporal covers. By identifying isolated Chl a plumes on monthly-mean maps and comparing them to the Lagrangian water plumes stemming from the topographic features we demonstrate the widespread influence of seamounts on the surface seasonal phytoplankton distribution. Therefore, the advection of water parcels from shallow topography can be considered as a powerful tool for identifying the effect of isolated submerged topography, similarly, to the analyses computed on islands (e.g., Mongin et al., 2009; Sanial et al., 2014, 2015; d’Ovidio et al., 2015; Ardyna et al., 2017). By comparison, Graham et al. (2015) investigated the spatial variability of the annual mean Chl a at the regional scale in the study area and concluded that, at this time scale, the phytoplankton biomass is not visibly enhanced over or downstream of the seamounts. However, we note that most of seamounts identified in our high resolution bathymetric data were not identified in this previous analysis (see for instance their Figure 5A), which could also influence their conclusions. Similarly, the Lagrangian pathways computed at the circumpolar scale using a bathymetric threshold also do not identify Chl a plumes in the southern Agulhas Basin, because no shallow topography was detected there with these data (Ardyna et al., 2017). These different outcomes highlight the need to consider both high resolution bathymetric data and short time scales for investigating a potential biological effect of seamounts.
In the following we firstly discuss the possible mechanisms at the origin of the seamount mass effect observed in the present study, the limits of the methods employed, and their applicability to other study cases. Secondly, we explore the ecological role of seamounts in the southern Agulhas Basin, from primary production to predators’ distribution, as well as some implications of these new insights for conservation activities.
Drivers of the Seamount Mass Effect
What is the origin of the blooms observed in the wake of seamounts in the southern Agulhas Basin? In most of the previous studies, the Chl a anomalies observed over the seamounts and in the surrounding waters were linked to the shallow seamount depths. However, the spatial and temporal variability of biological effects were rarely understood due to the complex nature of the physical processes involved there (e.g., Venrick, 1991; Pitcher et al., 2007; Pauly et al., 2017). The process presented here is framed by the limiting effect of iron on primary production (Martin, 1990) and the preponderant structuring effect of the horizontal transport on biochemical properties and ecosystems in the ACC region. The two necessary conditions identified for the fertilization of water masses in the open ocean southern Agulhas Basin are thus: (i) the presence of hydrographic regions associated, according to the literature, to potential enhanced dissolved iron content at intermediate depth; and (ii) upwelling dynamics due to the interaction of seamounts shallower than 1000 m depth with an energetic branch of the ACC.
In terms of iron content, two possibly enriched regions are identified in the southern Agulhas Basin. The first one is composed by the water masses that have transited over Bouvet Island, which is a known iron source (Perissinotto et al., 1992; Croot et al., 2004). The second one, is composed by the water masses located in the ACC, along the jet associated with the PF. Numerous in situ observations have recorded enhanced iron concentrations in the surface waters close to this ACC front, both in the Atlantic sector (De Baar et al., 1995; Löscher et al., 1997; Viljoen et al., 2018) and elsewhere (Measures and Vink, 2001; Mengelt et al., 2001). In the deeper ocean, iron measurements are less frequent (e.g., Tagliabue et al., 2012). Nevertheless, enhanced iron concentrations appear to occur in the Circumpolar Deep Water close to the PF region in correspondence of the Mid-Atlantic Ridge (Löscher et al., 1997). Furthermore, the analysis of the global GEOTRACES database indicates a sharp ferricline in the Atlantic ACC region reflecting the signature of subsurface lateral transfer of dissolved iron from the subantarctic islands (Tagliabue et al., 2014). Indeed numerous studies have concluded that the intense velocities of the PF current core result in a strong transport of nutrients downstream of South Georgia (Korb et al., 2004; Venables and Meredith, 2009; Venables et al., 2012; Borrione et al., 2014) and in a regular iron supply to the surface water due to the ACC-bathymetry interactions (Sokolov and Rintoul, 2007).
In terms of upward dynamics, the interaction of the ACC with sharp topographic features is well known to generate upwelling hotspots carrying deep waters to the surface (Viglione and Thompson, 2016; Tamsitt et al., 2017) and enhancing surface Chl a concentrations (Sokolov and Rintoul, 2007). Three different mechanisms have been identified in the past for explaining upwelling in the presence of seamounts. The first mechanism is eddy fluxes which are intensified when the ACC encounters a rough topography due to an increase in baroclinicity. The eddy activity enhanced in this way at seamounts can vigorously drive upward northern-sourced deep water along steeply sloping isopycnals in the PF region (Tamsitt et al., 2017; Rintoul, 2018). The enhanced eddy activity at seamounts is also associated to intense flow shear, which in turn preconditions an ageostrophic submesoscale circulation characterized by deep reaching vertical motion (Lévy et al., 2018; Siegelman et al., 2019). A second possible mechanism for upwelling is the bottom pressure torque created when the ACC impinges over bathymetric obstacles. This process induces upwelling upstream of a seamount and downwelling downstream of it (Hughes, 2005; Sokolov and Rintoul, 2007; Thompson and Naveira Garabato, 2014; Rintoul, 2018). This situation has been described in the Atlantic sector of the ACC region, at the South and North Scotia Ridges, the South Orkney Islands and the South-West Indian Ridge (Sokolov and Rintoul, 2007). Finally, a third mechanism which is able to connect deep water to the surface layer is the generation of internal lee waves at seamounts. These waves propagate upward and break, enhancing diapycnal mixing (Watson et al., 2013) and fluorescence signature over the seamounts (Brink, 1995; Kunze and Sanford, 1997; Eriksen, 1998). This has been observed for instance at the seamounts of the SWIR, at the northeast of the southern Agulhas Basin (Read and Pollard, 2017).
The interaction of a strong current with a topographic sharp relief is also known to produce Taylor columns, that is, semi-permanent anticyclones on the top of the topographic obstacle which can trap water for periods of months or longer (Taylor, 1923; Meredith et al., 2015). These features can have a special ecological interest because they may retain over the seamounts aging trophic webs, thus providing predictable preying hotspots (e.g., Pitcher et al., 2007; Morato et al., 2010; Cascão et al., 2017). Such circulations, more intense at high latitudes due to the enhanced Coriolis force (Owens and Hogg, 1980; Chapman and Haidvogel, 1992), have been observed in the Southern Ocean at the Maud Rise (Van Bennekom et al., 1988) and conditions conducive to their formation have been found at the Georgia Rise, South Scotia Ridge and at the Prince Edward plateau (Perissinotto and Rae, 1990; Meredith et al., 2003, 2015).
All together, the mechanisms here proposed for the Atlantic ACC region are schematized in Figure 7. The iron content increases in the surface layer at the South Georgia Island and sinks to the subsurface along the flow direction, with regular upward movements due to the interactions between the ACC and the topography. The Chl a blooms identified in the study cases (Figures 3, 4) and the important temporal variability of the climatological surface Chl a content close to the seamounts (Figure 5) are the surface expression of this topography-ACC interactions, usually hidden in the mean climatological Chl a signal when compared with subantarctic island-blooms (e.g., Graham et al., 2015; Ardyna et al., 2017). By highlighting the role of iron content of the upstream water masses, the mechanism here suggested could explain why seamounts seem to display re-enhanced phytoplankton biomass when they are close to rich systems, such as coastal margins (Van Bennekom et al., 1988; Perissinotto and Rae, 1990; Meredith et al., 2003; Graham et al., 2015; Oliveira et al., 2016; Lemos et al., 2018), or whether they are located in productive frontal zones (Djurhuus et al., 2017). On the other hand (and following Sokolov and Rintoul, 2007) our results identify processes extending at much larger spatial scales compared with the local phytoplankton enhancements described in previous studies which have focused on seamounts in other regions (e.g., Oliveira et al., 2016; Lemos et al., 2018). This larger extent is due to intense advection by the ACC, in analogy to the spread of non-consumed iron from the subantarctic islands in wintertime which preconditions the size of the islands’ blooming area (Mongin et al., 2009; d’Ovidio et al., 2015; Graham et al., 2015).
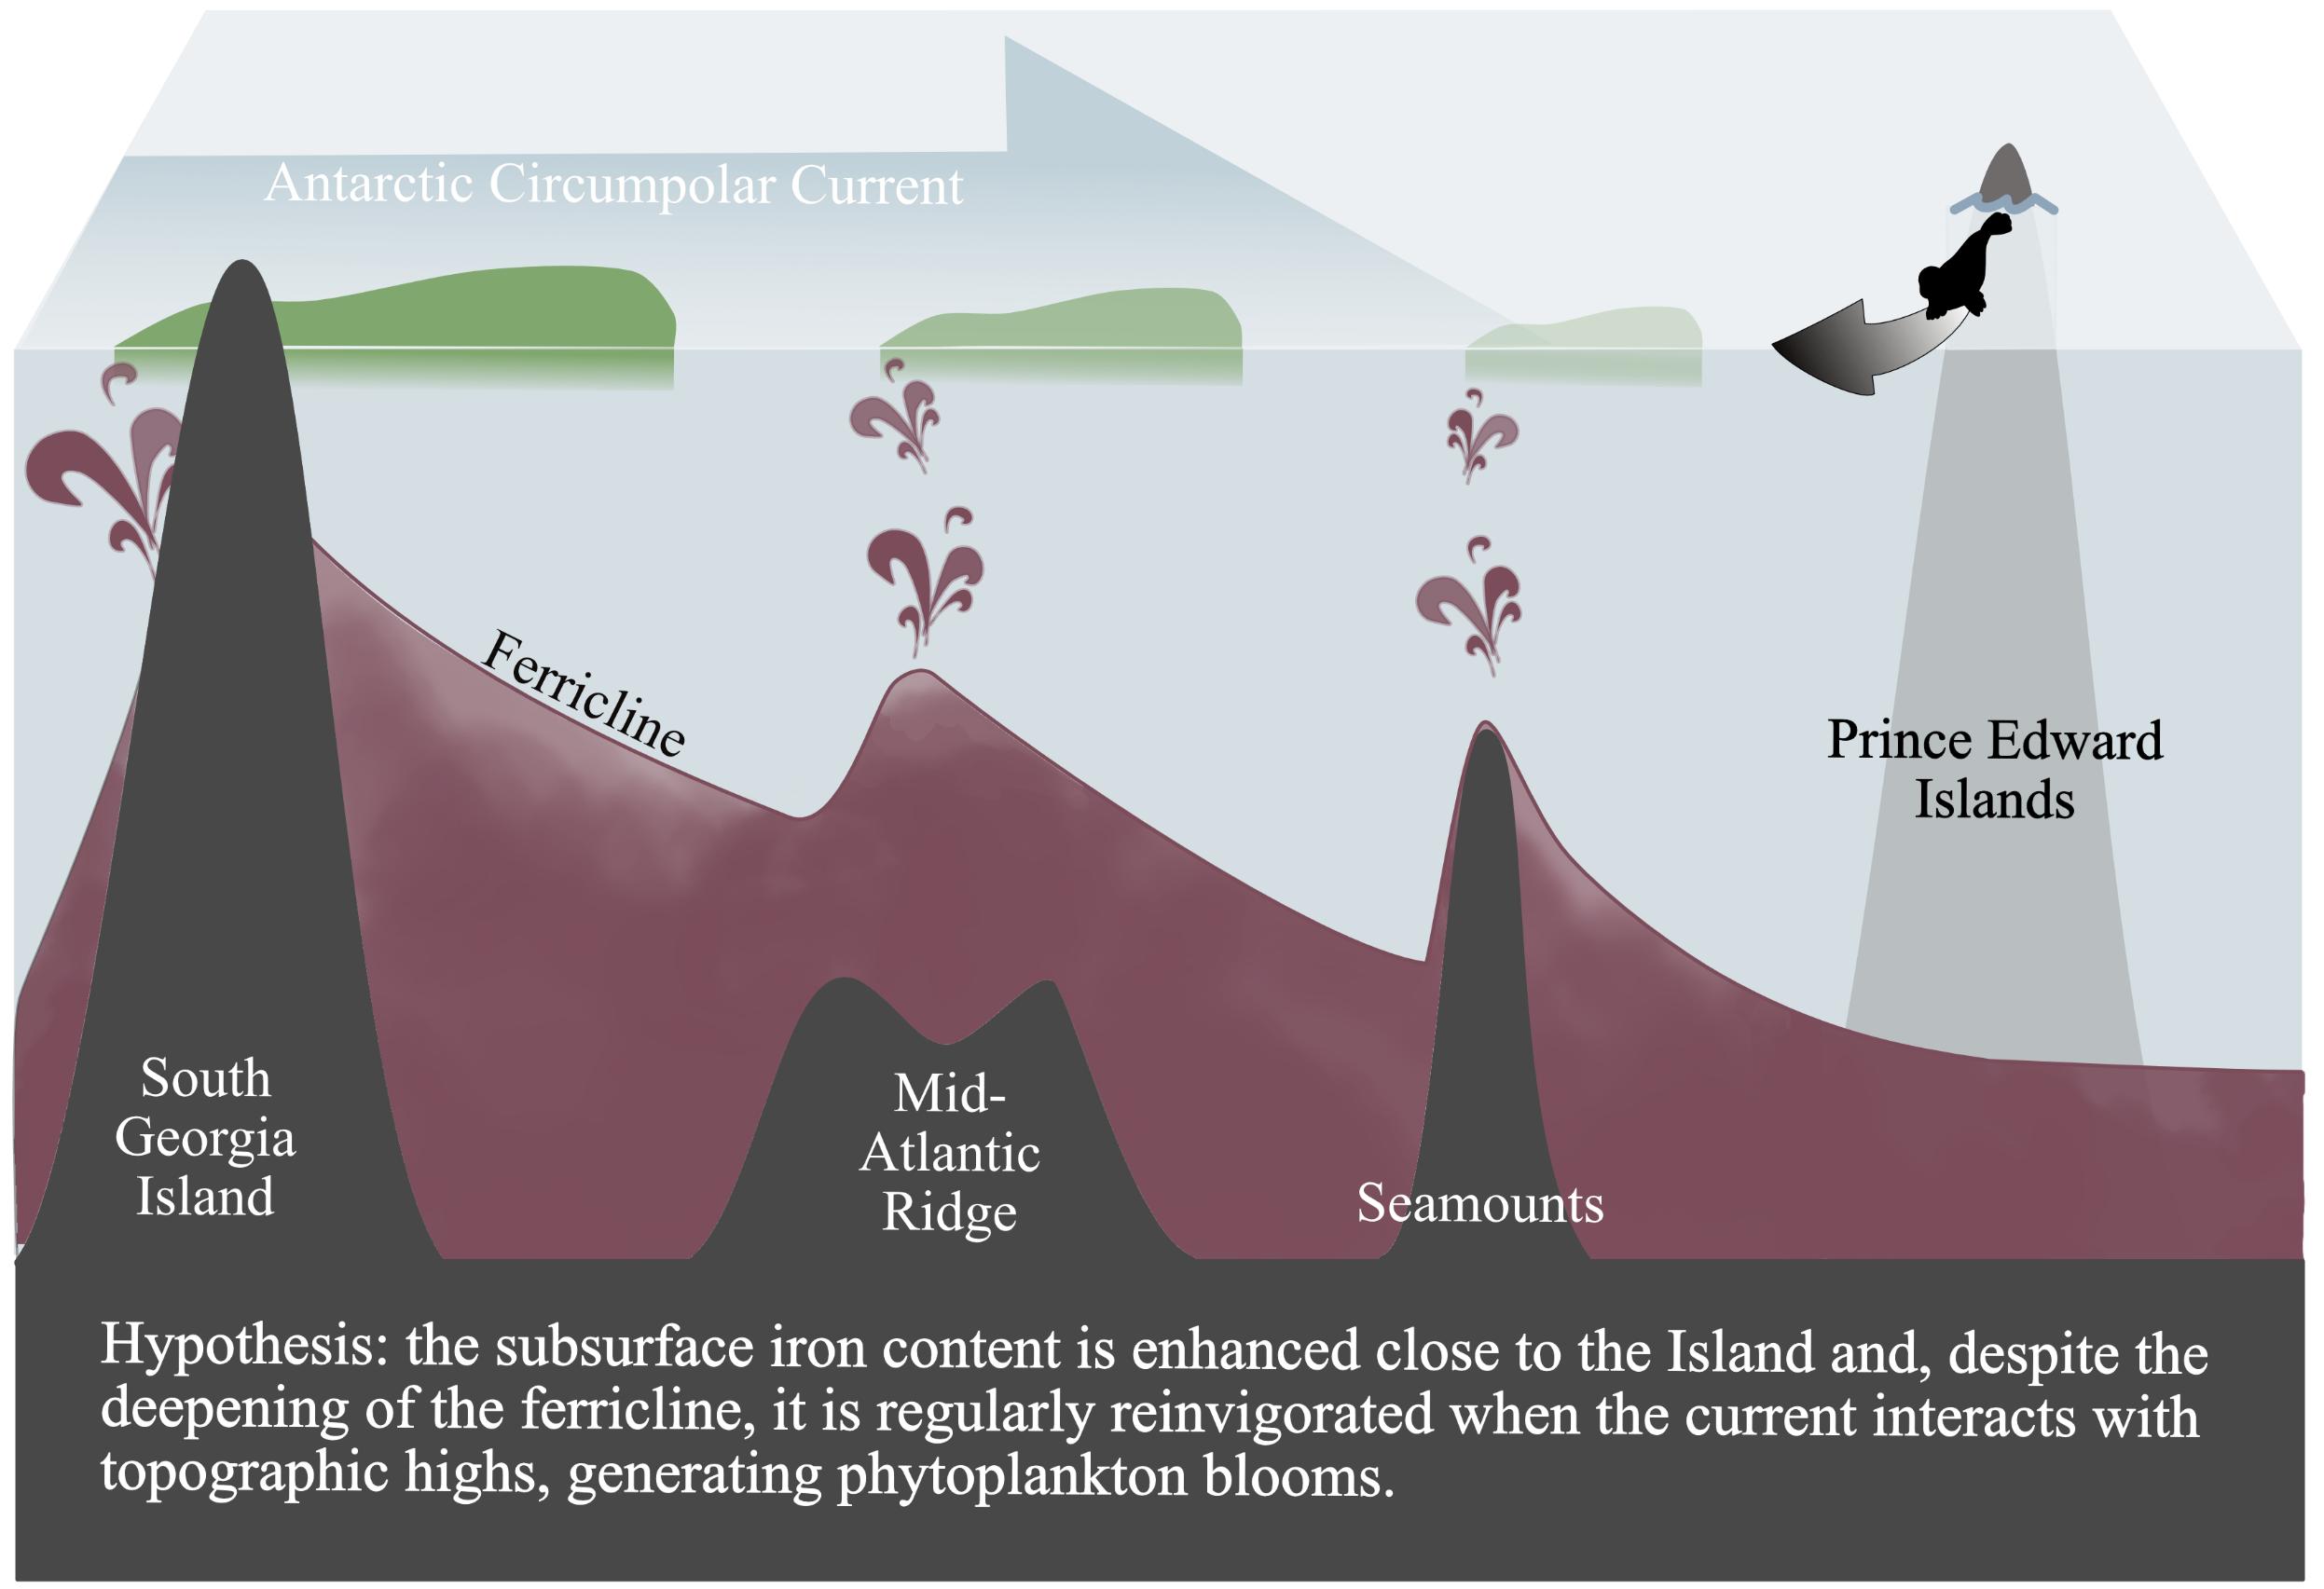
Figure 7. Schematic summarizing of phytoplankton productivity in the Atlantic ACC region. The interaction of the ACC with topographic highs generates upward movements and facilitates the injection of iron in the euphotic layer (symbolized by the burgundy-colored jets). Lightening of the phytoplankton blooms (green) is an indication of the decreasing of the Chl a concentration. Subantarctic pinnipeds and penguins from Prince Edward Islands (symbolized by the gray arrow) are foraging on this complex biological system.
Our approach does not explain all the patterns of primary production in the ACC region. The ACC core also interacts with a group of shallow seamounts (<1000 m depth) between 10°W and 6°E (Figure 5C) which corresponds to climatological Chl a concentrations topping at 0.7 mg/m3 (Figure 5B). Differently from the analysis of the SHS and SWIR (black contour in Figure 5A) the Lagrangian plume spreading from the seamounts close to 10°W only partially explain the Chl a plume in this region (result not shown). Most of Chl a seems to be aggregated close to the current core, which, constrained by the Mid-Atlantic Ridge, shifts northward close to 10°W (Boehme et al., 2008). The specific regional circulation catalyzed by the topography may explain the Chl a distribution. On the other hand, our analysis leaves open the question concerning why seamounts of other regions do not seem to be associated to intense Chl a plumes, such as the shallow Ob and Lena seamounts (∼50°E in Figure 5). This could be explained by the mechanism schematized in Figure 7. The deep iron, primarily upwelled to the intermediate layer at the South Georgia Island (Korb et al., 2004; Borrione et al., 2014), is assumed to slowly decay along the flow direction from west to east. Following this hypothesis, it seems plausible that the seamount effect may be less intense for topography features located further downstream of the South Georgia Island (∼35°W), as the Ob and Lena seamounts (∼50°E), compared to the closer ones (as the SRS and SWIR). We note that the mechanism here proposed consider primarily external iron inputs, i.e., the upstream iron transport. However, some local processes have also been identified as sources of surface nutrient supply at seamounts. For instance, the interaction of the porewater with sandy sediment releases reduced metal species to the water column (Huettel et al., 1998) and leads to an enhanced erosion of the sediments due to the physical and chemical actions of potential benthic communities (Rhoads and Boyer, 1982). For all these reasons, more detailed studies should be done in order to unambiguously identify the mechanisms at the origin of the Chl a enhancements observed in this study.
Ecological Significance of the Seamount Mass Effect in the Southern Agulhas Basin and Implications for Conservation
The surface Chl a concentrations observed in satellite images downstream of seamounts are minor compared to the ones occurring downstream of islands. For instance, in the Crozet bloom Chl a concentrations exceed 2 mg/m3 (Bakker et al., 2007), four times the ones observed in our analysis. However, we stress that, to assess the total phytoplankton biomass of a given region, one must integrate Chl a concentration over the mixed layer (ML) (e.g., Ardyna et al., 2019). The ML in the seamount region is at least between 10 and 30% deeper of the ML in the Kerguelen bloom region during January and February and between 30 and 50% deeper during December (Supplementary Figure S1). When compared to the Crozet and the South Georgia blooming regions the seamount ML increases up to 60–100% (Supplementary Figure S1). Therefore, the phytoplankton biomass integrated over the ML may present less intense contrasts between the seamount open ocean and the island bloom regions than the surface signals. Furthermore, we note that a deeper ML may also induce a lower Chl a signal in the satellite images, intensifying the observed surface differences between the two regions.
The analysis of the phytoplankton composition of the seamount plumes provides further insights about the relevance of this biological production from an ecological perspective. The phytoplankton community identified in the Atlantic ACC shows a bio-optical signature similar to the ones found in diatom-dominated island blooms, such as the region downstream of Kerguelen, and different from the nearby oligotrophic waters, characterized by Phaeocystis-types (Figure 6). This nanophytoplankton is known to be rapidly consumed by the microbial food web (Detmer and Bathmann, 1997; Pakhomov et al., 2019) and therefore its occurrence is not associated with profitable foraging grounds for top predators (Cushing, 1989; Moline et al., 2004; Pakhomov et al., 2019). Conversely, diatom-dominated blooms are more likely to support large trophic webs which lead to fish and crustaceans and higher predators (Cushing, 1989; Moline et al., 2004; Pakhomov et al., 2019). Presence of a large and rich (in terms of diversity) megafauna in our study region is confirmed by biologging data (Arthur et al., 2017; Pistorius et al., 2017; Reisinger et al., 2018). The similarity between the seamounts region to the island blooms is supported also by in situ measurements showing diatom enhanced concentrations at the Atlantic PF region in the vicinity of the Islas Orcadas Rises and Mid-Atlantic Ridge (Laubscher et al., 1993; Froneman et al., 1995; Bathmann et al., 1997; Detmer and Bathmann, 1997; Smetacek et al., 1997). On the other hand, the contrasted phytoplankton community between the seamount region and the classic HNLC areas (as the one between 110 and 130°E in Figure 6) would emphasize the interest of regions downstream of topographic highs. However, the lack of in situ phytoplankton observations in this low chlorophyll region prevent us to conclude on the potential zonal differences in the circumpolar phytoplankton communities of the PF region. Observation of mid trophic levels would also be valuable for linking the primary producers to the higher predators and verifying these hypotheses. Flynn and Williams (2012) showed that the topography-flow interaction over the Macquarie Ridge (160°E) seems to induce an increased biomass of the lanternfishes, a key prey for pinnipeds and seals (e.g., De Broyer et al., 2014). Further analyses of intermediate trophic levels should be done for explaining the biological productivity inferred from land-based top predators and assessing how each colony specifically relies on seamounts production. For instance, the distribution of surface and low trophic level foragers, such as Southern Rockhopper Penguin and Macaroni Penguin (Brown and Klages, 1987; Adams and Brown, 1989; Wilson et al., 1997; Crawford et al., 2003; Whitehead et al., 2016), might be more closely related to the surface productivity than the distribution of mesopelagic foragers.
Our analyses advocate for a connected vision of the biological productivity of the ACC region. Following the ACC, the high Chl a concentration decreases from west to east downstream of the South Georgia Island around the ACC core, but it is re-enhanced after the ACC interacts with submerged topographic features, in particular the SRS (as schematized in Figure 7). A more comprehensive view may have consequences especially in conservation policies. Currently, conservation planning in the ACC region is dominated by national programs and consequently displays important discontinuities constrained by the jurisdictional framework (e.g., exclusive economic zones). National Marine Protected Areas have been established around Heard and Mcdonald Islands, Kerguelen Islands, Crozet Islands, and Prince Edward Islands in order to conserve the rich and diverse ecosystems hosted in these oceanic waters. By comparison, the high seas of the southern Agulhas Basin, which are already managed for the fishing activities (Supplementary Figure S2), are currently not considered in conservation plans. However, our observations, along with the numerous foraging hotspots of numerous predators occurring in this latitudinal band, both from Bouvet Island and other subantarctic colonies (Biuw et al., 2010; Hindell et al., 2016; Arthur et al., 2017), highlight the need to consider the subantarctic range as a continuum. Current attempts made under the Commission for the Conservation of Antarctic Marine Living Resources (CCAMLR) aim at characterizing the ecosystems structure and function in the subantarctic region and eventually identifying priority areas for conservation. Therefore, efforts shall address the continuity of this oceanic region and the biophysical processes across the high seas and the multiple economic exclusive zones.
Summary and Conclusion
In the Antarctic Circumpolar Current (ACC) region, island blooms stretch for hundreds of kilometers along the current. Island related production plays a primary role in the biogeochemical cycles of the Southern Ocean and sustains large trophic chains up to megafauna species. Conversely, submerged topography is also known to stimulate primary production in its interaction with the ACC, but this productivity is comparatively much less intense (e.g., Sokolov and Rintoul, 2007; Graham et al., 2015; Ardyna et al., 2017). As a consequence, its contribution has been considered negligible at the basin scale, and the ACC waters are often described as a high nutrient low phytoplankton desert, punctuated by massive blooms in the wake of the islands. Conservation efforts are in line with this description, with subantarctic marine protected areas only occurring in the economic exclusive zones around the islands.
Here we revisited the role of seamounts in this framework, focusing on a region of the Indo-Atlantic ACC zone. This area is massively targeted by marine predators, even if no islands fertilize it. By combining high resolution bathymetric data, multi-satellite data, and BGC-Argo observations, we found that the oligotrophic nature of the study region apparent in Chl a climatological maps hides a much more complex situation. Important production (in excess of 0.6 mg/m3, Figures 2, 3) occurs there and spreads over huge distances, comparable to the extension of the islands’ blooms.
By applying a Lagrangian analysis to these lesser blooms we connected unambiguously these blooms to specific seamount systems. Our Lagrangian scheme was then depicted to track at mesoscale precision the thousands of kilometers long water plume influenced by each individual seamount system (Figures 3, 4).
In order to estimate the type of phytoplankton present in these blooms, we used the PHYSAT product, which provides maps of putative planktonic functional types. The PHYSAT algorithm revealed that the signatures of seamounts’ bloom are similar to the ones found in the islands’ wake, and not nearby less productive waters (Figure 6). This is consistent with the presence in both systems of foraging grounds for megafauna species.
The ecological role of seamounts in sustaining large trophic chains was finally confirmed by comparing climatologies of Chl a to the predators’ distributions (Figure 5). Our results allow us to conclude that, although temporally intermittent, less predictable, and less effective than the ones associated with the island mass effect, the blooms downstream of seamounts cannot be neglected. Our findings advocate for a connected vision of the ecosystems along the ACC and may support future conservation actions by providing the tools to track the areas under the seamount effect.
Data Availability Statement
All the data used in this research are freely available and may be downloaded through the links detailed in the section “Materials and Methods.”
Ethics Statement
Ethical review and approval was not required for the animal study because this study analyzed observations of vertebrate animals previously published by another study reviewed and approved by an animal ethics committee (doi: 10.1111/ddi.12702
Author Contributions
SS conducted the data analysis. SS and Fd’O wrote the manuscript. All authors contributed to the ideas and to the revision of the manuscript.
Funding
SS was supported by a Sorbonne University doctoral contract (ED129 Doctoral School of Environmental Sciences). Part of this study was supported by CNES.
Conflict of Interest
The authors declare that the research was conducted in the absence of any commercial or financial relationships that could be construed as a potential conflict of interest.
Acknowledgments
This work was a contribution to the French ANR-11-IDEX-0004-17-EURE-0006. The authors acknowledge the International Argo Program, the Global Ocean Observing System of which it is a part, and the national programs that contributed to it (http://www.argo.ucsd.edu, http://argo.jcommops.org). The authors are grateful to the National Research Foundation and the South African Department of Environmental Affairs for the collection of predators tracking data, and the numerous fields’ biologists who contributed to this database, including the authors of Reisinger et al. (2018). The authors also acknowledged Aviso, ACRI-ST and the European Copernicus Marine Environment Monitoring Service for the production and the delivery of environmental data. Fd’O acknowledged the support from the Cnes OSTST Tosca project LAECOS. The authors thank Ryan Reisinger for useful discussions and Severine Alvain and Anne-Hélène Reve-Lamarche for their help in accessing the PHYSAT data (Inter Deposit Digital Number IDDN.FR.001.330003.000.S.P.2012.000.30300).
Supplementary Material
The Supplementary Material for this article can be found online at: https://www.frontiersin.org/articles/10.3389/fmars.2020.00416/full#supplementary-material
Abbreviations
ACC, Antarctic Circumpolar Current; BGC-Argo, Biogeochemical Argo; CCAMLR, Commission for the Conservation of Antarctic Marine Living Resources; chl a, chlorophyll a; PF, Antarctic Polar Front; SRS, Shona Ridge System; SWIR, South-West Indian R.
Footnotes
- ^ https://figshare.com/articles/_/5613016
- ^ http://marine.copernicus.eu/
- ^ ftp://ftp.ifremer.fr/ifremer/argo/dac/coriolis/
References
Adams, N. J., and Brown, C. R. (1989). Dietary differentiation and trophic relationships in the sub-antarctic penguin community at Marion Island. Mar. Ecol. Prog. Ser. Oldendorf 57, 249–258. doi: 10.3354/meps057249
Alvain, S., Le Quéré, C., Bopp, L., Racault, M. F., Beaugrand, G., Dessailly, D., et al. (2013). Rapid climatic driven shifts of diatoms at high latitudes. Remote Sens. Environ. 132, 195–201. doi: 10.1016/j.rse.2013.01.014
Alvain, S., Moulin, C., Dandonneau, Y., and Bréon, F. M. (2005). Remote sensing of phytoplankton groups in case 1 waters from global SeaWiFS imagery. Deep Sea Res. Part I Oceanogr. Res. Pap. 52, 1989–2004. doi: 10.1016/j.dsr.2005.06.015
Alvain, S., Moulin, C., Dandonneau, Y., and Loisel, H. (2008). Seasonal distribution and succession of dominant phytoplankton groups in the global ocean: a satellite view. Global Biogeochem. Cycles 22:GB3001.
Ardyna, M., Claustre, H., Sallée, J. B., d’Ovidio, F., Gentili, B., Van Dijken, G., et al. (2017). Delineating environmental control of phytoplankton biomass and phenology in the Southern Ocean. Geophys. Res. Lett. 44, 5016–5024. doi: 10.1002/2016gl072428
Ardyna, M., Lacour, L., Sergi, S., d’Ovidio, F., Sallée, J. B., Rembauville, M., et al. (2019). Hydrothermal vents trigger massive phytoplankton blooms in the Southern Ocean. Nat. Communi. 10:2451.
Arthur, B., Hindell, M., Bester, M., De Bruyn, P. N., Trathan, P., Goebel, M., et al. (2017). Winter habitat predictions of a key Southern Ocean predator, the Antarctic fur seal (Arctocephalus gazella). Deep Sea Res. Part II Top. Stud. Oceanogr. 140, 171–181. doi: 10.1016/j.dsr2.2016.10.009
Aumont, O., and Bopp, L. (2006). Globalizing results from ocean in situ iron fertilization studies. Global Biogeochem. Cycles 20:GB2017. doi: 10.1029/2005GB002591
Bakker, D. C., Nielsdóttir, M. C., Morris, P. J., Venables, H. J., and Watson, A. J. (2007). The island mass effect and biological carbon uptake for the subantarctic Crozet Archipelago. Deep Sea Res. Part II Top. Stud. Oceanogr. 54, 2174–2190. doi: 10.1016/j.dsr2.2007.06.009
Barlow, K. E., and Croxall, J. P. (2002). Seasonal and interannual variation in foraging range and habitat of macaroni penguins Eudyptes chrysolophus at South Georgia. Mar. Ecol. Progr. Ser. 232, 291–304. doi: 10.3354/meps232291
Bathmann, U. V., Scharek, R., Klaas, C., Dubischar, C. D., and Smetacek, V. (1997). Spring development of phytoplankton biomass and composition in major water masses of the Atlantic sector of the Southern Ocean. Deep Sea Res. Part II Top. Stud. Oceanogr. 44, 51–67. doi: 10.1016/s0967-0645(96)00063-x
Biuw, M., Nøst, O. A., Stien, A., Zhou, Q., Lydersen, C., and Kovacs, K. M. (2010). Effects of hydrographic variability on the spatial, seasonal and diel diving patterns of southern elephant seals in the eastern Weddell Sea. PLoS One 5:e13816. doi: 10.1371/journal.pone.0013816
Blain, S., Quéguiner, B., Armand, L., Belviso, S., Bombled, B., Bopp, L., et al. (2007). Effect of natural iron fertilization on carbon sequestration in the Southern Ocean. Nature 446:1070.
Blain, S., Tréguer, P., Belviso, S., Bucciarelli, E., Denis, M., Desabre, S., et al. (2001). A biogeochemical study of the island mass effect in the context of the iron hypothesis: kerguelen Islands. Southern Ocean. Deep Sea Res. Part I Oceanogr. Res. Pap. 48, 163–187. doi: 10.1016/s0967-0637(00)00047-9
Block, B. A., Jonsen, I. D., Jorgensen, S. J., Winship, A. J., Shaffer, S. A., Bograd, S. J., et al. (2011). Tracking apex marine predator movements in a dynamic ocean. Nature 475, 86–90. doi: 10.1038/nature10082
Boehme, L., Meredith, M. P., Thorpe, S. E., Biuw, M., and Fedak, M. (2008). Antarctic Circumpolar current frontal system in the south atlantic: monitoring using merged argo and animal-borne sensor data. J. Geophys. Res. Oceans 113:C09012. doi: 10.1029/2007JC00464
Boersma, P. D., Rebstock, G. A., Frere, E., and Moore, S. E. (2009). Following the fish: penguins and productivity in the South Atlantic. Ecol. Monogr. 79, 59–76. doi: 10.1890/06-0419.1
Borrione, I., Aumont, O., Nielsdóttir, M. C., and Schlitzer, R. (2014). Sedimentary and atmospheric sources of iron around South Georgia, Southern Ocean: a modelling perspective. Biogeosciences 11, 1981–2001. doi: 10.5194/bg-11-1981-2014
Botnikov, V. N. (1963). Geographical position of the Antarctic Convergence Zone in the Antarctic Ocean. Soviet Antarctic Exped. Inform. Bull. 41, 324–327.
Boyd, P. W., Watson, A. J., Law, C. S., Abraham, E. R., Trull, T., Murdoch, R., et al. (2000). A mesoscale phytoplankton bloom in the polar Southern Ocean stimulated by iron fertilization. Nature 407, 695–702. doi: 10.1038/35037500
Brink, K. (1995). Tidal and lower frequency currents above Fieberling Guyot. J. Geophys. Res. 100, 10817–10832.
Brown, C. R., and Klages, N. T. (1987). Seasonal and annual variation in diets of Macaroni (Eudyptes chrysolophus chrysolophus) and Southern rockhopper (E. chrysocome chrysocome) penguins at sub-Antarctic Marion Island. J. Zool. 212, 7–28. doi: 10.1111/j.1469-7998.1987.tb05111.x
Cascão, I., Domokos, R., Lammers, M. O., Marques, V., Domínguez, R., Santos, R. S., et al. (2017). Persistent enhancement of micronekton backscatter at the summits of seamounts in the azores. Front. Mar. Sci. 4:25. doi: 10.3389/fmars.2017.00025
Ccamlr-XXXVII (2018). Report of the Thirty-Seven Meeting of the Commission. Hobart: Commission for the Conservation of Antarctic Marine Living Resources, 54.
Chapman, D. C., and Haidvogel, D. B. (1992). Formation of Taylor caps over a tall isolated seamount in a stratified ocean. Geophys. Astrophys. Fluid Dyn. 64, 31–65. doi: 10.1080/03091929208228084
Chassot, E., Bonhommeau, S., Dulvy, N. K., Mélin, F., Watson, R., Gascuel, D., et al. (2010). Global marine primary production constrains fisheries catches. Ecol. Lett. 13, 495–505. doi: 10.1111/j.1461-0248.2010.01443.x
Cotté, C., d’Ovidio, F., Dragon, A. C., Guinet, C., and Lévy, M. (2015). Flexible preference of southern elephant seals for distinct mesoscale features within the antarctic circumpolar current. Prog. Oceanogr. 131, 46–58. doi: 10.1016/j.pocean.2014.11.011
Crawford, R. J. M., Cooper, J., and Dyer, B. M. (2003). Population of the macaroni penguin Eudyptes chrysolophus at Marion Island, 1994/95–2002/03, with information on breeding and diet. Afr. J. Mar. Sci. 25, 475–486. doi: 10.2989/18142320309504036
Croot, P. L., Andersson, K., Öztürk, M., and Turner, D. R. (2004). The distribution and speciation of iron along 6 E in the Southern Ocean. Deep Sea Res. Part II Top. Stud. Oceanogr. 51, 2857–2879. doi: 10.1016/j.dsr2.2003.10.012
Cushing, D. H. (1989). A difference in structure between ecosystems in strongly stratified waters and in those that are only weakly stratified. J. Plankton Res. 11, 1–13. doi: 10.1093/plankt/11.1.1
De Baar, H. J., De Jong, J. T., Bakker, D. C., Löscher, B. M., Veth, C., Bathmann, U., et al. (1995). Importance of iron for plankton blooms and carbon dioxide drawdown in the Southern Ocean. Nature 373, 412–415. doi: 10.1038/373412a0
De Broyer, C., Koubbi, P., Griffiths, H. J., Raymond, B., Udekem, D. A. C. D., and Van de Putte, A. P., et al. (eds) (2014). Biogeographic Atlas of the Southern Ocean. Cambridge: Scientific Committee on Antarctic Research, 498.
De Jong, J., Schoemann, V., Lannuzel, D., Croot, P., de Baar, H., and Tison, J. L. (2012). Natural iron fertilization of the Atlantic sector of the Southern Ocean by continental shelf sources of the antarctic peninsula. J. Geophys. Res. Biogeosci. 117:G01029.
Della Penna, A., Trull, T. W., Wotherspoon, S., De Monte, S., Johnson, C. R., and d’Ovidio, F. (2018). Mesoscale variability of conditions favoring an iron-induced diatom bloom downstream of the kerguelen plateau. J. Geophys. Res. Oceans 123, 3355–3367. doi: 10.1029/2018jc013884
Detmer, A. E., and Bathmann, U. V. (1997). Distribution patterns of autotrophic pico-and nanoplankton and their relative contribution to algal biomass during spring in the Atlantic sector of the Southern Ocean. Deep Sea Res. Part II Top. Stud. Oceanogr. 44, 299–320. doi: 10.1016/s0967-0645(96)00068-9
Djurhuus, A., Read, J. F., and Rogers, A. D. (2017). The spatial distribution of particulate organic carbon and microorganisms on seamounts of the South West Indian Ridge. Deep Sea Res. Part II Top. Stud. Oceanogr. 136, 73–84. doi: 10.1016/j.dsr2.2015.11.015
d’Ovidio, F., De Monte, S., Alvain, S., Dandonneau, Y., and Lévy, M. (2010). Fluid dynamical niches of phytoplankton types. Proc. Natl. Acad. Sci. U.S.A. 107, 18366–18370. doi: 10.1073/pnas.1004620107
d’Ovidio, F., Della Penna, A., Trull, T. W., Nencioli, F., Pujol, M. I., Rio, M. H., et al. (2015). The biogeochemical structuring role of horizontal stirring: lagrangian perspectives on iron delivery downstream of the Kerguelen plateau. Biogeosciences 12, 5567–5581. doi: 10.5194/bg-12-5567-2015
Eriksen, C. C. (1998). Internal wave reflection and mixing at Fieberling Guyot. J. Geophys. Res. 103, 2977–2994. doi: 10.1029/97jc03205
Flynn, A. J., and Williams, A. (2012). Lanternfish (Pisces: Myctophidae) biomass distribution and oceanographic–topographic associations at Macquarie Island, Southern Ocean. Mar. Freshw. Res. 63, 251–263.
Frederiksen, M., Edwards, M., Richardson, A. J., Halliday, N. C., and Wanless, S. (2006). From plankton to top predators: bottom-up control of a marine food web across four trophic levels. J. Anim. Ecol. 75, 1259–1268. doi: 10.1111/j.1365-2656.2006.01148.x
Froneman, P. W., Perissinotto, R., McQuaid, C. D., and Laubscher, R. K. (1995). Summer distribution of net phytoplankton in the Atlantic sector of the Southern Ocean. Polar Biol. 15, 77–84.
Georgen, J. E., Lin, J., and Dick, H. J. (2001). Evidence from gravity anomalies for interactions of the Marion and Bouvet hotspots with the Southwest Indian Ridge: effects of transform offsets. Earth Planet. Sci. Lett. 187, 283–300. doi: 10.1016/s0012-821x(01)00293-x
Gervais, F., Riebesell, U., and Gorbunov, M. Y. (2002). Changes in primary productivity and chlorophyll a in response to iron fertilization in the Southern Polar Frontal Zone. Limnol. Oceanogr. 47, 1324–1335. doi: 10.4319/lo.2002.47.5.1324
Gove, J. M., McManus, M. A., Neuheimer, A. B., Polovina, J. J., Drazen, J. C., Smith, C. R., et al. (2016). Near-island biological hotspots in barren ocean basins. Nat. Commun. 7:10581. doi: 10.1038/ncomms10581
Graham, R. M., De Boer, A. M., van Sebille, E., Kohfeld, K. E., and Schlosser, C. (2015). Inferring source regions and supply mechanisms of iron in the Southern Ocean from satellite chlorophyll data. Deep Sea Res. Part I Oceanogr. Res. Pap. 104, 9–25. doi: 10.1016/j.dsr.2015.05.007
Guinet, C., Dubroca, L., Lea, M. A., Goldsworthy, S., Cherel, Y., Duhamel, G., et al. (2001). Spatial distribution of foraging in female Antarctic fur seals Arctocephalus gazella in relation to oceanographic variables: a scale-dependent approach using geographic information systems. Mar. Ecol. Prog. Ser. 219, 251–264. doi: 10.3354/meps219251
Heinze, C., Meyer, S., Goris, N., Anderson, L., Steinfeldt, R., Chang, N., et al. (2015). The ocean carbon sink–impacts, vulnerabilities and challenges. Earth Syst. Dyn. 6, 327–358. doi: 10.5194/esd-6-327-2015
Hindell, M. A., McMahon, C. R., Bester, M. N., Boehme, L., Costa, D., Fedak, M. A., et al. (2016). Circumpolar habitat use in the southern elephant seal: implications for foraging success and population trajectories. Ecosphere 7:e01213.
Huettel, M., Ziebis, W., Forster, S., and Luther, G. W III. (1998). Advective transport affecting metal and nutrient distributions and interfacial fluxes in permeable sediments. Geochim. Cosmochim. Acta 62, 613–631. doi: 10.1016/s0016-7037(97)00371-2
Hughes, C. W. (2005). Nonlinear vorticity balance of the antarctic circumpolar current. J. Geophys. Res. Oceans 110:C11008. doi: 10.1029/2004JC002753
Iverson, R. L. (1990). Control of marine fish production. Limnol. Oceanogr. 35, 1593–1604. doi: 10.4319/lo.1990.35.7.1593
Korb, R. E., Whitehouse, M. J., and Ward, P. (2004). SeaWiFS in the southern ocean: spatial and temporal variability in phytoplankton biomass around South Georgia. Deep Sea Res. Part II Top. Stud. Oceanogr. 51, 99–116. doi: 10.1016/j.dsr2.2003.04.002
Kunze, E., and Sanford, T. B. (1997). Tidally driven vorticity, diurnal shear and turbulence atop Fieberling Seamount. J. Phys. Oceanogr. 27, 2663–2693. doi: 10.1175/1520-0485(1997)027<2663:tdvdsa>2.0.co;2
Lancelot, C., Montety, A. D., Goosse, H., Becquevort, S., Schoemann, V., Pasquer, B., et al. (2009). Spatial distribution of the iron supply to phytoplankton in the Southern Ocean: a model study. Biogeosciences 6, 2861–2878. doi: 10.5194/bg-6-2861-2009
Laubscher, R. K., Perissinotto, R., and McQuaid, C. D. (1993). Phytoplankton production and biomass at frontal zones in the Atlantic sector of the Southern Ocean. Polar Biol. 13, 471–481.
Lea, M. A., Guinet, C., Cherel, Y., Duhamel, G., Dubroca, L., Pruvost, P., et al. (2006). Impacts of climatic anomalies on provisioning strategies of a Southern Ocean predator. Mar. Ecol. Prog. Ser. 310, 77–94. doi: 10.3354/meps310077
Legendre, L., and Rassoulzadegan, F. (1995). Plankton and nutrient dynamics in marine waters. Ophelia 41, 153–172. doi: 10.1080/00785236.1995.10422042
Lehahn, Y., d’Ovidio, F., and Koren, I. (2018). A satellite-based Lagrangian view on phytoplankton dynamics. Annu. Rev. Mar. Sci. 10, 99–119. doi: 10.1146/annurev-marine-121916-063204
Lemos, A. T., Ghisolfi, R. D. R., and Mazzini, P. L. F. (2018). Annual phytoplankton blooming using satellite-derived chlorophyll-a data around the Vitória-Trindade Chain, Southeastern Brazil. Deep Sea Res. Part I Oceanogr. Res. Pap. 136, 62–71. doi: 10.1016/j.dsr.2018.04.005
Lévy, M., Franks, P. J. S., and Smith, K. S. (2018). The role of submesoscale currents in structuring marine ecosystems. Nat. Commun. 9:4758. doi: 10.1038/s41467-018-07059-3
Löscher, B. M., De Baar, H. J., De Jong, J. T. M., Veth, C., and Dehairs, F. (1997). The distribution of Fe in the Antarctic circumpolar current. Deep Sea Res. Part II Top. Stud. Oceanogr. 44, 143–187.
Martin, J. H. (1990). Glacial-interglacial CO2 change: the iron hypothesis. Paleoceanography 5, 1–13. doi: 10.1029/pa005i001p00001
Measures, C. I., and Vink, S. (2001). Dissolved Fe in the upper waters of the Pacific sector of the Southern Ocean. Deep Sea Res. Part II Top. Stud. Oceanogr. 48, 3913–3941. doi: 10.1016/s0967-0645(01)00074-1
Menard, H. W. (1964). Marine Geology of the Pacific. New York: McGraw-Hill, xiv + 271. Available online at: https://www.worldcat.org/title/marine-geology-of-the-pacific/oclc/545637
Mengelt, C., Abbott, M. R., Barth, J. A., Letelier, R. M., Measures, C. I., and Vink, S. (2001). Phytoplankton pigment distribution in relation to silicic acid, iron and the physical structure across the Antarctic Polar Front, 170° W, during austral summer. Deep Sea Res. Part II Top. Stud. Oceanogr. 48, 4081–4100. doi: 10.1016/s0967-0645(01)00081-9
Meredith, M. P., Meijers, A. S., Naveira Garabato, A. C., Brown, P. J., Venables, H. J., Abrahamsen, E. P., et al. (2015). Circulation, retention, and mixing of waters within the Weddell-Scotia Confluence, Southern Ocean: the role of stratified T aylor columns. J. Geophys. Res. Oceans 120, 547–562. doi: 10.1002/2014jc010462
Meredith, M. P., Watkins, J. L., Murphy, E. J., Cunningham, N. J., Wood, A. G., Korb, R., et al. (2003). An anticyclonic circulation above the northwest Georgia rise, Southern Ocean. Geophys. Res. Lett. 30:2061. doi: 10.1029/2003GL018039
Michaels, A. F., and Silver, M. W. (1988). Primary production, sinking fluxes and the microbial food web. Deep Sea Res. Part A Oceanogr. Res. Pap. 35, 473–490. doi: 10.1016/0198-0149(88)90126-4
Moline, M. A., Claustre, H., Frazer, T. K., Schofield, O., and Vernet, M. (2004). Alteration of the food web along the Antarctic Peninsula in response to a regional warming trend. Global Change Biol. 10, 1973–1980. doi: 10.1111/j.1365-2486.2004.00825.x
Mongin, M. M., Abraham, E. R., and Trull, T. W. (2009). Winter advection of iron can explain the summer phytoplankton bloom that extends 1000 km downstream of the Kerguelen Plateau in the Southern Ocean. J. Mar. Res. 67, 225–237. doi: 10.1357/002224009789051218
Moore, J. K., and Abbott, M. R. (2002). Surface chlorophyll concentrations in relation to the antarctic polar front: seasonal and spatial patterns from satellite observations. J. Mar. Syst. 37, 69–86. doi: 10.1016/s0924-7963(02)00196-3
Morato, T., Hoyle, S. D., Allain, V., and Nicol, S. J. (2010). Seamounts are hotspots of pelagic biodiversity in the open ocean. Proc. Natl. Acad. Sci. U.S.A. 107, 9707–9711. doi: 10.1073/pnas.0910290107
Oliveira, A. P., Coutinho, T. P., Cabeçadas, G., Brogueira, M. J., Coca, J., Ramos, M., et al. (2016). Primary production enhancement in a shallow seamount (Gorringe—Northeast Atlantic). J. Mar. Syst. 164, 13–29. doi: 10.1016/j.jmarsys.2016.07.012
O’Toole, M., Guinet, C., Lea, M. A., and Hindell, M. A. (2017). Marine predators and phytoplankton: how elephant seals use the recurrent Kerguelen plume. Mar. Ecol. Prog. Ser. 581, 215–227. doi: 10.3354/meps12312
Owens, W. B., and Hogg, N. G. (1980). Oceanic observations of stratified Taylor columns near a bump. Deep Sea Res. Part A Oceanogr. Res. Pap. 27, 1029–1045. doi: 10.1016/0198-0149(80)90063-1
Pakhomov, E. A., Henschke, N., Hunt, B. P., Stowasser, G., and Cherel, Y. (2019). Utility of salps as a baseline proxy for food web studies. J. Plankton Res. 41, 3–11. doi: 10.1093/plankt/fby051
Pascual, A., Faugère, Y., Larnicol, G., and Le Traon, P. Y. (2006). Improved description of the ocean mesoscale variability by combining four satellite altimeters. Geophys. Res. Lett. 33:L02611. doi: 10.1029/2005GL024633
Pauly, D., Hood, L., and Stergiou, K. I. (2017). “Tentative von Bertalanffy growth parameters of little-studied fishes,” in Belated Contributions on the Biology of Fish, Fisheries and Features of Their Ecosystems. Fisheries Centre Research Reports, Vol. 25, eds D. Pauly, L. Hood, and K. I. Stergiou (Vancouver, BC: Institute for the Oceans and Fisheries), 58–60.
Perissinotto, R., Laubscher, R. K., and McQuaid, C. D. (1992). Marine productivity enhancement around Bouvet and the South Sandwich Islands (Southern Ocean). Mar. Ecol. Prog. Ser. 88, 41–41.
Perissinotto, R., Lutjeharms, J. R. E., and Van Ballegooyen, R. C. (2000). Biological–physical interactions and pelagic productivity at the Prince Edward Islands. Southern Ocean. J. Mar. Syst. 24, 327–341. doi: 10.1016/s0924-7963(99)00093-7
Perissinotto, R., and Rae, C. D. (1990). Occurrence of anticyclonic eddies on the prince edward plateau (Southern Ocean): effects on phytoplankton biomass and production. Deep Sea Res. Part A Oceanogr. Res. Pap. 37, 777–793. doi: 10.1016/0198-0149(90)90006-h
Pistorius, P., Hindell, M., Crawford, R., Makhado, A., Dyer, B., and Reisinger, R. (2017). At-sea distribution and habitat use in king penguins at sub-Antarctic Marion Island. Ecol. Evol. 7, 3894–3903. doi: 10.1002/ece3.2833
Pitcher, T. J., Morato, T., Hart, P. J. B., Clark, M. R., Haggan, N., and Santos, R. S. (eds) (2007). Seamounts: Ecology, Fisheries & Conservation. Fish and Aquatic Resources Series 12. Oxford: Blackwell Publishing, 527.
Pollard, R. T., Salter, I., Sanders, R. J., Lucas, M. I., Moore, C. M., Mills, R. A., et al. (2009). Southern Ocean deep-water carbon export enhanced by natural iron fertilization. Nature 457, 577–580. doi: 10.1038/nature07716
Queguiner, B. (2013). Iron fertilization and the structure of planktonic communities in high nutrient regions of the Southern Ocean. Deep Sea Res. Part II Top. Stud. Oceanogr. 90, 43–54. doi: 10.1016/j.dsr2.2012.07.024
Read, J., and Pollard, R. (2017). An introduction to the physical oceanography of six seamounts in the southwest Indian Ocean. Deep Sea Res. Part II Top. Stud. Oceanogr. 136, 44–58. doi: 10.1016/j.dsr2.2015.06.022
Reisinger, R., Raymond, B., Hindell, M. A., Bester, M. N., Crawford, R., Davies, D., et al. (2017). Habitat modelling of tracking data from multiple marine predators identifies important areas in the Southern Indian Ocean. Biodivers. Res. 24, 535–550. doi: 10.1111/ddi.12702
Reisinger, R. R., Raymond, B., Hindell, M. A., Bester, M. N., Crawford, R. J., Davies, D., et al. (2018). Habitat modelling of tracking data from multiple marine predators identifies important areas in the Southern Indian Ocean. Divers. Distrib. 24, 535–550. doi: 10.1111/ddi.12702
Rhoads, D. C., and Boyer, L. F. (1982). “The effects of marine benthos on physical properties of sediments,” in Animal-Sediment Relations, ed. P. McCall (Boston, MA: Springer), 3–52. doi: 10.1007/978-1-4757-1317-6_1
Rintoul, S. R. (2018). The global influence of localized dynamics in the Southern Ocean. Nature 558, 209–218. doi: 10.1038/s41586-018-0182-3
Rogers, A. D., Yesson, C., and Gravestock, P. (eds) (2015). A Biophysical and Economic Profile of South Georgia and the South Sandwich Islands as Potential Large-Scale Antarctic Protected Areas. Adv. Mar. Biol. 70, 1–286. doi: 10.1016/bs.amb.2015.06.001
Sallée, J. B., Llort, J., Tagliabue, A., and Lévy, M. (2015). Characterization of distinct bloom phenology regimes in the Southern Ocean. ICES J. Mar. Sci. 72, 1985–1998. doi: 10.1093/icesjms/fsv069
Sanial, V., van Beek, P., Lansard, B., d’Ovidio, F., Kestenare, É, Souhaut, M., et al. (2014). Study of the phytoplankton plume dynamics off the Crozet Islands (Southern Ocean): a geochemical-physical coupled approach. J. Geophys. Res. Oceans 119, 2227–2237. doi: 10.1002/2013jc009305
Sanial, V., van Beek, P., Lansard, B., Souhaut, M., Kestenare, E., d’Ovidio, F., et al. (2015). Use of Ra isotopes to deduce rapid transfer of sediment-derived inputs off Kerguelen. Biogeosciences 12, 1415–1430. doi: 10.5194/bg-12-1415-2015
Santora, J. A., Sydeman, W. J., Schroeder, I. D., Field, J. C., Miller, R. R., and Wells, B. K. (2017). Persistence of trophic hotspots and relation to human impacts within an upwelling marine ecosystem. Ecol. Appl. 27, 560–574. doi: 10.1002/eap.1466
Sc-Camlr-XXXVII (2018). Annex 7: Report of the Meeting of the Workshop on Spatial Management. Report of the Thirty-seven Meeting of the Scientific Committee. Hobart: Commission for the Conservation of Antarctic Marine Living Resources, 203–245.
Scheffer, A., Trathan, P. N., and Collins, M. (2010). Foraging behaviour of king penguins (Aptenodytes patagonicus) in relation to predictable mesoscale oceanographic features in the Polar Front Zone to the north of South Georgia. Prog. Oceanogr. 86, 232–245. doi: 10.1016/j.pocean.2010.04.008
Schmechtig, C., Claustre, H., Poteau, A., and D’Ortenzio, F. (2014). Bio-Argo quality control manual for Chlorophyll-A concentration. Version 1.0. Avaliable at: http://www.jamstec.go.jp/ARGORC/documents/Bio-Argo%20quality%20control%20manual%20for%20Chlorophyll-A%20concentration_v1.0.pdf (accessed December 17th 2014).
Schmechtig, C., Poteau, A., Claustre, H., D’Ortenzio, F., Dall’Olmo, G., and Boss, E. (2018). Processing BGC-Argo Particle Backscattering at the DAC Level. Version 1.4, 07 March 2018. France: IFREMER for Argo Data Management Villefranche-sur-Mer.
Sérazin, G. (2011). An approximate Neutral Density variable for the World’s Oceans. France: École Centrale de Lyon.
Siegelman, L., O’Toole, M., Flexas, M., Rivière, P., and Klein, P. (2019). Submesoscale ocean fronts act as biological hotspot for southern elephant seal. Sci. Rep. 9:5588. doi: 10.1038/s41598-019-42117-w
Smetacek, V., Assmy, P., and Henjes, J. (2004). The role of grazing in structuring Southern Ocean pelagic ecosystems and biogeochemical cycles. Antarct. Sci. 16, 541–558. doi: 10.1017/s0954102004002317
Smetacek, V., De Baar, H. J. W., Bathmann, U. V., Lochte, K., and Van Der Loeff, M. R. (1997). Ecology and biogeochemistry of the Antarctic Circumpolar Current during austral spring: a summary of Southern Ocean JGOFS cruise ANT X/6 of RV Polarstern. Deep Sea Res. Part II Top. Stud. Oceanogr. 44, 1–21. doi: 10.1016/s0967-0645(96)00100-2
Smetacek, V., Scharek, R., and Nöthig, E. M. (1990). “Seasonal and regional variation in the pelagial and its relationship to the life history cycle of krill,” in Antarctic Ecosystems, eds D. C. William and P. B. Howard-Williams (Berlin: Springer), 103–114. doi: 10.1007/978-3-642-84074-6_10
Sohrin, Y., Iwamoto, S. I., Matsui, M., Obata, H., Nakayama, E., Suzuki, K., et al. (2000). The distribution of Fe in the Australian sector of the Southern Ocean. Deep Sea Res. Part I Oceanogr. Res. Pap. 47, 55–84. doi: 10.1016/s0967-0637(99)00049-7
Sokolov, S., and Rintoul, S. R. (2007). On the relationship between fronts of the Antarctic Circumpolar Current and surface chlorophyll concentrations in the Southern Ocean. J. Geophys. Res. Oceans 112:C07030.
Staniland, I. J., Reid, K., and Boyd, I. L. (2004). Comparing individual and spatial influences on foraging behaviour in Antarctic fur seals Arctocephalus gazella. Mar. Ecol. Prog. Ser. 275, 263–274. doi: 10.3354/meps275263
Staudigel, H., Koppers, A. A. P., Lavelle, J. W., Pitcher, T. J., and Shank, T. M. (2010). Defining the word “seamount”. Oceanography 23, 20–21. doi: 10.5670/oceanog.2010.85
Sullivan, C. W., Arrigo, K. R., McClain, C. R., Comiso, J. C., and Firestone, J. (1993). Distributions of phytoplankton blooms in the Southern Ocean. Science 262, 1832–1837.
Tagliabue, A., Aumont, O., and Bopp, L. (2014). The impact of different external sources of iron on the global carbon cycle. Geophys. Res. Lett. 41, 920–926. doi: 10.1002/2013gl059059
Tagliabue, A., Mtshali, T., Aumont, O., Bowie, A. R., Klunder, M. B., Roychoudhury, A. N., et al. (2012). A global compilation of dissolved iron measurements: focus on distributions and processes in the Southern Ocean. Biogeosciences 9, 2333–2349. doi: 10.5194/bg-9-2333-2012
Tamsitt, V., Drake, H. F., Morrison, A. K., Talley, L. D., Dufour, C. O., Gray, A. R., et al. (2017). Spiraling pathways of global deep waters to the surface of the Southern Ocean. Nat. Commun. 8:172. doi: 10.1038/s41467-017-00197-0
Taylor, G. I. (1923). Experiments on the motion of solid bodies in rotating fluids. Proc. R. Soc. Lond. Ser. A 104, 213–218. doi: 10.1098/rspa.1923.0103
Thomalla, S. J., Fauchereau, N., Swart, S., and Monteiro, P. M. S. (2011). Regional scale characteristics of the seasonal cycle of chlorophyll in the Southern Ocean. Biogeosciences 8, 2849–2866. doi: 10.5194/bg-8-2849-2011
Thompson, A. F., and Naveira Garabato, A. C. (2014). Equilibration of the Antarctic circumpolar current by standing meanders. J. Phys. Oceanogr. 44, 1811–1828. doi: 10.1175/jpo-d-13-0163.1
Van Bennekom, A. J., Berger, G. W., Van der Gaast, S. J., and De Vries, R. T. P. (1988). Primary productivity and the silica cycle in the Southern Ocean (Atlantic sector). Palaeogeogr. Palaeoclimatol. Palaeoecol. 67, 19–30. doi: 10.1016/0031-0182(88)90120-4
Venables, H., Meredith, M. P., Atkinson, A., and Ward, P. (2012). Fronts and habitat zones in the Scotia Sea. Deep Sea Res. Part II Top. Stud. Oceanogr. 59, 14–24. doi: 10.1016/j.dsr2.2011.08.012
Venables, H. J., and Meredith, M. P. (2009). Theory and observations of Ekman flux in the chlorophyll distribution downstream of South Georgia. Geophys. Res. Lett. 36:L23610. doi: 10.1029/2009GL04137
Venables, W. N., and Ripley, B. D. (2002). Modern Applied Statistics with S-PLUS, 4th Edn. New York, NY: Springer.
Venrick, E. L. (1991). Mid-ocean ridges and their influence on the large-scale patterns of chlorophyll and production in the North Pacific. Deep Sea Res. Part A Oceanogr. Res. Pap. 38, S83–S102.
Viglione, G. A., and Thompson, A. F. (2016). Lagrangian pathways of upwelling in the Southern Ocean. J. Geophys. Res. Oceans 121, 6295–6309. doi: 10.1002/2016jc011773
Viljoen, J. J., Philibert, R., Van Horsten, N., Mtshali, T., Roychoudhury, A. N., Thomalla, S., et al. (2018). Phytoplankton response in growth, photophysiology and community structure to iron and light in the Polar Frontal Zone and Antarctic waters. Deep Sea Res. Part I Oceanogr. Res. Pap. 141, 118–129. doi: 10.1016/j.dsr.2018.09.006
Watson, A. J., Ledwell, J. R., Messias, M. J., King, B. A., Mackay, N., Meredith, M. P., et al. (2013). Rapid cross-density ocean mixing at mid-depths in the Drake Passage measured by tracer release. Nature 501, 408–411. doi: 10.1038/nature12432
Whitehead, T. O., Kato, A., Ropert-Coudert, Y., and Ryan, P. G. (2016). Habitat use and diving behaviour of macaroni Eudyptes chrysolophus and eastern rockhopper E. chrysocome filholi penguins during the critical pre-moult period. Mar. Biol. 163:19.
Wilson, R. P., Bost, C. A., Pütz, K., Charrassin, J. B., Culik, B. M., and Adelung, D. (1997). Southern rockhopper penguin Eudyptes chrysocome chrysocome foraging at Possession Island. Polar Biol. 17, 323–329. doi: 10.1007/pl00013373
Xing, X., Claustre, H., Blain, S., d’Ortenzio, F., Antoine, D., Ras, J., et al. (2012). Quenching correction for in vivo chlorophyll fluorescence acquired by autonomous platforms: a case study with instrumented elephant seals in the Kerguelen region (Southern Ocean). Limnol. Oceanogr. Methods 10, 483–495. doi: 10.4319/lom.2012.10.483
Keywords: open ocean seamounts, phytoplankton blooms, Antarctic Circumpolar Current, Lagrangian approach, pelagic hotspots
Citation: Sergi S, Baudena A, Cotté C, Ardyna M, Blain S and d’Ovidio F (2020) Interaction of the Antarctic Circumpolar Current With Seamounts Fuels Moderate Blooms but Vast Foraging Grounds for Multiple Marine Predators. Front. Mar. Sci. 7:416. doi: 10.3389/fmars.2020.00416
Received: 22 January 2020; Accepted: 12 May 2020;
Published: 09 June 2020.
Edited by:
Andrew John Constable, Australian Antarctic Division, AustraliaReviewed by:
Peter Strutton, University of Tasmania, AustraliaVladimir Laptikhovsky, Centre for Environment, Fisheries and Aquaculture Science (Cefas), United Kingdom
Copyright © 2020 Sergi, Baudena, Cotté, Ardyna, Blain and d’Ovidio. This is an open-access article distributed under the terms of the Creative Commons Attribution License (CC BY). The use, distribution or reproduction in other forums is permitted, provided the original author(s) and the copyright owner(s) are credited and that the original publication in this journal is cited, in accordance with accepted academic practice. No use, distribution or reproduction is permitted which does not comply with these terms.
*Correspondence: Sara Sergi, sara.sergi@locean-ipsl.upmc.fr