Using Structured Decision-Making Tools With Marginalised Fishers to Promote System-Based Fisheries Management Approaches in South Africa
 Louise Carin Gammage
 Astrid Jarre
- Department of Biological Sciences, University of Cape Town, Cape Town, South Africa
Fishers, and the communities they support face a range of challenges brought on by complexity and uncertainty in their social-ecological systems (SESs). This undermines their ability to achieve sustainability whilst hampering proactive planning and decision-making. To capacitate fishers to apply risk aversion strategies at smaller scales of operation and for managers to apply inclusive management approaches such as the ecosystem approach to fisheries management (EAF), a better understanding of the relationships and interactions in marine SESs must be developed. At the same time, the EAF requires the inclusion of multiple stakeholders, disciplines and objectives into decision-making processes. Previous work in the southern Cape with fishers, identified drivers of change. Building on this previous research, and using causal mapping, fishers mapped out drivers of change in an iterative process in a problem framing exercise which also highlighted hidden drivers of change and feedback loops. To explore the relative importance of key drivers of change with participants, weighted hierarchies as well as a Bayesian Belief Network (BBN) were developed. By identifying and highlighting these hidden system interactions a more integrated systems view has been facilitated, adding to the understanding of this fishery system. Drivers identified in the weighted hierarchy were consistent with those identified in the causal maps and previous research, of interest is the relative weighting attributed to these drivers. Whereas the weighted hierarchies emphasised the political dimensions, group work already indicated the range of perceptions, reflecting the considerable uncertainties in this SES. While methodologically challenging at first, the individual approach behind the BBN construction yielded a better reflection of the diversity of views and a better balance of political, economic and climate dimensions of drivers of change. We show how, by using SDMTs, the most disenfranchised community members can engage meaningfully in a structured process. As structure is crucial to management processes, the research shows that where the appropriate groundwork, capacity building and resourcing takes place, disenfranchised stakeholders can be integrated into formal management processes; fulfilling a key requirement of an EAF.
Introduction
Fisheries are an important food and livelihood source for millions of people, especially in developing countries (Garcia et al., 2003). Fishery-reliant coastal communities are exposed to a wide variety of social, economic, political and biophysical stressors (Parry et al., 2007; Brierley and Kingsford, 2009; Hoegh-Guldberg and Bruno, 2010). Anthropogenic climate change and the over-exploitation of marine species add more pressure (Tegner and Dayton, 2000; Jackson et al., 2001; Scheffer et al., 2005; Halpern et al., 2008; Hoegh-Guldberg and Bruno, 2010; Poloczanska et al., 2013). This results in coastal communities, fishing sectors and managers struggling with the ramifications (and potential opportunities) of change. Considering the challenges presented by complexity and uncertainty, fisheries should be viewed as complex marine social-ecological systems (SESs) (e.g. Ommer and Team, 2007; Ostrom, 2009). In governing these SESs, the Ecosystem Approach to Fisheries Management (EAF), (FAO, 2003; Garcia et al., 2003), has been widely adopted. EAF aims for the holistic, sustainable management of capture fisheries to promote healthy marine ecosystems together with sustainable fishery-derived livelihoods.
Decision-making in SESs is complicated with traditional, linear processes proving inadequate (Berkes, 2003). Recurring management problems - often severe - in natural resource use can stem from a lack of the implicit recognition of the inextricable links between ecosystems and social systems; especially since feedback loops can take important roles in system dynamics (Folke et al., 2010). Recognising complexity, ecosystem-based management approaches, such as the EAF (FAO, 2003), actively promote systems-thinking and stakeholder participation. To effectively implement an EAF, the decision process needs to balance multiple objectives, considering priorities and trade-offs between conflicting objectives in a multiple stakeholder context (FAO, 1999; Garcia et al., 2000; Degnbol and Jarre, 2004; Garcia and Cochrane, 2005), thereby bringing the need to integrate different criteria in support of decision-making, to the fore.
The successful implementation of EAF at the global scale has been challenging. Fisheries managers have grappled with the complexities of an EAF while trying to find effective ways to identify and weigh-up management objectives (e.g., Paterson and Petersen, 2010; Jennings et al., 2014). Current approaches for implementing an EAF tend to be used in a way that expands traditional management paradigms rather than changing them. For any EAF implementation to succeed, various perspectives need to be integrated into the decision-making process at various scales. Paterson et al. (2010) highlight the need for a transdisciplinary approach where real-world problems are used to develop solutions in partnerships with multiple stakeholders.
There is thus a need to develop and implement multi-use methods that can simultaneously address multi-faceted complex problems, and contribute to capacity building, at the small scale and inform EAF implementation and sustainable development at the larger scale. These challenges underscore the already identified need to re-evaluate how marine SESs are perceived, studied, managed and governed. From a methodological perspective, this does not necessarily constitute a need to ‘reinvent the wheel’ but to consider how existing methods can be used and applied in novel ways.
The use of structured decision-making tools (SDMTs) in an interactive and iterative participatory scenario-based approach in the context of the South African linefishery (Gammage, 2019) is such an example. To circumvent the limitations of forecasts under high uncertainty, scenario planning approaches to future change are a favoured approach to build adaptive capacity for resources users (DEA, 2013; IPCC, 2014; IPBES, 2016), although often used at a high level. While scenarios based on forecasts involving South African fisheries have been conducted as well, e.g., long-term adaptation scenarios for South Africa (DEA, 2013), participatory scenario planning approaches together with fishers have not been introduced or initiated as a decision-making or change-management tool, nor has the approach been employed to inform governance or the implementation of an EAF. Whereas scenarios present the overarching approach for this study, here we explore the use of problem structuring tools at the small scale to better understand complexities of South Africa’s southern Cape linefishery SES.
Previous work in this SES with fishery participants has identified drivers of change (Gammage et al., 2017a, 2019). In this second step, we use causal mapping, weighted hierarchies and BBNs as problem structuring tools toward building meaningful future scenarios for small-scale fishing communities in the southern Cape. While the scenario stories are explored elsewhere (Gammage, 2019), the results of this problem structuring phase are worth reflecting upon in their own right.
This scenario-based approach, following a participant-led, inductive approach (Creswell and Plano Clark, 2011; Newing and Contributors, 2011), seeks to address capacity building at the small-scale (fisher, household) whilst providing a practical way to inform decision-making at the larger scale (Gammage, 2019). The implementation of the overall approach provides valuable information in terms of both enhancing our understanding of SES interactions (product) and the process used to develop the tools. The approach comprises three components – building on knowledge of stressors that make fishers vulnerable to change (see Gammage, 2015; Gammage et al., 2017a, 2019; Martins et al., 2019), casual maps provide a conceptualisation of the marine SES, allowing for the identification of feedback loops and hidden interactions and contributes to problem structuring. Data required for the development of a weighted-hierarchy and prototype1 Bayesian Belief Network (BBN) in a facilitated systems-thinking exercise in a workshopping process which runs concurrently with small-scale prototyping scenario planning.
Through implementing this (small-scale) process with the most vulnerable and marginalised stakeholders in the fishery system, we draw on an undocumented knowledge system to firstly, ascertain what (if any) drivers and interactions are revealed by the participants in developing the causal map weighted hierarchy and prototype BBN. Importantly, we do not only build on a thematic framework identified in previous research, but also place the results of this study in conversation with previous research findings on drivers of change. Secondly, we seek to gauge whether these tools could be appropriate and beneficial in an iterative and interactive development process with stakeholders who are unfamiliar with more formal decision-making processes. Specifically, we address the role these tools can play in problem structuring and reframing while engaging participants in an exercise which builds capacity and enhances learning at the level of the person, household and community of fishers.
The paper proceeds with an introduction to the southern Cape research area. Next, follows a literature overview of the methodological approach, after which we outline and discuss the causal mapping process in its entirety before doing the same with the BBN process. We discuss the development of the weighted hierarchy within the context of the BBN development process. Finally, we provide insights gained from using these tools.
The Southern Cape Research Area
The small-scale commercial linefishery of the southern Cape is the focus of this study. This fishery is situated in the Benguela Current Large Marine Ecosystem (BCLME), an eastern boundary current system dominated by coastal upwelling. The highly productive BCLME sustains important fisheries for Angola, Namibia and South Africa (BCC, 2013). Consisting of four sub-(eco)systems, variability is exhibited at several temporal scales such as warming being observed at its edges (Rouault et al., 2010; Dufois and Rouault, 2012; Jarre et al., 2015). Observed spatial and temporal changes in the southern Benguela, attributed to various natural and anthropogenic drivers (Jarre et al., 2013; Blamey et al., 2015), occur across multiple scales - making it difficult to tease out exact drivers and interactions (Moloney et al., 2013). Observations of long-term trends in ocean temperature is further complicated by decadal-scale variability in the southern Benguela’s coastal and shelf waters (Jarre et al., 2015). While a general warming trend of both inshore and offshore ocean temperature is expected on the Agulhas bank, different datasets have shown conflicting trends regarding cooling and warming (Blamey et al., 2012, 2015; Lamont et al., 2018).
While stressors currently display decadal-scale variability (Blamey et al., 2012, 2015; Ward, 2018), the effects of climate change are inevitable and add to the complexity of the marine SES of the southern Cape. This not only poses challenges for fishery resources, but also for fishery-dependent communities (Jarre et al., 2013; Gammage et al., 2017a, b). For the South African linefishery, the over-exploitation of almost all warm/temperate, bottom-dwelling linefish is well documented and commercial extinction a reality for some species. This over-exploitation has negatively affected productivity (with associated social and economic impacts), trophic flow and biodiversity of marine ecosystems (Griffiths, 2000).
The coastal waters in the inshore area of the Agulhas Bank are the fishing grounds of the southern Cape linefishery (Figure 1). This is a boat-based, multi-user, multi-area and multi-species fishery that conducts mostly day trips, ranging from six to eight hours. The primary target species of the fishery is silver kob (Argyrosomus inodorus) (Griffiths, 2000; Blamey et al., 2015) but in absence of kob, other targeted species include silvers/carpenter (Argyrozona argyrozona), redfish (like red roman, Chrysoblephus laticeps) and various species of shark (Chondrichthyes spp.). Our research focused on small-scale fishers who participate as crewmen. This group of fishers, already identified as being particularly vulnerable to change (see Gammage et al., 2017a, 2019; Martins et al., 2019). Designated as ‘previously disadvantaged’ due to their marginalisation under South African Apartheid laws, this group of fishers is characterised by low levels of formal education, high levels of poverty, often live in towns situated off the coast (a consequence of Apartheid spatial planning), all of which contributes to their high vulnerability to any type of change or shock. These fishers, as small-scale fishers, remain excluded from formal decision-making processes, often due to their perceived inability to participate (also see Isaacs, 2006; Sowman, 2006; Sowman et al., 2014). The crew mostly live in the towns of Mossel Bay, Bitouville, Melkhoutfontein, Vermaaklikheid and Slangrivier (Figure 1). These sites stretch over 200 km of coastline in the southern Cape and consist of fishing communities in rural, semi-rural and peri-urban areas with both direct and indirect access to the ocean (Gammage et al., 2017a).
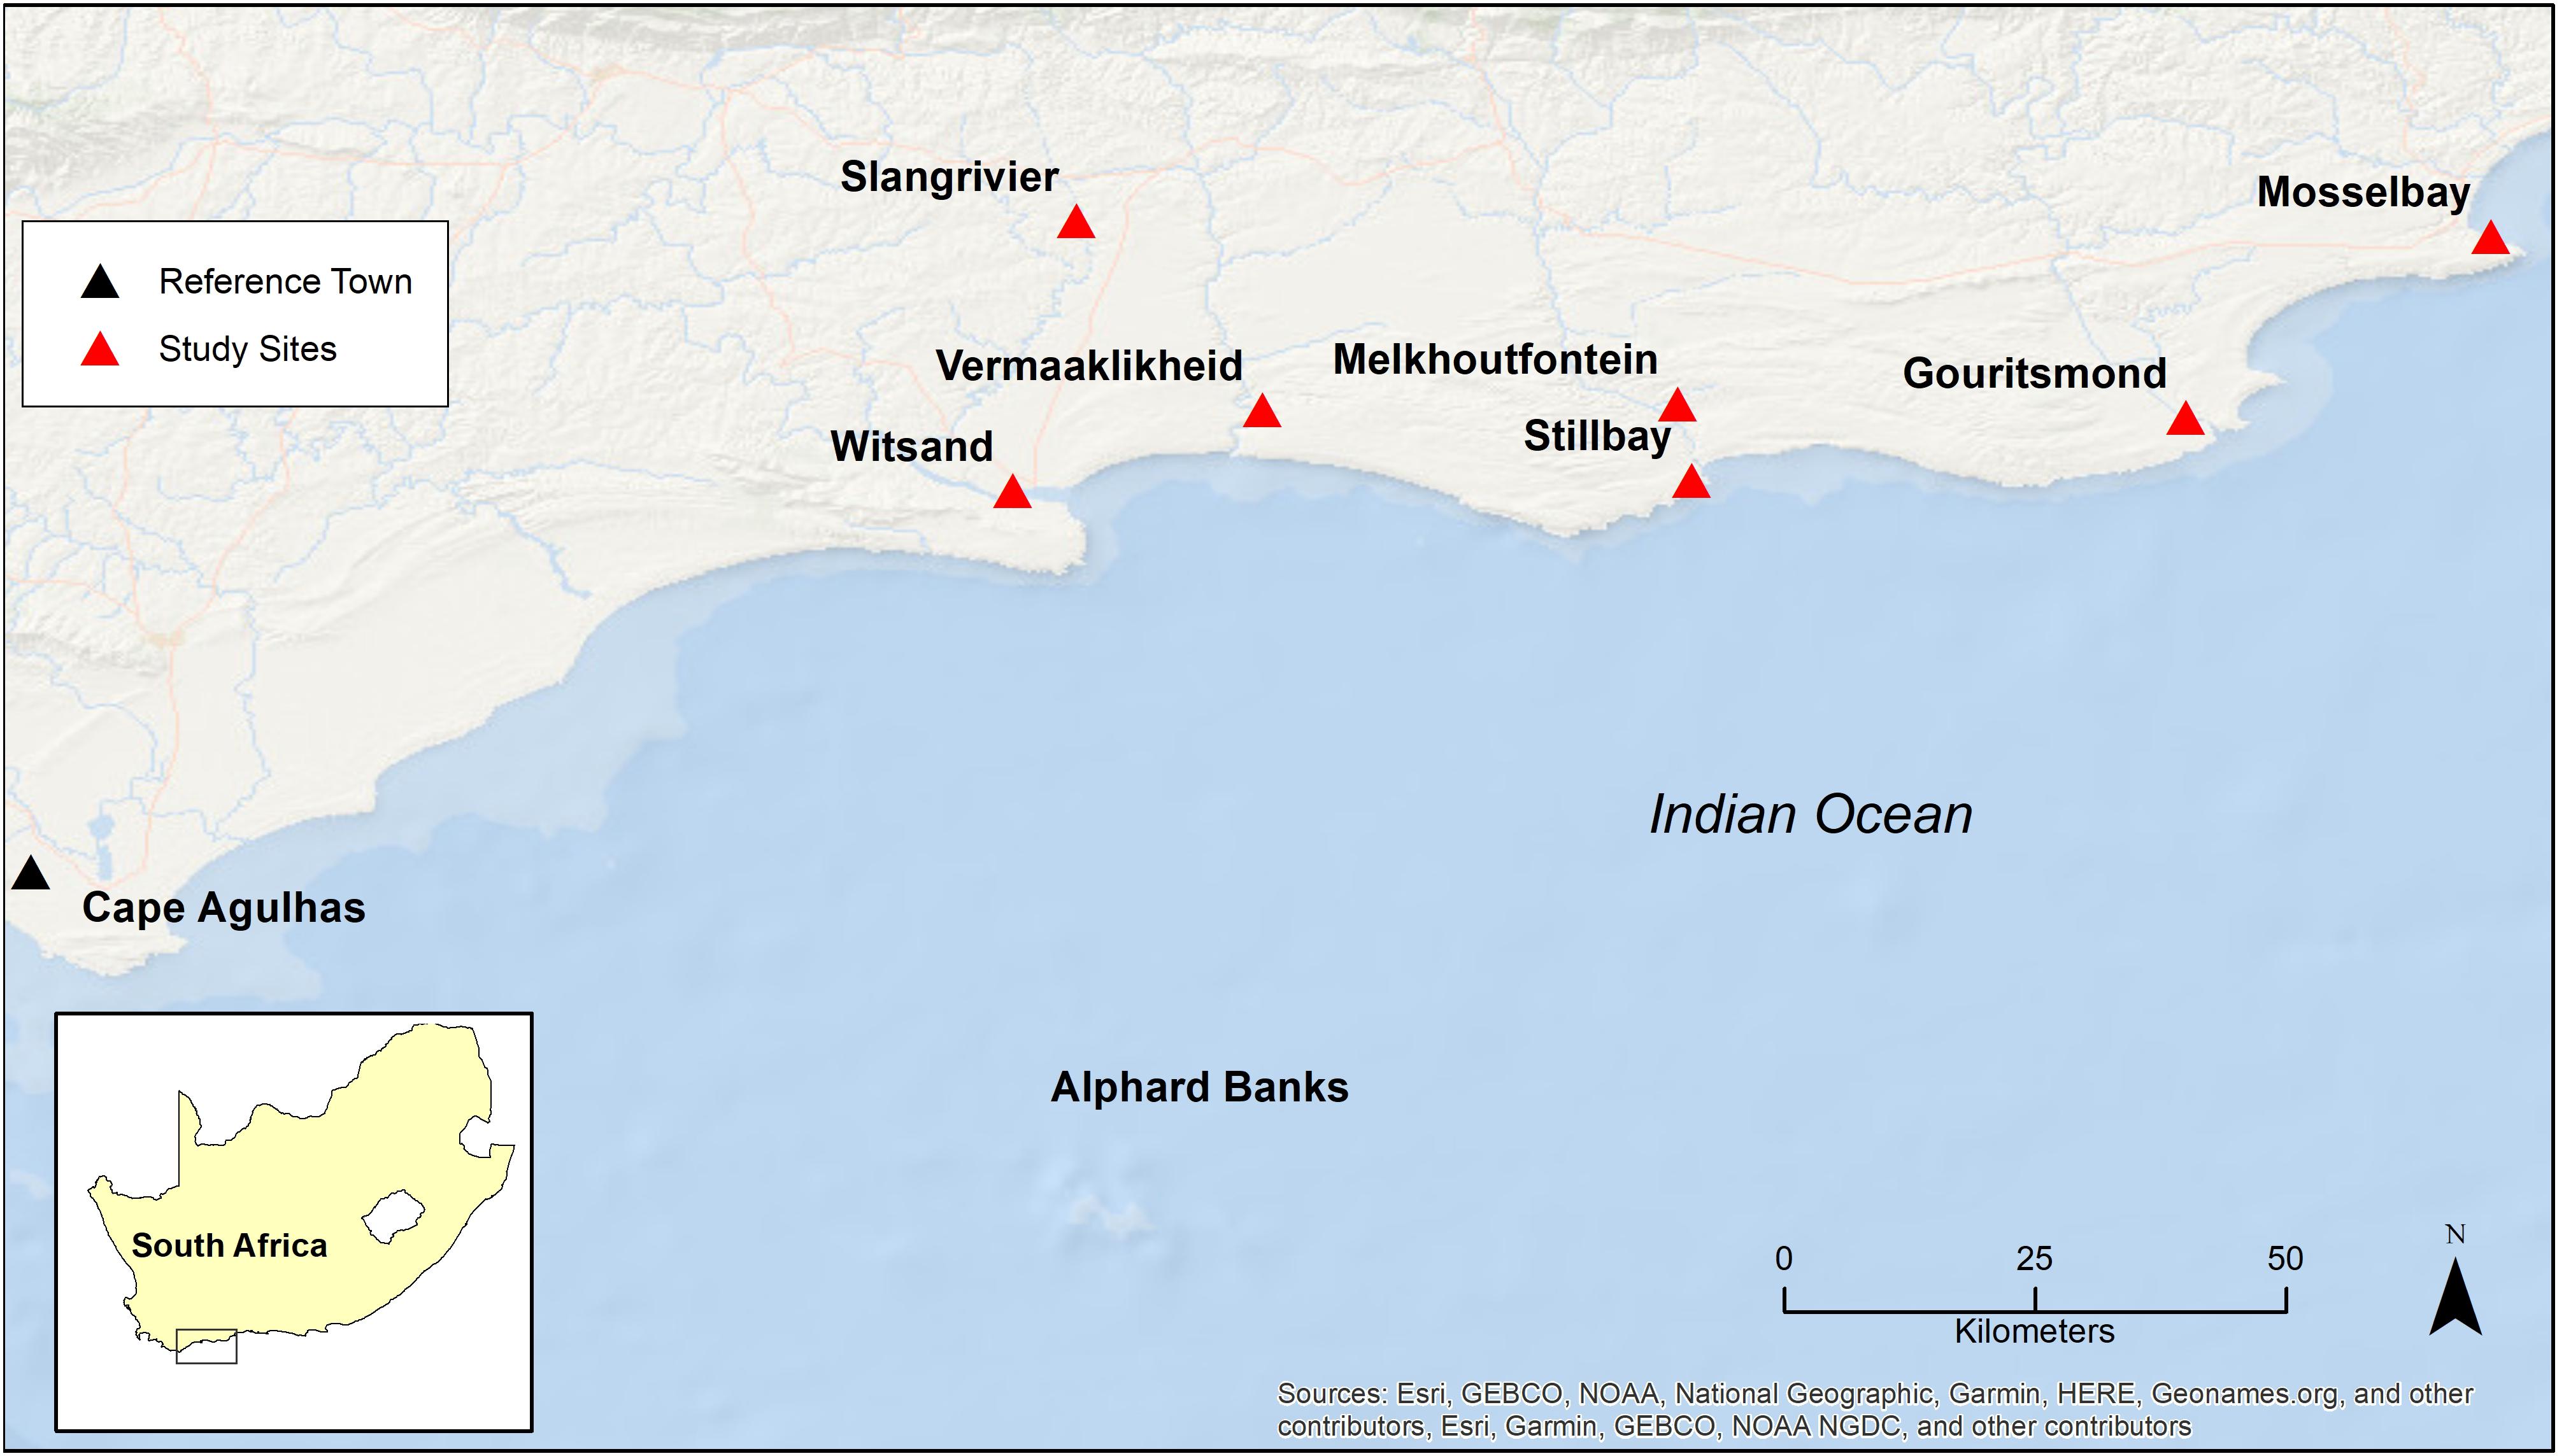
Figure 1. Map of the research area. Mossel Bay is large urban centre situated on the coast; Bitouville is part of Gouritsmond; Melkhoutfontein is situated approximately 8 km from Still Bay on the coast, Vermaaklikheid is 7 km from the coast as the crow flies, but fishers often travel 47 km by road to launch in Still Bay; Slangrivier is situated 26 km inland as the crow flies, fishers travel 38 km by road to Witsand.
In South Africa, the Small-Scale Fisheries Policy (Act no 474 of 2012) (DAFF, 2012) provides a framework for the management of small-scale fisheries and specifically addresses sustainable development, empowerment, and inequality for small-scale fishers. The SSFP is a people-centred approach to management which recognises the critical role played by marine resources in poverty alleviation (Sowman et al., 2014). The policy implementation has been plagued with delays and has to date, still not been fully implemented despite being promulgated in 2012 (see Gammage, 2019). The continued failure to access fishery Rights’ is a continued source of discontent among small-scale fishers and often prevents fishers from considering the impact of other drivers on catches (Gammage et al., 2017a, 2019), while poorly defined bottom-up management mechanisms continue to limit their involvement in formal management processes.
Apart from challenges experienced with the SSFP, this fishery has been plagued by increasing resource scarcity, variability in physical systems and policy uncertainty in recent years (Gammage, 2015; Gammage et al., 2017a). Highlighting knowledge gaps in the human dimension of the marine SES at the local scale, previous research carried out in the context of the Southern Cape Interdisciplinary Fisheries Research (SCIFR) project (Jarre et al., 2018) forms the background to work that describes stressors driving change and fishers’ responses to them (Gammage et al., 2017a, b). These include policy and regulation, climate variation and other fishing sectors as major stressors; policy enforcement, economics (capital), “political” issues and socio-economic issues as mid-range stressors and the geography of the area, infrastructure, social factors, lack of knowledge, fishing methods as minor stressors. Although these drivers of change identified by various groups of stakeholders is consistent throughout this research area, the research highlights that fishers implement different change response strategies, the research shows that decision-making is often haphazard with fishers finding it difficult to articulate their rationale (Gammage et al., 2017b). Fishing communities also tend to cope and react rather than adapt proactively to change. However, to ensure sustainable livelihoods, these communities will need to respond to these changes in a more structured manner that will allow them to carry out their livelihood activities based on informed decisions in the future (Gammage, 2015; Gammage et al., 2017b).
Overview of General Methods and Approach
Using Structured Decision-Making Tools for the Implementation of an EAF
Structured decision-making (SDM) provides context for framing problems that are related to multiple objectives and stakeholders. SDM combines analytical methods with insights into human judgement to aid and inform decision-makers, as opposed to prescribing preferred solutions (Gregory et al., 2012). In its practical implementation, SDM is an organised, inclusive and transparent approach, based on values and preferences that strive to understand complex problems, as well as generate and evaluate creative alternatives (Gregory et al., 2012; Robinson and Fuller, 2017). This approach can contribute to consistency, transparency and defensibility in decision-making processes and is important when considering the technical and value-based nature of multiple objectives that need to be considered in management decision-making contexts (Belton and Stewart, 2002; Wilson and McDaniels, 2007; Gregory et al., 2012; Robinson and Fuller, 2017).
Participatory modelling (PM) involves multiple stakeholders (often scientists and members of the public) working together to develop conceptual and dynamic models in addressing environmental problems (see Whatmore, 2009; Gaddis et al., 2010; Sandker et al., 2010; Voinov and Bousquet, 2010; Gregory et al., 2012; Gray et al., 2017). However, to be able to apply these methods, one first needs to ensure that stakeholders are willing to consider the possible solutions to complex problems, which often requires them to be willing to ‘sit in the same room.’ In South African fisheries, levels of conflict are often so high that many stakeholders are unwilling to engage in such processes. To this end, group interactions with a more homogenous group of stakeholders have been applied with some success (Paterson et al., 2010; McGregor, 2015; McGregor et al., 2016). The importance of stakeholder participation and engagement in the implementation of an EAF in South Africa cannot be over-emphasised. While the participation of representatives of large, established fishing companies is relatively well-developed (Staples, 2010), stakeholder participation in fisheries management overall remains fragmented (e.g., Hara et al., 2014). The continued marginalisation of small-scale fishers and the relatively low formal levels of education necessitates that the type of models used must be given careful consideration and the development of these models, carefully facilitated. For this group of fishers, the application of even qualitative network (simulation) modelling tools would have been premature. Here, small models are developed to establish a common language amongst stakeholders, building on the property of models as boundary objects to facilitate learning (McGregor, 2015). This learning is crucial for fishers to be able to confidently participate in larger scale settings considering the unequal power dynamics within South African fishery systems (e.g., Duggan, 2018).
While results of problem structuring methods have been used successfully in (predictive) systems modelling with stakeholders (e.g., van den Belt, 2004; Weller et al., 2016), the purpose of this study is to use simple models, built by stakeholders themselves, to clarify drivers and connections, as well as to assess the relative importance of drivers. Bearing in mind the marginalisation of these fishers, these explicit steps are necessary to familiarise all involved with structured processes in the first place (e.g., Garcia, 2000; Belton and Stewart, 2002; Voinov and Bousquet, 2010; Duggan, 2012; Gray et al., 2017), with the exposure and learning providing them with capacity to confidently participate in larger stakeholder group settings in future (Gammage, 2019).
Using Small Models as Problem Structuring Tools
Structured decision-making tools (SDMTs) provide a framework for facilitating the implementation of decision processes. These tools are designed to aid both individuals and groups in addressing complex decisions, specifically in the context of difficult group dynamics (Belton and Stewart, 2002; Guimarães Pereira et al., 2005; Gregory et al., 2012). Problem structuring refers to the process of making sense of an issue by identify key concerns, goals, stakeholders, actions and uncertainties (Belton and Stewart, 2002). Adequate problem framing involves all stakeholders and focuses on the socially constructed nature of potential management challenges and problems (Haapasaari et al., 2012b). This necessitates taking the most essential elements and interrelationships within a system into consideration, while facilitating the understanding of problems in their entirety (Young et al., 1999; Sluijs and Craye, 2005; Clark and Stankey, 2007; Folke et al., 2010; Verweij and Densen, 2010). Importantly, by making it explicit how various individuals and/or groups piece together a specific problem (such as resource scarcity), it becomes possible to also facilitate reciprocal and mutual learning, as well as enhance communication and develop effective management approaches (Verweij and Densen, 2010; Jones et al., 2011; Haapasaari et al., 2012a).
Casual maps are an example of a problem framing/structuring tool which provide an effective way of conceptualising a system (Belton and Stewart, 2002). This tool provides a formal visual view of the system and identifies key areas of concern, organises ideas to clarify goals and actions, and highlights knowledge gaps. The casual mapping process is particularly useful if the initial problem statement is very general and if the issues at hand are complicated (Belton and Stewart, 2002; Özesmi and Özesmi, 2004). Another vital advantage is that it is possible to model a system that has limited information at the scale at which the fishery operates using fisher (local) knowledge. Causal map construction is quick and easy, as demonstrated by Taber (1991) and Kosko (1992a, b), and presents an opportunity to combine knowledge sources as shown by Kosko (1992a). Although causal maps have successfully been applied in other fishery contexts in southern Africa (e.g., Stewart et al., 2009; Basson, 2009) these tools have never been used with the line fishers from the southern Cape.
The use of causal diagrams in problem structuring has been discussed by various authors (Belton, 1997; Belton and Stewart, 2002; Montibeller and Belton, 2006; Stewart et al., 2009). The most common reasons for using causal mapping relevant to this research, is to facilitate the development of system descriptions; a means to carry out problem structuring; to help decision-makers to understand, delineate and organise the problem; to elicit and structure the stakeholders’ knowledge of the problem situation and to stimulate new causal thinking (Marttunen et al., 2017).
By combining the maps produced by many stakeholders, the resulting (final) map is improved (Dickerson and Kosko, 1994; Özesmi and Özesmi, 2004). In the context of the present research, a problem identification process is initiated within the causal map development process and - due to the iterative nature of the research - is carried through to the BBN and scenario planning processes.
Bayesian Belief Networks (BBNs) are models that provide graphic and probabilistic representations of the relationships that exist amongst the variables within a parameterized system (Smith et al., 2018). The term BBN refers to an acyclic directed graph of probability distributions (Nicholson and Flores, 2011; Johnson and Mengersen, 2012) and was formally characterised by Judea Pearl in 1988 (Pearl, 1988). Importantly, BBNs are tools that are suitable for decision analysis under uncertainty, albeit at the expense of feedback loops (Smith et al., 2018). BBN modelling techniques allow for the determination of probabilities of outcomes associated with multiple drivers of change and have been successfully applied in multiple stakeholders and management settings in numerous applications, not just predictions (Haapasaari and Karjalainen, 2010; Levontin et al., 2011; Haapasaari et al., 2012b; Tiller et al., 2013). An example of this is where different stakeholders’ value and opinions have been effectively shown using BBNs in the context of fisheries management (Hammond and O’Brien, 2001; Levontin et al., 2011; Haapasaari et al., 2012a).
Problem definition is best achieved by including stakeholders from the beginning of the process so that the active participation is assured, and acceptance of the final product is improved (e.g., van den Belt, 2004). Stakeholders are also able to provide information about interests, concerns, perceptions, and/or data. BBNs can capture behavioural complexity (Pearl, 1988) although it is difficult and often impossible to measure the magnitude of the interaction strengths of all the variables in the system to acquire deterministic relationships. General observations, defined by uncertainty, can provide qualitative information about variable interactions (Dambacher et al., 2007). In general, BBNs aid ecological risk-based decision-making by providing a tool that is able to integrate numerous lines of evidence, including process-related information which stems from both existing data and/or expert judgement (Varis and Kuikka, 1997a; Marcot et al., 2001; Kuikka et al., 2011; Barton et al., 2012; Haapasaari et al., 2012a).
There are many factors which motivate the use of BBNs. The graphical nature of the model assists in problem structuring (Rumpff et al., 2011) and through the process of focussing ideas in the development of the model and the process of coproduction of the network structure (e.g., Newton, 2009), social learning between scientists (of various disciplines) and practitioners is promoted (Davies et al., 2015). The use of BBNs encourages system structure transparency (e.g., Henriksen et al., 2007) and addresses the interaction between variables and uncertainty explicitly (Henriksen and Barlebo, 2008; Landuyt et al., 2013). Where appropriate, and depending on the purpose of the BBN, options arising from different outcome scenarios can be explored (Haines-Young, 2011).
When considering fishery problems the approach is especially useful when examining human perspectives (Haapasaari et al., 2007; Haapasaari and Karjalainen, 2010; Levontin et al., 2011) whilst offering the opportunity for the integration of quantitative and qualitative data, different knowledge systems and perspectives into one model (Haapasaari et al., 2012b; van Putten et al., 2013). BBNs are also an excellent means of summarising information in complex systems (Zorrilla et al., 2007). In complex systems (such as fisheries), there is a high amount of variability not only in temporal and spatial scales in how drivers of change are perceived, but also in response to these changes. Considering this messiness and the characteristics of BBNs, it would appear the use of BBNs in this fishery system would provide a tool for the knowledge integration and system analysis required which goes one step beyond the qualitative analysis of causal diagrams.
Developing Causal Maps With Stakeholders
This section introduces the approach and method used in the development of the causal maps together with the related results and specific discussion.
The Approach and Methods Used in the Development of the Causal Maps
The causal map construction was an iterative process with participants and builds on previous research into stressors that drive change in this linefishery (Gammage, 2015; Gammage et al., 2017a, 2019; Supplementary Appendix 1). This previous research, using semi-structured interviews with various stakeholders, identified a thematic framework of stressors that drive change (see Supplementary Appendix 2). Using the thematic structure (Gammage, 2015; Gammage et al., 2017a, 2019), a causal diagram or ‘base map’ was constructed using the VensimTM (Personal Learning Edition) software. To derive the second iteration town-specific maps, the ‘base map’ was shown to participants from the towns of Mossel Bay, Bitouville, Melkhoutfontein and Slangrivier. This was accomplished by approaching key informants (typically in informal leadership roles) to convene a group of four to six participants for a group discussion. After a brief feedback session on previous research regarding drivers of change and social vulnerability (Gammage et al., 2019), fishers were asked to adjust the base diagram as they saw fit. This was done through a process of discussion and reaching a consensus within the group. In each of the towns, small adjustments, drawn in on a hardy copy of the diagram, were made. These group interactions were audio-recorded, and notes made to aid the digitising and integration processes. As all the participants were Afrikaans-speaking, in situ translation of the base map was provided by the researcher (also a native Afrikaans speaker). Hidden feedback loops and indirect stressors not apparent and identified by participants after the first iteration, were subsequently highlighted by the researcher in the diagram. Specific changes made with associated reasoning are provided in Supplementary Appendix 3.
Subsequently, the town-specific maps were combined to form one regional map, representing the third iteration of the process2. The integration of the town-specific into regional maps was done by comparing the various inputs from the towns and finding the option – whether the wording of the variable or the connections amongst variables – to make it applicable to each town. The regional map was shown to key informants from each town for validation and to ensure continued applicability to each town’s context. For the analysis of the maps, a causes tree, which shows all the causes that affect the target node (‘Ability to put food on the table’) together with a verification of the various feedback loops involving key stressors, was extracted using VensimTM.
The first workshop of the Bayesian network development process (see section “Approach and methods”) served as the final validation step in the mapping process. The regional map was used in this workshop and in the subsequent scenario planning process (see Gammage, 2019).
Results
Causal Mapping Process
The Base map was found to be consistent with the participants’ opinions, and adjustments made to the map were related to the place context (at the scale of the town/community). Throughout discussion with all groups, the participants needed to be guided away from falling into a repetition of the same issues, and it was reiterated throughout that the current research was a “next step” toward solving the various challenges outlined by previous research. Importantly, the issues highlighted by the participants throughout all the conversation echoed those raised in previous research (Gammage, 2015; Gammage et al., 2017a, 2019). All groups extensively discussed the implementation of policy and regulation; specifically the implementation of the small-scale fisheries policy (SSFP) (see section “THE SOUTHERN CAPE RESEARCH AREA”) (DAFF, 2012).
Causal Maps
First and second iterations
The base map (first iteration) is shown in Figure 2. The target node on the far right, ‘ability to put food on the table,’ is the central outcome of this diagram. All stressors identified have been framed regarding their influence on the fishery system and ultimately this outcome. As the indirect links have not been inserted into this base map, there are several variables with no inputs within the diagram namely ‘decrease in sea state’, ‘increase in rainfall’, ‘management zone (A vs B)’, ‘uncertainty about access to rights’, ‘uncertainty about SSFP’, ‘uncertainty about implementation of policy’, ‘access to DAFF’3 and ‘financial management skills’.
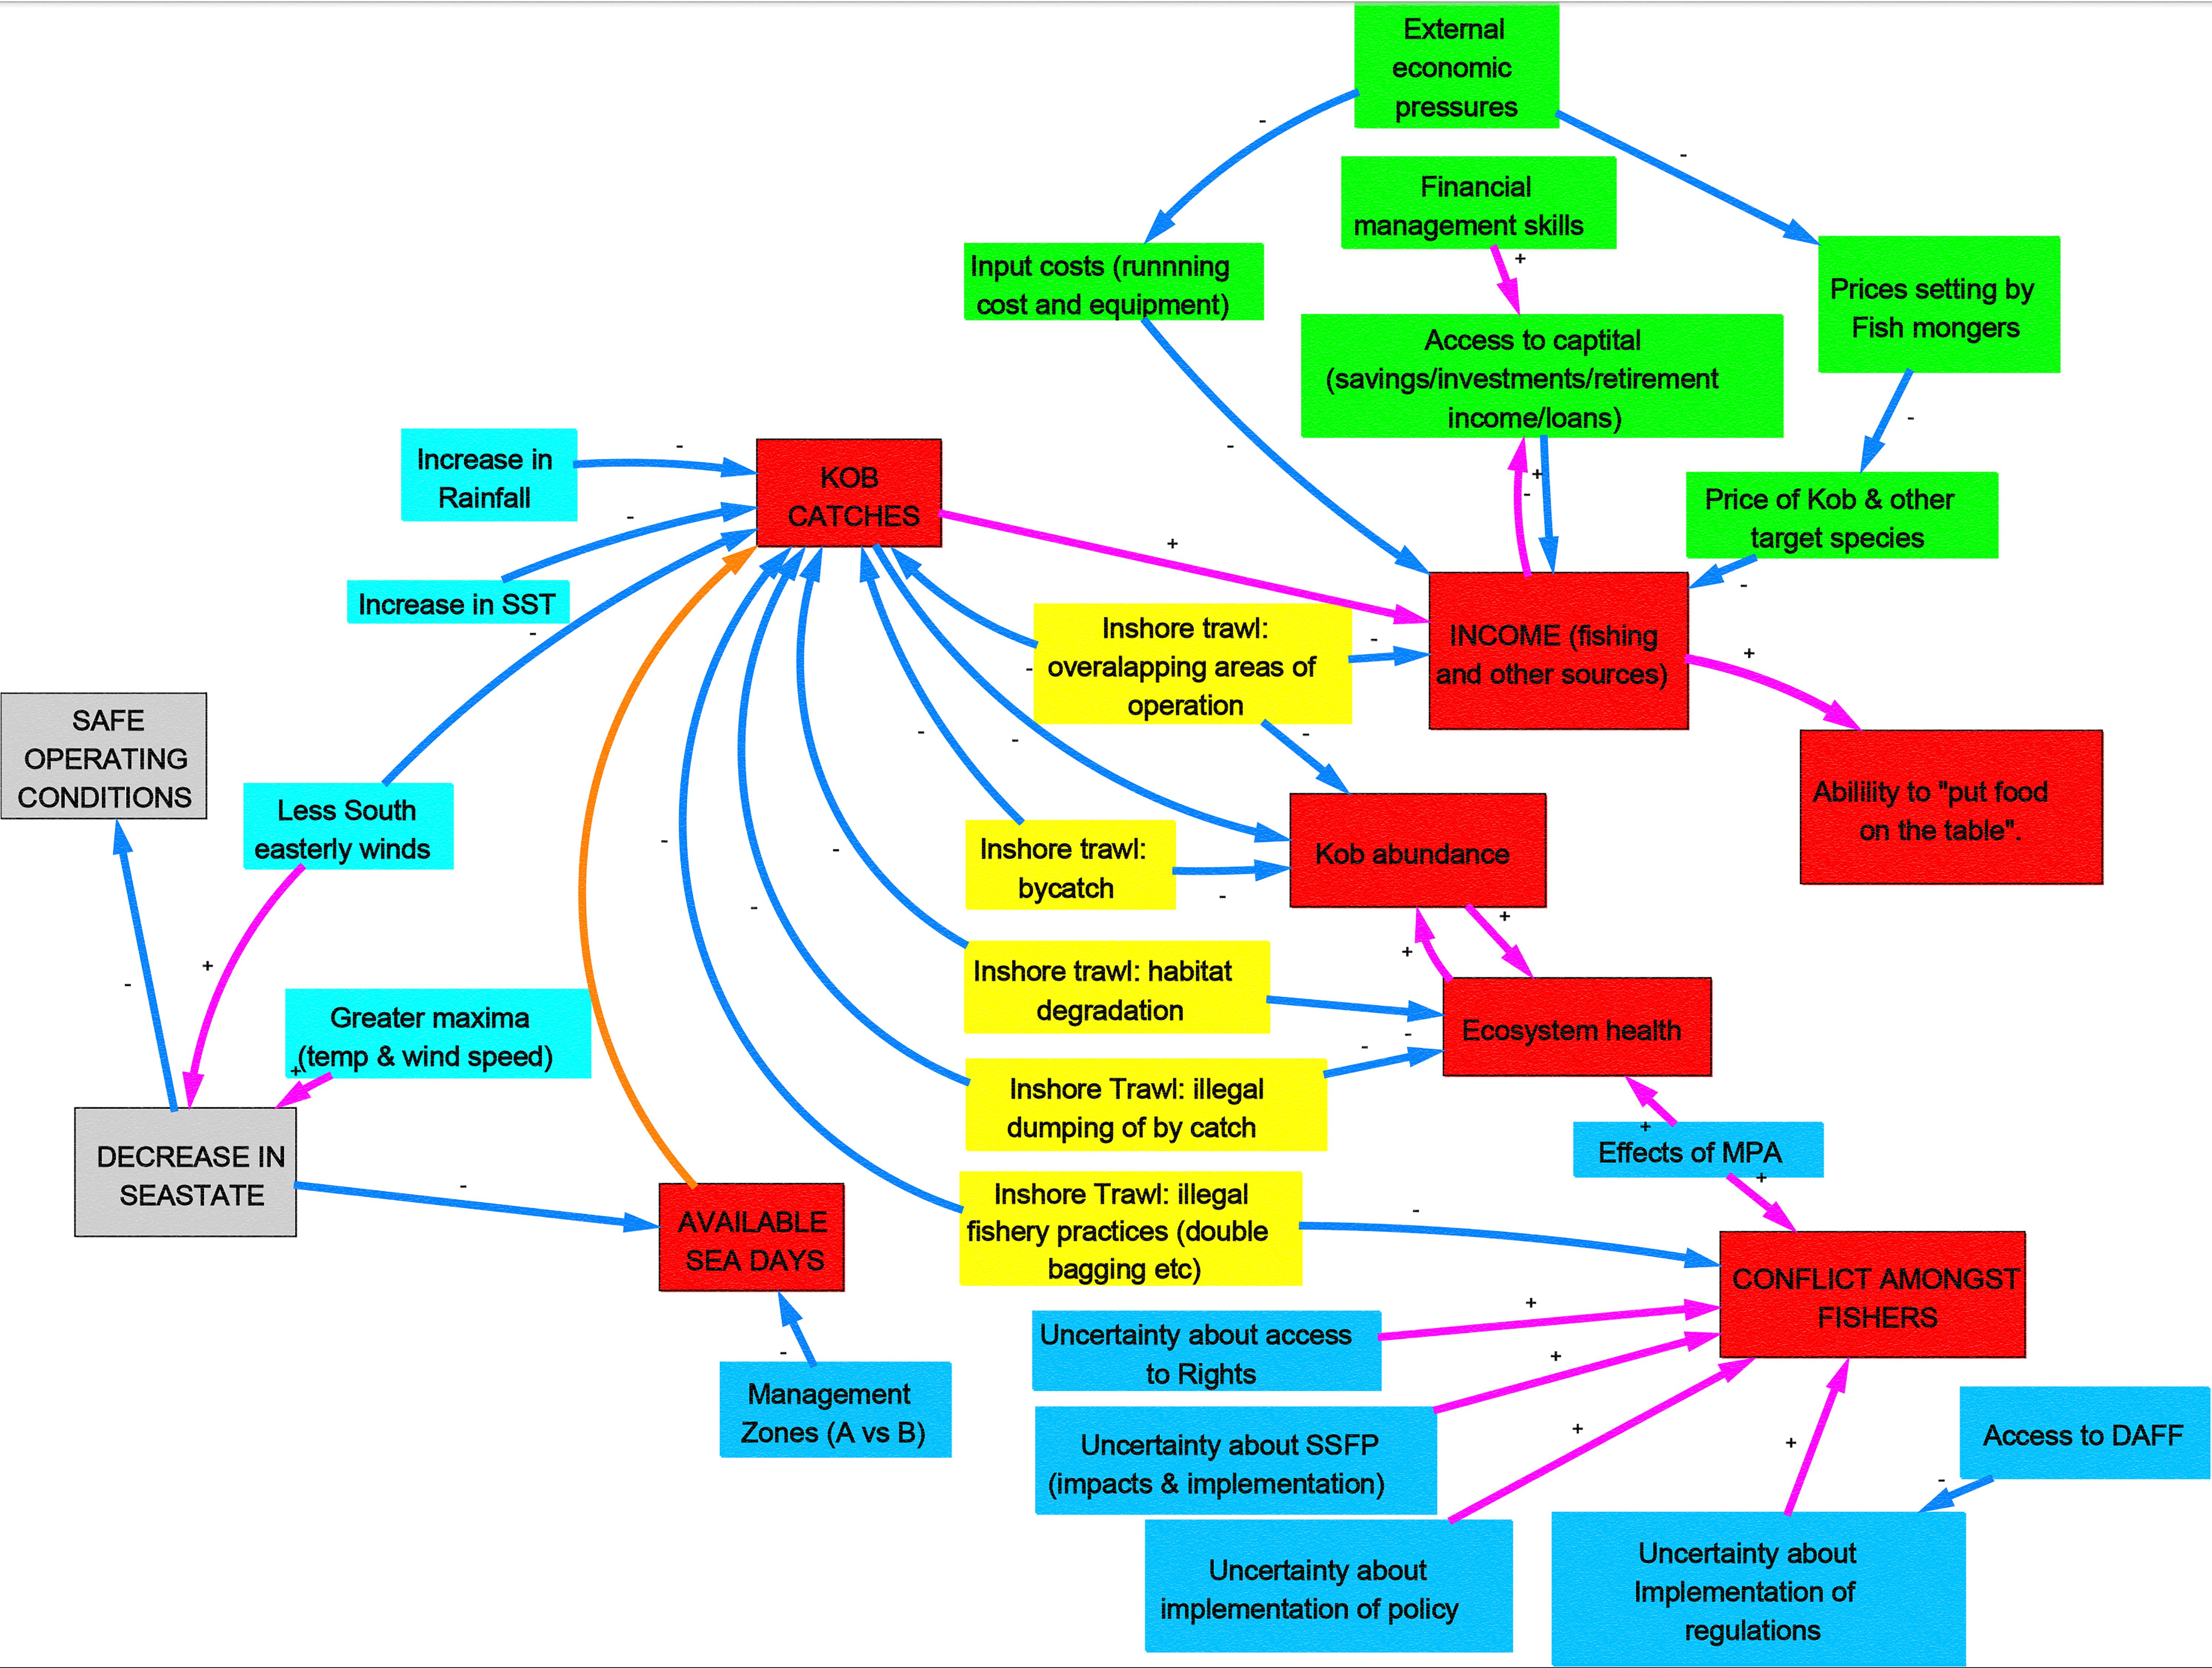
Figure 2. Base map (first iteration) derived from the stressor framework identified by Gammage (2015) and Gammage et al. (2017a). Although feedback loops are present in the map and visible to the trained eye, these feedback loops or indirect stressors are not explicitly highlighted in this first iteration of the map. See Table 1 for colour coding.
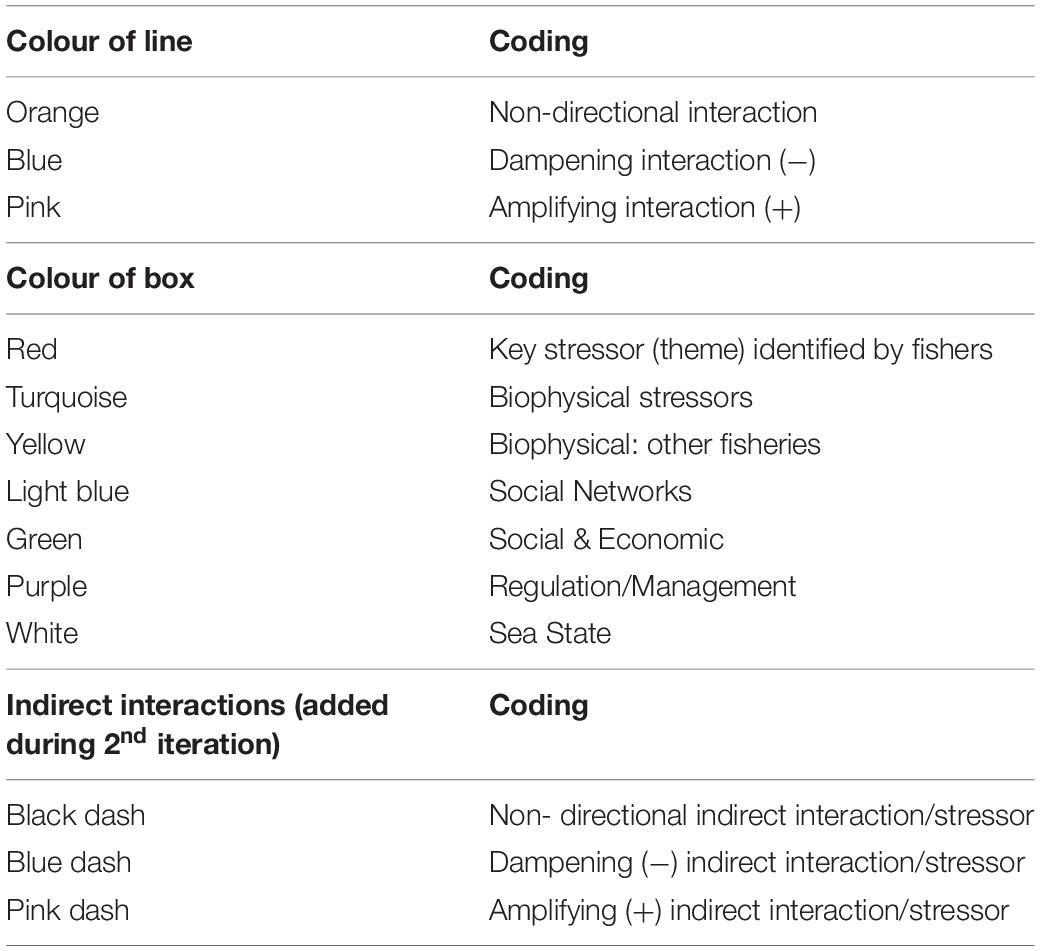
Table 1. Colour coding for interaction between variables in the Causal mapping of stressors that drive change in the linefishery in the southern Cape.
The causal map was colour coded as per Table 1.
The second iteration maps (town maps), together with a description of the adjustments made to derive the map, are provided in Supplementary Appendix 3. Supplementary Table 5 in Supplementary Appendix 3 provides a summation of key insights derived from these interactions with fishers in this iteration.
Regional (final) map
The regional map (Figure 3) was the last iteration in this process. Adjustments – mostly related to the names of the variables – were made to some of the variables and links to ensure that the map applies to all towns in the region. After the initial integration process, after further discussions and drawing from previous research and research knowledge; the map was further refined to form the final regional map. Key adjustments made are reflected in Supplementary Appendix 4. Importantly, the combined map was translated from English to Afrikaans, and both versions made available to participants.
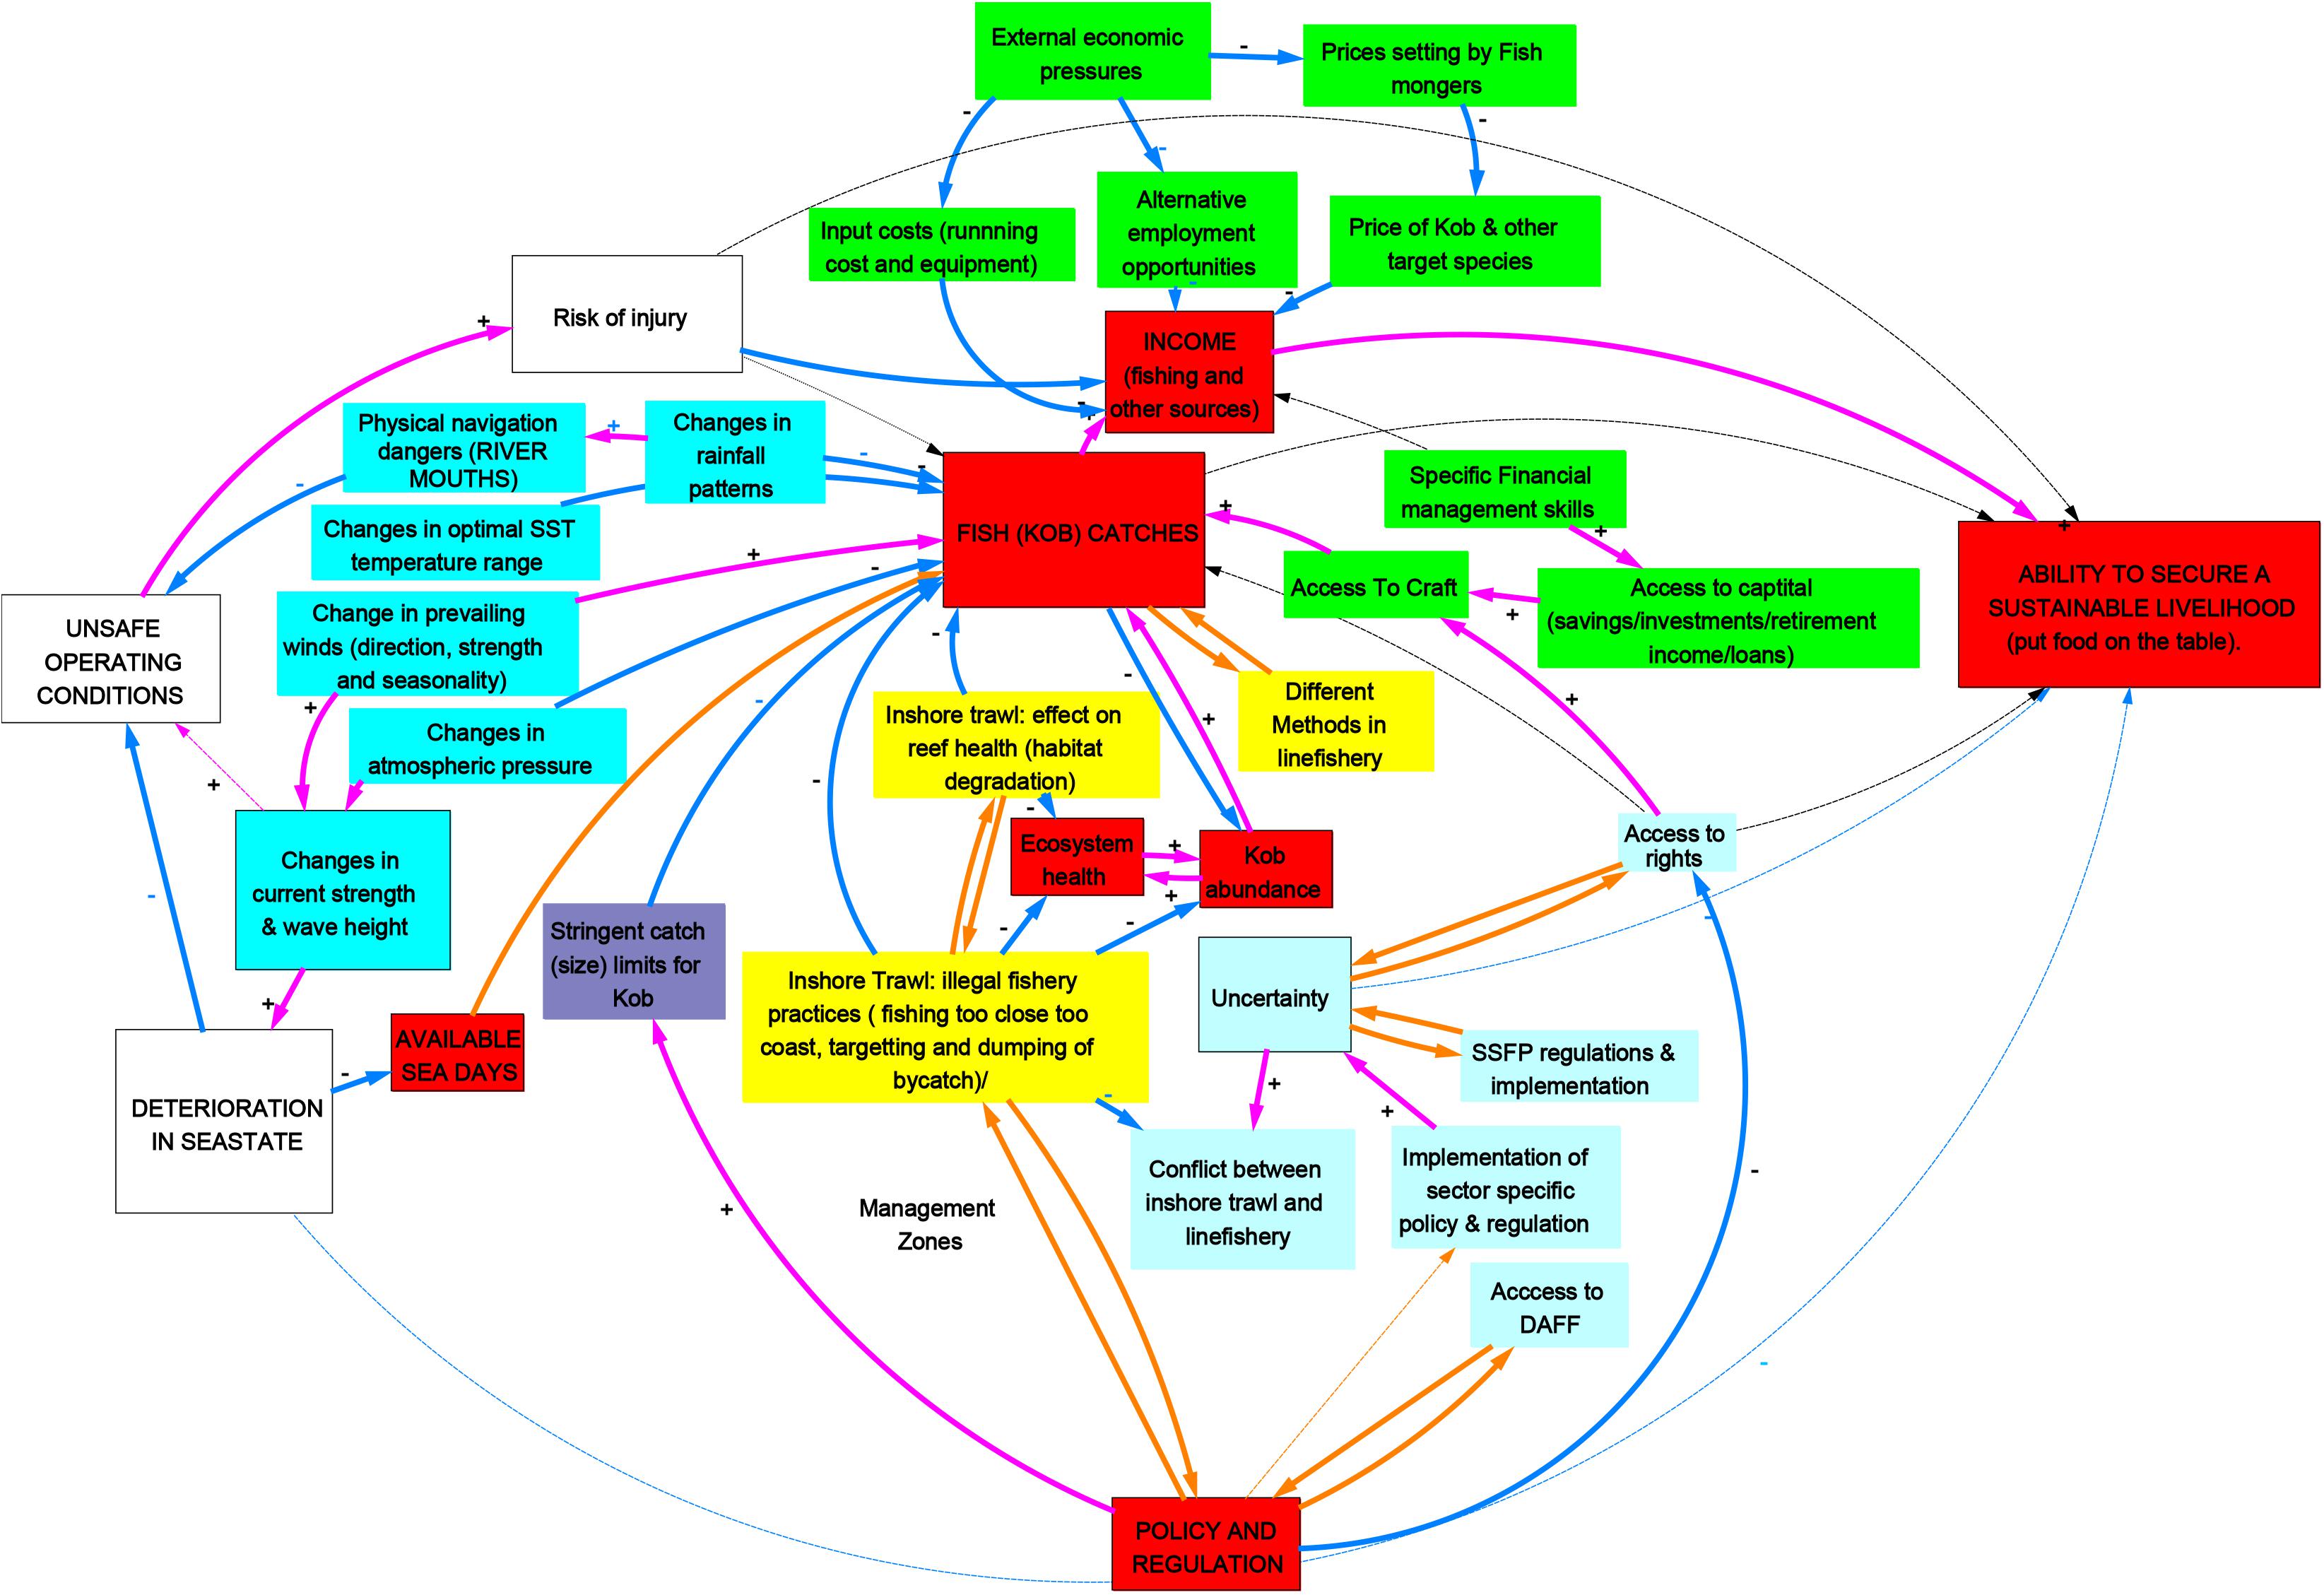
Figure 3. Final regional map derived from the inputs of fishers in the second iteration. This final map explicitly highlights feedback loops and indirect stressors. It portrays a view of the drivers of change derived from the original thematic framework together with information provided by participants in the second iteration. See Table 1 for colour coding.
The final diagram highlights the complexity of the system by revealing feedback loops such as the loop between ‘Uncertainty,’ ‘Access to Rights’ and ‘Ability to secure a sustainable livelihood’; highlighting non-linear dynamics in the system. This is especially true when considering all the indirect influences on the target node (‘ability to secure a sustainable livelihood’), where only one direct influence was initially identified.
The final map further highlights the complexity of policy and the regulatory issues at play, including the identified feedback loops. As this is a participant-driven product, this shows the importance that fishers attribute to policy and regulatory issues when questioned directly on drivers of system change. The insertion of ‘uncertainty’ as a driver of change is a direct product of the iterative process, where many of the discussions centred on lack of information regarding the implementation of policy (specifically the SSFP) and related timelines. There was also an explicit recognition that policy uncertainty has given rise to conflict amongst fishers (particularly, inshore trawl and line fishers, as well as between skippers and crew within the commercial linefishery). This is expected in a climate of policy implementation uncertainty where environmental variability and resource (specifically kob) scarcity is increasingly pervasive. For many of the identified feedback loops, the amplifying or dampening nature was not immediately apparent and has thus not been identified as such in the diagram. The causes trees (Supplementary Appendix 5) show the diagram expressed as hierarchies and reveal no surprises. The analysis of feedback loops and indirect drivers (see Supplementary Appendix 6), show that most feedback loops are present in the interaction within and between the policy and regulatory stressors and biophysical system stressors. The most prominent interaction between the human (social) and ecological is the effect that fishing methods (whether trawl or linefish) have on eventual kob catches, moderated by ecosystem and habitat health which influences overall kob availability.
Discussion: Using Causal Mapping in a Participatory Conceptual Modelling Process
The development and application of causal maps in this research were multi-faceted. The tool offers insight into the complexity of the SES of the southern Cape, while providing insights into how participants viewed the system. The process followed to derive the maps contributes directly to the BBNs development (below) as it served as the conceptualisation of the system. Insights gained from the process, show how causal maps could eventually be applied to improved communication among a wider group of stakeholders, as necessary for EAF implementation. Through the development process, it was possible to combine the knowledge and inputs from various participants. Lastly, a significant contribution was made toward a process of capacity building through the initiation of a mutual learning process that took place throughout.
Connecting the Social and the Ecological in the Southern Cape Linefishery
The causal mapping process served to validate findings of previous research concerning the drivers of change within the system and was particularly useful for highlighting feedback loops and multiple stressors that were not immediately apparent from the previous, qualitative research (Gammage et al., 2017a, b, 2019), such as the link between ‘changes in current strength & wave height,’ ‘unsafe operating conditions,’ ‘risk of injury’ and the ‘ability to secure a sustainable livelihood.’ The feedback loops in the final diagram largely highlight points of interaction between the policy/regulatory and biological system components of the SES. This is not surprising as the research took place at a time where fish (kob) scarcity was a reality (also highlighted by Duggan, 2018), coupled with policy uncertainty created by the delayed implementation of the SSFP. That these issues were top of mind is reflected in the fact that in all towns, the most time was spent on these issues in the small group interviews. In the case of this system conceptualisation, the feedback loops identified are most likely contributing to system instability. The diagram shows that fishing activities in the area have a definite impact on linefishery kob catches through the effect that fishing (specifically trawling and overfishing) has on the ecosystem (kob abundance) and benthic health (habitat destruction). Fishers have consistently over recent years reported declining fishery-derived incomes (Duggan, 2012, 2018; Gammage, 2015; Gammage et al., 2017a) with considerable attrition rates in the fisheries (both in the linefishery and inshore trawl) (Greenston, 2013; Gammage, 2015; Gammage et al., 2017b), a likely reflection of the decline in fishery-derived income reported by participants. Notably, there are no feedback loops connecting the climate/weather system component to the biological component in these maps. It is unlikely that there is no such connection (see Travers-Trolet et al., 2014; Ortega-Cisneros et al., 2017, 2018; Ward, 2018), but one can deduce that the climate/weather driver was not top of mind for this group of fishers. Although adjustments were made to the fishers’ inputs, these changes were mostly concerned with the wording of the variables to ensure that they were worded in a way that applied to the overall system. This result is echoed by the results of the weighted hierarchy (see Figure 4) that was derived as part of the BBN process.
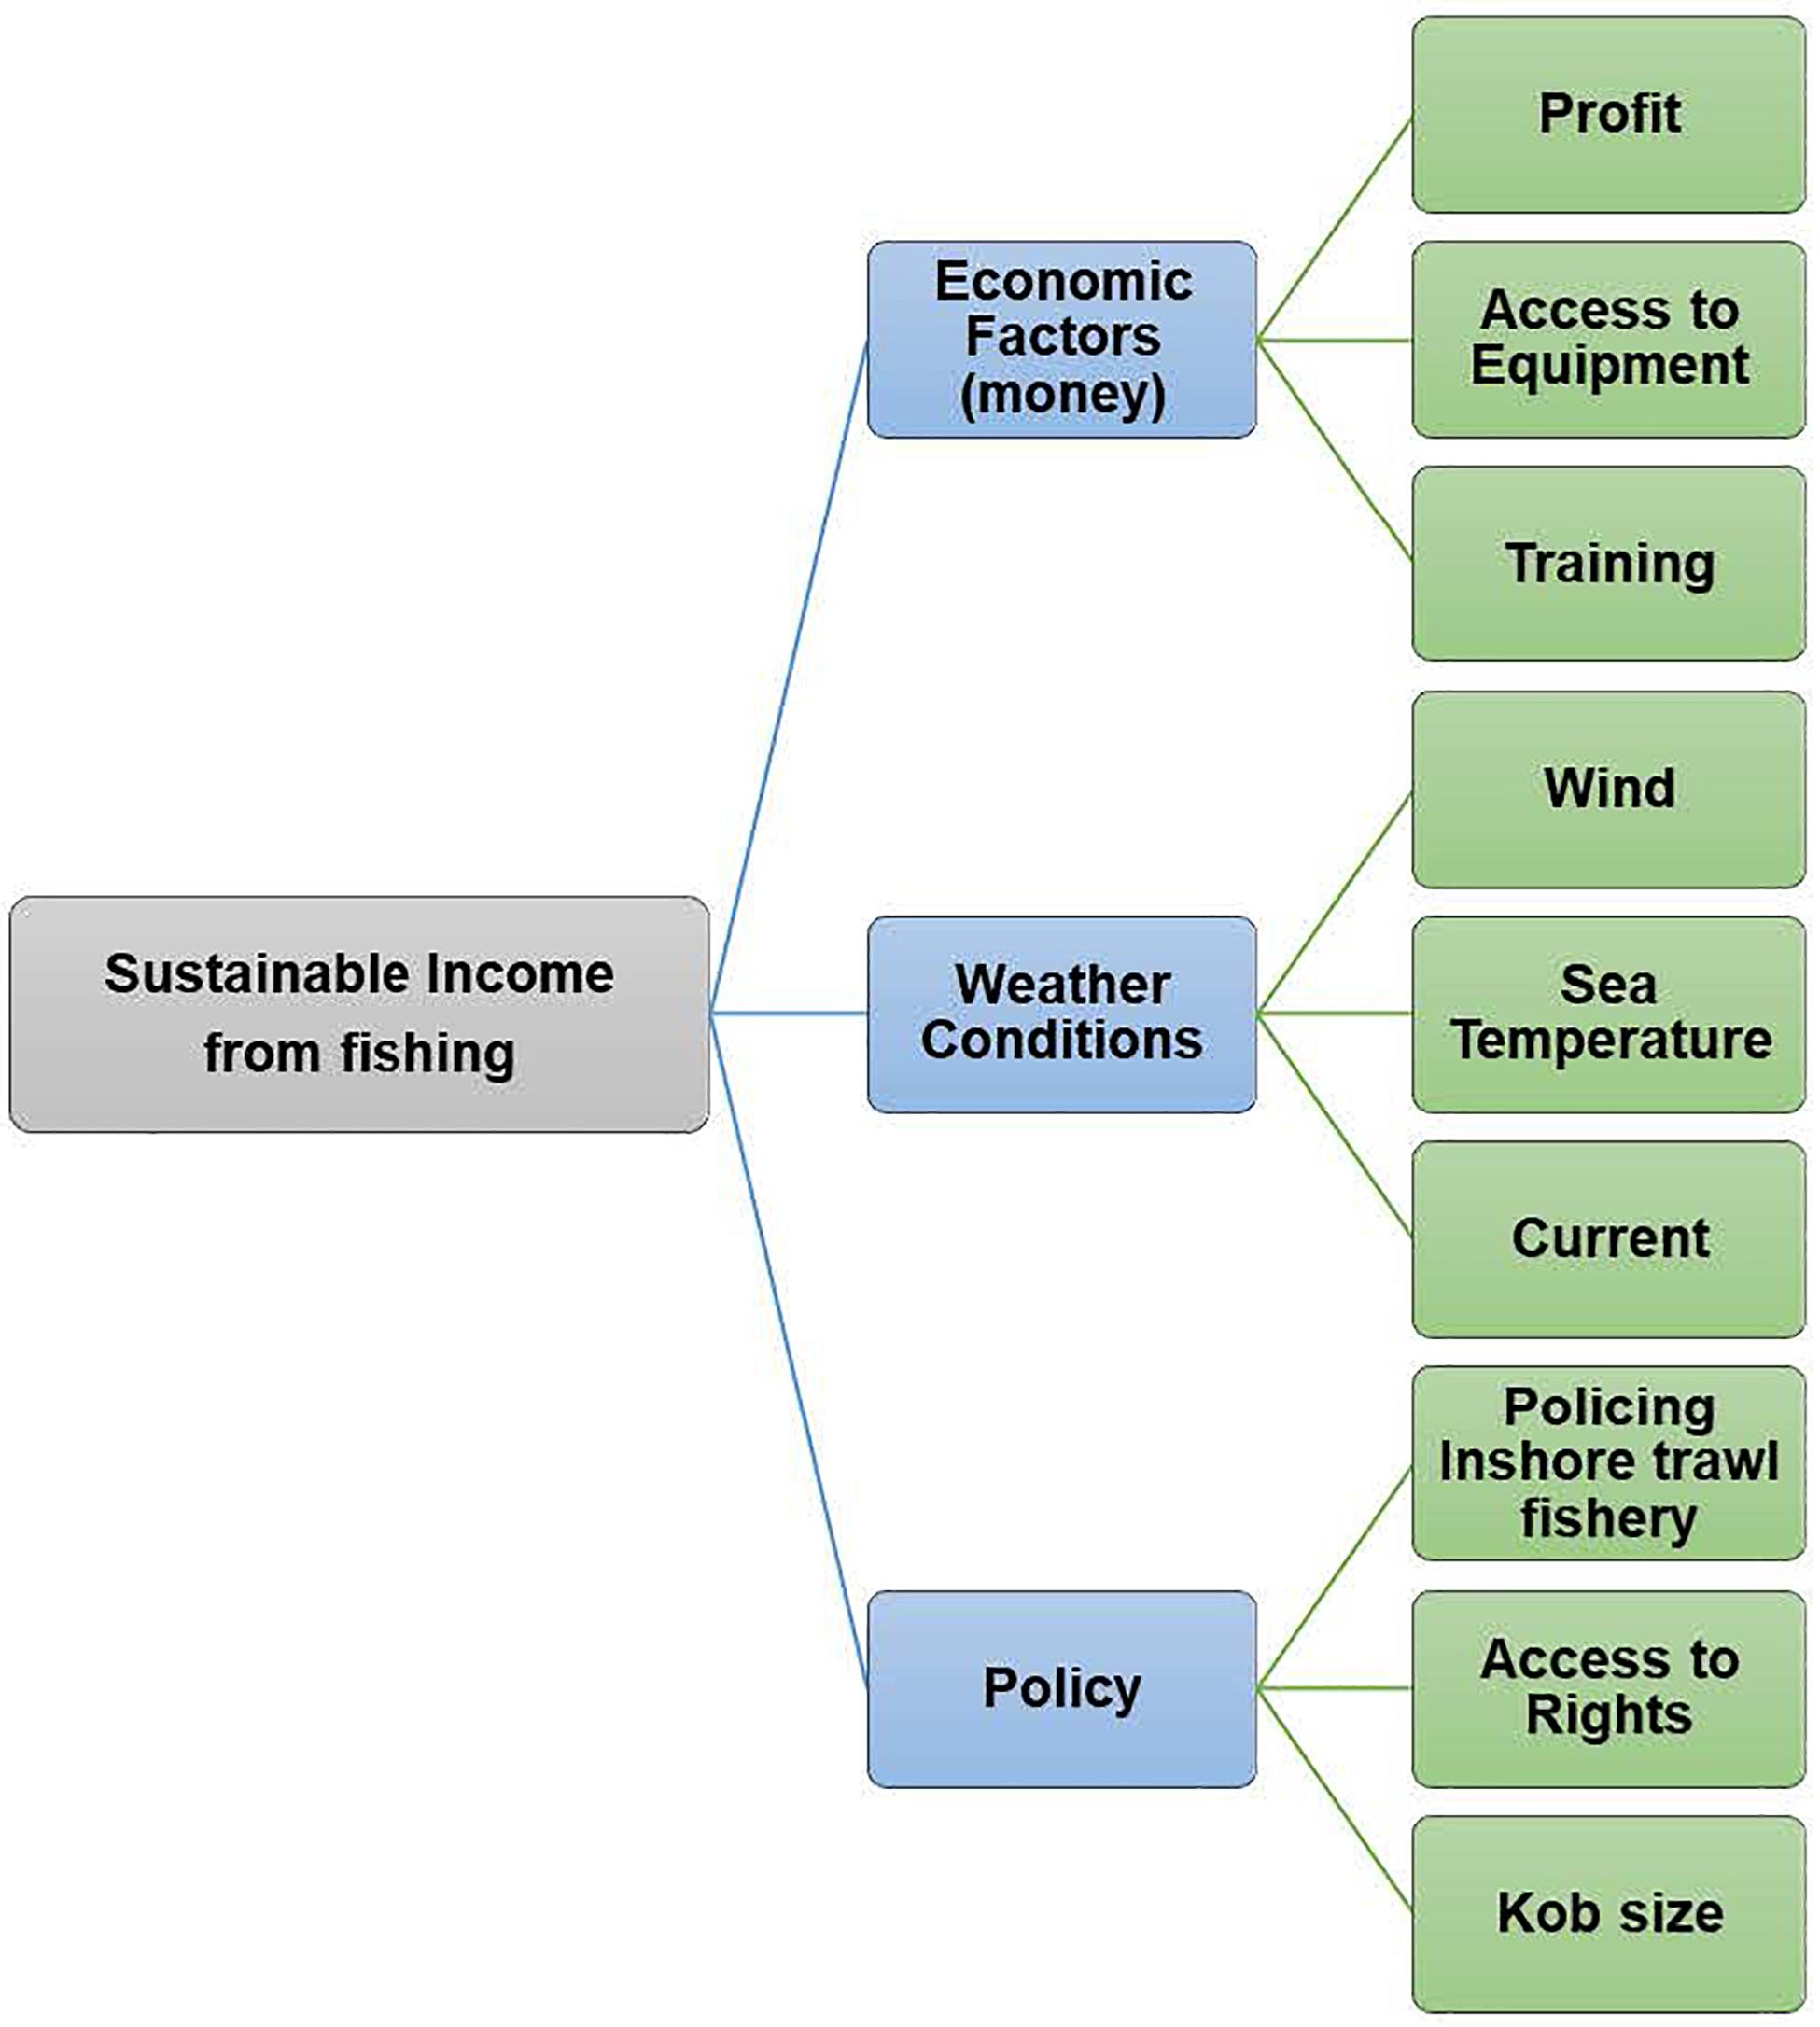
Figure 4. Hierarchy of drivers identified by participants. This hierarchy, with no weightings and states, provide the blueprint for the BBN structure. Note however, that the influences of the principal drivers become the root nodes in the BBN.
Many of the policy and regulatory drivers described by fishers throughout the research process were linked explicitly to uncertainty, and after some consideration and discussion, it became apparent that, from their perspectives and experiences, uncertainty of policy implementation posed the higher risk. The insertion of ‘uncertainty’ as a driver of change in place of the main ‘policy and regulation’ driver is a manifestation of a typical South African problem regarding policy and regulation implementation, which also has long been the case in small-scale fisheries in South Africa (e.g., Isaacs, 2006; Sowman, 2006; Sowman et al., 2014), including the current delayed implementation of the SSFP. This has had both short and long-term consequences, resulting in fishers being caught ‘in limbo,’ and in turn making short-and long-term decision-making difficult on how to best put food on the table. Additionally, the uncertainty about how policy and regulation will be implemented exacerbates tensions that are already present by other uncertainties in the system, such as those created by changes in sea conditions (e.g., changes in current strength and wave height).
This tension is not unique to South African small-scale fisheries as demonstrated by studies from other developing countries which highlight the role phenomena such as climate change are negatively impacting livelihoods in small-scale fisheries (Marshall et al., 2010; Perry et al., 2010; Zou and Wei, 2010; Cinner et al., 2012; IPCC, 2014). In the case of the southern Cape linefishery, this tension does not only apply to the individual and household scale but can also be seen in conflict between line fishers and amongst fishery sectors, notably the linefishery and inshore trawl fishery where a historical conflict in the area (Visser, 2015) is exacerbated by overlapping areas of operation (Greenston, 2013) exacerbated by target catch (resource) scarcity (Duggan, 2012, 2018).
Throughout the research, policy and regulatory issues, specifically challenges with implementation, enforcement and access to Rights were identified as the most pressing concern for participants (also see section “THE SOUTHERN CAPE RESEARCH AREA”). Again, this is not unique to South Africa. Policy and regulatory challenges are identified by multiple authors (e.g., FAO, 1995, 2015; Mikalsen and Jentoft, 2003; Bene and Neiland, 2006) emphasising the need to include the actors from the sector in policy, legislative and regulatory processes. The promulgation of the voluntary small-scale fishery guidelines by the FAO (FAO, 2015) not only recognised the importance of small-scale fisheries in food security and poverty alleviation, but also acknowledges the challenges with management within a sector where fishers often remain neglected and marginalised (FAO, 2015, 2016, 2018). In South Africa, government, and especially DAFF inevitably became the face of the challenges that are related to policy and regulations. One could argue that the emphasis on policy and regulatory issues and the impact of the inshore trawl fishery – in place of the explicit recognition of the importance of other drivers of change such as climate variability and kob shortages - is because the government is a more real and familiar foe. This by no means absolves the government of responsibility – globally, governmental decision making is seen to be aligned with more extensive, industrialised fisheries (e.g., Ommer et al., 2012; Jarre et al., 2018). However, given the importance of drivers in the physical system shown in various previous research (Duggan, 2012; Gammage, 2015; Gammage et al., 2017a; Jarre et al., 2018; Ward, 2018; Lyttle, 2019) and reiterated in the causal mapping and specifically shown by the BBNs (below), other drivers of change are as pressing and threatening as policy and regulatory issues. Importantly, failure to explicitly recognise the importance of other drivers of system change could hamper fishers’ ability to make informed decisions in the face of future change. Nevertheless, this research has shown that causal maps, when used in participatory and iterative processes, can help build capacity as knowledge is expanded through mutual learning. That some form of learning, or skills development, was taking place was evident in how the fishers were able to engage with increasingly difficult and unfamiliar activities as the research progressed. Importantly, applied at the larger scale, a wider set of stakeholders will be able to build on and modify these maps without losing the insights of this most vulnerable group of fishery participants.
Making Sense of Complexity While Building Capacity
Causal Maps provide a formal, yet visual way to carry out problem structuring and framing (Belton and Stewart, 2002). Particularly useful in this research was the ability of causal maps to highlight areas of concern not immediately apparent from qualitative analysis, such as ‘uncertainty.’ The causal maps’ ability to give insight into the organisation of ideas, and to clarify goals while revealing knowledge gaps (Belton and Stewart, 2002; Özesmi and Özesmi, 2004) have been specifically useful for research participants to form a more holistic picture of their fishery system: while participants considered aspects of the system in a piecemeal fashion, interactions with participants revealed that they often did not view the system in its entirety. In this research, the iterative development process further improves the final map. Causal maps typically do not depict the “why” question. Examining cognitive interpretation diagrams, where connections are drawn to reflect weight and sign of the causal relationships – as in the maps produced here – makes it easier to follow the causal relationships between the variables – see Özesmi and Özesmi (2004).
In this instance, the process has been useful due to (what could be called) the poor ‘formal’ definition of problems by fishers at the local scale. However, for the linefishery in the southern Cape, it may be more a case that the relationships between drivers are not well-defined – in such a context the causal maps have provided a tool which was used to provide insight into the complex relationships between variables identified, as demonstrated by the complexity shown in the final regional map. This level of complexity is also evident in a causal map produced by Stewart et al. (2009) who describe the possible implementation of a Multi Criteria Decision Analysis process in the context of a fishing rights allocation process in the South Africa’s Western Cape province. This demonstrates that the complexity seen in the southern Cape linefishery is not unique, nor is the usefulness of stakeholder-built causal maps in portraying complexity of their SESs.
Highlighting the indirect interactions and feedback loops has resulted in a diagram that better reflects the complexity known to exist in the southern Cape linefishery. This level of complexity is expected - small-scale fisheries across the world are increasingly framed as complex adaptive systems due to the nature of the problems that exist in these systems (Folke et al., 2005; Berkes, 2006, 2011; Wilson, 2006; Mahon et al., 2008; Gelcich et al., 2010; McConney and Charles, 2010). In the southern Cape and through the insights gained from the causal mapping process it was also possible to refine many of the processes identified in previous research: an example is the identification and use of optimal ranges (such as too hot or too cold for SST) in the climate drivers and being able to link drivers across themes (see Figure 3). The result is a better-defined system of interactions linked to change. Better-defined systems are an important basis for more effective management strategies. South African fishery management is no exception – despite legislation advocating for an ecosystem approach to fisheries management (EAF) (see WSSD, 2002), many social system components or their interactions with the ecosystems are disregarded in management decisions (e.g., Cochrane et al., 2015) thereby inadvertently basing decisions on overly simplistic views of the SES. While the causal maps described in this paper have not been constructed at the scale through which management can be informed directly, the successful use of the tool demonstrates the its usefulness in showing complexity, feedback loops, indirect drivers of change together with the ability to readily integrate the perspectives and knowledge from different sources (in this case participants from different towns). Participatory mapping should therefore be considered a useful general tool in future management contexts in South Africa. While many of the changes made to the diagrams made were subtle, the changes offered valuable new insight into the system. These new insights can assist with reframing the reanalysis of data that has already been collected by allowing for changing how questions are asked.
Contribution to Managing Scale Mismatches
Parity between the results of the mapping process and the results of previous research (Gammage et al., 2017a, b) is significant because the user groups (particularly skipper vs crew), towns and timescales differ. This has important implications when considering the scaling of data in the context of the linefishery system of the southern Cape. The issue of scaling is essential and complex – large models are often not applicable in the local context, and the specificity of work at local contexts can get lost in larger scales resulting in models that are ill-fitting to local details (e.g., Gibson et al., 2000). This is particularly problematic when considering that management decisions are often made at large (national) scale in a top-down fashion (e.g., Jarre et al., 2018) with no mechanism in place for the bottom-up flow of information that would be required to make decisions that can better address localised contexts. The parity between the results related to drivers of change seen throughout suggests that geographic scale is not essential where the contextual scale (or conceptual scale – see Gibson et al., 2000) is the same. This assertion is echoed when considering the MDS plots presented in Gammage et al. (2019) which showed that there was no internal variation per town in the responses offered. Instead, the internal variation is seen when considering user groups change responses (Gammage, 2015; Gammage et al., 2017b) to the same stressors. This contextual scale is what must still be accounted for in decision-making and management. Contextual scale for the linefishery could relate to an ecosystem scale related to linefish assemblage delineation zones as suggested by Winker et al. (2014) and Blamey et al. (2015), where management zones used to manage the fisheries should likewise follow the appropriate biogeographic scale to ensure fisheries are managed within the most suitable ecological context.
Suitability of the Tool
While the preceding sections highlight the usefulness of the maps, there are also limitations. The maps as such do not provide any information on the causation (the ‘why’ aspect) associated with the drivers (see Kim and Lee, 1998). In this map, this has partly been circumvented through the indication of the dampening or amplifying effect the stressors have on other, related stressors (i.e., the causation). This has assisted with the interpretation of the map from a research perspective, although research participants did not engage with the causality of the drivers beyond the initial discussions that took place to derive the maps (i.e., the information was not used or helpful in the workshopping process). The map does not have a temporal dimension and although a time scale was roughly defined when gathering the initial data used to construct the base map, this was a ‘loose’ definition as most fishers do not clearly define time associated to drivers of change in discussions, as highlighted in Ward (2018). Lack of a temporal dimension results in maps that do not have a sense of any transient behaviour in the system (Schneider et al., 1998; Hobbs et al., 2002). While it is possible to better quantify causal maps (see, e.g., Stewart et al., 2009), this is the domain of simulation modelling. In this case, the causal maps have successfully served as the conceptual framing of the system and as a tool for fishers to consult and use in the BBN process described in the following section.
Semi-Quantitative Modelling With Stakeholders
This section introduces the approach and method used in the development of the BBNs together with the related results and discussion. Importantly, the weighted hierarchy is discussed within the context of the BBN development process as this was an important first step of the BBN development.
Approach and Methods
Building on the causal mapping, the BBN modelling process followed the approach described by Tiller et al. (2013). It formed part of the scenario planning workshops with a group of fishers (participants) from Melkhoutfontein. The first workshop provided the opportunity to validate the final regional causal map and start the next steps, including a weighted hierarchy as preparation for the BBN modelling. The second workshop focused specifically on the actual scenario planning process (Gammage, 2019). A third workshop provided the opportunity for participants to populate the individual conditional probability tables (CPTs) required to construct the BBN. Thus, workshops One and Three were directly related to the BBN development process and are discussed in detail here.
Both the weighted hierarchy and the BBN model described here comprise three principal drivers of change and their contributing factors (nodes in the BBN) as identified by the participants. For this first prototype, dichotomous states were assigned to each node. Four conditional probability tables (CPTs) were required to parameterise the BBN model: one for the output and one each for the three principal drivers. Of the 11 participants who started the third workshop, 10 completed the CPTs, but four were not included in the final BBN as they were either completed incorrectly or incomplete. Importantly, two of the CPTs were incomplete since these participants had to leave for important prior commitments and could not return to the workshop. As the workshops built on a long-standing engagement with the community and their CPT responses reflects the same emphasis by the three groups seen in the results of the weighted hierarchy exercise, we are quite confident that participants meaningfully engaged with the exercise. The six remaining populated CPTs were combined into a single BBN model through the addition of an auxiliary node ‘Participants’, which represents the evenly weighted input of each participant (Kjærulf and Madsen, 2006; Tiller et al., 2013). The ‘contributing factors’ were assigned probabilities of 50% for the states as there are no other influences on these nodes in the model. The Bayesian modelling software package, NeticaTM was used to compile the BBN.
As the model incorporated the judgment of a homogenous group of fishers there is a requirement to question how sensitive the results may be to input variability. It was thus necessary to determine whether the model outputs are over-sensitive to any specific node and to ask the extent to which the model/outcomes could be altered by manipulating the states of the nodes. Sensitivity testing using ‘Income’ as the indicator node (where Network > Sensitivity to Findings) was carried out as a start. The BBN was tested under different scenarios (possible system states) by manipulating the three nodes identified by the sensitivity testing as being the most influential on ‘Income’ (Supplementary Appendix 9 in Supplementary Figure 14). Sensitivity tests (using ‘Income’) for the inputs of each of the individual participants were also carried out. These analyses determined the degree to which each node (input variable) could influence the ‘Income’ in both the combined model and in each of the six participant models. The sensitivity was calculated in NeticaTM as the degree of entropy reduction (reduction in the disorder or variation) at one node relative to the information represented in other nodes of the model. The sensitivity tests indicate how much of the variation in the node in question is explained by each of the other nodes in the model (Amstrup et al., 2008; Tiller et al., 2013). Lastly, the sensitivity of the model to inputs from additional participants was tested. For this analysis, the model was run three times with an added seventh (ghost) participant, picking up on general results as provided below. For each of these model tests, a duplicate set of existing CPTs was used.
Results
The results are divided into two main sections – the results relating to the process of constructing the BBN and the results derived from the model outputs.
The Bayesian Belief Network Construction Process
Workshop one
The data needed to define the weighted hierarchy and parametrise the BBN were obtained in Workshop One. An informal dinner for all participants, prior to the start of the first workshop served as an icebreaker, presenting an opportunity to provide background information on the project and the purpose of the interaction. The first workshop, scheduled to take place throughout a full day, was shortened as participants grew fatigued, ending just after lunch. Participants had difficulty with the more abstract thinking required for some of the exercises planned to derive the weighted hierarchy and system states, requiring further programme alterations. It must be noted that although participants may have found this process difficult at times, it was not a hardship for them and they enjoyed learning something new, engaging robustly on the topics at hand. Their willingness to continually engage with the process also demonstrated their investment in the process.
The Afrikaans regional causal diagram (Figure 3) was made available to all the participants as a tool to consult. Although at least half the group had had prior exposure to the previous research and diagram development process, the diagram was briefly explained. The workshop presented another opportunity for participants to verify the accuracy of the map, while the map served as a tool to assist participants to refine their thinking.
The first step in the BBN parameterisation process was to agree on a central issue and then a hierarchy of primary drivers and contributing factors. After some discussion of the drivers of change and their interactions, the central issue ‘Sustainable fishery-derived income’ for the BBN was identified4 via group consensus. Next, principal drivers of change and contributing factors were identified and discussed in a small group setting.
The facilitator moved between groups and had to prompt the participants numerous times, as many participants remained unsure of the requirements. As groups reported back, the principal drivers were discussed and agreed. Next, weightings and dichotomous states were assigned by the respective small groups after which participants were asked to vote for their preferred principal drivers and weightings. These states had to be discrete, exhaustive and mutually exclusive – all of which are fundamental principles of BBNs (e.g., Tiller et al., 2013). Restricting the states to dichotomous states implied that the states were a broad qualitative description, however this way of limiting the states in this prototype BBN strengthened the manageability of the associated CPTs. The results of this process are shown in Table 2.
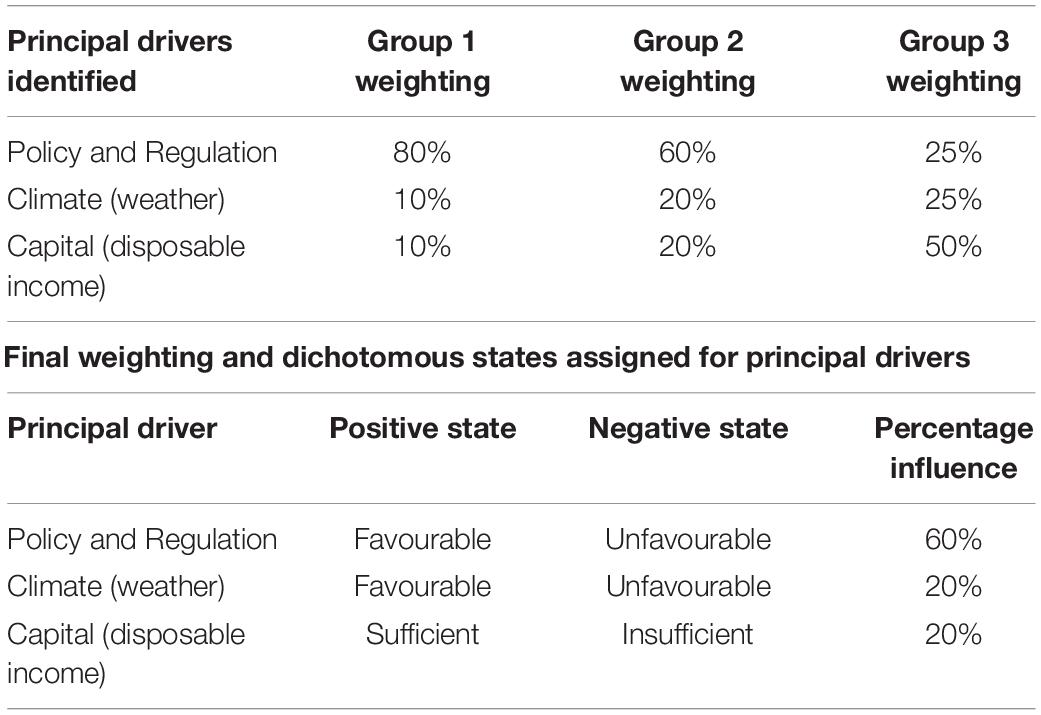
Table 2. Weightings identified by groups and final weighting and assigned dichotomous states.
Participants defined the next level of causality by identifying the three contributing factors that would influence each of the principal drivers. These contributing factors were also assigned a weighting and dichotomous states. Upon request from the participants, this part of the exercise took place in a large group setting. After extensive discussions on each variable, the state and weighting were decided on by group consensus. The CPTs associated to each driver in the hierarchy (including the central theme) were constructed using the drivers assigned by the group (the basic hierarchy identified without states or weightings is shown in Figure 4).
Workshop three
This workshop started with providing feedback on the research progress and the implementation of the SSFP. The purpose of the CPTs was introduced and each individual completed a set of CPTs while being guided in a large group setting. This was a protracted process that lasted the duration of the workshop. CPTs were populated by allocating the probabilities of an outcome for the principle drivers which has been assigned a combination of states for the contributing factors that directly influence it. The expert opinions of the individual participants provided these probabilities through the Workshop Three engagement.
Bayesian Belief Network Model Outcomes
Identification of principal drivers
After identifying the principal drivers in small groups, the reasoning used in the identification and weighting process was presented. The ensuing discussion allowed for consolidation and allowed all participants to air their views where some rigorous debate took place around the weighting of the drivers, most specifically, climate. Upon conclusion of the discussion, participants were asked to cast individual votes to indicate their preferred combination of weighting, the only instruction being that total combined weighting per individual could not exceed 100%. All three small groups identified the same variables (Table 2) with discussions centring around the weighting of the variables (Supplementary Appendix 7 in Supplementary Table 7 presents some key insights highlighted by participants). The final consensus weighting as determined by the whole group is shown in Table 2. Note that this weighting represents the specific results from Group 2 (Table 2), which had also been the ‘intermediate’ one earlier. All groups found assigning states problematic as the participants, not familiar with the process, sometimes found the decisions hard to make, and states were assigned as ‘good’ or ‘bad’. After some discussion, it was agreed that some of the states should be indicative of an optimal range such as favourable/unfavourable. It was also agreed that the researcher would rephrase the wording if required, although in keeping with the participant-led nature of the research, these states were kept as close as possible to the states assigned by the participants in the workshop.
Identification of contributing factors (to the principal drivers)
Assigning and weighting of contributing factors was done through group consensus. While this method is not considered to be ideal, participants were decidedly more comfortable in this setting. This could be because they could rely on the opinions of the leaders within the group, which made it a more comfortable exercise for some of the participants who were struggling with the process. Supplementary Appendix 7 (Supplementary Tables 7, 8) provides summations of the details of the contributing factors with key insights and rationale forthcoming from discussions. Table 3 show the final states and weighting.
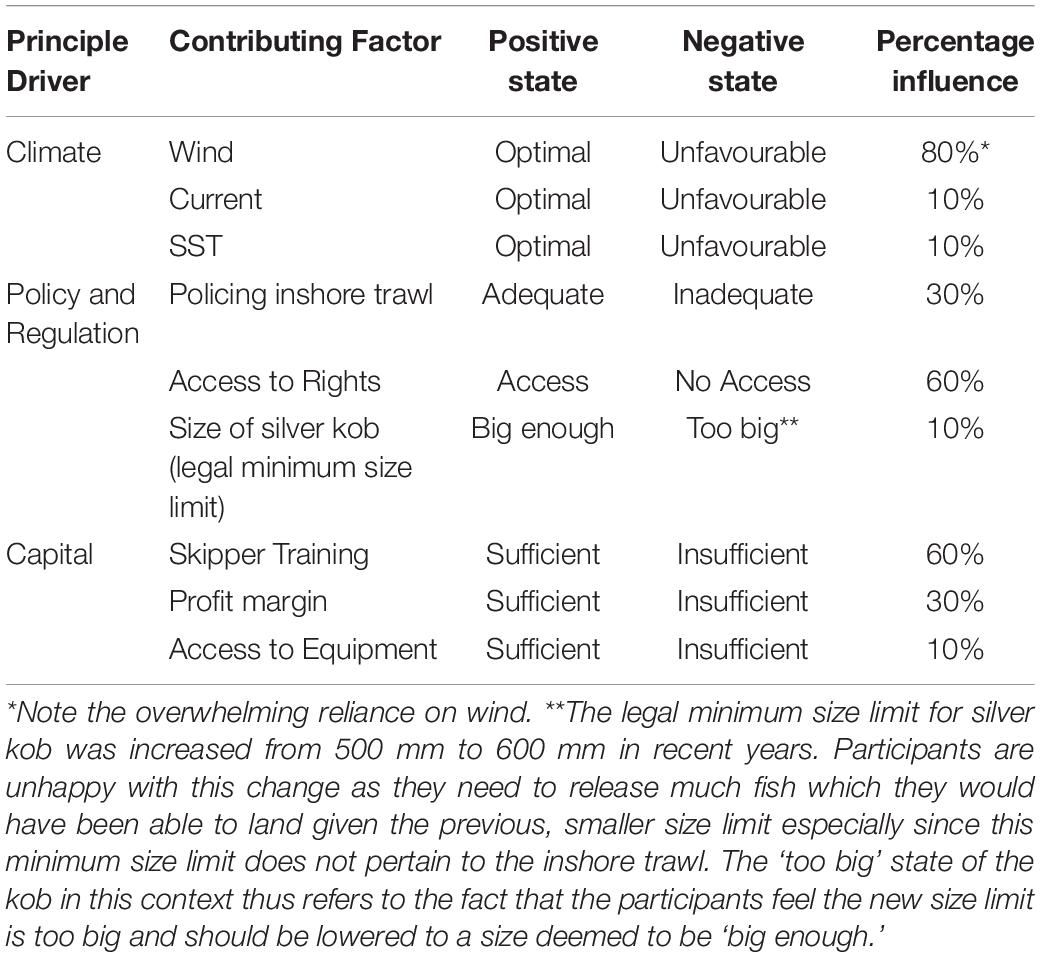
Table 3. Contributing factors – final weighting and dichotomous states assigned.
The final hierarchy, weighting and associated states as derived from the parameterisation process followed in Workshop One is shown in Figure 5. Where applicable, names of drivers and states were adjusted without changing the meaning as agreed upon in the workshop.
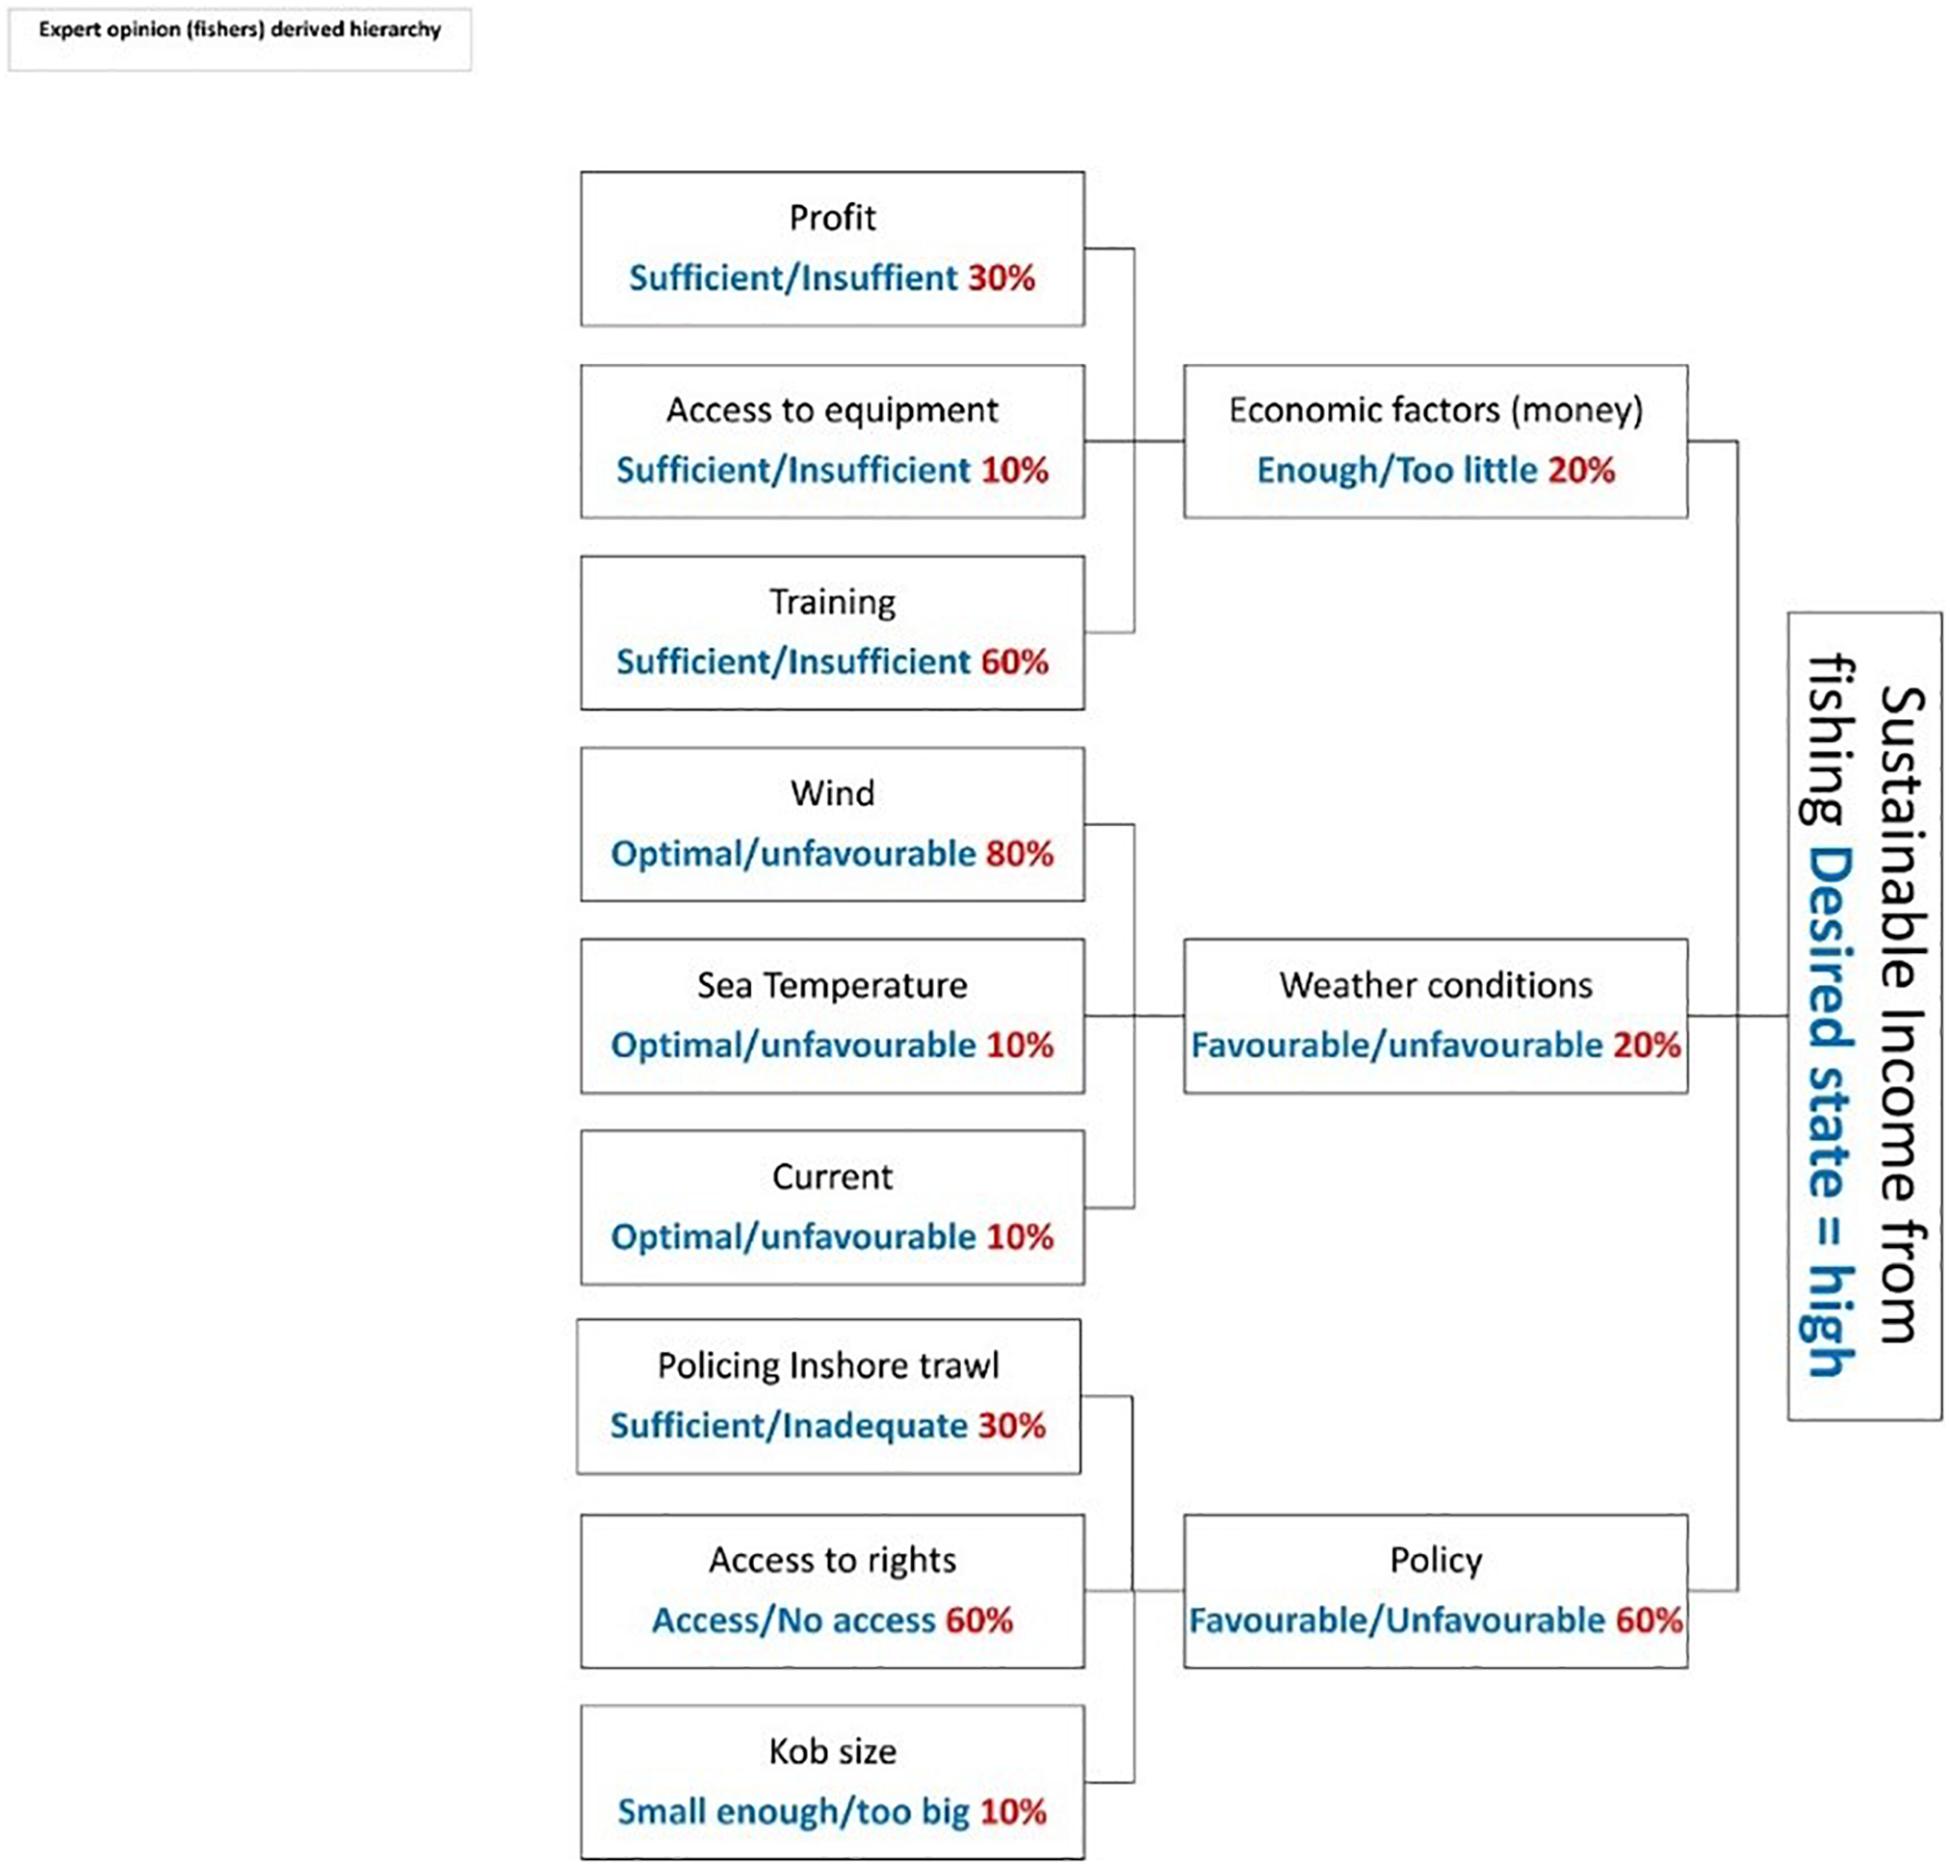
Figure 5. Weighted hierarchy, showing states and associated weightings, derived from fisher’s inputs in Workshop One. The desired outcome is a sustainable fishery-derived income (high/low). Drivers at the first hierarchy are ‘Policy (and regulation)’, ‘Weather conditions’ and ‘Economic factors (money)’. At the second hierarchical level, the size of the kob (fishers are permitted to catch) (Access to) fishing rights and policing of the Inshore trawl inform the ‘Policy’ driver. Wind, Current and sea temperature inform the ‘Weather conditions’ driver while (skipper) training, access to equipment and profit (margin) informs the ‘Economics’ driver.
The final prototype BBN is a combination of each of the six participants’ individual BBNs (all the completed CPTs are provided in Supplementary Appendix 8) and is shown in Figure 6. This ‘base’ run; BBN shows that when each of the contributing factors (root nodes) is assigned a default value of 50%, along with the equally weighted belief of the six participants (input using the auxiliary node), the probability of achieving sustainable fishing derived income is just below 25%.
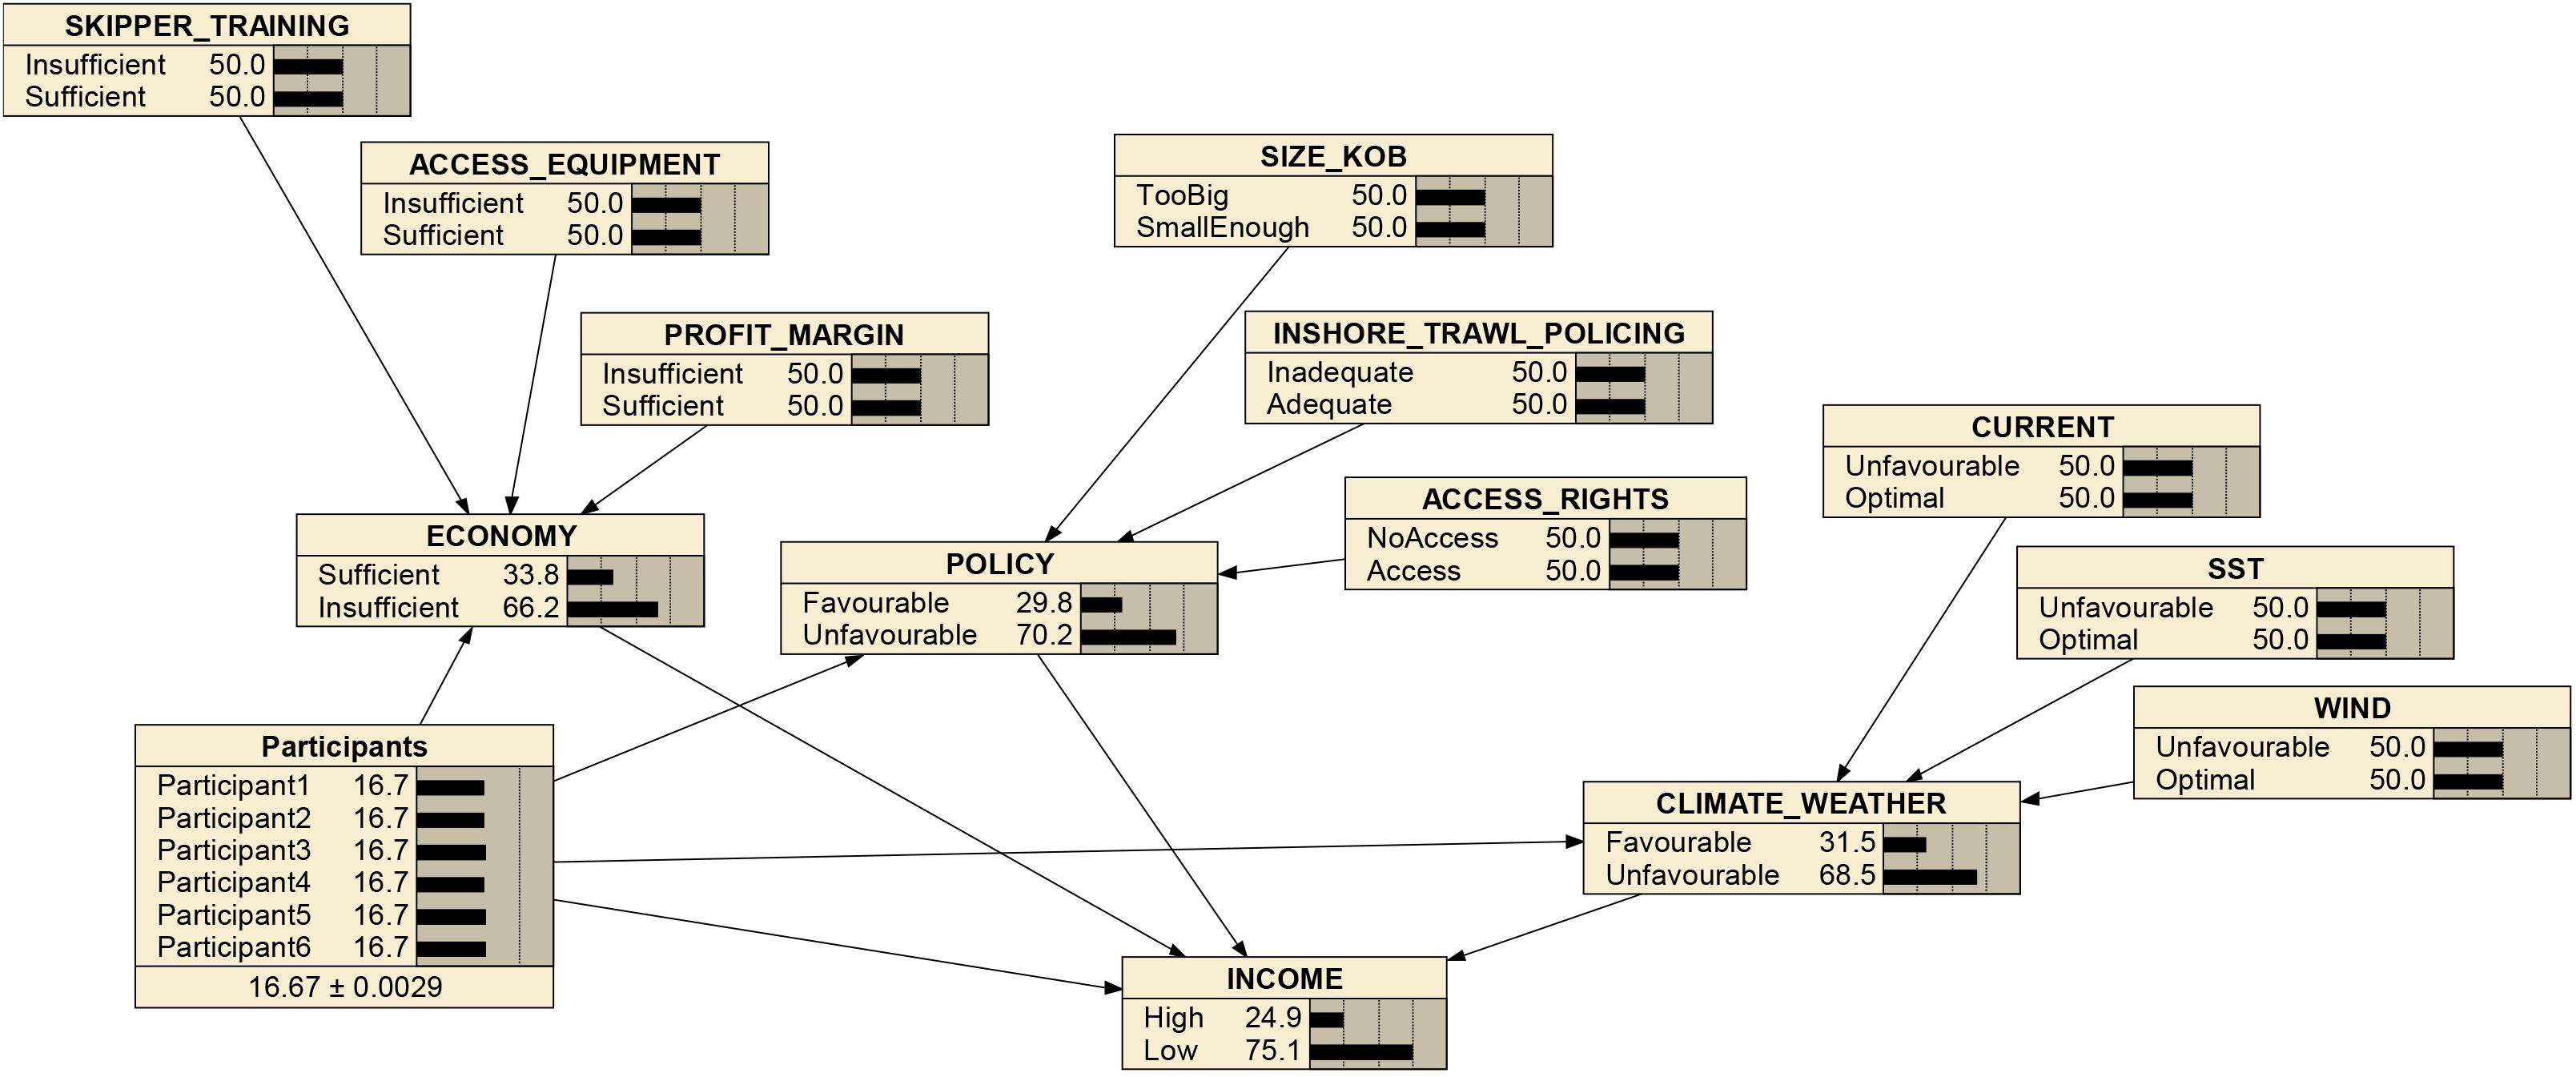
Figure 6. Modelled probability outputs of six BBNs. Each participants’ set of CPTs is integrated into the BBN with an auxiliary node ‘Participants.’
Sensitivity Testing of the Prototype BBN
Sensitivity testing provided an indication of which variables were most influential on the central issue sustainable fishery-derived income (‘Income’). The sensitivity of the prototype was tested in various ways. Firstly, using Netica’s sensitivity analysis function, the sensitivity of the model to ‘Income’ was tested. The results, provided in Table 4, show that among the principal drivers, ‘Income’ is more sensitive to ‘Economy’ and ‘Climate_Weather’ than to ‘Policy’. Interestingly, this result is at odds with the group consensus from the hierarchy exercises where ‘policy’ was assigned a 60% weighting (making it the dominant driver) by participants in the weighted hierarchy. Furthermore, the sensitivity analysis showed that ‘Access to Equipment’ and ‘Profit margin’ were the two contributing factors which would have the most influence on ‘Income’ (next three highest values for mutual info), followed by the three climate-related nodes with approximately equal influence.
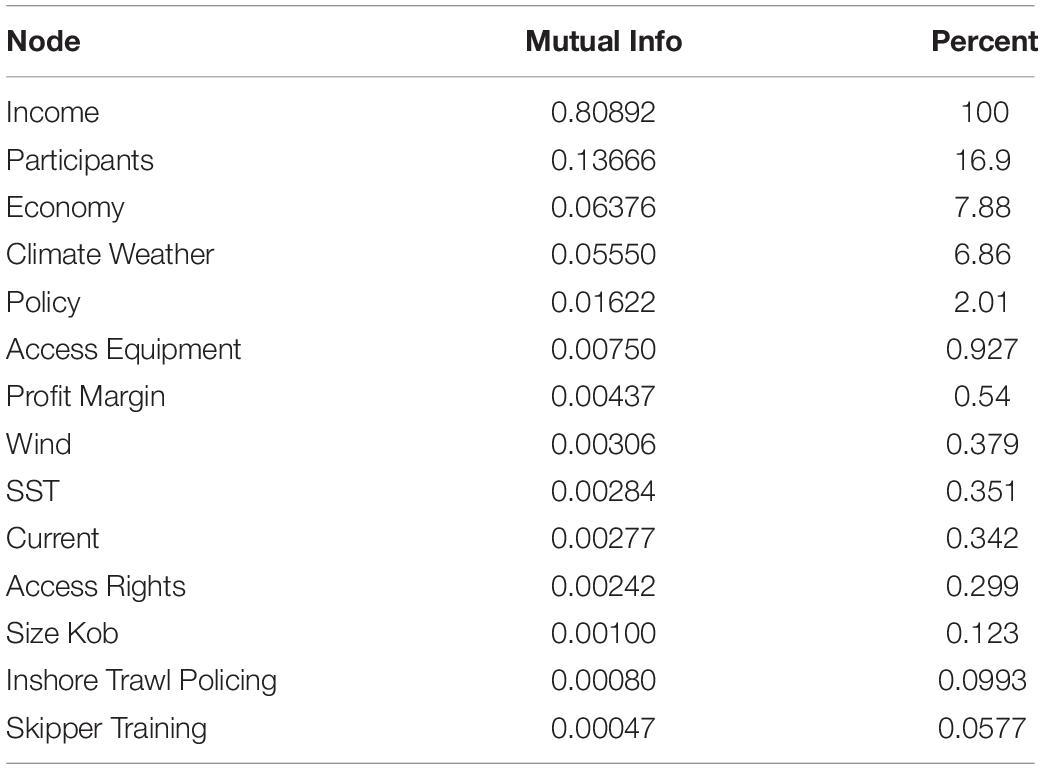
Table 4. Sensitivity analysis of the BBN shows the variability of the priority variable to changes in the settings of all other variables in the BBN.
The model was further tested by manipulating the three most influential variables on the second hierarchical level (Supplementary Figure 14) to create a scenario where (1) there is sufficient access to equipment, (2) the profit margin is sufficient and (3) wind is within optimal ranges (i.e., all set to 100%). The results of this manipulation demonstrate that under this ‘scenario,’ the probability of fishers earning a sustainable fishery derived income increases somewhat, from 24,9% to 38,6%. This result is consistent with the present resource scarcity (see section “THE SOUTHERN CAPE RESEARCH AREA”).
There are some discrepancies between the influence weighting derived from the sensitivity analysis and the weightings initially assigned by participants in the weighted hierarchy. Notably, ‘Access to equipment’ was originally weighted as the least important contributor to ‘Economy,’ while ‘Profit margin’ was given a 30% weighting. ‘Skipper training,’ although regarded as the most critical factor to ‘Economy’ in the weighted hierarchy, showed less influence in this prototype on both ‘Economy’ and ‘Income’ (Supplementary Appendix 8). For the weighted hierarchy, participants assigned an 80% weighting to ‘Wind.’ However, the sensitivity analysis shows that although wind played the most prominent role within the climate drivers, the influence of the three drivers was more evenly weighted in the BBN than initially suggested in the groupwork.
Additional sensitivity analysis explored how ‘Income’ would be influenced if more changes were made to the states in the second hierarchy of the BBN. The results of this analysis, shown in Table 5, show that the probability of income being high when all the contributing factors are set to a 100% likelihood of a favourable state is 91,7%, inversely, when the states are all set to a 100% likelihood of negative state, the probability associated to earning enough income is 2,04%. This result is expected. The range between the high and low state is also expected considering that participants inputs into the CPTs were often extreme – i.e. very high or low probabilities were assigned to the different permutations (see Supplementary Appendix 8 for all completed CPTs). The columns showing the 50/50 contributing factors states of the root nodes in the final BBN (see Figure 6) have been included to make the comparison between the Income (low/high) results easier.
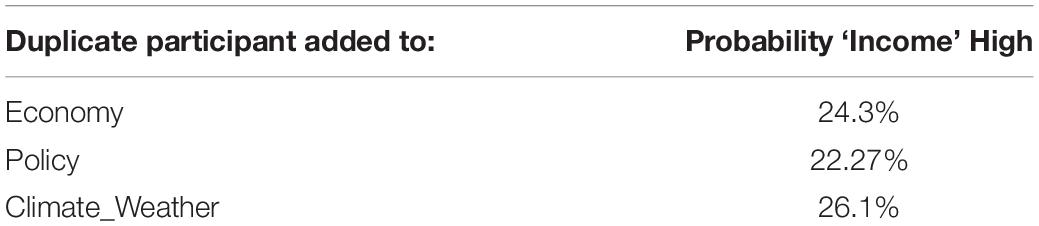
Table 5. Results from the sensitivity testing where duplicate participants were added to the combined net in three separate runs.
The sensitivity of each participants’ input to the BBN (Supplementary Appendix 9) showed that, for the principal drivers, the mutual information indicator showed different ranking of the drivers per participant. Participants one and five’s BBN inputs showed that the ‘Economy’ driver placed the most influence on ‘Income.’ The BBN derived from participants two and six showed that ‘Policy’ had the biggest influence on ‘Income,’ while Participants three and four’s BBN showed that ‘Climate_Weather’ carried the most influence on ‘Income.’ Note the deviation from the group consensus results provided in Tables 2, 3 and Figure 5, discussed below. Based on these results, three additional tests were run (also see Supplementary Appendix 9), to see which influence a hypothetical additional participant would have whose opinion was favouring either Economy, Policy or Climate_Weather. This was simply done by duplicating the CPTs of participants one, two and three in three separate test runs. The results (Table 5) show that adding the duplicate participants did not influence the BBN outputs to a substantial extent, indicating that the model is not over-sensitive to additional participants’ inputs. This result increased our trust that this first prototype is a useful representation of the huge uncertainties in the SES and reflects the diversity of opinions of the linefishers in Melkhoutfontein.
Prototype Bayesian Belief Network Discussion
The first prototype BBN described here is a graphic and probabilistic representation of the participants’ views of the relationships between key contributors to change (variables) on sustainable fishing-derived income within the southern Cape’s linefishery. Specifically, we sought to establish what additional insights, are gained into the drivers of change and system uncertainty through the development of a weighted hierarchy and prototype BBN and to evaluate the suitability of using such methods with stakeholders.
Suitability of Using BBNs in This Context
Importantly, the BBN construction process created an important dialogue space for ‘top of mind’ concerns to be addressed in a constructive, forward-thinking setting. While the use of the BBN as a participatory tool was not formally evaluated by participants, such an evaluation carried out by Zorrilla and García (2010) shows that stakeholders generally agree to the usefulness of the tool in the structuring of meetings while encouraging communications and discussions. Added to this these authors highlight the use in identifying stakeholders’ level of knowledge and uncertainty. Previous research in this fishery system consistently highlight the uncertainty brought about by high variability within the system (e.g., Gammage et al., 2017a; Ward, 2018). This uncertainty not only exposes fishers to risk but also hampers decision-making as fishers do not know what to plan for. The scenario-planning approach, in which the present work is situated, aims at providing tools to make this uncertainly explicit, and devise approaches to address this.
BBNs have generally proven useful for addressing uncertainty in environmental systems (Rieman et al., 2001; Said Ghabayen and Kemblowski, 2004; Uusitalo, 2007; Haapasaari and Karjalainen, 2010). The prototype constructed in this research provides a snapshot of uncertainties across dimensions relating to ‘Policy’, ‘Economics’ and ‘Climate.’ The importance lies in the fact that the tool was implementable at all in this context. Additionally, the insights into uncertainty gleaned from the BBN have been applied in the ensuing scenario-planning prototyping exercise (Gammage et al., 2019).
While this prototype BBN cannot yet be used to inform a decision-making process or to make any system prediction, the sensitivity analyses carried out delivers important insights into the distribution of participants values, which was less apparent when working by group consensus. In the continuing scenario planning-related discussions, the process used to derive this prototype BBN had already provided an important opportunity for diverse stakeholders to learn from each other’s point of view. In future this will be enhanced by including the views of a more diverse group of stakeholders. Importantly, however, the views of this vulnerable group of fishers will stay included in the process. Of course, data collection in the systems paradigm across natural, economic and social dimensions will also be valuable.
As with the causal maps, the capacity building and mutual learning in the context of this research cannot be underrated. The fishers were not at all used to having to think about their system in this manner, nor were they used to the abstract thinking required in the CPT completion process. Although this slowed down the research process considerably, it also provided the opportunity for mutual learning. Mutual learning in this setting is especially important as it adds to the capacity building required to mitigate long-term risk. Importantly, after the first workshop, it was not clear if fishers would be able to complete the CPTs required to parameterise the model. Through the workshopping process, where participants and the researcher could exchange ideas and knowledge, conditions were created where most of the fishers were able to complete the CPT process successfully. This demonstrates the value of continued engagement with fishers and other stakeholders to create enabling conditions such as spaces for active dialogue and learning, required for active participation of all stakeholders in an inclusive decision-making process.
Insights Into the Drivers of Change
The set of principal drivers identified by participants held no surprises, and in highlighting the large extent of uncertainties across all dimensions, the results are consistent with all the previous research into drivers of change in the SES of the southern Cape linefishery and the final causal map (see section “THE SOUTHERN CAPE RESEARCH AREA”). While these results cannot be viewed in isolation, they provide an essential perspective on what these small-scale fishers consider important drivers of change that influence their income.
A distinct contrast was revealed between the weighting in the hierarchy and the model outputs. To derive the hierarchy, the questions were asked more familiarly and directly. Fishers tended to respond to these questions in the same manner as they have done in the past. The BBN development process allowed for the reframing of some of these questions by asking for the same information in a more indirect way. The resulting BBN and subsequent sensitivity analysis provide insight into what drivers of change the individual participants feel are the most important concerning the central issue. The diverging opinions about the direct and contributing factors on ‘Income’ showed up at odds with the group consensus weightings that were established when deriving the weighted hierarchy. The drivers of ‘Income’ in the BBN presented a more balanced influence than that what had been assigned in the ‘weighting by consensus’ process. In this case, and importantly, asking the question more indirectly has allowed for the conversation to move beyond rhetoric and formulaic answers, providing a reflection of the single participants’ views and priorities. In fact, this is a general advantage of using BBNs specifically highlighted by Haapasaari et al. (2012b). Here specifically, it has allowed issues of trust and power that exist within different fisher roles (see Duggan, 2012, 2018) to be toned down.
It came somewhat unexpectedly that the probabilities in the CPTs assigned by the participants seemed rather extreme (i.e., 0–100%, 10–90%, 20–80%) with no moderate probabilities assigned to the combinations of variables where the likelihood of a favourable/unfavourable outcome could be assumed to be a bit more equal. This is likely a ramification of the simple dichotomy (good vs. bad) used in defining the states, which was then carried forward into the responses. An improvement can be expected from targeted data collection inspired by this model design, that makes sense to these relevant stakeholders.
It could also simply be a ramification of the general resource scarcity. The research also took place at a time where there was a large amount of uncertainty regarding policy implementation (discussed by amongst others Sowman et al., 2014; Gammage et al., 2017a; Duggan, 2018) and where fishery resources were constrained resulting in this model essentially being run in a state of ‘low fishery resources.’ By implication; if there are no fish to catch, it does not matter what is driving the change in the system, no fish equates to no income with certainty. Fishers are, however, not inclined to highlight the issue of resource scarcity, consistent with previous research (Gammage, 2015; Gammage et al., 2017a) and the results of the causal mapping presented here. One can only speculate on why this is the case, but it may well be there is a fear that if resource challenges were addressed directly, fishers would be forced to confront the fact that even if all other conditions in the fishery were favourable, very little would change for the better given their limited scope for alternative income.
Overall the sensitivity analysis of the prototype confirms a system with high uncertainty, thereby exposing fishers to higher risk. This is consistent with the first steps in the hierarchy construction. In that first round, one of the groups (see Table 2) of fishers provided an equal weighting to the ‘Policy and Regulation’ and ‘Climate (weather)’ variables while the ‘Capital’ variable was rated as the most important. Although all the fishers agreed on the final weighting through a voting process, the differing view of these fishers are reflected in the sensitivity analysis of the individual participants. Interestingly, none of the groups weighted ‘weather/climate’ as being the most important principal driver even though the sensitivity analysis shows that two participants did consider this as most important. These participants may not have been dominant voices, or their small group’s consensus opinions may have been divided from the start. Importantly again, this prototype BBN presents an aggregated model that best fits all the individual fishers’ views, as also shown by Haapasaari et al. (2007); Haapasaari and Karjalainen (2010) and Levontin et al. (2011) in Baltic Salmon fisheries. Future research can build on the ability of the approach to easily combine different knowledge streams and data (Varis and Kuikka, 1997b; Kuikka et al., 2011; Barton et al., 2012; Haapasaari et al., 2012a) while retaining the uncertainties arising from discrepancies in individual views.
Key Insights Across Conceptual and Semi-Quantitative Methods:
Although conducted as a small-scale local study, this research provides insights into how human dimensions of the marine SES can be better integrated into the South African EAF context by offering a methodological blueprint for future, multi-stakeholder processes at bigger scales of operation, whilst promoting social learning and capacity-building for participants operating at the local scale. Apart from the tool-specific questions, we have also addressed two over-arching questions related to new insights into the SES which came to the fore using the SDMTs and the knowledge gained through the iterative implementation process. Following from previous research (Gammage, 2015) and the causal map and BBN construction processes, fishers (and participants) may not always explicitly recognise the importance of several drivers of change in the SES. Failure to account for important system interactions and the role played by such stressors on the short term can severely impede their ability to proactively respond to future change in the long term as outlined by e.g., Walker et al. (2004); Folke (2006) and Folke et al. (2010). From conversations with fishers through the mapping and BBN modelling processes, it became clear that although issues concerning policy and regulation are foremost in the participants’ minds as they see it as the most direct and pressing threat to their livelihoods, stressors such as availability of fish are neglected in the discourse. This is not a challenge unique to South African fisheries. While the causal mapping process helped to highlight many of the issues that remain hidden in a narrative of drivers of change; it did not effectively help move participants beyond what could be called ‘standard responses’. The visual nature of the causal maps did, however, assist fishers with piecing together the drivers of change into a view of the system that moved beyond the abstract to something more concrete. This highlights the need for adequate problem (re)framing and (re)structuring when embarking on policy and management processes, also highlighted by Haapasaari et al. (2012b).
It remains impossible to employ good decision-making (at any scale) if social constructs of management problems and challenges are not accounted for Belton and Stewart (2002). The use of the decision-making tools in this context (specifically BBN), has allowed for questions regarding topics very familiar to fishers, to be reframed. This has helped to move beyond superficial, standard responses and has been helpful in moving the conversation along from a problem-orientated space to a solution-space: Not only does this problem structuring process using SDMTs provide a blueprint for future planning processes, but importantly for this research, it informed the development of the scenario stories as described in Gammage (2019).
Not only are we able to gain necessary insights into the relationships in the system in question, as viewed by relevant stakeholders, but through the participatory modelling process, a process of social/mutual learning and capacity building was also initiated amongst participants, in line with previous studies (van den Belt, 2004; Gregory et al., 2012; Paolisso and Trombley, 2017; Tuler et al., 2017; Videira et al., 2017). While the participants engaged relatively quickly with the causal maps, the BBN modelling process was more challenging to complete, as the process was more abstract than that of the causal maps. An important contribution made by the successful development of the BBN, however, was to the process of capacity building, and possibly social learning, at the smallest scales of interaction. This was true for both the workshop participants and the researcher alike. It contributes to the basis for meaningful inclusion of these fishers in multi-stakeholder settings (which will likely result in some heated discussions), where their voices and opinions currently are likely to be lost due to the unequal power relations at play (e.g., Duggan, 2018). The benefits and mechanisms of such learning in resource management contexts have been well described and discussed by various authors including Carpenter et al. (2006); Gaddis et al. (2010); Cundill and Rodela (2012); Oteros-Rozas et al. (2015); Tuler et al. (2017). Measuring the amount of capacity building and/or learning that took place throughout this process is near impossible (see Tuler et al., 2017). Although not formally evaluated within the context of this study, the interdisciplinary nature of the research allows for the researcher to record and include informal observations in making an evaluation. That some form of learning, or skills development, was taking place was evident in how the fishers were able to engage with increasingly difficult and unfamiliar activities as the research progressed.
Conclusion
Rooted in the human dimensions of SESs and keeping a focus on participant engagement, this research has explored tools which can be used in an inter-and transdisciplinary approach to achieve a balance between social, economic and ecological objectives, as needed for the implementation of EAF in South Africa. By making explicit the views of a marginalised group of stakeholders on drivers and the connections among multiple stressors, the research presented here opens a new view on the SES of the southern Cape linefishery.
We have shown that problem structuring tools commonly applied in structured decision-making can even work in communities where participants/fishers have little formal education. With structure crucial to the practical aspects of fisheries management to ensure repeatability and transparency, this finding shows that where the required groundwork, capacity building and resourcing take place, it is possible to integrate vulnerable, marginalised stakeholders into formal decision-making processes directly. Through the implementation of an interactive and iterative process to structuring a complex reality, the process has resulted in the promotion of capacity building at the scale of the individual, household and community of fishers. While the results presented here are of first prototype models, they have shown value as an important step in a scenario planning process with the same research participants. Inclusion of a wider group of stakeholders in the marine SES of South Africa’s southern Cape will improve the current prototypes. Dedicated data collection in a SES paradigm, together with stakeholder knowledge such as shown here, has the potential to bridge into formal, model-based predictions of possible scenarios of a highly uncertain future, valuable to stakeholders and managers alike.
Data Availability Statement
The datasets generated for this study cannot be made publicly available due to restrictions from ethics requirements and agreements with research participants.
Ethics Statement
The studies involving human participants were reviewed and approved by University of Cape Town, Faculty of Science Research Ethics Committee Approval No: FSREC 03 – 2016. The patients/participants provided their written informed consent to participate in this study.
Author Contributions
LG conceptualised the research, carried out the fieldwork and authored the manuscript which formed part of her Ph.D. research. AJ was the primary supervisor of the research. All authors contributed to the article and approved the submitted version.
Funding
This work was supported by the South African Department of Science and Technology and the National Research Foundation through a DST/RISA Doctoral Innovation Scholarship [101913] and the South African Research Chair in Marine Ecology and Fisheries [65238] as well as by the University of Cape Town [KW Johnston Bequest and Twamley Postgraduate Bursary].
Conflict of Interest
The authors declare that the research was conducted in the absence of any commercial or financial relationships that could be construed as a potential conflict of interest.
Acknowledgments
Our sincere thanks go to Prof. Charles Mather of Memorial University, NL, Canada for his support and co-supervision of the research which this manuscript draws on. Thank you to all the research participants for their willingness to offer up their time to participate in this project. Dr. Russell Richards from the University of Queensland Business School for his kind assistance with the Bayesian Modelling. Lee-Anne Gammage and Cara Pratten for assistance with notes at the workshops. Drs. Catherine Ward and Emma Lockerbie for comments on an earlier draft of the manuscript.
Supplementary Material
The Supplementary Material for this article can be found online at: https://www.frontiersin.org/articles/10.3389/fmars.2020.00477/full#supplementary-material
Footnotes
- ^ A prototype model – the simplest model that can be implemented to meaningfully address a question – holds many advantages when carried out in an interdisciplinary context: serves to establish a ‘common’ language and sense of purpose between participants, produces preliminary results and provides all participants a sense of the ability/potential of the approach thereby allowing for the reconsideration or refinement of the model (e.g. Starfield and Jarre, 2011).
- ^ The rationale used for upscaling the map is that the Multi-dimensional scaling (MDS) plots carried out (Gammage et al., 2019) showed that there was no internal variability between towns regarding stressors, corroborating prior research by Gammage (2015) and Gammage et al. (2017a).
- ^ National government department mandated to manage fisheries was previously (pre-2019) known as the Department of Agriculture, Forestry and Fisheries.
- ^ Although participants were invited to define any central issue important to them, the central issue identified was the same as that of the causal map and the subsequent scenario planning exercise (Gammage, 2019).
References
Amstrup, S. C., Marcot, B. G., and Douglas, D. C. (2008). “A Bayesian network modeling approach to forecasting the 21st century worldwide status of polar bears,” in Arctic Sea Ice Decline: Observations, Projections, Mechanisms, and Implications. Geophysical Monograph 180, eds E. T. Weaver, C. M. Bitz, and L. B. Tremblay (Washington D.C: American Geophysical Union), 213–268. doi: 10.1029/180gm14
Barton, D. N., Kuikka, S., Varis, O., Uusitalo, L., Henriksen, H. J., Borsuk, M., et al. (2012). Bayesian networks in environmental and resource management. Integr. Environ. Assess. Manag. 8, 418–429. doi: 10.1002/ieam.1327
Basson, J. (2009). Towards Operationalising An Ecosystem Approach to the Namibian Rock Lobster Fishery: Identifying Management Objectives and Indicators. Master’s thesis, University of Cape Town, Cape Town.
BCC (2013). Benguela Current Commission. Swakopmund: BCC. Available Online at: http://www.benguelacc.org/index.php/en/about/the-bclme
Belton, V. (1997). Integrated support from problem structuring through to alternative evaluation using COPE and V.I.S.A. J. Multi Criteria Decis. Anal. 6, 115–130. doi: 10.1002/(sici)1099-1360(199705)6:3<115::aid-mcda140>3.0.co;2-i
Belton, V., and Stewart, T. (2002). Multiple Criteria Decision Analysis: An Integrated Approach. Boston, MA: Kluwer Academic Publishers.
Bene, C., and Neiland, A. E. (2006). From Participation to Governance: A Critical Review of the Concepts of Governance, Co-Management and Participation, and Their Implementation in Small-Scale Inland Fisheries in Developing Countries. Penang: WorldFish.
Berkes, F. (2003). Alternatives to conventional management: lessons from small-scale fisheries. Environments 31, 5–20.
Berkes, F. (2006). From community-based resource management to complex systems: the scale issue and marine commons. Ecol. Soc. 11:15.
Berkes, F. (2011). “Restoring unity: the concept of marine social–ecological systems,” in World Fisheries: A Social–Ecological Analysis, eds P. Ommer, R. E. Perry, R. I. Cochrane, and K. Cury (Oxford: Wiley-Blackwell).
Blamey, L. K., Howard, J. A. E., Agenbag, J., and Jarre, A. (2012). Regime-shifts in the southern Benguela shelf and inshore region. Prog. Oceanogr. 106, 80–95. doi: 10.1016/j.pocean.2012.07.001
Blamey, L. K., Shannon, L. J., Bolton, J. J., Crawford, R. J. M., Dufois, F., Evers-King, H., et al. (2015). Ecosystem change in the southern Benguela and the underlying processes. J. Mar. Syst. 144, 9–29. doi: 10.1016/j.jmarsys.2014.11.006
Brierley, A. S., and Kingsford, M. J. (2009). Impacts of climate change on marine organisms and ecosystems. Curr. Biol. 19, R602—-R614. doi: 10.1016/j.cub.2009.05.046
Carpenter, S. R., Bennett, E. A., and Peterson, G. D. (2006). Scenarios for ecosystem services: an overview. Ecol. Soc. 11:29.
Cinner, J. E., McClanahan, T. R., Graham, N. A. J., Daw, T. M., Maina, J., Stead, S. M., et al. (2012). Vulnerability of coastal communities to key impacts of climate change on coral reef fisheries. Glob. Environ. Chang. 22, 12–20. doi: 10.1016/j.gloenvcha.2011.09.018
Clark, R., and Stankey, G. (2007). Integrated Research in Natural Resources: The Key Role of Problem Framing. Portland, OR: DIANE Publishing.
Cochrane, K. L., Joyner, J., Sauer, W. H. H., and Swan, J. (2015). An evaluation of the Marine Living Resources Act and supporting legal instruments as a framework for implementation of an ecosystem approach to fisheries in South Africa. Afr. J. Mar. Sci. 37, 437–456. doi: 10.2989/1814232X.2015.1100682
Creswell, J. W., and Plano Clark, V. L. (2011). Designing and Conduction Mixed Methods Research. 2nd Edn. Thousand Oaks, CA: SAGE Publications.
Cundill, G., and Rodela, R. (2012). A review of assertions about the processes and outcomes of social learning in natural resource management. J. Environ. Manage. 113, 7–14. doi: 10.1016/j.jenvman.2012.08.021
DAFF (2012). Policy for the Small Scale Fisheries No 474 of 2012. Gov. Gazette. Pretoria: DAFF, 1–62.
Dambacher, J. M., Brewer, D. T., Dennis, D. M., Macintyre, M., and Foale, S. (2007). Qualitative Modelling of Gold Mine Impacts on Lihir Island’s socioeconomic system and reef-edge fish community. Environ. Sci. Technol. 41, 555–562. doi: 10.1021/es0610333
Davies, K. K., Fisher, K. T., Dickson, M. E., Thrush, S. F., and Le Heron, R. (2015). Improving ecosystem service frameworks to address wicked problems. Ecol. Soc. 20:37.
Young, de B., Peterman, R. M., and Dobell, A. R. (1999). Canadian Marine Fisheries in a Changing and Uncertain World Canadian Special Publication of Fisheries and Aquatic Sciences No. 129. Ottawa: NRC Research Press.
DEA (2013). Long-Term Adaptation Scenarios Flagship Research Programme (LTAS) for South Africa. Climate Change Implications for Marine Fisheries in South Africa. Pretoria, South Africa. Springfield, VA: DEA.
Degnbol, P., and Jarre, A. C. (2004). Review of indicators in fisheries management - a development perspective. Afr. J. Mar. Sci. 26, 303–326. doi: 10.2989/18142320409504063
Dickerson, J. A., and Kosko, B. (1994). Virtual worlds as fuzzy cognitive maps. Presence Teleoperat. Virt. Environ. 3, 173–189. doi: 10.1162/pres.1994.3.2.173
Dufois, F., and Rouault, M. (2012). Sea surface temperature in False Bay (South Africa): Towards a better understanding of its seasonal and inter-annual variability. Cont. Shelf Res. 43, 24–35. doi: 10.1016/j.csr.2012.04.009
Duggan, G. L. (2012). In the Realm of the Kob Kings: Rethinking Knowledges and Dialogue in A Small-Scale Fishery. Master’s dissertation, University of Cape Town, Cape Town.
Duggan, G. L. (2018). Return to the Realm of the Kob Kings: Social Capital, Learning, Resilience and Action Research in a Changing Fishery. Ph.D. thesis, University of Cape Town, Cape Town.
FAO (1995). Code of Conduct for Responsible Fisheries. Rome: Food and Agriculture Organisation of the United Nations (FAO).
FAO (1999). Indicators for Sustainable Development of Marine Capture Fisheries. FAO Technical Guidelines for Responsible Fisheries (8). Rome: Food and Agriculture Organization of the United Nations (FAO).
FAO (2003). The Ecosystem Approach to Fisheries. Rome: Food and Agriculture Organization of the United Nations (FAO).
FAO (2015). Voluntary Guidelines for Securing Sustainable Small-Scale Fisheries in the context of Food Security and Poverty Eradication. Rome: Food and Agriculture Organization of the United Nations (FAO).
FAO (2016). The State of World Fisheries and Aquaculture 2016. Contributing to food Secuity and Nutrition for all. Rome: Food and Agriculture Organization of the United Nations (FAO).
FAO (2018). The state of World Fisheries and Aquaculture 2018. Meeting the Sustainable Development Goals. Rome: Food and Agriculture Organisation of the United Nations (FAO).
Folke, C. (2006). Resilience: the emergence of a perspective for social–ecological systems analyses. Glob. Environ. Chang. 16, 253–267. doi: 10.1016/j.gloenvcha.2006.04.002
Folke, C., Carpenter, S. R., Walker, B., Scheffer, M., Chapin, T., and Rockström, J. (2010). Resilience thinking: integrating resilience, adaptability and transformability. Ecol. Soc. 15:43. doi: 10.5751/ES-03610-150420
Folke, C., Hahn, T., Olsson, P., and Norberg, J. (2005). Adaptive governance of social–ecological systems. Annu. Rev. Environ. Resour. 30, 441–473.
Gaddis, E. J. B., Falk, H. H., Ginger, C., and Voinov, A. (2010). Effectiveness of a participatory modeling effort to identify and advance community water resource goals in St. Albans, Vermont. Environ. Model. Softw. 25, 1428–1438. doi: 10.1016/j.envsoft.2009.06.004
Gammage, L. C. (2015). Considering One’s Options When the Fish Leave. A Case Study of the Traditional Commercial Handline Fishery of the Southern Cape. Master’s thesis, University of Cape Town, Cape Town.
Gammage, L. C. (2019). Development of a Scenario-Based Approach for Responding to Change in Fishery Systems: A Case Study in the Small-Scale Fisheries of South Africa’s Southern Cape. Ph.D. thesis, University of Cape Town, Cape Town. Available online at: http://hdl.handle.net/11427/30360
Gammage, L. C., Jarre, A., and Mather, C. (2017a). A case study from the southern Cape linefishery 1: the difficulty of fishing in a changing world. S. Afr. J. Sci. 113:10. doi: 10.17159/sajs.2017/20160252
Gammage, L. C., Jarre, A., and Mather, C. (2017b). A case study from the southern Cape linefishery 2: considering one’s options when the fish leave. S. Afr. J. Sci. 113, 10. doi: 10.17159/sajs.2017/20160254
Gammage, L. C., Jarre, A., and Mather, C. (2019). A changing fishery system: perspectives from crew in the Southern Cape’ s handline fishery. South Afr. Geogr. J. 101, 210–252. doi: 10.1080/03736245.2019.1581656
Garcia, S., Staples, D., and Chesson, J. (2000). The FAO guidelines for the development and use of indicators for sustainable development of marine capture fisheries and an Australian example of their application. Ocean Coast. Manag. 43, 537–556. doi: 10.1016/s0964-5691(00)00045-4
Garcia, S., Zerbi, A., Aliaume, C., Do Chi, T., and Lasserre, G. (2003). The ecosystem approach to fisheries. Issues, terminology, principles, institutional foundations, implementation and outlook. FAO Fish. Tech. Pap. 443:71.
Garcia, S. M. (2000). The FAO definition of sustainable development and the Code of Conduct for Responsible Fisheries: an analysis of the related principles, criteria and indicators. Mar. Freshw. Res. 51, 535–541.
Garcia, S. M., and Cochrane, K. L. (2005). Ecosystem approach to fisheries: a review of implementation guidelines. ICES J. Mar. Sci. 62, 311–318. doi: 10.1016/j.icesjms.2004.12.003
Gelcich, S., Hughes, T., Olsson, P., Folke, C., Defeo, O., Fernandez, M., et al. (2010). Navigating transformations in governance of Chilean marine coastal resources. Proc. Natl. Acad. Sci. U.S.A. 107, 16794–16799. doi: 10.1073/pnas.1012021107
Gibson, C., Ostrom, E., and Ahn, T. K. (2000). The concept of scale and the human dimensions of global change. Ecol. Econ. 32, 217–239. doi: 10.1016/S0921-8009(99)00092-90
Gray, S., Paolisso, M., Jordan, R., and Gray, S. (eds) (2017). Environmental Modeling with Stakeholders. Theory, Methods, and Applications. Berlin: Springer, doi: 10.1007/978-3-319-25053-3
Greenston, J. (2013). Assessing the Suitability of an Individual Transferable Quota System to Address Unregulated By-Catch in South Africa’s Inshore Trawl Fishery. Master’s Thesis, University of Cape Town, Cape Town.
Gregory, R., Failing, L., Harstone, M., Long, G., McDaniels, T., and Ohlson, D. (2012). Structured Decision Making. A Practical Guide to Environmental Management Choices, 1st Edn. Hoboken, NJ: Wiley-Blackwell.
Griffiths, M. H. (2000). Long-term trends in catch and effort of commercial linefish off South Africa’s Cape Province: snapshots of the 20th century. South Afr. J. Mar. Sci. 22, 81–109. doi: 10.2989/025776100784125663
Guimarães Pereira, Â, Corral Quintana, S., and Funtowicz, S. (2005). GOUVERNe: new trends in decision support for groundwater governance issues. Environ. Model. Softw. 20, 111–118. doi: 10.1016/j.envsoft.2003.12.015
Haapasaari, P., and Karjalainen, T. (2010). Formalizing expert knowledge to compare alternative management plans: sociological perspective to the future management of Baltic salmon stocks. Mar. Policy 34, 477–486. doi: 10.1016/j.marpol.2009.10.002
Haapasaari, P., Kulmala, S., and Kuikka, S. (2012a). Growing into interdisciplinarity How to converge biology, economics, and social science in fisheries. Ecol. Soc. 17, 1–12. doi: 10.5751/ES-04503-170106
Haapasaari, P., Mäntyniemi, S., and Kuikka, S. (2012b). Baltic herring fisheries management: Stakeholder views to frame the problem. Ecol. Soc. 17:36. doi: 10.5751/ES-04907-170336
Haapasaari, P., Michielsens, C. G. J., Karjalainen, T. P., Reinikainen, K., and Kuikka, S. (2007). Management measures and fishers’ commitment to sustainable exploitation: a case study of Atlantic salmon fisheries in the Baltic Sea. ICES J. Mar. Sci. 64, 825–833. doi: 10.1093/icesjms/fsm002
Haines-Young, R. (2011). Exploring ecosystem service issues across diverse knowledge domains using Bayesian Belief Networks. Prog. Phys. Geogr. 35, 681–699. doi: 10.1177/0309133311422977
Halpern, B. S., Walbridge, S., Selkoe, K. A., Kappel, C. V., Micheli, F., D’Agrosa, C., et al. (2008). A global map of human impact on marine ecosystems. Science 319, 948–953.
Hammond, T. R., and O’Brien, C. M. (2001). An application of the Bayesian approach to stock assessment model uncertainty. ICES J. Mar. Sci. 58, 648–656. doi: 10.1006/jmsc.2001.1051
Hara, M. M., Rogerson, J., de Goede, J., and Raakjær, J. (2014). Fragmented participation in management of the fishery for small pelagic fish in South Africa - inclusion of small-rights holders is a complex matter. Afr. J. Mar. Sci. 36, 185–196. doi: 10.2989/1814232X.2014.930708
Henriksen, H. J., and Barlebo, H. C. (2008). Reflections on the use of Bayesian belief networks for adaptive management. J. Environ. Manag. 88, 1025–1036. doi: 10.1016/j.jenvman.2007.05.009
Henriksen, H. J., Rasmussen, P., Brandt, G., von Bülow, D., and Jensen, V. F. (2007). Public participation modelling using Bayesian networks in management of groundwater contamination. Environ. Model. Softw. 22, 1101–1113. doi: 10.1016/j.envsoft.2006.01.008
Hobbs, B. F., Ludsin, S. A., Knight, R. L., Ryan, P. A., Biberhofer, J., and Ciborowski, J. J. (2002). Fuzzy cognitive mapping as a tool to define management objectives for complex ecosystems. Ecol. Appl. 12, 1548–1565. doi: 10.1890/1051-0761(2002)012[1548:fcmaat]2.0.co;2
Hoegh-Guldberg, O., and Bruno, J. F. (2010). The Impact of Climate Change on the world’s marine ecosystems. Science 328, 1523–1529. doi: 10.1126/science.1189930
IPBES (2016). “The methodological assessment report on scenarios and models of biodiversity and ecosystem services,” in Secretariat of the Intergovernmental Science-Policy Platform on Biodiversity and Ecosystem Services, eds S. Ferrier, K. N. Ninan, P. Leadley, R. Alkemade, L. A. Acosta, H. R. Akçakaya, et al. (Bonn: IPBES), 350.
IPCC (2014). Climate Change 2014. Synthesis Report. Contribution of Working Groups I, II and III to the Fith Assessment Reports of the Intergovernmental Panel on Climate Change, eds R. K. P. Core Writing Team and L. A. Meyer (Geneva: IPCC), doi: 10.1017/CBO9781107415324
Isaacs, M. (2006). Small-scale fisheries reform: expectations, hopes and dreams of “a better life for all.” Mar. Policy 30, 51–59. doi: 10.1016/j.marpol.2005.06.010
Jackson, J. B., Kirby, M. X., Berger, W. H., Bjorndal, K. A., Botsford, L. W., Bourque, B. J., et al. (2001). Historical overfishing and the recent collapse of coastal ecosystems. Science 293, 629–637. doi: 10.1126/science.1059199
Jarre, A., Hutchings, L., Kirkman, S. P., Kreiner, A., Tchipalanga, P., Kainge, P., et al. (2015). Synthesis: climate effects on biodiversity, abundance and distribution of marine organisms in the Benguela. Fish. Oceanogr. 24, 122–149. doi: 10.1111/fog.12086
Jarre, A., Ragaller, S. M., and Hutchings, L. (2013). Long-term, Ecosystem-Scale Changes in the Southern Benguela Marine Pelagic Social-Ecological System: interaction of Natural and Human. Ecol. Soc. 18:55.
Jarre, A., Shannon, L. J., Cooper, R., Duggan, G. L., Gammage, L. C., Lockerbie, E. M., et al. (2018). Untangling a Gordian knot that must not be cut: social-ecological systems research for management of southern Benguela fisheries. J. Mar. Syst. 188, 1–11. doi: 10.1016/j.jmarsys.2018.01.004
Jennings, S., Smith, A. D. M., Fulton, E. A., and Smith, D. C. (2014). The ecosystem approach to fisheries: management at the dynamic interface between biodiversity conservation and sustainable use. Ann. N. Y. Acad. Sci. 1322, 48–60. doi: 10.1111/nyas.12489
Johnson, S., and Mengersen, K. (2012). Integrated Bayesian network framework for modeling complex ecological issues. Integr. Environ. Assess. Manag. 8, 480–490. doi: 10.1002/ieam.274
Jones, N., Ross, H., Lynam, T., Perez, P., and Leitch, A. (2011). Mental models: an interdisciplinary synthesis of theory and methods. Ecol. Soc. 16:46.
Kim, H. S., and Lee, K. C. (1998). Fuzzy implications of fuzzy cognitive map with emphasis on fuzzy causal relationship and fuzzy partially causal relationship. Fuzzy Sets Syst. 97, 303–313. doi: 10.1016/s0165-0114(96)00349-1
Kjærulf, U. B., and Madsen, A. L. (2006). Probabilistic Networks for Practitioners — A Guide to Construction and Analysis of Bayesian Networks and Influence Diagrams. Denmark: Department of Computer Science, Aalborg University, 266.
Kosko, B. (1992a). “Fuzzy associative memory systems,” inFuzzy Expert Systems, ed. A. Kandel (Tampa, FL: CRC Press), 13–162.
Kosko, B. (1992b). Neural Networks and Fuzzy Systems: A Dynamical Systems Approach to Machine Intelligence. Englewood Cliffs: Prentice Hall.
Kuikka, S., Haapasaari, P., Helle, I., Kulmala, S., and Mäntyniemi, S. (2011). “Experiences in applying Bayesian integrative models in interdisciplinary modeling: the computational and human challenges,” in Proceedings of the MODSIM, 19th International Congress on Modelling and Simulation, New Zealand, 2135–2141.
Lamont, T., García-Reyes, M., Bograd, S. J., van der Lingen, C. D., and Sydeman, W. J. (2018). Upwelling indices for comparative ecosystem studies: variability in the Benguela upwelling system. J. Mar. Syst. 188, 3–16. doi: 10.1016/j.jmarsys.2017.05.007
Landuyt, D., Broekx, S., D’hondt, R., Engelen, G., Aertsens, J., and Goethals, P. L. M. (2013). A review of Bayesian belief networks in ecosystem service modelling. Environ. Model. Softw. 46, 1–11. doi: 10.1016/j.envsoft.2013.03.011
Levontin, P., Kulmala, S., Haapasaari, P., and Kuikka, S. (2011). Integration of biological, economic, and sociological knowledge by Bayesian belief networks: the interdisciplinary evaluation of potential management plans for Baltic salmon. ICES J. Mar. Sci. 68, 632–638. doi: 10.1093/icesjms/fsr004
Lyttle, C. (2019). Analysing Modelled Nearshore Wave Climate Variability and Change as Relevant to the Traditional Handline Fishery of the South African South Coast. Master’s dissertation, University of Cape Town, Cape Town. Available Online at: http://hdl.handle.net/11427/30103
Mahon, R., McConney, P., and Roy, R. (2008). Governing fisheries as complex adaptive systems. Mar. Policy 32, 104–112. doi: 10.1016/j.marpol.2007.04.011
Marcot, B. G. B. G., Holthausen, R. S. R. S., Raphael, M. G., Rowland, M. M., and Wisdom, M. J. (2001). Using Bayesian belief networks to evaluate fish and wildlife population viability under land management alternatives from an environmental impact statement. For. Ecol. Manag. 153, 29–42. doi: 10.1016/S0378-1127(01)00452-452
Marshall, N. A., Marshall, P. A., Tamelander, J., Obura, D., Malleret-King, D., and Cinner, J. E. (2010). A Framework for Social Adaptation to Climate Change Sustaining Tropical Coastal Communitities and Industries. Gland: IUCN, 36.
Martins, I. M., Gammage, L. C., Jarre, A., and Gasalla, M. (2019). Different but similar? Exploring vulnerability to climate change in Brazilian and South African small-scale fishing communities. Hum. Ecol. 47, 515–526. doi: 10.1007/s10745-019-00098-4
Marttunen, M., Lienert, J., and Belton, V. (2017). Structuring problems for Multi-Criteria Decision Analysis in practice: a literature review of method combinations. Eur. J. Oper. Res. 263, 1–17. doi: 10.1016/j.ejor.2017.04.041
McConney, P., and Charles, A. (2010). “Managing small-scale fisheries: moving towards people-centered perspectives,” in Handbook of Marine Fisheries Conservation and Management, eds R. Grafton, R. Hilborn, D. Squires, M. Tait, and M. Williams (New York, NY: Oxford University Press).
McGregor, E. S. (2015). Assessing the Implementation Efficacy of an Ecosystem Approach to Fisheries Management in the South African Sardine Fishery. Doctoral thesis, University of Cape Town, Cape Town.
McGregor, E. S., Duncan, J. A., Greenstone, J. D., Shannon, L. J., and Jarre, A. (2016). Workshop outcomes: a decade of an ecosystem approach to fisheries in South Africa. Available Online at: http://www.eafsa.uct.ac.za/sites/default/files/image_tool/images/397/Papers/McGregoretal_2016%20%20FINAL.pdf
Mikalsen, K. H., and Jentoft, S. (2003). Limits to participation? On the history, structure and reform of Norwegian fisheries management. Mar. Policy 27, 397–407. doi: 10.1016/s0308-597x(03)00025-3
Moloney, C. L., Fennessy, S. T., Gibbons, M. J., Roychoudhurye, A., Shillington, F. A., and von et al. (2013). Reviewing evidence of marine ecosystem change off South Africa. Afr. J. Mar. Sci. 35, 427–448. doi: 10.2989/1814232x.2013.836135
Montibeller, G., and Belton, V. (2006). Causal maps and the evaluation of decision options: a review. J. Oper. Res. Soc. 57, 779–791. doi: 10.1057/palgrave.jors.2602214
Newing, H. Contributors (2011). Conducting Research in Conservation: A Social Science Perspective, 1st Edn. Oxon: Routledge.
Newton, A. C. (2009). “Bayesian Belief Networks in Environmental Modelling:A review of recent progress,” in Environmental Modelling: New Research, ed. P. N. Findley (New York, NY: Nova Science Publishers), 13–50.
Nicholson, A. E., and Flores, M. J. (2011). Combining state and transition models with dynamic Bayesian networks. Ecol. Model. 222, 555–556.
Ommer, R. E. and Team (2007). Coasts Under Stress: Restructuring and Social-Ecological Health, 1st Edn. Montreal: McGill-Queen’s University Press.
Ommer, R. E., Perry, R. I., Murray, G., and Neis, B. (2012). Social–ecological dynamism, knowledge, and sustainable coastal marine fisheries. Curr. Opin. Environ. Sustain. 4, 316–322. doi: 10.1016/j.cosust.2012.05.010
Ortega-Cisneros, K., Cochrane, K., and Fulton, E. A. (2017). An Atlantis model of the southern Benguela upwelling system: validation, sensitivity analysis and insights into ecosystem functioning. Ecol. Model. 355, 49–63. doi: 10.1016/j.ecolmodel.2017.04.009
Ortega-Cisneros, K., Cochrane, K. L., Fulton, E. A., Gorton, R., and Popova, E. (2018). Evaluating the effects of climate change in the southern Benguela upwelling system using the Atlantis modelling framework. Fish. Oceanogr. 27, 489–503. doi: 10.1111/fog.12268
Ostrom, E. (2009). A general framework for analyzing sustainability of social-ecological systems. Science 325, 419–423. doi: 10.5055/jem.2013.0130
Oteros-Rozas, E., Martín-López, B., Daw, T., Bohensky, E., Butler, J., Hill, R., et al. (2015). Participatory scenario planning in place-based social-ecological research: insights and experiences from 23 case studies. Ecol. Soc. 20:32. doi: 10.5751/ES-07985-200432
Özesmi, U., and Özesmi, S. L. S. L. (2004). Ecological models based on people’s knowledge: a multi-step fuzzy cognitive mapping approach. Ecol. Model. 176, 43–64. doi: 10.1016/j.ecolmodel.2003.10.027
Paolisso, M., and Trombley, J. (2017). “Cognitive, material and technical consideration in participatory environmental modeling,” in Environmental Modeling With Stakeholders. Theory, Methods, and Applications, eds S. Gray, M. Paolisso, R. Jordan, and S. Gray, 377.
Parry, M. L., Canziani, O. F., Palutikof, J. P., van der Linden, P. J., and Hanson, C. E. (eds) (2007). Climate Change 2007: Impacts, Adaptation and Vulnerability. Contribution of Working Group II to the Fourth Assessment Report of the Intergovernmental Panel on Climate Change. Cambridge, UK: Cambridge University Press, doi: 10.2134/jeq2008.0015br
Paterson, B., Isaacs, M., Hara, M. M., Jarre, A. C., and Moloney, C. L. (2010). Transdisciplinary co-operation for an ecosystem approach to fisheries: a case study from the South African sardine fishery. Mar. Policy 34, 782–794. doi: 10.1016/j.marpol.2010.01.019
Paterson, B., and Petersen, S. L. (2010). EAF implementation in Southern Africa: lessons learnt. Mar. Policy 34, 276–292. doi: 10.1016/j.marpol.2009.07.004
Perry, I., Cury, P., Brander, K., Jennings, S., and Planque, B. (2010). Sensitivity of marine systems to climate and fishing: concepts, issues and management responses. J. Mar. Syst. 79, 427–435. doi: 10.1016/j.jmarsys.2008.12.017
Poloczanska, E. S., Brown, C. J., Sydeman, W. J., Kiessling, W., Schoeman, D. S., Moore, P. J., et al. (2013). Global imprint of climate change on marine life. Nat. Clim. Chang. 3, 913–925. doi: 10.1038/nclimate1958
Rieman, B., Peterson, J. T., Clayton, J., Howell, P., Thurow, R., Thompson, W., et al. (2001). Evaluation of potential effects of federal land management alternatives on trends of salmonids and their habitats in the interior Columbia River basin. For. Ecol. Manag. 153, 43–62. doi: 10.1016/s0378-1127(01)00453-4
Robinson, K. F., and Fuller, A. K. (2017). “Participatory Modeling and Structured Decision Making,” in Environmental Modeling with Stakeholders: Theory, Methods, and Applications, eds S. Grey, M. Paolisso, R. Jordan, and S. Gray (Berlin: Springer), 377.
Rouault, M., Pohl, B., and Penven, P. (2010). Coastal oceanic climate change and variability from 1982 to 2009 around South Africa. Afr. J. Mar. Sci. 32, 237–246. doi: 10.2989/1814232X.2010.501563
Rumpff, L., Duncan, D. H., Vesk, P. A., Keith, D. A., and Wintle, B. A. (2011). State-and-transition modelling for Adaptive Management of native woodlands. Biol. Conserv. 144, 1235–1244. doi: 10.1016/j.biocon.2010.10.026
Said Ghabayen, S., and Kemblowski, M. (2004). Characterization of uncertainties in the operation and economics of the proposed seawater desalination plant in the Gaza Strip. Desalination 161, 191–201. doi: 10.1016/s0011-9164(04)90054-9
Sandker, M., Campbell, B. M., Ruiz-Pérez, M., Sayer, J. A., Cowling, R., Kassa, H., et al. (2010). The Role of Participatory Modeling in Landscape Approaches to Reconcile Conservation and Development. Ecol. Soc. 15:1.
Scheffer, M., Carpenter, S., and de Young, B. (2005). Cascading effects of overfishing marine systems. Trends Ecol. Evol. 20, 579–581. doi: 10.1016/j.tree.2005.08.018
Schneider, M., Shnaider, E., Kandel, A., and Chew, G. (1998). Automatic construction of FCMs. Fuzzy Sets Syst. 93, 161–172. doi: 10.1016/s0165-0114(96)00218-7
Sluijs, V. D. J. P., and Craye, M. (2005). Combining quantitative and qualitative measures of uncertainty in model-based environmental assessment: the NUSAP system. Risk Anal. 25, 481–492. doi: 10.1111/j.1539-6924.2005.00604.x
Smith, R. I., Barton, D. N., Dick, J., Haines-Young, R., Madsen, A. L., Rusch, G. M., et al. (2018). Operationalising ecosystem service assessment in Bayesian Belief Networks: experiences within the OpenNESS project. Ecosyst. Serv. 29, 452–464. doi: 10.1016/j.ecoser.2017.11.004
Sowman, M. (2006). Subsistence and small-scale fisheries in South Africa: a ten-year review. Mar. Policy 30, 60–73. doi: 10.1016/j.marpol.2005.06.014
Sowman, M., Sunde, J., Raemaekers, S., and Schultz, O. (2014). Fishing for equality: policy for poverty alleviation for South Africa’s small-scale fisheries. Mar. Policy 46, 31–42. doi: 10.1016/j.marpol.2013.12.005
Staples, D. J. (2010). Final Report on Institutional Arrangements for Implementing an Ecosystem Approach to Fisheries (EAF). Management in Benguela Current Commission. Swakopmund: BCC.
Starfield, A., and Jarre, A. (2011). “Interdisciplinary modeling for an ecosystem approach to management,” in Marine Social-Ecological Systems, 1st Edn, eds R. Ommer, I. Perry, K. Cochrane, and P. Cury (Hoboken, NJ: Blackwell Publishing Ltd).
Stewart, T. J., Joubert, A., and Janssen, R. (2009). MCDA Framework for Fishing Rights Allocation in South Africa. Gr. Decis. Negot. 19, 247–265. doi: 10.1007/s10726-009-9159-9159
Tegner, M. J., and Dayton, P. K. (2000). Ecosystem effects of fishing in kelp forest communities. ICES J. Mar. Sci. 57, 579–589. doi: 10.1006/jmsc.2000.0715
Tiller, R., Gentry, R., and Richards, R. (2013). Stakeholder driven future scenarios as an element of interdisciplinary management tools; the case of future offshore aquaculture development and the potential effects on fishermen in Santa Barbara. California. Ocean Coast. Manag. 73, 127–135. doi: 10.1016/j.ocecoaman.2012.12.011
Travers-Trolet, M., Shin, Y.-J., Shannon, L., Moloney, C., and Field, J. G. (2014). Combination of fishing and climate forcing in the southern Benguela upwelling ecosystem: an end-to-end modelling approach reveals dampened effects. PLoS One 9:e94286. doi: 10.1371/journal.pone.0094286
Tuler, S., Dow, K., Webler, T., and Whitehead, J. (2017). “Learning through participatory modeling: reflections on what it means and how it is measured,” in Environmental Modeling with Stakeholders. Theory, Methods, and Applications, eds S. Gray, M. Paolisso, R. Jordan, and S. Gray (Berlin: Springer), 377.
Uusitalo, L. (2007). Advantages and challenges of Bayesian networks in environmental modelling. Ecol. Model. 203, 312–318. doi: 10.1016/j.ecolmodel.2006.11.033
van den Belt, M. (2004). Mediated Modelling: A System Dynamics Approach to Environmental Consensus Building. Washington, DC: Island Press.
van Putten, I., Lalancette, A., Bayliss, P., Dennis, D., Hutton, T., Norman-Lopez, A., et al. (2013). A Bayesian model of factors influencing indigenous participation in the Torres Strait tropical rocklobster fishery. Mar. Policy 37, 96–105. doi: 10.1016/j.marpol.2012.04.001
Varis, O., and Kuikka, S. (1997a). BeNe-Eia: a Bayesian approach to expert judgment elicitation with case studies on climate change impacts on surface waters. Clim. Change 37, 539–563.
Varis, O., and Kuikka, S. (1997b). Joint use of multiple environmental assessment models by a Bayesian meta-model: the Baltic salmon case. Ecol. Model. 102, 341–351. doi: 10.1016/s0304-3800(97)00068-9
Verweij, M. C., and Densen, V. W. L. T. (2010). Differences in causal reasoning about resource dynamics and consequences for the participatory debate on North Sea fisheries. Mar. Policy 34, 1144–1155. doi: 10.1016/j.marpol.2010.03.014
Videira, N., Antunes, P., and Santos, R. (2017). “Engaging stakeholders in Environmental and sustainability decisions with participatory system dynamics modeling,” in Environmental Modeling With Stakeholders. Theory, Methods, and Applications, eds. S. Gray, M. Paolisso, R. Jordan, and S. Gray (Springer), 377.
Visser, N. (2015). The origins of the present: economic conflicts in the fisheries of the South African south east coast, circa 1910 to 1950. Marit. Stud. 14:9. doi: 10.1186/s40152-015-0029-26
Voinov, A., and Bousquet, F. (2010). Modelling with stakeholders. Environ. Model. Softw. 25, 1268–1281. doi: 10.1016/j.envsoft.2010.03.007
Walker, B., Holling, C. S., Carpenter, S. R., and Kinzig, A. (2004). Resilience, Adaptability and Transformability in Social – ecological Systems. Ecol. Soc. 9:5.
Ward, C. (2018). Climate Variability in Social-Ecological Systems of the Southern Cape: Integrating Farming and Fishing Perspectives. Doctoral thesis, University of Cape Town, Cape Town. Available Online at: https://open.uct.ac.za/handle/11427/30088
Weller, F., Sherley, R. B., Waller, L. J., Ludynia, K., Geldenhuys, D., Shannon, L. J., et al. (2016). System dynamics modelling of the Endangered African penguin populations on Dyer and Robben islands, South Africa. Ecol. Model. 327, 44–56. doi: 10.1016/j.ecolmodel.2016.01.011
Whatmore, S. J. (2009). Mapping knowledge controversies: science, democracy and the redistribution of expertise. Prog. Hum. Geogr. 33, 587–598. doi: 10.1177/0309132509339841
Wilson, C., and McDaniels, T. (2007). Structured decision-making to link climate change and sustainable development. Clim. Policy 7, 353–370. doi: 10.1080/14693062.2007.9685661
Wilson, J. A. (2006). Matching social and ecological systems in complex ocean fisheries. Ecol. Soc. 11:9. doi: 10.1002/9781444392241.ch2
Winker, H., Kerwath, S. E., and Attwood, C. G. (2014). Report on Age-Structured Stock Assessments and the Simulation of the Impact of Various Fisheries Management Options for the South African Linefishery. Report of the Linefish Scientific Working Group, LSWG No. 1, 2014. Department of Agriculture, Forestry & Fisheries, Cape Town.
WSSD (2002). Johannesburg Plan of Implementation. UN Doc. A/CONF.199/20. Resolut. II, Annex. New Cumberland, PA: WSSD, 1–6.
Zorrilla, P., Carmona, G., de la Hera, A., Bromley, J., Henriksen, H. J., and Rasmussen, P. (2007). “Application of Bayesian networks to the upper Guadiana basin,” in Proceedings of the CAIWA 2007, International Conference on Adaptive & Integrated Water Management, Basel, 1–20.
Zorrilla, P., and García, G. (2010). Evaluation of Bayesian networks in participatory water resources management, Upper Guadiana Basin, Spain. Ecol. Soc. 15:12.
Keywords: ecosystem approach to fisheries management, structured decision-making, causal map, Bayesian belief networks, social-ecological systems, small-scale fisheries, stakeholders
Citation: Gammage LC and Jarre A (2020) Using Structured Decision-Making Tools With Marginalised Fishers to Promote System-Based Fisheries Management Approaches in South Africa. Front. Mar. Sci. 7:477. doi: 10.3389/fmars.2020.00477
Received: 11 February 2020; Accepted: 28 May 2020;
Published: 26 June 2020.
Edited by:
Rowan Trebilco, Centre for Marine Socioecology, AustraliaReviewed by:
Stuart James Kininmonth, University of the South Pacific, FijiEmily Ogier, University of Tasmania, Australia
Copyright © 2020 Gammage and Jarre. This is an open-access article distributed under the terms of the Creative Commons Attribution License (CC BY). The use, distribution or reproduction in other forums is permitted, provided the original author(s) and the copyright owner(s) are credited and that the original publication in this journal is cited, in accordance with accepted academic practice. No use, distribution or reproduction is permitted which does not comply with these terms.
*Correspondence: Louise Carin Gammage, louise.gammage@uct.ac.za