Assessments of 15 Exploited Fish Stocks in Chinese, South Korean and Japanese Waters Using the CMSY and BSM Methods
 Cui Liang
 Weiwei Xian
 Daniel Pauly
- 1CAS Key Laboratory of Marine Ecology and Environmental Sciences, Institute of Oceanology, Chinese Academy of Sciences, Qingdao, China
- 2Laboratory for Marine Ecology and Environmental Science, Qingdao National Laboratory for Marine Science and Technology, Qingdao, China
- 3Center for Ocean Mega-Science, Chinese Academy of Sciences, Qingdao, China
- 4Sea Around Us, Institute for the Oceans and Fisheries, University of British Columbia, Vancouver, BC, Canada
The status of 15 marine fish and invertebrate populations exploited by Chinese, South Korean or Japanese fishing fleets were assessed, using two newly developed computer-intensive methods, CMSY and BSM. The results show that among the 15 populations in question, 2 have collapsed, 3 are grossly over-fished and 9 are overfished. Also, we compared results of the CMSY and BSM methods, and it shows that, while the CPUE data for use with the BSM method lead to narrower confidence intervals and may modify the shape of the biomass trajectory, they do not lead to over- or underestimates of terminal B/BMSY values. These results, although still tentative because the methods used to generate them are relatively new, generally match what is known of the status and exploitation of the populations in question, which makes CMSY and BSM to be promising stock assessment approaches in data-sparse situations. Based on our results, a consistent signal is obtained, thus suggesting that a reduction in fishing pressure would be necessary to restore the abundance status of these 15 populations.
Introduction
Fisheries data assembled by the Food and Agriculture Organization (FAO) suggest that the landings of the world’s marine fisheries declined slowly since 1996 (FAO, 2018), while marine catches, as reconstructed by the Sea Around Us by adding discards and other illegal, unreported and undocumented (IUU), declined by about 1.2 million tons per year since 1996 (Pauly and Zeller, 2016, 2019). This situation is even more severe for Asian fisheries (Lam and Pauly, 2019), given the high pressure on Asian fish stocks (Anticamara et al., 2011; Watson et al., 2013).
However, in developing countries, and notably in most regions of Asia, most fish populations exploited by even large-scale fisheries remain unassessed (Froese et al., 2012; Geng et al., 2018), precluding the rebuilding of their biomass. Fortunately, this state of affairs can be mitigated, at least in part, by the systematic application of newly developed methods for evaluating the status of exploited fish stocks for use in data-sparse situations, especially the Monte Carlo method CMSY (catch-maximum sustainable yield) developed by Froese et al. (2017). Unlike complex stock assessment methods requiring fisheries-independent data sets, such as obtained from research surveys, and catch-at-age data, the recently proposed CMSY method uses only a time series of catches and ancillary qualitative information to quantify biomass, exploitation rate, Maximum Sustainable Yield (MSY) and related fisheries reference points for a given population. As this method is still relatively new, we performed various comparison with the results of other methods applied to some of the stocks studied here, and performed sensitivity analyses which complement those performed by Froese et al. (2017).
Specifically, we applied and compared CMSY and the related Bayesian Schaefer model (BSM; Froese et al., 2017) methods to 15 fish and invertebrate populations exploited by Chinese, South Korean or Japanese fishing fleets in Northeast Asia to assess the status of their fisheries. Also, we compared results of CMSY and BSM methods; BSM uses catch-per-unit-effort (CPUE) data and offers a chance to explore the information content when adding that data. Sensitivity analyses were also performed to test model sensitivity to input parameters.
Materials and Methods
Data Sources
The data source and basic information of the 15 fish and invertebrate stocks covered here are given in Table 1 (Supplementary Tables S1, S2; see Supplementary Material). Most data were read off from figures in published scientific papers using OriginPro 8.5. When reading off data from graphs using OriginPro 8.5, small errors were inevitable; tests on simulated data suggest that the magnitude of errors is well below 5%.
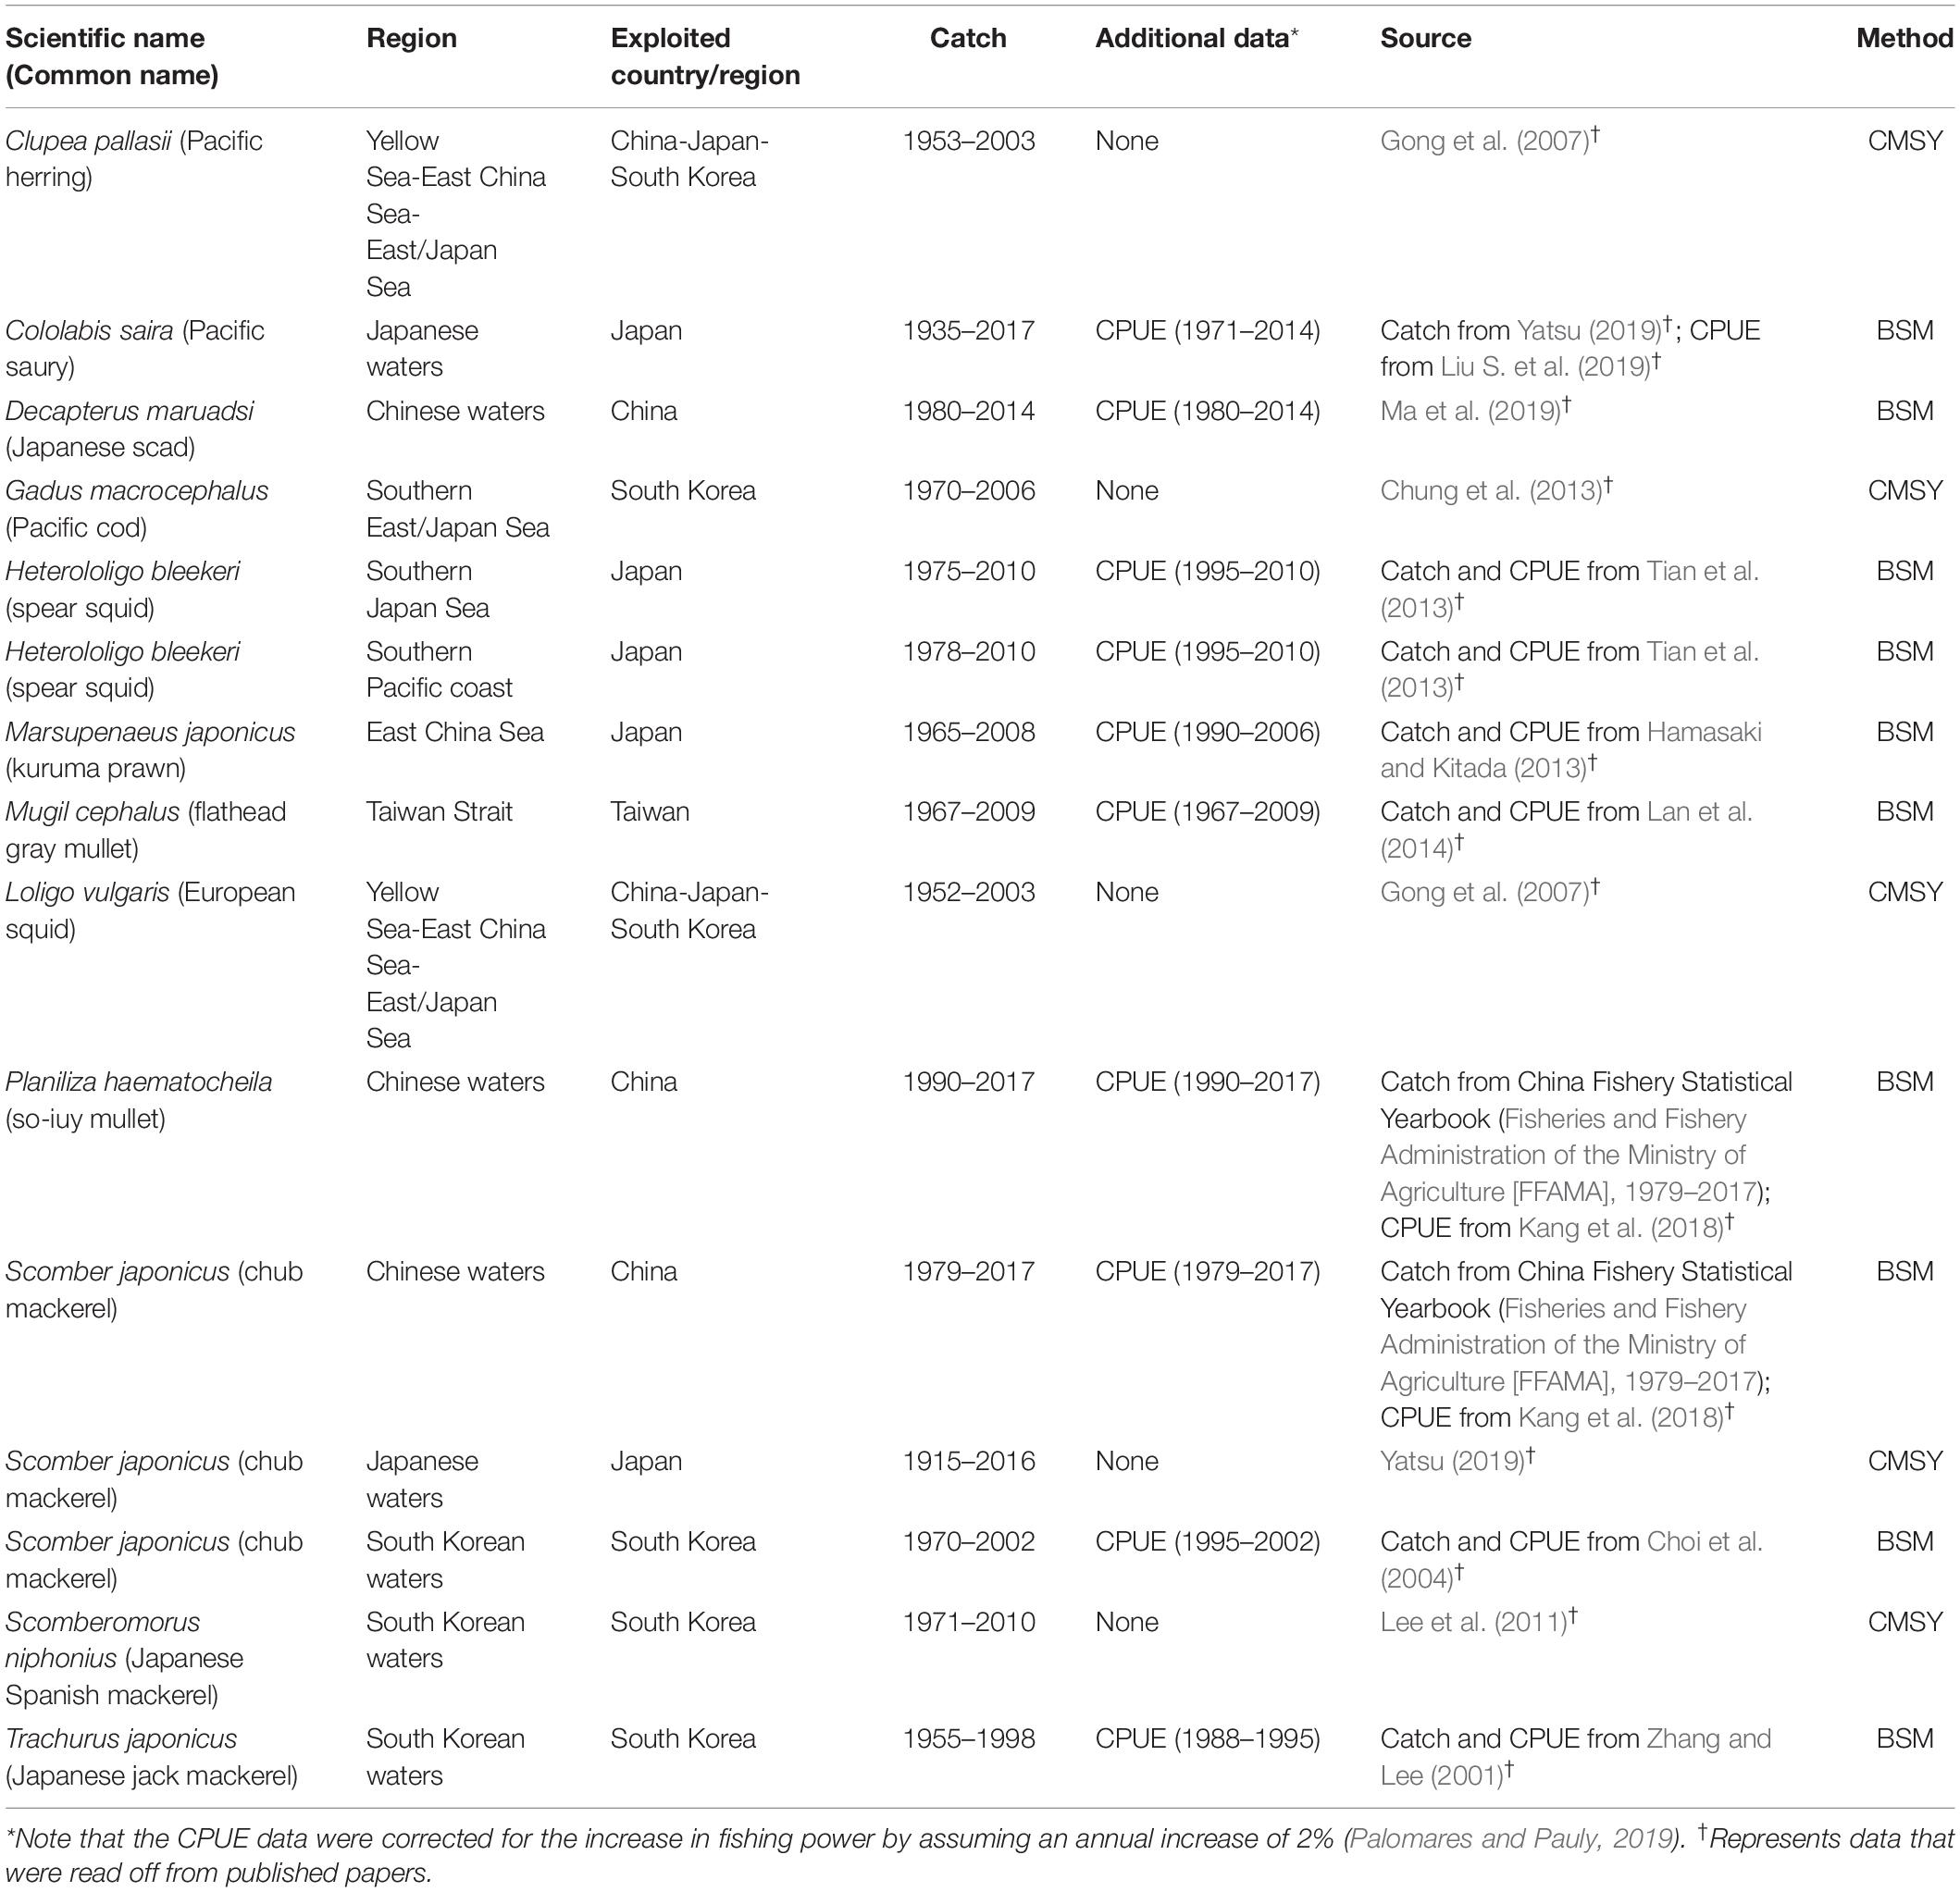
Table 1. Summary of data available for the stock assessments presented here.
General Description of CMSY and BSM Methods
The CMSY method can be seen as an accounting exercise where, starting from an assumed biomass, annual catches are subtracted from the stock’s biomass and its annual biological production is added to it. This results in a biomass trajectory whose shape is determined by the catches and by the stock’s growth rate, as determined by an assumed value of intrinsic population growth rate (r; “resilience”) and by how close the biomass is to carrying capacity (k). The Monte Carlo component of the methods is then used to generate thousands of such trajectories, each with different assumed values of r and k, and to identify the trajectories that provide viable solutions, i.e., trajectories that do no “crash” the stock, and which meet various criteria (“priors”).
In the cases where relative abundance data (i.e., CPUE) were available in addition to catch data, a Bayesian state-space implementation of the Schaefer surplus-production model (BSM) was applied. Note that the time series of abundance may be shorter than those for catches. The CMSY and BSM methods assumes that population growth, in nature, follows a logistic curve, as assumed in the commonly used Schaefer surplus-production model (Schaefer, 1954, 1957). Therefore, in the subsequent year (t+1), the biomass (Bt+1) follows the equation:
where Bt is the biomass at year t, r is the intrinsic rate of population increase, k is the carrying capacity (assumed equivalent to the unexploited population size), and Ct is the catch in year t.
When the stock size is severely depleted (biomass falls below 0.25k) (Froese et al., 2017), Equation (1) is slightly modified to account for “depensation,” i.e., reduced recruitment at low biomass levels (Myers et al., 1995), as shown in Equation (2):
The term 4 Bt/k assumes a linear decline of recruitment below half of the biomass that is capable of producing MSY.
Given a time series of catches and qualitative stock status information, the CMSY method, using a Monte-Carlo approach, identifies viable population biomass trajectories (i) compatible with the catch time series, (ii) compatible with assumed priors on biomass reductions, and (iii) occur within prior ranges of r and k, corresponding to viable r-k pairs. A parameter pair is deemed “viable” if its corresponding biomass trajectories are compatible with the catch series, i.e., neither collapses nor exceeds the maximum of the percentage of carrying capacity assumed to have remain at the end of the time series under consideration. Typically, the variable r-k pairs occupy a triangular-shaped cloud in a bivariate plot of r vs. k; the most probable r and k pair generally occurs near the tip of the triangle (Froese et al., 2017).
Determining the Boundaries of the r-k Space
To assign default values to r-ranges for the 15 stocks in question, the resilience estimates as provided in FishBase1 or SeaLifeBase2 for the species in question were translated into the r-ranges, as shown in Table 2. For species without resilience information in FishBase or SeaLifeBase, we used information of their taxonomically close species and/or set a wider-range.
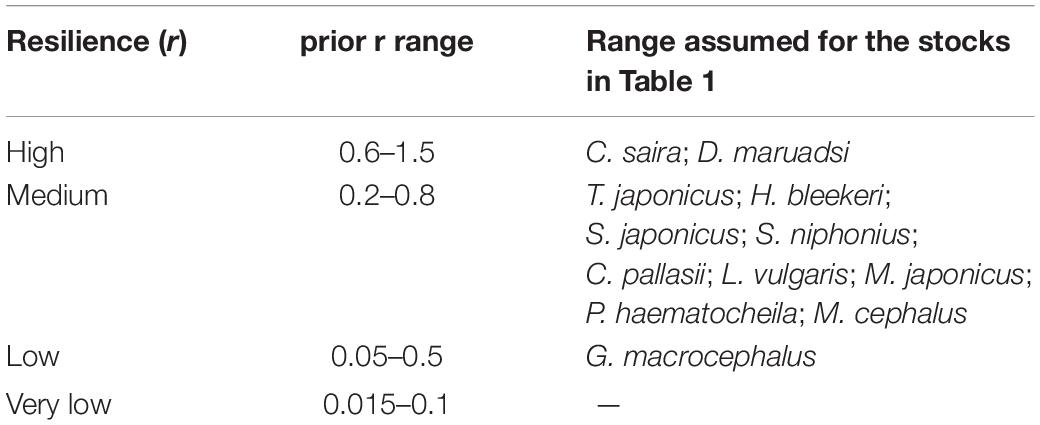
Table 2. Ranges suggested by FishBase (www.fishbase.org) for population growth rate (year–1).
For stocks with low prior biomass at the end of the time series, simulation performed by Froese et al. (2017) suggest that the range of carrying capacity within which viable values can be expected to occur is given by:
where klow and khigh are the lower and upper bounds of the prior range of k, max(C) is the maximum catch in the time series, and rlow and rhigh are the lower and upper bound of the range of r- values that the CMSY method explores.
For stocks with high prior biomass at the end of the time series, i.e., lightly depleted stocks, Equation (4) was applied.
where the variables and parameters are defined as in Equation (3), with both equations as per Froese et al. (2017).
Setting Prior Biomass Ranges
The CMSY and BSM methods also require priors for biomass relative to carrying capacity (k). This includes a prior biomass range relative to unexploited biomass (B/k) at the beginning and end of the time series, i.e., Bstart/k and Bend/k, respectively. Should there be an intermediate year in the time series where biomass is considered to be extraordinary, e.g., particular low or high, then relative intermediate biomass for that particular year should also be entered as a prior (Froese et al., 2017).
Table 3 presents suggested ranges of Bstart/k for the 15 stocks under assessment. Note that for species whose time series of catch data starts before 1960, high initial biomass was assumed (Bstart/k = 0.6–1), given that the fishing technology deployed at the time was rudimentary (Froese et al., 2017). In all other cases, we assumed a relative high biomass (Bstart/k = 0.4–0.8), in view of the fact that from the 1970s to the 1990s, industrial fishing effort had strongly increased in Northeast Asia (Anticamara et al., 2011), and the technological sophistication of that effort had also increased (Engelhard, 2016; Palomares and Pauly, 2019).
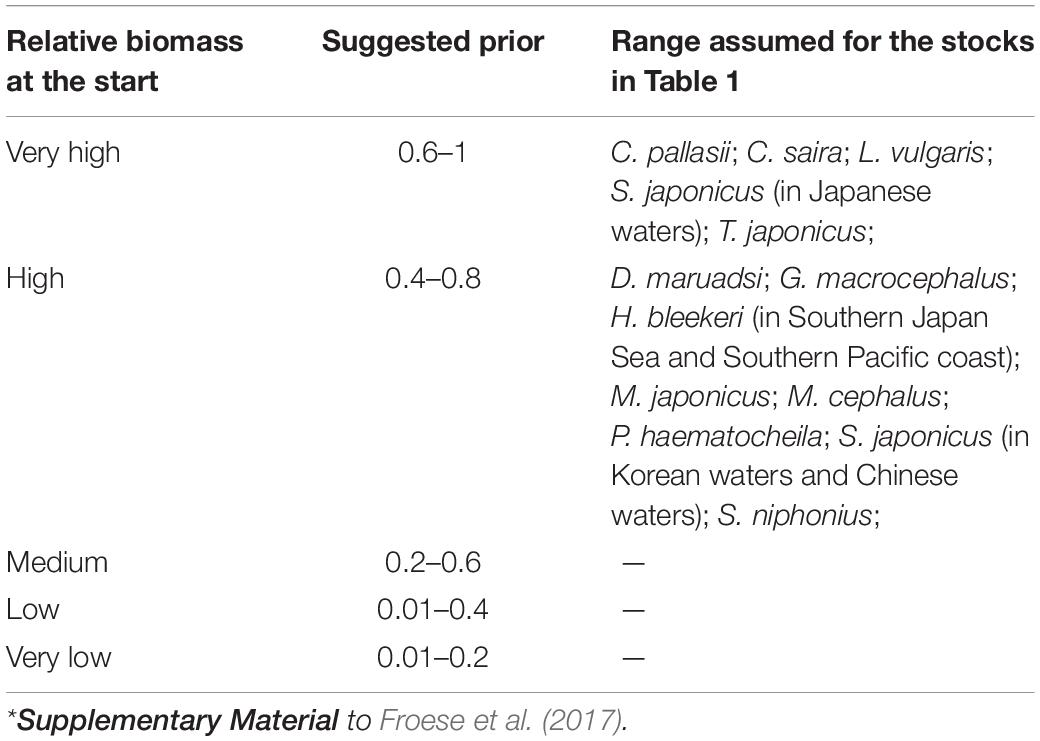
Table 3. Suggested fractions Bstart/k for the period before catch data became available*.
Table 4 presents suggested ranges of Bend/k. Given the intensity of the research areas of each species and the results of published research papers, we chose a relative low biomass (i.e., Bend/k = 0.01–0.4) at the end of the time series for C. pallasii (Gong et al., 2007), C. saira (Yatsu, 2019), D. maruadsi (Zheng et al., 2003), G. macrocephalus (Chung et al., 2013), L. vulgaris (Gong et al., 2007), M. japonicus (Hamasaki and Kitada, 2013), P. haematocheila (Shi et al., 2010), S. japonicus (Cheng and Lin, 2004; Choi et al., 2004; Yatsu, 2019), T. japonicus (Zhang and Lee, 2001). For the other stocks, the sources suggested a very low biomass (Bend/k = 0.01–0.2): H. bleekeri (Tian, 2009), M. cephalus (Shi et al., 2010).
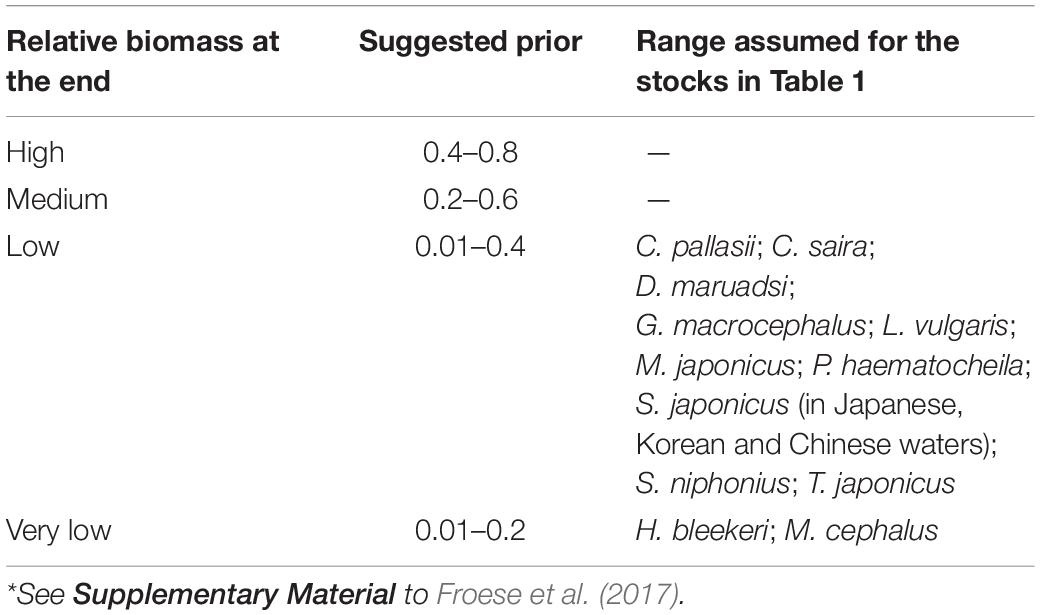
Table 4. Suggested ranges of the fraction Bend/k for the period prior to catches being available*.
To examine the potential impact of a “wrong” choice of r range (Supplementary Table S3; see Supplementary Material) and of the Bstart/k and Bend/k ranges (Supplementary Table S3; see Supplementary Material), sensitivity analyses were performed consisting of evaluating the effect on estimates of B/BMSY of the input originally drawn from these tables (“original”), compared with the input from the table row above (“Higher”) and below (“Lower”) the original selection.
Results
All 15 stocks in question were analyzed by CMSY method. The BSM method was also applied to the 10 stocks for which CPUE data were available (Table 1).
Japanese jack mackerel (Trachurus japonicus), a widely distributed and commercially exploited species along the coastal waters of South Korea, is used here to illustrate the CMSY and BSM outputs (Figure 1).
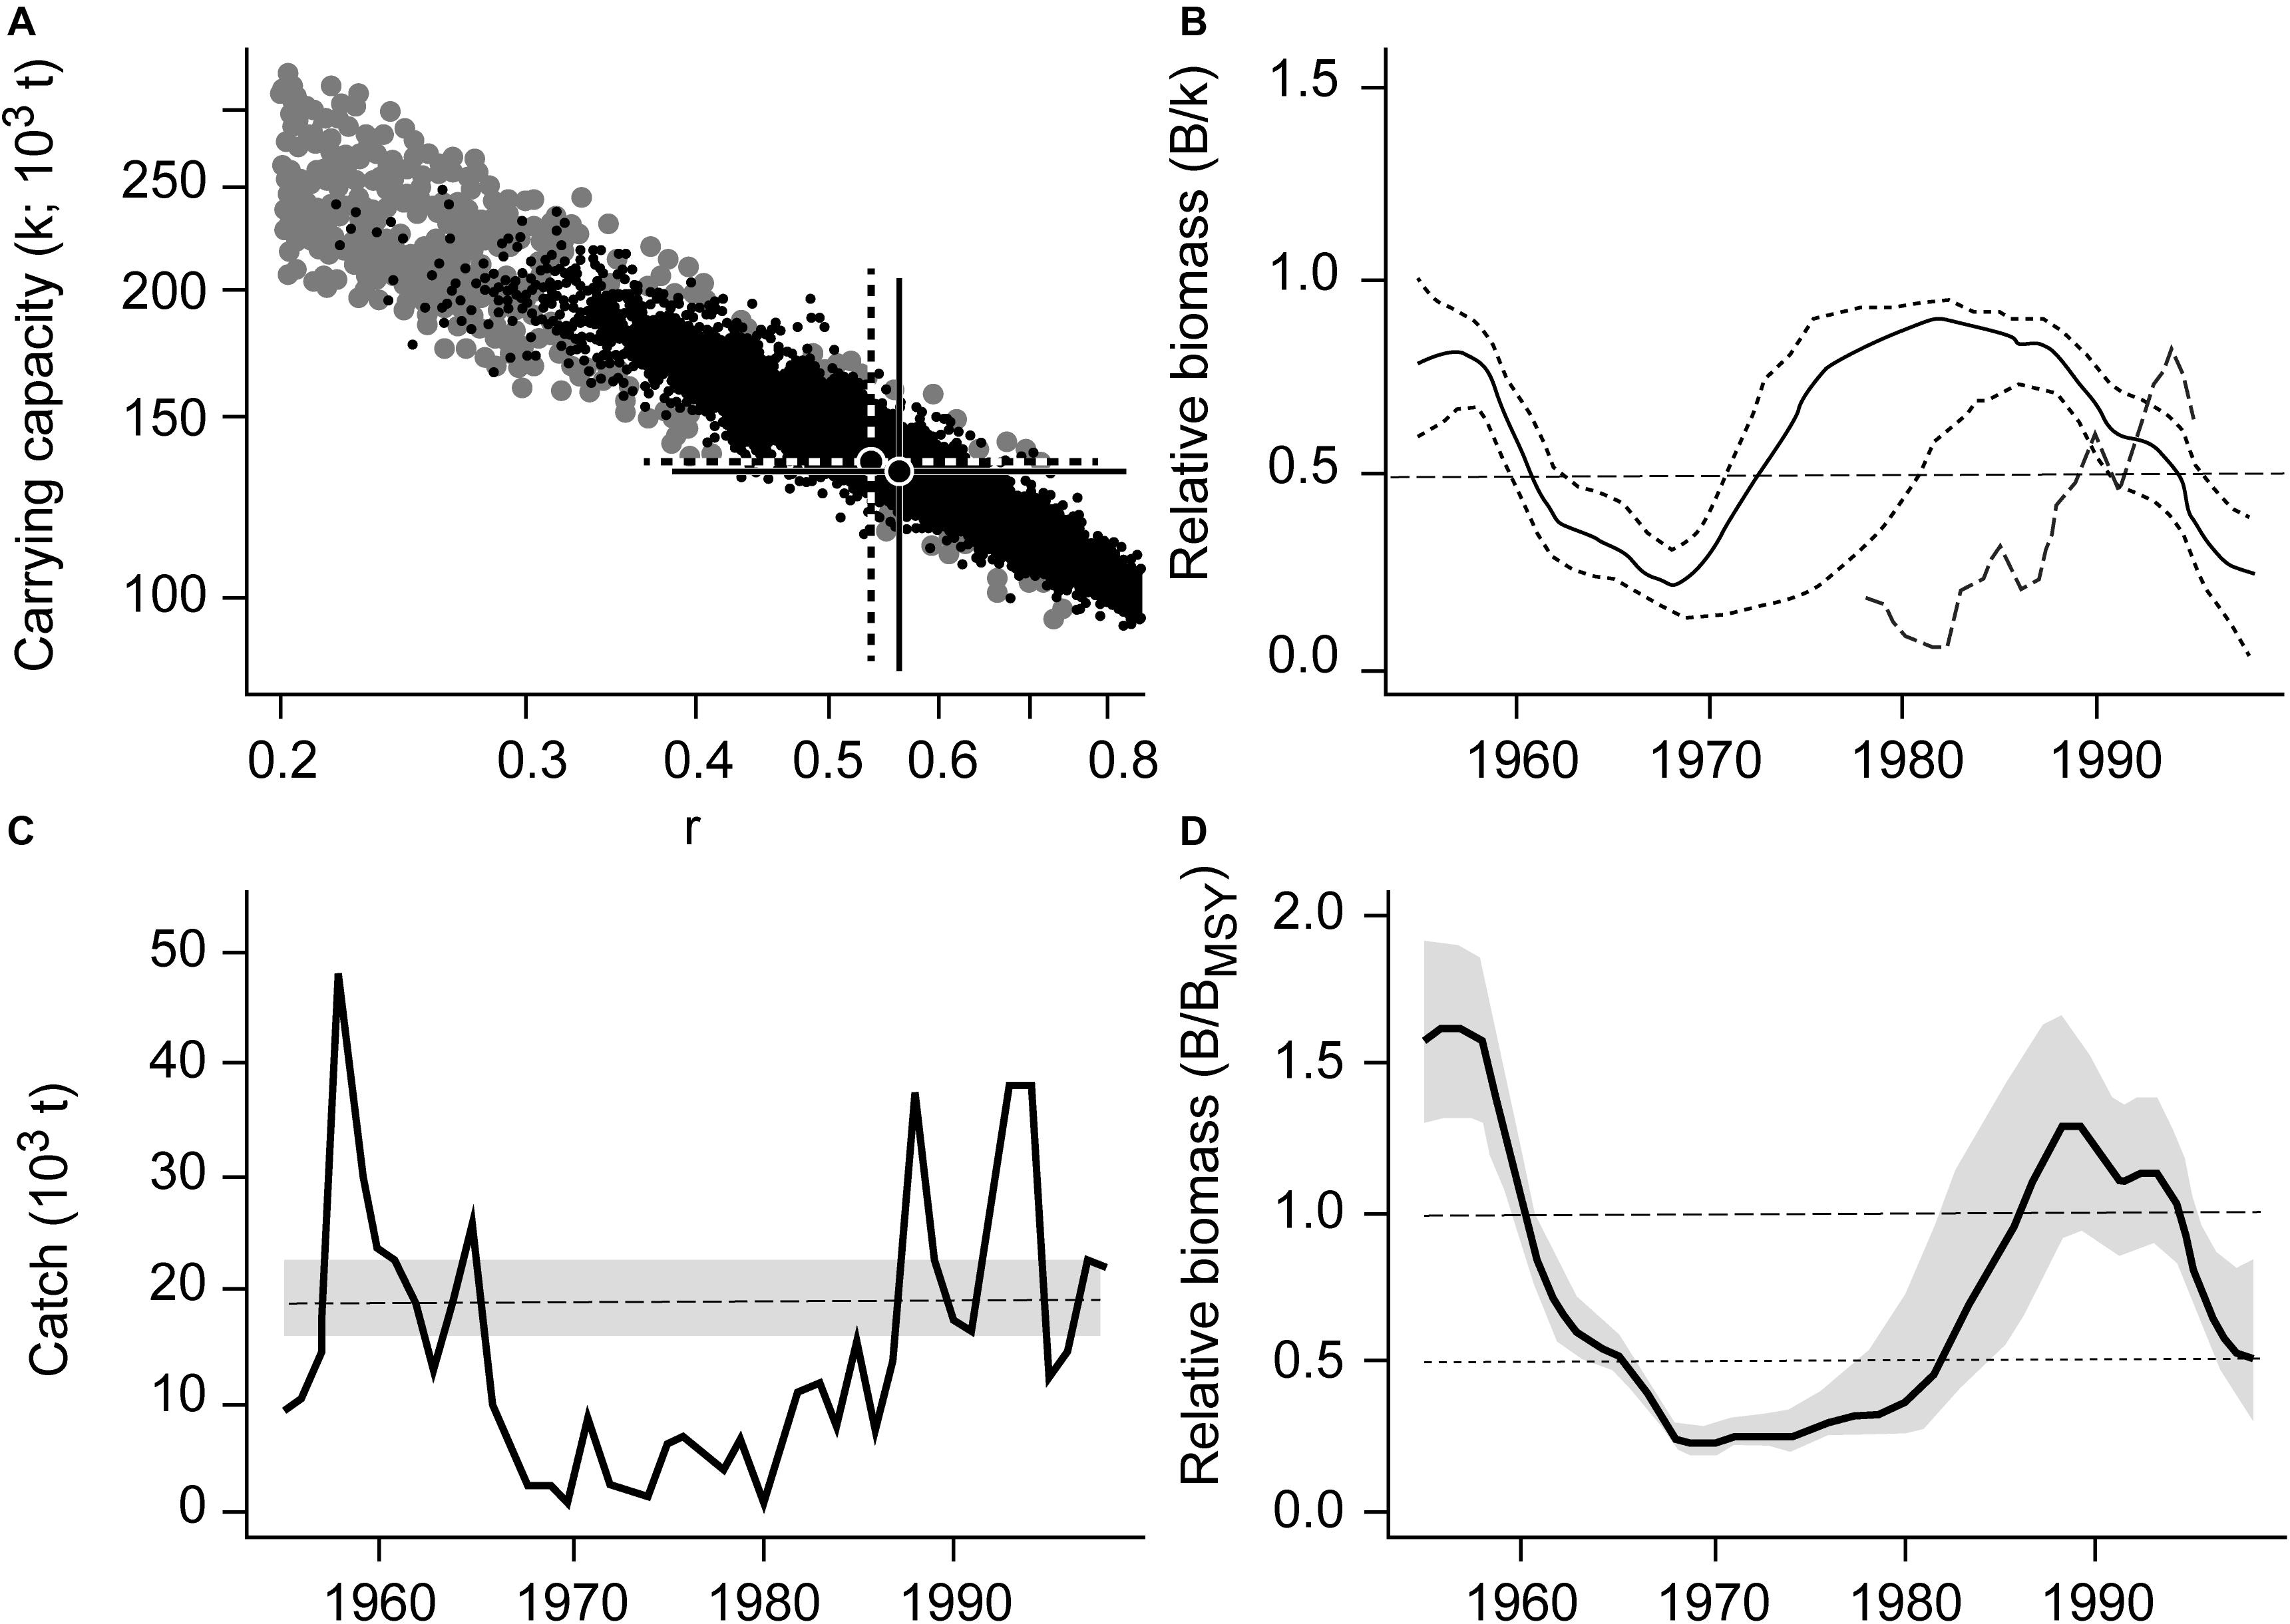
Figure 1. Results of the CMSY and BSM analyses for the Japanese jack mackerel (Trachurus japonicus) in South Korean waters. (A) viable r-k pairs identified by the CMSY and BSM methods. (B) Biomass trajectory estimated by CMSY (solid black line), with the two dotted lines being its CIs, and available abundance data scaled to the BSM estimate of k (broken line). (C) Catches relative to the BSM estimate of MSY, with the 95% confidence interval in gray. (D) Estimated relative biomass trajectory (B/BMSY), with the gray area indicating the confidence interval.
Figure 1A shows the viable r-k pairs found by CMSY (gray dots) and BSM methods (black dots). The best r-k pair and its approximate 95% confidence interval (CI), as estimated using CMSY are represented by a solid cross, while a dotted cross represents the best r-k pair and its approximate CI as estimated by the BSM method.
Figure 1B shows the biomass trajectory estimated by CMSY (solid line) and BSM (dotted line). Figure 1C shows the catches relative to the BSM estimate of MSY and its CI. In absolute terms, the MSY estimate was 18800 t per year, with a CI ranging from 15800 to 22300 t per year. Figure 1D shows the estimated trend of relative biomass. This biomass trend is similar to the detailed stock assessment of Zhang and Lee (2001).
The estimated biomass trajectories for five stocks without CPUE data are presented in Figure 2. Figure 3, which pertains to populations with CPUE data in addition to catch time series, shows on the left the biomass trajectories estimated (using CMSY) from the catch data alone, while displaying, on the right, the biomass trajectories estimated using BSM from catch data and CPUE data. The added CPUE data reduce the CIs and modify the shape of the biomass trajectories. However, Figure 4, which compares 10 pairs of Bend/BMSY estimates with and without CPUE data shows that, except for spear squid Heterololigo bleekeri in the southern Pacific coast of Japan, the added CPUE data do not change the Bend/BMSY values to a large extent.
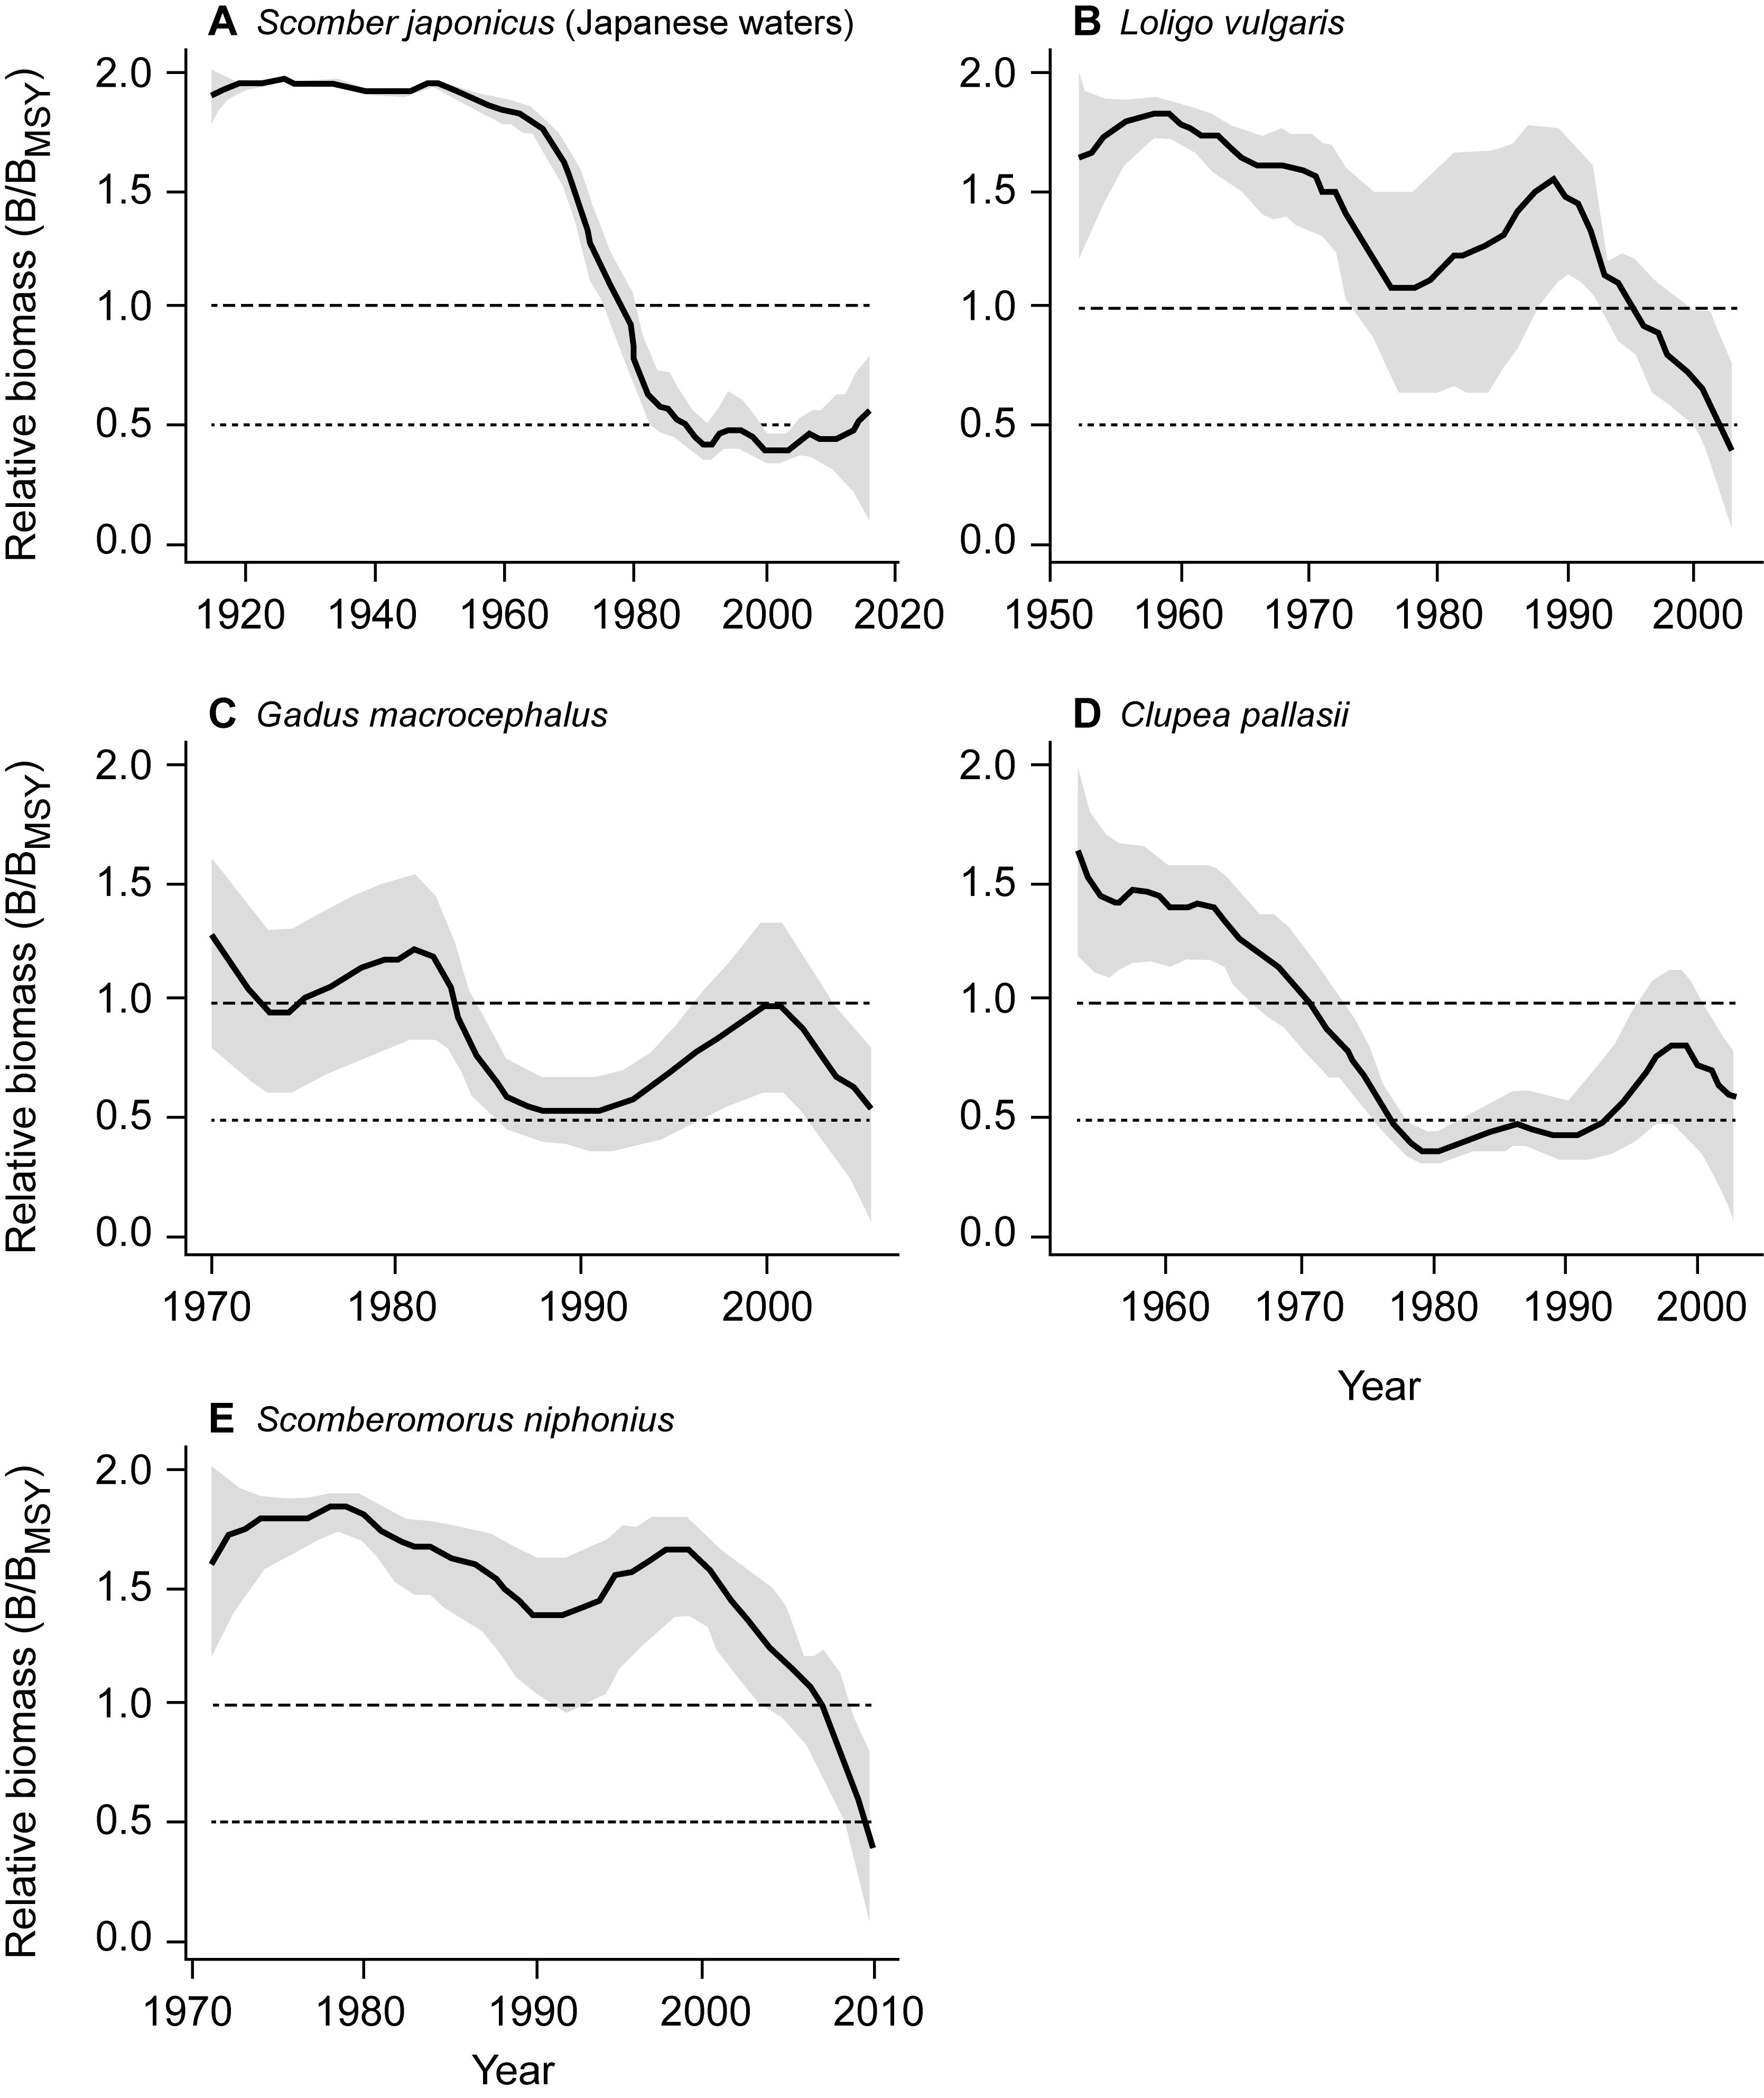
Figure 2. Trend of relative biomass (B/BMSY) generated using the CMSY method for 5 stocks without CPUE data, with the gray areas referring to the 95% confidence intervals. Panels (A–E) thus illustrate assessments with a minimum of data.
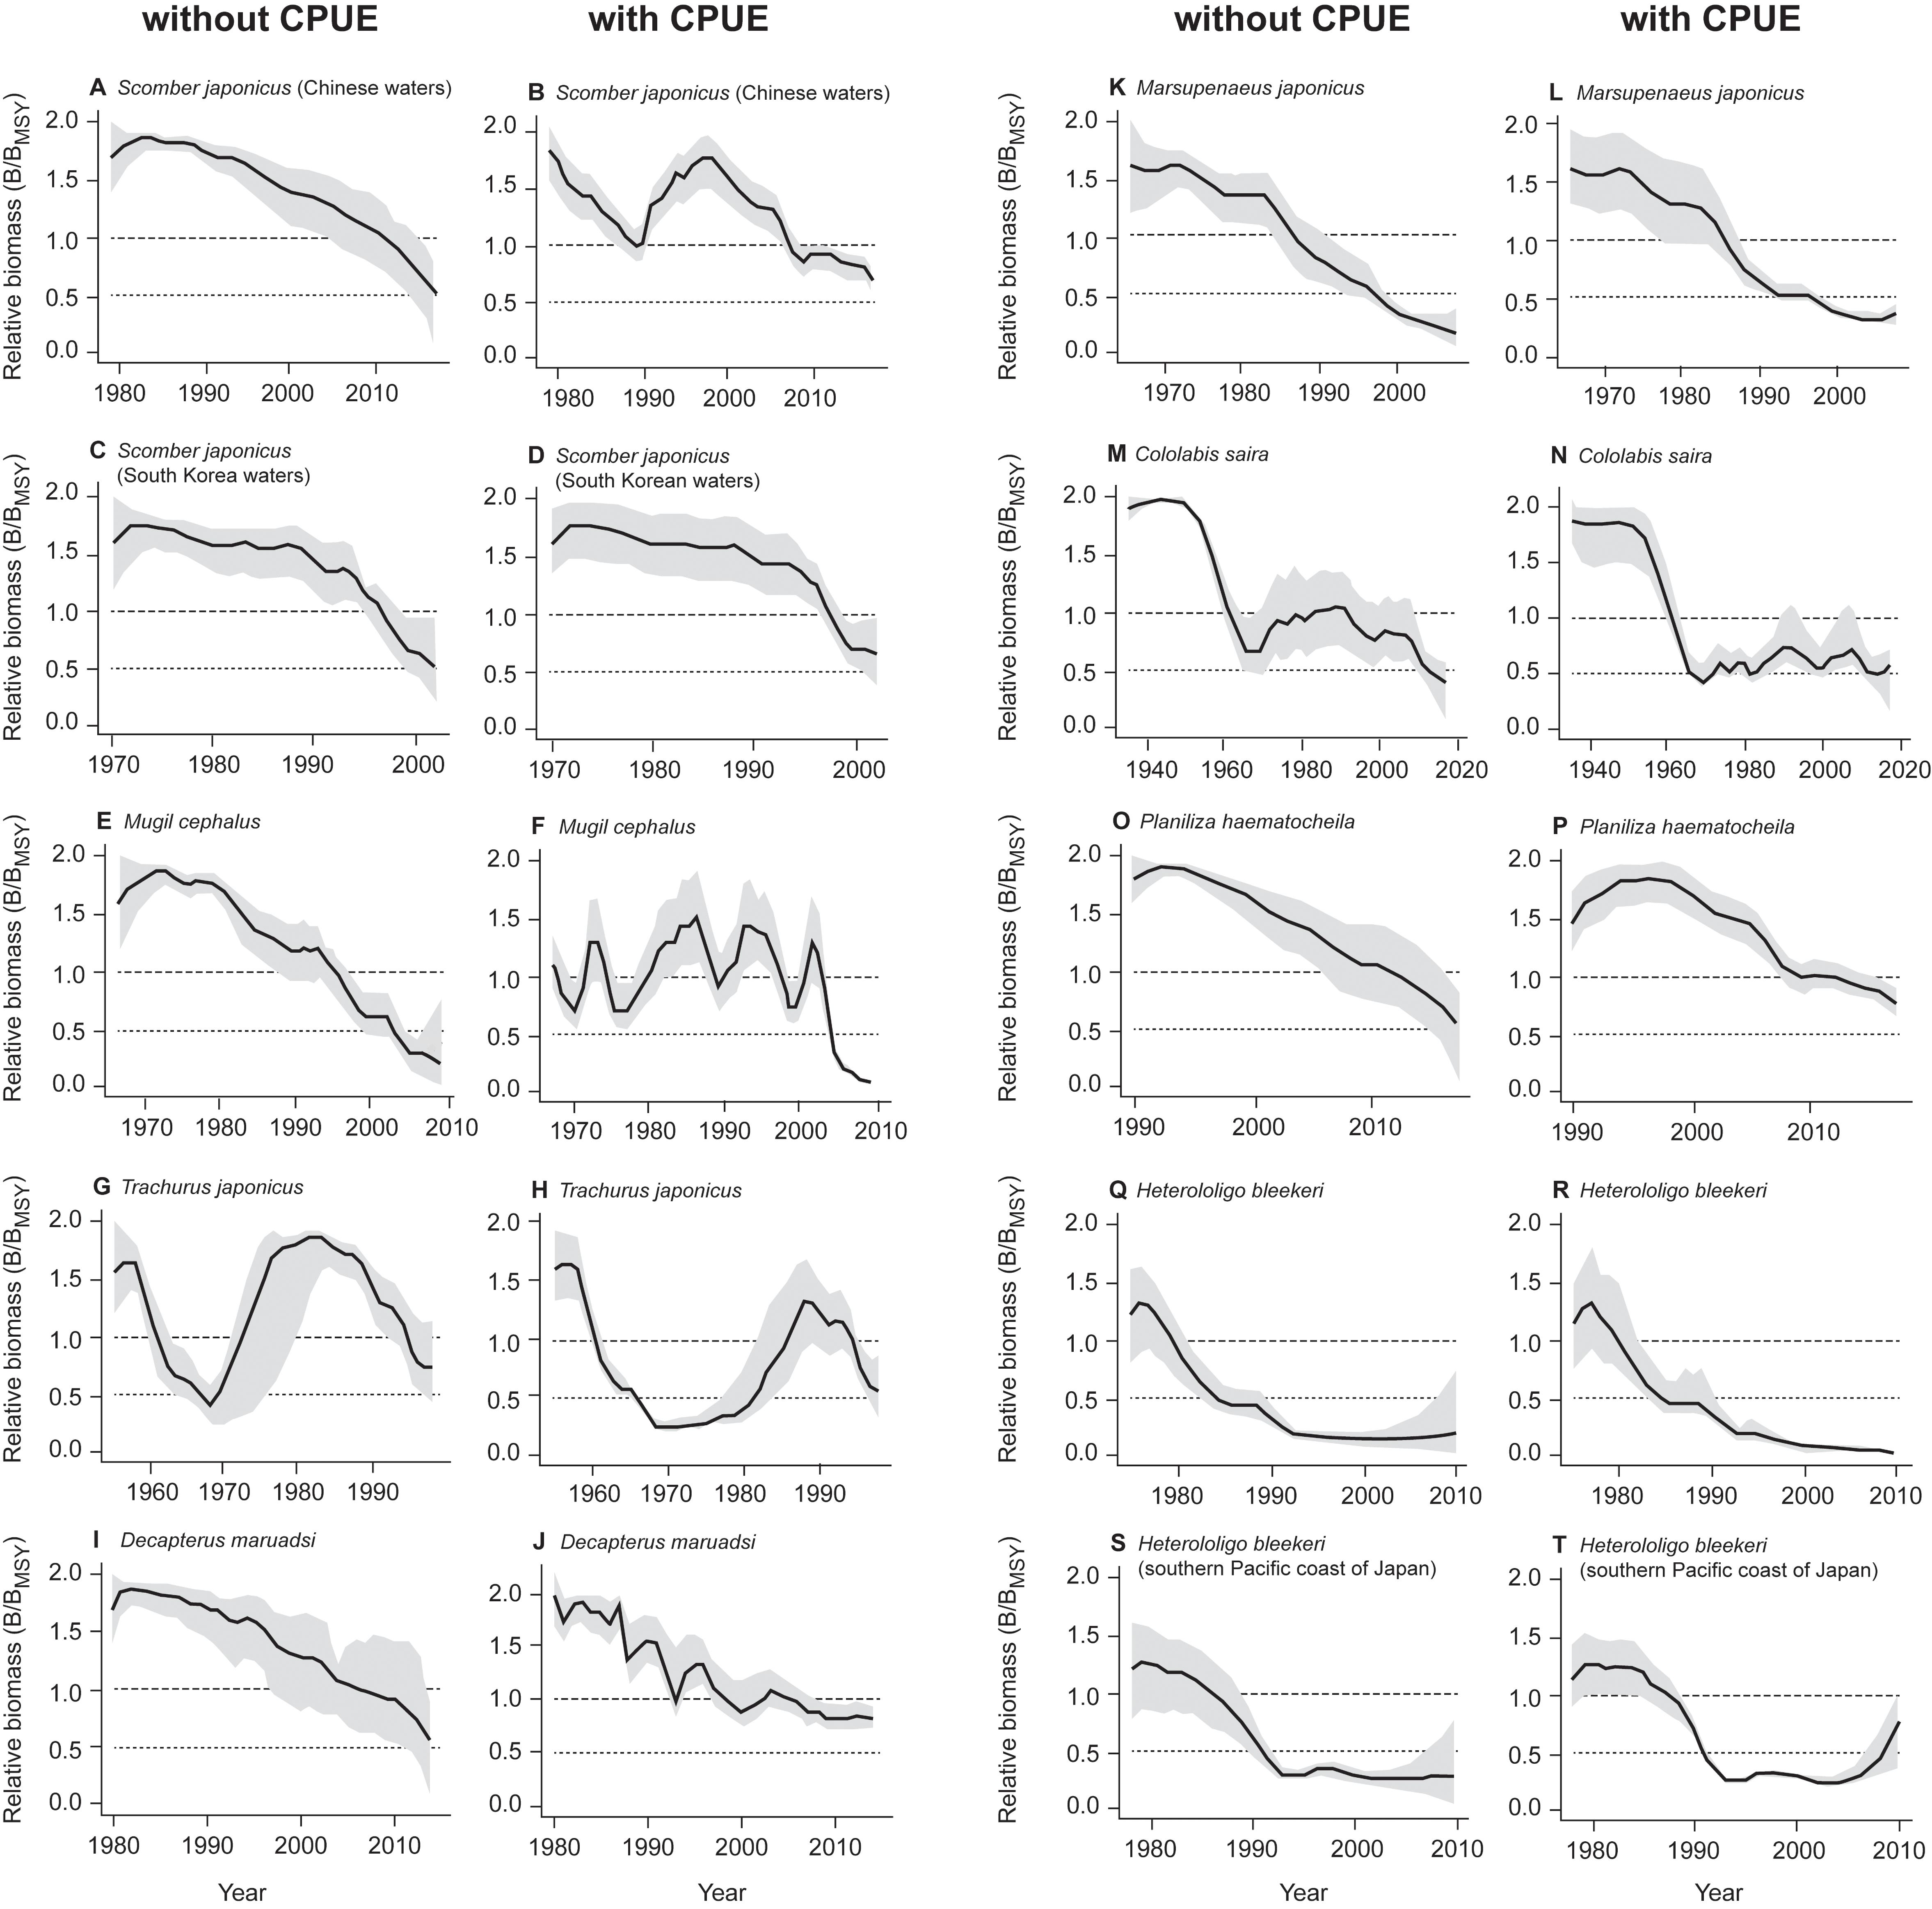
Figure 3. Comparison of relative biomass trends estimated using the CMSY method (without CPUE, left) and BSM (with CPUE, right) for 10 stocks, with the gray areas representing the 95% confidence intervals. Note the match between the pairs of panels, from (A) vs. (B) to (S) vs. (T).
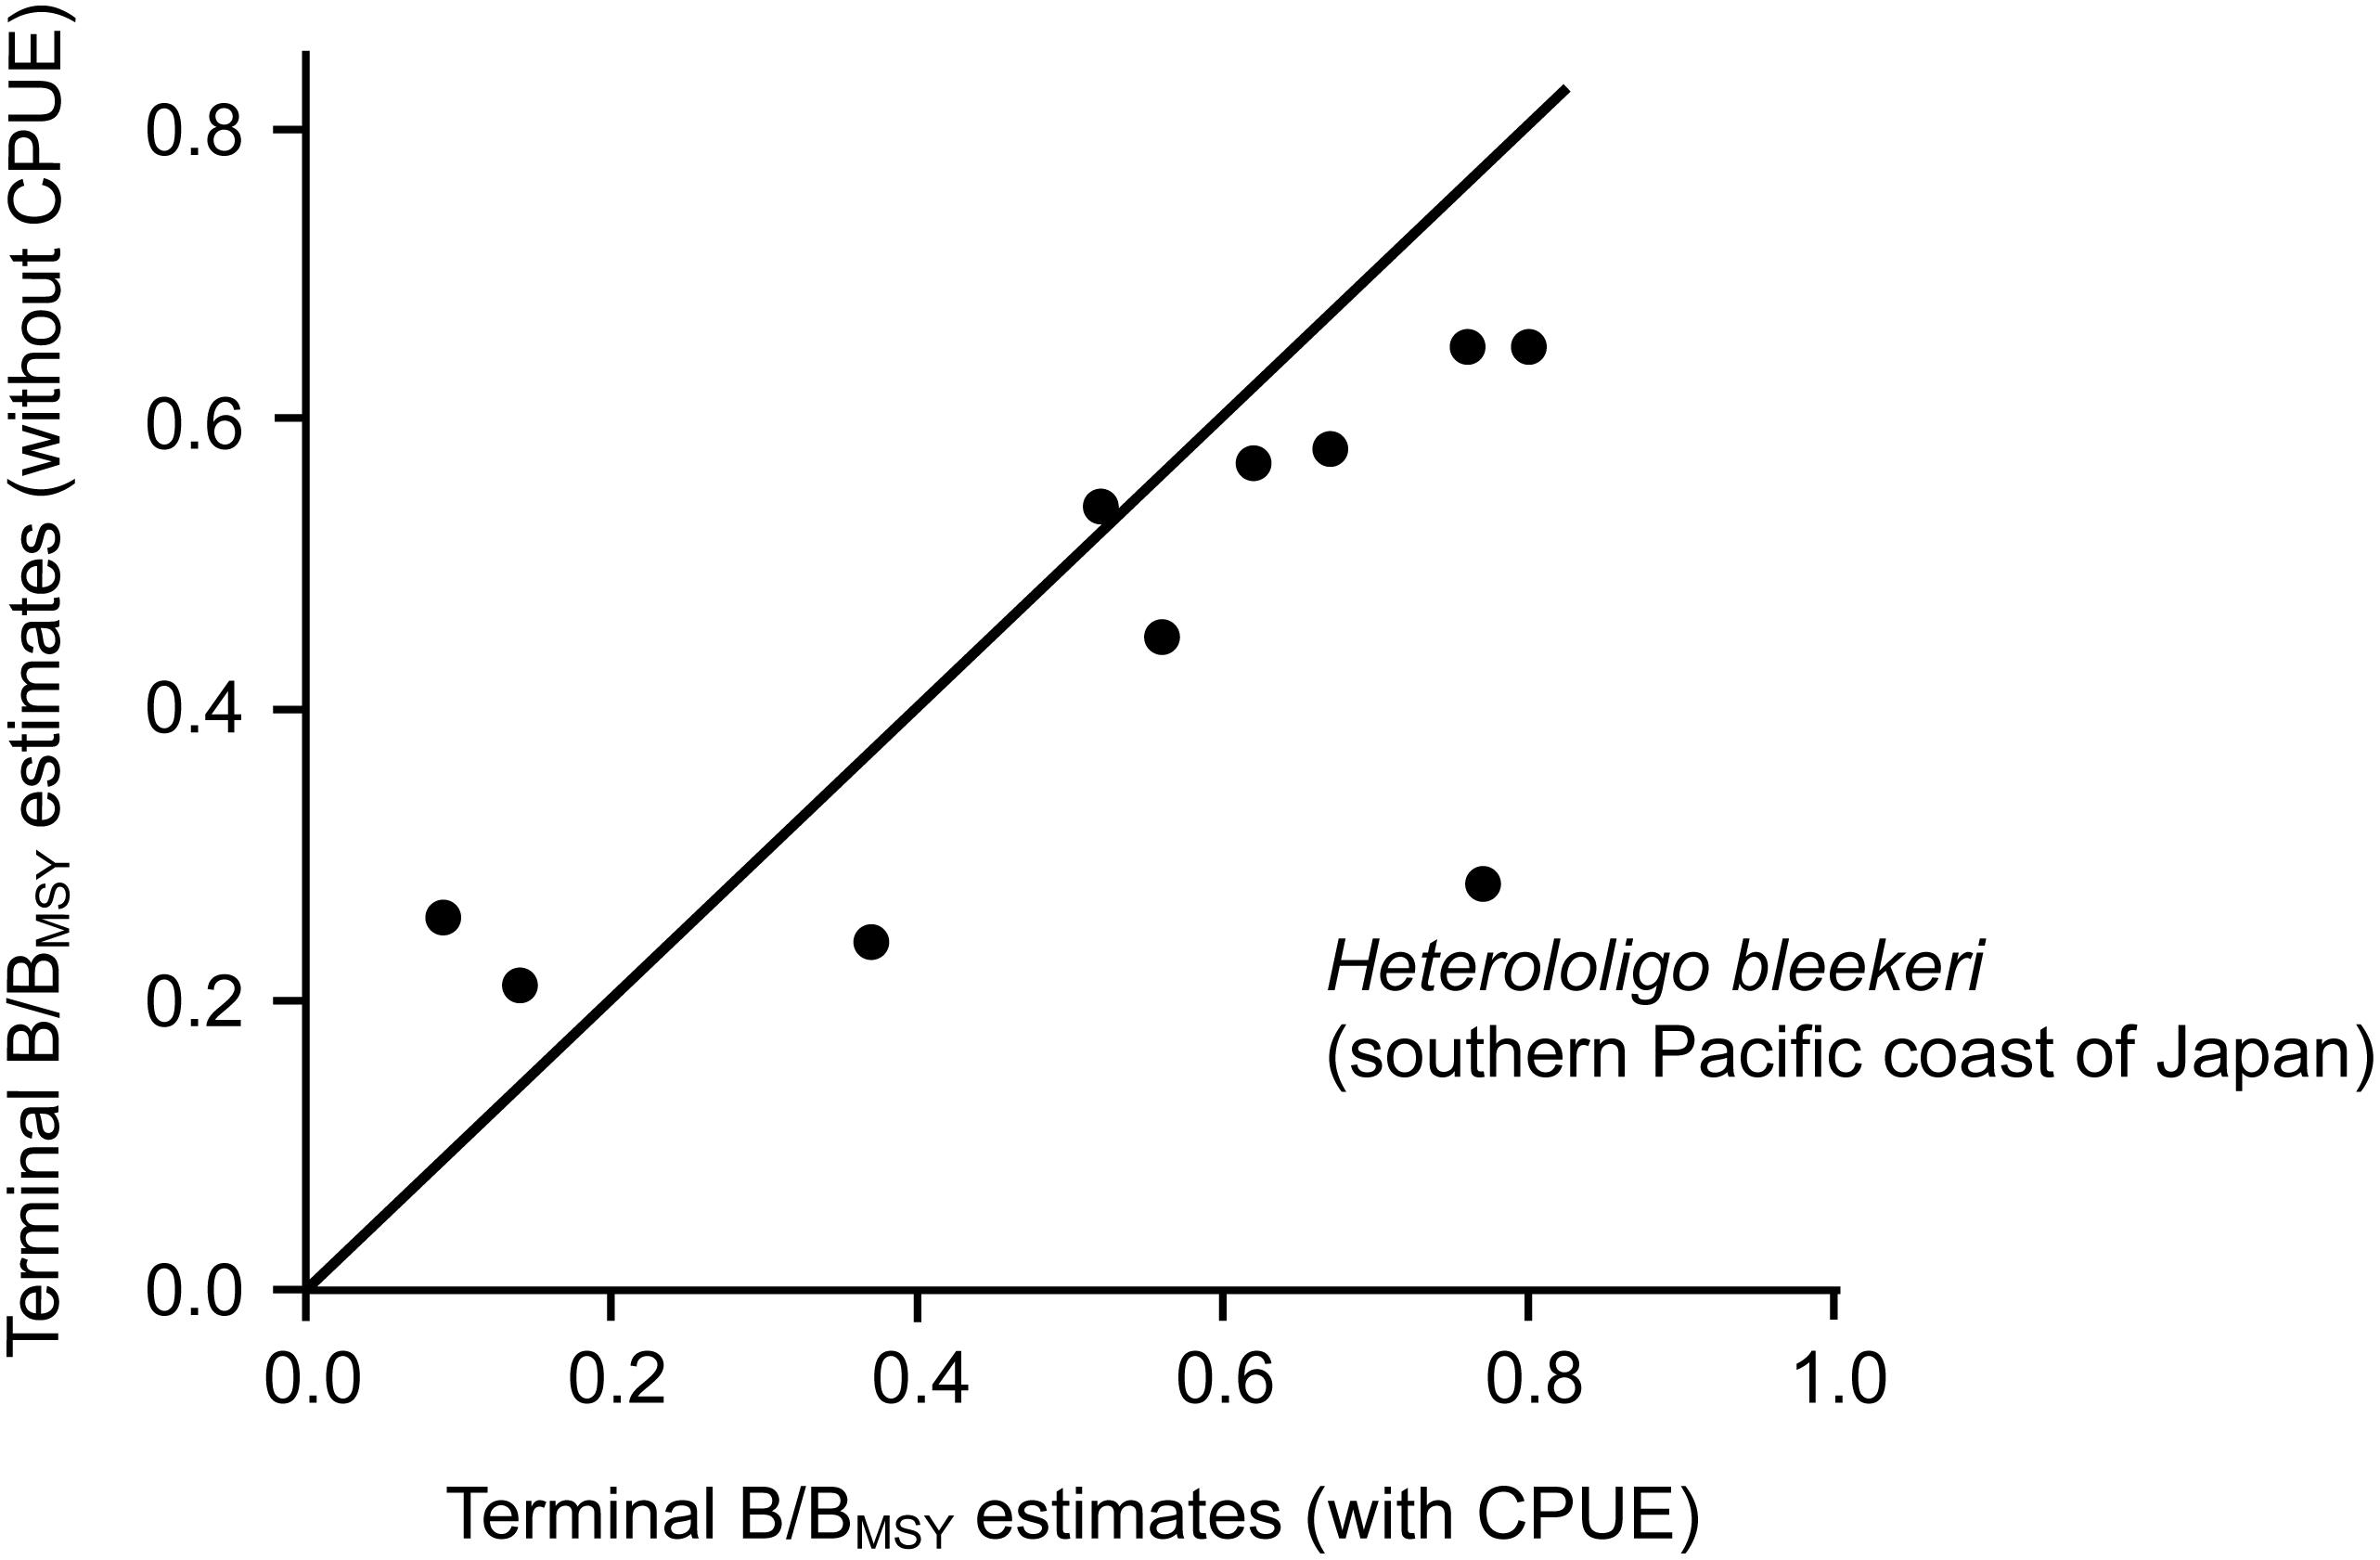
Figure 4. Terminal B/BMSY estimates of 10 stocks without (CMSY) and with (BSM) CPUE data added to the analysis.
Based on B/BMSY in the final year of a time series, stock status for 15 populations can be defined (Table 5). Among the 15 populations in question, 2 populations have collapsed, 3 populations are grossly over-fished and 9 populations are overfished (Table 6). Figure 5 shows that our results were very similar to the estimates from detailed stock assessments.
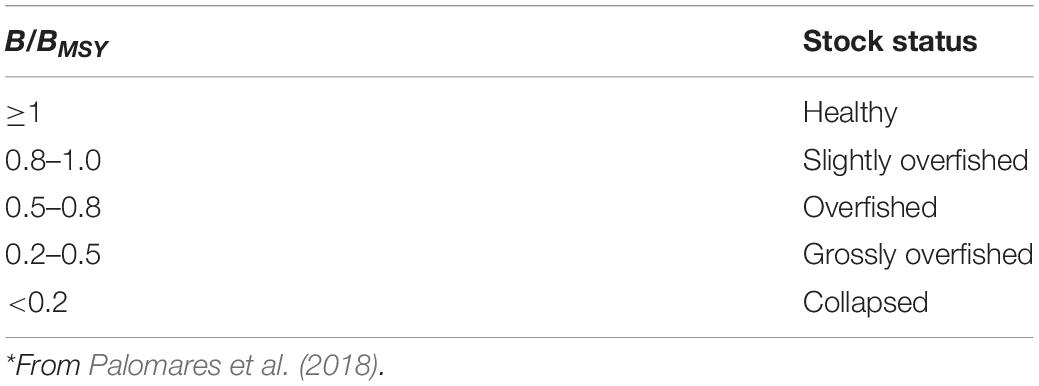
Table 5. Definition of fish stock status, based on B/BMSY in the final year of a time series*.
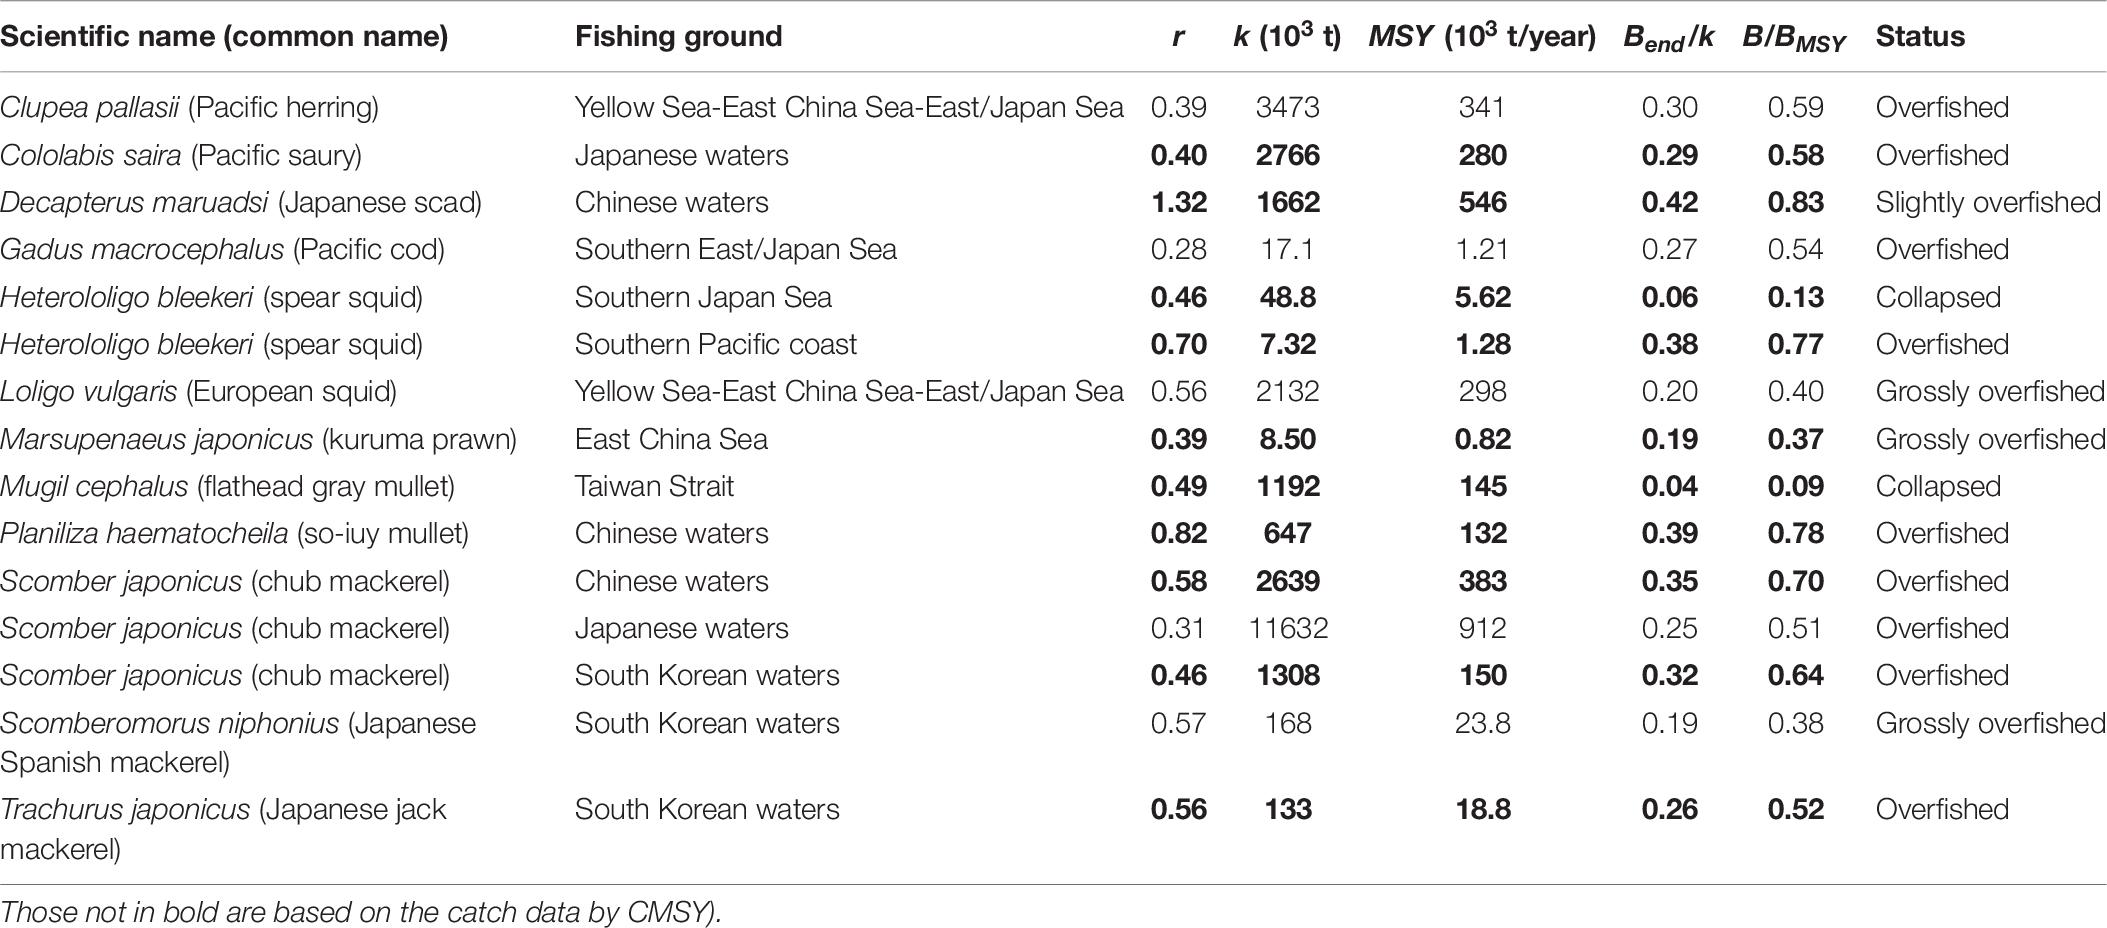
Table 6. Estimates of r, k, MSY, relative biomass and status as obtained by CMSY and/or BSM method for 15 stocks (the results in bold are based on the BSM method, i.e., catch and abundance data.
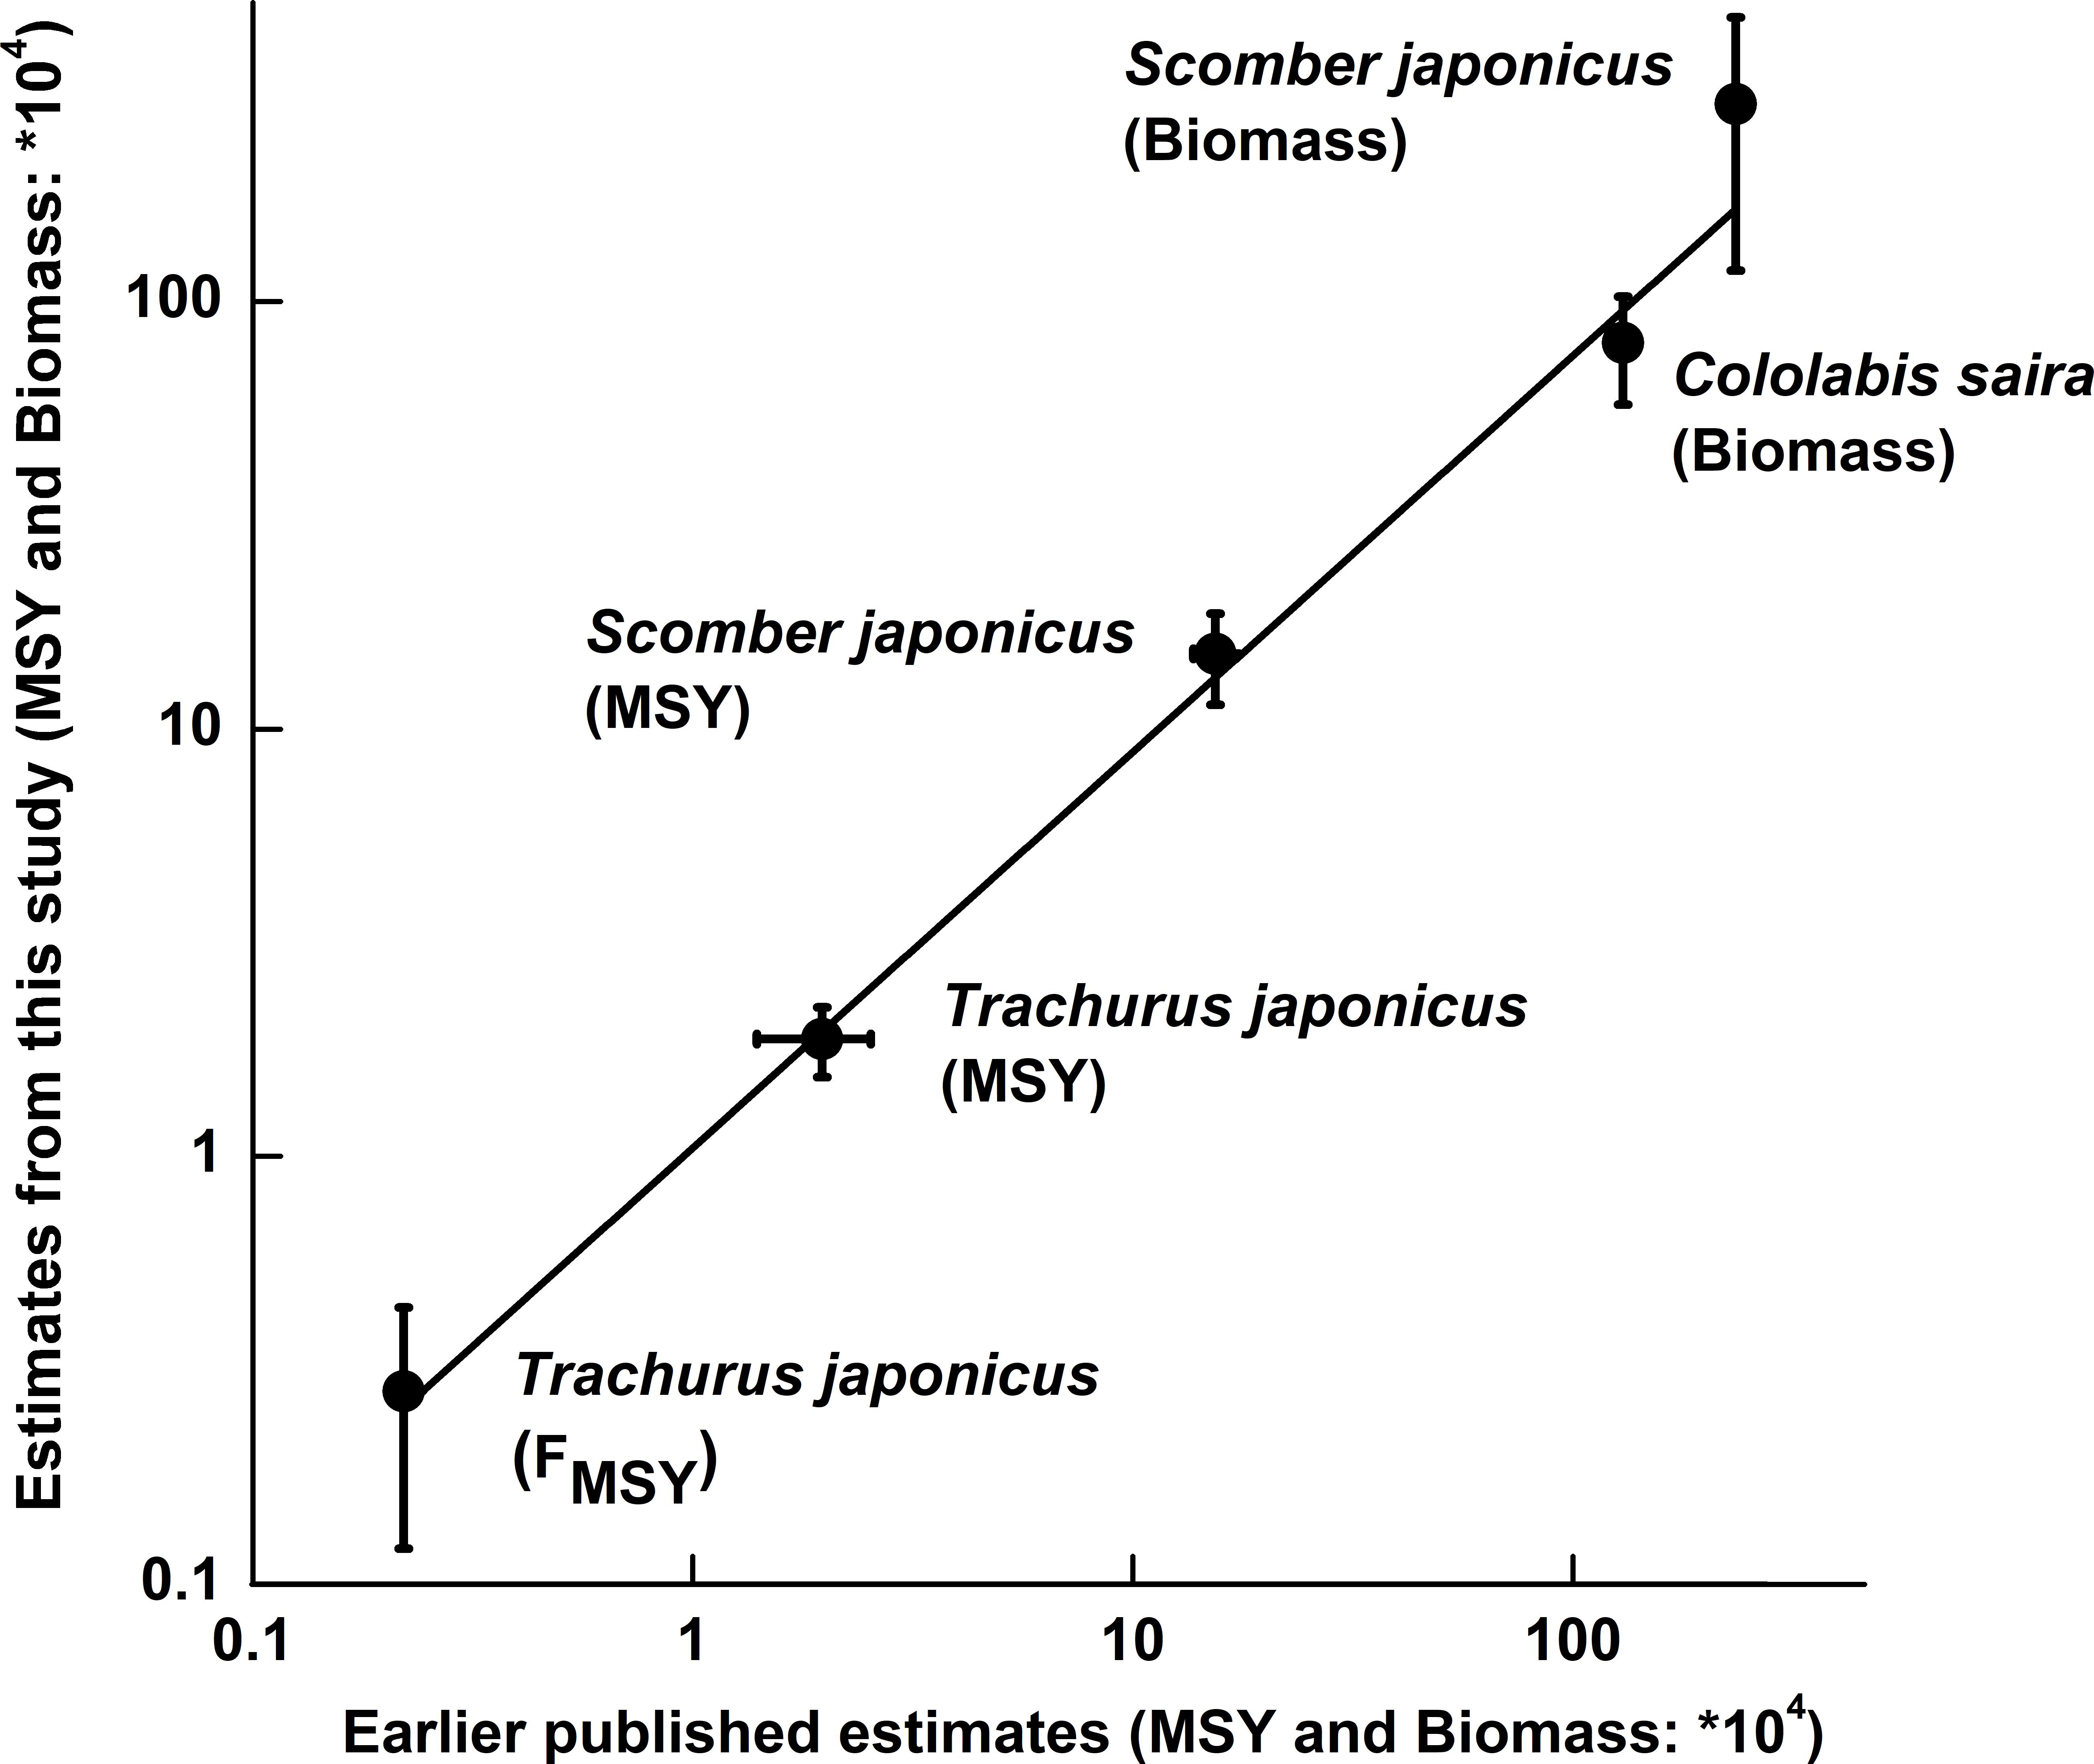
Figure 5. Plot of estimates obtained with the CMSY and BSM methods vs. the corresponding values estimated using other models [T. japonicus from Zhang and Lee (2001); S. japonicus from Choi et al. (2004) and Yatsu (2019); Cololabis saira from Yatsu (2019)]. The vertical bars refer to the confidence intervals of the CMSY and BSM results, while the two horizontal bars express ranges whose mid-ranges were used as point estimates.
Figure 6 shows the results of the sensitivity analyses performed for 3 of 15 populations in question, i.e., Pacific cod Gadus macrocephalus, Japanese jack mackerel Trachurus japonicus and chub mackerel Scomber japonicus, to explore the robustness of our assessment to both bias and mis-specified priors. Herein, each stock was assessed with priors (r, Bstart/k, Bend/k) that were less and more stringent (as defined in Tables 2–4; see also Supplementary Table S3).
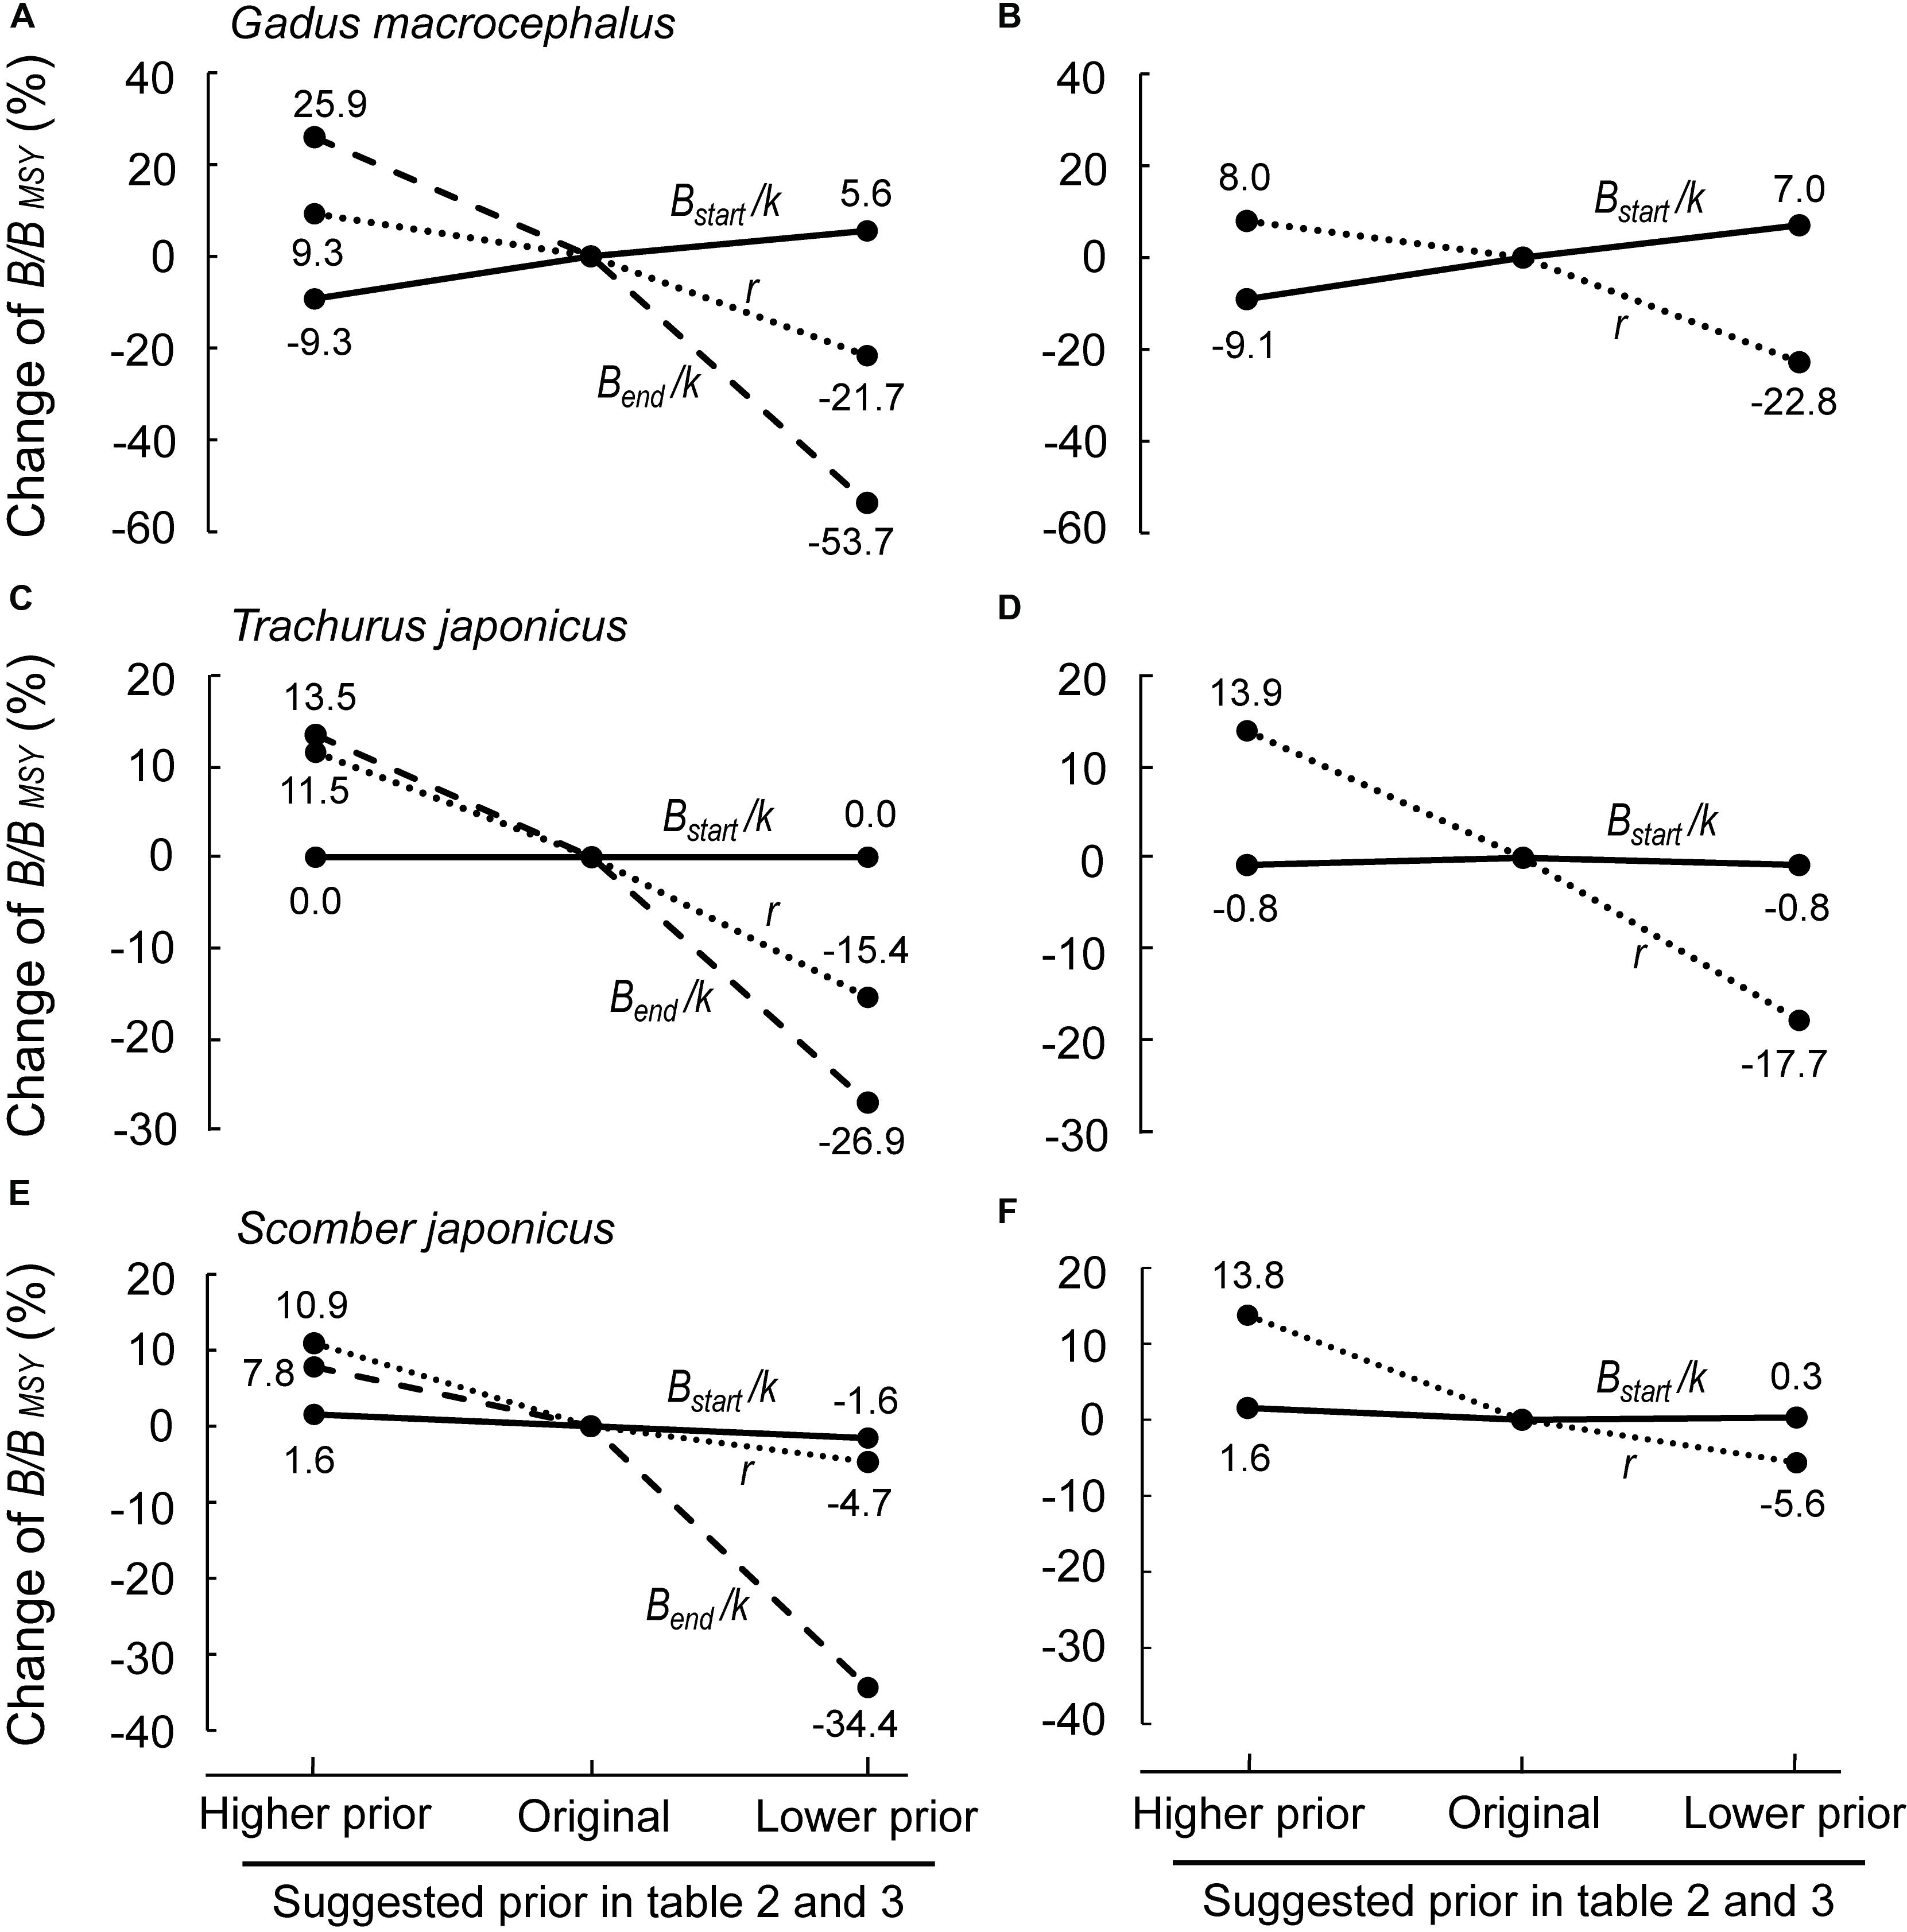
Figure 6. Sensitivity of B/BMSY to changes of the priors (r, Bstart/k and Bend/k) in Pacific cod (Gadus macrocephalus), Japanese jack mackerel (Trachurus japonicus) and chub mackerel (Scomber japonicus). (A,C,E) Effects of changing any of the 3 prior ranges (r, Bstart/k and Bend/k); (B,D,F) effect of changing r and Bstart/k, while setting Bend/k as “Not Available”; this produces virtually the same results as in (A,C,E) (see text).
Among three parameters, Bstart/k, Bend/k and r, Bend/k was the one with the largest effect on the results (Figure 6A), implying that a reliable prior of biomass range relative to unexploited biomass at the end of the time series is important. However, if an independent estimate for Bend/k is not available, setting the prior for Bend/k as “Not Available” would result in an average bias of 4.84% compared with the original selection (Supplementary Table S3; see Supplementary Material), which means that it has less impact on estimates than a problematic prior. Meanwhile, as is shown in Figure 6, setting Bend/k as “Not Available” would not have much effect on selecting other priors (Figure 6 and Supplementary Table S3). Sensitivity analyses for all stocks would be needed for more comprehensive understanding of the effects of priors.
Discussion
China, South Korea, and Japan are all surrounded by productive oceans, which has allowed seafood to become an essential source of animal protein in these three countries (Kim, 2010). However, declines in most of these fishery resources have occurred, caused by intensive fishing pressure (Kang, 2006). Indeed, these declines threaten the supply of fishery products, in spite of restrains on some fishing operations, including gear limitations, fishing areas and seasons, mesh size restriction, etc., that were adopted by China, South Korea and Japan (Asada, 1973; Lee et al., 2006; Shen and Heino, 2014).
In the late 1990s, Japan and South Korea introduced fisheries management systems based on Total Allowable Catch (TAC) (Zhang and Lee, 2001; Matsuda et al., 2010; Tanoue, 2015), while China, suffering from severe decline of its coastal resources (Liang and Pauly, 2017a, b), is also seeking for ways to effectively manage and restore its inshore fisheries. TAC management systems and stock rebuilding require stock assessments to provide baselines for rebuilding efforts. While detailed stock assessments are uncommon through most of East Asia, due to limited data and expertise, this shortfall is most severe in China (Zhang et al., 2017; Liu Z. et al., 2019).
However, the recent development of computer-intensive methods such as CMSY and BSM (Froese et al., 2017), which rely mainly on catch and relative abundance data, offers a window into the dynamics of exploited stocks. This contribution, which applied the CMSY and BSM methods to 15 commercially exploited populations in China, South Korea and Japan, led to a consistent signal being obtained, suggesting that all 15 populations studied here were depleted by similarly intensive fishing activities. We also find that the results overall match what is known of the exploitation of the populations in question.
Thus, in China, chub mackerel Scomber japonicus is an important commercial species, reported as suffering from a high exploitation rate since the early 1970s (Cheng and Lin, 2004). Also, following on the decline of resources exploited by the bottom trawl fishery, the exploitation of pelagic Japanese scad Decapterus maruadsi has intensified (Zheng et al., 2003), while so-iuy mullet Planiliza haematocheila and gray mullet Mugil cephalus, two important species of the Mugilidae family, have biomasses reported to have declined in 2000s (Shi et al., 2010).
Similarly, in Japan, spear squid Heterololigo bleekeri, widely distributed in coastal waters, have been overexploited to near collapse (Tian, 2009), while the recent decline of kuruma prawn Marsupenaeus japonicus catches suggest a much decreased stock size (Hamasaki and Kitada, 2013). Also, pelagic trawling surveys showed that the biomass of Pacific saury Cololabis saira around the Japanese Archipelago decreased from 5.0 million tons in 2003 to 1.8 million tons in 2016 (Yatsu, 2019), while the biomass of Scomber japonicus decreased from a high level during the 1970s to the end of the 1990s, then remained at a low level thereafter (Yatsu, 2019).
Finally, in South Korean waters, detailed stock assessments using the same catch and CPUE series as analyzed here, led to estimates of MSY in Scomber japonicus of 1.71 × 10⁵ t for the Schaefer model and 1.37 × 10⁵ t for the Fox model (Choi et al., 2004), which neatly bracket our estimates of 1.50 × 10⁵ t, as estimated by BSM method (Table 6 and Figure 5). Similarity, the results of Japanese jack mackerel Trachurus japonicus produced by the BSM method also fits well with that generated by a more data-demanding stock assessment model (Zhang and Lee, 2001).
Thus, the results from Figure 3 are confirmed by the stock assessment literature from China, Japan and South Korea. Also, except for spear squid Heterololigo bleekeri in the southern Pacific coast of Japan, while the biomass trajectories in the left panels of Figure 3, as obtained without CPUE data, differ somewhat from those in the right panels, which also have narrower confidence intervals, they do not differ systematically in the feature that is most important to fisheries managers, i.e., in their estimates of terminal B/BMSY (see also Figure 4).
This, we assume, is basically due to the fact that variations in catches, especially in fully exploited stocks, generally reflect the variations of the underlying biomasses (Kleisner et al., 2013; Pauly et al., 2013). This means that, while it is preferable to use CPUE data in conjunction with the CMSY method, their absence can be compensated, at least in part, by applying priors derived from expert knowledge on the status of fisheries. For the stock of spear squid Heterololigo bleekeri in the southern Pacific coast of Japan, its catch and CPUE time series trends diverged after 2005 (Tian et al., 2013; see also Supplementary Table S2), which resulted in mismatch results estimated by CMSY and BSM methods (Figures 3, 4).
CMSY and BSM methods rely largely on reliable catch time series. Problematic catch data, such as reflecting regime shifts or pertaining to a species of which a large fraction is discarded, would lead to biased parameter estimates, thus should not be assessed using CMSY and BSM methods. Meanwhile, the result of sensitivity analysis revealed that Bend/k has the biggest effect on the outcome of B/BMSY. When a biased estimate of Bend/k is used in the assessment, the methods might perform poorly.
In our contribution, we applied CMSY and BSM methods to 15 stocks, most of which were not assessed previously, especially for stocks in Chinese coastal waters. Our results provide preliminary fisheries reference points for these stocks, which can be used in fisheries management. Our results demonstrate that generally, the CMSY and BSM is adequate for assessing stocks in China and other countries where fisheries management has been hampered by a lack of suitable methods and/or detailed data.
Conclusion
The problem of overexploitation of fisheries has been well documented globally. This makes stock assessment methods relying mainly on catch data (such as the CMSY and BSM methods), more reliable than if stocks were lightly fished, as for overexploited fisheries, variations in catches generally reflect the variations of the underlying biomasses.
However, if the CMSY and BSM methods are to be widely used, reliable and long catch time series must be available; such time series are generally lacking from Chinese waters. Notably, China’s official fishery statistics, i.e., Chinese Fishery Statistical Yearbook, lists catches for only a few major commercial species. Thus, a massive improvement of China’s catch statistics will be required, to allow assessing and monitoring the success of management efforts.
Data Availability Statement
All datasets generated for this study are included in the article/Supplementary Material.
Author Contributions
CL and WX was responsible for the data collection, formal analysis, and writing original draft. DP was responsible for the conceptualization, methodology, reviewing, and editing the manuscript. All authors contributed to the manuscript and approved the submitted version.
Funding
CL and WX acknowledge financial support from the Creative Team Project of the Laboratory for Marine Ecology and Environmental Science, Qingdao National Laboratory for Marine Science and Technology (LMEES-CTSP-2018-1), National Natural Science Foundation of China (No. 31872568), NSFC-Shandong Joint Fund for Marine Ecology and Environmental Sciences (U1606404), Open Fund of CAS Key Laboratory of Marine Ecology and Environmental Sciences, Institute of Oceanology, Chinese Academy of Sciences (KLMEES202004), and Qingdao Postdoctoral Applied Research Project. DP acknowledges support from the Sea Around Us, funded by the Oak Foundation, the Marisla Foundation, the Paul M. Angell Family Foundation, the David and Lucile Packard Foundation, the Minderoo Foundation, and the Bloomberg Philanthropies through RARE.
Conflict of Interest
The authors declare that the research was conducted in the absence of any commercial or financial relationships that could be construed as a potential conflict of interest.
Acknowledgments
We thank Dr. M. L. Palomares and Dr. R. Froese for their comments on our results. We are also grateful to Evelyn Liu for redrawing our figures.
Supplementary Material
The Supplementary Material for this article can be found online at: https://www.frontiersin.org/articles/10.3389/fmars.2020.00623/full#supplementary-material
Footnotes
References
Anticamara, J. A., Watson, R., Gelchu, A., and Pauly, D. (2011). Global fishing effort (1950-2010): trends, gaps, and implications. Fish. Res. 107, 131–136. doi: 10.1016/j.fishres.2010.10.016
Asada, Y. (1973). License limitation regulations: the Japanese system. J. Fish. Board Can. 30, 2085–2095. doi: 10.1139/f73-335
Cheng, J., and Lin, L. (2004). Study on the biological characteristics ans status of commom mackerel (Scomber japonicus Houttuyn) fishery in the East China Sea region. Mar. Fish. 26, 73–78.
Choi, Y. M., Zhang, C. I., Lee, J. B., Kim, J. Y., and Cha, H. K. (2004). Stock assessment and management implications of chub mackerel, Scomber japonicus in Korean waters. J. Korean. Soc. Fish. Res. 6, 90–100.
Chung, S., Kim, S., and Kang, S. (2013). Ecological relationship between environmental factors and Pacific cod (Gadus macrocephalus) catch in the southern East/Japan Sea. Anim. Cells Syst. 17, 374–382. doi: 10.1080/19768354.2013.853693
Engelhard, G. H. (2016). “On the need to study fishing power change: challenges and perspectives,” in Perspectives on Oceans Past, eds K. Schwerdtner-Maáñez and B. Poulsen (Dordrecht: Springer), 89–101. doi: 10.1007/978-94-017-7496-3_6
FAO (2018). The State of World Fisheries and Aquaculture 2018-Meeting the Sustainable Development Goals. Rome: FAO.
Fisheries and Fishery Administration of the Ministry of Agriculture [FFAMA] (1979–2017). China Fishery Statistical Yearbook. Beijing: Agricultural Press of China.
Froese, R., Demirel, N., Coro, G., Kleisner, K. M., and Winker, H. (2017). Estimating fisheries reference points from catch and resilience. Fish Fish. 18, 506–526. doi: 10.1111/faf.12190
Froese, R., Zeller, D., Kleisner, K., and Pauly, D. (2012). What catch data can tell us about the status of global fisheries. Mar. Biol. 159, 1283–1292. doi: 10.1007/s00227-012-1909-6
Geng, Z., Zhu, J., Xia, M., and Li, Y. (2018). Research progress in fishery stock asse- ssment using data-poor/limited methods. Trans. Oceanol. Limnol. 5, 130–137.
Gong, Y., Jeong, H. D., Suh, Y. S., Park, J. H., Seong, K. T., Kim, S. W., et al. (2007). Fluctuations of pelagic fish populations in relation to the climate shifts in the Far-East regions. J. Ecol. Environ. 30, 23–38. doi: 10.5141/jefb.2007.30.1.023
Hamasaki, K., and Kitada, S. (2013). Catch fluctuation of Kuruma prawn, Penaeus japonicus in Japan relative to ocean climate variability and a stock enhancement program. Rev. Fish. Sci. 21, 454–468. doi: 10.1080/10641262.2013.800781
Kang, B., Liu, M., Huang, X., Li, J., Yan, Y., Han, C., et al. (2018). Fisheries in Chinese seas: what can we learn from controversial official fisheries statistics? Rev. Fish Biol. Fish. 28, 503–519. doi: 10.1007/s11160-018-9518-1
Kang, J. S. (2006). Analysis on the development trends of capture fisheries in North-East Asia and the policy and management implications for regional co-operation. Ocean Coast. Manag. 49, 42–67. doi: 10.1016/j.ocecoaman.2005.10.002
Kim, S. (2010). Fisheries development in northeastern Asia in conjunction with changes in climate and social systems. Mar. Policy 34, 803–809. doi: 10.1016/j.marpol.2010.01.028
Kleisner, K., Zeller, D., Froese, R., and Pauly, D. (2013). Using global catch data for inferences on the world’s marine fisheries. Fish Fish. 14, 293–311. doi: 10.1111/j.1467-2979.2012.00469.x
Lam, V. W., and Pauly, D. (2019). Status of fisheries in 13 Asian large marine ecosystems. Deep Sea Res. Part II Top. Stud. Oceanogr. 163, 57–64. doi: 10.1016/j.dsr2.2018.09.002
Lan, K., Lee, M., Zhang, C. I., Wang, P., Wu, L., and Lee, K. (2014). Effects of climate variability and climate change on the fishing conditions for grey mullet (Mugil cephalus L.) in the Taiwan Strait. Clim. Change 127, 577–578. doi: 10.1007/s10584-014-1208-y
Lee, K. N., Gates, J. M., and Lee, J. B. (2006). Recent developments in Korean fisheries management. Ocean Coast. Manag. 49, 355–366. doi: 10.1016/j.ocecoaman.2006.03.002
Lee, S., Kim, B., and Chang, D. (2011). Long-term variation in catch of Spanish mackerel (Scomberomorus niphonius) related to environmental change in Korean waters. J. Kor. Soc. Fish. Tech. 47, 99–107. doi: 10.3796/KSFT.2011.47.2.099
Liang, C., and Pauly, D. (2017a). Fisheries impacts on China’s coastal ecosystems: unmasking a pervasive ‘fishing down’effect. PLoS One 12:e0173296. doi: 10.1371/journal.pone.0173296
Liang, C., and Pauly, D. (2017b). Growth and mortality of exploited fishes in China’s coastal seas and their uses for yield-per-recruit analyses. J. Appl. Ichthyol. 33, 746–756. doi: 10.1111/jai.13379
Liu, S., Liu, Y., Fu, C., Yan, L., Xu, L., Wan, R., et al. (2019). Using novel spawning ground indices to analyze the effects of climate change on Pacific saury abundance. J. Mar. Syst. 191, 13–23. doi: 10.1016/j.jmarsys.2018.12.007
Liu, Z., Yuan, X., Yang, L., Yan, L., and Cheng, J. (2019). Stock assessment and management strategies for small yellow croaker in the East China Sea based on data-limited assessment models. J. Fish. Sci. China 26, 621–635.
Ma, S., Cheng, J., Li, J., Liu, Y., Wan, R., and Tian, Y. (2019). Interannual to decadal variability in the catches of small pelagic fishes from China Seas and its responses to climatic regime shifts. Deep Sea Res. Part II 159, 112–129. doi: 10.1016/j.dsr2.2018.10.005
Matsuda, H., Makino, M., Tomiyama, M., Gelcich, S., and Castilla, J. C. (2010). Fishery management in Japan. Ecol. Res. 25, 899–907.
Myers, R. A., Barrowman, N. J., Hutchings, J. A., and Rosenberg, A. A. (1995). Population dynamics of exploited fish stocks at low population levels. Science 269, 1106–1108. doi: 10.1126/science.269.5227.1106
Palomares, M. L. D., Froese, R., Derrick, B., Nöel, S.-L., Tsui, G., Woroniak, J., et al. (2018). “A preliminary global assessment of the status of exploited marine fish and invertebrate populations,” A Report Prepared By The Sea Around US For OCEANA (Washington, DC: OCEANA).
Palomares, M. L. D., and Pauly, D. (2019). On the creeping increase of vessels’ fishing power. Ecol. Soc. 24:31.
Pauly, D., Hilborn, R., and Branch, T. A. (2013). Does catch reflect abundance? Yes, it is a crucial signal. Nature 494, 303–306. doi: 10.1038/494303a
Pauly, D., and Zeller, D. (2016). Catch reconstructions reveal that global marine fisheries catches are higher than reported and declining. Nat. Commun. 7:10244.
Pauly, D., and Zeller, D. (2019). Agreeing with FAO: comments on SOFIA 2018. Mar. Policy 100, 332–333. doi: 10.1016/j.marpol.2018.12.009
Schaefer, M. B. (1954). Some aspects of the dynamics of populations important to the management of the commercial marine fisheries. Inter Am. Trop. Tuna Comm. Bull. 1, 23–56.
Schaefer, M. B. (1957). A study of the dynamics of the fishery for yellowfin tuna in the eastern tropical Pacific Ocean. Inter Am. Trop. Tuna Comm. Bull. 2, 243–285.
Shen, G., and Heino, M. (2014). An overview of marine fisheries management in China. Mar. Policy 44, 265–272. doi: 10.1016/j.marpol.2013.09.012
Shi, Z. H., Peng, S. M., and Hou, J. L. (2010). The prospects of resources exploitation and ecological culture of Mugilidae in China. Prog. Fish. Sci. 31, 120–125.
Tanoue, W. (2015). Japan’s Total Aowable Catch Systems In Fishery Resource Management. Washington, DC: University of Washington.
Tian, Y. (2009). Interannual-interdecadal variations of spear squid Loligo bleekeri abundance in the southwestern Japan Sea during 1975-2006: impact of the trawl fishing and recommendations for management under the different climate regimes. Fish. Res. 100, 78–85. doi: 10.1016/j.fishres.2009.06.005
Tian, Y., Nashida, K., and Sakaji, H. (2013). Synchrony in the abundance trend of spear squid Loligo bleekeri in the Japan Sea and the Pacific Ocean with special reference to the latitudinal differences in response to the climate regime shift. ICES J. Mar. Sci. 70, 968–979. doi: 10.1093/icesjms/fst015
Watson, R., Cheung, W. W. L., Anticamara, J., Sumaila, U. R., Zeller, D., and Pauly, D. (2013). Global marine yield halved as fishing intensity redoubles. Fish Fish. 14, 493–503. doi: 10.1111/j.1467-2979.2012.00483.x
Yatsu, A. (2019). Review of population dynamics and management of small pelagic fishes around the Japanese Archipelago. Fish Fish. 85, 611–639. doi: 10.1007/s12562-019-01305-3
Zhang, C. I., and Lee, J. B. (2001). Stock assessment and management implications of horse mackerel (Trachurus japonicus) in Korean waters, based on the relationships between recruitment and the ocean environment. Prog. Oceanogr. 49, 513–537. doi: 10.1016/s0079-6611(01)00038-6
Zhang, K., Liao, B., Xu, Y., Zhang, J., Sun, M., Qiu, Y., et al. (2017). Assessment for allowable catch of fishery resources in the South China Sea based on statistical data. Haiyang XueBao 39, 25–33.
Keywords: data-sparse stock, North-East Asia, CMSY, BSM, stock assessment
Citation: Liang C, Xian W and Pauly D (2020) Assessments of 15 Exploited Fish Stocks in Chinese, South Korean and Japanese Waters Using the CMSY and BSM Methods. Front. Mar. Sci. 7:623. doi: 10.3389/fmars.2020.00623
Received: 25 September 2019; Accepted: 08 July 2020;
Published: 29 July 2020.
Edited by:
Liping Liu, Shanghai Ocean University, ChinaReviewed by:
Jason Marc Cope, National Marine Fisheries Service (NOAA), United StatesYajie Liu, UiT The Arctic University of Norway, Norway
Copyright © 2020 Liang, Xian and Pauly. This is an open-access article distributed under the terms of the Creative Commons Attribution License (CC BY). The use, distribution or reproduction in other forums is permitted, provided the original author(s) and the copyright owner(s) are credited and that the original publication in this journal is cited, in accordance with accepted academic practice. No use, distribution or reproduction is permitted which does not comply with these terms.
*Correspondence: Cui Liang, liangc@qdio.ac.cn; Weiwei Xian, wwxian@qdio.ac.cn; Daniel Pauly, d.pauly@oceans.ubc.ca