Stronger Together: Do Coral Reefs Enhance Seagrass Meadows “Blue Carbon” Potential?
 Luis Alberto Guerra-Vargas
 Lucy Gwen Gillis
 José Ernesto Mancera-Pineda
- 1Área Curricular de Medio Ambiente, Facultad de Minas, Universidad Nacional de Colombia, Medellín, Colombia
- 2Department of Ecology, Leibniz-Zentrum für Marine Tropenforschung (ZMT), Bremen, Germany
- 3Departamento de Biología, Facultad de Ciencias, Universidad Nacional de Colombia, Bogotá, Colombia
Seagrass meadows are important for carbon storage, this carbon is known as “blue carbon” and represents a vital ecosystem service. Recently there has been growing interest in connectivity between ecosystems and the potential for connected ecosystems to facilitative ecosystem services. Tropical seagrass meadows are connected to coral reefs, as the reef barrier dissipates waves, which facilitates sediment accumulation and avoid erosion and export. Therefore, coral reefs might enhance the seagrass meadows capacity as a blue carbon sink. We tested this hypothesis through an assessment of blue carbon across a gradient of connected seagrass meadow and coral reef sites. We assessed attributes of seagrass meadows along a transect in addition to classifying the sites as exposed and sheltered. Classification of sites was completed through analyzing wave crest density in photographs and using granulometric evenness index. Organic carbon and organic matter were measured in sediment core samples and within seagrass living biomass (both above and below ground). Lastly, we measured changes in above and below ground traits of seagrass plants across the same sites. Gaps in the reef barrier were linked to high wave disturbance and exposed conditions, whilst barrier continuity to low wave disturbance and sheltered conditions. Organic carbon in sediments was 144 Mg ha–1 in the most sheltered (with reef barrier) and 91 Mg ha–1 in the most exposed (without reef barrier) meadows. Sheltered conditions also showed a redistribution of seagrass biomass to a greater quantity of roots compared to rhizomes. Whilst in exposed conditions the opposite occurred, which could be due to increased rhizome biomass have to enhanced anchorage or greater nutrient availability. This study found that coral reefs facilitate blue carbon potential in seagrass meadows indicating that coral reefs support this important ecosystem service. Also, results suggest that loss of coral reef structure due to bleaching and other stressors will likely result in a reduction of the blue carbon storage capacity of adjacent seagrass meadow. Further research should investigate how combined global and regional stresses may impact on the potential for coral reefs to buffer seagrass meadows, and how these stresses affect the functional traits of seagrass plants.
Introduction
Seagrass meadows are dominated by ecosystems engineering plants. These ecosystems have among the highest carbon sequestration rates in the sediments across natural-systems and store organic carbon in their living biomass (Mcleod et al., 2011; Fourqurean et al., 2012a). Seagrass meadows are distributed worldwide across a wide range of geomorphic settings and high deviations of organic carbon stock are observed among regions. For example, in the western tropical Atlantic or the Great Caribbean region, seagrass meadows present different environmental settings, ranging from estuarine and continental coastal settings to oceanic and oligotrophic settings as observed in small and remote islands and atolls. Atolls generally have a connected seascape with contiguous seagrass meadows, coral reefs and mangrove forests (Bouillon and Connolly, 2009; Gillis et al., 2014a; Gullström et al., 2018). These differences in physical attributes alter the carbon stock potential of the seagrass meadows.
Organic carbon (Corg) is stored in seagrass plants in two carbon pools: aboveground (AG-) or belowground (BG-) biomass pools (Fourqurean et al., 2012a; Duarte et al., 2013). Carbon in the living biomass of seagrass plants is usually higher in the below ground compartments (rhizomes and roots) than in the above ground compartments (leaves) (Fourqurean et al., 2012a). Seagrass plants are plastic (Arellano-Méndez et al., 2011; McDonald et al., 2016; Barry et al., 2018) and their AG and BG biomass will vary depending on different environmental conditions, like hydrodynamics or nutrients availability. For example, the growth of seagrasses and, therefore, their ability to transform CO2 into organic carbon is conditioned by the availability of nutrients (Lee et al., 2007; Burkholder et al., 2007) and light (Alcoverro et al., 1995; Collier et al., 2007). An increase in nutrient availability enhance the increase in the ration AG/BG, favoring the sequestration of CO2 in the above ground biomass pool compared to below ground biomass (Lee and Dunton, 2000; Medina-Gómez et al., 2016). Research in seagrass meadows has shown that increased water flow decreases leaf length to reduce drag force (de los Santos et al., 2016), which would alter carbon stock in the AG. Changes in AG and BG biomass of seagrass plants not only alter organic carbon within the plant but can affect their ability to attenuate waves and enhance organic carbon retention function whilst reducing sediment bed erosion (Duarte et al., 2005, 2013). Seagrass are exposed to the effects of wave energy on their canopies and sediments (Koch et al., 2006). Wind waves generate orbits in seawater column that transmit energy from the sea surface to the bottom. These cause more friction and sediment transport on the sediment bottom in shallow meadows than in the deep meadows. Seagrass and sediments in shallower meadows would be more exposed to disturbance than deeper ones. Physical variables like sediment texture can be used to relate bottom hydrodynamics with sediment type (Paterson and Black, 1992; Wentworth, 1992). Allochthonous organic matter that accumulate in the sediments of seagrass meadows is an important source that contributes significantly to soil Corg stocks as has been demonstrated by Kennedy et al. (2010), using a carbon isotopic approach. The natural trapping capacity of seagrass meadows could be facilitated by the buffering capacity of connected coral reefs, which reduce hydrodynamics allowing for sediment deposition and sediment erosion prevention (Koch et al., 2006; Gillis et al., 2014b).
Coral reefs protect and mitigate effects of normal hydrodynamics (wind and waves) and storm conditions on seagrass meadows and the reef lagoon (Gillis et al., 2014a; Guannel et al., 2016). Sheltered conditions could enhance the particulate organic matter and sediment trapping effects by seagrass canopies, facilitating the storing of organic carbon in seagrass sediments (Gillis et al., 2014b; Guannel et al., 2016). Additionally, Corg in seagrass living biomass may be protected from hydrodynamic damage; therefore, seagrass material export may be reduced in comparison to high exposure conditions, which there is not a barrier coral reef (Folmer et al., 2012; Duarte et al., 2013; Guannel et al., 2016). There is a growing interest in connectivity between coral reefs and seagrass meadows as this connectivity is thought to enhance ecosystem services for the entire seascape (Saunders et al., 2014; Guannel et al., 2016; Gillis et al., 2017).
The blue carbon sink potential of seagrass meadows is considered one of their most important ecosystem services (Arias-Ortiz et al., 2018; Saderne et al., 2019) as this has the potential to mitigate global climate change (Fourqurean et al., 2012a; Serrano et al., 2019). Given that coral reefs in the tropics often occur adjacent to seagrass meadows, they may play an important role in enhancing seagrass blue carbon potential. But there is little understanding of the interactions between reef barrier continuity, their attenuation of waves and organic carbon stock of seagrass meadows. Gaps and openings in a reef barrier are common in reef lagoons in the Caribbean. It is important to quantify the potential of Corg sequestration in associated seagrass meadows and sediments, and how it is affected by the disturbance factors linked to wave exposure (Koch et al., 2006; Folmer et al., 2012). Additionally, there are important knowledge gaps on how seagrasses adapt their organs (modules) to local environments (habitats) shaped by the physical conditions promoted by wave attenuation of the reef barrier (Christianen et al., 2013; Lavery et al., 2013; de los Santos et al., 2016).
This study hypothesizes that different wave exposures caused by discontinuous coral reef barriers impact seagrass organic carbon stocks. In particular it is expected that zones under sheltered conditions will increase organic carbon stocks in seagrass biomass and sediments compared to exposed ones. To answer this hypothesis, the study was conducted in the coral reef lagoon of San Andreìs, in the southwestern Caribbean, which has a discontinuous reef barrier located from north to south leading to different waves exposures. Under this rationale we chose seagrass sites with different levels of exposure to waves within the reef lagoon, sheltered or no from the coral reefs. This study goes beyond describing seagrass meadows as a carbon sink and attempts to explain the drivers of seagrass organic carbon storage potential in relation to physical attributes such as exposure to waves. This will improve the current knowledge of carbon stock potential in seagrass meadows at the seascape scale and establish further important facilitative connections between coral reefs and seagrass meadows.
Materials and Methods
Study Area
The study was conducted in San Andrés; a small oceanic island located 80 km from the Caribbean coast of Nicaragua and 775 km from the Colombian coast, N 12° 32′ and W 81°43′, in the southwestern Caribbean (IGAC, 1986; Figure 1).
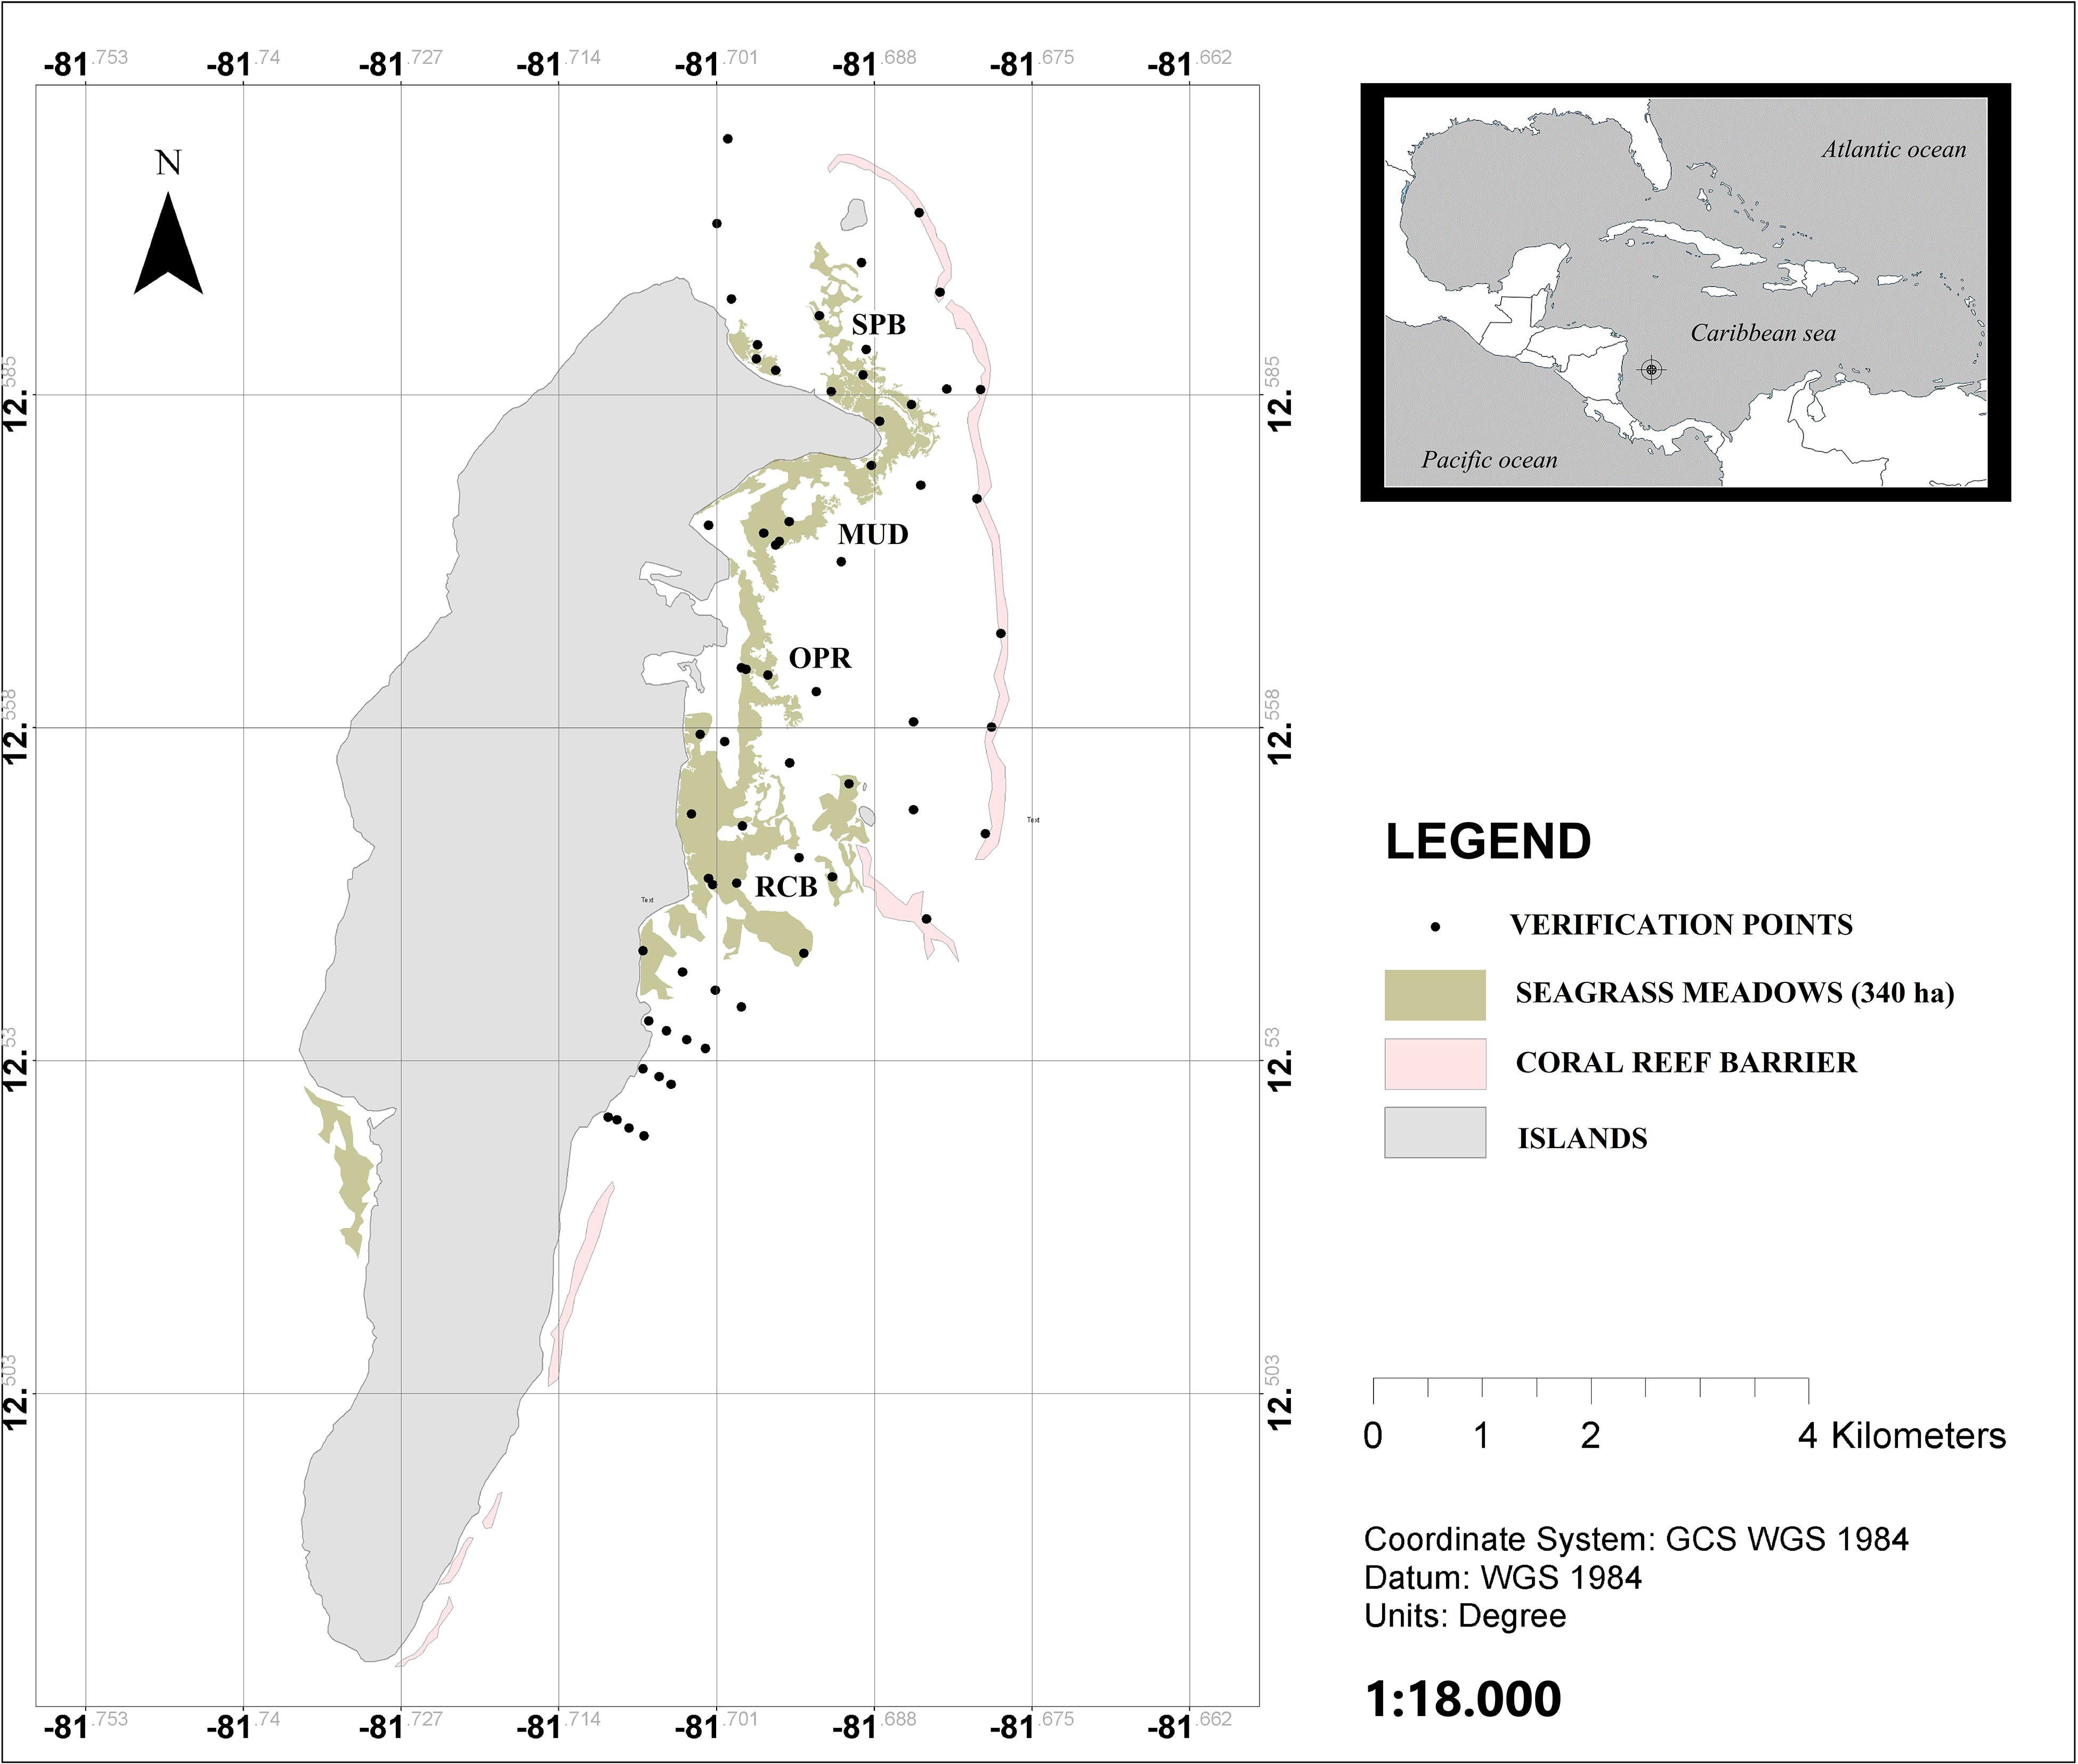
Figure 1. Seagrass meadows in San Andrés island, mapped as green patches. The pink patches are the coral reef barriers. The black circles represent the sampling points used to verify seagrass cover. The four sampled locations are shown on the map; SPB, Sprat bay; MUD, in the island harbor; OPR, in the marine protected area of Old Point Regional Park of Mangrove; and RCB, at Rocky Cay bay. This figure was modified from Guerra-Vargas and Guerra-Vargas (2017).
San Andrés has a monomodal rainfall pattern. The rainy season is from May to December, with maximum rainfall in October and November. The dry season is from February to April. In the dry season the island has strong trade winds (“Alisios”) from the north east. The island is a calcareous sedimentary and karstic formation, elongated from north to south, with a maximum length of 12.5 km and 3 km width. The location of our study was in the reef lagoon on the east coast of the island (Figure 1). There are at least 316 ha of seagrass meadows inside the lagoon, and 24 ha in the west coast of island (Guerra-Vargas and Guerra-Vargas, 2017).
Four species of seagrasses have been reported within the lagoon: Thalassia testudinum KD Koening 1805, Syringodium filiforme Kützing 1860, Halodule wrightii Ascherson 1868 and Halophila decipiens Ostenfeld 1902, but T. testudinum is the most common and dominant seagrass in the area (Díaz et al., 2003).
Within the reef lagoon, four sampling sites in the seagrass meadows, under a different level of exposure to wave energy due to continuity discontinuity characteristics of the reef, were selected. From north to south of the lagoon, these sampling sites are: SPB, Sprat bay; MUD, in the island harbor; OPR, in the marine protected area of Old Point Regional Park of Mangrove; and RCB, in Rocky Cay bay (Figure 1). To increase the representativeness within the sampling sites, sampling depth stations were distributed in a balanced number in three intervals of depth in this way: (1) Deep water (4–10 m), (2) Mid water (2–4 m), and (3) Shallow water meadows (0–2 m). These sampling stations quantified the effect of exposure on Corg stock to waves along changes in the depth. The study was conducted over two periods: rainy season (September–November) in 2016 and dry season (January-March) in 2017.
At each sampling sites, hydrodynamic energy and nutrient availability were measured as potential drivers of Corg stocks in seagrass sediments and biomass.
Hydrodynamic Energy
Hydrodynamic energy disturbance per sampling site was assessed through an analysis of the linear density of wave’s crest (LDW, crest m–1). To measure disturbance linked to wave intensity, a total of 22 available aerial photographs from 1974, 1980, 1984, and 1996, taken in different seasons, were analyzed (Source: Instituto Geográfico Agustín Codazzi). Wave’s crests in ten transect of 500 m were measured in the four sampling sites: SPB, MUD, OPR, RCB (Figure 2). Transects were geo-positioned inside 2.5 km2 rectangles located in the same sampling sites in the four sets of aerial photographs. Directions of the wave’s train (e.g., white arrows in Figure 2) were defined within rectangles. Transects were plotted parallel crossing the waves train and orthogonal to the first crest. The next step was to count the number of waves crests on each transect. LDW (crest m–1) is a proxy of disturbance factor because waves break at the reef barrier, dissipate energy and are refracted and diffracted to new directions. Waves increase the number of crests in a line in the same direction of their movement (Harris et al., 2018).
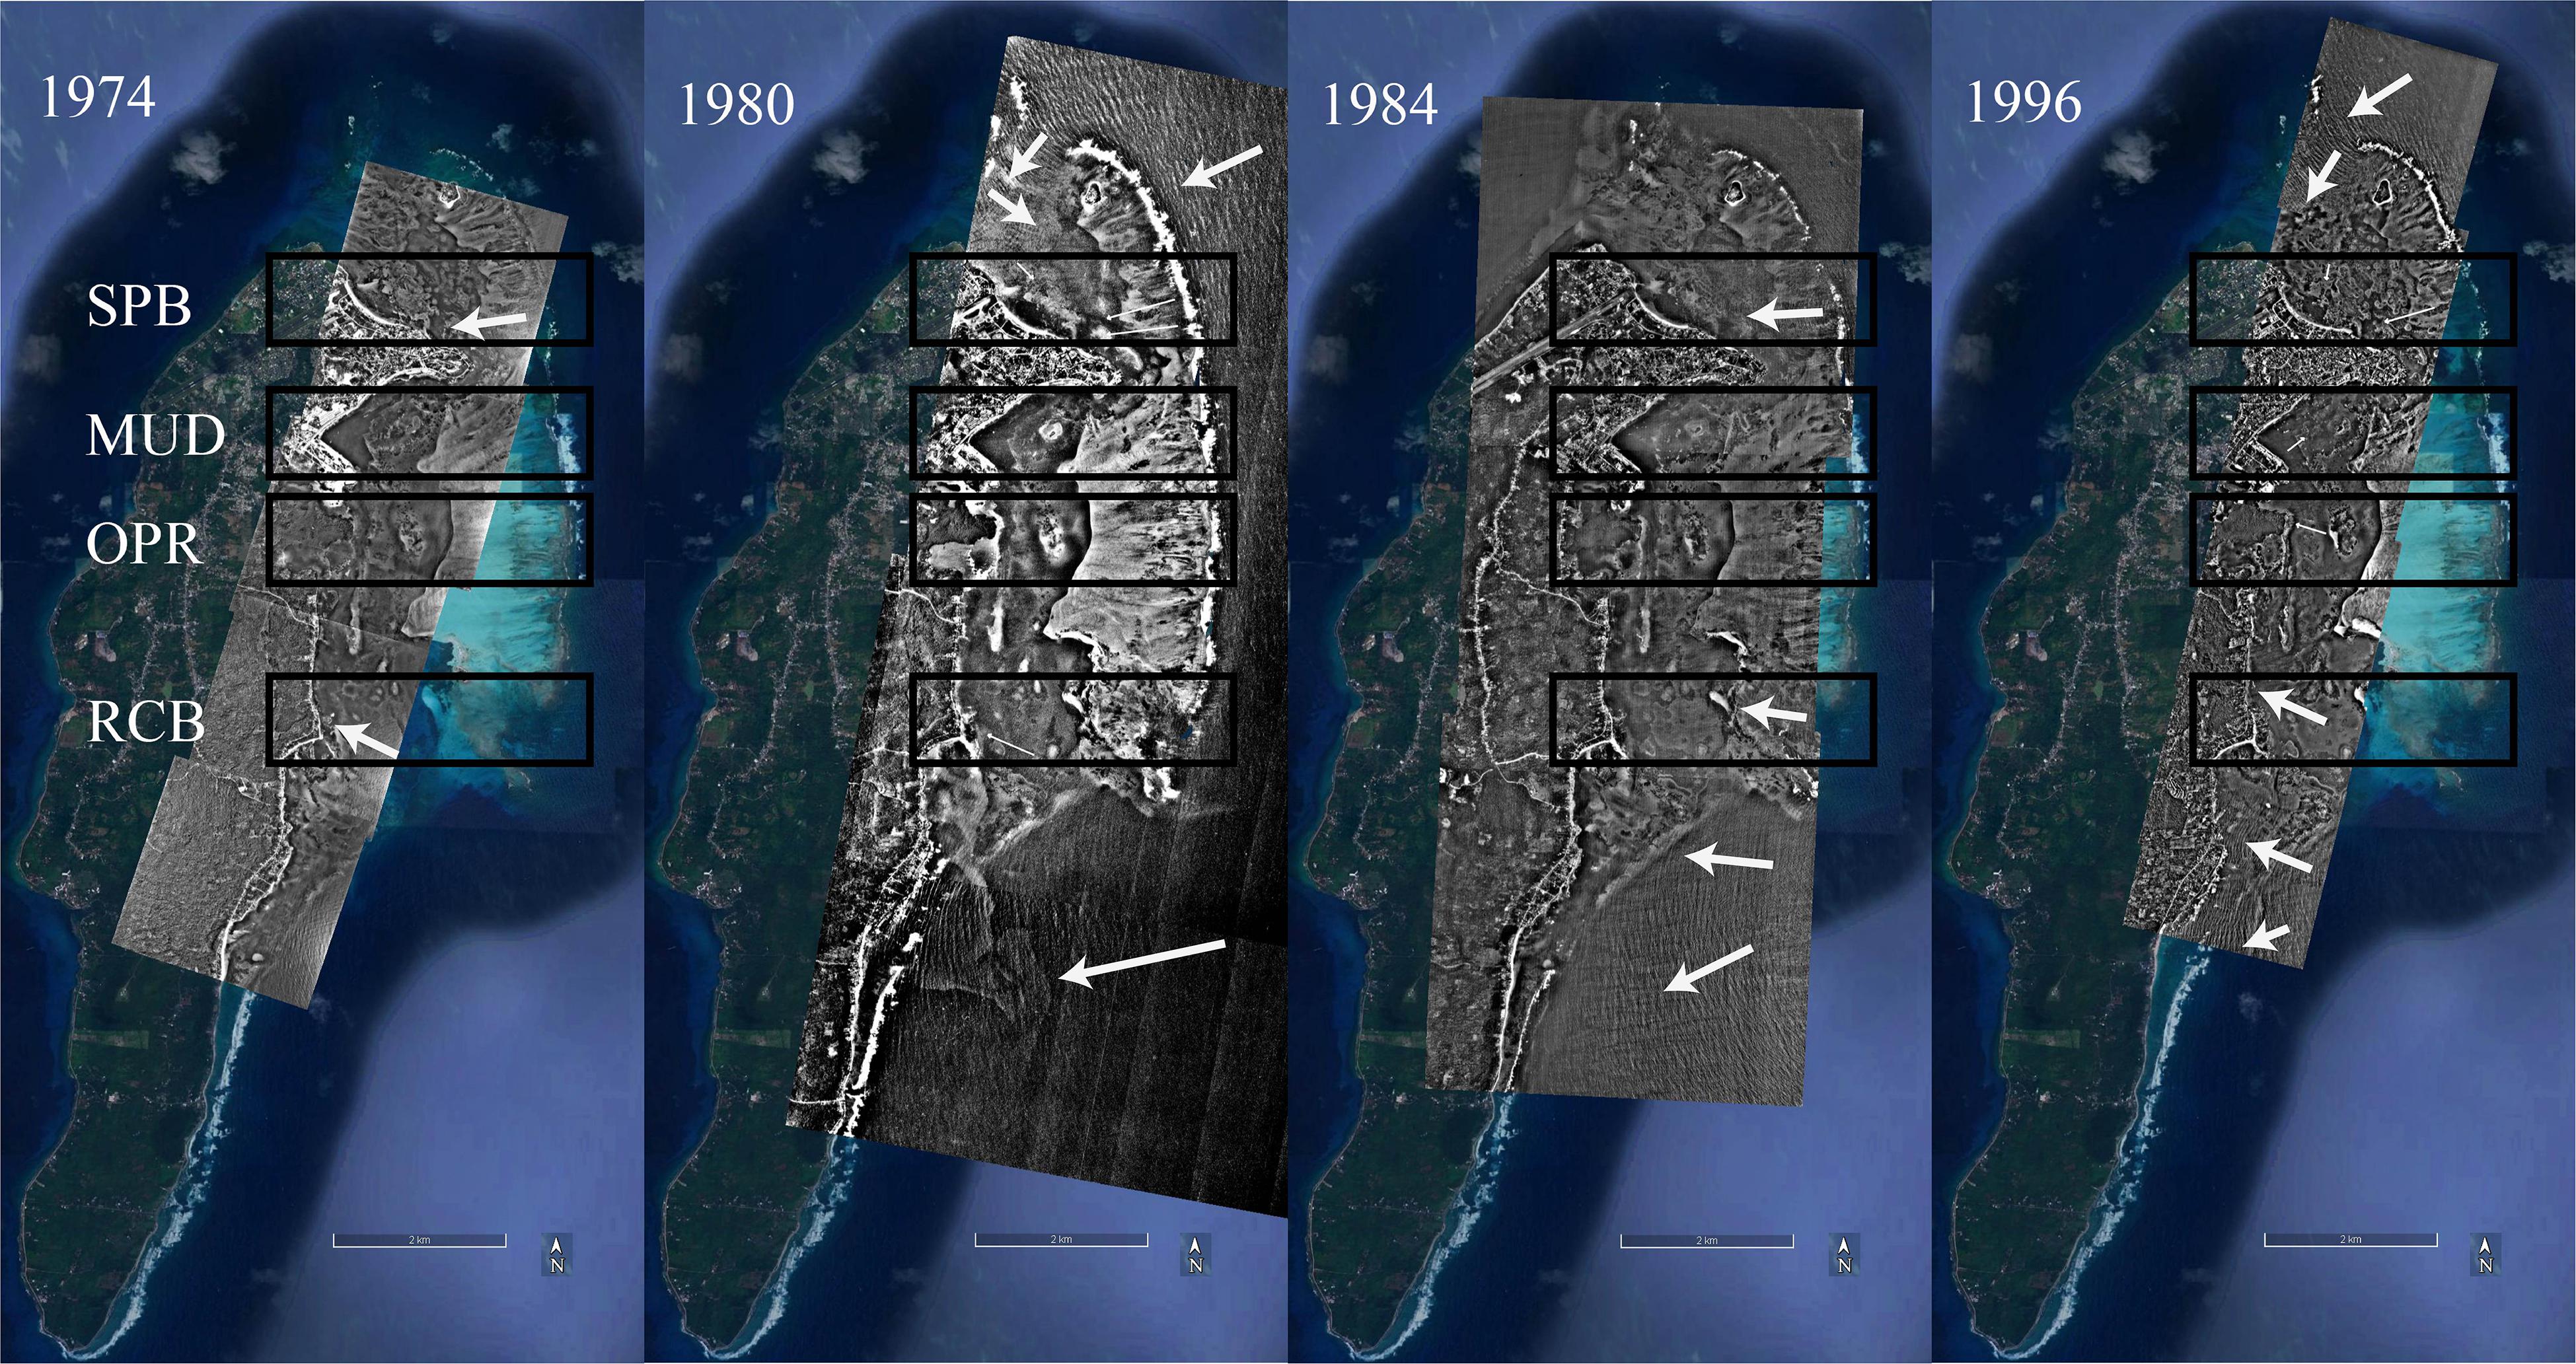
Figure 2. Wave direction (white arrows) in sampling sites (black rectangles: MUD, island harbor; OPR, Old Point Regional Park of Mangrove; RCB, Rocky Cay bay; SPB, Sprat bay), using aerial photographs from the years 1974, 1980, 1984, and 1996 (Source: Instituto Geográfico Agustin Codazzi IGAC).
Nutrient Availability
In September of 2016, seawater samples were obtained in the four sampling sites (SPB, MUD, OPR, and RCB). Samples of 500 ml were collected in shallow, mid and deep-water sampling stations in the seagrass meadows directly under the seagrass canopy. Samples were stored on ice and transported to the CORALINA (Corporation for Sustainable Development of the Archipelago) laboratory. The seawater was analyzed using the standard methods of American Public Health Association [APHA] (1992), to determine nitrate, nitrite, ammonium, phosphate and sulfide concentrations (mg l–1) by colorimetric protocols. Nitrate, nitrate, nitrite, ammonium, phosphate and sulfide concentrations were documented to characterize seawater properties and test the limitation of nitrogen in the water column over seagrass meadows.
Soil Biogeochemical Properties
Soil Organic Matter and Organic Carbon Content
Three seagrass sediment cores per depth station and per sampling site were extracted using a PVC pipe of 30 cm length and 10.16 cm diameter. So a total of 36 cores were taken for both seasons. Cores were transported on ice to CORALINA’s laboratory, where they were frozen for later analysis. In the laboratory, cores were defrosted, and sediments and seagrass plants were separated from other material. The first 10 cm of substrate was excluded to achieve a better comparability among sampling zones and control the effects of biota and recent erosion in that sediment layer. Sediments were homogenized and subsamples were taken to determine organic matter content in sediments (OMsed). OMsed were calculated in sediments samples taken in the wet season of 2016. Dry weight of sediments was determined after 72 h drying at 60°C. Organic matter percentage in sediments (OMsed) was measured using the loss on ignition method (LOI), where mass of volatile organic matter was subtracted from the sediments after burning them in a furnace for 6 h at 450°C. OMsed was determined using this formula:
Organic matter percentage in sediments was also used to calculate the Corg percentage (%) in the three replicate-cores of sediments per depth station (n = 36, only rainy season) using the equation proposed by Fourqurean et al. (2012a):
For a detailed characterization of soil Corg stocks along the seagrass sediments depth profile, one additional sediment core was extracted from each of the three depth stations at each of the four sampling sites (12 sediment cores in total) using a PVC pipe 30 cm length and 5.8 cm diameter. Cores were extracted in wet season of 2016. These pipes where subsampled with syringes at 5, 10, 15, 20, and 25 cm to determine volume (ml). Subsamples were then transported on ice to the marine biology laboratory of the Universidad Nacional de Colombia, where they were dried for 72 h at 60°C. Dry weights were calculated and means of DBD were obtained from each sampling site.
These subsamples were then transported to the chemistry laboratory of the Leibniz Center for Marine Tropical Research for the total Corg percentage (%) analysis using an elemental auto-analyzer (CN Analyzer Eurovector EA 3000). Then, Corg percentage in subsamples was used to characterize the organic carbon content in the study area.
Corg density (g cm–3) in sediments was calculated in each sample multiplying Corg percentage (%) per DBD (g cm–3). Corg density was multiplied by 100 to obtain top 1 m soil Corg stocks by surface area (g Corg cm–2). Soil Corg stocks are provided in Mg Corg ha–1 units (Howard et al., 2014).
Sediment Grain Size
Sediment grain size was determined to support hydrodynamic energy assessment. Granulometric analysis were performed in 200 g (wet weight) sediment subsamples extracted from the soil cores depth fraction between 10 and 20 cm, sampled in both the wet and the dry season. Sediments between 10 and 20 cm depths were treated with sodium hexametaphosphate (NaPO3)6 6% (p/v) for 24 h, then dried for 72 h at 60°C. Sediments from the first 10 cm of depth were rejected from the analysis to subtract effects of biota and recent sediment erosion on this layer. Sediments were homogenized and 100 g of dry weight per sample was taken to determine the percentage of the dry weight in seven sediment size ranges, using six sieves following standard grain size ranges (Wentworth, 1992). The smallest sediment grain size (<63 μm) or mud-like sediments were used to assess differences among the sampling periods (dry or wet season), sites and stations. Seven sediment grain size ranges were observed in all the samples. The Shannon-Wiener index (H’) was used to assess the granulometric evenness in the sediments:
Where S is seven sediment types and it was constant in all samples. Variations in evenness index are attributable to pi, or the proportion of dry weight in each assessed sediment type in 100 g of sediments. Granulometric H’ is close to zero if a sediment type dominates the others and it has a maximum value (H’ = 2.81 bits) when all sediment types are the same proportion. Grain size analysis using H’ and proportion of mud-like sediments were used to verify seagrass sediment exposure to waves. Higher granulometric evenness and higher proportions of mud-like sediments are expected in sites where low exposure to waves occurred (Paterson and Black, 1992; Folmer et al., 2012).
Seagrass Biomass
Seagrass biomass were collected over the two sampling seasons (rainy and dry), using PVC corers of 30 cm length and 10.2 cm diameter in the four sampling sites and their three depth stations (Figure 1). Three cores were collected per depth station (n = 36 cores, per season). Seagrass living biomass (SLB) was separated from the other material in these cores. SLB was treated with HCl 8% (v/v) to remove carbonates and epiphytes; the SLB was then rinsed in water and classified by seagrass species. Each plant was classified by modules: green leaves (Gl), living rhizomes (Rh) and roots (Ro). Dry weight was determined after seagrass biomass modules were dried at 60°C during 72 h. Rhizomes and roots dry weight (Mg Dry Weight ha–1) was pooled as belowground (BG-) SLB. Green leaf dry weight was classified as aboveground (AG-) SLB.
Thalassia testudinum is the dominant specie in the area, therefore T. testudinum living biomass (TLB) was assessed independently to other species and separated as aboveground Thalassia living biomass (AG-TLB) and belowground Thalassia living biomass BG-TLB. Dry weight was determined after seagrass samples were dried at 60°C, over 72 h. For the AG-TLB the epiphytes were removed using a razor blade after drying and before the dry weight was measured. Samples from the rainy season were used to determine organic matter (%) in seagrass plants using the LOI method. This method destroys samples. Therefore, samples from the dry season were used to determine percentages of Corg and TN in TLB, using the CN Analyzer Eurovector EA 3000 in the ZMT’s chemistry lab. Fifteen random samples of T. testudinum were selected across all sampling sites in the dry season, to determine TC, TOC, and TN, and to estimate the mean of these in the study area, and to verify changes in the means of these variables among Thalassia organs (green leaf, rhizomes, and roots). Additionally, a 0.34 coefficient was used to estimate organic carbon in seagrass stocks (Duarte, 1990), based on the equation:
Where SLB is seagrass living biomass and Corg stock represents the carbon stock within the seagrass biomass.
Statistical Analysis
Non-parametric analysis of data was used because the data did not fit assumptions required for parametric testing. Two tests were applied according to the objectives of assessing seasonality effects (Wilcoxon test) or spatial/wave exposure effects (Kruskal-Wallis test) on seagrass and sediment variables.
The Wilcoxon test can be used as an alternative non-parametric analysis between similar means from two groups from the same variable using the Student’s t-test. Seasonality effects were assessed in proportions of mud-like sediments (grain size < 63 μm, %) and granulometric evenness index (H’, bits), seagrass living biomass (SLB) and Thalassia testudinum living biomass (TLB) in their aboveground and belowground pools.
The Kruskal-Wallis test (K-W test) compares ranks among four sampling sites. To analyze differences between Linear density of wave’s crest, a Kruskal-Wallis Rank Sum Test (K-W test, X2) was applied to compare ranks among Old Point Regional Park of Mangrove (OPR), Rocky Cay bay (RCB) and Sprat bay (SPB) from 1996 data. Nemenyi’s (post hoc) test were applied to differentiate exposure to wave (Exposure levels). To analyze differences between nitrate, phosphates and sulfide in seawater, we compared ranks among sampling sites: MUD, OPR, RCB and SPB using the K-W test and the Nemenyi’s test for each variable. The K-W test and Nemenyi’s test were applied to assess effects of reef barrier in seagrass meadows variables, both in sediments and in biomass. Sediment variables analyzed were mud-like sediments, granulometric evenness index, organic matter in sediments (OMsed, %) and dry bulk density (DBD, g cm–3). Biomass variables were seagrass living biomass (SLB) and Thalassia testudinum living biomass (TLB), their aboveground (AG) and (BG) belowground pools, and their organic matter (%).
To analyze differences based on ratio among AG and BG pools in SLB, a descriptive approach was used with biomass of green leaves (AG), rhizomes and roots (BG). To assess disturbance factor on seagrass plants variables using the depth factor, a descriptive analysis was applied to compare sampling depth stations using seagrass plants and sediment variables. Seagrass plant variables considered were BG-SLB and BG-TLB. Sediment variables considered were organic carbon stock (Mg Corg ha–1), organic matter (OMsed, %), granulometric evenness H’ index and mud-like sediments.
Principal Coordinate Analysis (PCA) was used to establish dissimilarities in hydrodynamic conditions across sampling depth stations, based on sediment granulometric profiles. To assess dissimilarity on grain size profile in sediments among the four sampling stations, seven sediment variables were used (as ranges factors of grain size: >2, 2–1, 1–0.5, 0.5–0.25, 0.25–0.125, 0.125–0.063, <0.063 mm) and their proportion of dry mass in 100 g of sediments (as magnitudes).
All tests were conducted in R 3.5.2 and R studio 1.1.463. The post hoc testing Nemenyi’s All-Pairs Rank Comparison Test (Nemenyi’s test) was applied using the PMCMR plus package in R. Principal Coordinate Analysis (PCA) was conducted with this data in Primer v6.1.11 and PERMANOVA+ v1.0.1.
Results
Hydrodynamic Energy
From 1974 to 1984, a comparison of means was only possible between two sampling sites Sprat bay (SPB) and Rocky Cay bay (RCB) because wave crests were not detected in the island harbor (MUD) and Old Point Regional Park of Mangrove (OPR) (Table 1). In the photographs from 1996, significant differences were observed among three sampling sites (OPR, SPB and RCB; K-W test, X2 = 23.3, p < 0.01). Post hoc testing showed OPR was statistically higher than SPB and RCB (Nemenyi, p < 0.05). Comparison of means along the four periods suggest three levels of exposure to waves: I lesser exposed conditions (in MUD), II intermediate exposed conditions (in OPR) and III higher exposed conditions (in both RCB and SPB).
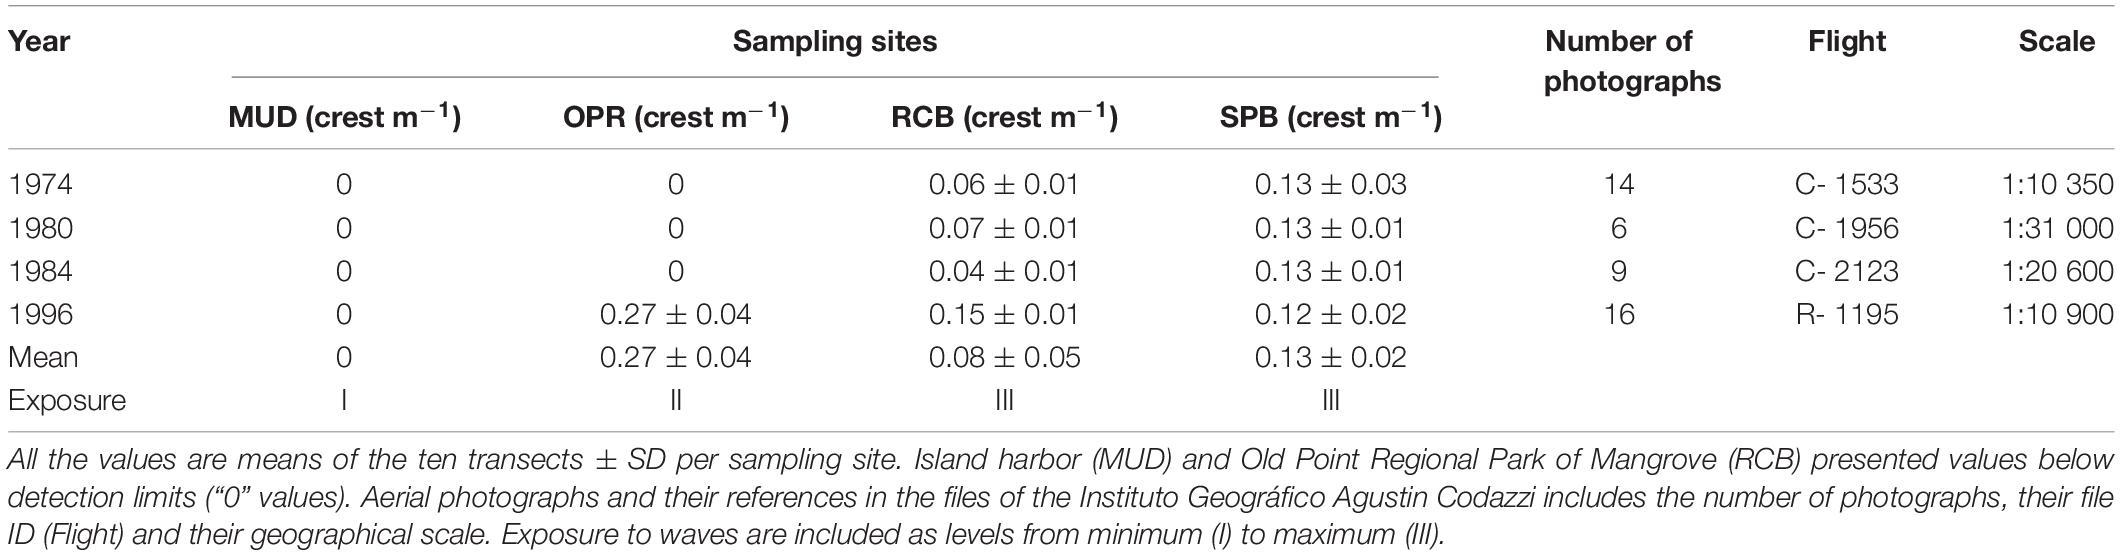
Table 1. Mean waves crest per meter in sampling sites (MUD, island harbor; OPR, Old Point Regional Park of Mangrove; RCB, Rocky Cay bay; SPB, Sprat bay), using available aerial photographs for the years 1974, 1980, 1984, and 1996.
Nutrient Availability
In all sampling points dissolved ammonium and nitrite concentration were below the detection limits of the methods (<0.02 mg l–1). Phosphate concentration was in a range of 0.02 to 0.2 mg l–1; nitrate in a range of 0.019 to 0.09 mg l–1 and sulfide in a range of 6.3 to 9.9 mg l–1 at all sampling points (Supplementary Table S1). No significant difference was seen between sampling sites, for sulfide or phosphate (Supplementary Table S1).
Soil Biogeochemical Properties
Proportions of mud-like sediments (grain size < 63 μm) showed no significant difference between sampling seasons (Wilcoxon test, V = 223, p > 0.05, n = 36). Similar results were obtained using the granulometric evenness index (H’) between sampling seasons (V = 378, p > 0.05, n = 36). The pooled mud-like sediments, H’ and organic matter in sediments (OMsed) showed significant differences among sites (Table 2). However, dry bulk density (DBD) in sediments showed no significant difference among sampling sites during the rainy season (Table 2). Principal coordinates analysis applied to the seven ranges of grain size proportions in sediments results in higher dissimilarities among RCB and SPB shallow water sampling stations compared to others except for the SPB mid water station (2–4 m) (Figure 3).
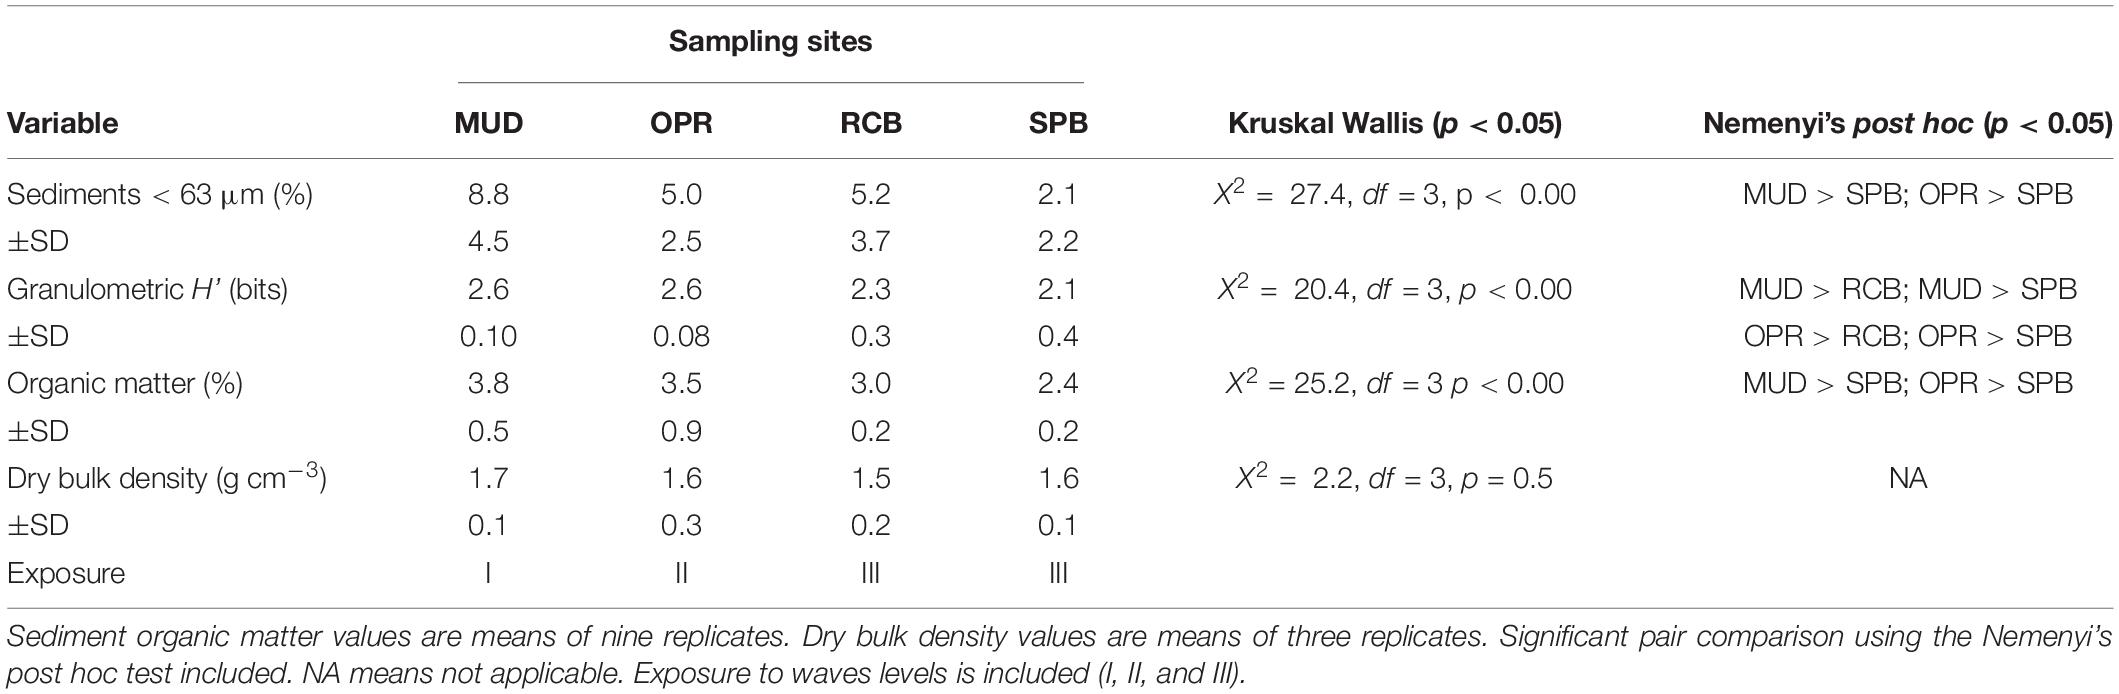
Table 2. Mean of sediment variables in sampling sites (MUD, OPR, RCB, and SPB). Mud-like sediments (<63 μm) and Granulometric H’ values are means of 18 replicates.
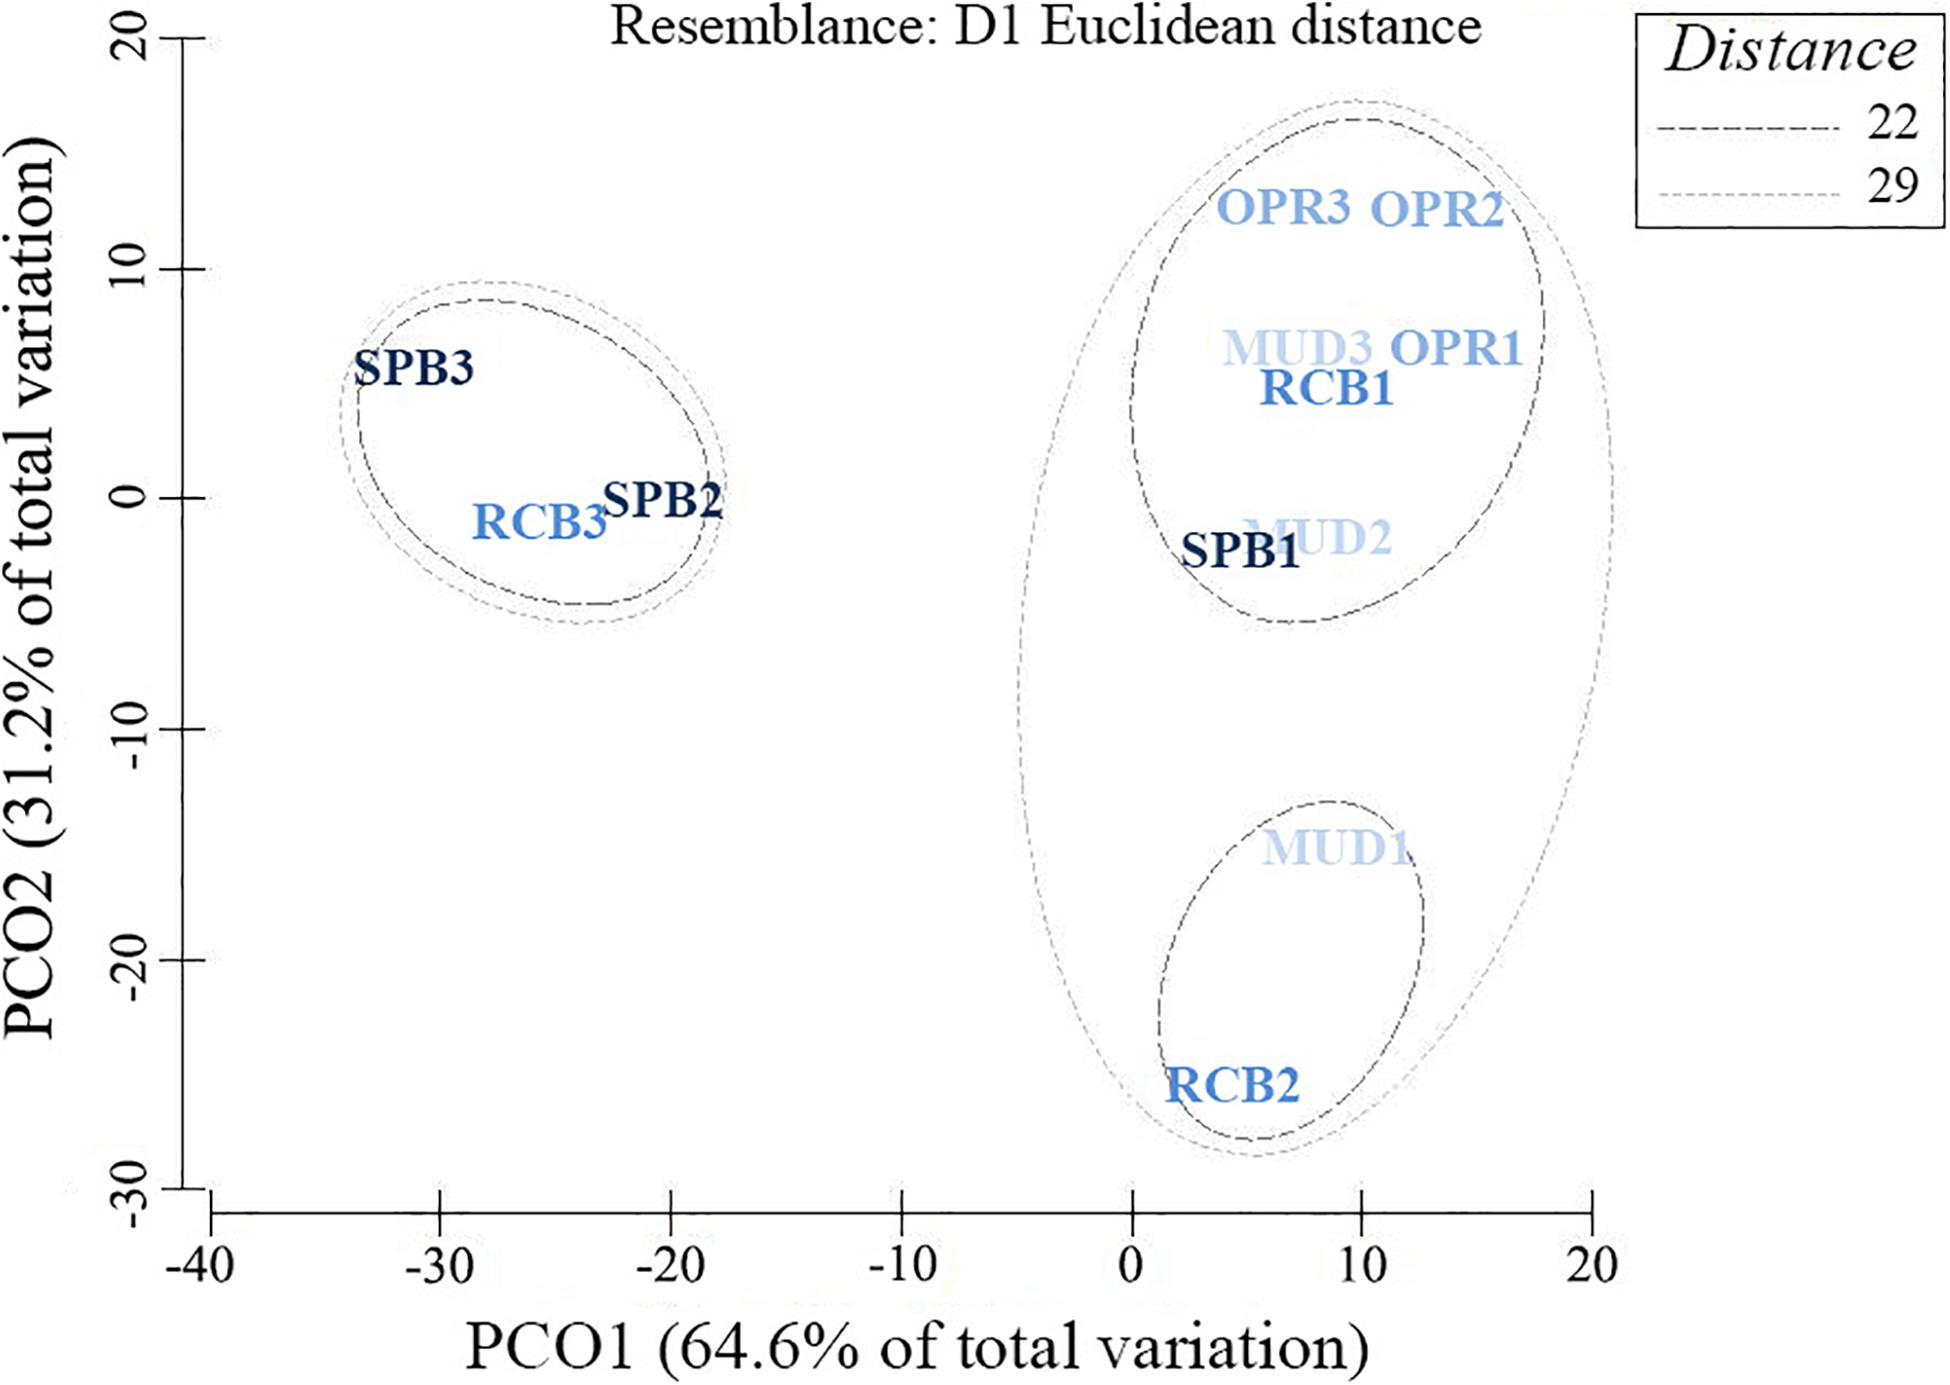
Figure 3. Principal Coordinates Analysis using seven grain-size ranges and their proportion in 100 g dry weight of sediments. Sampling sites differentiated by colors (and exposure levels) as MUD (I), OPR (II), RCB (III) and; SPB (III). And sampling stations (depth factor) differentiated by numbers (site 1 as deep, site 2 as mid and site 3 as shallow water station). Resemblance values based on means from six replicates per sampling station (data from both seasons were pooled).
Sediment organic carbon stock has variations within the study area, less exposed and intermediate sites MUD and OPR showed higher sediment organic carbon stocks than more exposed sites SPB and RCB (Figure 4). Organic carbon (OC) stocks varied from 122.2 (SD = 9) to 226.9 (SD = 32) Mg Corg ha–1 being maximum in MUD and minimum in SPB. OC stock (Mg Corg ha–1) and organic matter (%) in sediments were analyzed along the sampling depth stations per site (Figure 5 and Supplementary Table S3). Both variables showed lower values in the mid (RCB2 and SPB2) and shallow (RCB3 and SPB3) water stations in exposed sites. RCB and SPB sites tended to decrease sediment organic carbon stock and organic matter as the same time as depth decreased.
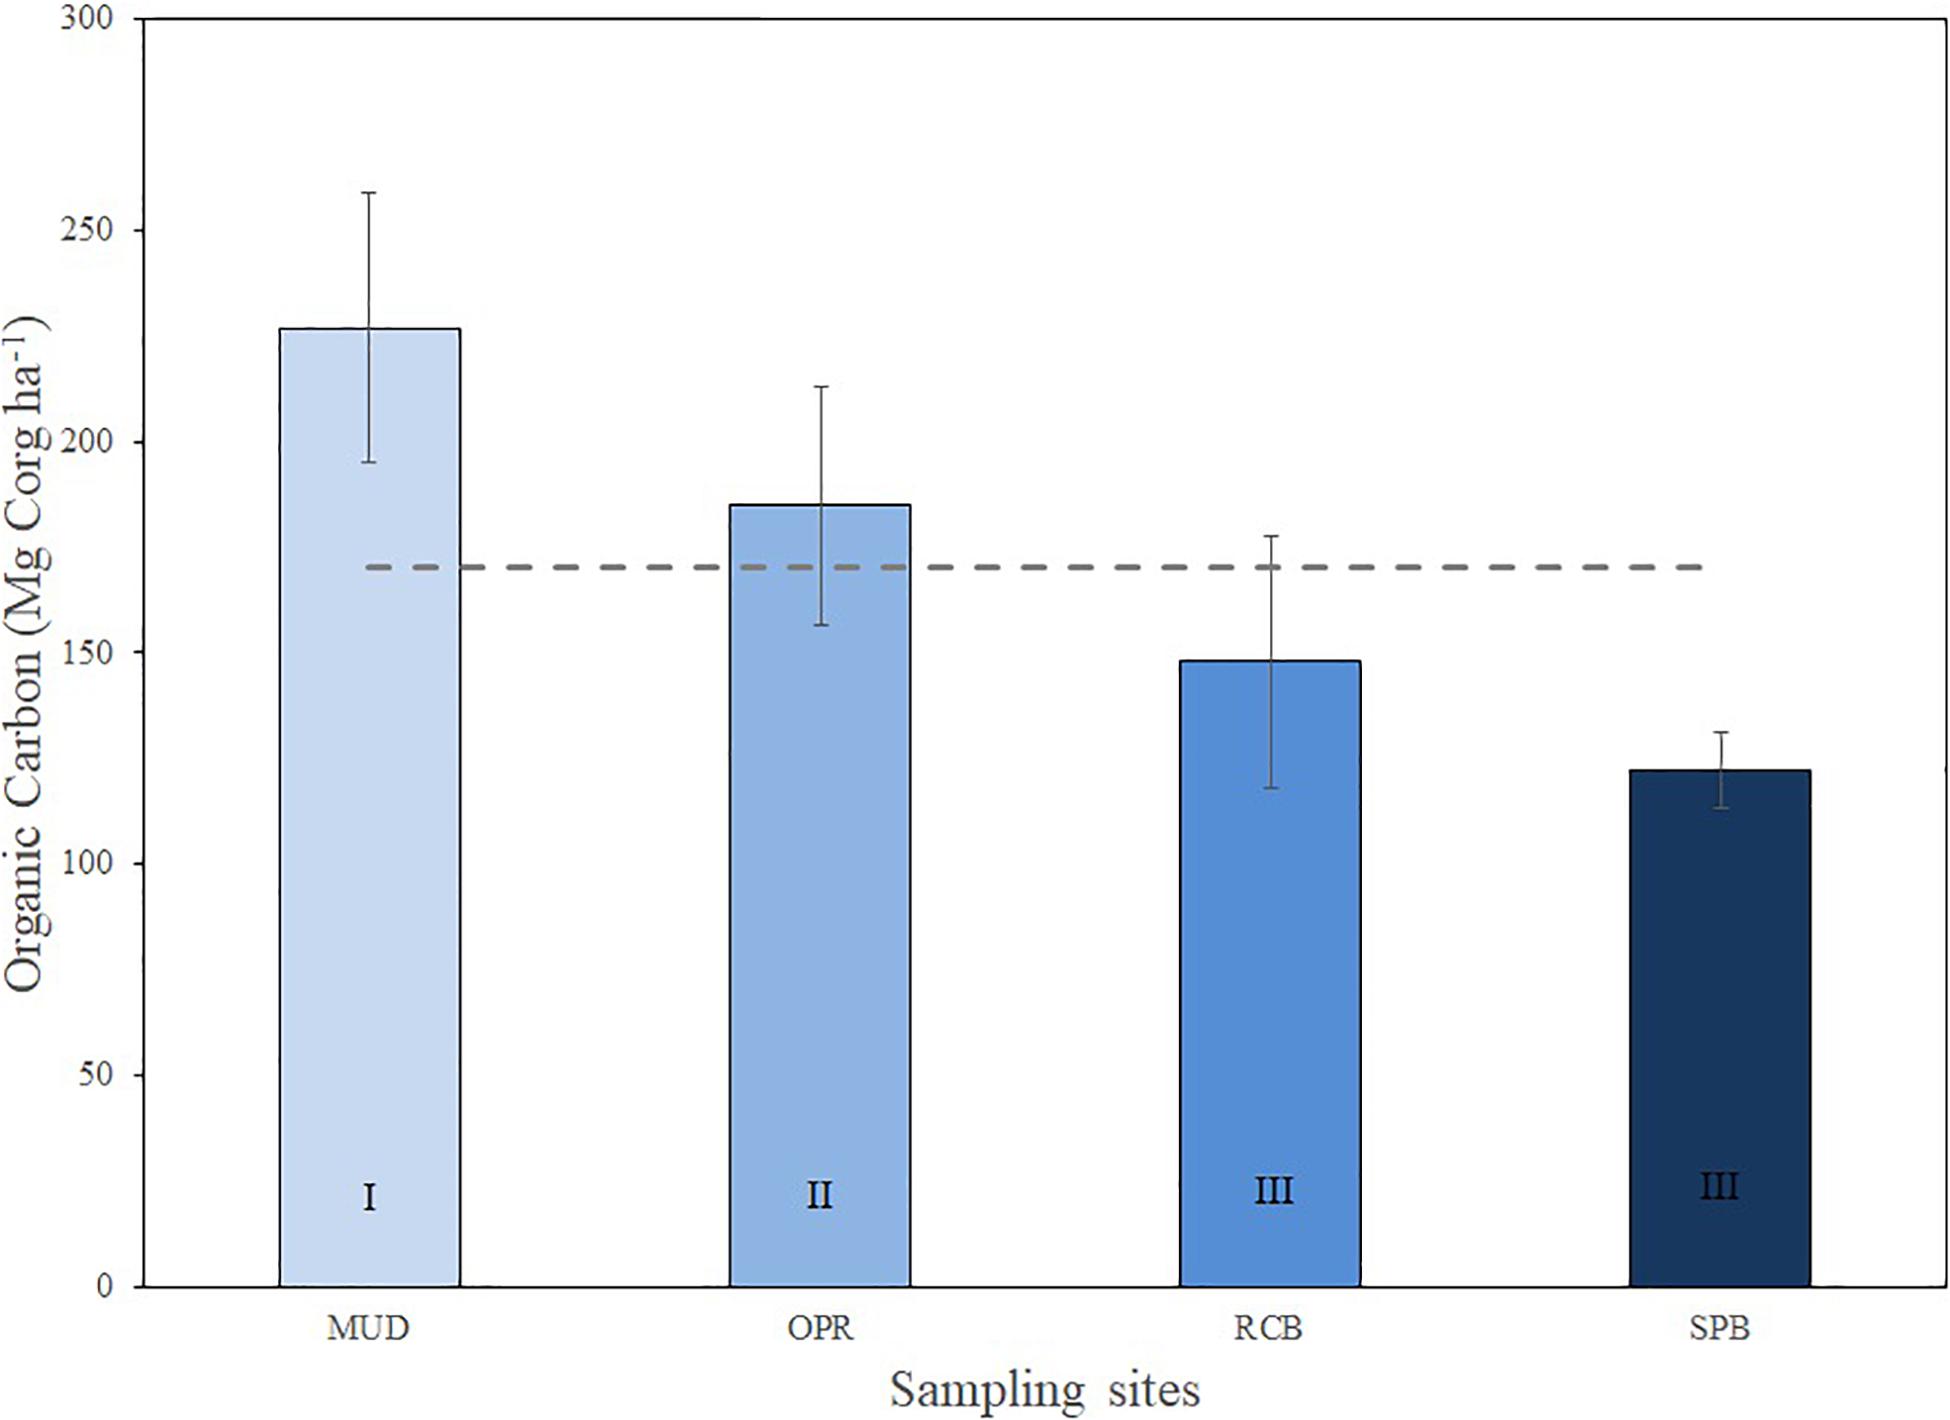
Figure 4. Sediment organic carbon (Mg Corg ha–1) means (±SD) per site (MUD, OPR, RCB, and SPB). Mean of study area is represented by the dashed line (170.5 ± 47.3 Mg Corg ha–1). Exposure to waves levels is included (I, II, and III).
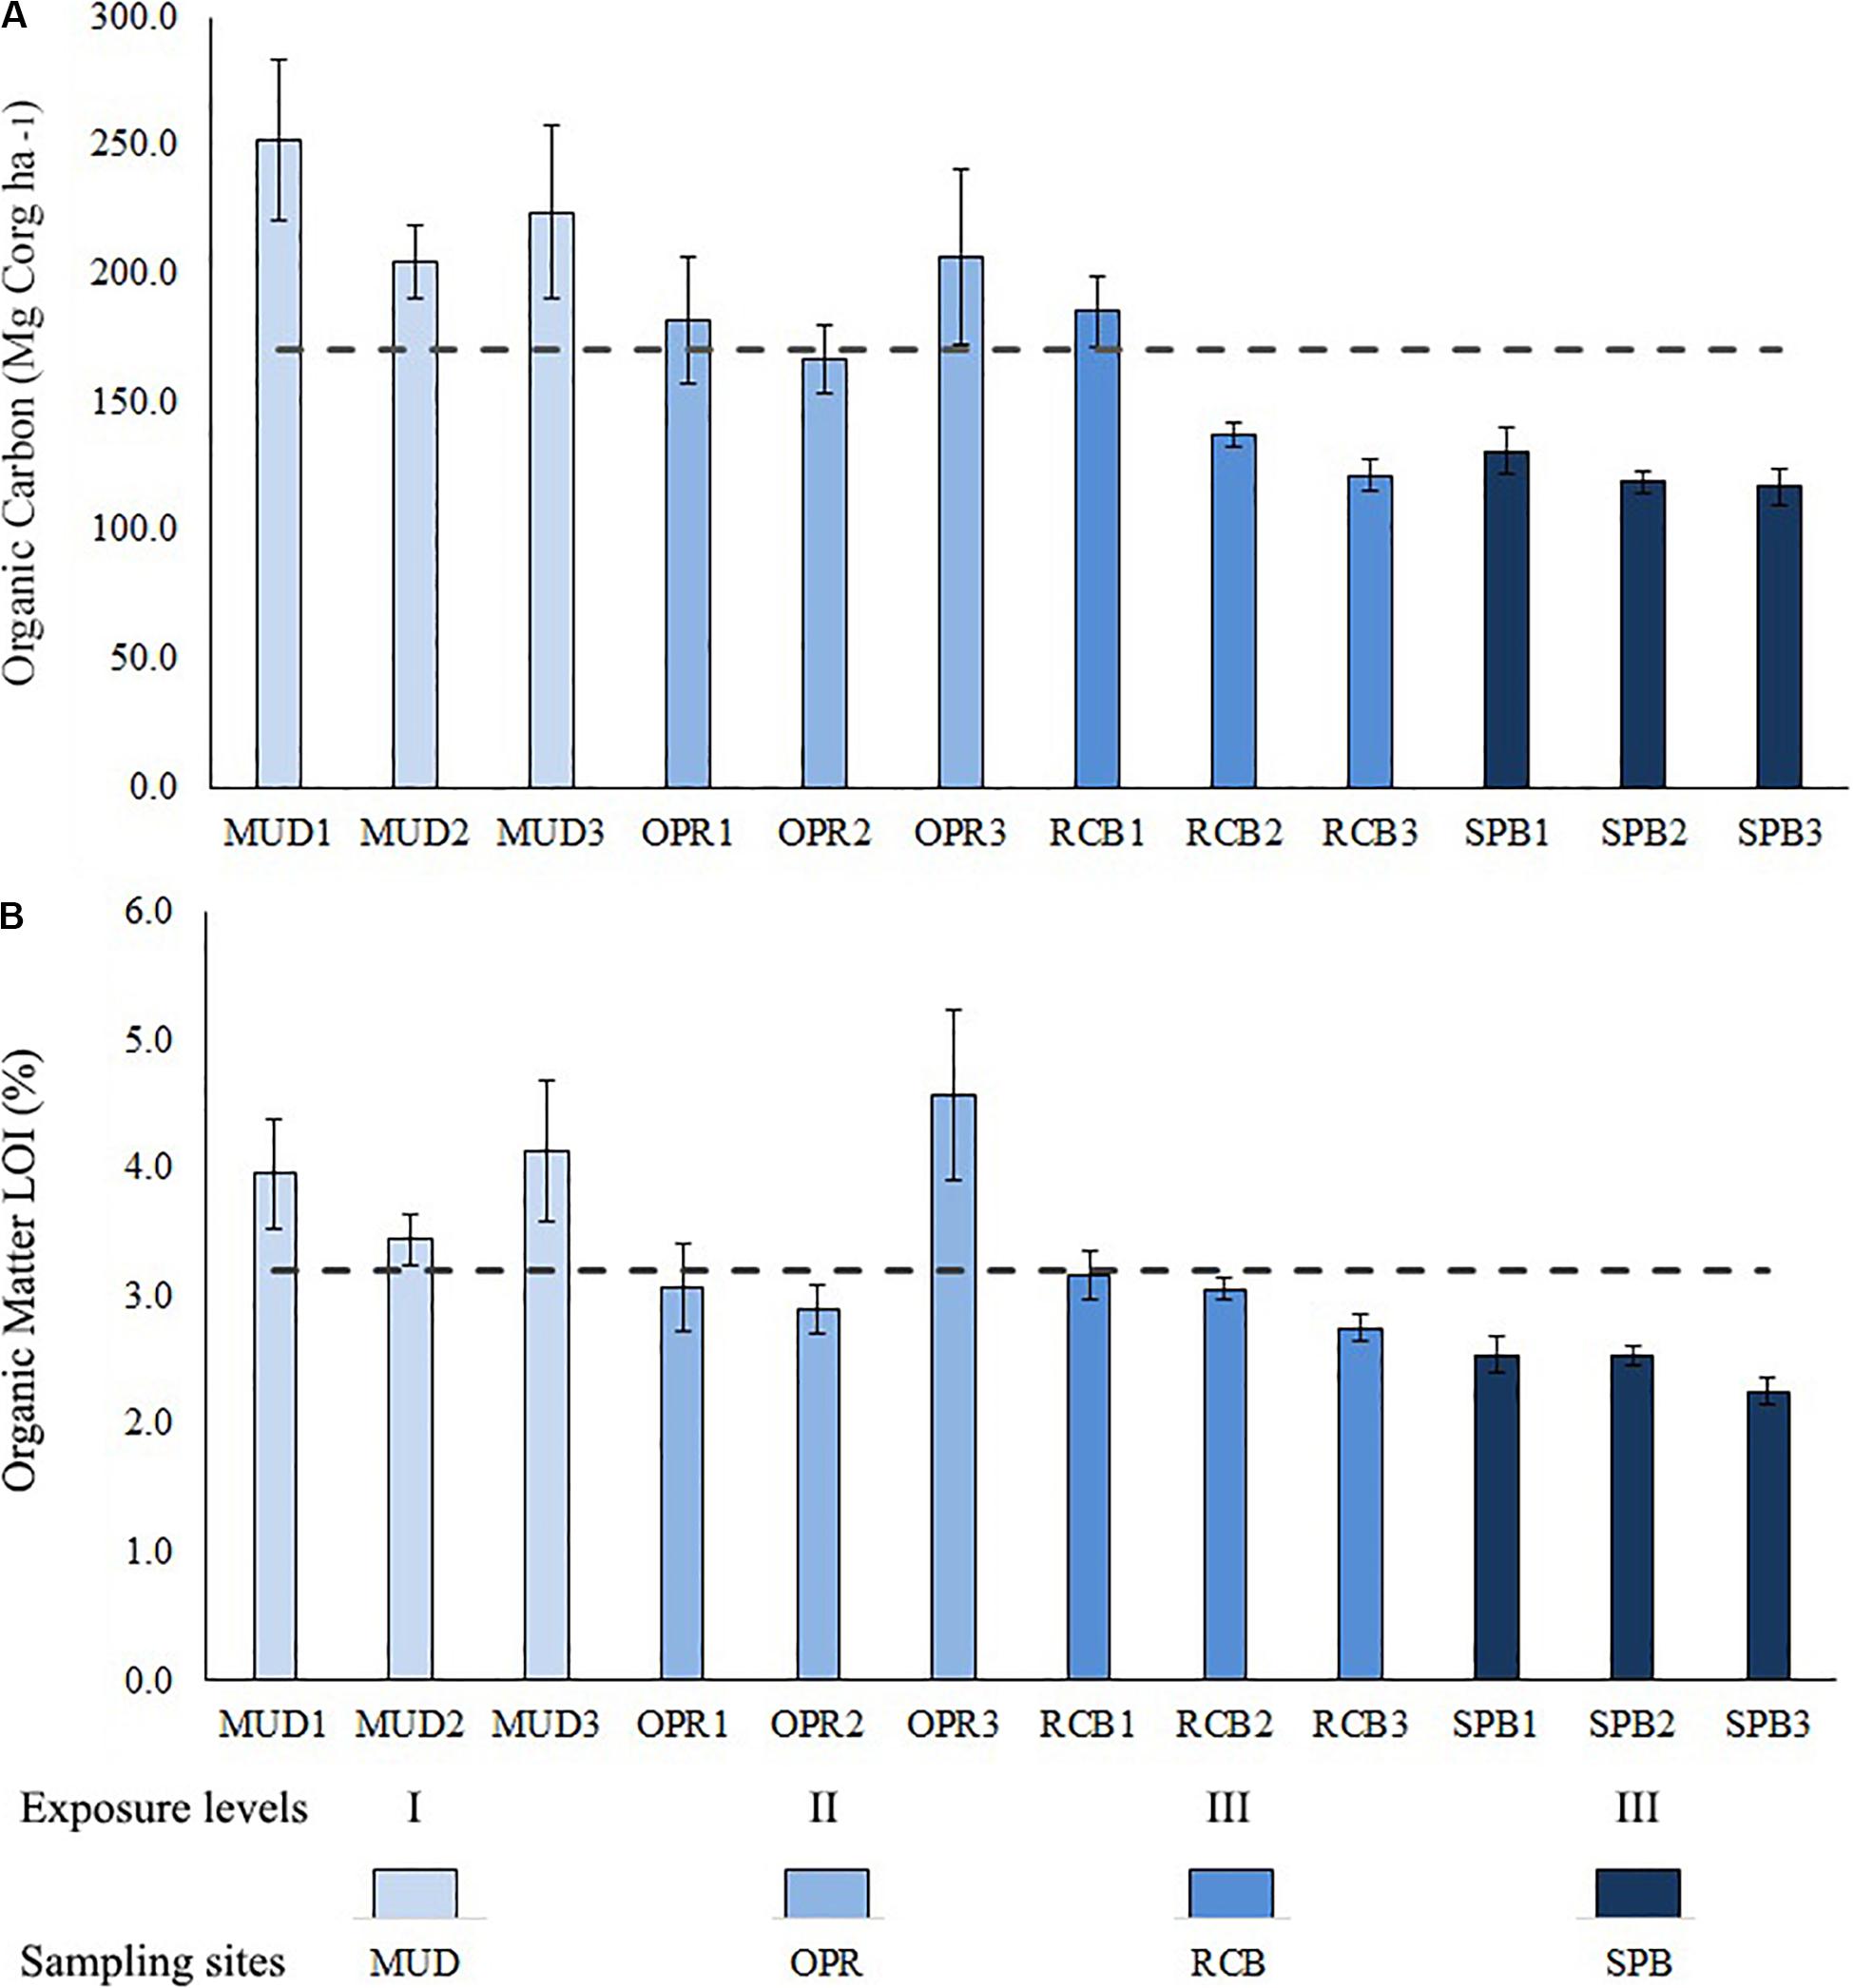
Figure 5. Bar plot showing means (±SD) per depth stations (deep 1, mid 2 and shallow 3) per site (MUD, OPR, RCB, and SPB). (A) Sediment organic carbon (Mg Corg ha–1). (B) Sediment organic matter (%) determined by LOI method. Means of study area are represented by the dashed lines. Exposure to waves levels is included (I, II and III).
Seagrass Species
In the study area, three species of seagrasses were found: Thalassia testudinum K. D. Koening 1805, Syringodium filiforme Kützing 1860, and Halodule wrightii Ascherson 1868. Only T. testudinum was present at all depths in all sampling sites, while H. wrightii, was only observed in SPB2 (mid water sampling station) and S. filiforme was absent in MUD1 (deep water station) and RCB2 (mid water station). Thalassia testudinum dominated total living biomass of seagrasses (mean 81%, SD = 0.2, n = 72). Therefore, the results obtained in seagrasses living biomass (community scale) and in T. testudinum living biomass are presented below independently. Halophila decipiens Ostenfeld 1902 was not observed in the sampled meadows.
Seagrass Living Biomass Among Sampling Periods
Significant differences were found in seagrass living biomass (SLB), T. testudinum living biomass (TLB), aboveground seagrass living biomass (AG-SLB), aboveground T. testudinum living biomass AG-TLB and belowground seagrass living biomass (BG-SLB) across seasons (Supplementary Figure S1 and Supplementary Table S4). Yet no significant difference was seen in belowground T. testudinum living biomass across seasons (BG-TLB). Seagrass biomass was always higher in the dry season compared to the rainy season, and this is attributed to the aboveground pools in SLB (Supplementary Figure S1). Data were separated by seasons and comparison among sampling sites were conducted (Supplementary Tables S5, S6). In both seasons, significant differences in T. testudinum living belowground biomass (BG-TLB) across sampling sites, being significantly higher in MUD than in RCB. These differences were attributed to low values in BG-TLB at RCB2 (mid water sampling station) (Supplementary Tables S5, S6). Seagrass in the less exposed site (MUD) invested greater biomass in roots than rhizomes in comparison to the other sites where levels of wave exposure were higher (Figure 6A and Supplementary Table S7). In contrast RCB and SPB had Rh:Ro ratios, which were higher than sites MUD (Figure 6A and Supplementary Table S7), suggesting that these sites had higher root and belowground biomass with respect to green leaf biomass (Figures 6B,C). The descriptive comparison between the ratios showed differences in the distribution of seagrass biomass between their belowground modules (Supplementary Table S7).
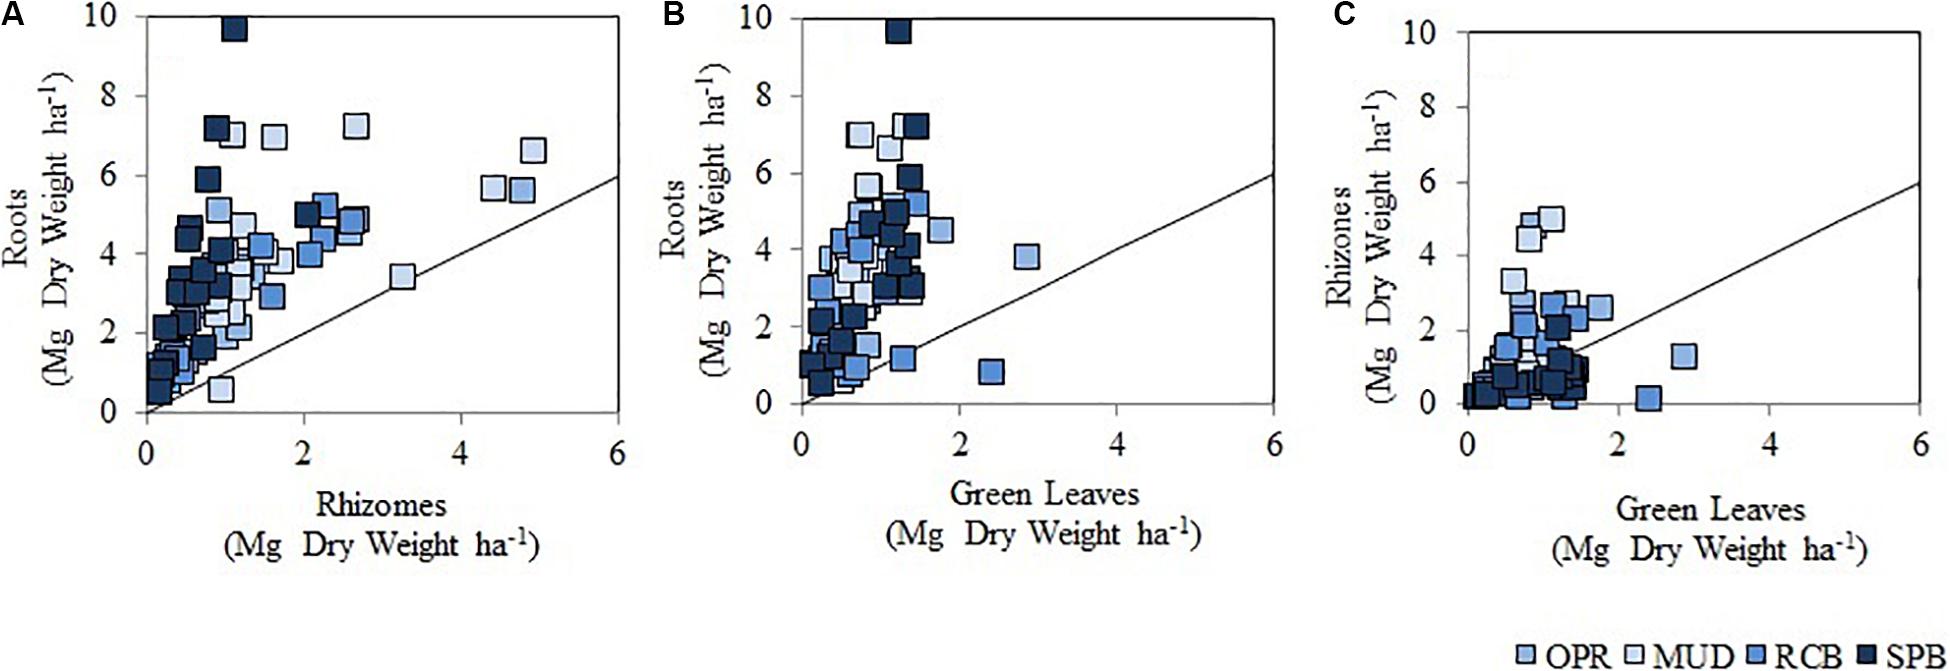
Figure 6. Scatter plot showing living biomass in seagrass modules (all species pooled) in sampling sites. (A) It represents roots and rhizomes ratio (Ro:Rh), (B) it is roots and green leaves (Ro:Gl), (C) shows rhizomes and green leaves (Rh:Gl). Circles in colors respond to sampling sites and waves exposure levels as MUD (I), OPR (II), RCB (III), and SPB (III), from light blue to dark blue. There are 18 replicates per site, data from wet and dry season pooled. The black line indicates a 1:1 relation between the different seagrass modules.
Organic Matter, Total Organic Carbon and Total Nitrogen in Seagrass Biomass
Organic matter in seagrass living biomass (SLB) and T. testudinum living biomass (TLB) showed significant differences among sampling sites for the majority of variables in the rainy season (Supplementary Table S8). In AG-SLB and AG-TLB no significant difference was seen (Supplementary Table S8). Post hoc testing indicated significant differences are attributed to MUD. This sampling site had lower means of organic matter percentage than SPB and OPR. Mean of Corg percentage (%) in the T. testudinum organs (34.1 ± 4%) was similar to Duarte’s coefficient (34%) used by Fourqurean et al. (2012a) to estimate Corg stock in SLB (Supplementary Table S9). Estimated organic carbon stock in seagrass biomass in the study area was 2.4 Mg Corg ha–1 (Supplementary Table S10).
Depth Effects on Seagrass and Sediments Variables
As there were not significant differences in granulometry (evenness index H’), mud-like sediments percentage, SLB and TLB between seasons, the data of these variables were pooled to analyze the effect of depth (Figure 7). Descriptive comparisons among evenness index H’ showed mid and deep-water sampling sites in RCB and SPB were lower in values compared to all sampling stations on MUD and OPR. Mud-like sediments showed the lowest values in the shallow water sampling stations on SPB and RCB, including mid water stations on SPB. Similar values between BG-SLB and BG-TLB were found among all sampling stations on MUD and OPR (Figure 7). But SPB and RCB indicated observable differences for BG-SLB and BG-TLB among their shallow and deep-water sampling stations. Except for MUD sampling stations, medians in sediment variables increased with depth whilst BG-SLB and BG-TLB decreased with depth (Figure 5).
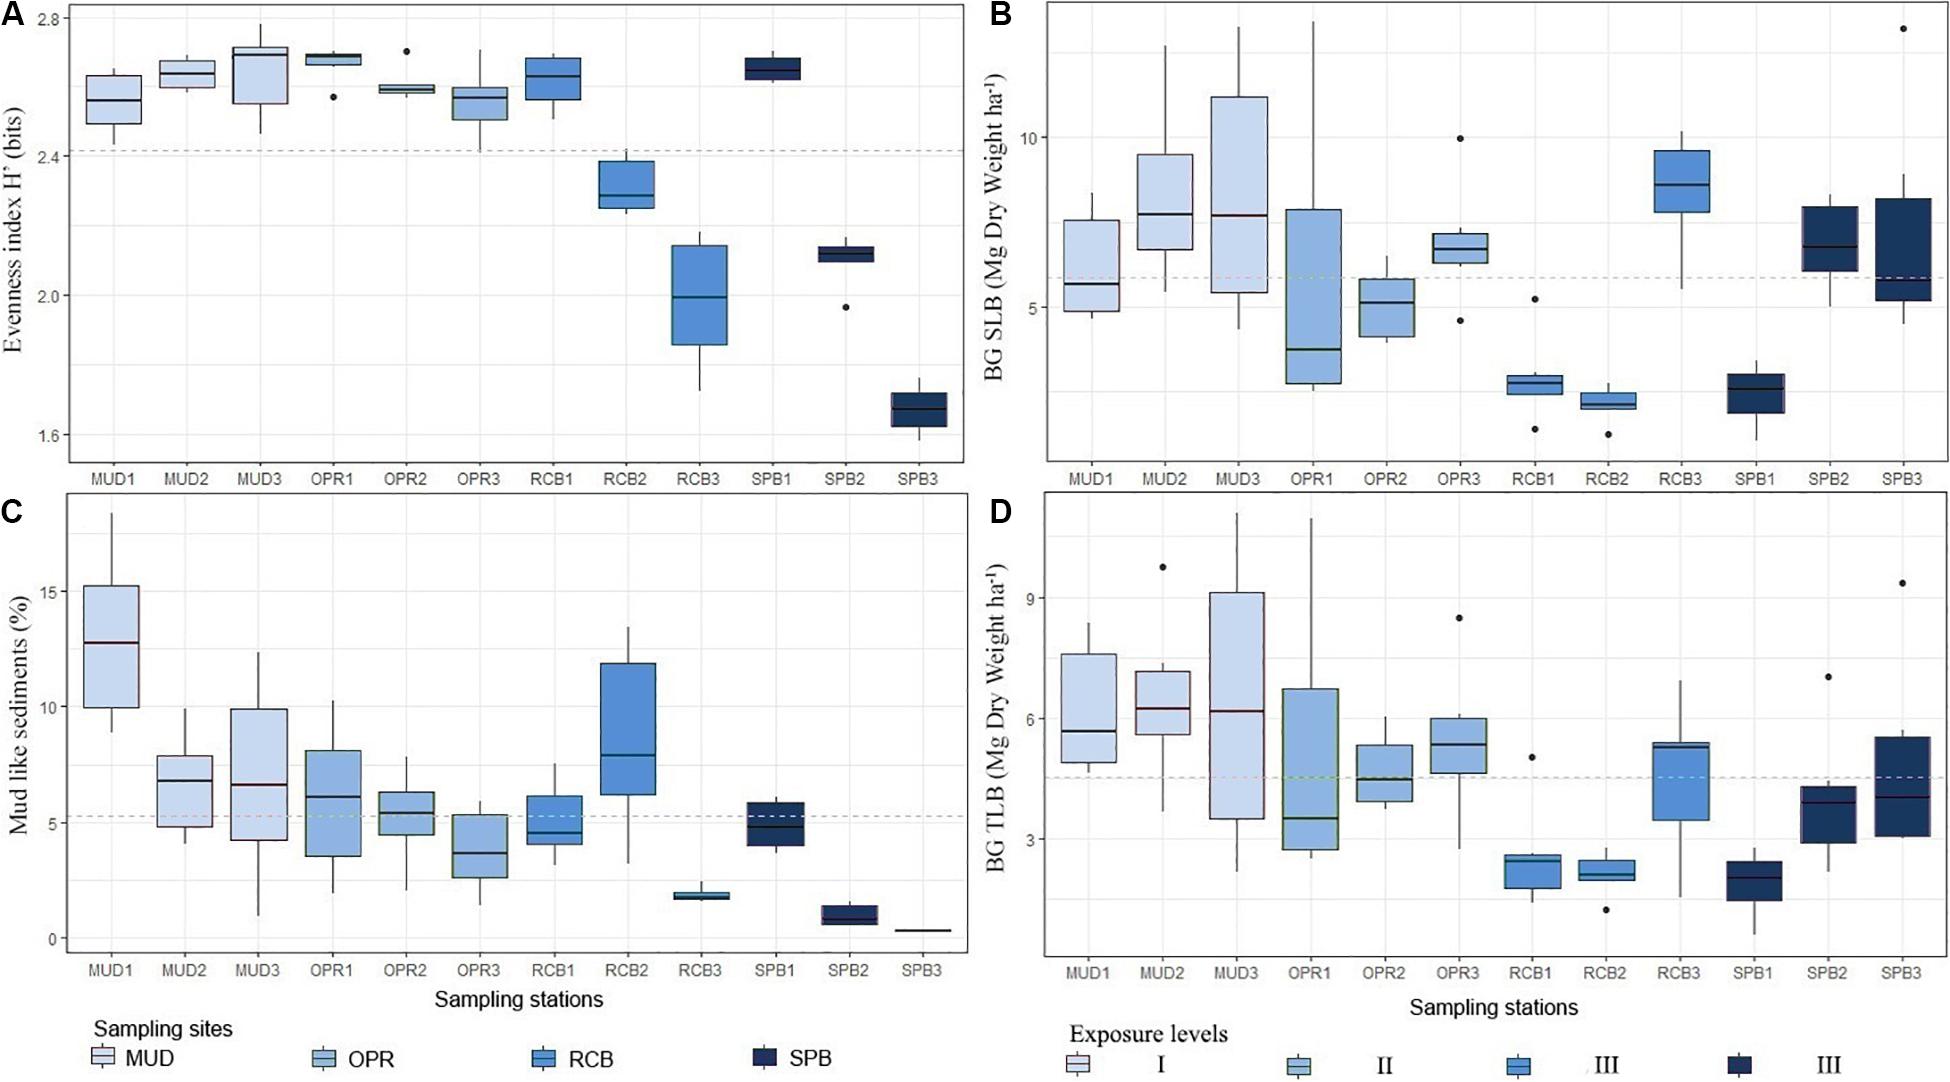
Figure 7. Boxplots by sites (and exposure levels) MUD (I), OPR (II), RCB (III), and SPB (III) and by sampling stations (1 indicates deep water, 2 mid water and 3 shallow water meadows). (A) shows evenness index for granulometry profile H’ (bits), (B) shows belowground seagrass living biomass (Mg Dry Weight ha–1), (C) is percentage of mud-like sediments per 100 g of dry weight (%) and (D) is belowground T. testudinum living biomass (Mg Dry Weight ha–1). Each box is based on six replicates per sampling station. Study area means are represented by dashed lines. Exposure to waves levels is included (I, II, and III).
Discussion
Coral reef barriers and their continuous spatial distribution reflected and broke waves and mitigated wave’s disturbance within the reef lagoon. However, gaps and openings at the north and south of the barrier promoted refraction processes and exposed conditions over seagrass meadows inside the reef lagoon. Sites with reduced disturbance enhanced seagrass meadow carbon accumulation in sediments, whilst sites with higher disturbance were related with lower organic carbon stock in meadow sediments (Figure 8).
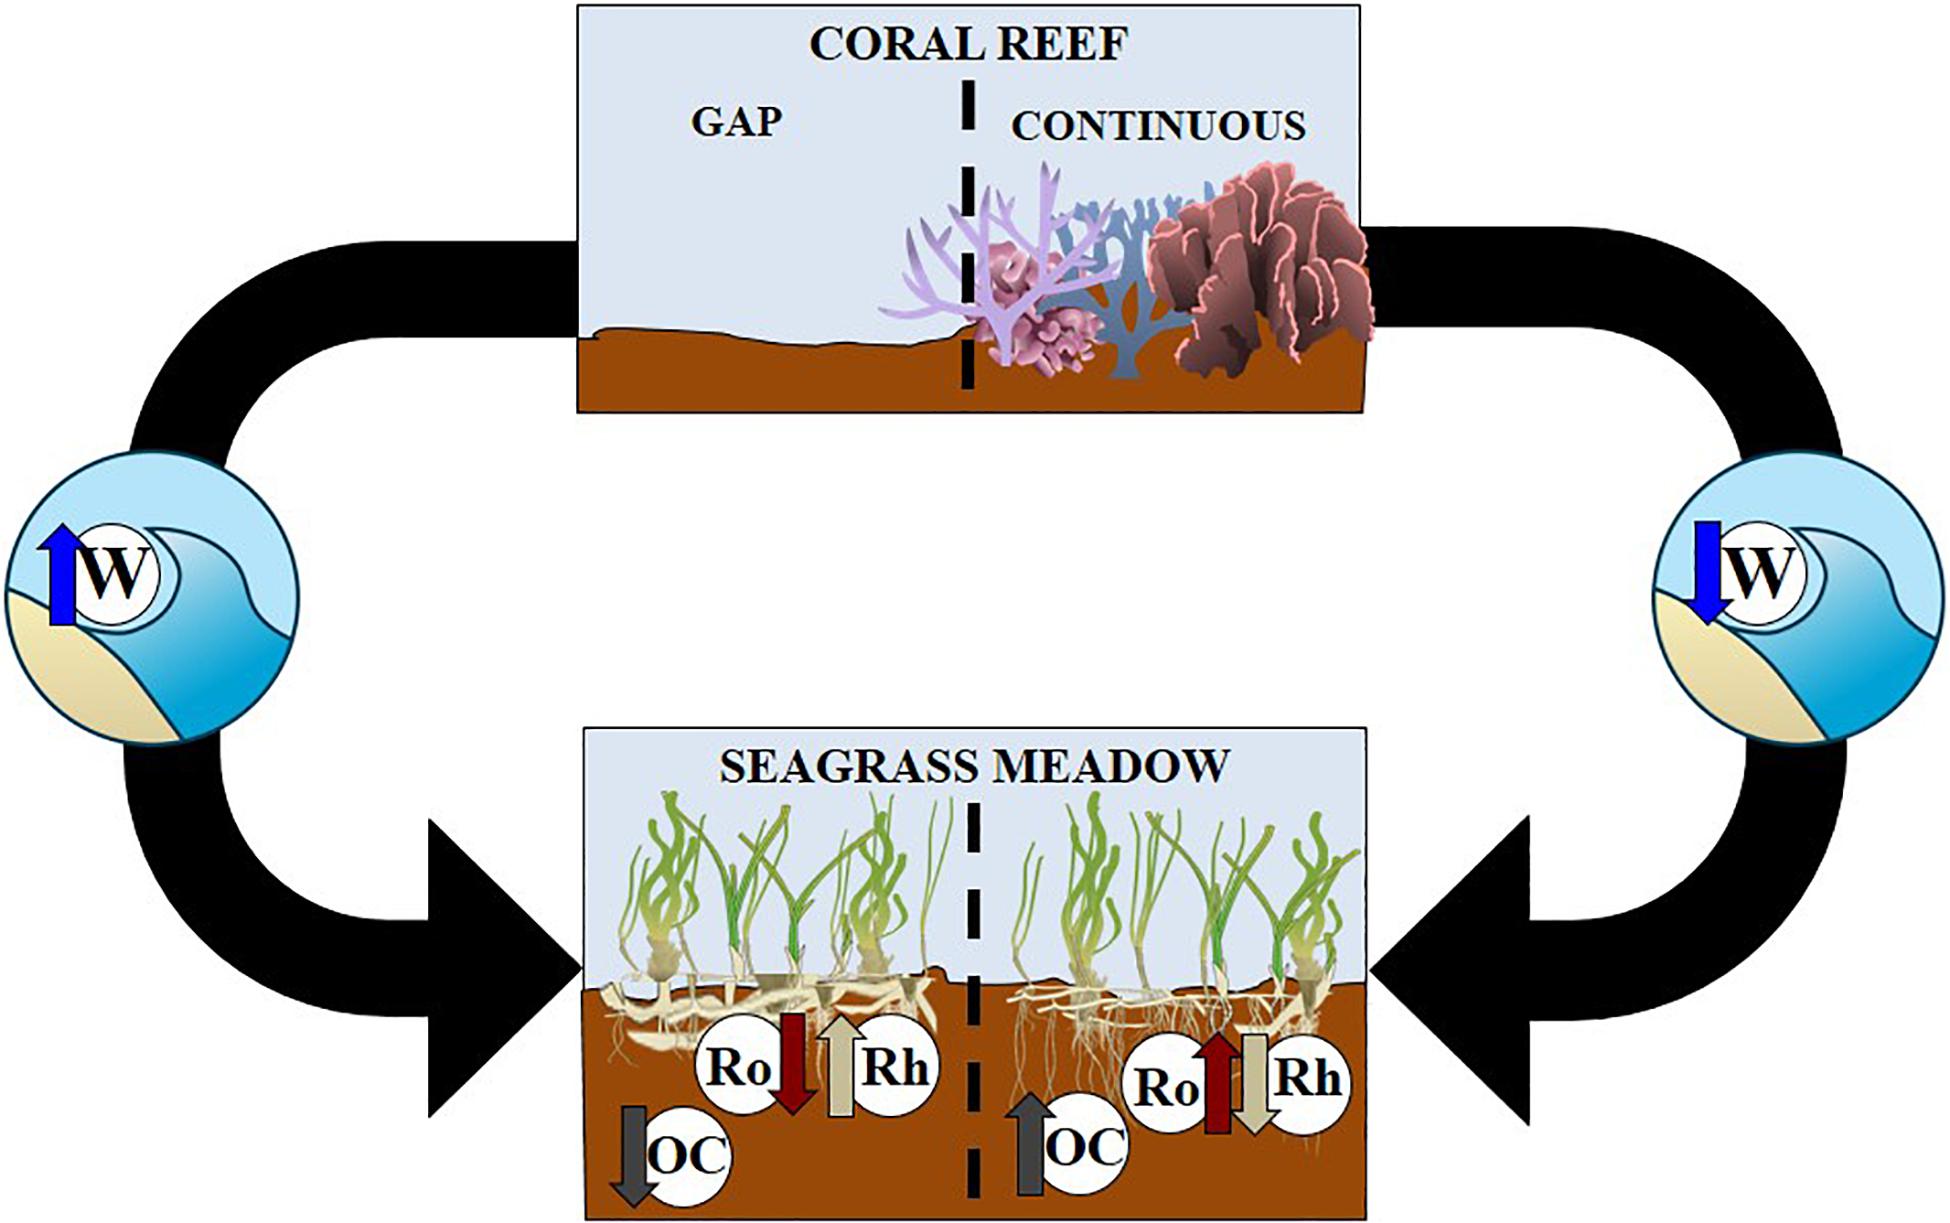
Figure 8. Conceptual diagram showing connected seascape of coral reefs (upper section) and seagrass meadows (lower section). Black arrows indicate connections between coral reefs with a gap (left hand side) and continuous (right hand side) with seagrass meadows. Letters are as follows W is waves, OC is sediment organic carbon, Ro represents roots and Rh is seagrass rhizomes.
This reef barrier function also increased organic carbon stock sequestered by seagrass living biomass in sheltered conditions. Additionally, these conditions promoted responses in T. testudinum and other seagrass plants, for example the redistribution of their biomass to rhizomes in exposed conditions (Figure 5 and Supplementary Table S7). Disturbance is a key factor explaining differences in sediment variables inside the reef lagoon.
Wave Disturbance in Seagrass Meadows
Within the reef lagoon, four sampling sites in the seagrass meadows, under a different level of exposure to wave energy due to continuity discontinuity characteristics of the reef, were selected. From north to south of the lagoon, these sampling sites are: SPB, MUD, OPR and RCB (Figure 1). The wave’s direction within the reef lagoon is from the east in the majority of cases. Differences in the linear density of waves crest among sampling sites were attributed to the coral reef barrier regulation effect (Lugo-Fernández et al., 1992; Hardy and Young, 1996; Ferrario et al., 2014; Harris et al., 2018). Areas where crests cannot be observed correspond with undistinguishable waves and therefore the lowest disturbance factor i.e., sheltered sites, this was found in harbor and Old Point Regional Park where the continuous barrier reduces wave energy in breaking waves. Sprat Bay and Rocky Cay Bay showed higher disturbance factors, because gaps in the barrier permitted waves to enter the reef lagoon and attenuation is lower than at the reef crest. These sites are referred to as exposed sites.
Patterns observed in sediment samples variables supported our classification of exposed or sheltered sites. Granulometric evenness (H’ index) suggested disturbance factors modulate granulometry in seagrass sediments, where low disturbance factors in sheltered sites corresponds to more even sediment type distribution than in exposed sites (high disturbance), these sites also indicated a lesser capacity to conserve fine sediments than sheltered sites, because this function is modulated by disturbance linked to wave intensity (Folmer et al., 2012). In exposed sites, hydrodynamics were more energetic, and these conditions promoted sandy sediments transported close to the shore because wave action and shallow water currents have sufficient energy to transport them (de Boer, 2007; Potouroglou et al., 2017). In these sites, medium size sediments dominated the granulometric profile and lower organic matter stock was observed.
Continuous Coral Reef Barrier Increases Sediment Organic Carbon
A vital ecosystem services coral reefs provide is to protect coastal areas from storm surges and hurricanes (Guannel et al., 2016). Within connected coastal seascapes they are also thought to alter hydrodynamic energy sufficiently to allow for establishment and expansion seagrass meadows require (Gillis et al., 2014a,b). Seagrass meadows themselves have been found to be globally important carbon sinks, due to ecosystem engineers (seagrass plants) reducing the water current to allow for carbon accumulation (van Katwijk et al., 2010; Lavery et al., 2013). In this research we have found for the first time, connected coral reefs and seagrass meadows also show enhanced sediment organic carbon. Coral reefs protect coastal areas from sediment erosion from strong hydrodynamics at a seascape scale (Saunders et al., 2014; Guannel et al., 2016). Additionally, coral reefs could prevent sediment erosion which also favors organic carbon burial and stock accumulation in the long-term at a more local scale.
Seagrass meadows within a reef lagoon play a functional role in conserving textural conditions in belowground top sediments (Duarte et al., 2005, 2013; Potouroglou et al., 2017). Sheltered sites tended to accumulate more mud-like sediments and consequently more organic matter in sediments than exposed sites (Folmer et al., 2012; Hossain et al., 2014). This was due to reduced wave intensity, and the disturbance factor had lesser effects on filter capacity of seagrass leaves. Fine sediments are a key factor for conserving organic matter and organic carbon in seagrass meadow sediments, because mud-like sediments prevent organic carbon resuspension and remineralization (Paterson and Black, 1992; Wentworth, 1992; van Katwijk et al., 2010; Folmer et al., 2012).
Our data showed organic matter and organic carbon in sediments had a higher mean in deep water meadows (>4 m depth) than shallow water meadows (<2 m depth) in exposed sites (Figure 5). Our data showed organic matter and organic carbon in sediments had a higher mean in deep water meadows (>4 m depth) than shallow water meadows (<2 m depth) in exposed sites (Figure 5). Our data showed organic matter and organic carbon in sediments had a higher mean in deep water meadows (>4 m depth) than shallow water meadows (<2 m depth) in exposed sites (Figure 5). In this sense, our results differ from those reported in previous studies were authors found lower Corg stocks in deeper meadows compared to shallower ones due to a decrease in seagrass productivity and biomass associated to the decrease in light availability with depth (Alcoverro et al., 1995; Collier et al., 2007; Serrano et al., 2014). However, in tropical latitudes there is a high incidence of light throughout the year, in fact in seagrass meadows from San Andrés island, transparency is 100% up to at least 10 m depth for much of the year (Rodríguez et al., 2010). Thus, in the study area, deep meadows are not limited by light availability and differences in Corg stocks with depth are mainly due to different exposure to hydrodynamic energy.
A higher wave intensity and turbulence in shallow water meadows of exposed sites were linked to greater quantities of sandy sediments in the belowground pool and a reduction in organic matter in sediments. Particulate organic sediments could be more easily trapped in deeper than shallower seagrass meadows because the wave intensity on the seafloor bottom is reduced thus decreasing effects of turbulence and decreasing friction over deposited sediments (Bird, 1994; Folmer et al., 2012). Organic carbon stock in sediments are comparable with regional data from the tropical western Atlantic (Figure 4 and Supplementary Table S2), which is the third highest among bioregions assessed by Fourqurean et al. (2012a). Organic carbon stock in MUD is similar to Corg stock in sediments in the tropical western Atlantic (150.9 ± 26.3 Mg Corg ha–1) and the South Atlantic (137.0 ± 56.8 Mg ha–1), but the other sites assessed in this study showed lower means.
Multi Effects on Seagrass Biomass Carbon Stocks
In this study we found differences across seasons for Thalassia testudinum, which has been observed in other studies (van Tussenbroek et al., 2014). Observed differences between T. testudinum above ground living biomass in both sampling periods (rainy and dry seasons) were attributable to increases in carbon biomass stock in sheltered sites. Similar to T. testudinum living biomass significant differences were observed between rainy and dry seasons for seagrass living biomass. Available data from the Caribbean monitoring of seagrass meadows suggest this oscillation is common and biomass tends to be higher in dry seasons compared to rainy seasons (Pérez et al., 2006; van Tussenbroek et al., 2014).
It was surprising to find no significant differences in values from T. testudinum for above ground living biomass among sampling sites, despite green leaves being the most vulnerable to changes in seawater conditions and disturbance factors (Hemminga and Duarte, 2000). However, there were significant differences in T. testudinum belowground living biomass related to disturbance factors and sediment variables. In exposed sites decreasing below ground biomass was observed whilst increasing depth correlated with greater biomass among sampling stations (Figure 7). The descriptive comparison between the ratios showed differences in the distribution of seagrass biomass between their belowground modules (Supplementary Table S7). When investigating further the ratio among living biomass in seagrass modules (roots to green leaves ratio) (Figure 6 and Supplementary Table S7) it was double the biomass in sheltered sites. This indicates seagrass plants invest 2-fold in the biomass of roots for the majority of sheltered sites compared to exposed conditions. This may be because of two reasons.
First seagrass plants in exposed conditions developed greater biomass in rhizomes than in roots, as a strong mechanism is required to anchor in sandy substrate. RCB and SPB had Rh:Ro ratios, which were higher than sites MUD (Figure 6A and Supplementary Table S7). Rhizome to root ratio in exposed conditions seagrass indicated they invested greater quantities in rhizome than root biomass compared to sheltered conditions. Seagrass response to disturbance in sandy substrates was to produce more rhizomes for anchorage as in agreement with other studies (Hemminga and Duarte, 2000; Hizon-Fradejas et al., 2009). A similar pattern was also seen for depth across sites. Shallower meadows showed higher below ground living biomass than deeper meadows. Because disturbance effects of waves are more intense closer to the shoreline, seagrass therefore increase their belowground biomass (mainly as rhizomes) to tolerate this disturbance (Hemminga and Duarte, 2000).
The second reason is that sediment is richer in organic matter, which could be a source of nitrogen (Fourqurean et al., 2012b; Kindeberg et al., 2018). Data supported the hypothesis that there is low availability of nitrogen in the water column over assessed seagrass meadows (Supplementary Table S1). Seagrass in sheltered conditions could use roots to uptake nitrogen, from organic matter available in sediments to sustain biomass especially in oligotrophic seawater around San Andrés island (Gavio et al., 2010; Abdul aziz et al., 2018; Supplementary Table S1). Therefore, nitrogen in organic matter could be a source of nitrogen for seagrass plants under sheltered conditions, whilst in exposed conditions waves may facilitate nitrogen uptake from the surrounding water (Supplementary Figure S2 and Supplementary Table S11). In these cases, stronger hydrodynamics are thought to allow for the reduction of the boundary layer thickness surrounding leaves which prevents them up-taking nutrients (Cornelisen and Thomas, 2004; Morris et al., 2008; Gillis et al., 2017).
Conclusion
Coral reefs facilitate blue carbon potential in seagrass meadows. Sediments in seagrass meadows protected by a reef barrier avoid erosion and enhance seagrass capacity to retain organic matter in soils. Loss of coral reef structure due to bleaching and other stressors will likely result in a reduction of the blue carbon storage capacity of adjacent seagrass meadow. Given that coral reefs and seagrass meadows in the tropics use to occur together (Huxham et al., 2018), this connective relationship between ecosystems could have global implications for carbon sequestration. Seagrass meadows in the reef lagoon showed a higher potential as a total carbon sink (Figure 8), in part because of inorganic sediments from coralline algae and coral fragments from the reef (Supplementary Table S11). This suggests these seagrass meadows potential function as an inorganic carbon sink and a particulate carbon filter, as they are retaining and trapping sediments richer in carbonates transported by bottom currents in the reef lagoon (Kennedy et al., 2010; Potouroglou et al., 2017; Saderne et al., 2019).
Here, we showed that traits of seagrass plants alter with exposed and sheltered sites (Figure 6), further research could contribute to this topic (Ackerly and Cornwell, 2007). Specifically, how traits may vary across different landscape gradients with different ecosystem matrixes. Traits are plastic and will be altered by environmental factors such as stress, which could come from global climate change or eutrophication. Monitoring programs in seagrass meadows addressing their integrity or health must also investigate measurements in the belowground pool, which are commonly evaded. New studies conducted in reef lagoons similar to this study must consider the high variability within the seagrass living biomass affected by factors as disturbance (wave’s intensity), depth and distance to the shore. Studies need to be holistic and monitor the entire seascape; in this research we did not consider the connectivity with mangrove forests. But previous research has found that seagrass carbon sequestration increases when seagrass meadows and mangrove forests are adjacent to each other (Chen et al., 2017; Huxham et al., 2018). Therefore, connectivity with all three systems needs to be further explored.
Data Availability Statement
The datasets generated for this study are available on request to the corresponding author, in the Supplementary Material and in ZMT database (https://www.spatialdatahub.org/pat/zmt-database/) through ID 591.
Author Contributions
LG-V conceived the study, performed the research, analyzed the data, contributed to the methods or models, and wrote the manuscript. LG contributed by analyzing the data, contributed to the methods or models, and helped to write the manuscript. JM-P conceived the study, supported the data analyzes, and wrote the manuscript. All authors contributed to the article and approved the submitted version.
Funding
Thanks to the Center for Excellence in Marine Science Corporation CEMarin, because the support and co-financing of the project and doctoral thesis in marine sciences “Evaluation of seagrass beds as carbon reservoirs: a case study in the Colombian Caribbean” in Universidad Nacional de Colombia, Contract No. 05-2016. Thanks to the Consejo Profesional de Biología CPBiol, because the partial financial support of this project, through Contract No. 13 of 2015. Thanks to COLCIENCIAS and COLFUTURO, because the co-financing of the project through Call No. 617. Also, thanks to Fundación ECO R-EVOLUTION for its partial financial support in travel expenses during the fieldwork.
Conflict of Interest
The authors declare that the research was conducted in the absence of any commercial or financial relationships that could be construed as a potential conflict of interest.
Acknowledgments
We thank ZMT chemistry laboratory to facilitate autoanalyzer use and Dr. B. Gavio for her independent revision of this manuscript.
Supplementary Material
The Supplementary Material for this article can be found online at: https://www.frontiersin.org/articles/10.3389/fmars.2020.00628/full#supplementary-material
Abbreviations
AG-SLB, aboveground – seagrass living biomass; AG-TLB, aboveground – Thalassia testudinum living biomass; BG-SLB, belowground – seagrass living biomass; BG-TLB, belowground – Thalassia testudinum living biomass; Corg, organic carbon; DBD, dry bulk density of sediments; Gl, biomass of green leaves in seagrass; H’, Shannon-Wiener index used to assess granulometric profile of sediments or evenness; LDW, linear density of wave’s crest; MUD, sampling site in the island harbor; OM-LOI, organic matter percentage (in sediments) determined by loss on ignition method; OMsed, organic matter in sediments; OPR, sampling site in the marine protected area of Old Point Regional Park of Mangrove; PCV, physical-chemical variables; RCB, sampling site in Rocky Cay bay; Rh, biomass of rhizomes in seagrass; Ro, biomass of roots in seagrass; SLB, seagrass living biomass; SPB, sampling site in Sprat bay; TC, total carbon; TLB, Thalassia testudinum living biomass; TN, total nitrogen.
References
Abdul aziz, P., Mancera-Pineda, J. E., and Gavio, B. (2018). Rapid assessment of coastal water quality for recreational purposes: methodological proposal. Ocean Coast. Manag. 151, 118–126. doi: 10.1016/j.ocecoaman.2017.10.014
Ackerly, D. D., and Cornwell, W. K. (2007). A trait-based approach to community assembly: partitioning of species trait values into within- and among-community components. Ecol. Lett. 10, 135–145. doi: 10.1111/j.1461-0248.2006.01006.x
Alcoverro, T., Duarte, C. M., and Romero, J. (1995). Annual growth dynamics of Posidonia oceanica: contribution of large-scale versus local factors to seasonality. Mar. Ecol. Prog. Ser. 120, 203–210. doi: 10.3354/meps120203
American Public Health Association [APHA], (1992). Standard Methods For The Examination Of Water And Wastewater, 20th Edn, Washington, DC: American Public Health Association.
Arellano-Méndez, L. U., Herrera-Silveira, J. A., Montero-Muñoz, J. L., and De los Angeles Liceaga-Correa, M. (2011). Morphometric trait variation in Thalassia testudinum (Banks ex König) associated to environmental heterogeneity in a subtropical ecosystem. J. Ecosyst. Ecogr. S1:001. doi: 10.4172/2157-7625.S1-001
Arias-Ortiz, A., Serrano, O., Masqué, P., Lavery, P. S., Mueller, U., Kendrick, G. A., et al. (2018). A marine heat wave drives massive losses from the world’s largest seagrass carbon stocks. Nat. Clim. Chang. 8, 338–344. doi: 10.1038/s41558-018-0096-y
Barry, S. C., Bianchi, T. S., Shields, M. R., Hutchings, J. A., Jacoby, C. A., and Frazer, T. K. (2018). Characterizing blue carbon stocks in Thalassia testudinum meadows subjected to different phosphorus supplies: a lignin biomarker approach. Limnol. Oceanogr. 63, 2630–2646. doi: 10.1002/lno.10965
Bouillon, S., and Connolly, R. M. (2009). “Carbon exchange among tropical coastal ecosystems” in Ecological Connectivity Among Tropical Coastal Ecosystems, ed. I. Nagelkerken, (Dordecht: Springer), 45–70. doi: 10.1007/978-90-481-2406-0
Bird, E. C. (1994). “Physical setting and geomorphology of coastal lagoons (Chapter 2),” in Coastal Lagoon Processes, Vol. 60, ed. B. Kjerfve, (Amsterdam: Elsevier Oceanography Series), 9–39. doi: 10.1016/s0422-9894(08)70007-2
Burkholder, J. M., Tomasko, D. A., and Touchette, B. W. (2007). Seagrasses and eutrophication. J. Exper. Mar. Biol. Ecol. 350, 46–72. doi: 10.1016/j.jembe.2007.06.024
Chen, G., Huzni Azkab, M., Chmura, G. L., Chen, S., Sastrasuwondo, P., Ma, Z., et al. (2017). Mangroves as a major source of soil carbon storage in adjacent seagrass meadows. Sci. Rep. 7:42406. doi: 10.1038/srep42406
Christianen, M. J. A., van Belzen, J., Herman, P. M. J., van Katwijk, M. M., Lamers, L. P. M., van Leent, P. M. J., et al. (2013). Low-canopy seagrass beds still provide important coastal protection services. PLoS One 8:e62413. doi: 10.1371/journal.pone.0062413
Collier, C., Lavery, P., Masini, R., and Ralph, P. (2007). Morphological, growth and meadow characteristics of the seagrass Posidonia sinuosa along a depth-related gradient of light availability. Mar. Ecol. Prog. Ser. 337, 103–115. doi: 10.3354/meps337103
Cornelisen, C. D., and Thomas, F. I. M. (2004). Ammonium and nitrate uptake by leaves of the seagrass Thalassia testudinum: impact of hydrodynamic regime and epiphyte cover on uptake rates. J. Mar. Syst. 49, 177–194. doi: 10.1016/j.jmarsys.2003.05.008
de Boer, W. F. (2007). Seagrass-sediment interactions, positive feedbacks and critical thresholds for occurrence: a review. Hydrobiologia 591, 5–24. doi: 10.1007/s10750-007-0780-9
de los Santos, C. B., Onoda, Y., Vergara, J. J., Pérez-Lloréns, J. L., Bouma, T. J., and La Nafie, Y. A. (2016). A comprehensive analysis of mechanical and morphological traits in temperate and tropical seagrass species. Mar. Ecol. Prog. Ser. 551, 81–94. doi: 10.3354/meps11717
Díaz, J. M., Barrios, L. M., and Gómez-López, D. I. (2003). Las Praderas De Pastos Marinos En Colombia: Estructura Y Distribución De Un Ecosistema Estratégico, Serie Publicaciones Especiales No. 10. Santa Marta: INVEMAR.
Duarte, C. M. (1990). Seagrass nutrient content. Mar. Ecol. Prog. Ser. 67, 201–207. doi: 10.3354/meps067201
Duarte, C. M., Losada, I. J., Hendriks, I. E., Mazarrasa, I., and Marbà, N. (2013). The role of coastal plant communities for climate change mitigation and adaptation. Nat. Clim. Chang. 3, 961–968. doi: 10.1038/nclimate1970
Duarte, C. M., Middelburg, J. J., and Caraco, N. (2005). Major role of marine vegetation on the oceanic carbon cycle. Biogeosciences 2, 1–8. doi: 10.5194/bg-2-1-2005
Ferrario, F., Beck, M. W., Storlazzi, C. D., Micheli, F., Shepard, C. C., and Airoldi, L. (2014). The effectiveness of coral reefs for coastal hazard risk reduction and adaptation. Nat. Commun. 5:3794. doi: 10.1038/ncomms4794
Folmer, E. O., van der Geest, M., Jansen, E. J., Olff, H., Anderson, T. M., Piersma, T., et al. (2012). Seagrass-sediment feedback: an exploration using a non-recursive structural equation model. Ecosystems 15, 1380–1393. doi: 10.1007/s10021-012-9591-6
Fourqurean, J. W., Duarte, C. M., Kennedy, H., Marbà, N., Holmer, M., Mateo, M. A., et al. (2012a). Seagrass Meadows as a globally significant carbon stock. Nat. Geosci. 5, 505–509.
Fourqurean, J. W., Kendrick, G. A., Collins, L. S., Chambers, R. M., and Vanderklift, M. A. (2012b). Carbon, nitrogen and phosphorus storage in subtropical seagrass meadows: examples from Florida Bay and Shark Bay. Mar. Freshw. Res. 63, 967–983.
Gavio, B., Palmer-Cantillo, S., and Mancera, J. E. (2010). Historical analysis (2000-2005) of the coastal water quality in San Andrés Island, SeaFlower biosphere reserve, Caribbean Colombia. Mar. Pollut. Bull. 60, 1018–1030. doi: 10.1016/j.marpolbul.2010.01.025
Gillis, L. G., Bouma, T. J., Jones, C. G., van Katwijk, M. M., Nagelkerken, I., Jeuken, C. J. L., et al. (2014a). Potential for landscape-scale positive interactions among tropical marine ecosystems. Mar. Ecol. Prog. Ser. 503, 289–303. doi: 10.3354/meps10716
Gillis, L. G., Ziegler, A. D., van Oevelen, D., Cathalot, C., Herman, P. M. J., Wolters, J. W., et al. (2014b). Tiny is mighty: seagrass beds have a large role in the export of organic material in the tropical coastal zone. PLoS One 9:e111847. doi: 10.1371/journal.pone.0111847
Gillis, L. G., Paul, M., and Bouma, T. (2017). Opportunities for protecting and restoring tropical coastal ecosystems by utilizing a physical connectivity approach. Front. Mar. Sci. 4:374. doi: 10.3389/fmars.2017.00374
Guannel, G., Arkema, K., Ruggiero, P., and Verutes, G. (2016). The power of three: coral reefs seagrasses and mangroves protect coastal regions and increase their resilience. PLoS One 11:e0158094. doi: 10.1371/journal.pone.0158094
Guerra-Vargas, V. A., and Guerra-Vargas, L. A. (2017). “Determinaci n y cartografía del área de los pastos marinos del lagoon arrecifal de la isla de San Andrés,” in VI Seminario Las Ciencias del Mar en la Universidad Nacional de Colombia “20 Años de la sede Caribe”, ed. CECIMAR (San Andrés Isla: Universidad Nacional de Colombia sede Caribe), 40.
Gullström, M., Lyimo, L. D., Dahl, M., Samuelsson, G. S., Eggertsen, M., Anderberg, E., et al. (2018). Blue carbon storage in tropical seagrass meadows relates to carbonate stock dynamics, plant-sediment processes, and landscape context: insights from the Western Indian Ocean. Ecosystems 21, 551–566. doi: 10.1007/s10021-017-0170-8
Hardy, T. A., and Young, I. R. (1996). Field study of water attenuation on an offshore coral reef. J. Geophys. Res. 101, 14311–14326. doi: 10.1029/96jc00202
Harris, D. L., Rovere, A., Casella, E., Power, H., Canavesio, R., Collin, A., et al. (2018). Coral reef structural complexity provides important coastal protection from waves under rising sea levels. Sci. Adv. 4:eaao4350. doi: 10.1126/sciadv.aao4350
Hizon-Fradejas, A. B., Nakano, Y., Nakai, S., Nishijima, W., and Mitsumasa, O. (2009). Anchorage and resistance to uprooting forces of eelgrass (Zostera marina L.) shoots planted in slag substrates. J. Water Environ. Technol. 7, 91–101. doi: 10.2965/jwet.2009.91
Hossain, M. B., Marshall, D. J., and Venkattramanan, S. (2014). Sediment granulometry and organic matter content in the intertidal zone of the Sungai Brunei estuarine system, northwest coast of Borneo. Carpathian J. Earth Enviro. Sci. 9, 231–239.
Howard, J., Hoyt, S., Isensee, K., Pidgeon, E., and Telszewski, M. (2014). “field sampling of soil carbon pools in coastal ecosystems,” in Coastal Blue Carbon: Methods for Assessing Carbon Stocks and Emissions Factors in Mangroves, Tidal Salt Marshes, and Seagrasses, Chap. 3, eds J. Howard, S. Hoyt, K. Isensee, M. Telszewski, and E. Pidgen, (Arlington, VI: UNESCO).
Huxham, M., Whitlock, D., Githaiga, M., and Dencer-Brown, A. (2018). Carbon in the coastal seascape: how interactions between mangrove forests, seagrass meadows and tidal marshes influence carbon storage. Curr. Forest. Rep. 4, 101–110. doi: 10.1007/s40725-018-0077-4
IGAC (1986). San Andr s y Providencia. Aspectos Geogr ficos. Bogot : Instituto Geogr fico Agust n Codazzi (IGAC).
Kennedy, H., Beggins, J., Duarte, C. M., Fourqurean, J. W., Holmer, M., Marbá, N., et al. (2010). Seagrass sediments as a global carbon sink: isotopic constraints. Glob. Biogeochem. Cycles 24:GB4026. doi: 10.1029/2010GB003848
Kindeberg, T., Ørberg, S. B., Röhr, M. E., Holmer, M., and Krause-Jensen, D. (2018). Sediment stocks of carbon, nitrogen, and phosphorus in danish eelgrass Meadows. Front. Mar. Sci. 5:474. doi: 10.3389/fmars.2018.00474
Koch, E. W., Ackerman, J. D., Verduin, J., and van Keulen, M. (2006). “Fluid dynamics in seagrass ecology-from molecules to ecosystems,” in Seagrasses: Biology, Ecology and Conservation, eds A. W. D. Larkum, R. J. Orth, and C. M. Duarte, (Amsterdam: Springer), 193–225. doi: 10.1007/1-4020-2983-7_8
Lavery, P. S., Mateo, M. A., Serrano, O., and Rozaimi, M. (2013). Variability in the carbon storage of seagrass habitats and its implications for global estimates of blue carbon ecosystem service. PLoS One 8:e73748. doi: 10.1371/journal.pone.0073748
Lee, K., and Dunton, K. H. (2000). Effects of nitrogen enrichment on biomass allocation, growth, and leaf morphology of the seagrass Thalassia testudinum. Mar. Ecol. Prog. Ser. 196, 39–48. doi: 10.3354/meps196039
Lee, K., Park, S. R., and Kim, Y. K. (2007). Effects of irradiance, temperature, and nutrients on growth dynamics of seagrasses: a review. J. Exper. Mar. Biol. Ecol. 350, 144–175. doi: 10.1016/j.jembe.2007.06.016
Lugo-Fernández, A., Roberts, H. H., and Wiseman, W. J. (1992). Tide effects on wave attenuation and wave set-up on a Caribbean coral reef. Estuar. Coast. Shelf Sci. 47, 385–393. doi: 10.1006/ecss.1998.0365
McDonald, A. M., Prado, P., Heck, K. L., Fourqurean, J. W., Frankovich, T. A., Dunton, K. H., et al. (2016). Seagrass growth, reproductive, and morphological plasticity across environmental gradients over a large spatial scale. Aquat. Bot. 134, 87–96. doi: 10.1016/j.aquabot.2016.07.007
Mcleod, E., Chmura, G. L., Bouillon, S., Salm, R., Björk, M., Duarte, C. M., et al. (2011). A blueprint for blue carbon: toward an improved understanding of the role of vegetated coastal habitats in sequestering CO2. Front. Ecol. Environ. 9, 552–560. doi: 10.1890/110004
Medina-Gómez, I., Madden, C. J., Herrera-Silveira, J., and Kjerfve, B. (2016). Response of Thalassia testudinum morphometry and distribution to environmental drivers in a pristine tropical lagoon. PLoS One 11:e0164014. doi: 10.1371/journal.pone.0164014
Morris, E. P., Peralta, G., Brun, F. G., van Duren, L., Bouma, T. J., and Perez-Llorens, J. L. (2008). Interaction between hydrodynamics and seagrass canopy structure: spatially explicit effects on ammonium uptake rates. Limnol. Oceanogr. 53, 1531–1539. doi: 10.4319/lo.2008.53.4.1531
Paterson, D., and Black, K. (1992). Water flow, sediment dynamics and benthic biology. Adv. Ecol. Res. 29, 155–193. doi: 10.1016/s0065-2504(08)60193-2
Pérez, D., Guevara, M., and Bone, D. (2006). Temporal variation of biomass and productivity of Thalassia testudinum (Hydrocharitaceae) in Venezuela, Southern Caribbean. Intern. J. Trop. Biol. 54, 329–339.
Potouroglou, M., Bull, J. C., Krauss, K. W., Kennedy, H., Fusi, M., Dafonchio, D., et al. (2017). Measuring the role of seagrasses in regulating sediment surface elevation. Sci. Rep. 7:11917. doi: 10.1038/s41598-017-12354-y
Rodríguez, A., Mancera, P. J. E., and Gavio, B. (2010). Survey of benthic dinoflagellates associated to beds of Thalassia testudinum in San Andrés island, Seaflower biosphere reserve, Caribbean Colombia. Acta biol. Colomb. 15, 231–248.
Saderne, V., Geraldi, N. R., Macreadie, P. I., Maher, D. T., Middelburg, J. J., Serrano, O., et al. (2019). Role of carbonate burial in blue carbon budgets. Nat. Commun. 10:1106. doi: 10.1038/s41467-019-08842-6
Saunders, M. I., Leon, J. X., Callaghan, D. P., Roelfsema, C. M., Hamilton, S., Brown, C. J., et al. (2014). Interdependency of tropical marine ecosystems in response to climate change. Nat. Clim. Chang. 4, 724–729. doi: 10.1038/nclimate2274
Serrano, O., Lavery, P. S., Rozaimi, M., and Mateo, M. A. (2014). Influence of water depth on the carbon sequestration capacity of seagrasses. Glob. Biogeochem. Cycles 28, 950–961. doi: 10.1002/2014GB004872
Serrano, O., Lovelock, C. E., Atwood, T., Macreadie, P., Canto, R., Phinn, S., et al. (2019). Australian vegetated coastal ecosystems as global hotspots for climate change mitigation. Nat. Commun. 10:4313. doi: 10.1038/s41467-019-12176-8
van Katwijk, M. M., Bos, A. R., Hermus, D. C. R., and Suykerbuyk, W. (2010). Sediment modification by seagrass beds: muddification and sandification induced by plant cover and environmental conditions. Estuar. Coast. Shelf Sci. 89, 175–181. doi: 10.1016/j.ecss.2010.06.008
van Tussenbroek, B., Cortés, J., Collin, R., Fonseca, A. C., Gayle, P. M., Guzmán, H. M., et al. (2014). Caribbean-wide, long-term study of seagrass beds reveals local variations, shifts in community structure and occasional collapse. PLoS One 9:e90600. doi: 10.1371/journal.pone.0090600
Keywords: organic carbon stock, Caribbean, connectivity, ecosystem service, reef lagoon, living biomass, sediments, Thalassia testudinum
Citation: Guerra-Vargas LA, Gillis LG and Mancera-Pineda JE (2020) Stronger Together: Do Coral Reefs Enhance Seagrass Meadows “Blue Carbon” Potential? Front. Mar. Sci. 7:628. doi: 10.3389/fmars.2020.00628
Received: 07 February 2020; Accepted: 09 July 2020;
Published: 29 July 2020.
Edited by:
Juan Armando Sanchez, University of Los Andes, ColombiaReviewed by:
Megan Irene Saunders, CSIRO Oceans and Atmosphere (O&A), AustraliaInés Mazarrasa, Environmental Hydraulics Institute (IHCantabria), Spain
Copyright © 2020 Guerra-Vargas, Gillis and Mancera-Pineda. This is an open-access article distributed under the terms of the Creative Commons Attribution License (CC BY). The use, distribution or reproduction in other forums is permitted, provided the original author(s) and the copyright owner(s) are credited and that the original publication in this journal is cited, in accordance with accepted academic practice. No use, distribution or reproduction is permitted which does not comply with these terms.
*Correspondence: Luis Alberto Guerra-Vargas, laguerravar@unal.edu.co; Lucy Gwen Gillis, lucy.gillis@leibniz-zmt.de