Plankton Community Changes From Warm to Cold Winters in the Oligotrophic Subtropical Ocean
 Laia Armengol
 Gara Franchy
  Santiago Hernández-León
- Instituto de Oceanografía y Cambio Global, IOCAG, Universidad de Las Palmas de Gran Canaria, Unidad Asociada ULPGC-CSIC, Las Palmas de Gran Canaria, Spain
Subtropical gyres are large areas of the ocean characterized by high stratification, low nutrients, and low primary production. The Canary Current System (CanCS) shows a rather strong seasonal thermocline during most of the annual cycle, which erodes through convective mixing from January to March promoting the so-called Late Winter Bloom (LWB). Atmospheric deposition from the Sahara desert is also another key feature of the CanCS providing additional nutrients to the euphotic zone. As a consequence of global warming, these oligotrophic regimes systems are expanding and the temperature increase affects phytoplankton, and reverberate on the food web structure and biogeochemical cycles. In the CanCS, the effect of warming and dust deposition on the planktonic community remains poorly know. Here, we show the effects of a 0.5°C increase in ocean temperature during two consecutive years. During 2011, winter temperature allowed the development of the LWB, promoting the increase of autotrophic cells and the coexistence of the microbial loop and the “classic” trophic web. The former predominated before and after the LWB, while the latter prevailed during the LWB. The rather high temperature during 2010 prevented the LWB development, causing highly oligotrophic conditions and episodic events of Saharan dust contributing to nutrient inputs. During this warm year, we found a dominance of small cells such as nanoflagellates and dinoflagellates, and surprisingly high biomass of mesozooplankton, hinting at the “tunneling effect” as an alternative trophic pathway (rapid uptake of phosphate by prokaryotes which are consumed by flagellates and then by zooplankton). These changes show the impact of a slight increase in temperature in this oligotrophic system and how future scenarios in the context of global warming could promote considerable shifts in the trophic web structure.
Introduction
Subtropical gyres include large oligotrophic areas of the ocean in which, despite the low nutrient concentration, complex trophic webs are common (Longhurst, 1998), and episodic annual production rates could be as high as in temperate ecosystems (Menzel and Ryther, 1961). The seasonal and interannual production cycle in north subtropical gyres is fairly well known from the Ocean Long-Term Time-Series Stations at Hawaii (HOT) and Bermuda (BATS). In these subtropical regions, light is not a limiting factor and nutrient regeneration supports production during most of the annual cycle (Dugdale and Goering, 1967). Sea surface cooling and some episodic wind stirring during winter promotes the deepening of the mixed layer, allowing nutrient enriched waters to reach the ocean surface promoting the so-called Late Winter Bloom (LWB; Menzel and Ryther, 1961).
The Canary Current System (CanCS), located in the eastern North Atlantic subtropical gyre, is characterized by oligotrophic waters due to strong stratification during most of the year (De Leon and Braun, 1973; Braun, 1980). During winter, surface cooling erodes the thermocline allowing nutrient input into the photic layer (De Leon and Braun, 1973; Braun, 1980; Barton et al., 1998; Arístegui et al., 2001; Cianca et al., 2007; Neuer et al., 2007), promoting maximum values of chlorophyll a (Chla) and primary production (De Leon and Braun, 1973; Braun, 1980; Arístegui et al., 2001). Micro- and mesozooplankton communities also increase during the winter bloom, taking advantage of the available resources (Hernández-León et al., 1984; Schmoker et al., 2012, 2014; Schmoker and Hernández-León, 2013).
Atmospheric deposition is another major source of limiting nutrients to the open ocean, and the Sahara desert also provide nutrients to the CanCS. Nitrogen and phosphorus are found in dust (Donaghay et al., 1992; Guerzoni et al., 1999; Duarte et al., 2006) as well as micronutrients such as iron, nickel, and cupper (Duce and Tindale, 1991; Jickells, 1999). Dust transports rather high concentrations of crustal elements involved in marine biological cycles such as silicate, aluminum, and manganese (Goudie and Middleton, 2001; Viana et al., 2002). Studies based on experiments of dust addition have reported the effect of nutrients from Saharan dust on phytoplankton growth (Bonnet et al., 2005; Herut et al., 2005; Duarte et al., 2006; Marañón et al., 2010; Giovagnetti et al., 2013; Pitta et al., 2017). However, the intensity of the response in the field is still not clear. Bishop et al. (2002) observed an enhanced biological response after a dust storm based on in situ particulate organic carbon and Chla in High Nutrient Low Chlorophyll (HNLC) waters of the North Pacific. Similarly, in oligotrophic waters of the South China Sea, Chla concentration increased significantly during a heavy dust year (Wang et al., 2012). However, Chami et al. (2012) observed a negative effect of dust on primary production in the subtropical Atlantic Ocean due to the attenuation of photosynthetic active radiation (PAR) produced by the dust aerosol layer in the atmosphere. In the Mediterranean Sea, a relationship between phytoplankton and dust was only observed when atmospheric events coincided with the stratified season (Eker-Develi et al., 2006; Volpe et al., 2009). Hence, it has been hypothesized that Saharan dust would only have a major influence on primary production at local and short-time scales, immediately after an atmospheric deposition event has taken place (Guerzoni et al., 1999).
The microbial loop controls most of the flow of energy and matter in subtropical gyres (Pomeroy, 1974; Azam et al., 1983; Longhurst, 1998). Picophytoplankton accounts for a large proportion of the primary productivity (Li et al., 1983), which is mostly consumed by nano- and micrograzers (Calbet and Landry, 2004; Armengol et al., 2019). Micrograzers control more than 80% of primary production in the CanCS (Arístegui et al., 2001; Marañón et al., 2007), and microzooplankton grazing has been pointed out as the principal mechanism limiting the phytoplankton growth both in artificial iron injections (Landry et al., 2000a, b; de Baar et al., 2005; Boyd et al., 2007; Henjes et al., 2007) and in dust addition experiments (Herut et al., 2005; Marañón et al., 2010). On the other hand, larger diatoms are the most favored organisms when primary production is artificially induced (Landry et al., 2000b; de Baar et al., 2005; Boyd et al., 2007; Henjes et al., 2007) because of their higher growth rates and a lower grazing pressure compared to prokaryotic algae (Landry et al., 2000a, b; Henjes et al., 2007; Armengol et al., 2017). Mesozooplankton controls microplankton (Schmoker and Hernández-León, 2013; Armengol et al., 2017), which mainly prey on non-pigmented organisms (Arístegui et al., 2001; Hernández-León et al., 2004). Finally, diel vertical migrants (mainly zooplankton a micronekton) exert a predation pressure on mesozooplankton (Moore, 1950; Uda, 1956; Angel, 1989; Hernández-León et al., 2010). Hence, all these trophic interactions modulate the planktonic variability and composition resulting in a succession of biomass peaks during the LWB in the Canary Island waters (Schmoker et al., 2012).
Ocean warming is promoting an expansion of oligotrophic gyres at a rate of 0.8–4.3% y–1 (McClain et al., 2004; Polovina et al., 2008; Irwin and Oliver, 2009). A number of studies have observed a decrease in phytoplankton biomass related to an increase in temperature (McClain et al., 2004; Gregg et al., 2005; Behrenfeld et al., 2006; Kahru et al., 2009; Boyce et al., 2010). Specifically, primary production in the subtropical gyres of the Atlantic Ocean has decreased due to increase in temperature and nitracline depth (Marañón et al., 2003). The decrease of autotrophic organisms affects the entire trophic web and biogeochemical cycles in the eutrophic zone (Sherr and Sherr, 1994; Jones, 2000; Boëchat et al., 2007; Assmy et al., 2014). Due to the continuous emissions of CO2 and the effect of greenhouse gases, modeling studies predict an increase of temperature in the ocean between 1.8 and 3.3°C by 2040 (Cai et al., 2014; Cheng et al., 2019). Considering how temperature influences phytoplankton, it is of paramount importance to know the effect of an increase in temperature on the natural planktonic community in order to predict future landscapes in the subtropical ocean.
The effect of warmer years on plankton community or the role of the different planktonic groups throughout the year remains poorly known in the CanCS. In order to better understand the complex trophic interactions in subtropical waters, we studied the planktonic community composition in these waters during a warm and a cold year. In the CanCS, the year 2010 was the warmest recorded for the last 30 years, reaching temperatures above 19°C throughout the year (Cropper et al., 2014). In order to study the episodic late winter bloom in these warm waters, we performed a weekly sampling covering the productive period during 2010 and 2011. Differences between bloom and non-bloom conditions and dust conditions were assessed, as well as the variability in terms of abundance, biomass, and primary productivity between two quite different years.
Materials and Methods
Sampling and Hydrographic Measurements
Weekly sampling was carried out in the Canary Islands waters to the north of Gran Canaria Island from February 2010 to June 2011 on board the R/V Atlantic Explorer. Three stations separated 10 nautical miles (Figure 1) were sampled in the mixed layer at 20 m depth using a General Oceanics rosette equipped with 4 L PVC Niskin bottles, Seabird-25 CTD, and a Turner Scufa Fluorometer. Mixed layer depth was estimated using an optimal linear fitting method (Chu and Fan, 2010), and employing the method proposed by Kelly (2018) in R programming language.
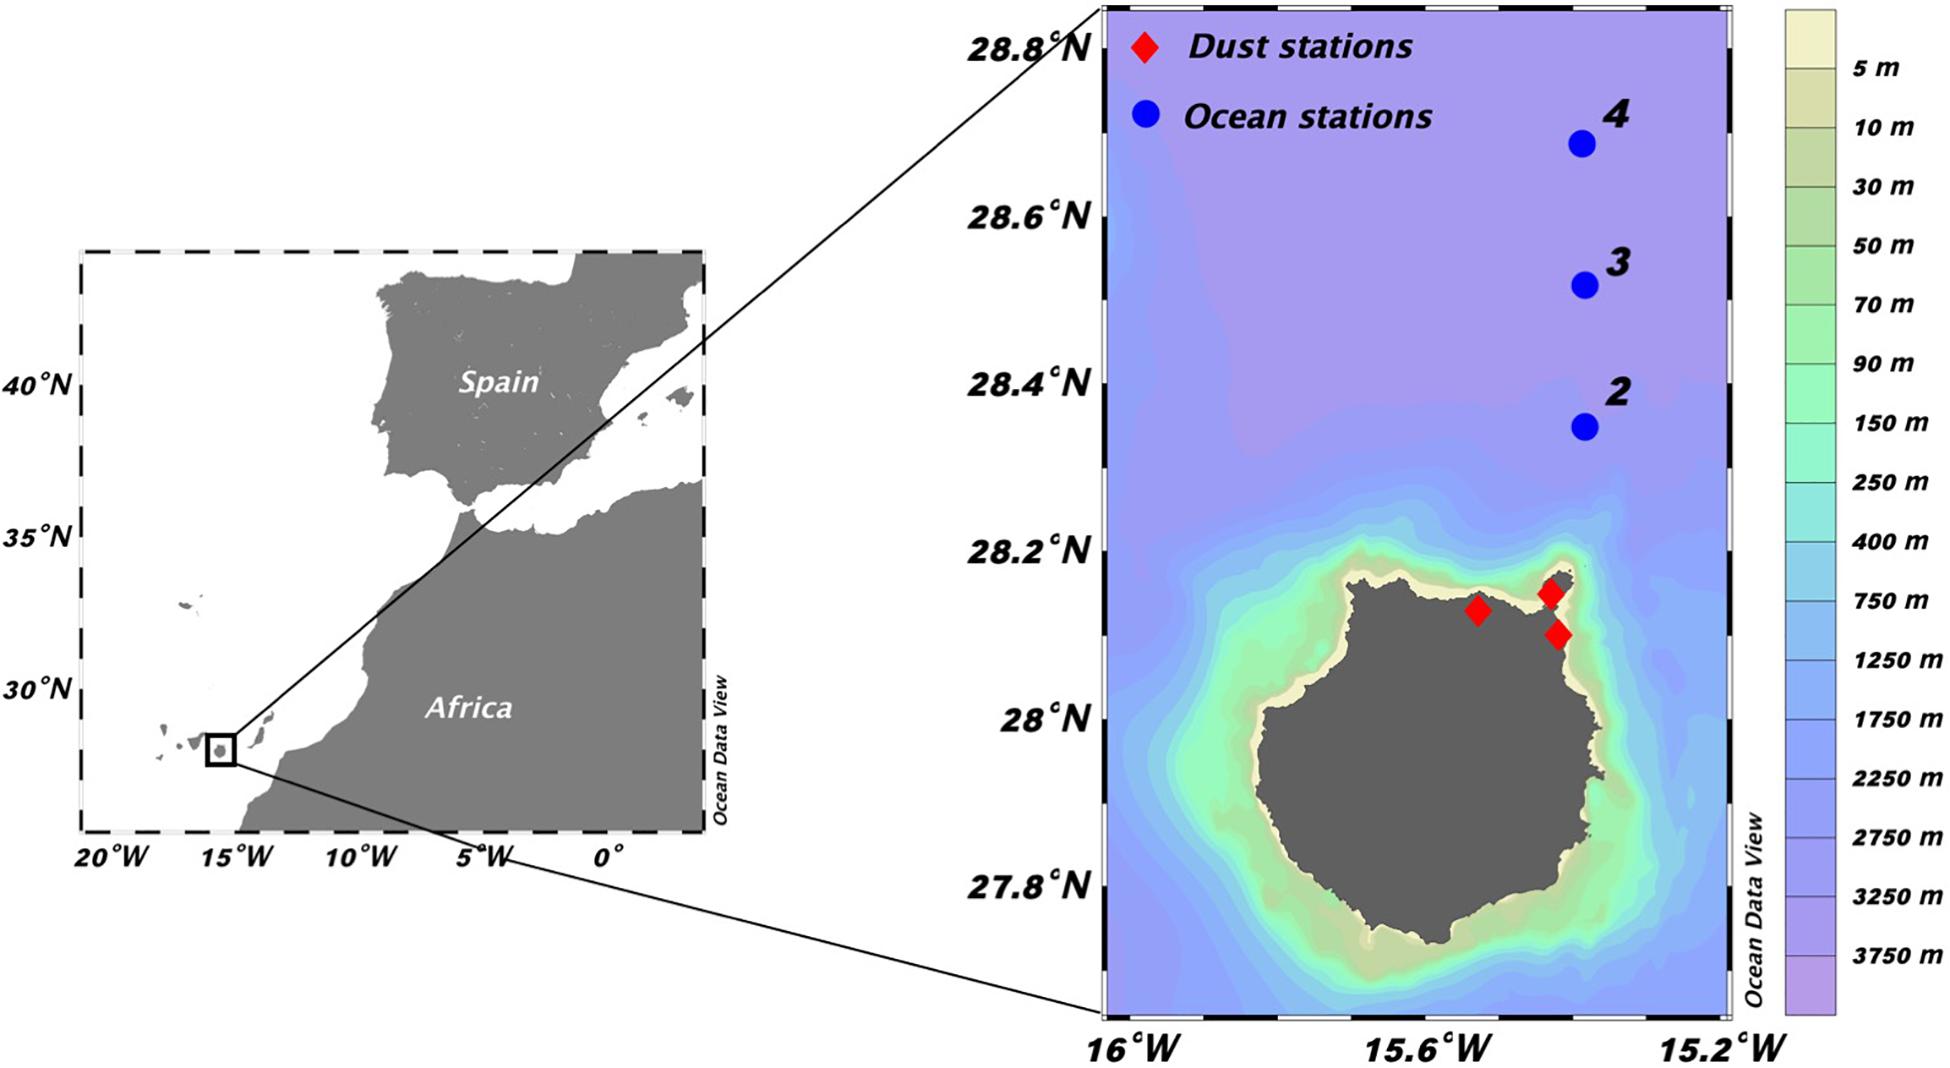
Figure 1. Location of the oceanographic stations ( ) and the dust stations (
 ) at the North of Gran Canaria (Canary Islands).
Nutrients
Inorganic nutrients were sampled from surface waters and analyzed using a Technicon II segmented-flow autoanalyzer and using the method of Armstrong et al. (1967) (see also Benavides et al., 2013).
Atmospheric Dust Measurements
Atmospheric particulate matter data were collected from Gobierno de Canarias web1. Dust concentration in our study is the average value of the three stations located north and northeast of Gran Canaria Island (Figure 1).
Primary Production
Primary production (PP) data were obtained from the Ocean Productivity website2 using the VGPM model following Behrenfeld and Falkowski (1997).
Chlorophyll a and Picoplankton
Samples of 500 mL were obtained for Chla at 20 m depth using a Niskin bottle, filtered through 25 mm Whatman GF/F filters, and stored frozen (−20°C) until their analysis in the laboratory. Pigments were extracted in cold (−20°C) acetone (90%) for 24 h and analyzed using an AU Turner Designs bench fluorometer previously calibrated with pure Chla (Sigma Aldrich) according to Yentsch and Menzel (1963), and acidified following Welschmeyer (1994). Picoplankton were sampled from the Niskin bottle, fixed with 20% of paraformaldehyde, incubated at 4°C for 30 min, placed in liquid nitrogen immediately after 30 min incubation, and stored at −80°C until their analysis. Autotrophic picoeukaryotes, Synechococcus, Prochlorococcus, and heterotrophic prokaryotes were counted by flow cytometry using a FACScalibur cytometer (Gasol and Del Giorgio, 2000).
Nano- and Microplankton Analysis
Samples of 45 ml of autotrophic and heterotrophic nanoflagellates were sampled, fixed with glutaraldehyde (0.3% final concentration), stored in the dark at 4°C until their filtration onto 25 mm polycarbonate filter with 0.45 μm pore size, and stained with diamidino-2-phenylindole (DAPI) following the procedure suggested by Haas (1982). The filter was then mounted on a microscope slide and analyzed by epifluorescence microscopy with a Zeiss Axiovert 35 microscope.
Samples of 500 ml of microplankton organisms were sampled from station 3 in a dark bottles, fixed with acid Lugol’s iodine (2% final concentration), and stored at room temperature in darkness until analysis. Aliquots of 100 mL of sample were placed in Utermöhl sedimentation chambers for 48 h, organisms counted using a Zeiss Axiovert 35 inverted microscope, and classified in main groups: diatoms, dinoflagellates, ciliates, tintinnids, and silicoflagellates.
Mesozooplankton
Mesozooplankton was sampled from 200 m depth to surface using a WP-2 equipped with 100 μm mesh net (UNESCO, 1968). Samples were fixed in 4% buffered formaldehyde and stored until analysis. In the laboratory, samples were sieved in size ranges (0.1–0.2, 0.2–0.5, 0.5–1 mm, and >1 mm) and dry weight obtained following Lovegrove (1966).
Microzooplankton Grazing Experiments
The dilution technique was used to estimate phytoplankton growth and microzooplankton grazing (Landry and Hassett, 1982; Landry et al., 1995). Seawater from station 4 was sampled at the mixed layer using a 30 L Niskin bottle. Briefly, seawater in treatments of 100, 75, 50, 25, and 10% whole seawater (WSW) were used for experiments during 2010, and 100, 70, 40, and 5% for experiments during 2011. WSW were incubated in 2.4 L polycarbonate Nalgene bottles in triplicate for 24 h simulating in situ conditions of light and temperature. To simulate in situ conditions, light was measured using a Secchi Disk, and then light attenuating meshes were used to reduce radiation over the incubated bottles. A continuous seawater input system was used to maintain temperature conditions. A concentration of 0.5 μM NH4Cl and 0.03 μM PO4 were added to each bottle to avoid phytoplankton growth limitation. Moreover, three bottles at 100% WSW were filled without adding nutrients to assess the effects of nutrient enrichment on phytoplankton growth. A 100% filtered seawater (FSW) was incubated to ensure the filtration system worked properly.
Growth (μ) and mortality by microzooplankton consumption (m) were determined for all planktonic groups by linear regression between net growth rate (ki) and dilution factor (Di):
where Ct and C0 are final and initial concentration respectively of Chla or specific organism abundance, and t is the incubation time (1 day). Mortality rate (m) is the slope of regression, while the y-intercept is the growth rate obtained from nutrient amended treatment (μn). Intrinsic growth rate (μ0) was calculated as:
Negative values of μ0 were converted to 0.001 d–1, while negative values of g were converted to 0 d–1 (Calbet and Landry, 2004). Daily production (P, μgC L–1 d–1) and consumption (G, μgC L–1 d–1) for every group was determined according Landry et al. (2000a):
Where C0 and Cm represent the initial and mean carbon concentration during incubation, respectively. The impact of microzooplankton consumption on production (%) was estimated as:
Biomass Conversion Factors
Converting abundance into carbon biomass allowed the comparison between organisms belonging to different taxonomic groups. The separation by size ranges within each taxonomic group also resulted in a more accurate and precise biomass data. Abundance of organisms were converted to biomass using conversion factors: Chla concentration was converted to carbon using a C:Chla ratio of 50 (Harris, 1986); while abundance of Prochlorococcus, Synechococcus, autotrophic picoeukaryotes and heterotrophic prokaryotes were converted using 29 fgC cell–1, 100 fgC cell–1 (Zubkov et al., 2000), 1500 fgC cell–1 (Zubkov et al., 1998), and 17 fgC cell–1 (Bode et al., 2001), respectively.
Abundances of nanoflagellates were converted to carbon using the biovolume (BV) estimated by microscopy and conversion factors of 220 fgC μm–3 for heterotrophic nanoflagellates (Borsheim and Bratbak, 1987) and 0.433(BV)0.863 pgC cell–1 (Verity et al., 1992) for autotrophic nanoflagellates. Finally, microplankton abundance was converted to biomass using total biovolume data obtained by microscopy fitting organisms to suitable shape (Hillebrand et al., 1999) and using the biomass conversion factor from Menden-Deuer and Lessard (2000):
Statistical Analysis
One-way analysis of variance (ANOVA) was used to test for significant differences in temperature, salinity, and atmospheric particulate matter for each station. When Kolmogorov-Smirnov Test (to evaluate the normality of data) failed, the Kruskal-Wallis One Way ANOVA was used. The ANOVA critical significance value p was given in the text to indicate the level of difference. The t-test was used to study the significant differences between 2010 and 2011 periods for each station. When Saphiro-Wilk test (to study normality) failed, we used the Mann-Whitney Rank Sum test. We conducted a Principal Component Analysis (PCA) to study the ordination of the organisms and physical-chemical variables to identify the essential components contributing to the total variance of organisms. We performed a stepwise multiple linear regression with both forward and backward selection to explore the relationships between organisms and environmental factors. Variance inflation factors (VIF > 6) were used to identify co-linearity between independent variables and removed before analysis (Zuur et al., 2009). Mallow’s Cp were applied to identify the best model. Pearson rank correlation was generated in order to observe the interconnection correlation between all environmental and biological variables, and the level of significance of the respective correlations.
Results
Environmental Parameters and Chlorophyll a
Two clear scenarios were observed during 2010 and 2011 winters. A highly stratified water column was found from February to June 2010, while we observed characteristic features of the LWB from February to April 2011 with an average depth of the mixed layer of 150 m (Figure 2). The water column was stratified from April to June 2011 as expected. During 2010 significantly higher temperature and salinity of 0.5 ± 0.05°C and 0.04 ± 0.02 (mean ± SD), respectively, were found in the photic layer compared to 2011 (Mann-Whitney Rank Sum, p < 0.05).
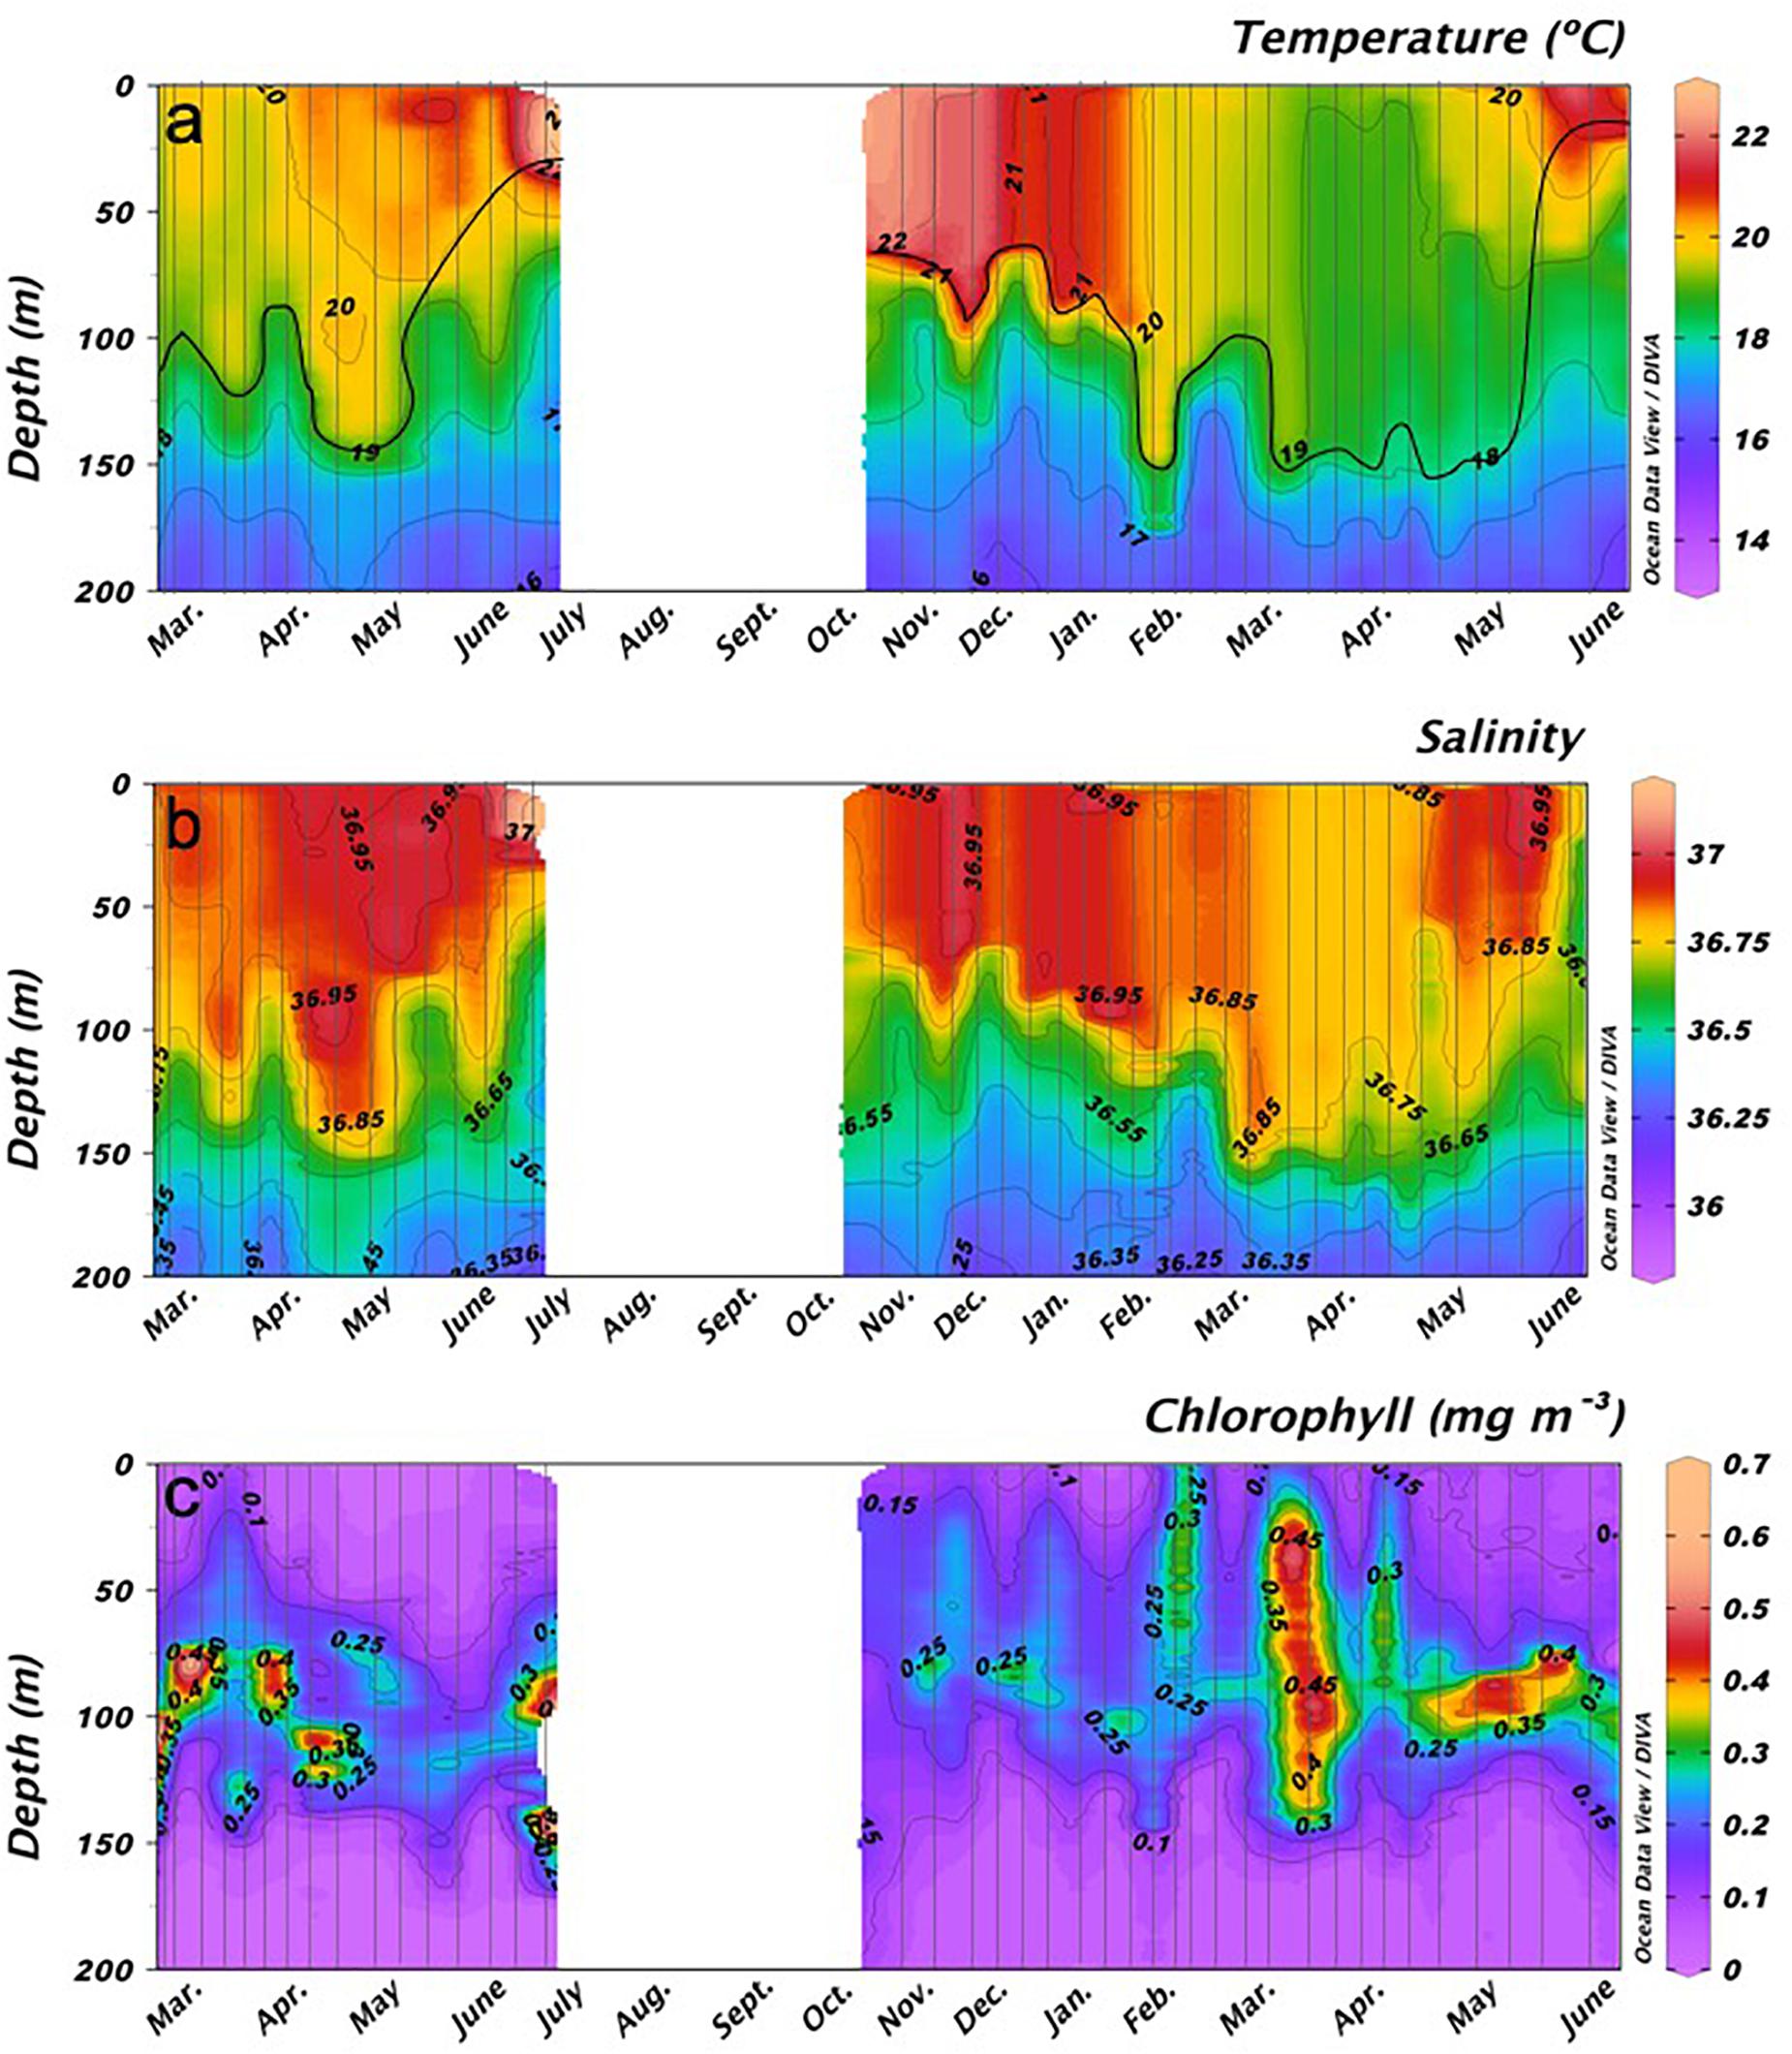
Figure 2. Temporal variability of average (A) temperature (°C), (B) salinity, and (C) Chlorophyll a (mgChla m– 3) from surface to 200 m in stations 2, 3, and 4. White spaces indicate no data available.
The deep chlorophyll maximum (DCM) was limited to a small depth range, reaching maximum values of 0.4 mg m–3 during February to April 2010; while in 2011 the DCM was wider and reached maximum values of 0.5 mg m–3 during the same period (Figure 2). Moreover, comparing May and June for both years, the DCM was stronger during 2011 (0.35–0.4 mg m–3) than during 2010 (0.2–0.25 mg m–3). Chla was explained at 62% by temperature, NO3 + NO2, PO43–, heterotrophic prokaryotes, and mesozooplankton (Table 1). Moreover, Chla showed a positive correlation with NO3 + NO2 and total nutrients (Spearman test, ρ = 0.49 p < 0.001 and ρ = 0.30 p < 0.001, respectively; Table 2).
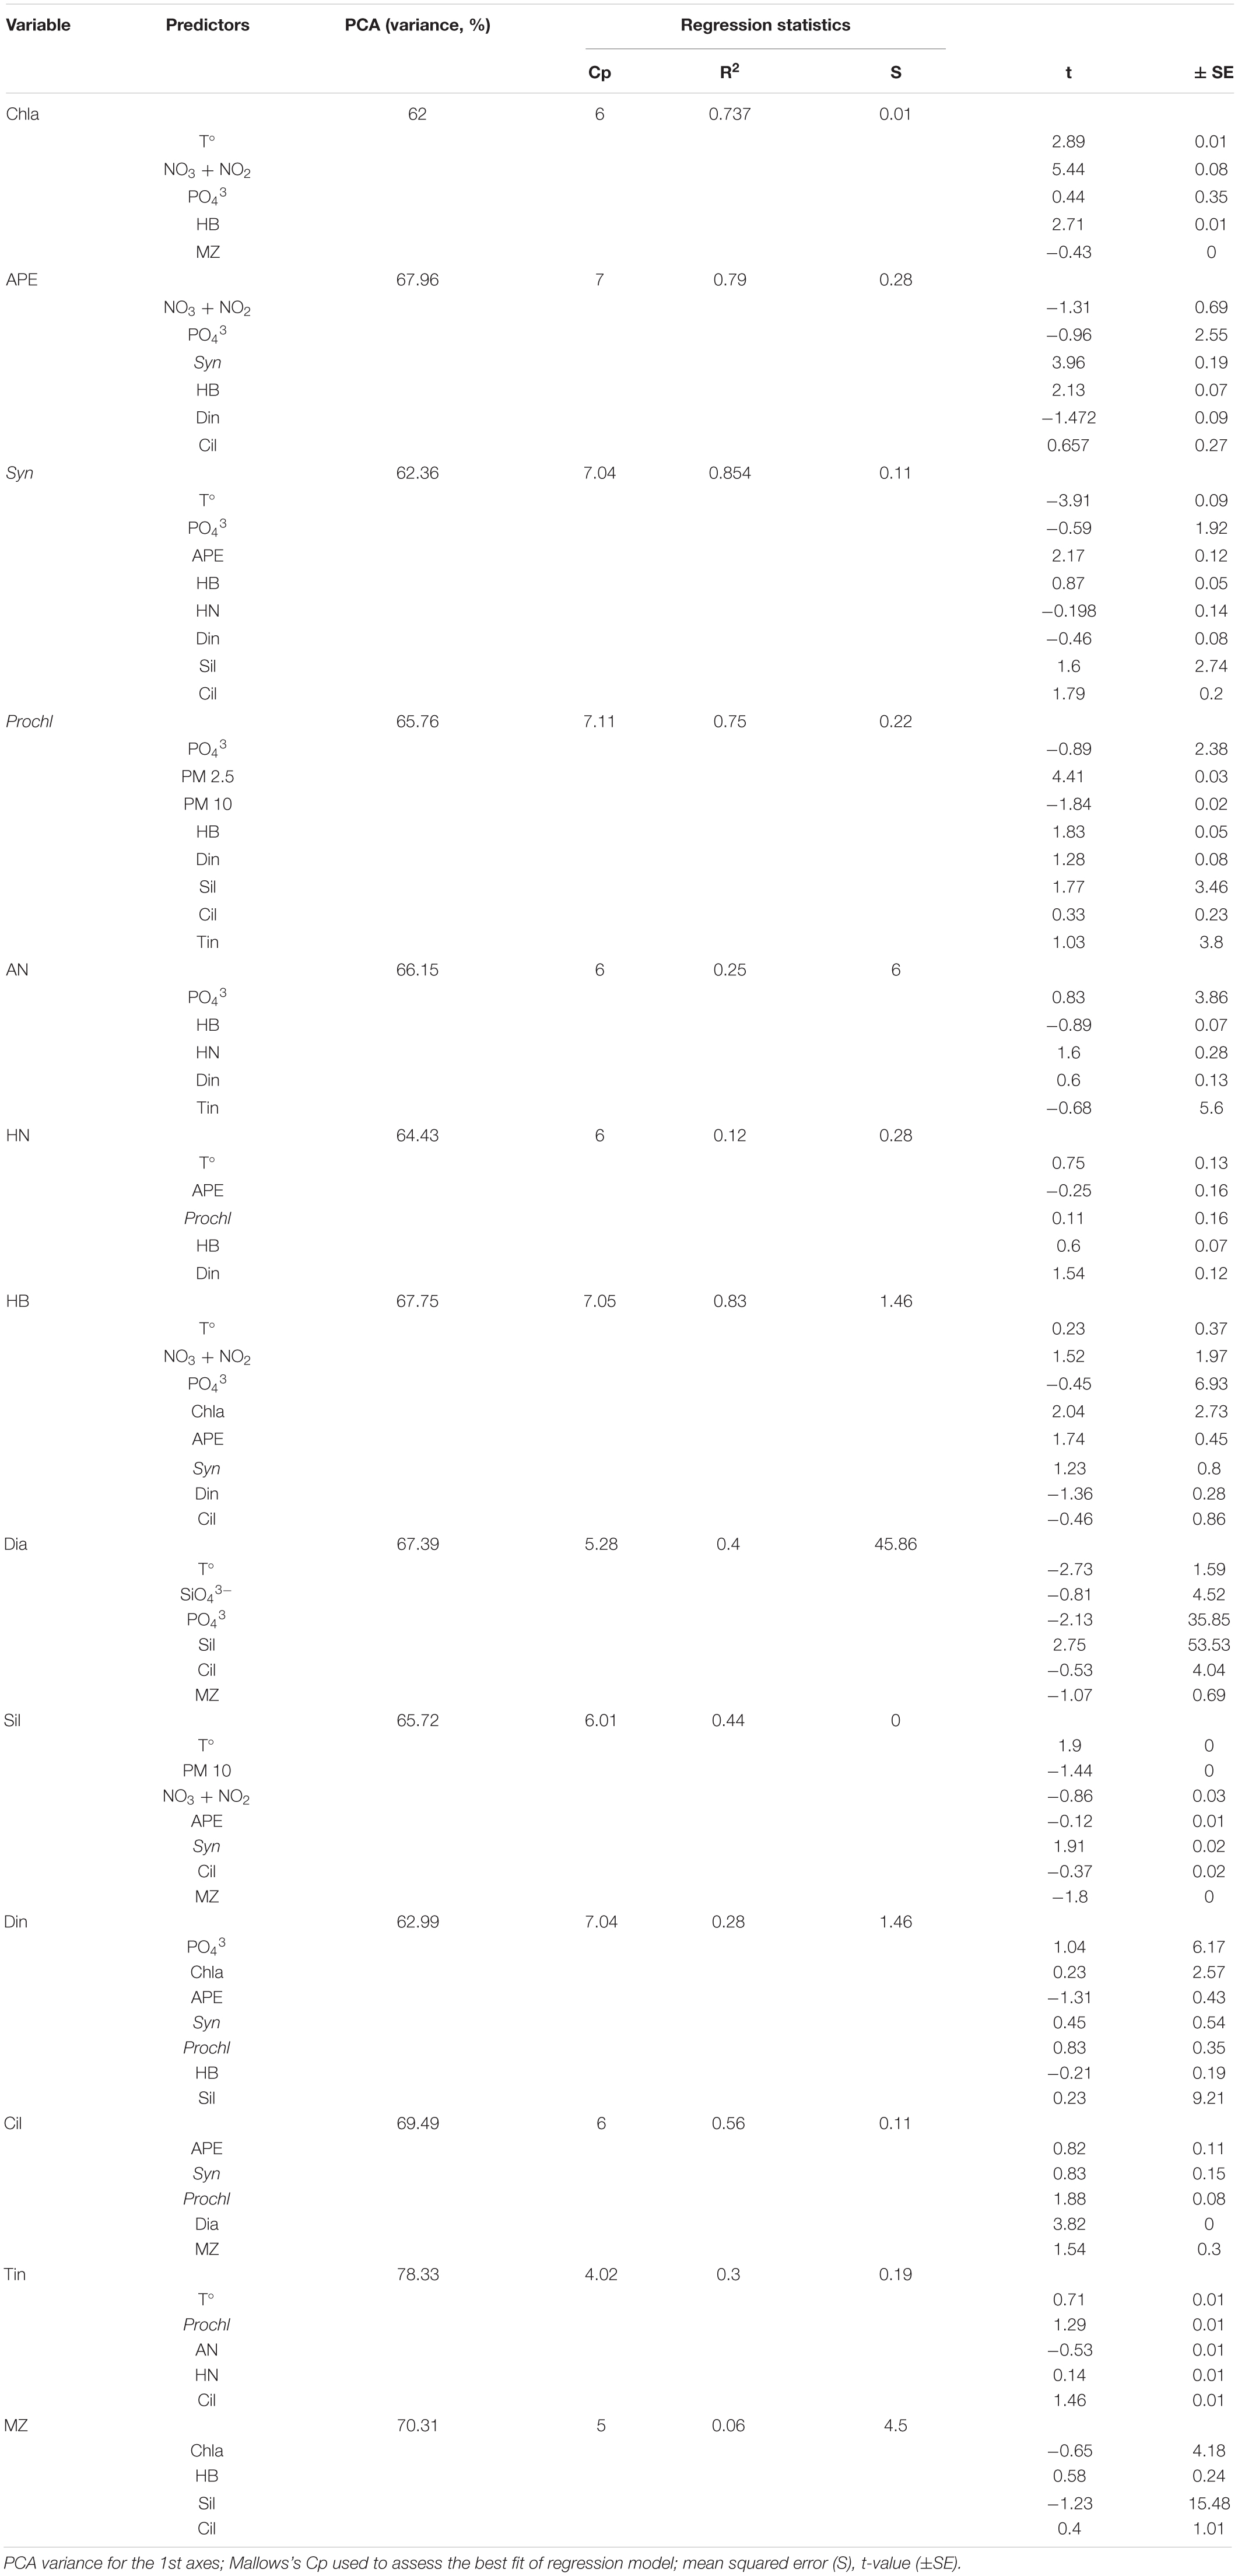
Table 1. Principal Component Analysis (PCA) and Stepwise multiple regression model for groups of organisms using biological and physiochemical variables as effects: Temperature (T°), Chlorophyll a (Chla), autotrophic picoeukaryotes (APE), Synechococcus (Syn), Prochlorococcus (Prochl), autotrophic nanoflagellates (AN), heterotrophic nanoflagellates (HN), heterotrophic bacteria (HB), diatoms (Dia), dinoflagellates (Din), silicoflagellates (Sil), ciliates (Cil), tintinnids (Tin), and mesozooplankton (MZ).
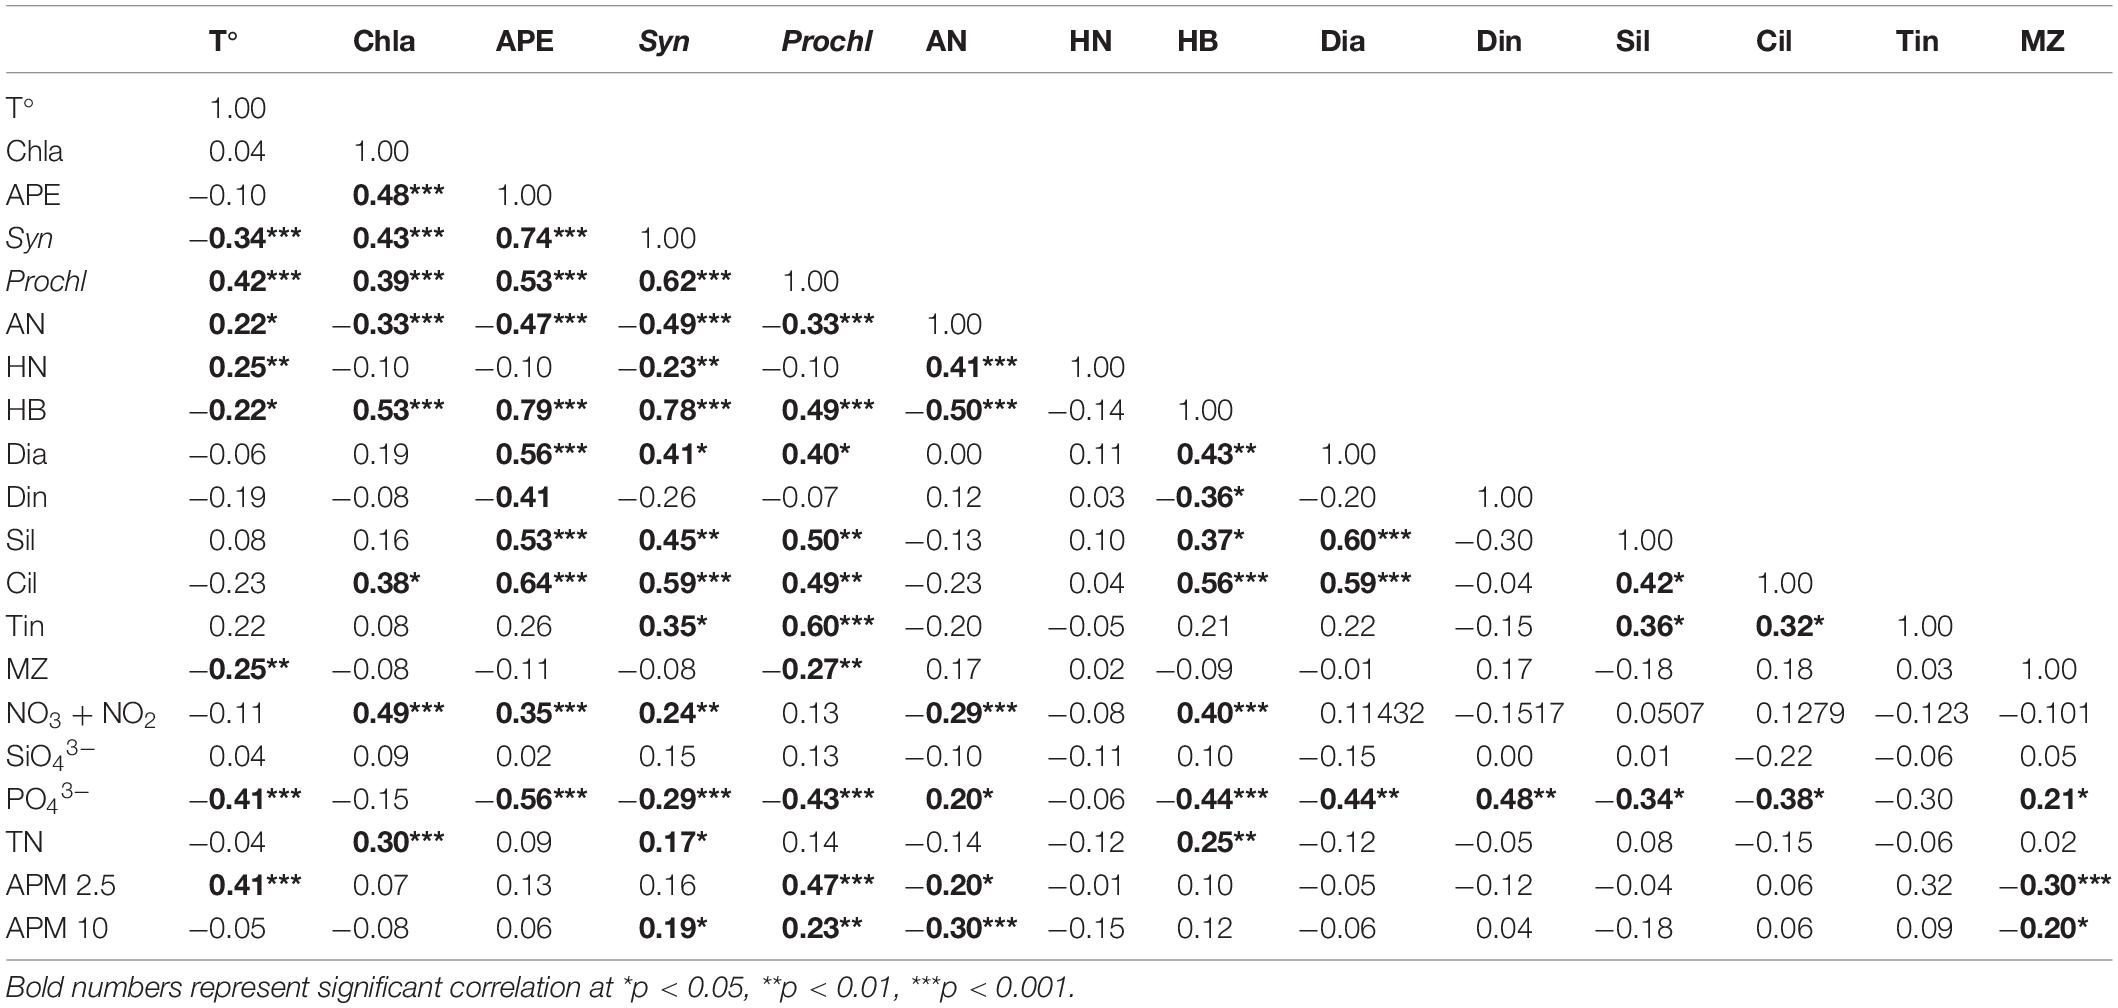
Table 2. Spearman correlation coefficients between biologic variables: temperature (T°), Chlorophyll a (Chla), autotrophic picoeukaryotes (APE), Synechococcus (Syn), Prochlorococcus (Prochl), autotrophic nanoflagellates (AN), heterotrophic nanoflagellates (HN), heterotrophic bacteria (HB), diatoms (Dia), dinoflagellates (Din), silicoflagellates (Sil), ciliates (Cil), tintinnids (Tin), mesozooplankton (MZ); and environmental variables: NO3 + NO2, SiO43–, PO43–, total nutrients (TN), atmospheric particulated matter 2.5 μm (APM 2.5), atmospheric particulated matter 10 μm (APM 10).
The average concentration of atmospheric particulate matter (PM) north of Gran Canaria Island throughout both years was 31.55 ± 50.45 μg m–3 (mean ± SD) (Figure 3A). Significantly higher dust events were observed in February 22nd, March 18th, June 4th 2010, and November 22th; and during January 6th and 17th, and May 14th 2011 (Kruskal-Wallis One-way ANOVA, p < 0.05). Maximum values of PM were found in March 2010 and January 2011 (383.34 ± 70.71 μg m–3 and 223.83 ± 101.96 μg m–3, respectively; mean ± SD).
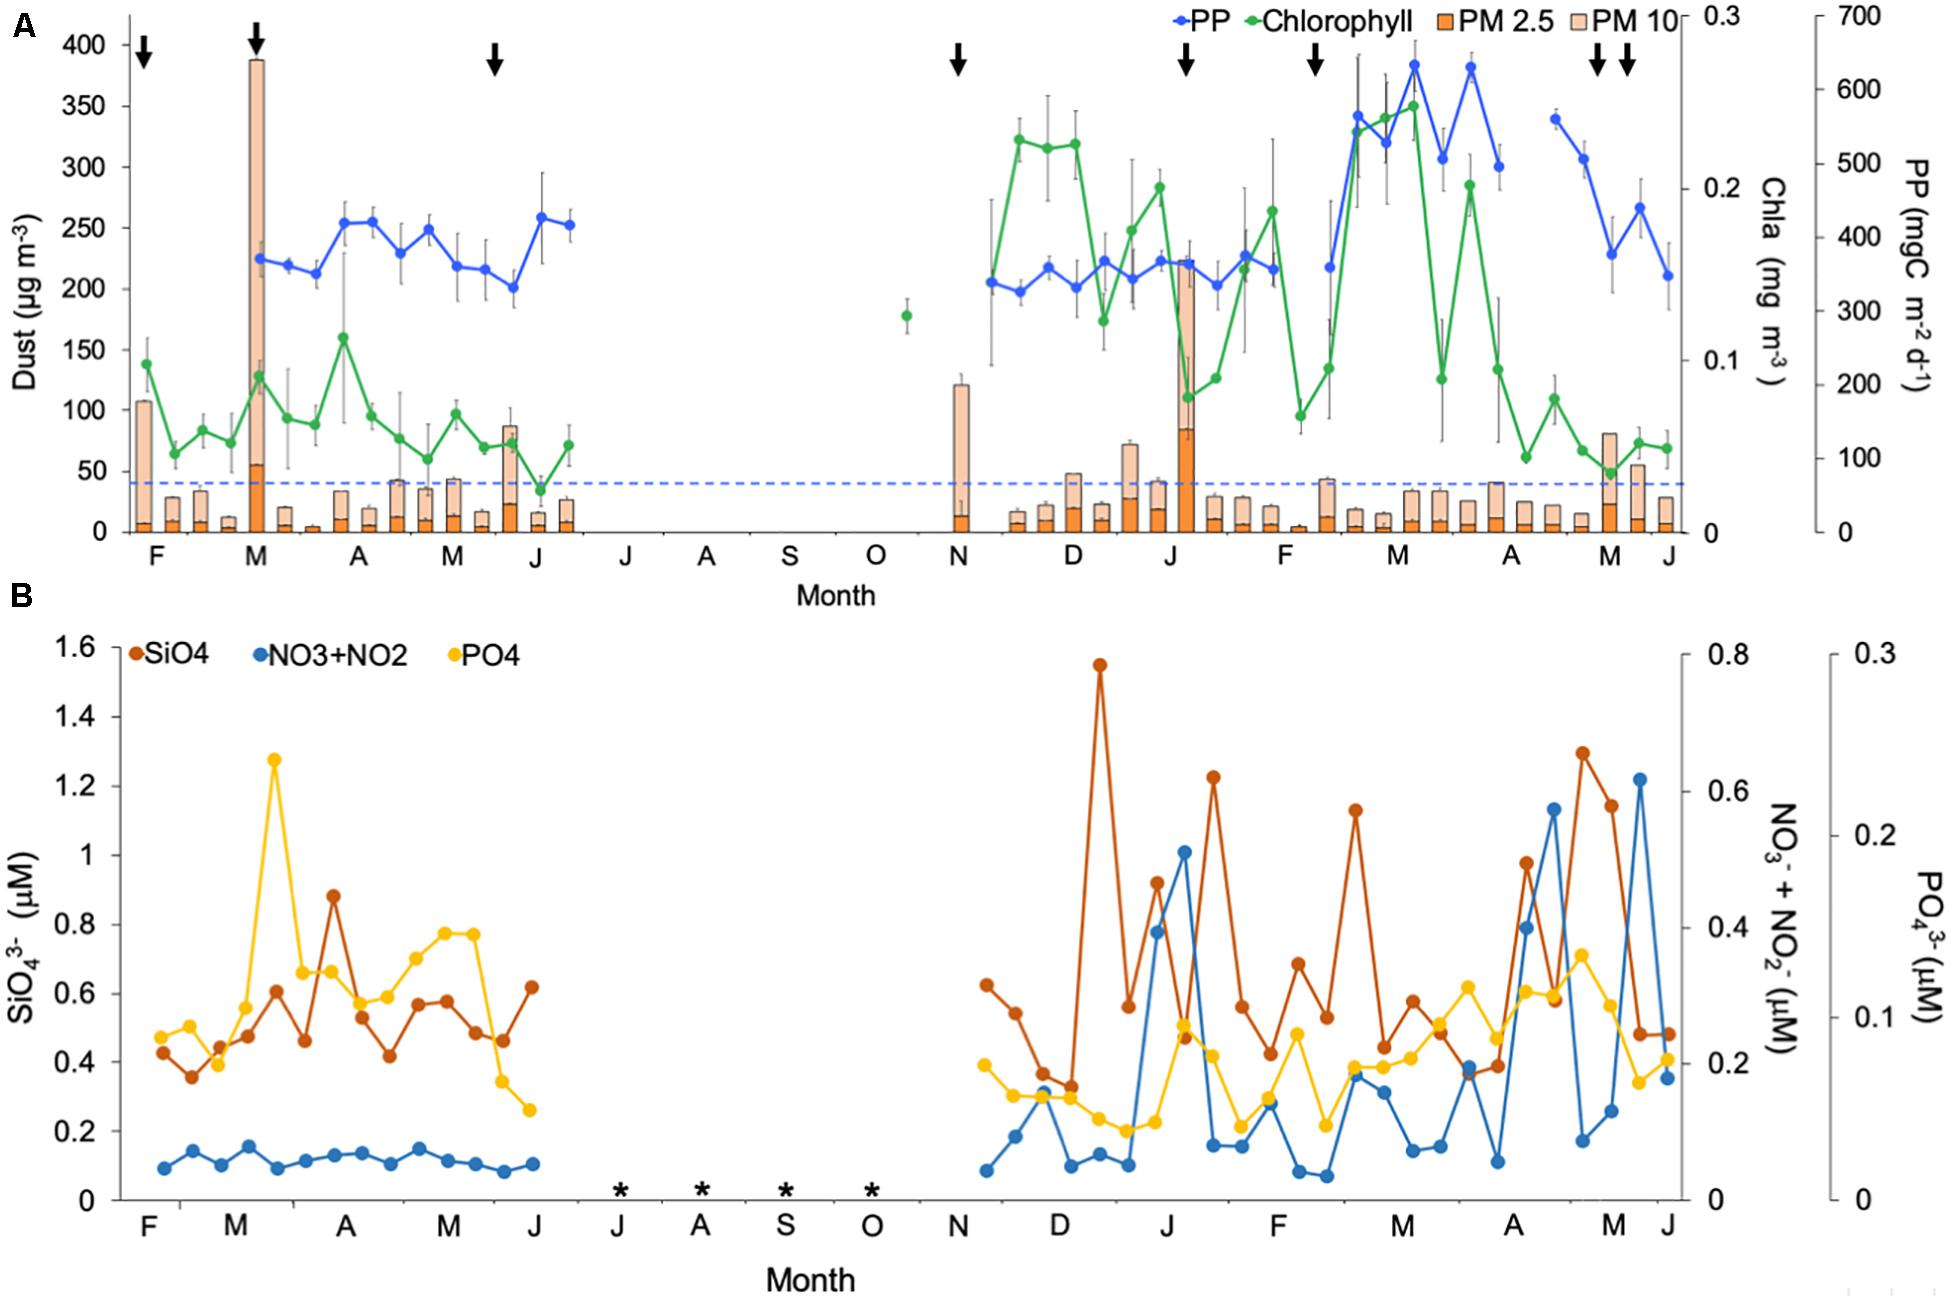
Figure 3. Temporal variability of (A) average dust concentration of atmospheric Particulated Matter (PM, μg m–3) from three dust stations for particle size of 10 μm ( ) and 2.5 μm (
 ), mean annual dust concentration at the North of Gran Canaria (
 ), statistically significant (Kruskal-Wallis One-way ANOVA, p < 0.05) dust events (downarrow), Chlorophyll a concentration (mg m–3,
 ) in the mixed layer and Primary Production from satellite (mgC m–2 d–1,); (B) average concentration (μM) of NO3 + NO2 (
 ), SiO43– (
 ) and PO43– (
 ) in the mixed layer for stations 2, 3, and 4. * No data available.
Besides warm temperature and water column stratification, the year 2010 was also characterized by significantly lower concentration of NO3 + NO2 compared to 2011, while strikingly PO43– was higher during 2010 compared to 2011 (Mann-Whitney Rank Sum Test, p < 0.05) (Figure 3B). During 2010, the maximum PO43– concentration was observed at the end of March, coinciding with a slightly shallower mixing layer and a large dust event (Figure 3). However, on average, nutrient concentration was higher in 2011 for SiO43– (0.68 μM ± 0.34 versus 0.53 μM ± 0.12 in 2010; mean ± SD; Mann-Whitney Rank Sum Test, p = 0.09) and significantly for NO3 + NO2 (0.18 μM ± 0.17 versus 0.06 μM ± 0.01 in 2010; mean ± SD; Mann-Whitney Rank Sum Test, p < 0.001), while PO43– was significantly higher in 2010 (0.12 μM ± 0.05 versus 0.07 μM ± 0.03 in 2011; mean ± SD; Mann-Whitney Rank Sum Test, p < 0.001) (Figure 3B). We did not observe a correlation between dust deposition and nutrient concentration (Pearson, r = −0.05 p > 0.05), but NO3 + NO2 showed a significant positive correlation with Chla (Pearson test, r = 0.49 p < 0.001) (Table 2).
Chla concentration in the mixed layer was significantly higher in 2011 compared to 2010 (Mann-Whitney Rank Sum Test, p < 0.05) (Figure 3A), particularly during March 2011 coinciding with the LWB period. With the exception of the LWB period in 2011, the satellite PP during 2010 and 2011 were not significantly different, and values ranged 341–400 mgC m–2 d–1. During the LWB in 2011, PP was significantly higher than during other periods (Mann-Whitney Rank Sum Test, p < 0.05), with average values of 557 ± 56 mgC m–2 d–1 (Figure 3B).
Plankton Community
Differences in biomass among both years were sharp (Figure 4A). Prochlorococcus dominated the picoplankton community in all stations during 2010 and most of 2011, except for the LWB months when the community shifted to autotrophic picoeukaryotes and Synechococcus (Figure 4B). Prochlorococcus showed a negative correlation with phosphates, while autotrophic picoeukaryotes and Synechococcus showed a positive correlation with NO3 + NO2, and both Synechococcus and Prochlorococcus displayed a positive correlation with atmospheric PM (Spearman test, Table 2). Sixty eight per cent of autotrophic picoeukaryote biomass variability was explained by NO3 + NO2, PO43–, Synechococcus, heterotrophic prokaryotes, dinoflagellates and ciliates, whereas 62% of Synechococcus biomass distribution was due to temperature, PO43–, autotrophic picoeukaryotes, heterotrophic prokaryotes, heterotrophic nanoflagellates, dinoflagellates, silicoflagellates and ciliates (PCA and Stepwise multiple regression model, Table 1). At 66% of Prochlorococcus biomass was explained by PO43–, PM, heterotrophic prokaryotes, dinoflagellates, silicoflagellates, ciliates and tintinnids (PCA and Stepwise multiple regression model, Table 1).
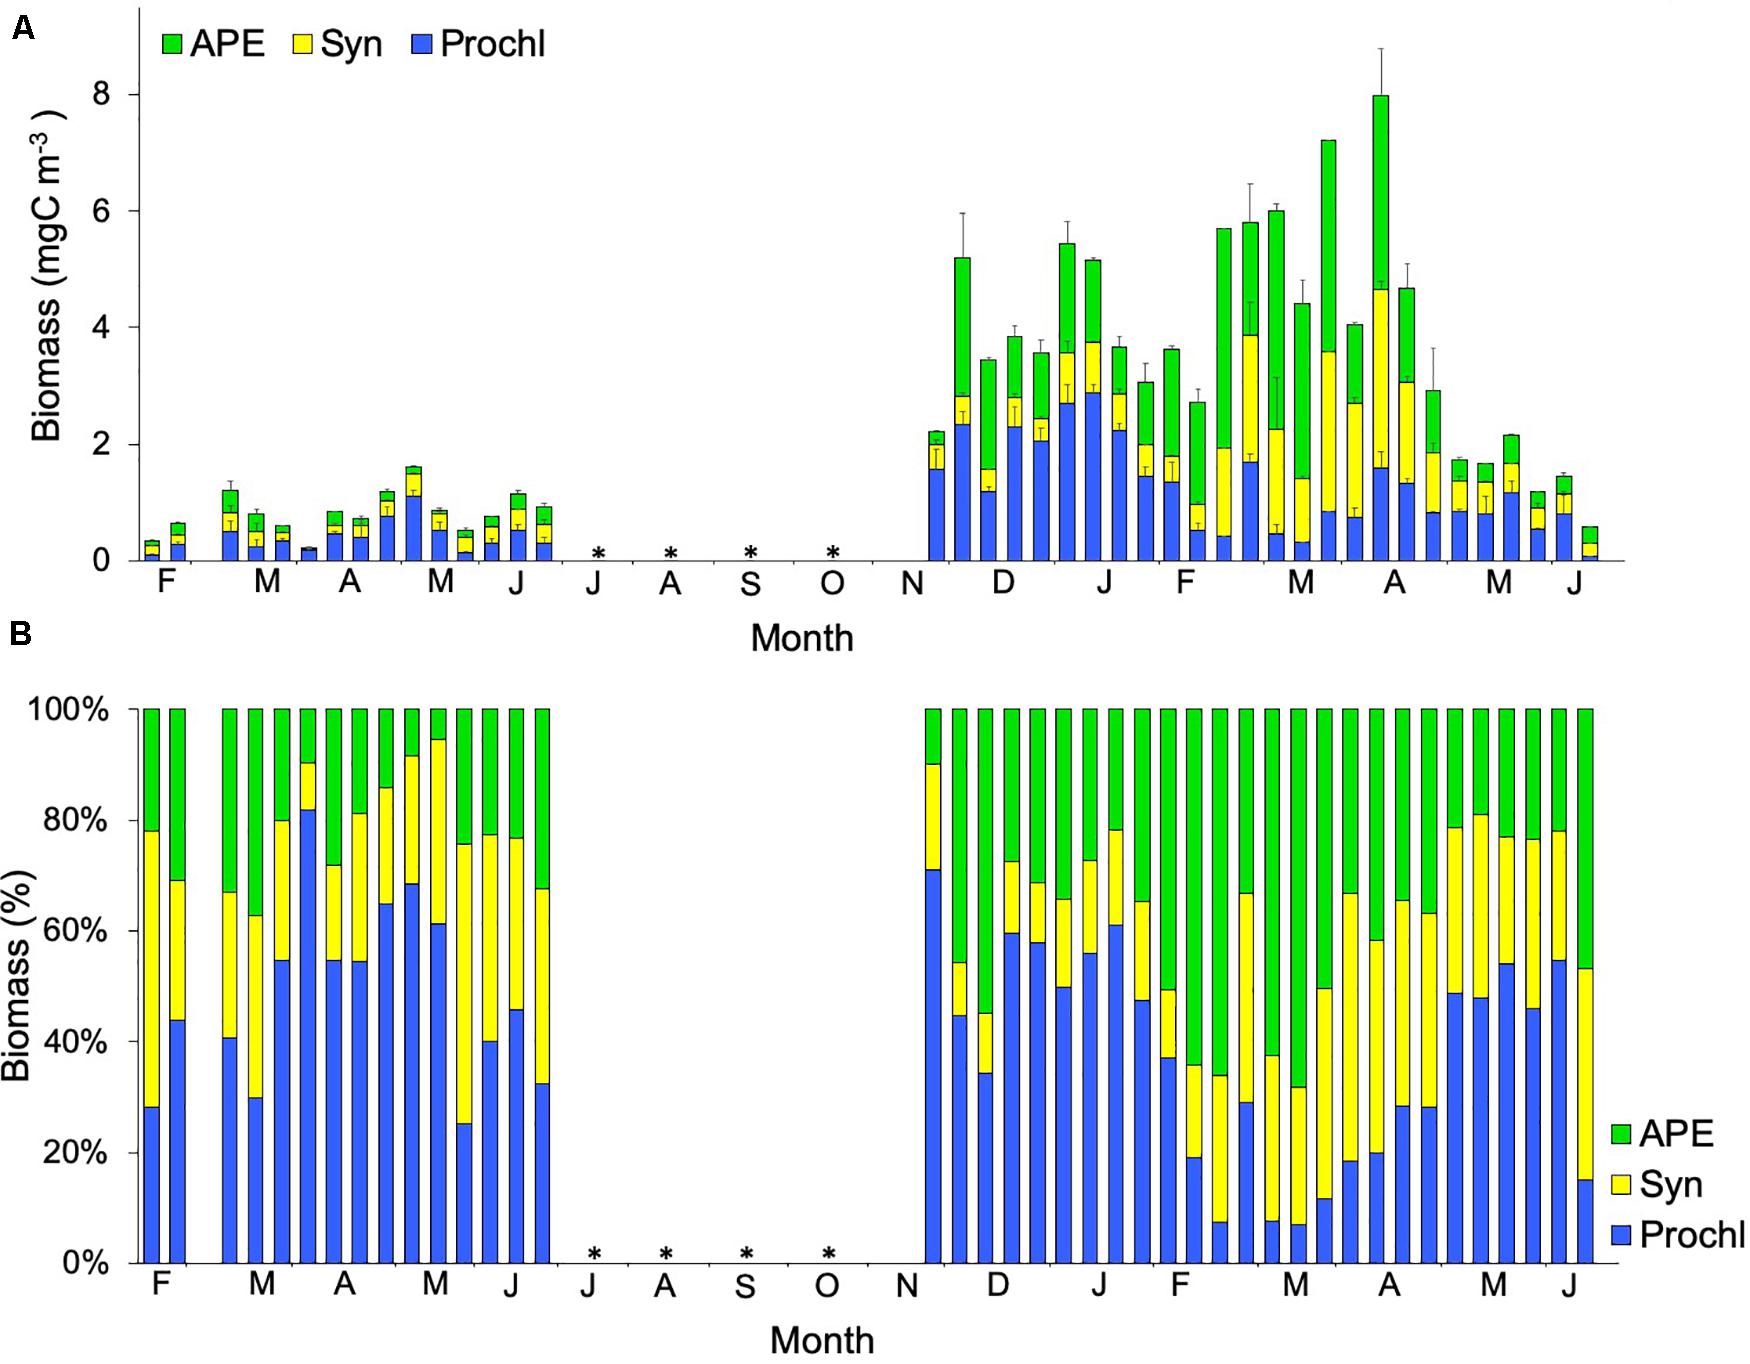
Figure 4. (A) Temporal variability of average values (mean ± SE) of biomass for stations 1, 2, and 3, and (B) Percentage for Prochlorococcus (Prochl, ), Synechococcus (Syn,
 ), and autotrophic picoeukaryotes (APE,
 ). * No data available.
Heterotrophic bacteria dominated the picoplankton community in both years, however, the highest biomass occurred during the LWB in 2010 (Figure 5 and Table 2). Temperature, NO3 + NO2, PO43–, Chla, autotrophic picoeukaryotes, Synechococcus, dinoflagellates, and ciliates explained 67.8% of the heterotrophic bacteria biomass variability (PCA and Stepwise multiple regression model, Table 1), and showed a positive correlation with almost all groups (Spearman test, Table 2).
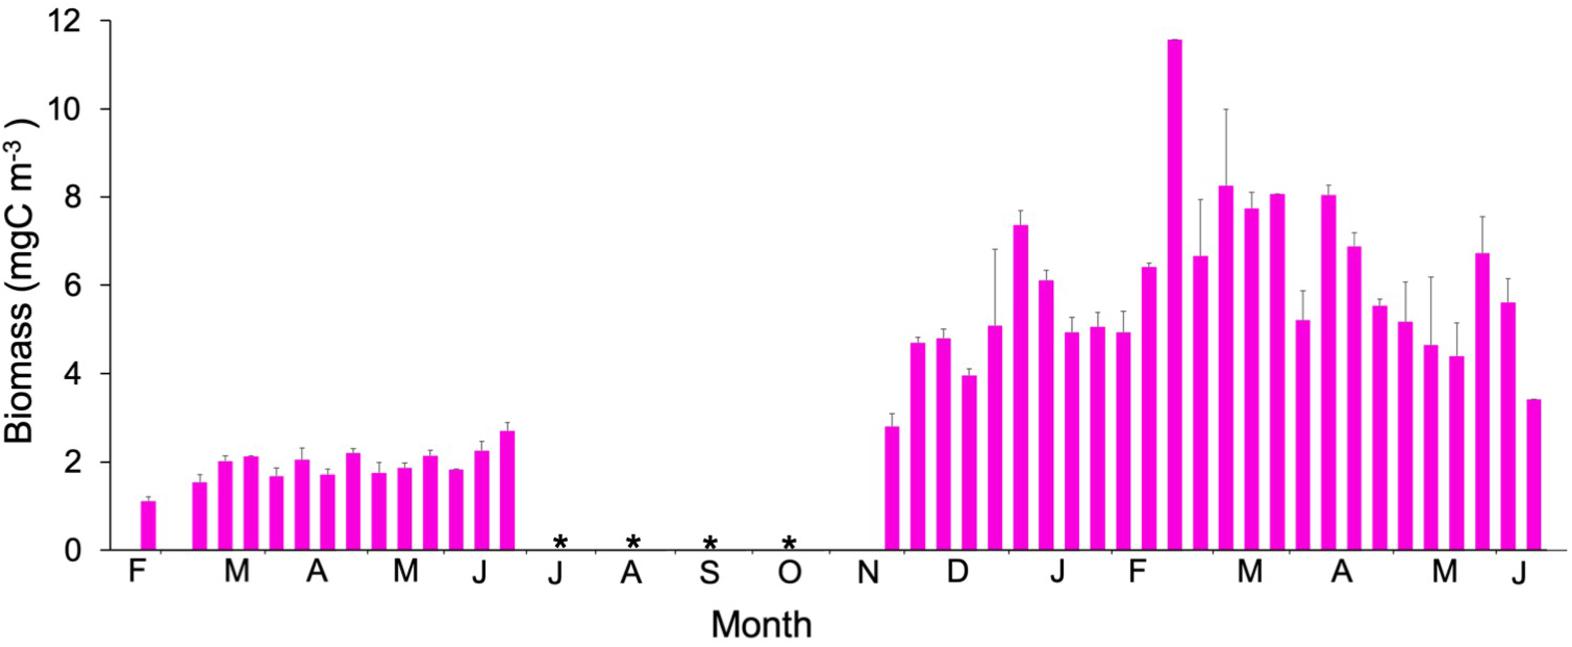
Figure 5. Temporal variability of heterotrophic bacteria biomass ( ). Values are the average of values (mean ± SE) for stations 1, 2, and 3. No data available is represented by an asterisk.
In contrast to picoplankton results, both autotrophic and heterotrophic nanoflagellates displayed a significant increase in biomass related to temperature (positive significant correlation, Spearman test; Table 2), and autotrophic nanoflagellates even dominated the autotrophic community for a few periods during 2010 (Figure 6). Biomass of heterotrophic nanoflagellates exceeded that of autotrophic nanoflagellates during March 2010, while during the coldest period (2011), heterotrophic nanoflagellates biomass was higher than autotrophic nanoflagellates. The latter almost disappeared for a few months during 2011, showing a positive correlation with PO43– (Spearman test, Table 2). Sixty six percent of the variation in autotrophic nanoflagellate biomass was explained by PO43–, heterotrophic prokaryotes, heterotrophic nanoflagellates, dinoflagellates and tintinnids (PCA and Stepwise multiple regression model, Table 1); whilst heterotrophic nanoflagellates were related to temperature, NO3 + NO2, PO43–, Chla, autotrophic picoeukaryotes, Synechococcus, dinoflagellates, and ciliates (68%, PCA and Stepwise multiple regression model; Table 1).
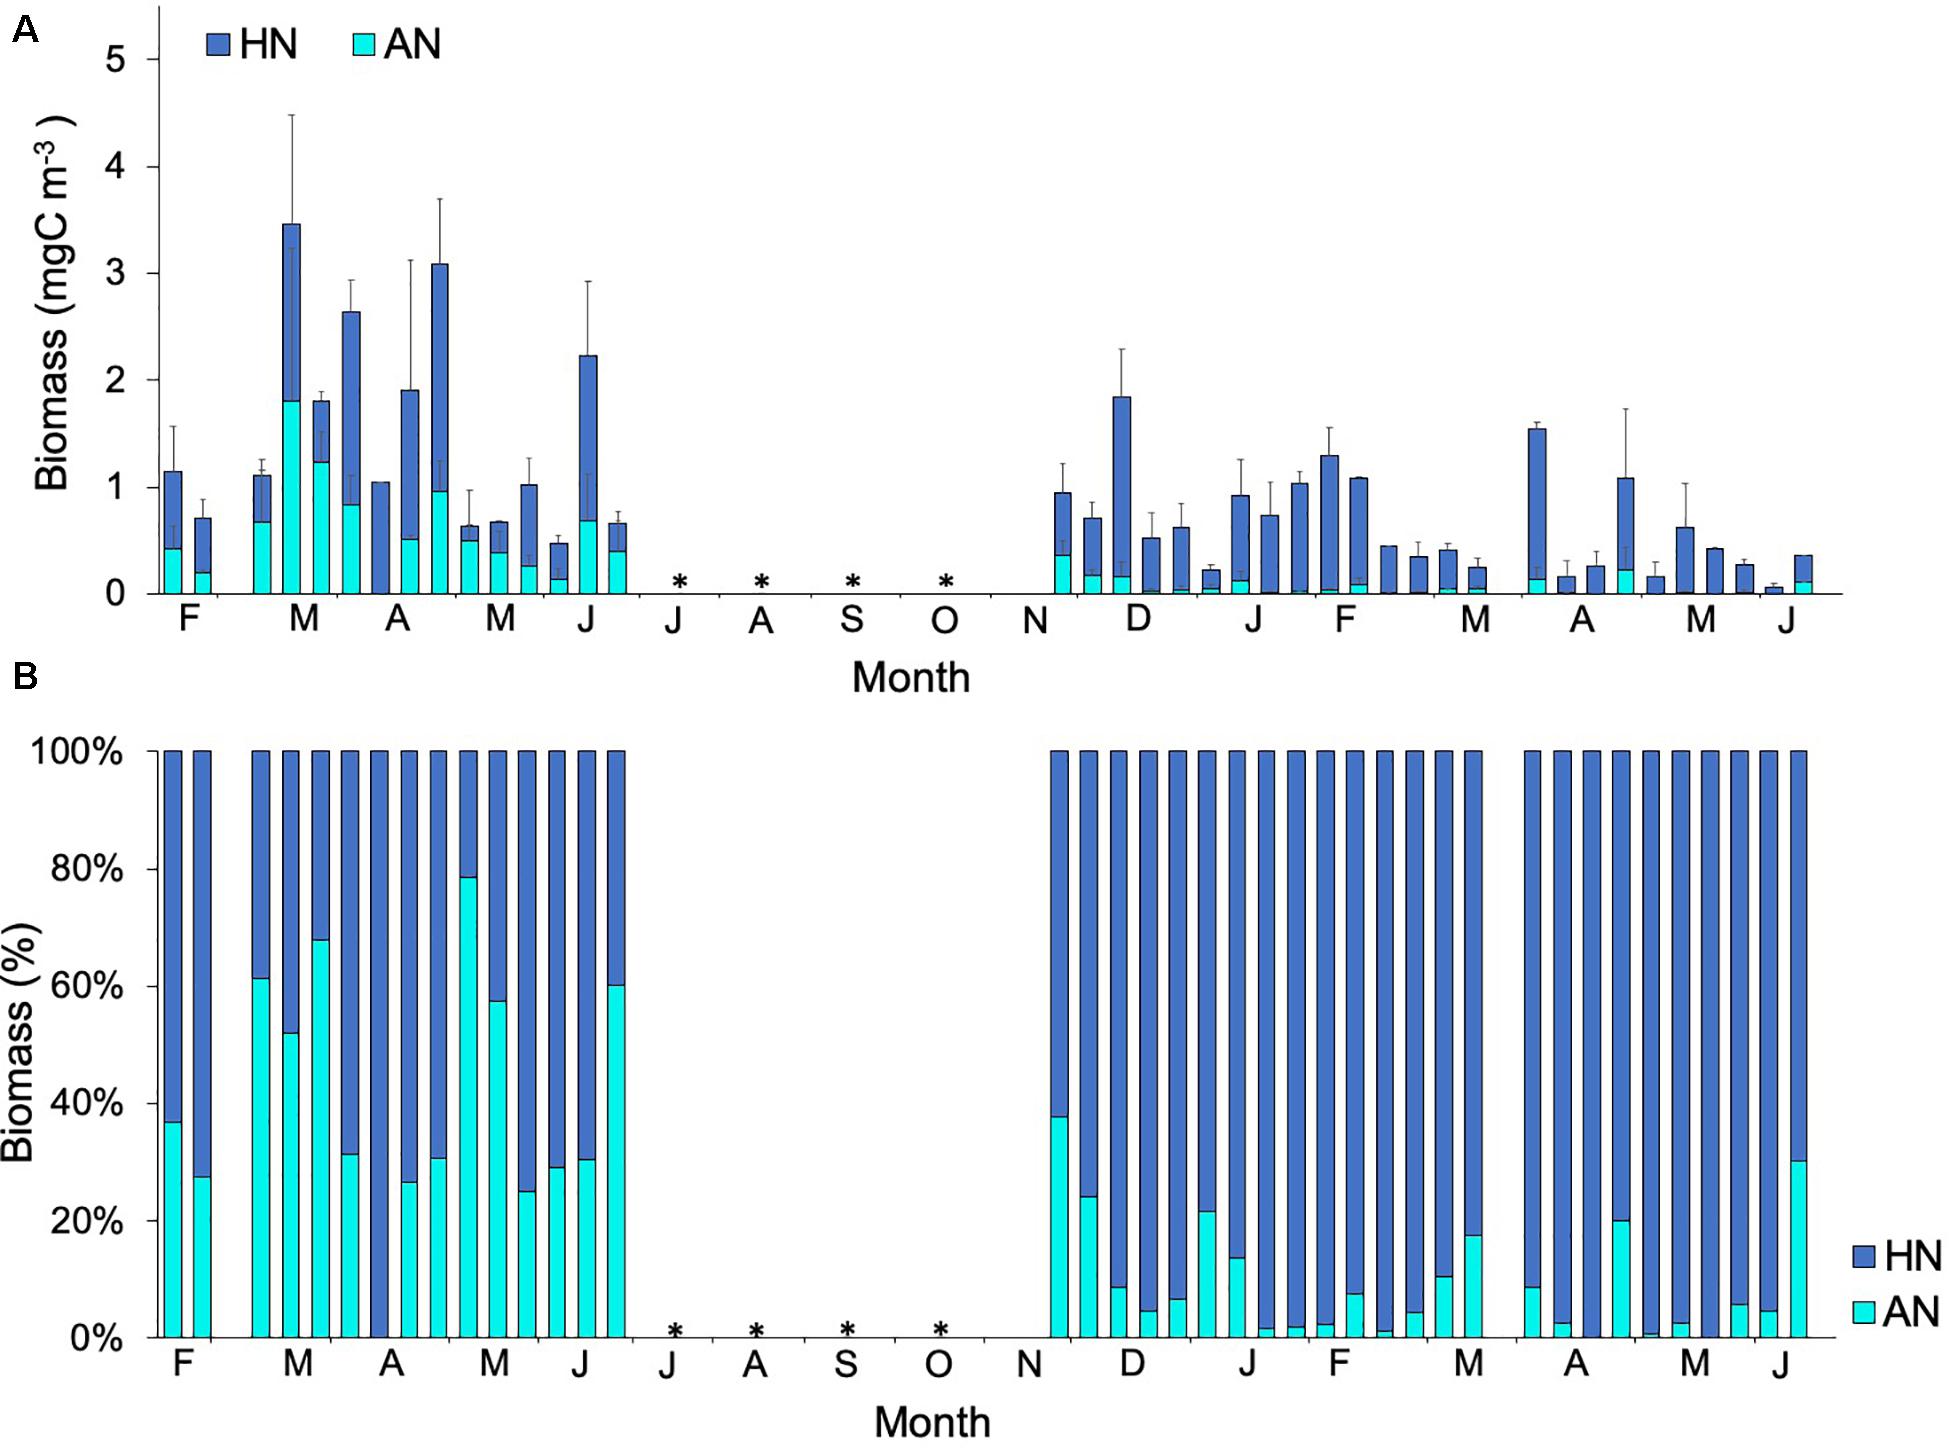
Figure 6. (A) Temporal variability of averages values (mean ± SE) of biomass for stations 1, 2, and 3, and (B) Percentage for heterotrophic (HN, ) and autotrophic (AN,
 ) nanoflagellates. No data available is represented by an asterisk.
Microplankton data were only available for station 3 (Figure 7). Similar to picoplankton, microplankton biomass during 2011 was significantly higher than during 2010 (Mann-Whitney Rank Sum, p < 0.05). Dinoflagellates dominated the community during 2010 and practically throughout 2011, except during the mixing period (December 2010 to January 2011) and the LWB, when community shifted to diatoms. During the LWB, diatoms dominated the community and increased the microplankton biomass for a short period from ca. 8 μgC L–1 to 200 μgC L–1 (Figure 7B). Sixty seven percent of the variation in diatom biomass was explained temperature, SiO43–, PO43–, silicoflagellates, ciliates and mesozooplankton; while PO43, Chla, autotrophic picoeukaryotes, Synechococcus, Prochlorococcus, heterotrophic prokaryotes, and silicoflagellates accounted for ca. 63% of the variance in biomass of dinoflagellates (PCA and Stepwise multiple regression model, Table 1). During 2011, biomass of tintinnids, silicoflagellates, and ciliates increased by almost an order of magnitude with respect to the previous year (Figure 7B). Temperature, Synechococcus, Prochlorococcus and diatoms accounted for 78.3% of the variance in biomass of tintinnids, while autotrophic picoeukaryotes, Synechococcus, Prochlorococcus, diatoms and mesozooplankton accounted for 69.5% of the variance in biomass of ciliates (Table 1). Ciliates and tintinnids were significantly correlated with the smallest planktonic groups of autotrophic picoeukaryotes, Synechococcus and Prochlorococcus (Spearman test, Table 2).
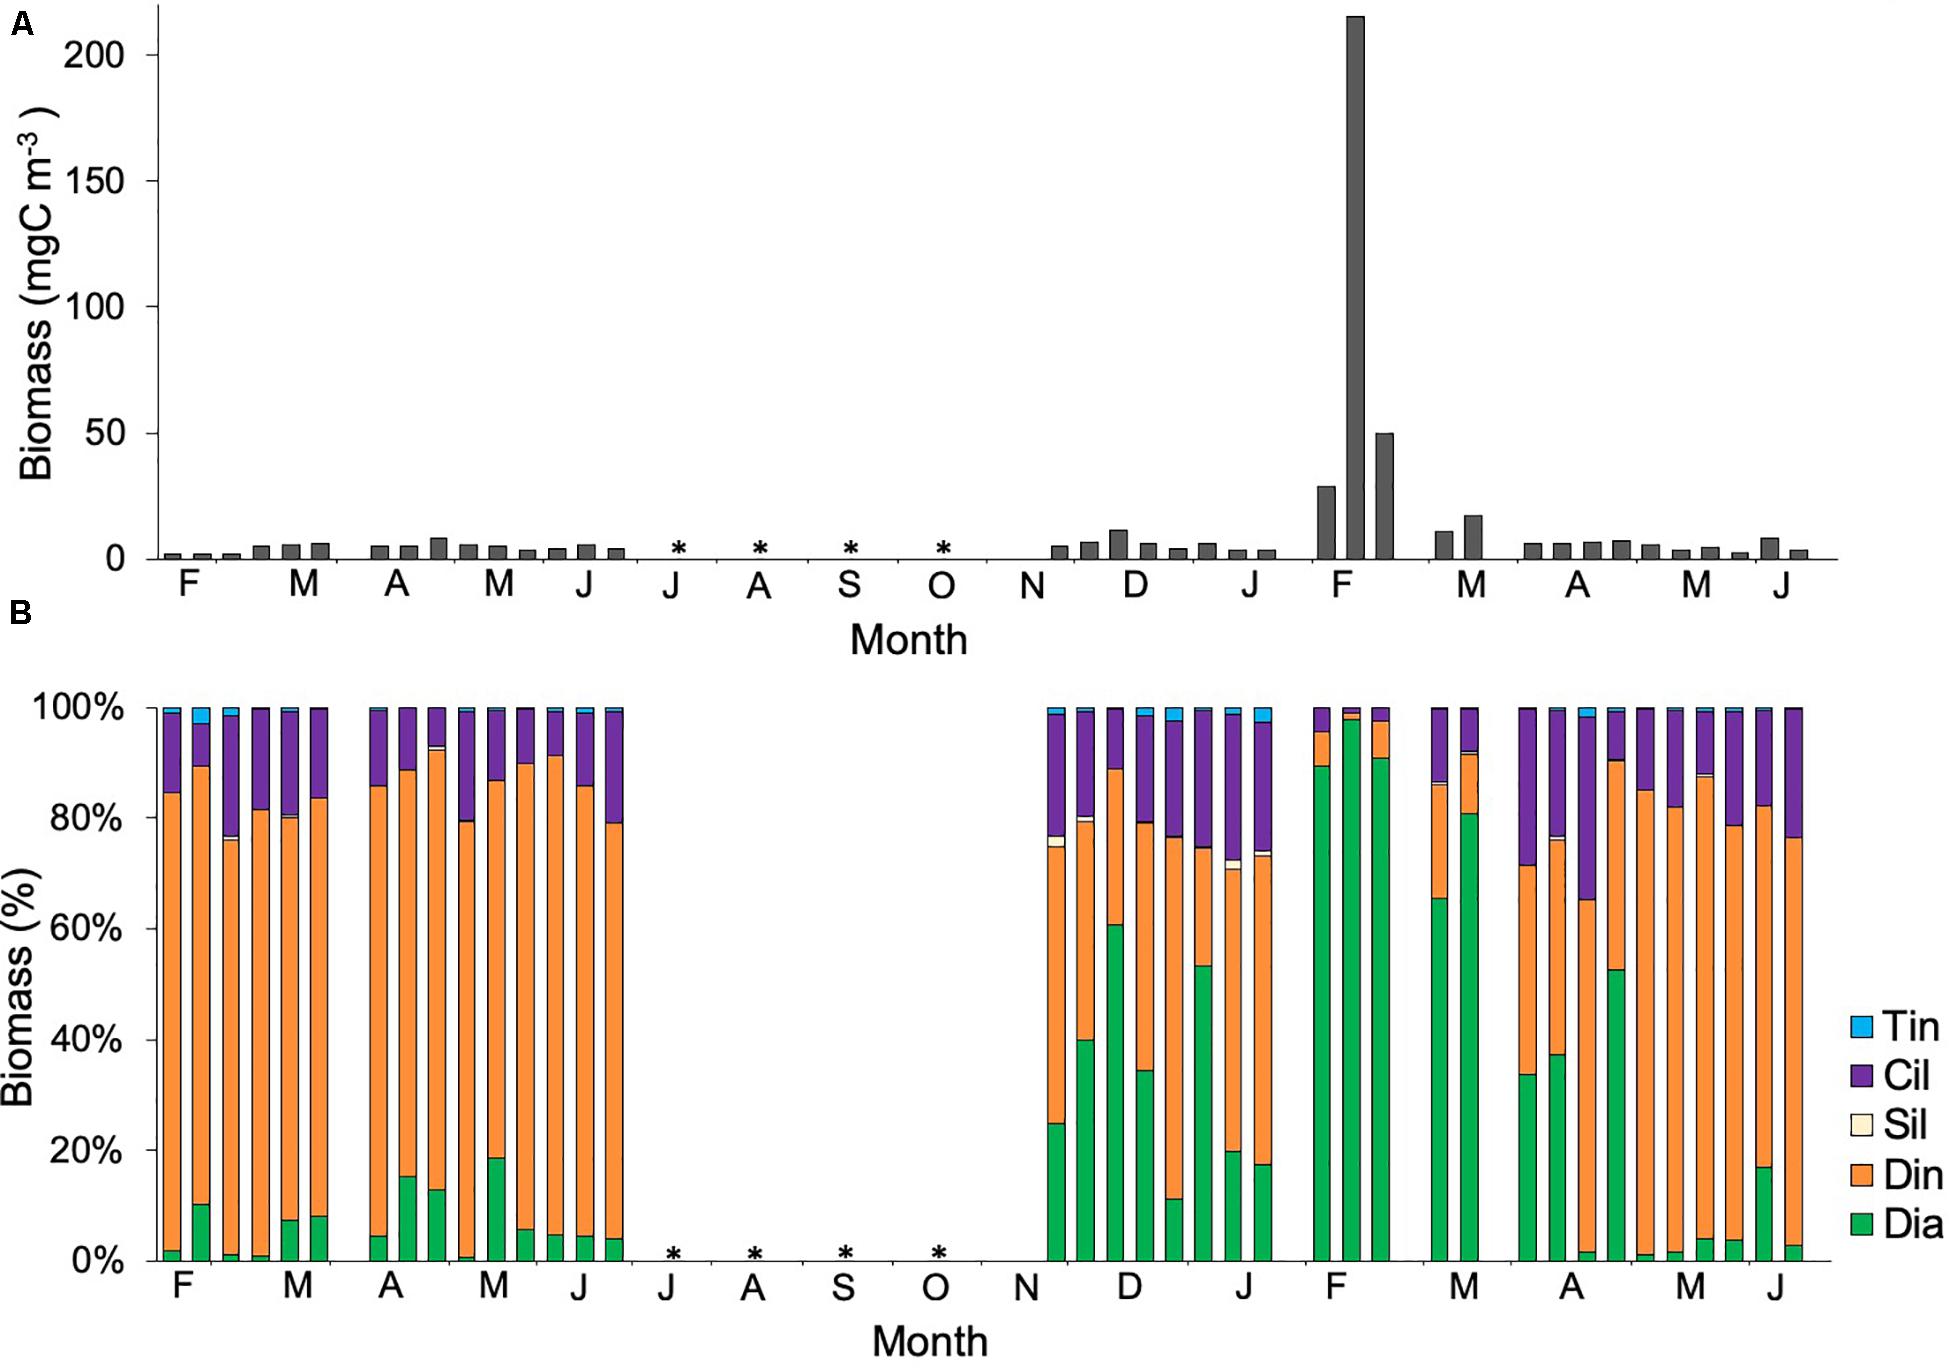
Figure 7. (A) Temporal variability of averages values (mean ± SE) of biomass for stations 1, 2, and 3, and (B) Percentage for diatoms (Dia, ), dinoflagellates (Din,
 ), silicoflagellates (Sil,
 ), ciliates (Cil,
 ) and tintinnids (Tin,
 ). No data available is represented by an asterisk.
Mesozooplankton biomass was significantly higher during 2010 (Mann-Whitney Rank Sum, p < 0.05) (Figure 8), especially during March 2010. Maximum values were observed, however, during the LWB in 2011 (Figure 8). Chla, heterotrophic prokaryotes, silicoflagellate, and ciliates explained 70.3% of the variation in mesozooplankton biomass (Table 1).
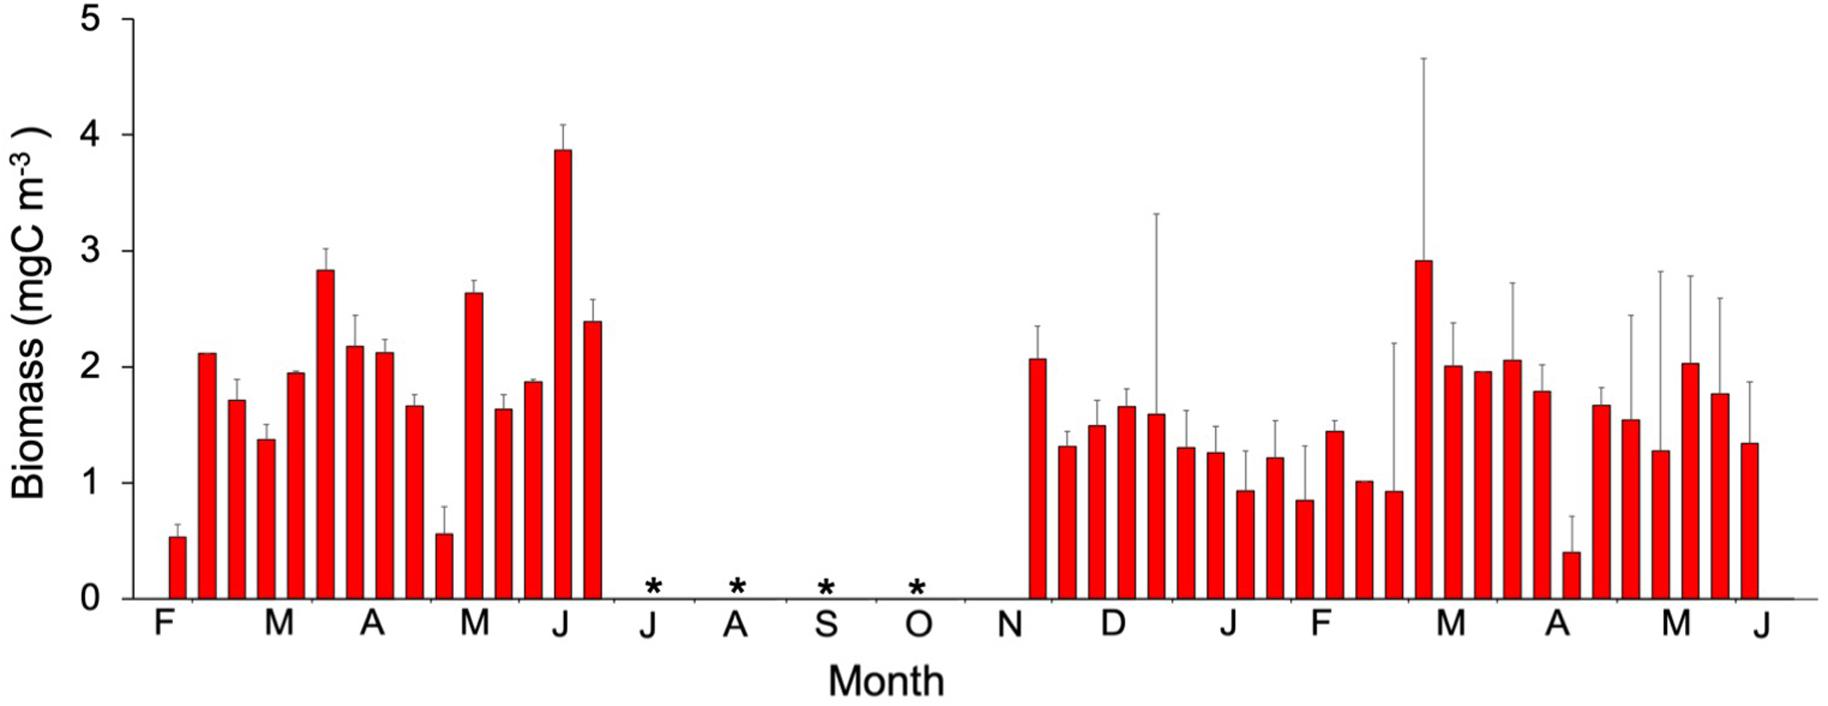
Figure 8. Temporal variability of mesozooplankton biomass ( ). Values are the average of values (mean ± SE) for stations 1, 2, and 3. No data available is represented by an asterisk.
Comparing both years (Figure 9), biomass was significantly higher for autotrophic picoeukaryotes, Synechococcus, Prochlorococcus, heterotrophic prokaryotes, diatoms, tintinnids, silicoflagellates (Mann-Whitney Rank Sum, p < 0.05) and ciliates (t-test, p < 0.05) during the cold year (2011). By contrast, autotrophic and heterotrophic nanoflagellates, dinoflagellates, and mesozooplankton (Mann-Whitney Rank Sum, p < 0.05) were significant higher during the warm year (2010) (Figure 9). In agreement, we found significant negative correlations between temperature and Synechococcus, heterotrophic prokaryotes and mesozooplankton (Pearson test, Table 2), and significant positive correlations between temperature and Prochlorococcus and both autotrophic and heterotrophic nanoflagellates (Pearson test, Table 2).
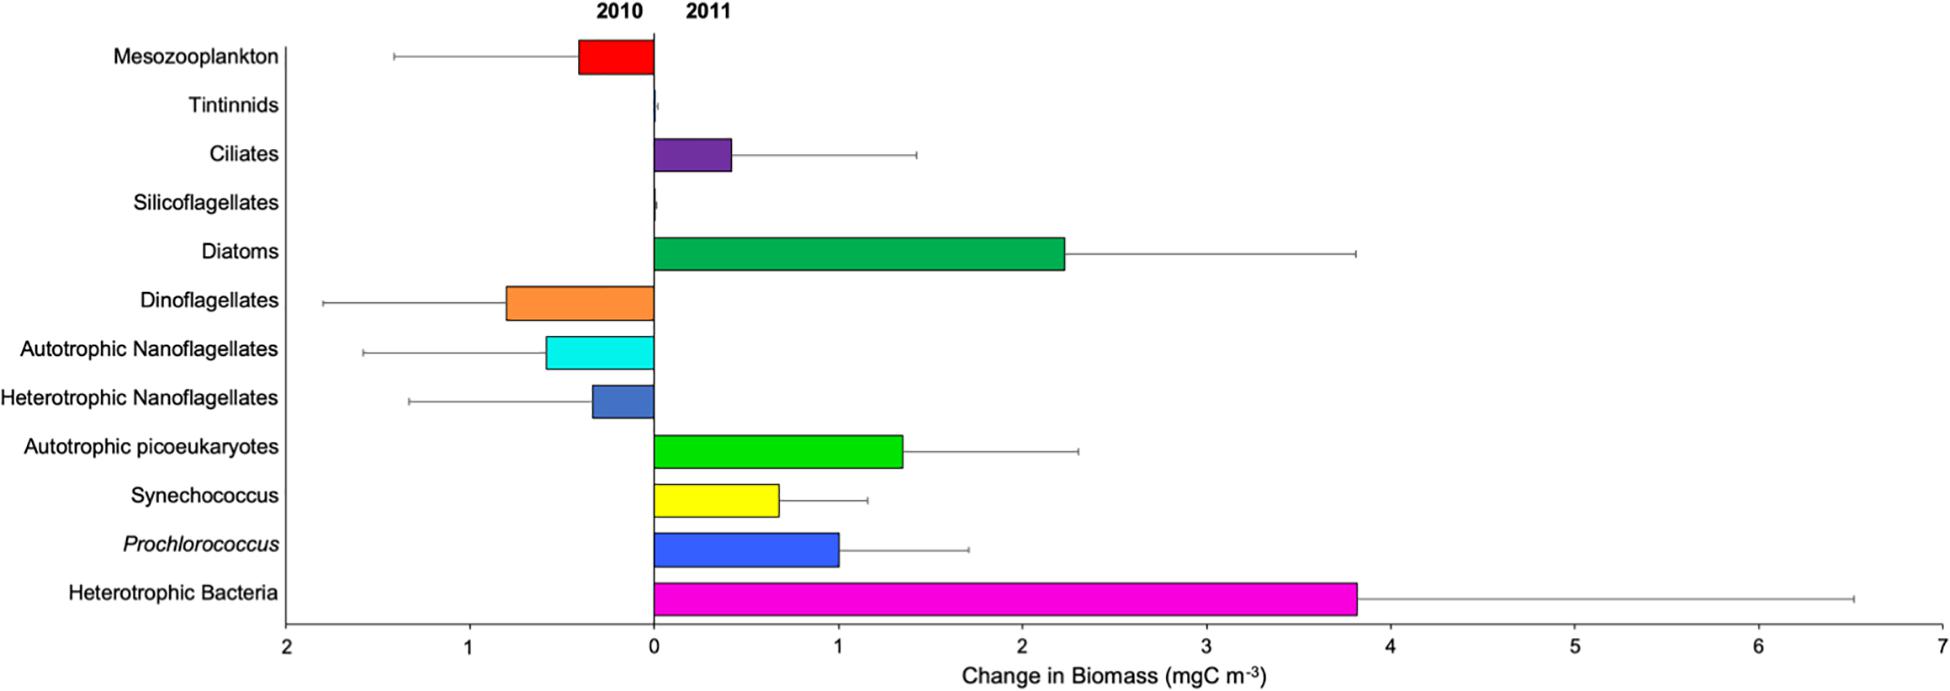
Figure 9. Changes in biomass (mgC m–3) (±SE) of autotrophic picoeukaryotes (), Synechococcus (), Prochlorococcus (), autotrophic nanoflagellates ( ), heterotrophic nanoflagellates (
 ), heterotrophic bacteria (), diatoms (
 ), dinoflagellates (), silicoflagellates (
 ), ciliates (
 ), tintinnids (
 ), and mesozooplankton () between 2010 and 2011 years. Right values indicate more biomass in 2011, while left values indicate more biomass in 2010.
Microzooplankton Grazing and Phytoplankton Growth
Dilution experiments performed during the warm (D1–D5) and cold years (D6 and D7) (Table 3) did not show a relationship between temperature and growth or mortality rates. In terms of Chla, growth showed highest rates during 2010 while grazing remained constant during both years (Figures 10A,B). For specific plankton groups, growth for autotrophic picoeukaryotes, Synechococcus and Prochlorococcus was higher in 2010, while for heterotrophic prokaryotes, autotrophic and heterotrophic nanoflagellates, and the growth was higher in 2011 (Figure 10A). All groups showed lower grazing rates during 2011 compared to 2010 (Figure 10B). The daily production removed by microzooplankton (%PP) showed the highest values in 2010 for autotrophic and heterotrophic nanoflagellates. Chla and heterotrophic prokaryotes displayed highest rates in 2011 (Figure 10C). We also found a significant positive correlation between heterotrophic nanoflagellate biomass and grazing of Synechococcus, and %PP of Synechococcus (Pearson test, r = 0.87 p < 0.05 and r = 0.87 p < 0.05; respectively).
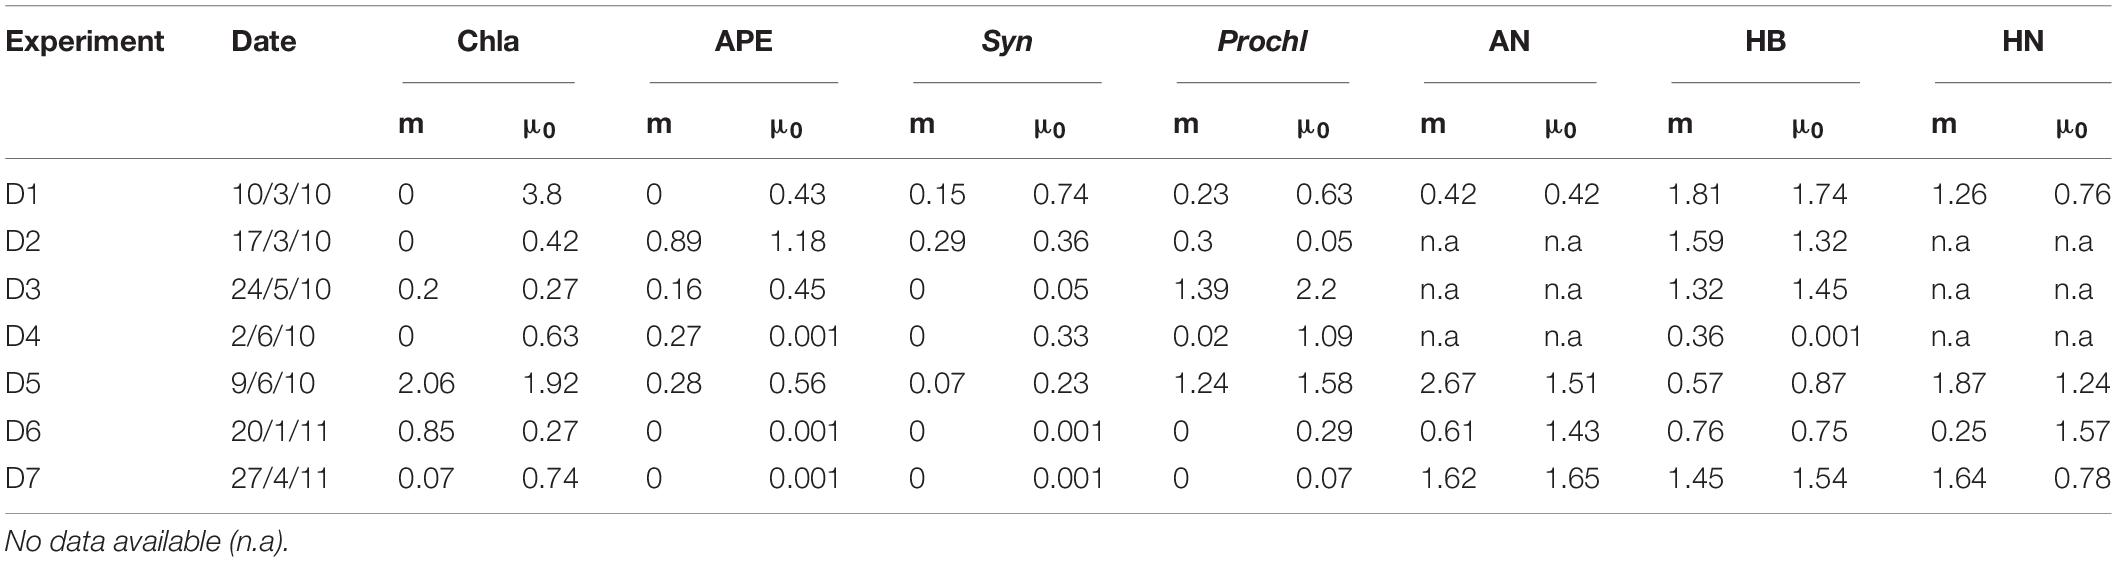
Table 3. Mortality (m) and growth (μ) rates (d–) of total phytoplankton (Chla), autotrophic picoeukaryotes (APE), Synechococcus (Syn), Prochlorococcus (Prochl), autotrophic nanoflagellates (AN), heterotrophic bacteria (HB) and heterotrophic nanoflagellates (HN) for each dilution experiment.
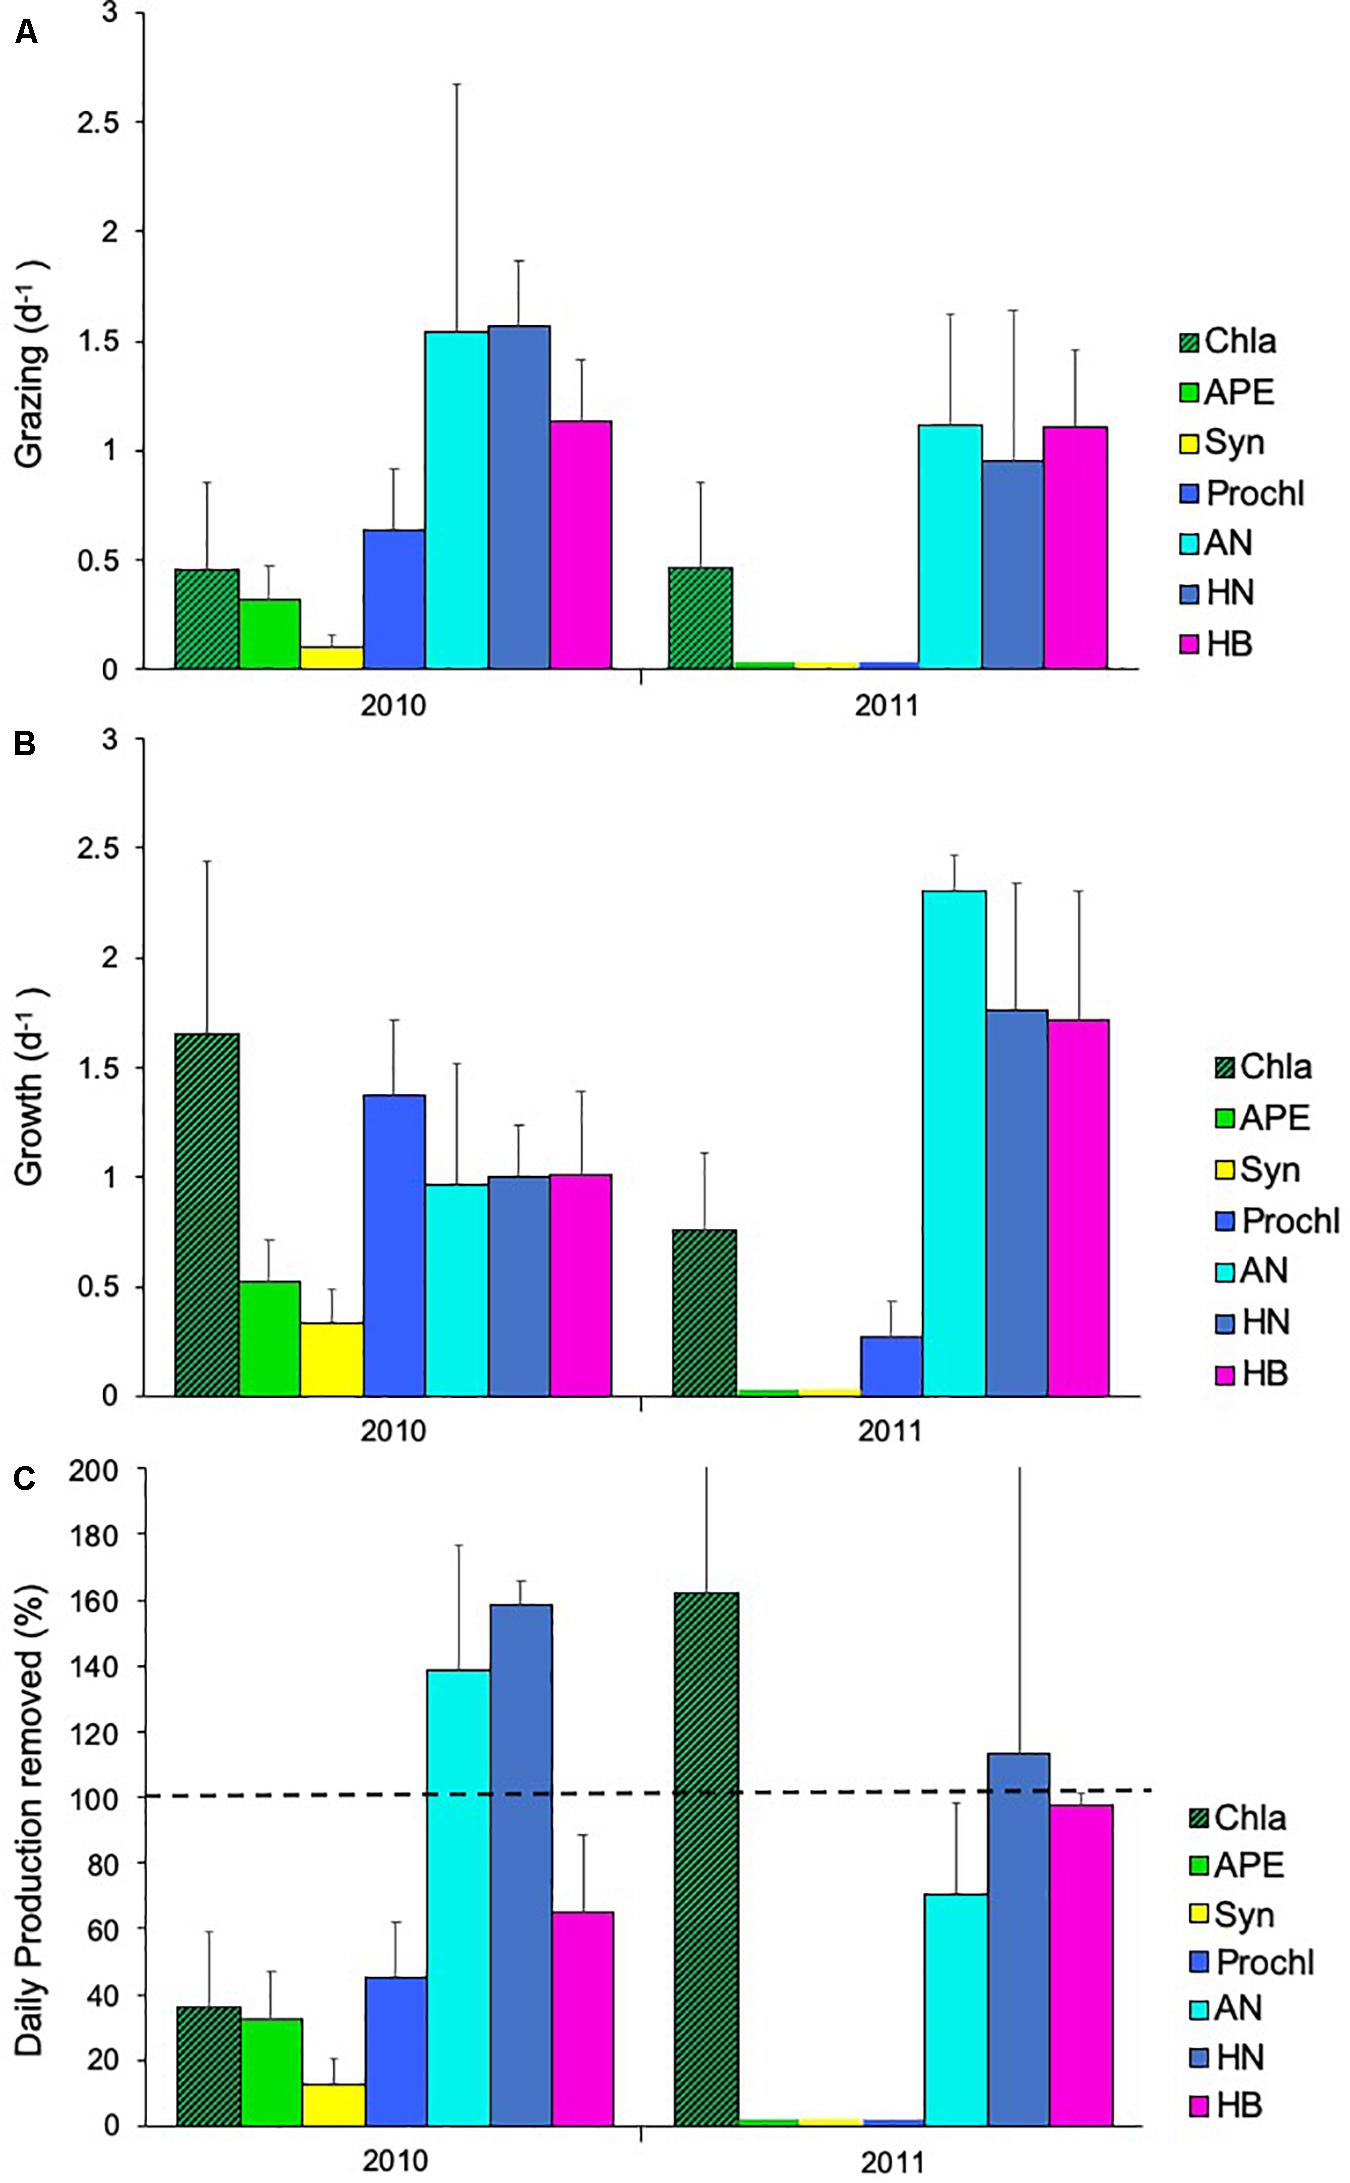
Figure 10. Rates of (A) growth (d–1), (B) grazing (d–1), and (C) daily production removed (%) (± SE) in 2010 and 2011 for chlorophyll a (Chla, ), autotrophic picoeukaryotes (APE,), Synechococcus (Syn,), Prochlorococcus (Prochl,), autotrophic nanoflagellates (AN,), heterotrophic nanoflagellates (HN,
 ) and heterotrophic bacteria (HB).
Discussion
Two contrasted scenarios were observed during 2010 and 2011 in the subtropical waters off the Canary Islands. Winter 2010 was the warmest of the last 30 years in these waters (Cropper and Hanna, 2014), also coinciding with the exceptionally warm temperatures in Europe (Barriopedro et al., 2011). In the eastern North Atlantic subtropical gyre, the cooling of surface waters and some episodic wind stirring in winter stimulates convection which erodes the thermocline and re-supplies nutrients to the photic zone, developing the LWB (Menzel and Ryther, 1961; De Leon and Braun, 1973; Braun, 1980; Karl et al., 1996; Barton et al., 1998; Arístegui et al., 2001; Cianca et al., 2007; Neuer et al., 2007). Temperature was above 19°C during the productive period of 2010, limiting the flux of nutrients into the euphotic layer by convective mixing. These climatic conditions promoted oligotrophic conditions during 2010, preventing the formation of the typical LWB in these waters. The annual average values of satellite Chla from 2003 to 2014 was 0.4 mg Chla m–3 ± 0.14 (mean ±SD)3, while during 2010 average value was 0.21 ± 0.19 (mean ± SD). By contrast, normal productive conditions were observed during winter 2011 as we noticed the development of the winter bloom. Physical conditions during winter directly impacted the biomass of planktonic organisms and most likely the trophic relationships among different groups.
Impact of Late Winter Bloom Development on Autotroph Community
The ∼0.5°C increase in temperature during 2010 led to a high stratification of the mixed layer, which limited the development of the LWB during February and March and the subsequent increase in Chla (Figures 2, 3A). By contrast, the cooling of surface waters during 2011 promoted the development of a deep mixed layer and the consequent nutrient availability in the euphotic zone, favoring the development of the LWB. In terms of Chla, the magnitude of the LWB in 2011 was similar to previous studies in the area (e.g., Schmoker and Hernández-León, 2013). During spring, surface waters became warmer and autotrophic biomass decreased (Figures 3, 6) as expected (Arístegui et al., 2001; Schmoker et al., 2012, 2014).
Saharan Dust Fertilization and Nutrient Pumping
The year 2010 was a period of more intense dust events in recent years (Cropper et al., 2014), and March 2010 showed the highest deposition (Figure 3A). Dust transported significant concentrations of iron, aluminum and manganese as measured during the same events (see Jaramillo-Vélez et al., 2016; Menéndez et al., 2017; Báez-Hernández et al., 2019) and promote some nutrient stress relief (Neuer et al., 2004). The strong stratification of the water column during winter 2010 limited the replenishment of nutrients to the euphotic layer. However, it is also known that Saharan dust releases relatively high concentrations of phosphorus (Bonnet et al., 2005; Herut et al., 2005; Duarte et al., 2006), which would explain, at least in part, the higher PO43– concentration during 2010 (0.12 μM ± 0.05 SD) compared to 2011 (0.07 μM ± 0.03 SD) (Mann-Whitney Rank Sum Test, p < 0.001), with previous measurements at the time-series from station ESTOC (Neuer et al., 2007), and at the northeast subtropical gyre (Marañón et al., 2000, 2003). Saharan dust also contains silicates (Goudie and Middleton, 2001; Viana et al., 2002) although its concentration in the ocean remained slightly lower in 2010 (0.52 μM ± 0.13 SD) than in 2011 (0.66 μM ± 0.3 SD) but not significantly different. It was not surprising to find a higher concentration of NO3 + NO2 in 2011 (0.19 μM ± 0.18 SD) due to higher mixing in that year compared to 2010 (0.06 μM ± 0.01 SD). However, NO3 + NO2 peaks observed after dust events (Figure 3) were also reported by other authors (e.g., Mills et al., 2004) as Saharan dust is also an important source of NO2– and especially NO3– (Formenti et al., 2003; Morales-Baquero et al., 2006; Tang et al., 2010).
Community Succession
Prochlorococcus, Synechococcus, and autotrophic picoeukaryotes biomass were extremely low during 2010 compared to 2011 (Figure 4). This biomass was also quite low compared to previous years in the same area (see Schmoker and Hernández-León, 2013). Prochlorococcus dominated throughout the study except during the bloom, when Synechococcus and autotrophic picoeukaryotes took over the picoplankton community (Figure 4B), something observed as a common feature of subtropical gyres (Zubkov et al., 2000; DuRand et al., 2001; Baltar et al., 2009; Giovannoni and Vergin, 2012; Schmoker et al., 2012; Schmoker and Hernández-León, 2013). Heterotrophic prokaryotes dominated the picoplankton community during 2010 although their biomass was lower than during 2011. Gómez-Consarnau et al. (2019) reported that bacteria with proteorhodopsins exhibit a hybrid metabolism obtaining energy from organic matter degradation or through light-driven energy generation. In highly oligotrophic environments, biomass generation by these bacteria can exceed that of primary production. However, we can only speculate that heterotrophic prokaryotes dominance over other picoplankton during 2010 was due to bacteria with proteorhodopsins since no more specific analyses were made during this study.
The diatom peak at the beginning of the bloom period is another feature of the LWB already observed in Canary Island waters (Ojeda, 1998; Schmoker et al., 2014). The large and episodic increase in diatoms biomass during 2011 was a striking result since temperature were slightly higher than in previous studies (see Schmoker and Hernández-León, 2013). Therefore, we would expect a lower availability of nutrients developing a less favorable scenario for these large algae. Kemp and Villareal (2013) observed diatoms involved in diazotrophic diatom symbioses increasing primary production in stratified and oligotrophic waters. However, we cannot prove that Chaetoceros sp., the largest contributors to the diatom biomass in February 2011, was involved in diazotrophic diatom assemblages. Another possibility to explain the diatom peak could be that Saharan dust deposition during January 2011 fertilized surface waters, enhancing the availability of nutrients due to mixing and favoring the extraordinary peak of diatoms.
Dinoflagellates dominated the planktonic community during 2010, and had higher biomass than in 2011 (Figures 7, 9). Dinoflagellates are dominant during oligotrophic, warm, and stratified periods as observed in the tropical and subtropical ocean (e.g., Armengol et al., 2019). Outside the productive period during 2011, dinoflagellates also predominated in the microplankton community as previously observed in the oligotrophic subtropical ocean (Buck et al., 1996; Bode et al., 2001; Naik et al., 2015; Armengol et al., 2019). Opposite to our results, Schmoker and Hernández-León (2013) found ciliates as the most abundant organisms of the microplankton community during their study between 2005 and 2007. We hypothesize that the large biomass of mesozooplankton during 2010 preyed on ciliates as the preference of copepods for ciliates is well known (Stibor et al., 2004a, b; Vadstein et al., 2004; Calbet and Saiz, 2005; Armengol et al., 2017), potentially explaining in part the low ciliate biomass during 2010 (0.70 mgC m–3 ± 0.25 SD) in comparison to 2011 (1.12 mgC m–3 ± 0.54 SD).
The mesozooplankton biomass increased after dust deposition (Figure 8), especially after the main event on March 18th, in accordance with previous studies in the area (Hernández-León et al., 2004). Herrera et al. (2017) suggested that the increase in mesozooplankton was the consequence of the so-called luxury consumption (Pitta et al., 2016) based on phosphorus input changing the stoichiometry of preys and favoring mesozooplankton (see below).
Trophic Web Relationships
During this study, we observed how physical and chemical conditions in our area of study shifted from very oligotrophic (2010) to oligotrophic (2011) and productive conditions (LWB). Temperature and availability of nutrients/preys were the main shaping agents of the planktonic communities as shown by correlations found between both variables and different groups of organisms (Tables 1, 2). However, trophic interactions have a strong impact on planktonic communities, given that grazing is an important driver of primary producers, even when phytoplankton growth increases (Landry et al., 2000b, a; de Baar et al., 2005; Herut et al., 2005; Boyd et al., 2007; Henjes et al., 2007; Marañón et al., 2010). Productive environments differ biologically from oligotrophic ones as in the latter small cells dominate the planktonic community (Marañón et al., 2010). In oligotrophic environments, microzooplankton is more efficient at consuming phytoplankton as a result of their similar size to its prey, high growth, and metabolic rates (Fenchel, 1987; Sherr and Sherr, 1994; Jones, 2000; Boëchat et al., 2007), and their consumption can exceed more than 70% of primary production (Landry and Calbet, 2004; Armengol et al., 2019). Conversely, in productive environments large cells such as diatoms dominate the community (e.g., Wilkerson et al., 2000). Here, microzooplankton are the main consumers of bacteria, small autotrophs, flagellates and even other protists (e.g., Campbell, 1927, 1926; Sherr et al., 1986; Strom, 1991; Hansen, 1992; Sherr and Sherr, 2003). Nanoflagellates are efficient bacterivores (Azam et al., 1983) and could be preying on cyanobacteria and heterotrophic prokaryotes as shown by the relationships found between heterotrophic nanoflagellates and Synechococcus (Tables 1, 2). The large biomass of dinoflagellates and the decrease in autotrophic picoeukaryotes and Synechococcus biomass (Figures 4, 7) during the productive period in March 2010, as well as the high grazing rates found (Table 3), and the significant relationships between dinoflagellates and autotrophic picoeukaryotes (Tables 1, 2), suggest the grazing of dinoflagellates upon autotrophic picoeukaryotes. The relative high availability of potential preys during 2011 (Figure 4) did not result in high grazing rates on pico- and nanoplankton. This is a common feature of oligotrophic systems because nanograzers are the largest consumers of primary production (Calbet, 2008). Previous studies (Schmoker and Hernández-León, 2013; Armengol et al., 2017) found a strong correlation between microplankton and autotrophic picoplankton in these waters and suggested that small-sized microplankton controlled smaller autotrophic cells, supporting our results.
Trophodynamics depends on both physical and chemical factors such as temperature or dust deposition and organisms abundance. Thereby, we hypothesize three trophic scenarios were taking place depending on environmental conditions and promoting productive, oligotrophic, or highly oligotrophic conditions. Water became more productive during the LWB and experienced an increase in autotrophic organisms, especially diatoms. From results of biomass and statistics test obtained, we speculate mesozooplankton could consume the diatom bloom enhanced by the continuous pumping of nutrients from deep waters due to mixing, while ciliates could graze upon picoplankton. Mesozooplankton (mainly copepods) could also be preying upon ciliates. Thus, in this scenario, we speculate that a “classic trophic chain” prevailed (Mills, 1989). In this environment large organisms dominated the community while dinoflagellates decreased in biomass.
Outside the LWB period waters were warmer, stratification increased, and nutrients diminished. Now, smaller organisms such as dinoflagellates and heterotrophic prokaryotes dominated the planktonic community while ciliates decreased. Mesozooplankton biomass decreased during this period probably due to its inability to take advantage of new available resources. The mesozooplankton decline suggests a small transfer of matter and energy from primary producers to higher trophic levels, and a potentially a higher remineralization of organic matter typical of the microbial loop (Azam et al., 1983).
The last scenario observed was the highly oligotrophic conditions during 2010 as a result of the strongly stratified waters which prevented mixing and nutrient availability. During this period, the Saharan dust events were almost the sole nutrient input. We observed a decrease in Chla and an increase in the biomass of heterotrophic prokaryotes, nanoflagellates, and mesozooplankton after dust events, especially after the most important one in March 18th, 2010. These pattern could be fingerprints of an alternative trophic pathway similar to the so-called “tunneling effect” (Thingstad and Cuevas, 2010), whereby rapid luxury consumption (rapid uptake of phosphate) by bacteria could be quickly consumed by heterotrophic nanoflagellates and dinoflagellates, increasing its biomass and mesozooplankton feeding as proposed by Herrera et al. (2017). If we consider heterotrophic prokaryotes as bacteria with proteorhodopsins, as proposed by Gómez-Consarnau et al. (2019) in highly oligotrophic waters, autotrophic and mixotrophic dinoflagellates could be the major consumers of phosphates, explaining in part the high biomass of dinoflagellates throughout 2010. Also the biomass of mesozooplankton remained relatively high until June 2010, showing some fingerprints of fertilization effects through these non-exclusive trophic pathway due to dust events during April, May, and June 2010, transferring energy and matter from lower to higher trophic levels.
In summary, the increase of 0.5°C in temperature in subtropical waters prevented the development of the LWB and caused highly oligotrophic conditions, whereby the episodic Saharan dust events provided an important input of nutrients. In this environment, we expected the dominance of small cells and low mesozooplankton biomass. However, we found a relatively high mesozooplankton biomass, hinting at other trophic pathways such as the “tunneling effect.” In 2011, lower temperature conditions and mixing improved nutrient availability in the euphotic zone and allowed the development of the LWB during 2011. In this period, autotrophic cells dominated the community, whereby diatoms showed a massive peak, coinciding with an increase of ciliates and mesozooplankton. We suggest that during the LWB, coexistence of the microbial loop and the “classic” trophic web occurred, increasing efficiency in matter transfer to higher trophic levels. However, the LWB is only a short productive pulse in the normal oligotrophic conditions dominating subtropical waters throughout the year. Before and after the bloom, we found the dominance of typical small cells of oligotrophic environments, wherein microbial loop usually predominates with a high nutrient recycling.
Data Availability Statement
All datasets generated for this study are included in the article/supplementary material.
Author Contributions
LA obtained the dust and remote sensing derived primary production data, and contributed to the interpretation and writing of the manuscript. GF sampled and measured biomass of picoplankton, nanoplankton, chlorophyll and heterotrophic bacteria, and carried out grazing experiments. AO measured abundance and biomass of microplankton samples. SH-L designed and promoted this study and acted as a cruise leader, as well as contributed to the writing and discussion of the manuscript. All authors contributed to the article and approved the submitted version.
Funding
This research was funded by projects Lunar Cycles and Iron Fertilization (LUCIFER, CTM2008-03538), “Biomass and Active Flux in the Bathypelagic Zone” (Bathypelagic, CTM2016-78853-R) from the Spanish Ministry of Economy and Competitiveness (MINECO) to SH-L, and South and Tropical Atlantic Climate-Based Marine Ecosystem Prediction for Sustainable Management (TRIATLAS, 817578) from European Commission. GF was funded with a doctoral fellowship from Universidad de Las Palmas de Gran Canaria. LA was funded with a doctoral fellowship (BES-2013-063148) from the MINECO of Spain, and with a postdoctoral fellowship from “Unidad de Océano y Clima” of R&D&I Consejo Superior de Investigaciones Científicas and IOCAG.
Conflict of Interest
The authors declare that the research was conducted in the absence of any commercial or financial relationships that could be construed as a potential conflict of interest.
Footnotes
- ^ http://www.gobiernodecanarias.org/medioambiente/calidaddelaire/inicio.do
- ^ http://www.science.oregonstate.edu/ocean.productivity/index.php
- ^ https://oceancolor.gsfc.nasa.gov/atbd/chlor_a/
References
Angel, M. V. (1989). Vertical profiles of pelagic communities in the vicinity of the Azores Front and their implications to deep ocean ecology. Prog. Oceanogr. 22, 1–46. doi: 10.1016/0079-6611(89)90009-8
Arístegui, J., Hernández-León, S., Montero, M. F., and Gómez, M. (2001). The seasonal planktonic cycle in coastal waters of the Canary Islands. Sci. Mar. 65, 51–58. doi: 10.3989/scimar.2001.65s151
Armengol, L., Calbet, A., Franchy, G., Rodríguez-Santos, A., and Hernández-León, S. (2019). Planktonic food web structure and trophic transfer efficiency along a productivity gradient in the tropical and subtropical Atlantic Ocean. Sci. Rep. 9:2044. doi: 10.1038/s41598-019-38507-9
Armengol, L., Franchy, G., Ojeda, A., Santana-del Pino, Á, and Hernández-León, S. (2017). Effects of copepods on natural microplankton communities: do they exert top-down control? Mar. Biol. 164:136. doi: 10.1007/s00227-017-3165-2
Armstrong, F. A. J., Stearns, C. R., and Strickland, J. D. H. (1967). The measurement of upwelling and subsequent biological process by means of the Technicon Autoanalyzer® and associated equipment. Deep Sea Res. Oceanogr. Abstr. 14, 381–389. doi: 10.1016/0011-7471(67)90082-4
Assmy, P., Cisewski, B., Henjes, J., Klaas, C., Montresor, M., and Smetacek, A. (2014). Response of the protozooplankton assemblage during the European Iron Fertilization Experiment (EIFEX) in the Antarctic circumpolar current. J. Plankton Res. 36, 1175–1189. doi: 10.1093/plankt/fbu068
Azam, F., Fenchel, T., Field, J. G., Gray, J. S., Meyer-Reil, L. A., and Thingstad, F. (1983). The ecological role of water-column microbes in the Sea. Mar. Ecol. Prog. Ser. 10, 257–263. doi: 10.2307/24814647
Báez-Hernández, M., García, N., Menéndez, I., Jaramillo, A., Sánchez-Pérez, I., and Santana, Á (2019). Interaction of sinking behaviour of Saharan dust and lithogenic and biogenic fluxes in the Canary Basin. Sci. Mar. 83, 121–132. doi: 10.3989/scimar.04877.19A
Baltar, F., Arístegui, J., Montero, M. F., Espino, M., Gasol, J. M., and Herndl, G. J. (2009). Mesoscale variability modulates seasonal changes in the trophic structure of nano- and picoplankton communities across the NW Africa-Canary Islands transition zone. Prog. Oceanogr. 83, 180–188. doi: 10.1016/J.POCEAN.2009.07.016
Barriopedro, D., Fischer, E. M., Luterbacher, J., Trigo, R. M., and Garcia-Herrera, R. (2011). The hot summer of 2010?: map of Europe. Science 332, 220–224. doi: 10.1080/10255842.2015.1069566
Barton, E. D., Arıìstegui, J., Tett, P., Cantón, M., Garcıìa-Braun, J., and Hernández-León, S. (1998). The transition zone of the Canary Current upwelling region. Prog. Oceanogr. 41, 455–504. doi: 10.1016/S0079-6611(98)00023-8
Behrenfeld, M. J., and Falkowski, P. G. (1997). Photosynthetic rates derived from satellite-based chlorophyll concentration. Limnol. Oceanogr. 42, 1–20. doi: 10.4319/lo.1997.42.1.0001
Behrenfeld, M. J., O’malley, R. T., Siegel, D. A., Mcclain, C. R., Sarmiento, J. L., and Feldman, G. C. (2006). Climate-driven trends in contemporary ocean productivity. Nat. Lett. 444, 752–755. doi: 10.1038/nature05317
Benavides, M., Arístegui, J., Agawin, N. S. R., Cancio, J. L., and Hernàndez-León, S. (2013). Enhancement of nitrogen fixation rates by unicellular diazotrophs vs. Trichodesmium after a dust deposition event in the Canary Islands. Limnol. Oceanogr. 58, 267–275. doi: 10.4319/lo.2013.58.1.0267
Bishop, J. K. B., Davis, R. E., and Sherman, J. T. (2002). Robotic observations of dust storm enhancement of carbon biomass in the North Pacific. Science 298, 817–821. doi: 10.1126/SCIENCE.1074961
Bode, A., Barquero, S., Varela, M., Braun, J., and de Armas, D. (2001). Pelagic bacteria and phytoplankton in oceanic waters near the Canary Islands in summer. Mar. Ecol. Prog. Ser. 209, 1–17. doi: 10.3354/meps209001
Boëchat, I. G., Weithoff, G., Krüger, A., Gücker, B., and Adrian, R. (2007). A biochemical explanation for the success of mixotrophy in the flagellate Ochromonas sp. Limnol. Oceanogr. 52, 1624–1632. doi: 10.4319/lo.2007.52.4.1624
Bonnet, S., Guieu, C., Chiaverini, J., Ras, J., and Stock, A. (2005). Effect of atmospheric nutrients on the autotrophic communities in a low nutrient, low chlorophyll system. Limnol. Oceanogr. 50, 1810–1819. doi: 10.4319/lo.2005.50.6.1810
Borsheim, K. Y., and Bratbak, G. (1987). Cell volume to cell carbon conversion factors for a bacterivorous Monas sp. enriched from seawater. Mar. Ecol. Prog. Ser. 36, 171–175. doi: 10.3354/meps036171
Boyce, D. G., Lewis, M. R., and Worm, B. (2010). Global phytoplankton decline over the past century. Nature 466, 591–596. doi: 10.1038/nature09268
Boyd, P. W., Jickells, T., Law, C. S., Blain, S., Boyle, E. A., and Buesseler, K. O. (2007). Mesoscale Iron enrichment experiments 1993-2005: synthesis and future directions. Science 315, 612–617. doi: 10.1126/science.1131669
Braun, J. (1980). Estudios de producción en aguas de las Islas Canarias. I, hidrografía, nutrientes y producción primaria. Bolet. Inst. Español Oceanogr. 285, 149–154.
Buck, K. R., Chavez, F. P., and Campbell, L. (1996). Basin-Wide Distributions of Living Carbon Components and the Inverted Trophic Pyramid of the Central Gyre of the North Atlantic Ocean, Summer 1993. Available at: https://www.int-res.com/articles/ame/10/a010p283.pdf (accessed August 28, 2019).
Cai, R., Hoegh-Guldberg, O., Fabry, V. J., Hilmi, K., Poloczanska, E. S., Sundby, S., et al. (2014). AR5 Climate Change 2014: Impacts, Adaptation, and Vulnerability — IPCC. Available at: https://www.ipcc.ch/report/ar5/wg2/ (accessed August 23, 2019).
Calbet, A. (2008). The trophic roles of microzooplankton in marine systems. ICES J. Mar. Sci. 65, 325–331. doi: 10.1093/icesjms/fsn013
Calbet, A., and Landry, R. M. (2004). Phytoplankton growth, microzooplankton grazing, and carbon cycling in marine systems. Limnol. Oceanogr. 49, 51–57. doi: 10.4319/lo.2004.49.1.0051
Calbet, A., and Saiz, E. (2005). The ciliate-copepod link in marine ecosystems the ciliate-copepod link in marine ecosystems. Aquat. Microb. Ecol. 38, 157–167. doi: 10.3354/ame038157
Campbell, A. S. (1926). The cytology of Tintinnopsis nucula (FOL) Laackmann with an account of its neuromotor apparatus division and a new intranuclear parasite. Publ. Zool. Univ. Calif. 29, 179–236.
Campbell, A. S. (1927). Studies on the marine ciliate Favella (Jörgensen), with special regard to the neuromotor apparatus and its role in the formation of the lorica. Publ. Zool. Univ. Calif. 29, 429–452.
Chami, M., Mallet, M., and Gentili, B. (2012). Quantitative analysis of the influence of dust sea surface forcing on the primary production of the subtropical Atlantic Ocean using a ten-year time series of satellite observations. J. Geophys. Res. Ocean 117:C07008. doi: 10.1029/2012JC008112
Cheng, L., Abraham, J., Hausfather, Z., and Trenberth, K. (2019). How fast are the oceans warming? Science 363, 128–129. doi: 10.1126/science.aav7619
Chu, P. C., and Fan, C. (2010). Optimal linear fitting for objective determination of ocean mixed layer depth from glider profiles. J. Atmos. Ocean. Technol. 27, 1893–1898. doi: 10.1175/2010JTECHO804.1
Cianca, A., Helmke, P., Mouriño, B., Rueda, M. J., Llinás, O., and Neuer, S. (2007). Decadal analysis of hydrography and in situ nutrient budgets in the western and eastern North Atlantic subtropical gyre. J. Geophys. Res. 112:C07025. doi: 10.1029/2006JC003788
Cropper, T. E., and Hanna, E. (2014). An analysis of the climate of Macaronesia, 1865-2012. Int. J. Climatol. 34, 604–622. doi: 10.1002/joc.3710
Cropper, T. E., Hanna, E., and Bigg, G. R. (2014). Spatial and temporal seasonal trends in coastal upwelling off Northwest Africa, 1981–2012. Deep Sea Res. Part I Oceanogr. Res. Pap. 86, 94–111. doi: 10.1016/j.dsr.2014.01.007
de Baar, H. J. W., Boyd, P. W., Coale, K. H., Landry, M. R., Tsuda, A., and Assmy, P. (2005). Synthesis of iron fertilization experiments: from the Iron Age in the age of enlightenment. J. Geophys. Res 110:C09S16. doi: 10.1029/2004JC002601
De Leon, A. R., and Braun, J. G. (1973). Ciclo Anual de la Produccion Primaria y su Relacion con los Nutrientes en Aguas Canarias (Annual Cycle of Primary Production and Its Relationship with Nutrients in Waters off the Canary Islands). Madrid: Inst. Esp. Oceanogr.
Donaghay, P. L., Rines, H. M., and Sieburth, J. M. (1992). Simultaneous sampling of fine scale biological, chemical, and physical structure in stratified waters. Ergebnisse der Limnol. ERLIA 36, 1–14.
Duarte, C. M., Dachs, J., Llabrés, M., Alonso-Laita, P., Gasol, J. M., and Tovar-Sánchez, A. (2006). Aerosol inputs enhance new production in the subtropical northeast Atlantic. J. Geophys. Res. Biogeosciences 111:G04006. doi: 10.1029/2005JG000140
Duce, R. A., and Tindale, N. W. (1991). Atmospheric transport of iron and its deposition in the ocean. Limnol. Oceanogr. 36, 1715–1726. doi: 10.4319/lo.1991.36.8.1715
Dugdale, R. C., and Goering, J. J. (1967). Uptake of new and regenerated forms of nitrogen in primary productivity. Limnol. Oceanogr. 12, 196–206. doi: 10.4319/lo.1967.12.2.0196
DuRand, M. D., Olson, R. J., and Chisholm, S. W. (2001). Phytoplankton population dynamics at the Bermuda Atlantic time-series station in the Sargasso Sea. Deep Sea Res. Part II Top. Stud. Oceanogr. 48, 1983–2003. doi: 10.1016/S0967-0645(00)00166-1
Eker-Develi, E., Kideys, A., and Tugrul, S. (2006). Role of Saharan dust on phytoplankton dynamics in the northeastern Mediterranean. Mar. Ecol. Prog. Ser. 314, 61–75. doi: 10.3354/meps314061
Fenchel, T. (1987). “Ecological physiology: feeding,” in Ecology of Protozoa. Brock/Springer Series in Contemporary Bioscience, (Berlin: Springer), 32–52. doi: 10.1007/978-3-662-25981-8_3
Formenti, P., Elbert, W., Maenhaut, W., Haywood, J., and Andreae, M. O. (2003). Chemical composition of mineral dust aerosol during the Saharan Dust Experiment (SHADE) airborne campaign in the Cape Verde region, September 2000. J. Geophys. Res. Atmos 108. doi: 10.1029/2002JD002648
Gasol, J. M., and Del Giorgio, P. A. (2000). Using flow cytometry for counting natural planktonic bacteria and understanding the structure of planktonic bacterial communities. Sci. Mar. 64, 197–224. doi: 10.3989/scimar.2000.64n2197
Giovannoni, S. J., and Vergin, K. L. (2012). Seasonality in ocean microbial communities. Science 335, 671–676. doi: 10.1126/science.1198078
Gómez-Consarnau, L., Raven, J. A., Levine, N. M., Cutter, L. S., Wang, D., and Seegers, B. (2019). Microbial rhodopsins are major contributors to the solar energy captured in the sea. Sci. Adv. 5:eaaw8855. doi: 10.1126/sciadv.aaw8855
Goudie, A. S., and Middleton, N. J. (2001). Saharan dust storms: nature and consequences. Earth Sci. Rev. 56, 179–204. doi: 10.1016/S0012-8252(01)00067-8
Gregg, W. W., Casey, N. W., and McClain, C. R. (2005). Recent trends in global ocean chlorophyll. Geophys. Res. Lett. 32:L03606. doi: 10.1029/2004GL021808
Guerzoni, S., Chester, R., Dulac, F., Herut, B., Loÿe-Pilot, M.-D., and Measures, C. (1999). The role of atmospheric deposition in the biogeochemistry of the Mediterranean Sea. Prog. Oceanogr. 44, 147–190. doi: 10.1016/S0079-6611(99)00024-5
Haas, L. W. (1982). Improved epifluorescence microscopy for observing planktonic microorganisms. Ann. Inst. Océanogr. 58, 261–266.
Hansen, P. J. (1992). Prey size selection, feeding rates and growth dynamics of heterotrophic dinoflagellates with special emphasis on Gyrodinium spirale. Mar. Biol. 114, 327–334. doi: 10.1007/BF00349535
Harris, G. P. (1986). Phytoplankton ecology: structure, function and fluctuation. J. Mar. Biol. Assoc. U. K. 67:235. doi: 10.1017/S0025315400026485
Henjes, J., Assmy, P., Klaas, C., Verity, P., and Smetacek, V. (2007). Response of microzooplankton (protists and small copepods) to an iron-induced phytoplankton bloom in the Southern Ocean (EisenEx). Deep Sea Res. Part I Oceanogr. Res. Pap. 54, 363–384. doi: 10.1016/J.DSR.2006.12.004
Hernández-León, S., Almeida, C., Bécognée, P., Yebra, L., and Arístegui, J. (2004). Zooplankton biomass and indices of grazing and metabolism during a late winter bloom in subtropical waters. Mar. Biol. 145, 1191–1200. doi: 10.1007/s00227-004-1396-5
Hernández-León, S., Llinás-González, O., and Braun, J. (1984). Nota sobre la variación de la biomasa del mesoplancton en aguas de Canarias. Centro dc Tecnología Pesquera, Telde.
Herrera, I., López-Cancio, J., Yebra, L., and Hernández-Léon, S. (2017). The effect of a strong warm winter on subtropical zooplankton biomass and metabolism. J. Mar. Res. 75, 557–577. doi: 10.1357/002224017822109523
Herut, B., Zohary, T., Mantoura, R. F. C., Pitta, P., Psarra, S., and Rassoulzadegan, F. (2005). Response of East mediterranean surface water to saharan dust: on-board microcosm experiment and field observations. Deep Sea Res. Part II Top. Stud. Oceanogr. 52, 3024–3040. doi: 10.1016/J.DSR2.2005.09.003
Hillebrand, H., Dürselen, C.-D., Kirschtel, D., Pollingher, U., and Zohary, T. (1999). Biovolume calculation for pelagic and benthic microalgae. J. Phycol. 35, 403–424. doi: 10.1046/j.1529-8817.1999.3520403.x
Irwin, A. J., and Oliver, M. J. (2009). Are ocean deserts getting larger? Geophys. Res. Lett. 36:L18609. doi: 10.1029/2009GL039883
Jaramillo-Vélez, A., Menéndez, I., Alonso, I., Mangas, J., Hernández-León, S., and Hernández-León, S. (2016). Grain size, morphometry and mineralogy of airborne input in the Canary basin: evidence of iron particle retention in the mixed layer. Sci. Mar. 80, 395–408. doi: 10.3989/scimar.04344.27A
Jickells, T. (1999). The inputs of dust derived elements to the Sargasso Sea; a synthesis. Mar. Chem. 68, 5–14. doi: 10.1016/S0304-4203(99)00061-4
Jones, R. I. (2000). Mixotrophy in Planktonic Protists: An Overview. Available at: https://onlinelibrary.wiley.com/doi/pdf/10.1046/j.1365-2427.2000.00672.x (accessed December 19, 2018).
Kahru, M., Kudela, R., Manzano-Sarabia, M., and Mitchell, B. G. (2009). Trends in primary production in the California Current detected with satellite data. J. Geophys. Res. 114:C02004. doi: 10.1029/2008JC004979
Karl, D. M., Christian, J. R., Dore, J. E., Hebel, D. V., Letelier, R. M., and Tupas, L. M. (1996). Seasonal and interannual variability in primary production and particle flux at Station ALOHA. Deep Sea Res. Part II Top. Stud. Oceanogr. 43, 539–568. doi: 10.1016/0967-0645(96)00002-1
Kelly, D. (2018). “R Tutorial for oceanographers,” in Oceanographic Analysis with R, (Berlin: Springer), 5–90. doi: 10.1007/978-1-4939-8844-0_2
Kemp, A. E. S., and Villareal, T. A. (2013). High diatom production and export in stratified waters – A potential negative feedback to global warming. Prog. Oceanogr. 119, 4–23. doi: 10.1016/J.POCEAN.2013.06.004
Landry, M., Constantinou, J., Latasa, M., Brown, S., Bidigare, R., and Ondrusek, M. (2000a). Biological response to iron fertilization in the eastern equatorial Pacific (IronEx II). III. Dynamics of phytoplankton growth and microzooplankton grazing. Mar. Ecol. Prog. Ser. 201, 57–72. doi: 10.3354/meps201057
Landry, M., Ondrusek, M., Tanner, S., Brown, S., Constantinou, J., and Bidigare, R. (2000b). Biological response to iron fertilization in the eastern equatorial Pacific (IronEx II). I. Microplankton community abundances and biomass. Mar. Ecol. Prog. Ser. 201, 27–42. doi: 10.3354/meps201027
Landry, M. R., and Calbet, A. (2004). Microzooplankton production in the oceans. ICES J. Mar. Sci. 61, 501–507. doi: 10.1016/j.icesjms.2004.03.011
Landry, M. R., and Hassett, R. P. (1982). Estimating the Grazing Impact of Marine Micro-zooplankton. Available at: http://www.faculty.wwu.edu/~shulld/ESCI322data/LandryHassett1983.pdf (accessed December 19, 2018).
Landry, M. R., Kirshtein, J., and Constantinou, J. (1995). A refined dilution technique for measuring the community grazing impact of microzooplankton, with experimental tests in the central equatorial Pacific. Mar. Ecol. Prog. Ser. 120, 53–63. doi: 10.3354/meps120053
Li, W. K., Rao, D. V., Harrison, W. G., Smith, J. C., Cullen, J. J., and Irwin, B. (1983). Autotrophic picoplankton in the tropical ocean. Science 219, 292–295. doi: 10.1126/science.219.4582.292
Lovegrove, T. (1966). The determination of the dry weight of plankton and the effect of various factors on the values obtained. Contemp. Stud. Mar. Sci 429–467.
Marañón, E., Behrenfeld, M. J., González, N., Mouriño, B., and Zubkov, M. V. (2003). High variability of primary production in oligotrophic waters of the Atlantic Ocean: uncoupling from phytoplankton biomass and size structure. Mar. Ecol. Prog. Ser. 257, 1–11. doi: 10.3354/meps257001
Marañón, E., Cermeóo, P., Rodríguez, J., Zubkov, M. V., and Harris, R. P. (2007). Scaling of phytoplankton photosynthesis and cell size in the ocean. Limnol. Oceanogr. 52, 2190–2198. doi: 10.4319/lo.2007.52.5.2190
Marañón, E., Fernández, A., Mouriño-Carballido, B., MartÍnez-GarcÍa, S., Teira, E., and Cermeño, P. (2010). Degree of oligotrophy controls the response of microbial plankton to Saharan dust. Limnol. Oceanogr. 55, 2339–2352. doi: 10.4319/lo.2010.55.6.2339
Marañón, E., Holligan, P. M., Varela, M., Mouriño, B., and Bale, A. J. (2000). Basin-scale variability of phytoplankton biomass, production and growth in the Atlantic Ocean. Deep. Res. Part I Oceanogr. Res. Pap. 47, 825–857. doi: 10.1016/S0967-0637(99)00087-4
McClain, C. R., Signorini, S. R., and Christian, J. R. (2004). Subtropical gyre variability observed by ocean-color satellites. Deep Sea Res. Part II Top. Stud. Oceanogr. 51, 281–301. doi: 10.1016/J.DSR2.2003.08.002
Menden-Deuer, S., and Lessard, E. J. (2000). Carbon to Volume Relationships for Dinoflagellates, Diatoms, and Other Protist Plankton. Available at: https://aslopubs.onlinelibrary.wiley.com/doi/pdf/10.4319/lo.2000.45.3.0569 (accessed August 23, 2019).
Menéndez, I., Derbyshire, E., Carrillo, T., Caballero, E., Engelbrecht, J. P., and Romero, L. E. (2017). Saharan dust and the impact on adult and elderly allergic patients: the effect of threshold values in the northern sector of Gran Canaria. Spain. Int. J. Environ. Health Res. 27, 144–160. doi: 10.1080/09603123.2017.1292496
Menzel, D. W., and Ryther, J. H. (1961). Nutrients limiting the production of phytoplankton in the Sargasso sea, with special reference to iron. Deep Sea Res. 7, 276–281. doi: 10.1016/0146-6313(61)90045-4
Mills, M. M., Ridame, C., Davey, M., La Roche, J., and Geider, R. J. (2004). Iron and phosphorus co-limit nitrogen fixation in the eastern tropical North Atlantic. Nature 429, 292–294. doi: 10.1038/nature02550
Mills, M. G. L. (1989). “The comparative behavioral ecology of hyenas: the importance of diet and food dispersion,” in Carnivore Behavior, Ecology, and Evolution, (Boston, MA: Springer), 125–142. doi: 10.1007/978-1-4757-4716-4_5
Moore, H. B. (1950). The relation between the scattering layer and the euphausiacea. Biol. Bull. 99, 181–212. doi: 10.2307/1538738
Morales-Baquero, R., Pulido-Villena, E., and Reche, I. (2006). Atmospheric inputs of Phosphorus and Nitrogen to the Southwest Mediterranean Region: Biogeochemical Responses of High Mountain Lakes. Available at: https://aslopubs.onlinelibrary.wiley.com/doi/pdf/10.4319/lo.2006.51.2.0830 (accessed August 28, 2019).
Naik, R. K., George, J. V., Soares, M. A., Devi, A., Anilkuma, N., and Roy, R. (2015). Phytoplankton community structure at the juncture of the Agulhas Return Front and Subtropical Front in the Indian Ocean sector of Southern Ocean: bottom-up and top-down control. Deep Sea Res. Part II Top. Stud. Oceanogr. 118, 233–239. doi: 10.1016/J.DSR2.2015.01.002
Neuer, S., Cianca, A., Helmke, P., Freudenthal, T., Davenport, R., and Meggers, H. (2007). Biogeochemistry and hydrography in the eastern subtropical North Atlantic gyre. Results from the European time-series station ESTOC. Prog. Oceanogr. 72, 1–29. doi: 10.1016/J.POCEAN.2006.08.001
Neuer, S., Torres-Padrón, M. E., Gelado-Caballero, M. D., Rueda, M. J., Hernández-Brito, J., and Davenport, R. (2004). Dust deposition pulses to the eastern subtropical North Atlantic gyre: does ocean’s biogeochemistry respond? Glob. Biogeochem. Cycles 18:GB4020.
Ojeda, A. (1998). Dinoflagelados de Canarias: Estudio Taxonómico y Ecológico. Tesis de doctorado, Universidad de las palmas de gran canaria, Biología.
Pitta, P., Nejstgaard, J. C., Tsagaraki, T. M., Zervoudaki, S., Egge, J. K., and Frangoulis, C. (2016). Confirming the “Rapid phosphorus transfer from microorganisms to mesozooplankton in the Eastern Mediterranean Sea” scenario through a mesocosm experiment. J. Plankton Res. 38, 502–521. doi: 10.1093/plankt/fbw010
Polovina, J. J., Howell, E. A., and Abecassis, M. (2008). Ocean’s least productive waters are expanding. Geophys. Res. Lett. 35:L03618. doi: 10.1029/2007GL031745
Pomeroy, L. R. (1974). The Ocean’s Food Web. A Changing Paradigm. Bioscience 24, 499–504. doi: 10.2307/1296885
Schmoker, C., Arístegui, J., and Hernández-León, S. (2012). Planktonic biomass variability during a late winter bloom in the subtropical waters off the Canary Islands. J. Mar. Syst. 95, 24–31. doi: 10.1016/J.JMARSYS.2012.01.008
Schmoker, C., and Hernández-León, S. (2013). Stratification effects on the plankton of the subtropical Canary Current. Prog. Oceanogr. 119, 24–31. doi: 10.1016/J.POCEAN.2013.08.006
Schmoker, C., Ojeda, A., and Hernández-León, S. (2014). Patterns of plankton communities in subtropical waters off the Canary Islands during the late winter bloom. J. Sea Res. 85, 155–161. doi: 10.1016/J.SEARES.2013.05.002
Sherr, B. F., and Sherr, E. B. (2003). Community respiration/production and bacterial activity in the upper water column of the central Arctic Ocean. Deep Sea Res. Part I Oceanogr. Res. Pap. 50, 529–542. doi: 10.1016/S0967-0637(03)00030-X
Sherr, B. F., Sherr, E. B., Andrew, T. L., Fallon, R. D., and Newell, S. Y. (1986). Trophic interactions between heterotrophic protozoa and bacterioplankton in estuarine water analyzed with selective metabolic inhibitors. Mar. Ecol. Prog. Ser. 32, 169–179.
Sherr, E. B., and Sherr, B. F. (1994). Bacterivory and herbivory: key roles of phagotrophic protists in pelagic food webs. Microb. Ecol. 28, 223–235. doi: 10.1007/BF00166812
Stibor, H., Vadstein, O., Diehl, S., Gelzleichter, A., Hansen, T., and Hantzsche, F. (2004a). Copepods act as a switch between alternative trophic cascades in marine pelagic food webs. Ecol. Lett. 7, 321–328. doi: 10.1111/j.1461-0248.2004.00580.x
Stibor, H., Vadstein, O., Lippert, B., Roederer, W., and Olsen, Y. (2004b). Calanoid copepods and nutrient enrichment determine population dynamics of the appendicularian Oikopleura dioica: a mesocosm experiment. Mar. Ecol. Prog. Ser. 270, 209–215. doi: 10.3354/meps270209
Strom, S. L. (1991). Growth and grazing rates of the herbivorous dinoflagellate Gymnodinium sp. from the open subarctic Pacific Ocean. Mar. Ecol. Prog. Ser. 78, 103–113.
Tang, M. J., Thieser, J., Schuster, G., and Crowley, J. N. (2010). Uptake of NO3 and N2O5 to Saharan dust, ambient urban aerosol and soot: a relative rate study. Atmos. Chem. Phys. 10, 2965–2974. doi: 10.5194/acp-10-2965-2010
Thingstad, T., and Cuevas, L. (2010). Nutrient pathways through the microbial food web: principles and predictability discussed, based on five different experiments. Aquat. Microb. Ecol. 61, 249251–249262. doi: 10.3354/ame01452
Uda, M. (1956). Researches on the fisheries grounds in relation to the scattering layer of supersonic wave. J. Tokyo Univ. Fish. 42, 103–111.
Vadstein, O., Stibor, H., Lippert, B., Løseth, K., Roederer, W., and Sundt-Hansen, L. (2004). Moderate increase in the biomass of omnivorous copepods may ease grazing control of planktonic algae. Mar. Ecol. Prog. Ser. 270, 199–207. doi: 10.3354/meps270199
Verity, P. G., Robertson, C. Y., Tronzo, C. R., Andrews, M. G., Nelson, J. R., and Sieracki, M. E. (1992). Relationships between cell volume and the carbon and nitrogen content of marine photosynthetic nanoplankton. Limnol. Oceanogr. 37, 1434–1446. doi: 10.4319/lo.1992.37.7.1434
Viana, M., Querol, X., Alastuey, A., Cuevas, E., and Rodrıìguez, S. (2002). Influence of African dust on the levels of atmospheric particulates in the Canary Islands air quality network. Atmos. Environ. 36, 5861–5875. doi: 10.1016/S1352-2310(02)00463-6
Volpe, G., Banzon, V. F., Evans, R. H., Santoleri, R., Mariano, A. J., and Sciarra, R. (2009). Satellite observations of the impact of dust in a low-nutrient, low-chlorophyll region: fertilization or artifact? Global Biogeochem. Cycles 23:GB3007. doi: 10.1029/2008GB003216
Wang, S.-H., Hsu, N. C., Tsay, S.-C., Lin, N.-H., Sayer, A. M., and Huang, S.-J. (2012). Can Asian dust trigger phytoplankton blooms in the oligotrophic northern South China Sea? Geophys. Res. Lett. 39:L05811. doi: 10.1029/2011GL050415
Welschmeyer, N. A. (1994). Fluorometric analysis of chlorophyll a in the presence of chlorophyll b and pheopigments. Limnol. Oceanogr. 39, 1985–1992. doi: 10.4319/lo.1994.39.8.1985
Wilkerson, F., Dugdale, R., Kudela, R., and Chavez, F. (2000). Biomass and productivity in Monterey Bay, California: contribution of the large phytoplankton. Deep Sea Res. Part II Top. Stud. Oceanogr. 47, 1003–1022. doi: 10.1016/S0967-0645(99)00134-4
Yentsch, C. S., and Menzel, D. W. (1963). A Method for the Determination of Phytoplankton Chlorophyll and Phaeophytin by fluorescence*. Available at: http://www.whoi.edu/cms/files/Yentsch_Menzel_1963_DSR_1-s2.0-0011747163903589-main_180904.pdf (accessed December 19, 2018).
Zubkov, M. V., Sleigh, M. A., Burkill, P. H., and Leakey, R. J. G. (2000). Picoplankton community structure on the Atlantic Meridional Transect: a comparison between seasons. Prog. Oceanogr. 45, 369–386. doi: 10.1016/S0079-6611(00)00008-2
Zubkov, M. V., Sleigh, M. A., Tarran, G. A., Burkill, P. H., and Leakey, R. J. (1998). Picoplanktonic community structure on an Atlantic transect from 50°N to 50°S. Deep Sea Res. Part I Oceanogr. Res. Pap. 45, 1339–1355. doi: 10.1016/S0967-0637(98)00015-6
Keywords: phytoplankton, microplankton, late winter bloom, oligotrophic waters, tunneling effect
Citation: Armengol L, Franchy G, Ojeda A and Hernández-León S (2020) Plankton Community Changes From Warm to Cold Winters in the Oligotrophic Subtropical Ocean. Front. Mar. Sci. 7:677. doi: 10.3389/fmars.2020.00677
Received: 12 December 2019; Accepted: 27 July 2020;
Published: 14 August 2020.
Edited by:
Chiara Piroddi, Joint Research Centre, ItalyReviewed by:
Cecile Guieu, UMR 7093 Laboratoire d’Océanographie de Villefranche (LOV), FranceBrian P. V. Hunt, The University of British Columbia, Canada
Copyright © 2020 Armengol, Franchy, Ojeda and Hernández-León. This is an open-access article distributed under the terms of the Creative Commons Attribution License (CC BY). The use, distribution or reproduction in other forums is permitted, provided the original author(s) and the copyright owner(s) are credited and that the original publication in this journal is cited, in accordance with accepted academic practice. No use, distribution or reproduction is permitted which does not comply with these terms.
*Correspondence: Laia Armengol, laia_armengol@hotmail.com