From Sea Surface to Seafloor: A Benthic Allochthonous eDNA Survey for the Abyssal Ocean
 Olivier Laroche
 Oliver Kersten3
  Craig R. Smith
 Erica Goetze
- 1Department of Oceanography, School of Ocean and Earth Science and Technology, University of Hawai‘i at Mānoa, Honolulu, HI, United States
- 2Institute of Marine Research, Tromsø, Norway
- 3Centre for Ecological and Evolutionary Synthesis, Department of Biosciences, University of Oslo, Oslo, Norway
Environmental DNA (eDNA) metabarcoding could facilitate rapid and comprehensive biotic surveys in the deep ocean, yet many aspects of the sources and distribution of eDNA in the deep sea are still poorly understood. In order to examine the influence of the water column on benthic eDNA surveys in regions targeted for deep-sea polymetallic nodule mining, we investigated the occurrence of pelagic eDNA across: (1) two different deep-sea habitat types, abyssal plains and seamounts, (2) benthic sample types, including nodules, sediment, and seawater within the benthic boundary layer (BBL), and (3) sediment depth horizons (0–2 and 3–5 cm). Little difference was observed between seamounts and the adjacent abyssal plains in the proportion of legacy pelagic eDNA sampled in the benthos, despite >1,000 m depth difference for these habitats. In terms of both reads and amplicon sequence variants (ASVs), pelagic eDNA was minimal within sediment and nodule samples (<2%), and is unlikely to affect benthic surveys that monitor resident organisms at the deep seafloor. However, pelagic eDNA was substantial within the BBL (up to 13% ASVs, 86% reads), derived both from the high-biomass upper ocean as well as deep pelagic residents. While most pelagic metazoan eDNA found in sediments and on nodules could be sourced from the epipelagic, protist legacy eDNA sampled on these substrates appeared to originate across a range of depths in the water column. Some evidence of eDNA degradation across a vertical sediment profile was observed for protists, with higher diversity in the 0–2 cm layer and a significantly lower proportion of legacy pelagic eDNA in deeper sediments (3–5 cm). Study-wide, our estimated metazoan sampling coverage ranged from 40 to 74%, despite relatively large sample size. Future deep-sea eDNA surveys should examine oceanographic influences on eDNA transport and residence times, consider habitat heterogeneity at a range of spatial scales in the abyss, and aim to process large amounts of material per sample (with replication) in order to increase the sampling coverage in these diverse deep ocean communities.
Introduction
Deep sea ecosystems are facing increasing pressure from anthropogenic activities, including climate change and future seabed mining (Boschen et al., 2013; Halpern et al., 2015; Sweetman et al., 2017). The deep sea, defined as the ocean and seafloor below 200 m, represents the largest habitat on our planet, covering ∼65% of Earth’s surface (Thistle, 2003; Thurber et al., 2014). The deep ocean is a significant regulator of carbon sequestration and nutrient regeneration, and provides habitat and trophic support to a multitude of organisms (Le et al., 2017). Characterizing and monitoring the health of deep ocean ecosystems is important, given their role in maintaining Earth’s systems.
The first large-scale deep-sea mining is likely to occur in the Clarion Clipperton Zone (CCZ), a region of particularly valuable mineral resources (nickel-, cobalt-, and copper-rich manganese nodules) in the abyssal equatorial Pacific (Wedding et al., 2013, 2015). At ∼ 6 million km2, the CCZ spans large-scale environmental gradients in polymetallic nodule density, particulate organic carbon flux and seafloor bathymetry, and is host to diverse biological communities (Glover et al., 2002; Smith et al., 2008a; Wedding et al., 2013). Approximately 30% of the CCZ management area has been allocated to exploration nodule mining through 16 contracts granted by the International Seabed Authority (ISA). Benthic communities in the CCZ are typically characterized by high biodiversity and low biomass (Ramirez-Llodra et al., 2010; Kaiser et al., 2017; Smith et al., 2019), due to severe food limitation at abyssal depths (Smith et al., 2008a). A high proportion of species are rare, rendering adequate sampling coverage particularly difficult to achieve (Smith et al., 2008a; De Smet et al., 2017; ISA, 2019; Simon-Lledó et al., 2019). Regional species diversity is enhanced by habitat heterogeneity at a range of spatial scales, including the presence of polymetallic nodules that serve as hard substrates in a predominantly soft sediment ecosystem (Amon et al., 2016; Vanreusel et al., 2016; De Smet et al., 2017; Kaiser et al., 2017; Simon-Lledó et al., 2019; Laroche et al., 2020a), as well as deep seamounts (relief >1,000 m above the surrounding seafloor; Clark et al., 2010; Leitner et al., 2017) that may alter nutrient and particle fluxes and influence associated biological communities (Genin and Dower, 2007; Samadi et al., 2007; Lavelle and Mohn, 2010; Rowden et al., 2010). Biodiversity and species ranges remain poorly characterized across the CCZ, making predictions of the impacts of large-scale mining problematic.
Environmental DNA (eDNA) surveys could be particularly valuable for monitoring community change and environmental impacts in the deep sea, given high biodiversity, limited taxonomic descriptions of the fauna, and the challenges of sampling in remote deep-ocean habitats (Boschen et al., 2016; Sinniger et al., 2016; Kersten et al., 2019; Laroche et al., 2020a). eDNA metabarcoding is a sensitive and cost-efficient tool for biodiversity assessment (Goodwin et al., 2017; Seymour, 2019), with advantages over visual or whole-animal surveys in the ability to capture the hidden diversity of cryptic microbial eukaryotes and to indirectly detect the presence of recently living organisms through cellular debris or extra-cellular DNA (Kelly, 2016; Deiner et al., 2017). However, several methodological aspects regarding eDNA surveys in the deep ocean remain unresolved, including the extent of legacy DNA (extracellular or non-living material) that arrives in the abyss via sinking with detrital particles from overlying pelagic ecosystems (but see Pawlowski et al., 2011; Morard et al., 2017 for foraminifera). eDNA degradation rates also greatly influence organismal detection; previous studies in the upper ocean have reported eDNA half-life ranging from 10 to 50 h, and complete turnover from a few hours to several months across a range of environmental conditions (see Barnes et al., 2014; Collins et al., 2018). Both abiotic and biotic factors, including temperature, pH, oxygen concentration and microbial activity, have been found to strongly influence eDNA persistence (Strickler et al., 2015; Barnes and Turner, 2016; Seymour et al., 2018; Armbrecht et al., 2019). eDNA adsorption to sediment particles can strongly protect it against hydrolysis and DNase activity (Torti et al., 2015), with low temperatures in the deep sea favorable to DNA preservation (Corinaldesi et al., 2008). Because eDNA may be better preserved in deep sea sediments than in seawater, sample substrates from benthic boundary layer (BBL) seawater, polymetallic nodules, and sediments may integrate eDNA inputs over different timescales.
We used an eDNA metabarcoding approach to assess the influence of allochthonous pelagic eDNA on biodiversity surveys at the abyssal seafloor in the western CCZ (Figure 1). Specifically, our objectives were to evaluate pelagic eDNA occurrence in different: (1) deep sea habitats, including abyssal plains/hills versus seamounts, (2) benthic sample types, including polymetallic nodules, sediment, and seawater within the BBL, and (3) sediment horizons (0–2 and 3–5). We also evaluate methods for eDNA recovery from diverse sample substrates and the sampling effort required to fully capture diverse assemblages in the abyssal CCZ. We hypothesize that: (1) most pelagic eDNA recovered from the benthos will have originated in the epipelagic, as production and biomass are highest within this depth zone, (2) the proportion of eDNA shared between pelagic and abyssal samples (BBL seawater, sediment, nodules) will be highest within BBL seawater, rather than in sediments or on nodules, as a range of species may inhabit both the deeper pelagic and BBL zones (e.g., meroplankton; Kersten et al., 2017, 2019; swimming holothurians), and (3) pelagic eDNA will occur in higher proportions within the upper sediment horizon (0–2 cm) compared to deeper horizons (3–5 cm) due to detrital eDNA settlement on the surface layer and DNA degradation over time within deeper sediments.
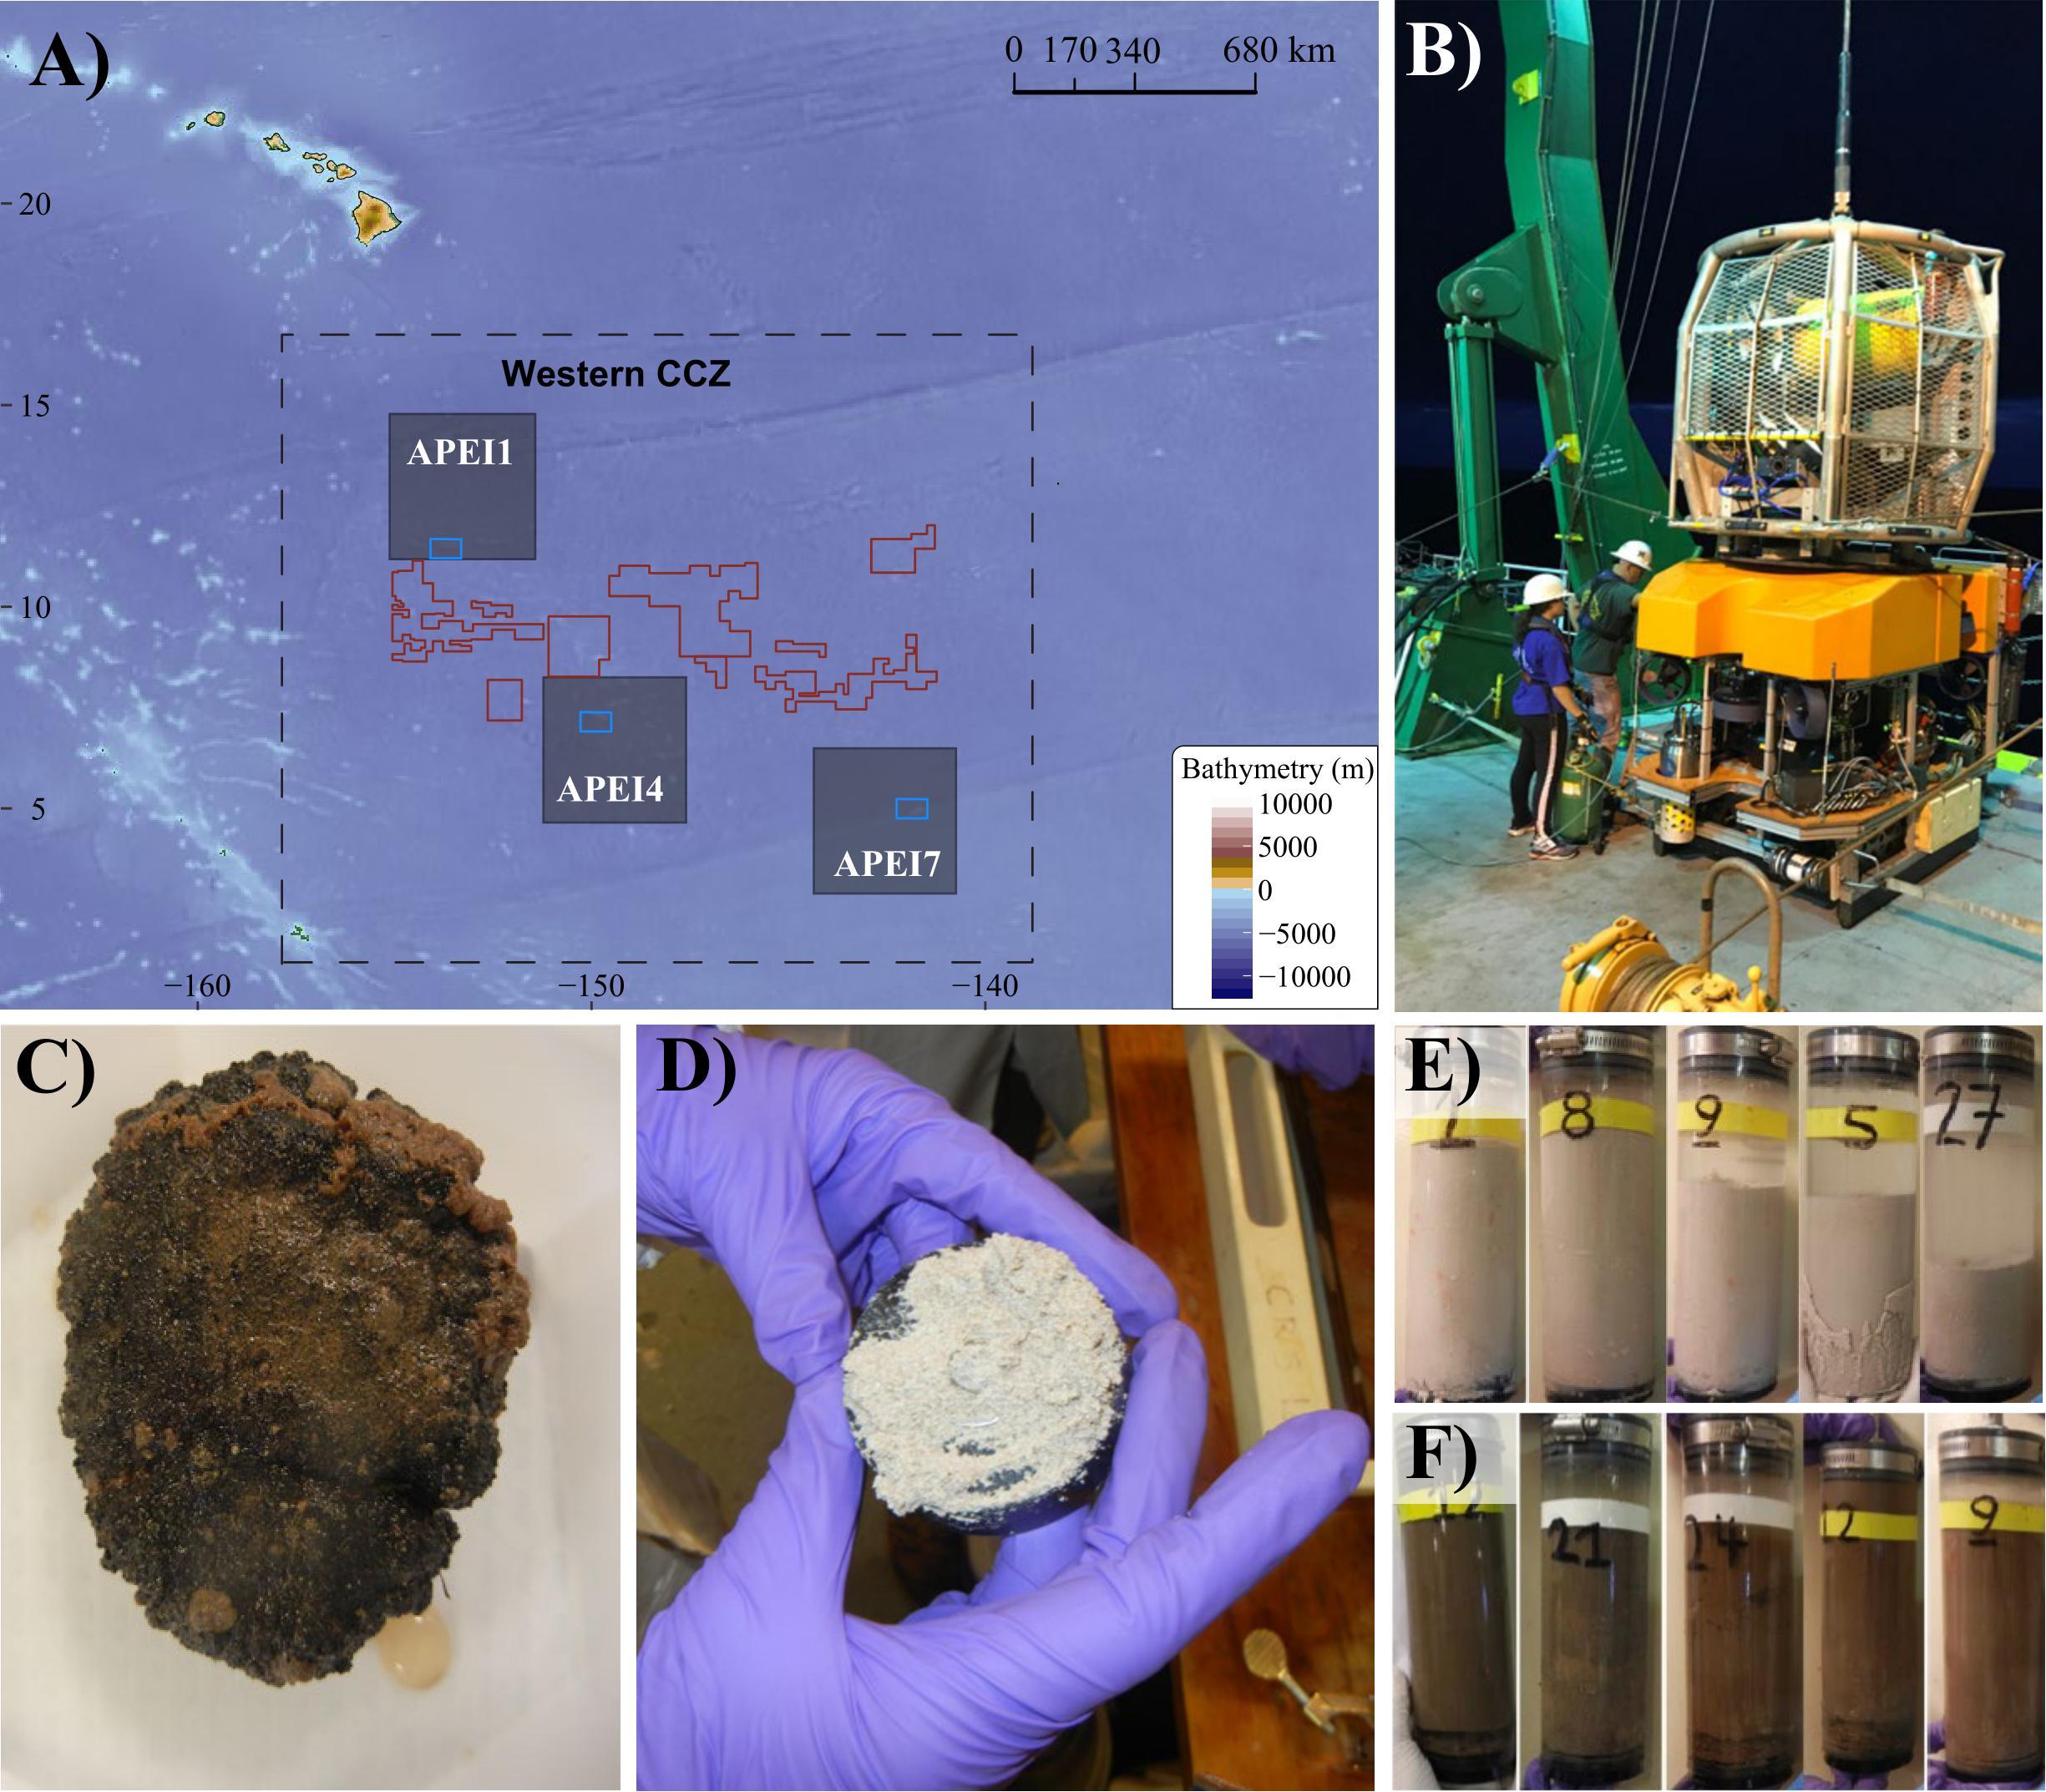
Figure 1. Sampling sites, sampling tools (ROV Lu’ukai), and substrates collected. (A) Map of the study areas within the western Clarion Clipperton Zone (Western CCZ), with the locations of Areas of Particular Environmental Interest (APEIs 1, 4, 7) indicated (gray squares). Sampling regions within each APEI are marked by blue rectangles. Exploration mining contractor (red outline) areas within the western CCZ are also shown. See Supplementary Figure S1 for greater detail on the sampling sites. (B) Remotely operated vehicle (ROV) Lu’ukai, used for collection of sediment and polymetallic nodules. (C) Example of a polymetallic nodule. (D) Example of seamount sediment texture, largely made up of foraminiferal tests. A thin slab of sediment is shown on top of a black rubber plate (push core base). (E) Seamount sediment cores. (F) Abyssal plain sediment cores.
Materials and Methods
Sample Collection
Samples were collected in Areas of Particular Environmental Interest (APEIs) 1, 4, and 7 of the western CCZ (Figure 1, Supplementary Figure S1, Tables 1, 2, and Supplementary Table S1), with one seamount and the adjacent abyssal plain sampled within each APEI. APEIs are seafloor areas currently closed by the International Seabed Authority to seabed mining (Wedding et al., 2013). Seamount summit depths ranged from 3,100 m (APEI 7) to 3,900 m (APEI 1) and were all >1,000 m above the surrounding seafloor. Abyssal plain sites were sampled over 15 km away from the seamount ridgeline (APEI 7) or base (APEI 4/APEI 1) to reduce the effect of seamount processes on the abyssal habitats sampled. Due to ROV technical constraints, only seawater samples were collected over the seamount in APEI 1.
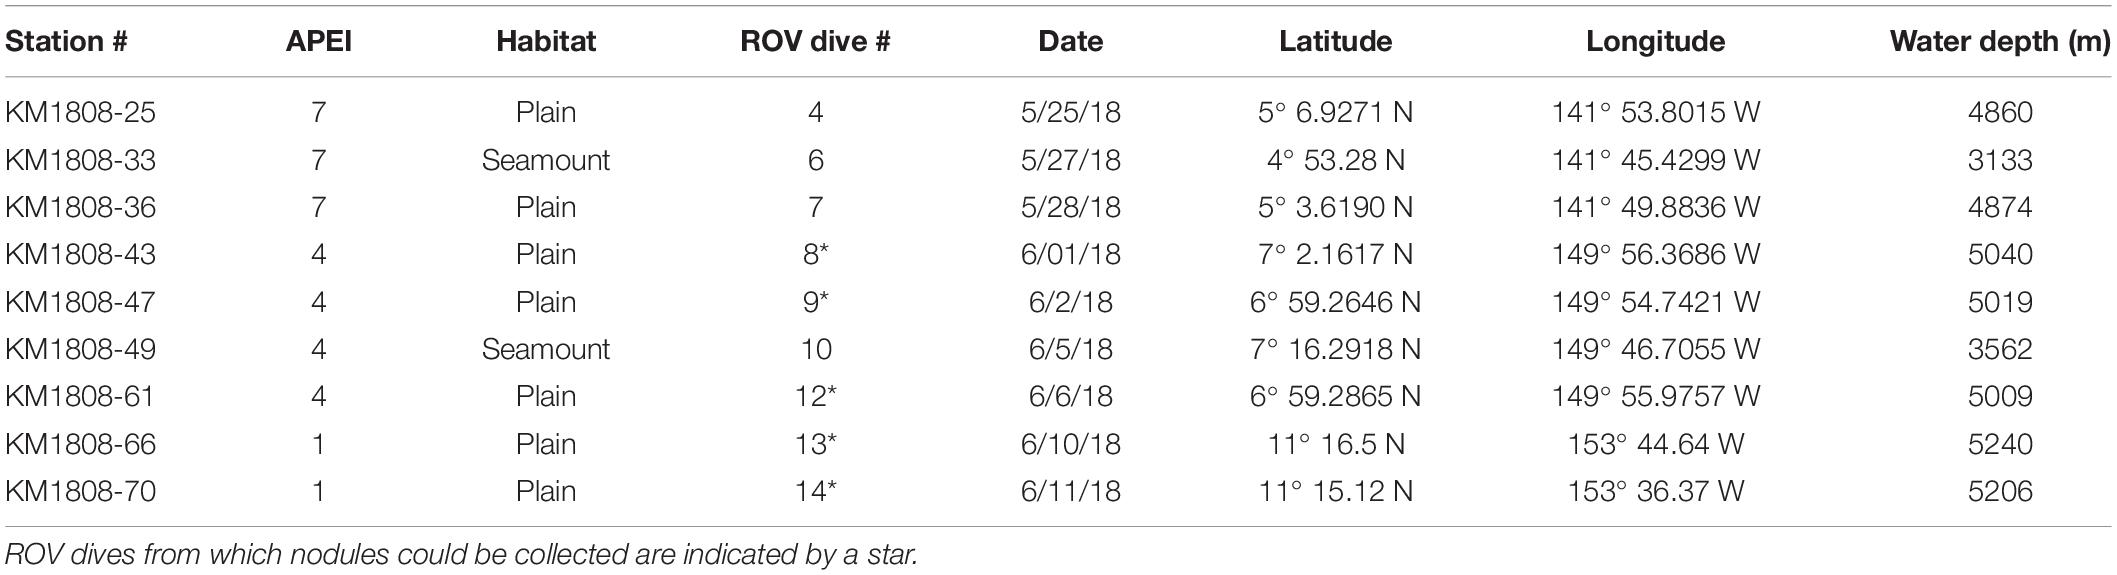
Table 1. Station overview for ROV dives from which sediment and nodules were collected for eDNA.
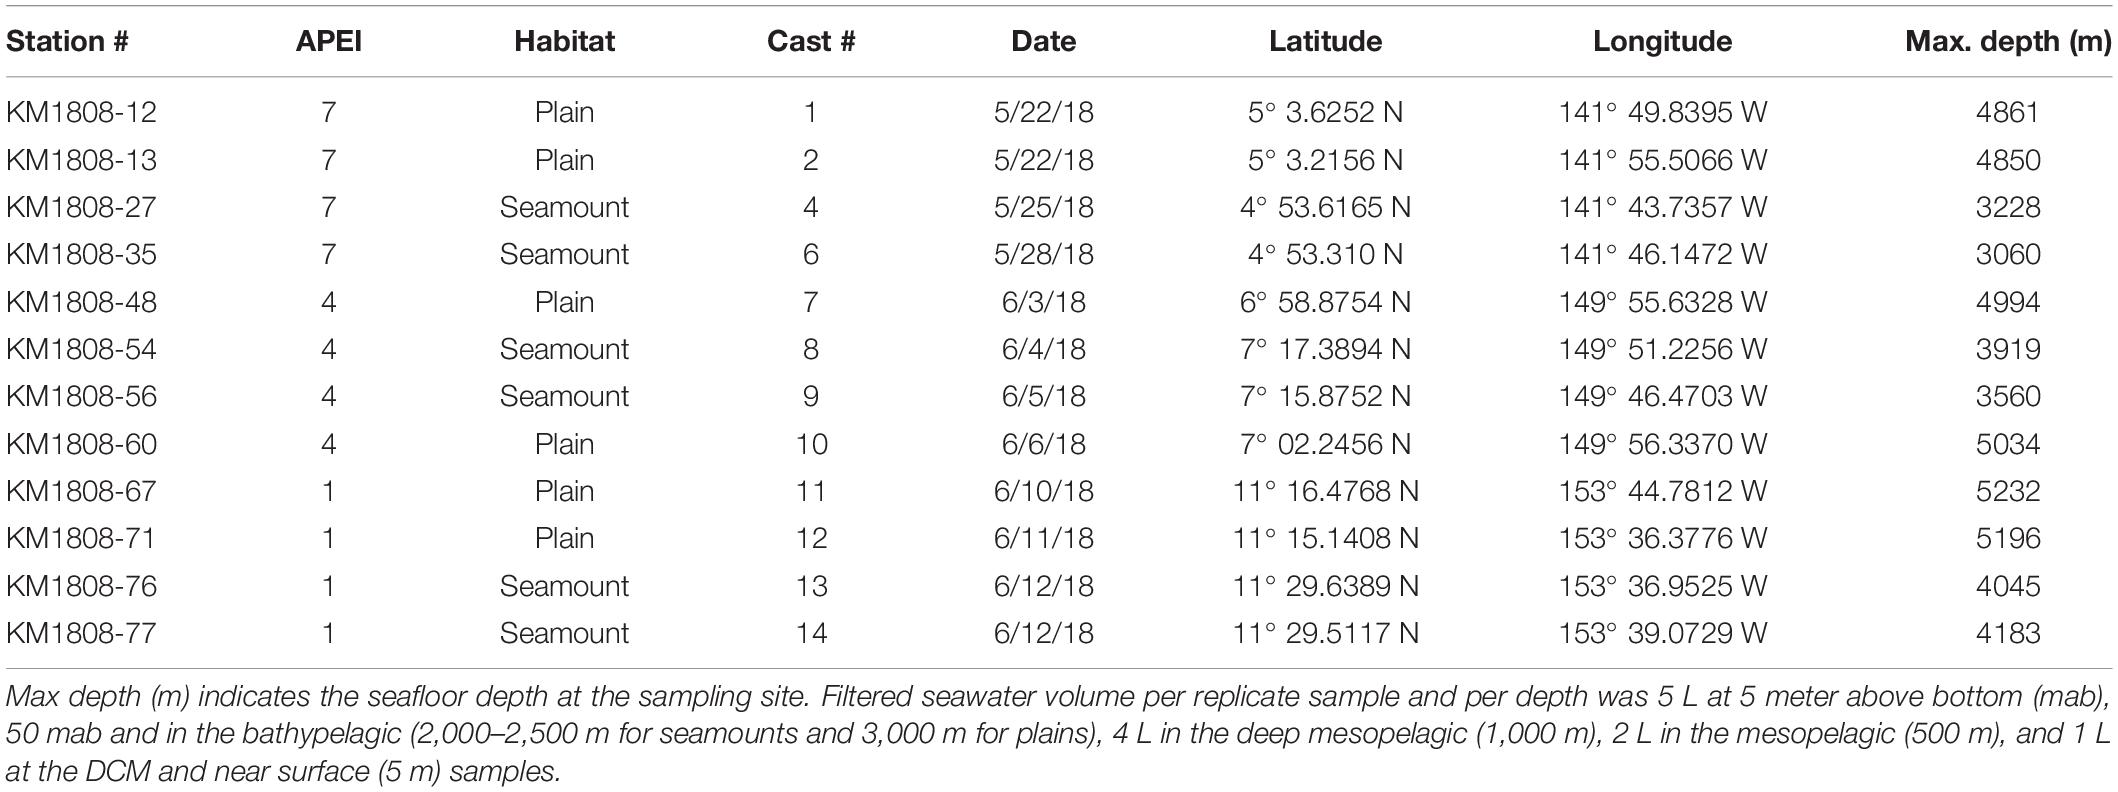
Table 2. List of conductivity, temperature and depth (CTD) casts from which seawater was collected for eDNA.
Sediment samples were obtained with the ROV Lu’ukai using 7-cm diameter push cores. Typical ROV dives yielded two cores in close proximity (meters) near the start of the dive and another 2 cores at mid-dive, on average 2.3 km away from the starting point. Cores were subsampled for eDNA at 0–2 and 3–5 cm sediment horizons using single-use sterile syringes (60 mL) to extract one mini-core from each sediment horizon. Samples were cryopreserved at −80°C until processing. Between ROV dives (Table 1), sediment-processing gear and push-core tubes were treated with 10% commercial bleach (diluted with double-distilled water [ddH2O]), and rinsed with ddH2O to prevent DNA contamination. Subsampling equipment (core slicer, guide) was rinsed in ddH2O between cores from the same ROV dive. For APEI 1, two replicate subsamples were taken from each sediment horizon and core. Polymetallic nodules were collected from the same ROV dives using either push cores or the manipulator arm of the ROV, with nodules placed into a BioBox sample holder on the ROV, which was sealed during ROV recovery from the seafloor. Upon arrival on shipboard, nodules were transferred to sterile whirl-pack bags and cryopreserved (−80°C).
Seawater samples were collected using conductivity-temperature-depth (CTD) casts with a 24 Niskin bottle rosette (10 L). Four CTD casts per APEI were conducted, two over the abyssal plain/hills and two over the seamount (Table 2). Seawater was collected at seven depths within the water column: 5 m above bottom (mab), 50 mab, bathypelagic depths (3,000 m over plains/hills, 2,500 or 2,000 m over seamounts, depending on summit depth), in the deep mesopelagic at 1,000 m, mesopelagic at 500 m, deep chlorophyll maximum (DCM; between 90 and 60 m), and at 5 m depth in near-surface waters. Eukaryotic productivity and biomass vary greatly across depth in the water column, with exponential declines in pelagic animal biomass (e.g., Vinogradov, 1970; Angel and Baker, 1982). As a result, while it is common for eDNA studies to sample the epipelagic community with small seawater volumes (e.g., 250 mL to 2 L liters, Thomsen et al., 2012; Shulse et al., 2017; Sigsgaard et al., 2017; Günther et al., 2018; Jeunen et al., 2019), larger volumes are required at greater depths to adequately sample communities to account for and offset expected declines in eDNA concentration (e.g., as in Shulse et al., 2017). Therefore, filtered seawater volumes varied across depth in this study, with 5 L per replicate sampled at 5 mab, 50 mab and bathypelagic depths, 4 L filtered in the deep mesopelagic (1,000 m), 2 L in the mesopelagic (500 m), and 1 L filtered per replicate at the DCM and in the near surface. Four to six replicates were taken from each CTD cast and depth. To assess and eliminate cross-contamination, negative controls (ddH2O) were collected for each CTD cast (1 L for each of 2 replicates), with ddH2O transferred to a sampling carbouy and filtration handled together with all seawater carbouys. eDNA was collected on sterile 0.2 μm Supor filters (Pall) using 47 mm inline polycarbonate filter holders and two peristaltic pumps. Two pumps with six tubing lines were run in parallel, with deep ocean samples run as a priority on the faster pump. Filters were preserved in 1 ml of RNALater (Invitrogen), flash frozen in liquid nitrogen, and held at −80°C until processing. Between CTD casts, the workspace was treated with 10% bleach for a minimum of 30 min, followed by a ddH2O surface wipe. Sampling equipment was treated with 10% bleach for a minimum of 30 min, followed by three ddH2O rinses and three rinses with seawater from the target sampling depth (Niskin bottle; per standard oceanographic practice for sampling from a Niskin bottle rosette). To avoid contamination during sample collection, personal protective equipment included disposable lab coats and nitrile gloves for all involved personnel. Supplementary Table S1 reports all sediment, nodule, and seawater samples included in this study.
DNA Extraction
Sediment samples were homogenized with a sterile metallic spatula, subsampled for 10 g, and processed with the PowerMax® Soil kit (QIAGEN, CA, United States) following the manufacturer’s protocol. Purified eDNA was eluted in 1 mL of ddH2O. Prior to eDNA extraction, polymetallic nodules were ground and homogenized inside their whirl-pack bag using a 16 g ceramic pestle. No detectable quantities of DNA could be obtained using the PowerMax® Soil kit with ∼10 g of nodule material, likely as a result of very low DNA concentrations on nodules. We therefore used the FastDNATM Spin kit (following the manufacturer’s protocols), processing ten subsamples of ca. 500 mg for each nodule. Due to low eDNA concentrations per subsample (mean concentration of 0.382 ng/μL), replicates were pooled in pairs and concentrated to ∼ 1 ng/μL with the DNA Clean & Concentrator kit (Zymo Research, CA, United States) to obtain sufficient DNA for polymerase chain reaction (PCR) amplification. Polymetallic nodules ranged between 15.4 and 144.8 g, with 3–32% of the nodule processed for DNA extractions.
For seawater samples, four extraction protocols were tested in pilot experiments: (1) a Cetyl Trimethyl Ammonium Bromide (CTAB) and ethanol precipitation protocol based on Renshaw et al. (2015),(2) the DNeasy® Blood and Tissue kit (QIAGEN, CA, United States) using a modified protocol from Djurhuus et al. (2017),(3) the E.Z.N.A® Water DNA kit (OMEGA, GA, United States), and (4) the DNeasy® Plant Mini kit (QIAGEN, CA, United States), using a modified protocol based on Paerl et al. (2008) and Shulse et al. (2017). Using biological triplicates, protocol 4 provided the highest DNA yield and best purity measurements, and was therefore used to process all seawater samples (see the Supplementary Material for the full protocol). Due to low DNA concentration in the 5 and 50 mab samples (mean concentration of 0.573 ng/μL), replicates (2 L × 5 L each) were pooled together and concentrated to ∼1 ng/μL with the DNA Clean & Concentrator kit (Zymo Research, CA, United States) to obtain sufficient DNA for amplification.
To assess and eliminate cross-contamination, an extraction blank was included for each sample substrate type (sediment, nodule, and seawater). All sample handling and extraction steps took place in a dedicated laboratory that had never been used for PCR amplification.
PCR Amplification and Library Preparation
The V4 region of the 18S rRNA gene [approximately 450 base pairs (bp)] was PCR amplified using the eukaryotic forward primer Uni18SF: 5′-AGG GCA AKY CTG GTG CCA GC-3′ and reverse primer Uni18SR: 5′-GRC GGT ATC TRA TCG YCT T-3′ (Zhan et al., 2013). Primers were modified to include Illumina overhang adaptors. The choice of optimal 18S rRNA hypervariable regions for biodiversity assessments remains under debate (e.g., see Hadziavdic et al., 2014; Tanabe et al., 2016). Here, preliminary tests comparing the V1–V2 region using primers from Fonseca et al. (2010) and the V4 region with primers from Zhan et al. (2013) found highest taxonomic classification and diversity at the genus level (especially for metazoans) with the latter primer set. This marker (V4 of 18S rRNA) and primer set (Zhan et al., 2013) were therefore selected for use in the full study.
Polymerase chain reaction reactions consisted of 12.5 μL of MyFiTM Mix (Bioline; hot-start, proof-reading Taq polymerase), 0.5 μL of each primer (10 μM), 0.6 μL of Bovine Serum Albumin (300 μM; BSA; Sigma), 1–3 μL of template DNA (min 2.5 ng/μL per reaction) with ddH2O added to reach a total volume of 25 μL. The reaction cycling conditions were: 95°C for 3 min, followed by 35 cycles of 95°C for 15 s, 55°C for 30 s, 72°C for 15 s, with a final extension step at 72°C for 1 min. A negative control (no template DNA) was included with each PCR to ensure an absence of contamination.
Purification and quantification of the amplicons was performed with AMPure® XP beads (Beckman Coulter®, IN, United States) and a Qubit® Fluorometer (Life Technologies), following the manufacturer’s instructions. Purified amplicons were normalized to 2 ng/μL with ddH2O, and submitted to the Advanced Studies in Genomics Proteomics and Bioinformatics (ASGPB) of the University of Hawaii at Manoa (HI, United States) for indexing with the NexteraTM DNA library Prep Kit (Illumina, CA, United States). Samples were pooled into two libraries and sequenced on two MiSeq IlluminaTM runs using V3 chemistry and paired-end sequencing (2 bp × 300 bp). Two blank samples containing ddH2O were included during the indexing and sequencing process to assess potential contamination. Sequences are available from the NCBI Sequence Read Archive (SRA) under accession numbers SRR9199590 to SRR9199869.
Bioinformatic Analysis
Demultiplexed samples were denoised with the DADA2 pipeline (Callahan et al., 2016), as implemented in Qiime2 (Bolyen et al., 2019), using the qiime dada2 denoise-paired function and default parameters. The DADA2 pipeline is a sequence quality control process that filters low quality reads based on the maximum expected error value (default = 2), detects and removes Illumina amplicon artifacts, filters PhiX reads, and merges paired forward and reverse reads using a default minimum overlapping region of 20 bp. DADA2 is particularly efficient at eliminating spurious sequences from Illumina platforms (Callahan et al., 2016). Prior to merging, forward and reverse reads were truncated at 260 and 235 bp, respectively, to remove low quality regions and reduce the number of sequences lost during quality filtering. The DADA2 pipeline detects and removes chimeric sequences using a de novo approach. Here, chimera removal also was performed using the consensus approach, in which sequences found to be chimeric in a majority of samples are discarded. Taxonomic assignment was performed by training Qiime2’s naive Bayes classifier (Pedregosa et al., 2012) on a SILVA 18S rRNA database (release 132 clustered at 99% similarity; Quast et al., 2013) trimmed with Qiime2’s feature-classifier extract-reads function and the V4 primers. For downstream analyses, amplicon sequence variants (ASVs) were used instead of operational taxonomic unit (OTUs) in order to retain the highest possible taxonomic resolution in the data. The complete bioinformatics script is provided in Supplementary Material.
Data Analysis and Statistics
Sequencing depth and recovered diversity per sample were inspected using rarefaction curves with the vegan R package (Oksanen et al., 2018). Rarefaction curves indicated that all but one sample (N-26) had sufficient sequencing depth to capture total amplicon richness within the sample. This sample was excluded from all downstream analyses (Supplementary Figure S2). Sequences found in any of the negative controls (ddH2O), including field, DNA extraction, and PCR blanks, were investigated and removed from the dataset. Sequences unclassified at kingdom level and those originating from non-marine taxa were also discarded (taxa assigned to birds, insects, terrestrial mammal families that likely originate from marine vessel waste). The data were then split into two groups: (1) metazoans, and (2) non-metazoans, primarily comprised of protists from the SAR supergroup (Adl et al., 2019). Amplicon sequence variant (ASV) richness for each sample type (sediment, nodule, and seawater) was estimated using the Chao2 index (per sample), an estimator of asymptotic species richness based on the frequency of rare taxa, as well as with a bootstrap method with 200 replicates as outlined in Chao and Jost (2012). When the Chao2 index is estimated per sample, as in this study, rare taxa correspond to those found in very few samples (rather than those that are rare within each sample). Calculations and visualizations were conducted using the iNEXT (version 2.0.19; Hsieh et al., 2019) and ggplot2 R packages (Wickham, 2016). The sampling coverage, or sampling completeness, estimator was based on the incidence of singletons and doubletons across samples (Chao2 index; defined in equation 4a of Chao and Jost, 2012). We used base coverage as a metric for comparison among multiple samples; this metric combines rarefaction and extrapolation, and represents the highest coverage value between minimum extrapolated values and maximum interpolated values (see Chao et al., 2014). Alpha and gamma diversity, reported as ASV richness estimated by the Chao2 index, was also compared across the water column. ASV overlap between sediment layers (0–2 and 3–5 cm) and water columns depths within the BBL (5 and 50 mab) was investigated with Venn diagrams using the Venny 2.1 program (Oliveros, 2015), in order to evaluate the importance of sampling these distinct depth horizons. Beta diversity differences between the water column depths was explored using unweighted unifrac distances (Lozupone and Knight, 2005) and a pairwise analysis of variance with the pairwiseAdonis R package (version 0.4; Martinez Arbizu, 2020).
The presence of pelagic eDNA at the seafloor, here defined as ASVs from samples of the near surface to the bathypelagic ocean (0 to 3,000 m over abyssal plains, 0 to 2,000–2,500 m over seamounts, inclusively) that were concurrently found in benthic samples, was examined from two perspectives: (1) the pelagic perspective, representing the proportion of pelagic ASVs and reads concurrently found in the benthic environment, and (2) the benthic perspective, representing the proportion of benthic ASVs and reads for each sample type (BBL seawater, sediments, and nodules) that were concurrently found within pelagic samples. The taxonomic composition and proportions of pelagic eDNA found within abyssal habitats were visualized using ggplot2. From the benthic perspective, the proportion of benthic ASVs and reads per sample was also contrasted per sample type and tested for significant differences between habitats and sediment layers with a two-sample Wilcoxon test in R (wilcox.test function), and visualized with box-plots and the ggplot2 R package. In order to ensure that results were not biased by differences in sampling completeness between habitats, an analysis of sampling coverage was conducted (Supplementary Figure S3).
Results
High-Throughput Sequencing
A total of 10,315,003 18S reads was generated (Supplementary Table S2). Quality filtering, denoising, merging and chimera removal reduced read counts by 54%, leaving an average of 43,523 good quality reads per sample. Removal of sequences found in the blank samples resulted in a mean loss of 2.7% ASVs per seawater sample and 0.4% of ASVs for nodules (Supplementary Table S3). Removal of non-marine taxa led to a further loss of 3.3% ASVs for nodules, 1.5% for sediment and less than 1% for seawater samples (Supplementary Table S3). All subsequent analyses were performed on both filtered and unfiltered data to examine the effect of removing sequences found in blank samples or belonging to non-marine metazoan taxa. However, since this filtering step had no impact on the results or inferences of the study, only analyses performed on trimmed data are presented below.
Sampling Coverage and Diversity
Overall, the achieved sampling coverage was highest for seawater (74 and 84% for metazoans and non-metazoans, respectively), followed by nodules (65% for both groups) and sediment samples (40 and 64% for metazoans and non-metazoans, Figure 2). Gamma diversity, or ASV richness for all samples combined, was highest within sediment samples (1,271 metazoan and 6,107 protist ASVs), followed by seawater (409 and 5,953 ASVs) and nodules (407 and 2,186 ASVs, Figure 2). Similarly, ASV richness at base coverage was higher in sediment samples than in nodules or seawater samples for both metazoans and non-metazoans (Figure 2).
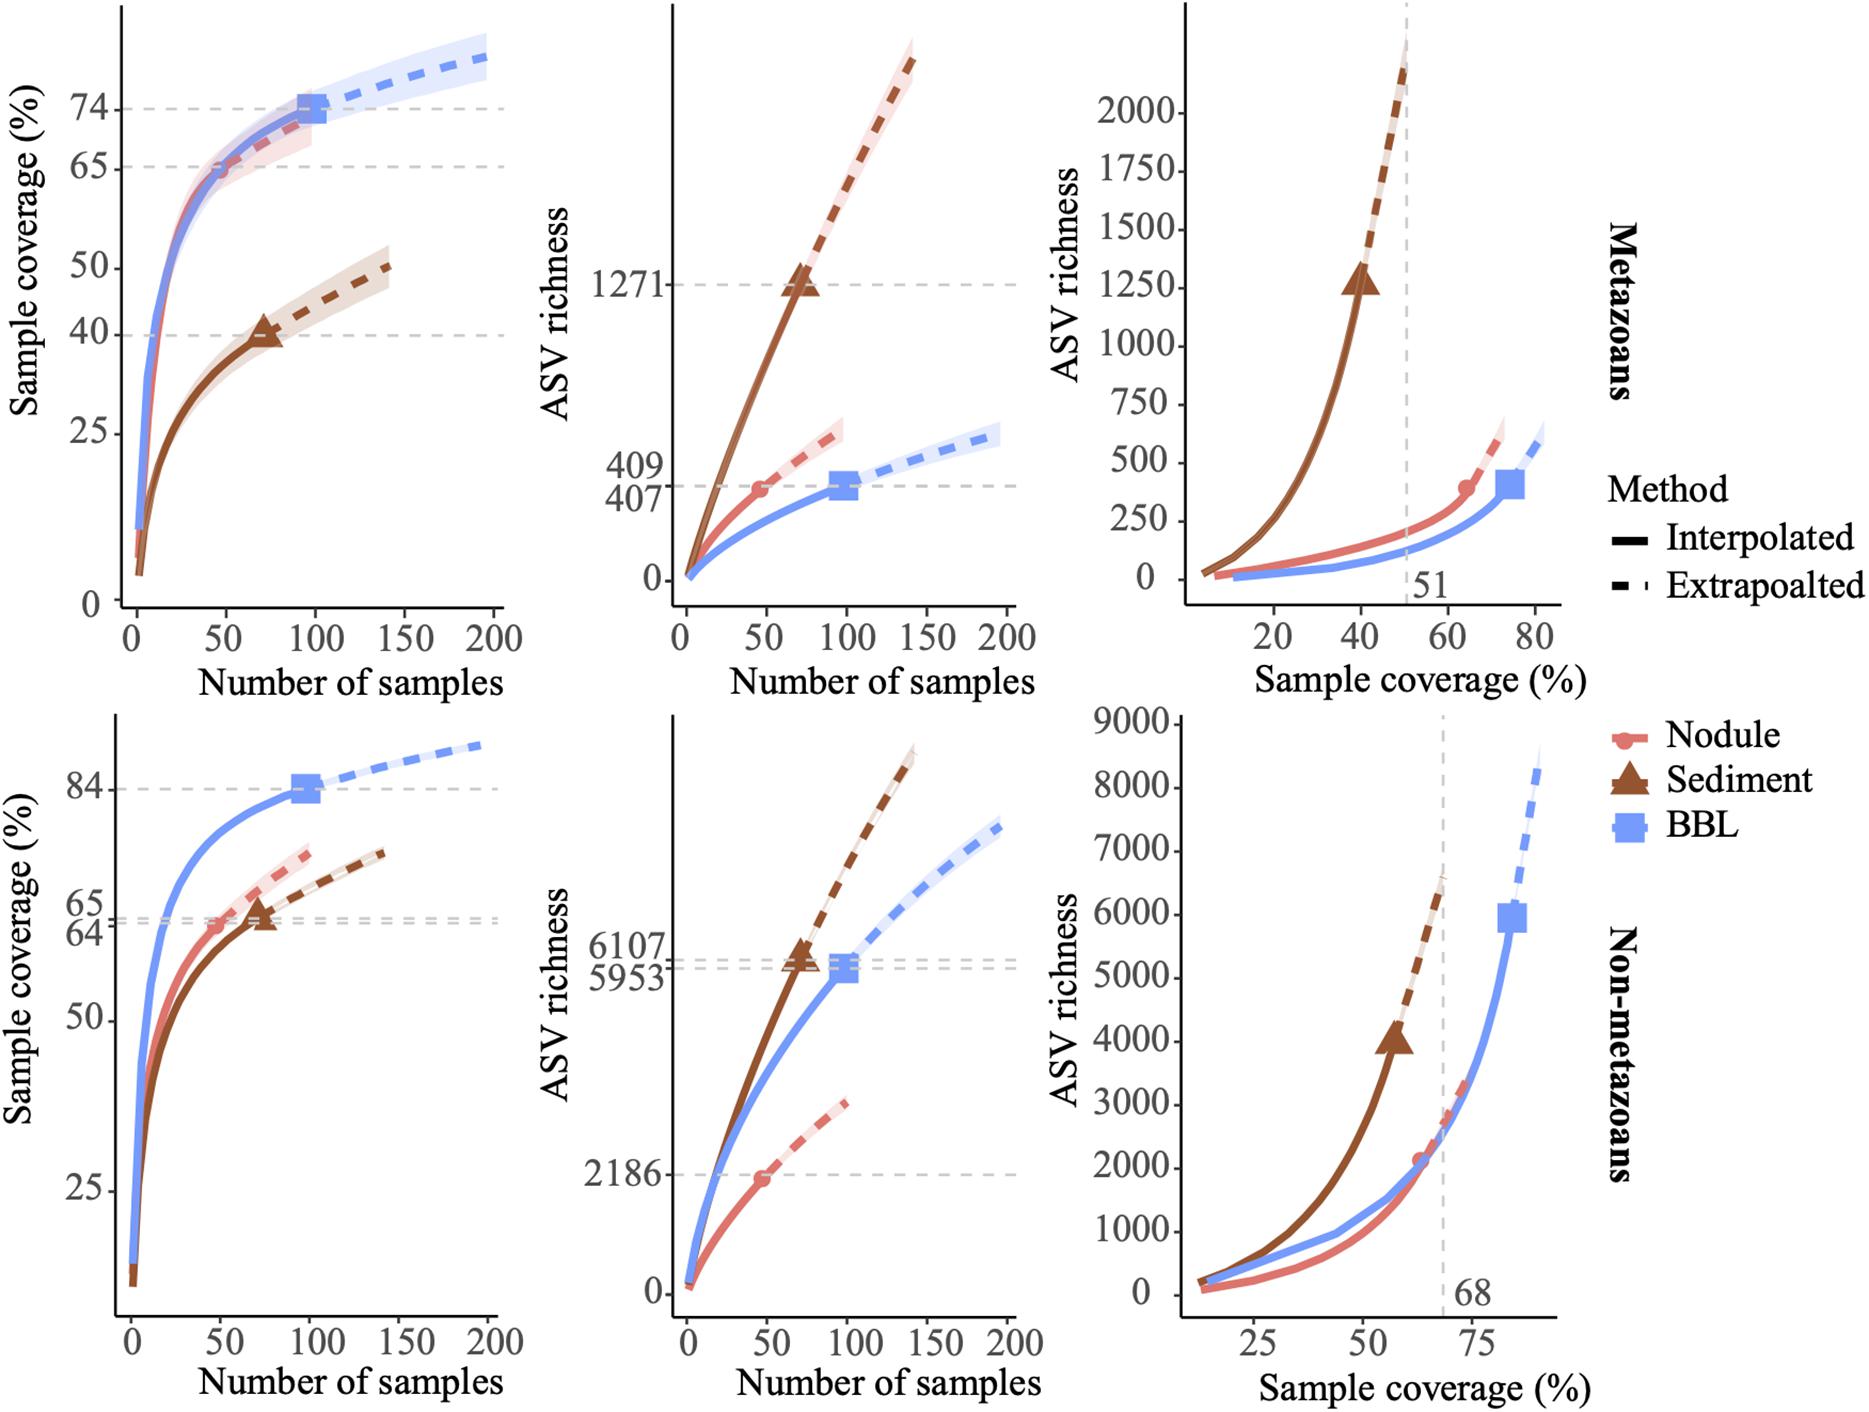
Figure 2. Amplicon sequence variant (ASV) sampling coverage and richness for each sample type (nodule, sediment, and seawater). ASV richness was estimated using Chao2 (Chao and Jost, 2012). Shaded, colored areas indicate the 95% confidence intervals obtained from a bootstrap method based on 200 replicates. Horizontal dotted gray lines (left and center) indicate maximum interpolation values for each sample type. Vertical dotted gray lines (right) indicate the value at base coverage, defined as the highest coverage value between minimum extrapolated values and maximum interpolated values.
Sampling coverage analyzed at the level of biological replicates indicated that for sediment samples, two replicates of 10 g each led to a mean sampling coverage of 15 and 39% for metazoans and non-metazoans of the 0–2 cm layer, respectively, and 8 and 36% for the 3–5 cm layer (Supplementary Figure S4). Further analysis of community composition in the 0–2 and 3–5 cm layers showed modest ASV overlap between the two (10 and 19% of shared ASVs for metazoans and non-metazoans, respectively), with a large fraction of ASVs found solely in the top layer (56 and 47% for metazoans and non-metazoans, respectively) (Supplementary Figure S5). For nodules, five biological replicates (1 g of material each) extracted from each nodule provided a mean sampling coverage of 58% for metazoans and 43% for non-metazoans (Supplementary Figure S3). With three biological replicates, sampling coverage in seawater samples averaged 53% for metazoans and 69% for non-metazoans across water-column depths (Supplementary Figure S4). Further analysis of community overlap between the BBL water column depths showed that 5 and 50 mab samples shared 23 and 30% of metazoan and protist ASVs, respectively, with the 5 mab layer possessing the greater portion of unshared ASVs (48 and 45% for metazoans and non-metazoans) (Supplementary Figure S5). Overall, 66 and 73% of total benthic diversity was captured in the upper sediment horizon and the 5 mab BBL seawater sample, respectively.
Mean metazoan ASV richness per sample remained largely uniform across depths in the water column, with slightly higher values in the DCM (12 ± 4) and BBL (5 and 50 mab; 14 ± 7) (Figure 3A). However, sampling coverage varied greatly across water column depths (from 49 to 73%), with lowest values for the 5 mab (49%) and 50 mab (57%) samples (Figure 3B). Significant differences in ASV richness (absence of overlap in confidence intervals) can be observed between 5 mab and the mesopelagic, deep mesopelagic and near surface depths (Figure 3C). At base coverage (64%), diversity was highest within the BBL samples (∼225 and ∼100 ASVs at 5 and 50 mab, respectively), and lowest within the mesopelagic (500 m) and deep mesopelagic (1,000 m) samples (∼55 ASVs; Figure 3C). A comparison of the sampling effort (volume of filtered water) required at each depth to reach equivalent sampling coverage is shown in Table 3 (at base coverage, 49%). The water column depths requiring highest sampling effort, or the largest volume of seawater filtered, are 5 and 50 mab, the bathypelagic and the DCM. Differences in beta-diversity between water column depths was found to be significant for all pairs except near surface vs. DCM, mesopelagic vs. 50 mab, and between the bathypelagic and 5 and 50 mab samples (Supplementary Table S4).
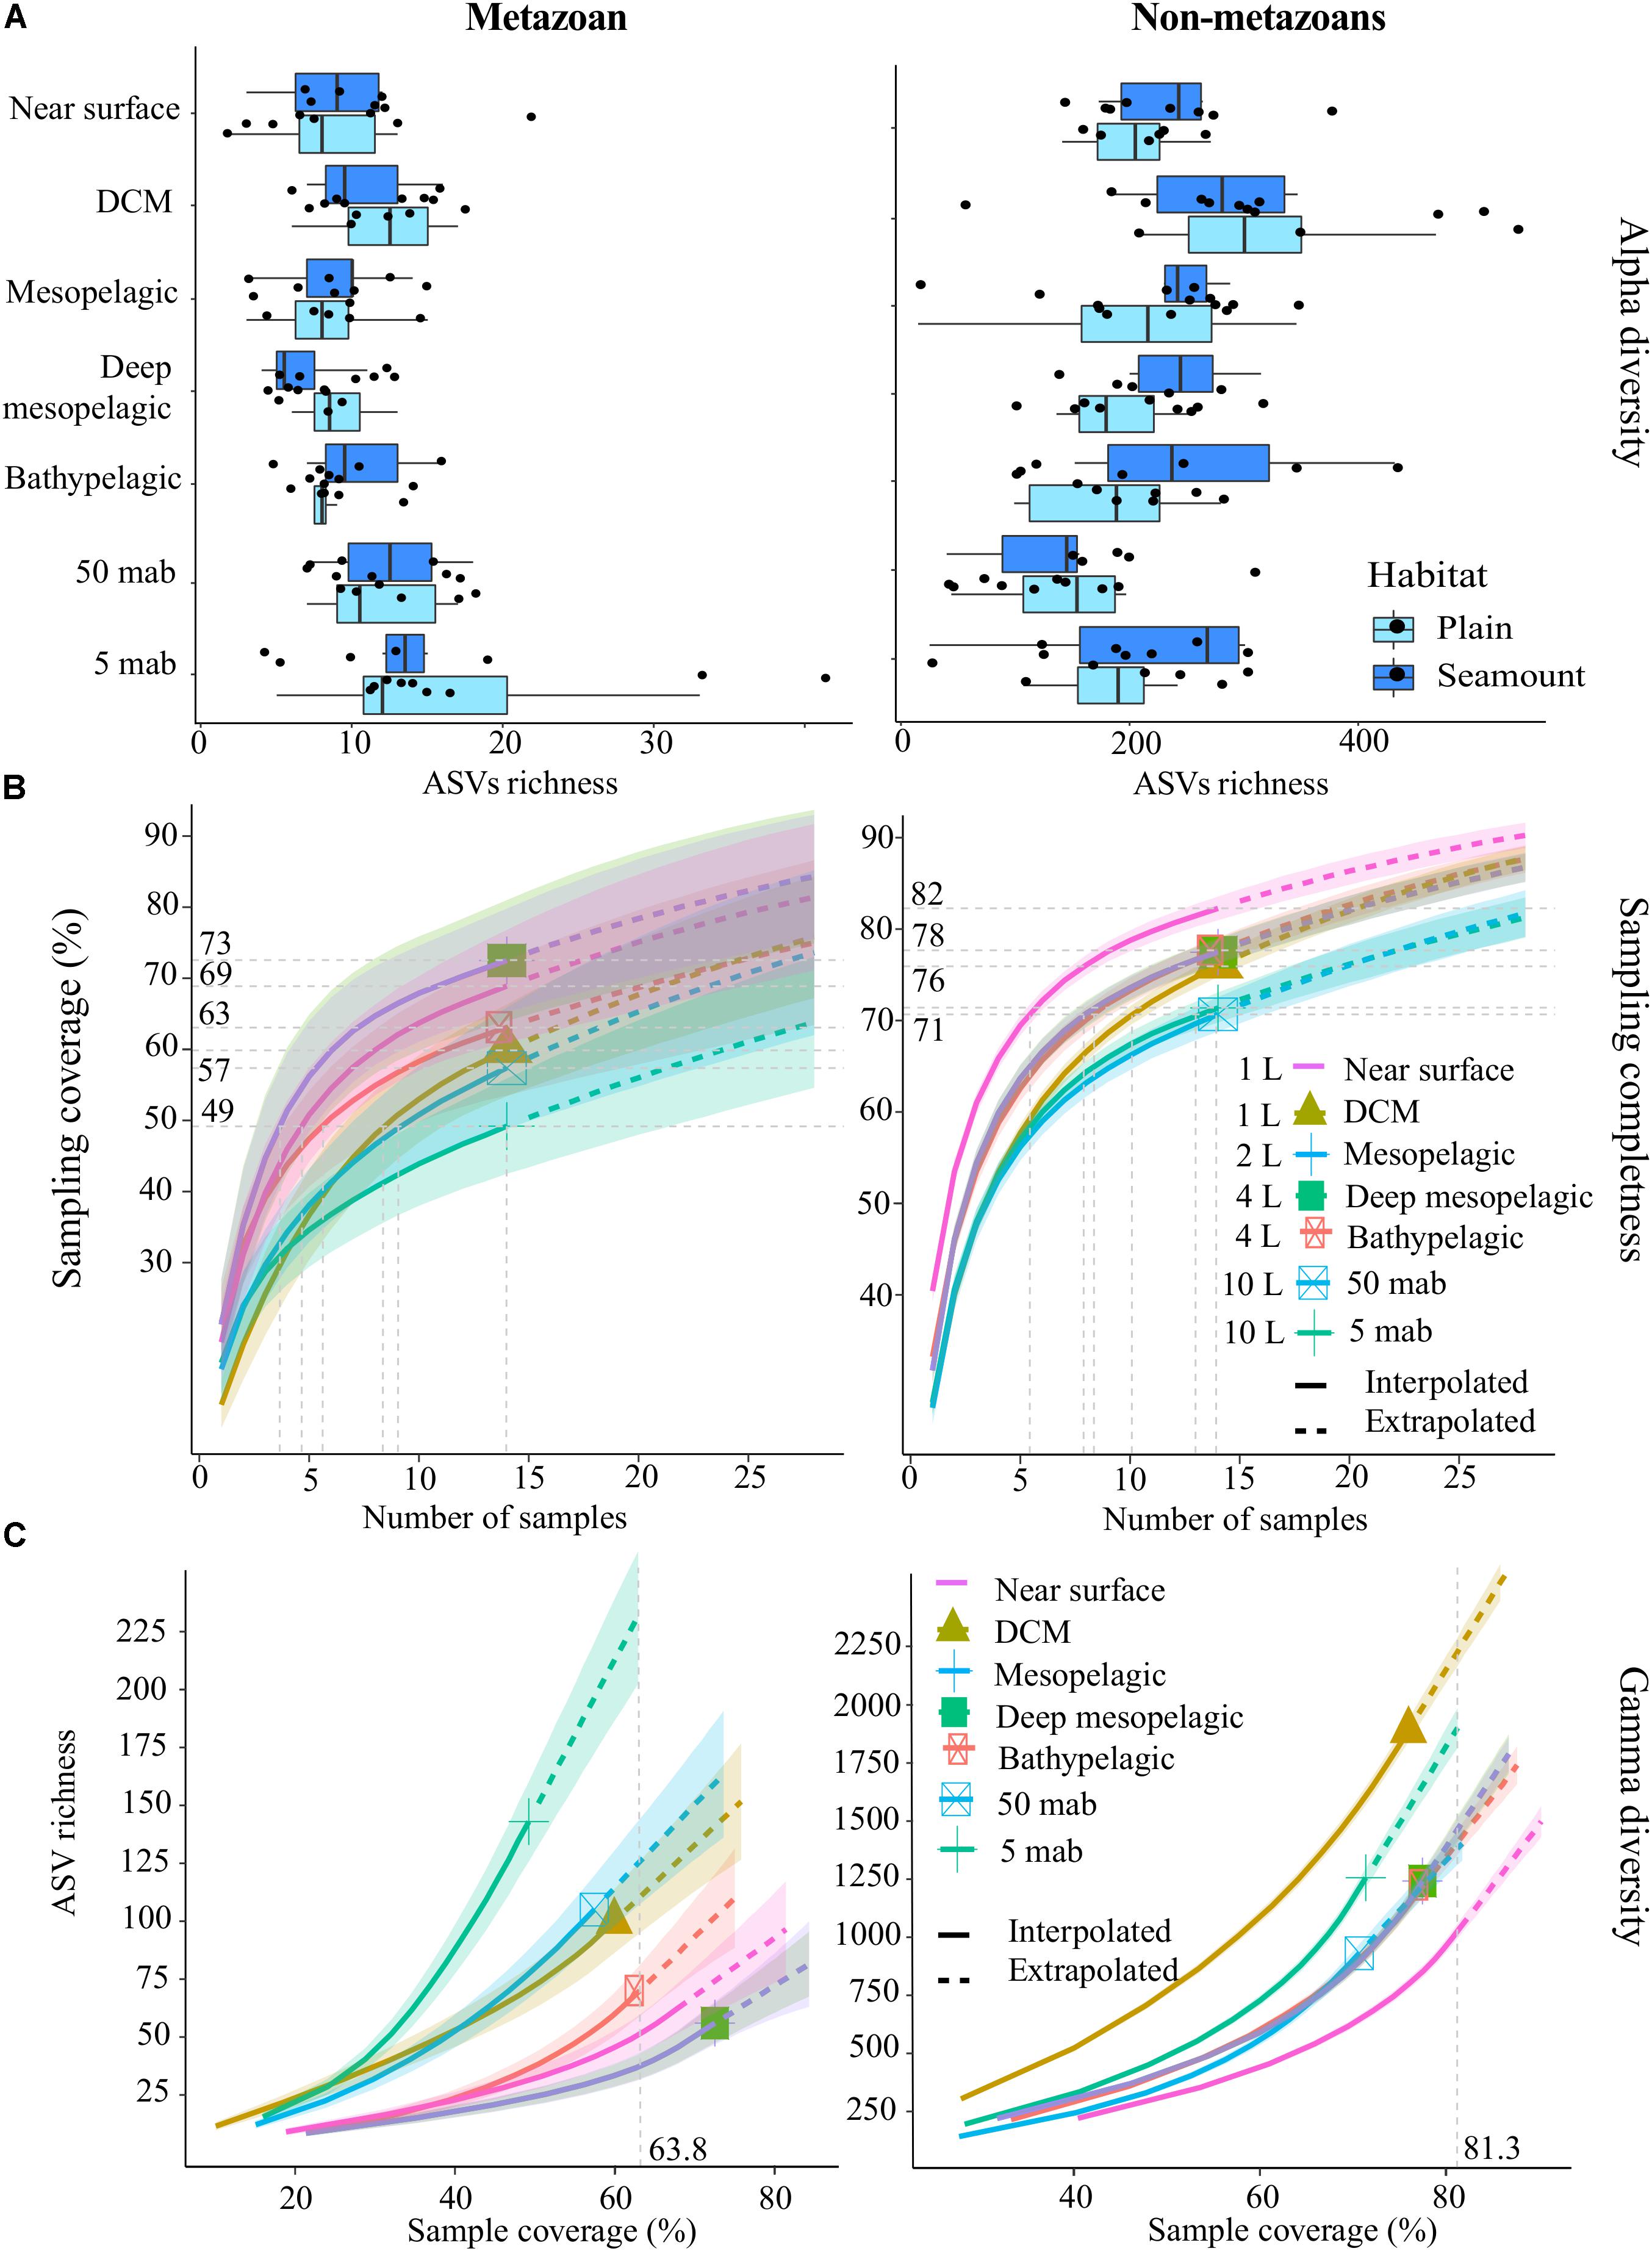
Figure 3. Alpha-diversity, sampling completeness and gamma-diversity across the water column for both metazoans and non-metazoans. (A) Box-plot of mean amplicon sequence variant (ASV) richness observed per sample, within each habitat type (abyssal plains, seamounts). (B) Sampling coverage achieved across the water column, with seawater volumes filtered at each depth as listed. Horizontal gray dotted lines indicate maximum interpolated sampling coverage values for each water column depth horizon. (C) Estimated ASV richness as a function of sampling coverage (Chao2 estimator), across the water column. The vertical dotted gray line represents sample completeness at base coverage, defined as the highest coverage value between minimum extrapolated values and maximum interpolated values. DCM, deep chlorophyll maximum; mab, meters above bottom. For (B,C), shaded colored areas indicate the 95% confidence intervals obtained by a bootstrap method based on 200 replicates.
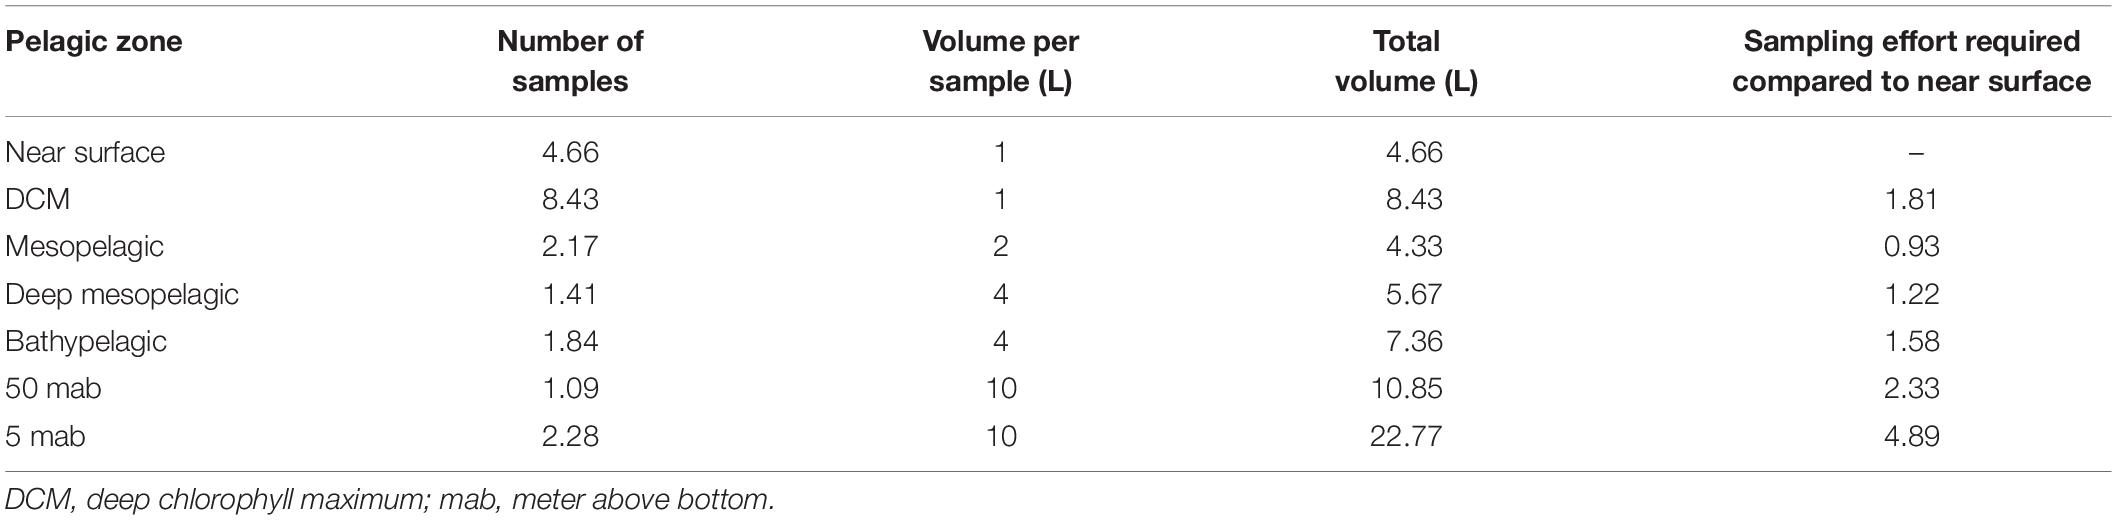
Table 3. Sampling effort required at each pelagic depth to reach the minimum sampling coverage achieved across depth (49%) for metazoans.
For non-metazoans in the water column, ASV richness per sample was highest within the DCM (304 ± 131) before gradually declining through the meso- and bathypelagic and then increasing again at 5 mab (Figure 3A). In contrast to metazoans, non-metazoan sampling coverage remained relatively high and uniform across depths (from 71 to 82%; Figure 3B), although significant differences can be observed between the near surface, BBL and the zones in between at the highest number of samples collected (14; Figure 3B). At base coverage, diversity was highest in the DCM (∼2,200 ASVs) and 5 mab (∼1,900 ASVs), and lowest at the near surface (∼1,050 ASVs; Figure 3C). Comparison of the sampling effort required per depth to reach equivalent sampling coverage (71%), is shown in Table 4, with 50 mab, 5 mab, the deep mesopelagic, and the DCM requiring the largest volumes of seawater filtered. Beta-diversity was found to be significantly different for all pairs of water column depths except 50 mab vs. 5 mab (Supplementary Table S4).
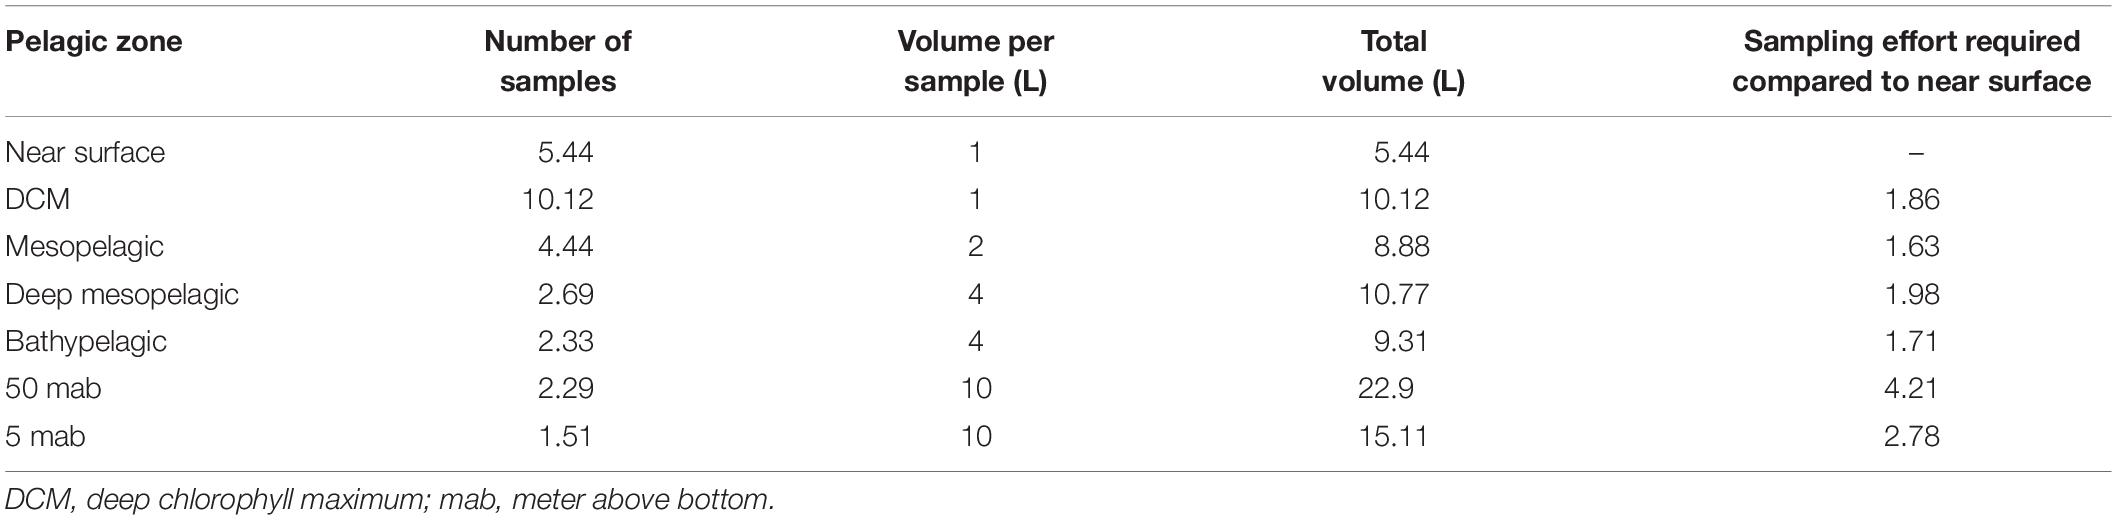
Table 4. Sampling effort required at each pelagic depth to reach the minimum sampling coverage achieved across depth (71%) for non-metazoans.
Pelagic eDNA in the Water Column
Metazoan eDNA within the epipelagic derived predominantly from arthropods (mean per sample of 70 ± 13% of reads), followed by chordates (15 ± 4%; essentially composed of appendicularians and thaliaceans) and cnidarians (11 ± 4%) (Figure 4A). Mesopelagic eDNA differed substantially from the epipelagic in that fewer arthropod reads (<17%) and a higher proportion of cnidarian reads (72%) were observed. The deep mesopelagic and bathypelagic zones contained a high proportion of cnidarian reads (>75%), which were mostly unassigned at the family level within the classes Hydrozoa (75%) and Scyphozoa (4%), but included reads assigned to families Agalmatidae (9%), Rhopalonematidae (4%), and Prayidae (2%).
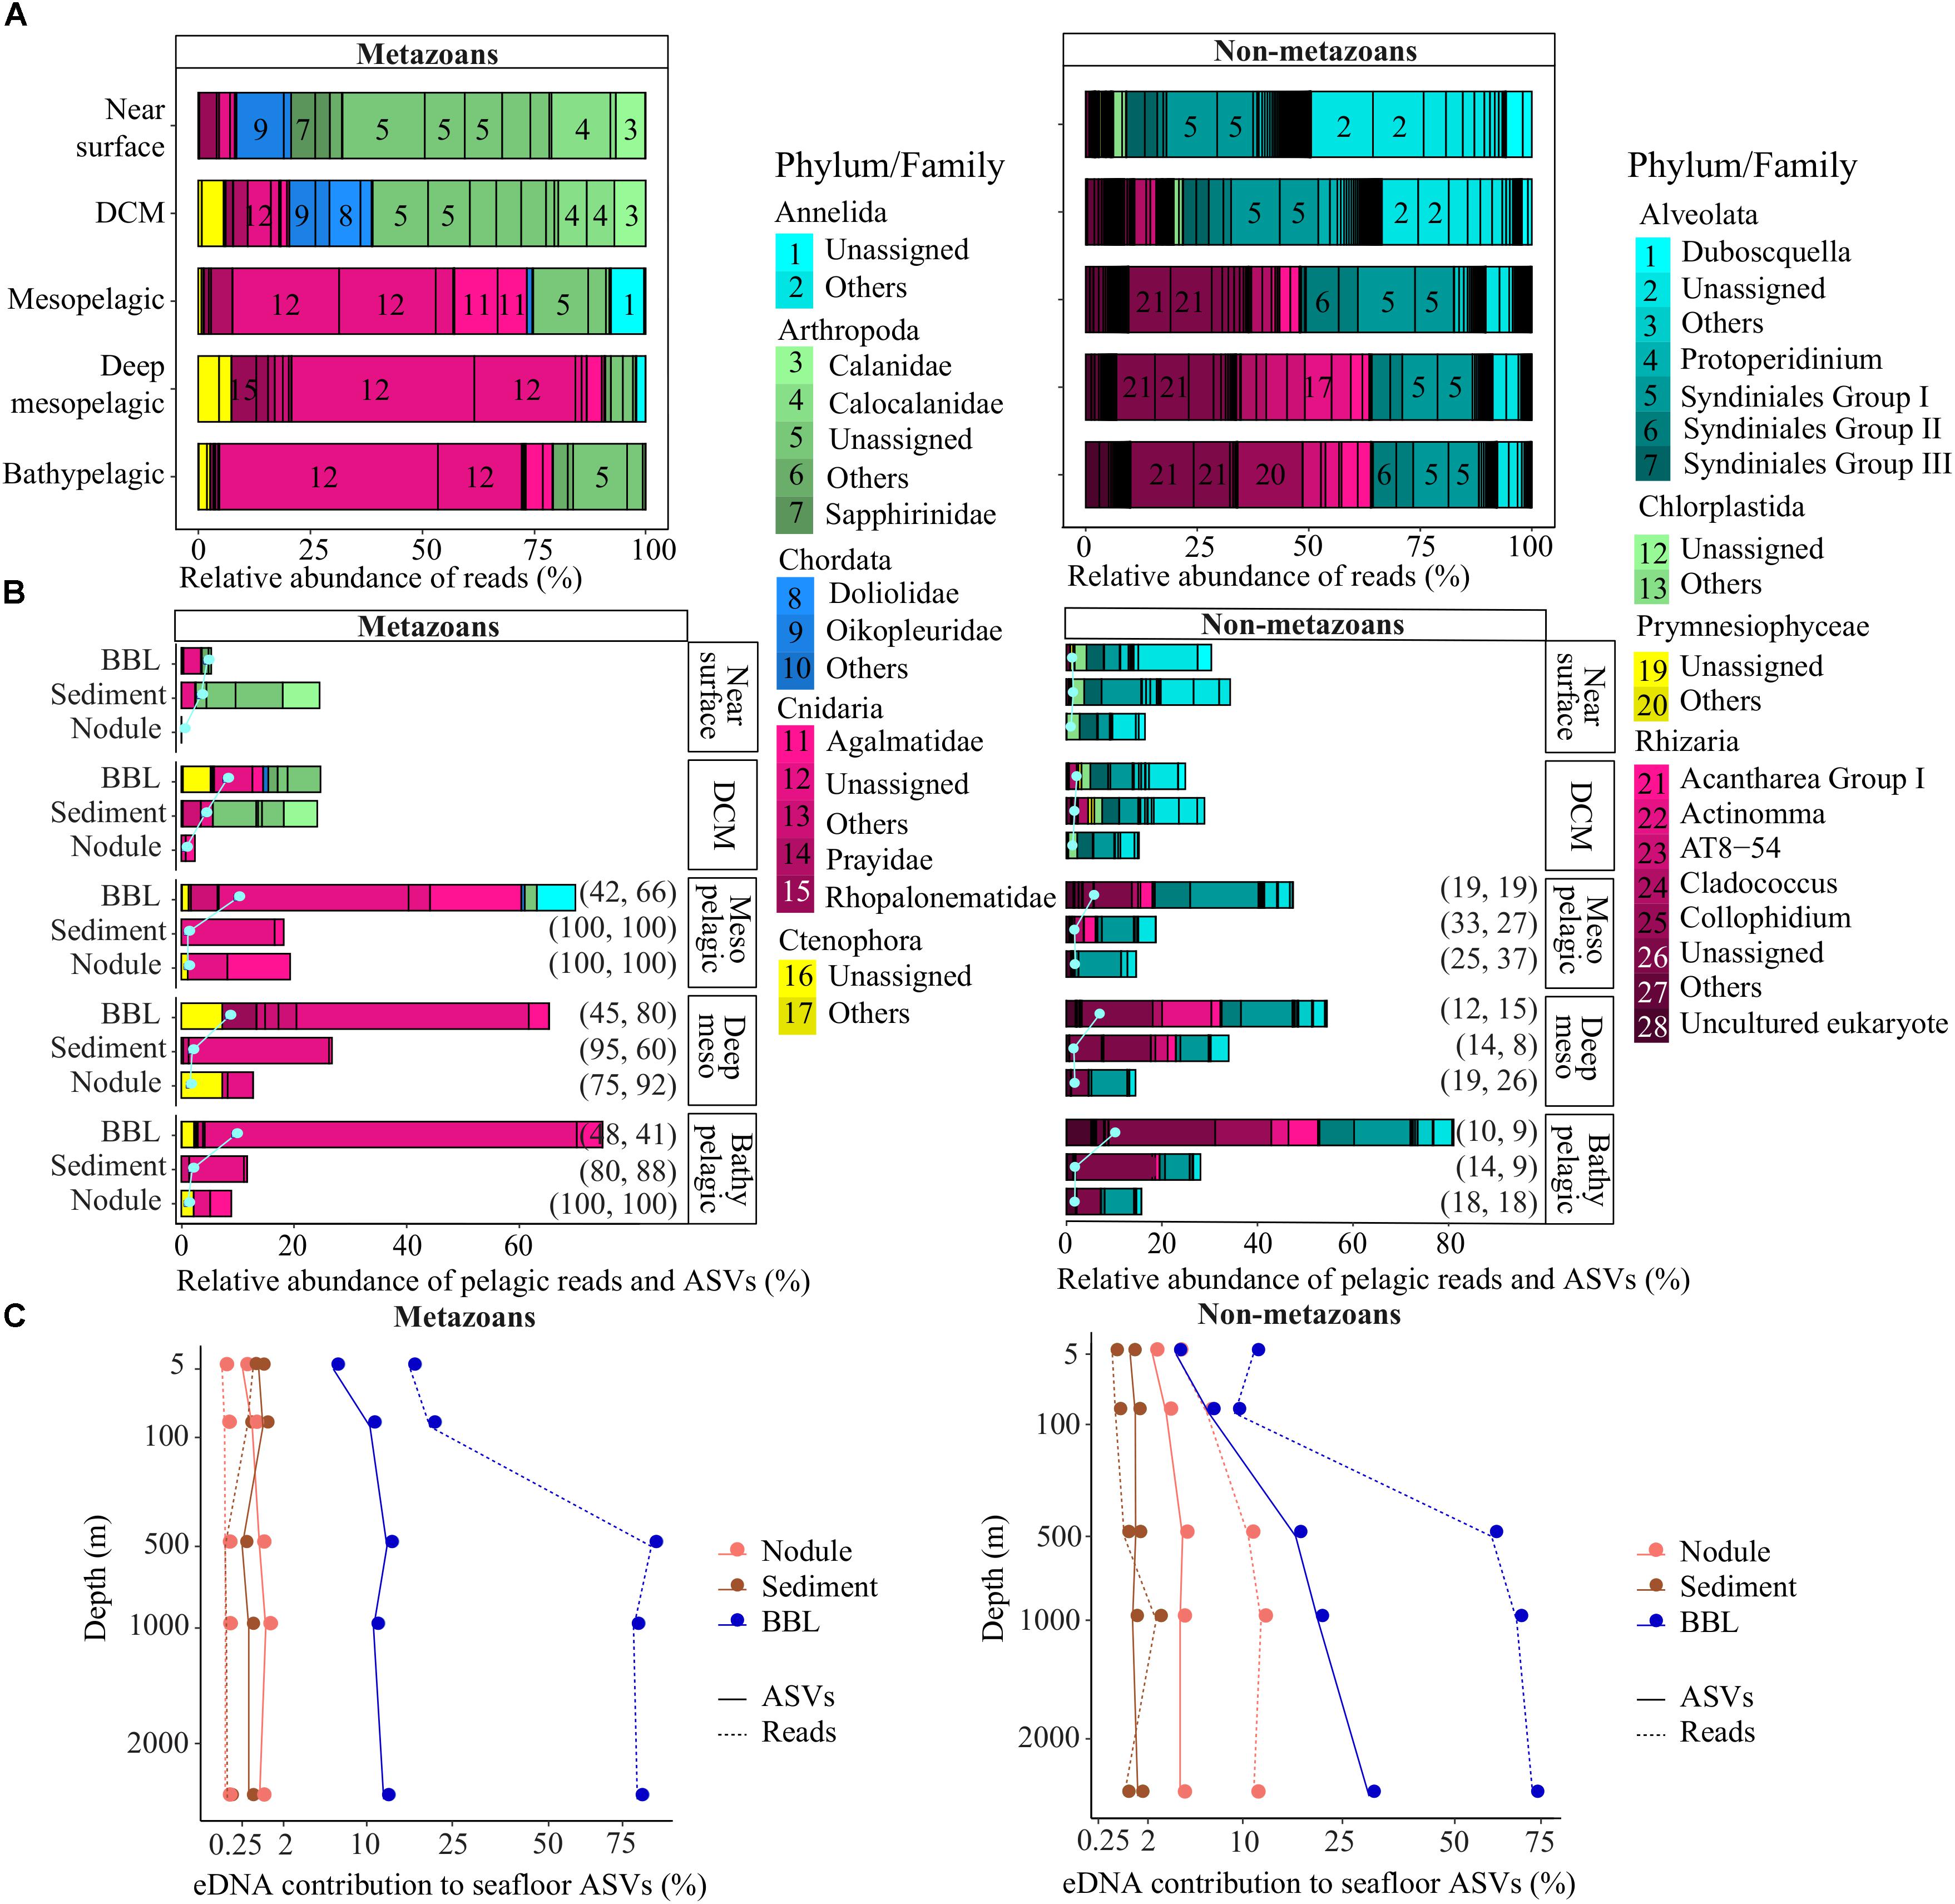
Figure 4. Pelagic eDNA community composition and contribution to diversity at the seafloor. (A) Relative read abundance (bars) of phyla and families per pelagic depth zone within each deep ocean habitat (abyssal plains, seamounts). (B) Relative abundance of pelagic reads (bars) and pelagic ASVs (pale gray dots and lines) that also were sampled in abyssal sediment, nodule or BBL seawater samples, plotted relative to the diversity sampled in the water column per pelagic depth zone (pelagic perspective). The percent of pelagic ASVs and associated reads concurrently found in the epipelagic are indicated on the right side of the bars, in parentheses. Families with marginal relative abundance were combined and designated as “Others”. (C) Proportion of sediment, nodule or BBL seawater ASVs and reads that were found within each pelagic zone sampled. Plot shows the benthic perspective, or pelagic diversity sampled at the seafloor relative to all diversity sampled at the seafloor. BBL, benthic boundary layer; DCM, deep chlorophyll maximum.
Non-metazoan taxonomic composition also varied substantially across the water column, with Alveolata dominating the epipelagic (84 ± 7%) and Rhizaria dominating the meso- and bathypelagic (58 ± 10%; Figure 4A). Alveolate reads were primarily from Protalveolata, specifically from one of the five Syndiniales groups (31% of all pelagic reads), as well as the dinoflagellates (22%). Within the Rhizarians, most sequences belonged to Order Spumellaria (16% of all pelagic reads), Order Collodaria (9%), Class Acantharia (4%), and the RAD B class of the Retaria subphylum (3%).
Pelagic eDNA at the Seafloor
Pelagic Perspective
A relatively small fraction of the metazoan diversity observed in the upper ocean (near surface, DCM) was sampled at the abyssal seafloor, ranging from 1.2 to 24% of reads from ASVs that were simultaneously observed in both the epipelagic and abyssal sediments, nodules or seawater (Figure 4B). In contrast, a large fraction of the metazoan diversity in the meso- and bathypelagic ocean was found within BBL seawater samples (up to 75% of reads, 10% of ASVs; Figure 4B). Interestingly, the great majority of metazoan pelagic ASVs (>75%) and reads (>60%) sampled below the DCM that were also found in sediment and nodules could have been sourced from the epipelagic, as these sequences were also present in the near surface and/or DCM samples.
Many of the patterns observed for metazoans were shared for non-metazoans, including the lower proportion of epipelagic diversity sampled at abyssal depths in comparison to meso- and bathypelagic non-metazoan diversity (Figure 4B). In the mesopelagic and below, the proportion of pelagic protist reads found within BBL seawater samples increased gradually and substantially, from 47 to 81% and 6 to 10% for reads and ASVs, respectively. In contrast to metazoans, the proportion of non-metazoan pelagic ASVs and reads sampled below the DCM that could have been sourced in the epipelagic (also found within near surface and/or DCM samples) was much lower (<33% and <37%, respectively; Figure 4B). Overall, pelagic protist reads were found in the smallest proportion within nodules (15 ± 1%), followed by sediments (29 ± 6%) and seawater samples (48 ± 22%).
For both metazoans and non-metazoans, the proportion of the main pelagic eDNA phyla found within the benthos closely reflected that of the overall phyla composition of each pelagic zone (Figures 4A,B), with no evidence of taxonomic filtering in terms of which pelagic taxa were sampled at the abyssal seafloor.
Benthic Perspective
Because nodules, and especially sediment samples, had higher metazoan ASV richness than seawater (Figure 2), the proportion of diversity that was pelagic in origin represents a small fraction of the total sampled diversity at the seafloor. For example, pelagic metazoan reads and ASVs corresponded, respectively, to 0.012 and 0.64% of the diversity sampled on nodules and 0.15 and 0.53% for sediments. However, pelagic eDNA made up a much larger fraction of the BBL eDNA diversity (56% reads, 13% ASVs) (Figure 4C). Within the BBL, most of the pelagic diversity derives from meso- and bathypelagic depths. For metazoans, the percentage of ASVs and associated reads per benthic sample that were also sampled in the pelagic, and inferred to be pelagic in origin, were not significantly different between seamount and abyssal-plain habitats, nor between upper and lower sediment horizons (Figure 5), when evaluated as combined pelagic samples of the relevant APEI and habitat (Supplementary Table S5).
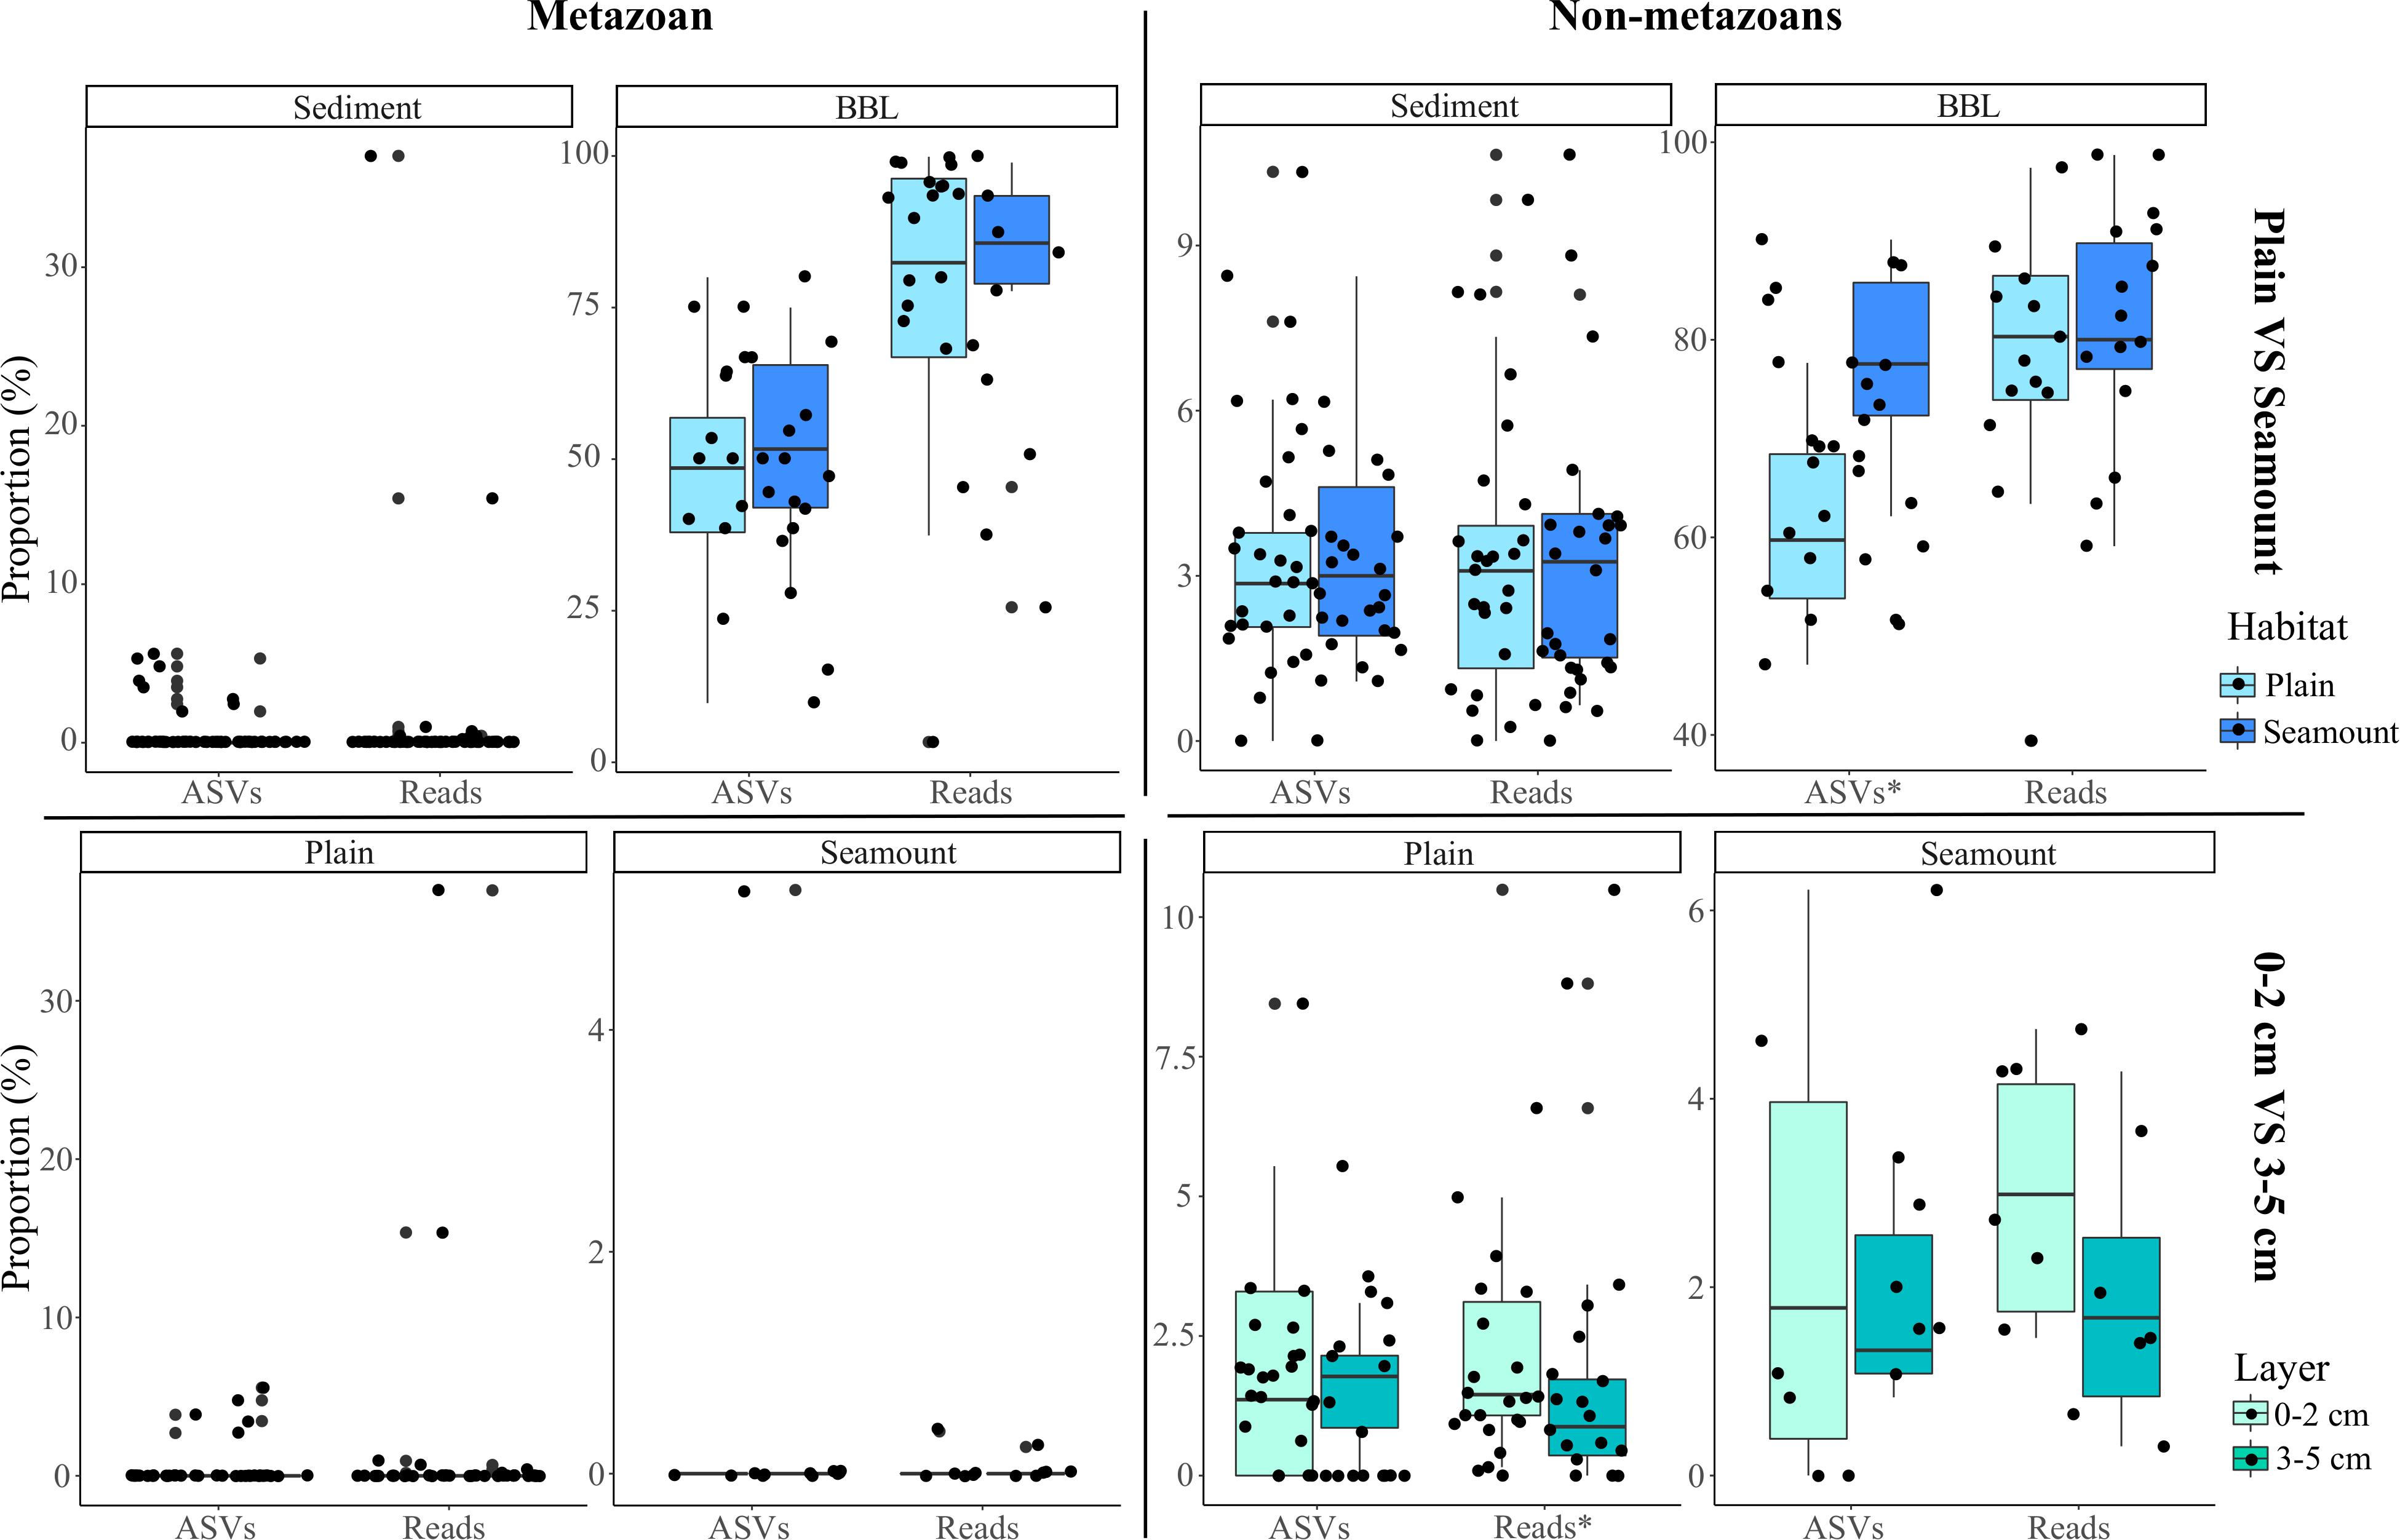
Figure 5. Box-plots of the mean proportion of amplicon sequence variants (ASVs) and their respective reads that derive from pelagic ecosystems (surface to bathypelagic depths) that were sampled at the seafloor across habitats (abyssal plain, seamount) and sediment layers (0–2 and 3–5 cm) for both metazoans and non-metazoans. Plot shows the benthic perspective, or pelagic diversity sampled at the seafloor relative to all diversity sampled at the seafloor. The stars (x-axis labels) indicate significant differences determined by two-sample Wilcoxon tests.
For non-metazoans, the overall contribution of pelagic eDNA to the benthos increased gradually with depth in the water column, especially for the BBL samples (Figure 4C). The proportions of pelagic eDNA sampled on nodules (9 and 4% for reads and ASVs, respectively) were over an order of magnitude higher than for metazoans. In contrast to metazoans, the percentage of non-metazoan ASVs per benthic sample that were pelagic in origin was significantly higher in seamount than in abyssal plain samples (t-tests; p < 0.001) (Figure 5 and Supplementary Table S5). Significantly higher proportions of pelagic reads also could be observed within the 0–2 cm versus 3–5 cm sediment layer for the abyssal plain samples (Supplementary Table S5 and Figure 5).
Discussion
Biodiversity assessments in the deep ocean are essential prior to large-scale anthropogenic impacts, such as polymetallic nodule mining proposed for the Clarion Clipperton Zone (Smith et al., 2008a; Wedding et al., 2013, 2015). eDNA metabarcoding methods are increasingly being applied as a biomonitoring tool for ecosystem health in marine systems (e.g., Danovaro et al., 2016; Goodwin et al., 2017; Stat et al., 2017), but have seen limited application in the deep sea (e.g., Dell’Anno et al., 2015; Guardiola et al., 2015, 2016; Sinniger et al., 2016). Here, we examine the effect of allochthonous pelagic DNA on eDNA surveys in abyssal habitats, and address several methodological issues that affect the optimal design of deep ocean eDNA biotic surveys.
Our results show that detrital pelagic eDNA represents a very small fraction of the diversity sampled in sediments and nodules at the abyssal seafloor (<2% of ASVs and their associated reads), and is unlikely to impede recovery of resident diversity in benthic eDNA surveys of the deep ocean. Pelagic eDNA sampled in the abyss appears to derive from two distinct processes: (1) True legacy eDNA that is sourced from the high biomass upper ocean (epipelagic) and sinks to the seafloor on detrital particles, including particulate organic matter (POM) and inorganic particles (e.g., foram and radiolarian tests or diatom frustules), and (2) eDNA sourced from resident populations in the bathy- and abyssopelagic ocean from organisms whose distributions range down to near the seafloor. This interpretation derives from the fact that most of the epipelagic eDNA found in the benthos was observed in sediment samples, while meso- and bathypelagic eDNA found in the benthos was overwhelmingly present within BBL seawater samples (Figures 4B,C). Most of the POM originating in the upper ocean is disaggregated and remineralized during its descent through the water column, such that POM flux declines exponentially with depth (Martin et al., 1987; Buesseler et al., 2007; Lutz et al., 2007; Grabowski et al., 2019), and less than 2% of primary production from the upper ocean typically reaches the abyssal seafloor (Smith et al., 2008b). This proportion is similar to that of the relative proportion of total epipelagic ASVs found in CCZ sediments (0.78 and 1.29% for metazoans and non-metazoans) and nodules (0.36 and 2.65% for metazoans and non-metazoans), suggesting that this material corresponds to true legacy eDNA and may be acting as a tracer of POC flux to the abyssal seafloor. In BBL seawater samples, the proportion of epipelagic ASVs found at the seafloor was slightly higher (8.2 and 5.8% for metazoans and non-metazoans), and BBL pelagic reads were strongly augmented by material originating in the meso- and bathypelagic (up to 86 and 72% for metazoan and non-metazoans, respectively; Figure 4C). Most of these deep-sourced sequences derived from hydrozoans, including siphonophore and trachymedusa families, such as Algamatidae, Rhopalonematidea, and Prayidae, as well as radiolarians (Rhizaria). High relative abundance of hydrozoans, especially siphonophores, in deep pelagic habitats is well documented (e.g., Youngbluth et al., 2008; Robison et al., 2010; Cartes et al., 2013), though there are also deep living benthic species (e.g., rhodaliids live tethered to benthic substrates; Pugh, 1983; O’Hara et al., 2016), and their presence near the seafloor of the CCZ has been reported by Dahlgren et al. (2016). Rhizaria also occur in high relative abundance in the meso- and bathypelagic (Jing et al., 2018), and have been documented to be associated with sinking POM collected at abyssal depths in the Pacific (Boeuf et al., 2019). It seems likely that a high proportion of pelagic eDNA reads concurrently found in the BBL seawater samples originate from species whose distributions extend across a broad depth range, including the bathy- and abyssopelagic, and are truncated at the seafloor. Non-metazoans and metazoans differed in the source of legacy eDNA to the seafloor, with detrital pelagic eDNA originating primarily from the epipelagic for metazoans, and across the entire water column for non-metazoans. For non-metazoans, both pelagic ASV and read proportions tended to increase with source depth in the water column (Figure 4C). Finally, the 18S rRNA gene is highly conserved and has relatively low taxonomic resolution (Papadopoulou et al., 2015; Creer et al., 2016; Tanabe et al., 2016), and it is possible that close pelagic and benthic relatives are not differentiated by this marker. Based on the above, we infer that most metazoan pelagic eDNA found within sediments and nodules originates from detrital material sourced primarily in the epipelagic (‘true’ legacy eDNA), while pelagic eDNA found within the BBL mostly derives from residents whose distributions extend upward into the bathy- and abyssopelagic ocean.
Sedimentation rates in the CCZ are relatively low, estimated to range from 0.15 to 1.15 cm kyr–1 (Müller and Mangini, 1980; Mewes et al., 2014; Volz et al., 2018), the mixed layer depth due to bioturbation is ∼2 cm (Smith and Rabouille, 2002), oxygen penetrates to >1 m into the sediments (Volz et al., 2018), and organic matter within the 0–5 cm layer may derive from sediment deposition over 4,000–33,000 years. Due to the low sedimentation rates and oxic conditions, most organic matter reaching the abyssal seafloor in the CCZ is remineralized within the upper few decimeters or meter of sediment (Müller and Mangini, 1980; Burdige, 2007; Volz et al., 2018). While eDNA in marine sediments can be preserved for several thousand years under certain conditions (Corinaldesi et al., 2011; Lejzerowicz et al., 2013), Dell’Anno and Danovaro (2005) found exponential declines in extracellular DNA (exDNA) in the top 5 cM of deep-sea sediments, and estimated a mean exDNA residence time of 9.5 years for the top centimeter. However, several studies suggest that most sediment eDNA degrades over time scales of hours to months due to DNase activity and hydrolysis (depurination), or is taken up by microbial organisms as a nutrient source (Nielsen et al., 2007; Corinaldesi et al., 2008; Ibáñez de Aldecoa et al., 2017). Recent deep-sea studies also suggest a marginal effect of exDNA on biodiversity assessments of contemporary eukaryotic communities (Guardiola et al., 2016; Ramírez et al., 2018; Brandt et al., 2020). In this study, using pelagic eDNA as a tracer to understand eDNA flux into and retention within the abyssal seafloor, we did not find evidence of increased pelagic eDNA degradation across a vertical profile within the sediment core for metazoans (Supplementary Table S4), since the majority of samples had no pelagic ASVs. However, we did find significant differences in sediment depth horizons for non-metazoans, with a higher proportion of pelagic reads in the 0–2 cm horizon in abyssal plains, and a trend toward a higher proportion of both pelagic ASVs and reads in the 0–2 cm layer across all abyssal habitats, as well as higher overall diversity within the 0–2 cm horizon (Figure 5 and Supplementary Figure S5). Note that a very small fraction of sediment eDNA was found to be pelagic in origin, and the overwhelming majority of eDNA sampled in the 0–5 cm layer derives from benthic organisms (historical and/or present assemblages).
Application of eDNA biotic surveys to monitor environmental impacts on the deep seafloor requires understanding the sampling effort needed to adequately capture the resident diversity of deep benthic assemblages. Our results for abyssal sediments, polymetallic nodules and BBL seawater demonstrate highest ASV richness in sediments for both metazoans and non-metazoans at equivalent sampling coverage, with a substantial drop to the richness estimated for polymetallic nodules and BBL seawater (at base coverage, Figure 2). Given prior studies demonstrating the importance of sample size to recovery of eukaryotic diversity (e.g., Nascimento et al., 2018), we targeted large sample volumes in comparison to many earlier eDNA studies, extracting DNA from 10 g of sediment, 10 L of BBL seawater, and 1 g of ground polymetallic nodule for each sample. For comparison, marine protist diversity on the continental shelf is typically sampled for eDNA using ∼ 2 g of sediment (or less) in each sample (Pawlowski et al., 2014; Chariton et al., 2015; Pochon et al., 2015; Laroche et al., 2018), and metazoan surveys are often based on 1–2 L of filtered seawater (e.g., Sigsgaard et al., 2017; Grey et al., 2018; Jeunen et al., 2019) or ∼10 g per sample of the top 3–5 cm layer (deep sea examples, Guardiola et al., 2015, 2016; Sinniger et al., 2016). Despite relatively high sampling effort, including 71 sediment samples from 36 cores, 193 seawater samples from 12 CTD casts, and 50 samples from 10 polymetallic nodules, we are still under-sampling the diversity of these abyssal assemblages, with estimated sampling coverage for metazoans ranging from 40 to 74% study-wide across sample types. Our sampling coverage tended to be lower for metazoans than non-metazoans at equivalent sample size (e.g., in sediments 40% vs. 64%), as expected since metazoans exhibit a higher degree of patchiness and because their detection relies in part on trace DNA recovery (Sinniger et al., 2016; Nascimento et al., 2018). For metazoans, diversity recovered from polymetallic nodules was approximately 6 times lower than in sediments at equivalent sampling coverage, and consequently, despite assessing only 5 g of material per nodule (∼6% of mean nodule weight) for a total of 10 nodules, sampling coverage was more complete study-wide and could be extrapolated to ∼75% of total community diversity. Nevertheless, the relatively low sampling coverage per nodule (∼50%) suggests that assessing additional material per nodule and increasing the number of sampled nodules is needed. Additional work would also yield insights into the nodule crevice-associated fauna (Thiel et al., 1993), and reveal how community composition on nodules varies as a function of nodule size (e.g., Laroche et al., 2020a). For seawater samples, metazoan ASV richness was higher at 5 mab within the BBL than any other depth sampled (at base coverage; Figure 2), with relatively low sampling coverage (49%, 57%, BBL samples) despite filtering 10 L per sample (2 L × 5 L). We therefore recommend increasing the number of replicates when sampling metazoan eDNA within the BBL, for example to >30 L (>3 L × 10 L replicates) to obtain sampling coverage at over 50% of the community (Table 3). With sampling coverage ranging from 64 to 84% for non-metazoans (all 3 substrate types), we infer that our sample sizes were adequate to capture most of the diversity of eukaryotic non-metazoans, although increased sampling effort (number of samples) across a broader range of abyssal microhabitats would improve understanding of community structure and the distribution of eDNA across these habitats. Sampling the abyssal seafloor is technically challenging and expensive relative to most marine environments, and as is commonly reported in other abyssal faunal studies (e.g., using conventional survey methods, De Smet et al., 2017; Pape et al., 2017; Washburn et al., unpublished), significant sampling effort is required to achieve high sampling completeness, in particular for the sparse but highly diverse sediment community. Additionally, the detection probability of taxa is influenced by the amount of template DNA used for PCR amplification and in studies with low amount of template material, such as ancient DNA studies, a minimum of 8 PCR replicates have been proposed to increase detection probability (Ficetola et al., 2015). While we reduced stochasticity and increased detection probability by using a minimum of 3 ng of DNA per PCR and by pooling 2 PCR replicates per sample, further research evaluating the effect of PCR replication on deep sea benthic surveys would be valuable.
Overall, our results provide some guidance on designing eDNA biotic surveys for the deep ocean, as well as insight into processes that affect the transport and distribution of eDNA across the water column and abyss. Future deep-sea eDNA surveys should aim to process large amounts of material per sample (>10 g sediment, >10 L seawater, with replication), consider habitat heterogeneity at a range of spatial scales in the abyss (Laroche et al., 2020a), and explore the temporal variability of eDNA in particular abyssal habitats and sites. Finally, research is needed to evaluate how the oceanographic setting, including current velocities and sediment-transport regime, influence eDNA delivery, retention, and persistence (e.g., degradation and winnowing) within abyssal benthic habitats.
Data Availability Statement
The datasets generated in this study can be found on the NCBI website https://www.ncbi.nlm.nih.gov/, under project number PRJNA546001, sample accession numbers SRR9199590 to SRR9199869.
Author Contributions
EG, OK, OL, and CS designed the study. EG, OK, and CS conducted field work and sampling at sea. OL generated the data and performed analyses. OL wrote the manuscript with intellectual contributions from all co-authors. EG and CS provided grant and equipment support. All authors contributed to the article and approved the submitted version.
Funding
Support for this project was provided by The Pew Charitable Trusts award UH30788 (to PIs EG and CS), Gordon and Betty Moore Foundation award 5596 (lead PIs CS and J. Drazen), NOAA Ocean Exploration grant NA17OAR0110209 (lead PIs J. Drazen and CS), and from the University of Hawai‘i for ROV technical support at sea. The views expressed are those of the author(s) and do not necessarily reflect the views of The Pew Charitable Trusts or other funding agencies. This is contribution 11119 from SOEST, University of Hawai‘i at Mānoa.
Conflict of Interest
The authors declare that the research was conducted in the absence of any commercial or financial relationships that could be construed as a potential conflict of interest.
Acknowledgments
We thank M. Church, E. Wear, other DeepCCZ scientists, and the captain and crew of R/V Kilo Moana for assistance at sea. We thank J. Saito from the Advanced Studies in Genomics, Proteomics, and Bioinformatics (ASGPB) core facility for laboratory support, and M. Gaither for early discussions on eDNA surveys in the deep ocean. This manuscript was released as a pre-print at bioRxiv, Laroche et al. (2020b).
Supplementary Material
The Supplementary Material for this article can be found online at: https://www.frontiersin.org/articles/10.3389/fmars.2020.00682/full#supplementary-material
References
Adl, S. M., Bass, D., Lane, C. E., Lukeš, J., Schoch, C. L., Smirnov, A., et al. (2019). Revisions to the classification, nomenclature, and diversity of eukaryotes. J. Eukaryot. Microbiol. 66, 4–119. doi: 10.1111/jeu.12691
Amon, D. J., Ziegler, A. F., Dahlgren, T. G., Glover, A. G., Goineau, A., Gooday, A. J., et al. (2016). Insights into the abundance and diversity of abyssal megafauna in a polymetallic-nodule region in the eastern Clarion-Clipperton Zone. Sci. Rep. 6:30492. doi: 10.1038/srep30492
Angel, M. V., and Baker, A. D. C. (1982). Vertical distribution of the standing crop of plankton and micronekton at three stations in the northeast Atlantic. Biol. Oceanogr. 2, 1–30.
Armbrecht, L. H., Coolen, M. J. L., Lejzerowicz, F., George, S. C., Negandhi, K., Suzuki, Y., et al. (2019). Ancient DNA from marine sediments: precautions and considerations for seafloor coring, sample handling and data generation. Earth Sci. Rev. 196:102887. doi: 10.1016/j.earscirev.2019.102887
Barnes, M. A., and Turner, C. R. (2016). The ecology of environmental DNA and implications for conservation genetics. Conserv. Genet. 17, 1–17. doi: 10.1007/s10592-015-0775-4
Barnes, M. A., Turner, C. R., Jerde, C. L., Renshaw, M. A., Chadderton, W. L., and Lodge, D. M. (2014). Environmental conditions influence eDNA persistence in aquatic systems. Environ. Sci. Technol. 48, 1819–1827. doi: 10.1021/es404734p
Boeuf, D., Edwards, B. R., Eppley, J. M., Hu, S. K., Poff, K. E., Romano, A. E., et al. (2019). Biological composition and microbial dynamics of sinking particulate organic matter at abyssal depths in the oligotrophic open ocean. Proc. Natl. Acad. Sci. U.S.A. 116, 11824–11832. doi: 10.1073/pnas.1903080116
Bolyen, E., Rideout, J. R., Dillon, M. R., Bokulich, N. A., Abnet, C. C., Al-Ghalith, G. A., et al. (2019). Reproducible, interactive, scalable and extensible microbiome data science using QIIME 2. Nat. Biotechnol. 37, 852–857. doi: 10.1038/s41587-019-0209-9
Boschen, R. E., Collins, P. C., Tunnicliffe, V., Carlsson, J., Gardner, J. P. A., Lowe, J., et al. (2016). A primer for use of genetic tools in selecting and testing the suitability of set-aside sites protected from deep-sea seafloor massive sulfide mining activities. Ocean Coast. Manage. 122, 37–48. doi: 10.1016/j.ocecoaman.2016.01.007
Boschen, R. E., Rowden, A. A., Clark, M. R., and Gardner, J. P. A. (2013). Mining of deep-sea seafloor massive sulfides: a review of the deposits, their benthic communities, impacts from mining, regulatory frameworks and management strategies. Ocean Coast. Manage. 84, 54–67. doi: 10.1016/j.ocecoaman.2013.07.005
Brandt, M. I., Trouche, B., Henry, N., Liautard-Haag, C., Maignien, L., de Vargas, C., et al. (2020). An assessment of environmental metabarcoding protocols aiming at favoring contemporary biodiversity in inventories of deep-sea communities. Front. Mar. Sci. 7:234. doi: 10.3389/fmars.2020.00234
Buesseler, K. O., Lamborg, C. H., Boyd, P. W., Lam, P. J., Trull, T. W., Bidigare, R. R., et al. (2007). Revisiting carbon flux through the ocean’s twilight zone. Science 316, 567–570. doi: 10.1126/science.1137959
Burdige, D. J. (2007). Preservation of organic matter in marine sediments: controls, mechanisms, and an imbalance in sediment organic carbon budgets? Chem. Rev. 107, 467–485. doi: 10.1021/cr050347q
Callahan, B. J., McMurdie, P. J., Rosen, M. J., Han, A. W., Johnson, A. J. A., and Holmes, S. P. (2016). DADA2: high-resolution sample inference from Illumina amplicon data. Nat. Methods 13, 581–583. doi: 10.1038/nmeth.3869
Cartes, J. E., Fanelli, E., López-Pérez, C., and Lebrato, M. (2013). Deep-sea macroplankton distribution (at 400 to 2300m) in the northwestern Mediterranean in relation to environmental factors. J. Mar. Syst. 113-114, 75–87. doi: 10.1016/j.jmarsys.2012.12.012
Chao, A., Gotelli, N. J., Hsieh, T. C., Sander, E. L., Ma, K. H., Colwell, R. K., et al. (2014). Rarefaction and extrapolation with Hill numbers: a framework for sampling and estimation in species diversity studies. Ecol. Monogr. 84, 45–67. doi: 10.1890/13-0133.1
Chao, A., and Jost, L. (2012). Coverage-based rarefaction and extrapolation: standardizing samples by completeness rather than size. Ecology 93, 2533–2547. doi: 10.1890/11-1952.1
Chariton, A. A., Stephenson, S., Morgan, M. J., Steven, A. D. L., Colloff, M. J., Court, L. N., et al. (2015). Metabarcoding of benthic eukaryote communities predicts the ecological condition of estuaries. Environ. Pollut. 203, 165–174. doi: 10.1016/j.envpol.2015.03.047
Clark, M. R., Rowden, A. A., Schlacher, T., Williams, A., Consalvey, M., Stocks, K. I., et al. (2010). The ecology of seamounts: structure, function, and human impacts. Annu. Rev. Mar. Sci. 2, 253–278. doi: 10.1146/annurev-marine-120308-081109
Collins, R. A., Wangensteen, O. S., O’Gorman, E. J., Mariani, S., Sims, D. W., and Genner, M. J. (2018). Persistence of environmental DNA in marine systems. Commun. Biol. 1:185. doi: 10.1038/s42003-018-0192-6
Corinaldesi, C., Barucca, M., Luna, G. M., and Dell’Anno, A. (2011). Preservation, origin and genetic imprint of extracellular DNA in permanently anoxic deep-sea sediments. Mol. Ecol. 20, 642–654. doi: 10.1111/j.1365-294X.2010.04958.x
Corinaldesi, C., Beolchini, F., Dell’Anno, A., and Bianche, V. B. (2008). Damage and degradation rates of extracellular DNA in marine sediments: implications for the preservation of gene sequences. Mol. Ecol. 17, 3939–3951. doi: 10.1111/j.1365-294X.2008.03880.x
Creer, S., Deiner, K., Frey, S., Porazinska, D., Taberlet, P., Thomas, W. K., et al. (2016). The ecologist’s field guide to sequence-based identification of biodiversity. Methods Ecol. Evol. 56, 68–74. doi: 10.1111/2041-210X.12574
Dahlgren, T., Wiklund, H., Rabone, M., Amon, D., Ikebe, C., Watling, L., et al. (2016). Abyssal fauna of the UK-1 polymetallic nodule exploration area, Clarion-Clipperton Zone, central Pacific Ocean: Cnidaria. Biodivers. Data J. 4:e9277. doi: 10.3897/BDJ.4.e9277
Danovaro, R., Carugati, L., Berzano, M., Cahill, A. E., Carvalho, S., Chenuil, A., et al. (2016). Implementing and innovating marine monitoring approaches for assessing marine environmental status. Front. Mar. Sci. 3:213. doi: 10.3389/fmars.2016.00213
De Smet, B., Pape, E., Riehl, T., Bonifácio, P., Colson, L., and Vanreusel, A. (2017). The community structure of deep-sea macrofauna associated with polymetallic nodules in the eastern part of the Clarion-Clipperton fracture zone. Front. Mar. Sci. 4:103. doi: 10.3389/fmars.2017.00103
Deiner, K., Bik, H. M., Mächler, E., Seymour, M., Lacoursière-Roussel, A., Altermatt, F., et al. (2017). Environmental DNA metabarcoding: transforming how we survey animal and plant communities. Mol. Ecol. 5872–5895. doi: 10.1111/mec.14350
Dell’Anno, A., Carugati, L., Corinaldesi, C., Riccioni, G., and Danovaro, R. (2015). Unveiling the biodiversity of deep-sea nematodes through metabarcoding: Are we ready to bypass the classical taxonomy? PLoS One 10:e0144928. doi: 10.1371/journal.pone.0144928
Dell’Anno, A., and Danovaro, R. (2005). Extracellular DNA plays a key role in deep-sea ecosystem functioning. Science 309, 2179–2179. doi: 10.1126/science.1117475
Djurhuus, A., Port, J., Closek, C. J., Yamahara, K. M., Romero-Maraccini, O., Walz, K. R., et al. (2017). Evaluation of filtration and DNA extraction methods for environmental DNA biodiversity assessments across multiple trophic levels. Front. Mar. Sci. 4:314. doi: 10.3389/fmars.2017.00314
Ficetola, G. F., Pansu, J., Bonin, A., Coissac, E., Giguet-Covex, C., De Barba, M., et al. (2015). Replication levels, false presences and the estimation of the presence/absence from eDNA metabarcoding data. Mol. Ecol. Resour. 15, 543–556. doi: 10.1111/1755-0998.12338
Fonseca, V. G., Carvalho, G. R., Sung, W., Johnson, H. F., Power, D. M., Neill, S. P., et al. (2010). Second-generation environmental sequencing unmasks marine metazoan biodiversity. Nat. Commun. 1:98. doi: 10.1038/ncomms1095
Genin, A., and Dower, J. F. (2007). “Seamount plankton dynamics,” in Seamounts: Ecology, Fisheries & Conservation, eds T. J. Pitcher, T. Morato, P. J. B. Hart, M. R. Clark, N. Haggan, and R. S. Santos (Oxford: Blackwell Publishing Ltd), 85–100. doi: 10.1002/9780470691953
Glover, A., Smith, C., Paterson, G., Wilson, G., Hawkins, L., and Sheader, M. (2002). Polychaete species diversity in the central Pacific abyss: local and regional patterns, and relationships with productivity. Mar. Ecol. Prog. Ser. 240, 157–170. doi: 10.3354/meps240157
Goodwin, K. D., Thompson, L. R., Duarte, B., Kahlke, T., Thompson, A. R., Marques, J. C., et al. (2017). DNA sequencing as a tool to monitor marine ecological status. Front. Mar. Sci. 4:107. doi: 10.3389/fmars.2017.00107
Grabowski, E., Letelier, R. M., Laws, E. A., and Karl, D. M. (2019). Coupling carbon and energy fluxes in the North Pacific Subtropical Gyre. Nat. Commun. 10:1895. doi: 10.1038/s41467-019-09772-z
Grey, E. K., Bernatchez, L., Cassey, P., Deiner, K., Deveney, M., Howland, K. L., et al. (2018). Effects of sampling effort on biodiversity patterns estimated from environmental DNA metabarcoding surveys. Sci. Rep. 8:8843. doi: 10.1038/s41598-018-27048-2
Guardiola, M., Uriz, M. J., Taberlet, P., Coissac, E., Wangensteen, O. S., and Turon, X. (2015). Deep-sea, deep-sequencing: metabarcoding extracellular DNA from sediments of marine canyons. PLoS One 10:e0139633. doi: 10.1371/journal.pone.0139633
Guardiola, M., Wangensteen, O. S., Taberlet, P., Coissac, E., Uriz, M. J., and Turon, X. (2016). Spatio-temporal monitoring of deep-sea communities using metabarcoding of sediment DNA and RNA. PeerJ 4:e2807. doi: 10.7717/peerj.2807
Günther, B., Knebelsberger, T., Neumann, H., Laakmann, S., and Martínez Arbizu, P. (2018). Metabarcoding of marine environmental DNA based on mitochondrial and nuclear genes. Sci. Rep. 8:14822. doi: 10.1038/s41598-018-32917-x
Hadziavdic, K., Lekang, K., Lanzen, A., Jonassen, I., Thompson, E. M., and Troedsson, C. (2014). Characterization of the 18s rRNA gene for designing universal eukaryote specific primers. PLoS One 9:e87624. doi: 10.1371/journal.pone.0087624
Halpern, B. S., Frazier, M., Potapenko, J., Casey, K. S., Koenig, K., Longo, C., et al. (2015). Spatial and temporal changes in cumulative human impacts on the world’s ocean. Nat. Commun. 6:7615. doi: 10.1038/ncomms8615
Hsieh, T. C., Ma, K. H., and Chao, A. (2019). iNEXT: an R package for rarefaction and extrapolation of species diversity (Hill numbers). Methods Ecol. Evol. 7, 1451–1456. doi: 10.1111/2041-210X.12613
Ibáñez de Aldecoa, A. L., Zafra, O., and González-Pastor, J. E. (2017). Mechanisms and regulation of extracellular DNA release and its biological roles in microbial communities. Front. Microbiol. 8:1390. doi: 10.3389/fmicb.2017.01390
ISA (2019). Deep CCZ Biodiversity Synthesis Workshop. Friday Harbor, WA: International Seabed Authority.
Jeunen, G. J., Knapp, M., Spencer, H. G., Lamare, M. D., Taylor, H. R., Stat, M., et al. (2019). Environmental DNA (eDNA) metabarcoding reveals strong discrimination among diverse marine habitats connected by water movement. Mol. Ecol. Resour. 19, 426–438. doi: 10.1111/1755-0998.12982
Jing, H., Zhang, Y., Li, Y., Zhu, W., and Liu, H. (2018). Spatial variability of Picoeukaryotic communities in the Mariana Trench. Sci. Rep. 8:15357. doi: 10.1038/s41598-018-33790-4
Kaiser, S., Smith, C. R., and Arbizu, P. M. (2017). Editorial: biodiversity of the Clarion Clipperton fracture zone. Mar. Biodivers. 47, 259–264. doi: 10.1007/s12526-017-0733-0
Kelly, R. P. (2016). Making environmental DNA count. Mol. Ecol. Resour. 16, 10–12. doi: 10.1111/1755-0998.12455
Kersten, O., Smith, C. R., and Vetter, E. W. (2017). Abyssal near-bottom dispersal stages of benthic invertebrates in the Clarion-Clipperton polymetallic nodule province. Deep Sea Res. Part I Oceanogr. Res. Pap. 127, 31–40. doi: 10.1016/j.dsr.2017.07.001
Kersten, O., Vetter, E. W., Jungbluth, M. J., Smith, C. R., and Goetze, E. (2019). Larval assemblages over the abyssal plain in the Pacific are highly diverse and spatially patchy. PeerJ 7:e7691. doi: 10.7717/peerj.7691
Laroche, O., Kersten, O., Smith, C. R., and Goetze, E. (2020a). Environmental DNA surveys detect distinct metazoan communities across abyssal plains and seamounts in the western Clarion Clipperton Zone. Mol. Ecol. doi: 10.1111/mec.15484[Epub
CrossRef Full Text ahead of print]. | PubMed Abstract | Google Scholar
Laroche, O., Kersten, O., Smith, C. R., and Goetze, E. (2020b). From sea surface to seafloor: a benthic allochthonous eDNA survey for the abyssal ocean. bioRxiv [Preprint]. doi: 10.1101/2020.05.07.082602
Laroche, O., Wood, S. A., Tremblay, L. A., Ellis, J. I., Lear, G., and Pochon, X. (2018). A cross-taxa study using environmental DNA/RNA metabarcoding to measure biological impacts of offshore oil and gas drilling and production operations. Mar. Pollut. Bull. 127, 97–107. doi: 10.1016/j.marpolbul.2017.11.042
Lavelle, J. W., and Mohn, C. (2010). Motion, commotion, and biophysical connections at deep ocean seamounts. Oceanography 23, 90–103. doi: 10.5670/oceanog.2010.64
Le, J. T., Levin, L. A., and Carson, R. T. (2017). Incorporating ecosystem services into environmental management of deep-seabed mining. Deep Sea Res. Part II Top. Stud. Oceanogr. 137, 486–503. doi: 10.1016/j.dsr2.2016.08.007
Leitner, A. B., Neuheimer, A. B., Donlon, E., Smith, C. R., and Drazen, J. C. (2017). Environmental and bathymetric influences on abyssal bait-attending communities of the Clarion Clipperton Zone. Deep Sea Res. Part I Oceanogr. Res. Pap. 125, 65–80. doi: 10.1016/j.dsr.2017.04.017
Lejzerowicz, F., Esling, P., Majewski, W., Szczuciński, W., Decelle, J., Obadia, C., et al. (2013). Ancient DNA complements microfossil record in deep-sea subsurface sediments. Biol. Lett. 9:20130283. doi: 10.1098/rsbl.2013.0283
Lozupone, C., and Knight, R. (2005). UniFrac: a new phylogenetic method for comparing microbial communities. Appl. Environ. Microbiol. 71, 8228–8235. doi: 10.1128/AEM.71.12.8228-8235.2005
Lutz, M. J., Caldeira, K., Dunbar, R. B., and Behrenfeld, M. J. (2007). Seasonal rhythms of net primary production and particulate organic carbon flux to depth describe the efficiency of biological pump in the global ocean. J. Geophys. Res. 112:C10011. doi: 10.1029/2006JC003706
Martin, J. H., Knauer, G. A., Karl, D. M., and Broenkow, W. W. (1987). VERTEX: carbon cycling in the northeast Pacific. Deep Sea Res. Part A Oceanogr. Res. Pap. 34, 267–285. doi: 10.1016/0198-0149(87)90086-0
Martinez Arbizu, P. (2020). pairwiseAdonis: Pairwise Multilevel Comparison Using Adonis. R package version 0.4. Available online at: https://github.com/pmartinezarbizu/pairwiseAdonis (accessed February, 2019).
Mewes, K., Mogollón, J. M. M., Picard, A., Rühlemann, C., Kuhn, T., Nöthen, K., et al. (2014). Impact of depositional and biogeochemical processes on small scale variations in nodule abundance in the Clarion-Clipperton fracture zone. Deep Sea Res. Part I Oceanogr. Res. Pap. 91, 125–141. doi: 10.1016/j.dsr.2014.06.001
Morard, R., Lejzerowicz, F., Darling, K. F., Lecroq-Bennet, B., Winther Pedersen, M., Orlando, L., et al. (2017). Planktonic foraminifera-derived environmental DNA extracted from abyssal sediments preserves patterns of plankton macroecology. Biogeosciences 14, 2741–2754. doi: 10.5194/bg-14-2741-2017
Müller, P. J., and Mangini, A. (1980). Organic carbon decomposition rates in sediments of the pacific manganese nodule belt dated by 230Th and 231Pa. Earth Planet. Sci. Lett. 51, 94–114. doi: 10.1016/0012-821X(80)90259-9
Nascimento, F. J. A., Lallias, D., Bik, H. M., and Creer, S. (2018). Sample size effects on the assessment of eukaryotic diversity and community structure in aquatic sediments using high-throughput sequencing. Sci. Rep. 8:11737. doi: 10.1038/s41598-018-30179-1
Nielsen, K. M., Johnsen, P. J., Bensasson, D., and Daffonchio, D. (2007). Release and persistence of extracellular DNA in the environment. Environ. Biosaf. Res. 6, 37–53. doi: 10.1051/ebr:2007031
O’Hara, T. D., Hugall, A. F., MacIntosh, H., Naughton, K. M., Williams, A., and Moussalli, A. (2016). Dendrogramma is a siphonophore. Curr. Biol. 26, R457–R458. doi: 10.1016/j.cub.2016.04.051
Oksanen, J., Blanchet, F. G., Friendly, M., Kindt, R., Legendre, P., McGlinn, D., et al. (2018). vegan: Community Ecology Package. Available online at: https://cran.r-project.org/package=vegan (accessed February, 2019).
Oliveros, J. C. C. (2015). Venny. An Interactive Tool for Comparing Lists with Venn’s Diagrams. Available online at: http://bioinfogp.cnb.csic.es/tools/venny/index.html (accessed February, 2019).
Paerl, R. W., Foster, R. A., Jenkins, B. D., Montoya, J. P., and Zehr, J. P. (2008). Phylogenetic diversity of cyanobacterial narB genes from various marine habitats. Environ. Microbiol. 10, 3377–3387. doi: 10.1111/j.1462-2920.2008.01741.x
Papadopoulou, A., Taberlet, P., and Zinger, L. (2015). Metagenome skimming for phylogenetic community ecology: a new era in biodiversity research. Mol. Ecol. 24, 3515–3517. doi: 10.1111/mec.13263
Pape, E., Bezerra, T. N., Hauquier, F., and Vanreusel, A. (2017). Limited spatial and temporal variability in meiofauna and nematode communities at distant but environmentally similar sites in an area of interest for deep-sea mining. Front. Mar. Sci. 4:205. doi: 10.3389/fmars.2017.00205
Pawlowski, J., Christen, R., Lecroq, B., Bachar, D., Shahbazkia, H. R., Amaral-Zettler, L., et al. (2011). Eukaryotic richness in the abyss: insights from pyrotag sequencing. PLoS One 6:18169. doi: 10.1371/journal.pone.0018169
Pawlowski, J., Esling, P., Lejzerowicz, F., Cedhagen, T., and Wilding, T. A. (2014). Environmental monitoring through protist NGS metabarcoding: assessing the impact of fish farming on benthic foraminifera communities. Mol. Ecol. Resour. 14, 1129–1140. doi: 10.1111/1755-0998.12261
Pedregosa, F., Varoquaux, G., Gramfort, A., Michel, V., Thirion, B., Grisel, O., et al. (2012). Scikit-learn: machine learning in python. Pattern Recognit. 45, 2041–2049. doi: 10.1016/j.patcog.2011.04.006
Pochon, X., Wood, S. A., Keeley, N. B., Lejzerowicz, F., Esling, P., Drew, J., et al. (2015). Accurate assessment of the impact of salmon farming on benthic sediment enrichment using foraminiferal metabarcoding. Mar. Pollut. Bull. 100, 370–382. doi: 10.1016/j.marpolbul.2015.08.022
Pugh, P. R. (1983). Benthic siphonophores: a review of the family Rhodaliidae (Siphonophora, Physonectae). Philos. Trans. R. Soc. B Biol. Sci. 301, 165–300. doi: 10.1098/rstb.1983.0025
Quast, C., Pruesse, E., Yilmaz, P., Gerken, J., Schweer, T., Yarza, P., et al. (2013). The SILVA ribosomal RNA gene database project: improved data processing and web-based tools. Nucleic Acids Res. 41, 590–596. doi: 10.1093/nar/gks1219
Ramirez-Llodra, E., Brandt, A., Danovaro, R., De Mol, B., Escobar, E., German, C. R., et al. (2010). Deep, diverse and definitely different: unique attributes of the world’s largest ecosystem. Biogeosciences 7, 2851–2899. doi: 10.5194/bg-7-2851-2010
Ramírez, G. A., Jørgensen, S. L., Zhao, R., and D’Hondt, S. (2018). Minimal influence of extracellular DNA on molecular surveys of marine sedimentary communities. Front. Microbiol. 9, 1–12. doi: 10.3389/fmicb.2018.02969
Renshaw, M. A., Olds, B. P., Jerde, C. L., McVeigh, M. M., and Lodge, D. M. (2015). The room temperature preservation of filtered environmental DNA samples and assimilation into a phenol-chloroform-isoamyl alcohol DNA extraction. Mol. Ecol. Resour. 15, 168–176. doi: 10.1111/1755-0998.12281
Robison, B. H., Sherlock, R. E., and Reisenbichler, K. R. (2010). The bathypelagic community of Monterey Canyon. Deep Sea Res. Part II Top. Stud. Oceanogr. 57, 1551–1556. doi: 10.1016/j.dsr2.2010.02.021
Rowden, A. A., Dower, J. F., Schlacher, T. A., Consalvey, M., and Clark, M. R. (2010). Paradigms in seamount ecology: fact, fiction and future. Mar. Ecol. 31(Suppl. 1), 226–241. doi: 10.1111/j.1439-0485.2010.00400.x
Samadi, S., Schlacher, T., and de Forges, B. R. (2007). “Seamount Benthos,” in Seamounts: Ecology, Fisheries & Conservation, ed. T. Pritcher (Oxford: Blackwell Publishing Ltd), 117–140. doi: 10.1002/9780470691953.ch7
Seymour, M. (2019). Rapid progression and future of environmental DNA research. Commun. Biol. 2:80. doi: 10.1038/s42003-019-0330-9
Seymour, M., Durance, I., Cosby, B. J., Ransom-Jones, E., Deiner, K., Ormerod, S. J., et al. (2018). Acidity promotes degradation of multi-species environmental DNA in lotic mesocosms. Commun. Biol. 1:4. doi: 10.1038/s42003-017-0005-3
Shulse, C. N., Maillot, B., Smith, C. R., and Church, M. J. (2017). Polymetallic nodules, sediments, and deep waters in the equatorial North Pacific exhibit highly diverse and distinct bacterial, archaeal, and microeukaryotic communities. Microbiologyopen 6:e00428. doi: 10.1002/mbo3.428
Sigsgaard, E. E., Nielsen, I. B., Carl, H., Krag, M. A., Knudsen, S. W., Xing, Y., et al. (2017). Seawater environmental DNA reflects seasonality of a coastal fish community. Mar. Biol. 164:128. doi: 10.1007/s00227-017-3147-4
Simon-Lledó, E., Bett, B. J., Huvenne, V. A. I., Schoening, T., Benoist, N. M. A., and Jones, D. O. B. (2019). Ecology of a polymetallic nodule occurrence gradient: implications for deep-sea mining. Limnol. Oceanogr. 64, 1883–1894. doi: 10.1002/lno.11157
Sinniger, F., Pawlowski, J., Harii, S., Gooday, A. J., Yamamoto, H., Chevaldonné, P., et al. (2016). Worldwide analysis of sedimentary DNA reveals major gaps in taxonomic knowledge of deep-sea Benthos. Front. Mar. Sci. 3:92. doi: 10.3389/fmars.2016.00092
Smith, C. R., Clark, M., Amon, D., Bonifáco, P., Bribiesca-Contreras, G., Christodoulou, M., et al. (2019). Deep CCZ Biodiversity Synthesis Workshop Report. Friday Harbor, WA: International Seabed Authority (ISA).
Smith, C. R., Paterson, G., Lambshead, J., Glover, A., Rogers, A., Gooday, A., et al. (2008a). Biodiversity, Species Ranges, and Gene Flow in the Abyssal Pacific Nodule Province: Predicting and Managing the Impacts of Deep Seabed Mining. ISA Technical Study No. 3. Friday Harbor, WA: International Seabed Authority (ISA).
Smith, C. R., De Leo, F. C., Bernadion, A. F., Sweetman, A. K., and Arbizu, P. M. (2008b). Abyssal food limitation, ecosystem structure and climate change. Trends Ecol. Evol. 23, 518–528. doi: 10.1016/j.tree.2008.05.002
Smith, C. R., and Rabouille, C. (2002). What controls the mixed-layer depth in deep-sea sediments? The importance of POC flux. Limnol. Oceanogr. 47, 418–426. doi: 10.4319/lo.2002.47.2.0418
Stat, M., Huggett, M. J., Bernasconi, R., DiBattista, J. D., Berry, T. E., Newman, S. J., et al. (2017). Ecosystem biomonitoring with eDNA: metabarcoding across the tree of life in a tropical marine environment. Sci. Rep. 7:12240. doi: 10.1038/s41598-017-12501-5
Strickler, K. M., Fremier, A. K., and Goldberg, C. S. (2015). Quantifying effects of UV-B, temperature, and pH on eDNA degradation in aquatic microcosms. Biol. Conserv. 183, 85–92. doi: 10.1016/j.biocon.2014.11.038
Sweetman, A. K., Thurber, A. R., Smith, C. R., Levin, L. A., Mora, C., Wei, C.-L., et al. (2017). Major impacts of climate change on deep-sea benthic ecosystems. Elementa 5:4. doi: 10.1525/elementa.203
Tanabe, A. S., Nagai, S., Hida, K., Yasuike, M., Fujiwara, A., Nakamura, Y., et al. (2016). Comparative study of the validity of three regions of the 18S-rRNA gene for massively parallel sequencing-based monitoring of the planktonic eukaryote community. Mol. Ecol. Resour. 16, 402–414. doi: 10.1111/1755-0998.12459
Thiel, H., Schriever, G., Bussau, C., and Borowski, C. (1993). Manganese nodule crevice fauna. Deep Sea Res. 1 Oceanogr. Res. Pap. 40, 419–423. doi: 10.1016/0967-0637(93)90012-R
Thistle, D. (2003). The Deep-Sea Floor: An Overview Ecosystems of the Deep Ocean. (Amsterdam: Elsevier).
Thomsen, P. F., Kielgast, J., Iversen, L. L., Møller, P. R., Rasmussen, M., and Willerslev, E. (2012). Detection of a diverse marine fish fauna using environmental DNA from seawater samples. PLoS One 7:e41732. doi: 10.1371/journal.pone.0041732
Thurber, A. R., Sweetman, A. K., Narayanaswamy, B. E., Jones, D. O. B., Ingels, J., and Hansman, R. L. (2014). Ecosystem function and services provided by the deep sea. Biogeosciences 11, 3941–3963. doi: 10.5194/bg-11-3941-2014
Torti, A., Lever, M. A., and Jørgensen, B. B. (2015). Origin, dynamics, and implications of extracellular DNA pools in marine sediments. Mar. Genomics 24, 185–196. doi: 10.1016/j.margen.2015.08.007
Vanreusel, A., Hilario, A., Ribeiro, P. A., Menot, L., and Arbizu, P. M. (2016). Threatened by mining, polymetallic nodules are required to preserve abyssal epifauna. Sci. Rep. 6:26808. doi: 10.1038/srep26808
Vinogradov, M. E. (1970). Vertical Distribution of the Oceanic Zooplankton. Jerusalem: Israel Program for Scientific Translations.
Volz, J. B., Mogollón, J. M., Geibert, W., Arbizu, P. M., Koschinsky, A., and Kasten, S. (2018). Natural spatial variability of depositional conditions, biogeochemical processes and element fluxes in sediments of the eastern Clarion-Clipperton Zone, Pacific Ocean. Deep Sea Res. Part I Oceanogr. Res. Pap. 140, 159–172. doi: 10.1016/j.dsr.2018.08.006
Wedding, L. M. M., Friedlander, A. M. M., Kittinger, J. N. N., Watling, L., Gaines, S. D. D., Bennett, M., et al. (2013). From principles to practice: a spatial approach to systematic conservation planning in the deep sea. Proc. R. Soc. B 280:20131684. doi: 10.1098/rspb.2013.1684
Wedding, L. M. M., Reiter, S. M., Smith, C. R., Gjerde, K. M., Kittinger, J. N., Friedlander, A. M., et al. (2015). Managing mining of the deep seabed. Science 349, 144–145. doi: 10.1126/science.aac6647
Youngbluth, M., Sørnes, T., Hosia, A., and Stemmann, L. (2008). Vertical distribution and relative abundance of gelatinous zooplankton, in situ observations near the Mid-Atlantic Ridge. Deep Sea Res. Part II Top. Stud. Oceanogr. 55, 119–125. doi: 10.1016/j.dsr2.2007.10.002
Keywords: environmental DNA, metabarcoding, legacy eDNA, deep sea, abyssal plains, Clarion Clipperton Zone (CCZ), deep-sea mining
Citation: Laroche O, Kersten O, Smith CR and Goetze E (2020) From Sea Surface to Seafloor: A Benthic Allochthonous eDNA Survey for the Abyssal Ocean. Front. Mar. Sci. 7:682. doi: 10.3389/fmars.2020.00682
Received: 30 May 2020; Accepted: 27 July 2020;
Published: 08 September 2020.
Edited by:
Daniela Zeppilli, Institut Français de Recherche pour l’Exploitation de la Mer (IFREMER), FranceReviewed by:
Hidetaka Nomaki, Japan Agency for Marine-Earth Science and Technology (JAMSTEC), JapanMichael Vecchione, National Oceanic and Atmospheric Administration (NOAA), United States
Copyright © 2020 Laroche, Kersten, Smith and Goetze. This is an open-access article distributed under the terms of the Creative Commons Attribution License (CC BY). The use, distribution or reproduction in other forums is permitted, provided the original author(s) and the copyright owner(s) are credited and that the original publication in this journal is cited, in accordance with accepted academic practice. No use, distribution or reproduction is permitted which does not comply with these terms.
*Correspondence: Olivier Laroche, olli.laroche@gmail.com