Fishing Gear as a Data Collection Platform: Opportunities to Fill Spatial and Temporal Gaps in Operational Sub-Surface Observation Networks
 Cooper Van Vranken1*
  Berthe M. J. Vastenhoud1
  James P. Manning2
  Kristian S. Plet-Hansen3
  Julie Jakoboski4
  Patrick Gorringe5
  Michela Martinelli6
- 1Berring Data Collective, Copenhagen, Denmark
- 2NOAA Northeast Fisheries Science Center, Woods Hole, MA, United States
- 3National Institute of Aquatic Resources (DTU Aqua), Technical University of Denmark, Lyngby, Denmark
- 4MetOcean Solutions, Division of Meteorological Service of New Zealand, Raglan, New Zealand
- 5Swedish Meteorological and Hydrological Institute (SMHI), Norrköping, Sweden
- 6Institute for Biological Resources and Marine Biotechnologies (IRBIM), National Research Council (CNR), Ancona, Italy
While the observation of the open ocean is well achieved by automated ocean measurement instruments, coastal and shelf seas suffer the lack of sub-surface collection platforms. Commercial fishing gear such as bottom trawls, pots, traps and long lines can act as platforms for sensors, which collect physical oceanographic data concurrently with normal fishing operations. The lack of observed in situ ocean data in coastal and shelf seas limits operational oceanography, weather forecasting, maritime industries, and climate change monitoring. In addition, using fishing gear as an ocean observation platform has auxiliary benefits for fisheries management including stakeholder involvement. This study quantifies and compares the existing sub-surface in situ data coverage with the spatial distribution of fishing activities. The results show that integration with fishing could contribute to filling some of the most pressing gaps in existing ocean observation systems in coastal and shelf seas. There are limitations related to opportunistic data collection, mainly related to spatial and temporal heterogeneity of fishing activities. However, we make the case that fishery-based observations have the potential to complement existing ocean observing systems in areas where oceanographic data are lacking and needed most in order to ensure long term sustainability of ocean monitoring.
Introduction
Despite the well documented importance of understanding the physical processes occurring in the ocean, there is a lack of in situ subsurface data to calibrate and constrain ocean models and forecasts in coastal and shelf seas. Recent studies have shown large errors in prior ocean modeling analyses (Cheng et al., 2019; Lozier et al., 2019). For example, models validated and run with insufficient empirical data decrease the accuracy of the Intergovernmental Panel on Climate Change (IPCC) reports (Lozier et al., 2019; Tanhua et al., 2019). Note: All acronyms are defined in section “Glossary.” Coastal and shelf-seas are of particular importance, as these are the most dynamic ocean regions with the highest ecosystem productivity and biodiversity and value to maritime industries and coastal recreation (Farcy et al., 2019; Jacox et al., 2020). Insufficient empirical data in coastal ocean models can hinder the blue economy and ultimately leads to inaccurate forecasts and un-informed policy decisions (Tanhua et al., 2019).
Collecting subsurface ocean measurements presents numerous challenges and costs. Conductivity, temperature, and depth sensors (CTDs) measure the vertical water column profiles of the baseline physical oceanographic parameters, temperature and salinity, at corresponding depths. Traditionally, most types of subsurface ocean data were collected via dedicated scientific research vessels (R/Vs). On R/Vs, CTDs are often deployed alongside other sensors measuring a variety of parameters, such as oxygen, fluorescence or turbidity. The operating costs associated with R/Vs prohibit data being collected on the spatial and temporal scales necessary for operational oceanographic purposes. Despite costs, R/Vs are an indispensable cornerstone for ocean observations due to their unparalleled data collection capabilities and flexibility, enabling the widest range of simultaneously measured parameters (Schmidt et al., 2019). A variety of technologies and platforms are now being employed for sustained monitoring ocean physics at spatial and temporal scales that would not be possible with R/Vs. EXpendable BathyThermographs (XBTs) are a one-time use temperature recording unit that can be deployed from a range of vessel types, after which they are discarded to the sea floor. XBTs are operable in the majority of seas, from open oceans to coastal waters. From the 1960s, millions of XBTs were deployed, making XBTs the most common subsurface ocean temperature data source (ICDC, 2019). Today the most used platforms for collecting CTD profiles are Argo floats: 4,000 Argo floats operate globally, collecting 2,000 m profiles every 10 days (Argo, 2019). Argo floats have resulted in a step-change improvement for global sub-surface ocean observation, and therefore, for oceanography on a whole (von Schuckmann et al., 2016). However, operating Argo floats in shelf seas has proved to be difficult and is not widely practiced (Siiriä et al., 2019). The successful deployment of the large scale Argo program, combined with operational ranges of Argo floats, means that there are now more physical subsurface observations of the open ocean than in coastal and shelf sea regions (Killick et al., 2019). Addressing the gaps in in situ ocean data coverage due to the operational limitations of Argo floats is identified as a key priority by recent reviews of ocean observation systems (March et al., 2019; She et al., 2019; Tanhua et al., 2019).
A multitude of platforms are employed for the physical oceanographic observation of shelf seas, including moored buoys and buoyancy-driven gliders (Puillat et al., 2016; Meinig et al., 2019; Möller et al., 2019). Each of these platforms has unique data collection capabilities and advantages which often complement each other in order to achieve a more comprehensive ocean observation system. Marine animals, including sharks, seals, whales, and turtles, can be employed as opportunistic platforms for oceanographic sensors (Fedak, 2013; Hussey et al., 2015; Patel et al., 2018; March et al., 2019). In some regions this approach is widely used. For instance, in the Southern Ocean the majority of profile data comes from marine mammals (Fedak, 2013). Citizen scientists have also been successfully engaged collecting oceanographic data from a variety of activities including surfing, scuba diving and sailing vessels (Wright et al., 2016; Brewin et al., 2017; Astrolabe, 2019). The integration of oceanographic data collection with commercial vessels such as ferries, cargo ships, and fishing vessels is termed “Ship Of OPportunity” (SOOP) (Goni et al., 2010; Freeman et al., 2017). Some of these commercial vessels, such as ferries, are widely utilized for collecting ocean measurements (Gaughan et al., 2015; Haller et al., 2015).
Coastal and shelf seas that are often associated with high maritime activity and complex oceanographic dynamics are among the areas in the ocean where accurate and up to date empirical data are most needed (OECD, 2016; Puillat et al., 2016; Patel et al., 2018; Farcy et al., 2019). Compared with the deep ocean, the spatial and temporal physical variability of the near coastal ocean and polar regions is higher (Serreze et al., 2000; She et al., 2016; Gawarkiewicz and Malek Mercer, 2019). Furthermore, the variety of processes occurring in, as well as the features of coastal waters (e.g., tidal processes, river plumes, and benthic features), require an increase in observations in order to improve oceanographic models (Gaughan et al., 2015; Lamouroux et al., 2016). Users of ocean data and modeled products, ranging from search and rescue operations to hurricane forecasts, suffer from a lack of empirical data in these coastal and shelf seas (Domingues et al., 2019; Mateus et al., 2020).
Commercial fishing activity is concentrated in these data-poor coastal and shelf seas. A Gear that is used to catch fish is often set out to the sea floor and then hauled back up, offering a potential platform for sensors to measure the ocean while fishermen are performing their normal fishing operations. In addition, fishing vessels are actively navigated by their captains and crew through the hazards associated with high traffic maritime areas that can destroy autonomous data collection platforms such as autonomous underwater vehicles (AUVs) and buoys (Teng et al., 2009). Several successful programs have used the approach of collecting oceanographic data with fishing gear as a platform. Two examples of sensors mounted on fishing gear are shown (Figure 1).

Figure 1. Left: A temperature and depth sensor on a scallop dredge in the Gulf of Maine. Image: Cooper Van Vranken. Right: A sensor on a trawl net headrope, Aleutian Islands, Alaska. Image: Lynn Selboe. Sensors: NKE Instrumentation.
In Italy, the National Research Council (CNR) founded the Fishery Observing System (FOS) in 2003, upgrading to the Fishery and Oceanography Observing System (FOOS) in 2013 (Falco et al., 2007, 2011; Martinelli et al., 2012; Carpi et al., 2015; Russo et al., 2015, 2016; Aydoğdu et al., 2016; Sparnocchia et al., 2016; Lucchetti et al., 2018). FOOS works with various types of fishing vessels including pelagic trawlers, bottom trawlers, and purse seiners to collect both physical oceanographic measurements (CTD) and meteorological observations (weather stations for wind speed and direction, atmospheric pressure, etc.), along with georeferenced catch information (Martinelli et al., 2016; Patti et al., 2016).
The French Institute for Exploitation of the Sea (Ifremer) runs the Recopesca program in cooperation with NKE Instrumentation, with a primary goal of advancing an ecosystem approach to fisheries management (Leblond et al., 2010). Starting with 30 vessels in 2009, the project includes trawlers, longlines, pot fishers, and gillnetters, outfitted with sensors (Lamouroux et al., 2016; Karlson et al., 2017). Recently, CNR and Ifremer collaborated with the NKE Instrumentation (France) to extend their water column profile measurement options and include dissolved oxygen and chlorophyll fluorescence (Martinelli et al., 2014, 2017; Sparnocchia et al., 2017).
In the United States, the National Oceanographic and Atmospheric Administration’s (NOAA) Northeast Fisheries Science Center, in collaboration with the Gulf of Maine Lobster Foundation, has run the Environmental Monitoring on Lobster Traps and Large Trawlers (eMOLT) program since 2001. The eMOLT program is intended to aid the fisheries science, oceanographic, and weather forecasting communities by mounting temperature sensors on fishing gear (Manning and Pelletier, 2009; Li et al., 2017). In 2015 the addition of real-time telemetry to the project has resulted in more than eleven-thousand hauls reporting bottom temperature.
In New Zealand, there is a new initiative led by MetOcean Solutions (Meteorological Service of New Zealand) as part of the larger, multi-disciplinary Moana Project (MetOcean Solutions, 2020). The ocean observation component of the Moana Project, “Te Tiro Moana,” partners with Zebra-Tech Ltd. and the New Zealand fishing community to expand the spatial and temporal coverage of subsurface temperature observations (Beamsley et al., 2020). The Moana Project aims to outfit most commercial fishing vessels operating in New Zealand (hundreds), as well as enabling additional recreational and educational citizen scientists to collect ocean temperature measurements. These data will then be anonymously assimilated into the Moana Project’s hydrodynamic ocean forecasts (Beamsley et al., 2020), with model and forecast products tailored specifically for fishing.
Similar pilot projects have been performed by the Thünen Institute for Baltic Sea Research Warnemünde, Oregon State University (Childress et al., 2010), and NOAA and the North Pacific Research Board (Ianelli et al., 2010). Aarhus University, University of Manitoba, and the Royal Greenland fishing fleet are currently running a pilot project mounting CTDs to the nets of two trawl net fishing vessels of West Greenland (Rysgaard, Personal Communication). Berring Data Collective (BDC) is a new program both outfitting new vessels and working to promote communication and data standardization between existing programs. An example of CTD profile data recorded by BDC in the Kattegat off Denmark is shown (Figure 2). Several additional fishing fleets around the world also record hydrographic data from sensors on their gear, for private data analytics purposes.
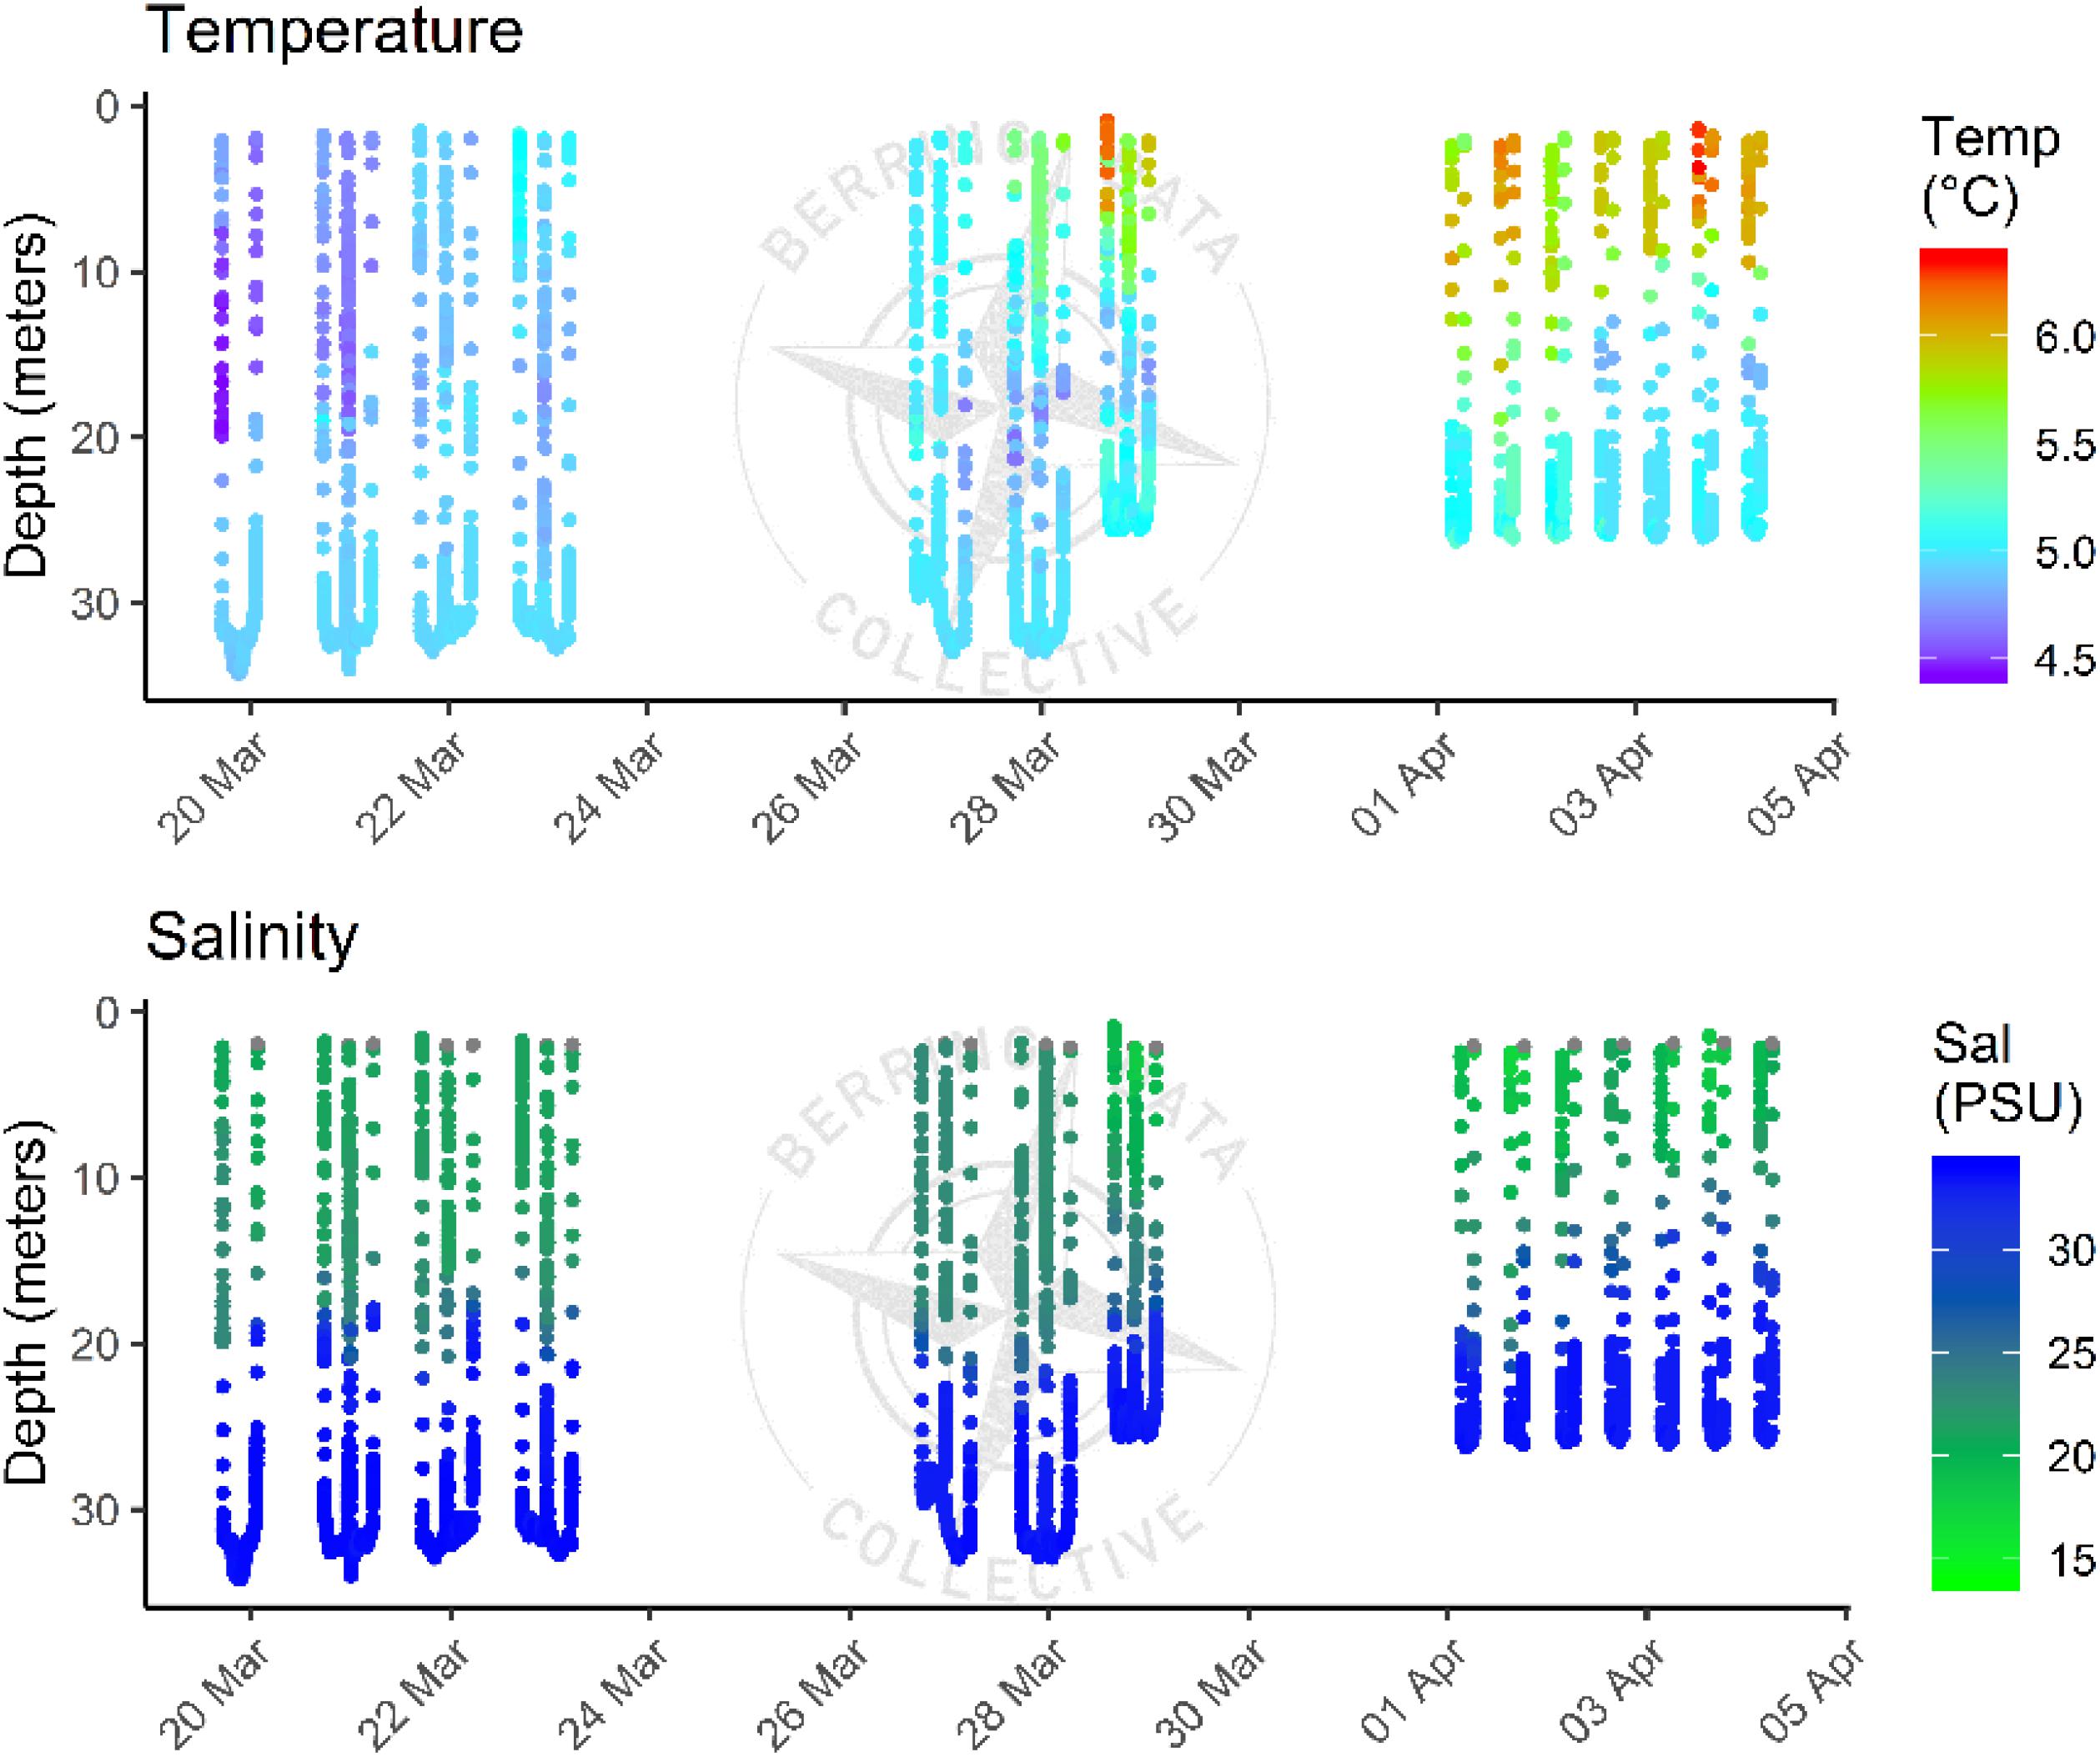
Figure 2. Temperature and salinity profiles measured from a CTD sensor mounted on a bottom trawl net off of Denmark in 2019. For a comprehensive quality assessment of similar data collected via fishing vessels, see Aydoğdu et al. (2016).
Results from these programs demonstrate that collection of oceanographic data via fishing gear can be successfully implemented with a diverse range of vessel types, locations, and fisheries. The operational assimilation of bottom temperature data from eMOLT into the Doppio regional ocean model has started. Doppio is a shelf and coastal focused model covering the Mid-Atlantic Bight and the Gulf of Maine (López et al., 2020). In addition, work has been done to evaluate both empirical data quality and instrument reliability (Martinelli et al., 2016; Möller et al., 2019). Best practice protocols have been produced through several EU projects (Martinelli et al., 2016; Karlson et al., 2017; Möller et al., 2019). A simulated assimilation experiment found that a limited number of fishing vessels in the Adriatic could reduce root mean squared model temperature error in the upper and lower layers by 44 and 36%, respectively (Aydoğdu et al., 2016). In the Bay of Biscay, RECOPSECA fishing vessel profiles are used as the on-shelf complement to Argo data as part of the CORA-IBI (COriolis ocean database for ReAnalysis – Ireland–Biscay–Iberia; Szekely et al., 2017) dataset, linking shelf to open ocean phenomena (Lamouroux et al., 2016; Charria et al., 2017). The uptake and utilization of this data source is still limited, but it is increasing.
The aim of this article is to compare spatial and temporal gaps in today’s sub-surface physical oceanographic observation coverage with the distribution of fishing gear deployments. Our focus is on platform distribution, rather than the resulting ocean measurements. Existing observations and fishing events are gridded, mapped, and compared on a global scale, as well as on three regional focus areas: the North Atlantic, Alaska, and New Zealand. Quantification of existing ocean observation distribution on a global scale is a novel extension of prior spatial gap analyses limited by specific region or platform type (Akpınar and Charria, 2018; March et al., 2019). These analyses were inspired and are enabled by the array of observation platform metadata available in The European Marine Observation and Data Network (EMODnet) Physics portal (EMODnet, 2019).
In summary, our analyses demonstrate that the spatial distribution and temporal frequency of fishing operations make fishing vessels well suited to contribute to ocean observation systems.
Materials and Methods
To compare the spatial and temporal distribution of existing oceanographic observation programs with the distribution of fishing effort, we have extracted, as described below, both existing observations and fishing activity data from global data hubs of ocean observations and fishing activity. The analyses cover 2017 and 2018. All included observation platforms measure temperature as it is a core physical oceanographic parameter. R/Vs are excluded from most analyses as the focus is on automated and opportunistic data collection platforms producing data for operational usage available in near real-time only. Historical and delayed mode observations are excluded. Focus regions were selected based on the authors’ applied knowledge of the fisheries in these areas, in addition to being shelf seas areas with abundant human maritime activity. The North Atlantic and Alaska are regions of particular importance to monitor with regard to climate change, especially because in situ measurements are particularly sparse in near-polar regions (Serreze et al., 2000; Buch et al., 2019).
The New Zealand focus region is analyzed both with the global proxy datasets for fishing and observations, as well as data available from national New Zealand databases, in order to quantify the degree of validity of the method used for the subsequent data and methods presented. In New Zealand, data were available for both the publicly available observation platform databases used by the Moana Project for local operational modeling, as well as precise fishing activity locations. New Zealand has stringent haul-by-haul fisheries reporting regulations resulting in accurate and precise location data for every fishing operation (Reddy, 2019). These fishing location data were provided in an anonymous, aggregated form on a 0.5 × 0.5 degree latitude-longitude grid for the purposes of this study. These precise local data sources enabled a comparison between the global data sources used in the subsequent analyses in order to evaluate the accuracy of the presented methods (see section “Method Validation”).
Current Observation Coverage Data
The global, subsurface observation coverage data have primarily been extracted from the EMODnet Physics data portal (EMODnet, 2019). EMODnet Physics (EASME/EMFF/2016/1.3.1.2 – Lot 3/SI2.749411) provides a gateway to ocean physics data in European seas. EMODnet Physics is strongly federated with the two European data aggregating infrastructures: Copernicus Marine Environment Monitoring Service – In Situ Thematic Assembly Centre for operational data flow, while historical validated datasets are organized in collaboration with SeaDataNet and its network of National Oceanographic Data Centers. These data are integrated with other European data hubs (e.g., ICES and PANGAEA) and combined with Supplementary Data from Global Oceans Observing networks such as ARGO, DBCP, GLOSS, GO-SHIP, etc. to make the most comprehensive physical parameter data catalogs available (EMODnet, 2019). Moreover, international collaborations provide access to coastal data in non-European areas (e.g., NOAA platforms for the United States, IAPB platforms for the Arctic area, IMOS/AODN for Australia, SOOS for the Southern ocean, and others). As a result, EMODnet Physics catalogs are going beyond European seas to offer an even more exhaustive entry point to global ocean physical observations.1 A recent spatial gap analysis performed as part of the AtlantOS project used similar methods relying solely on EMODnet platform data (Akpınar and Charria, 2018). Smaller scale data collection programs that take place within the territorial waters of one nation, and are more likely be coastal, may not yet be included in EMODnet. EMODnet is under development, and is continuing to incorporate additional data collection programs and platforms (Calewaert et al., 2016).
The United States Integrated Ocean Observing System (IOOS), as well as its regional nodes Alaska Ocean Observing System (AOOS) and North Eastern Regional Association of Coastal Ocean Observing Systems (NERACOOS), did not include any additional subsurface platforms from those already included in the EMODnet Physics data set (AOOS, 2016; IOOS, 2019; NERACOOS, 2019). Additional platforms were included in our analysis from the Southern Ocean Observing System (SOOS) and the Joint technical Commission for Oceanography and Marine Meteorology in situ Observations Program (JCOMMOPS) portals (JCOMMOPS, 2019; SOOS and EMODnet, 2019).
With the exception of New Zealand, R/Vs are excluded from analysis for two reasons. The first reason is that a global database of all research vessel sub-surface profiles does not exist. The second is that the purpose of research vessel measurements is generally not primarily for operational purposes. While these relatively sparse observations can and do make substantial contributions to operational forecasting, many R/Vs do not transmit their collected data in near real-time (Smith et al., 2019). In the New Zealand analyses, the relevant research vessel data that was transmitted in near real-time for operational use was included.
For section “Method Validation,” local New Zealand data sources were the data sources as currently used by the Moana Project for operational ocean forecast verification, corresponding to relevant classifications used in the global data selection criteria. While the majority of platforms were duplicated in the New Zealand global and local observation data sets, local data were extracted from their operational sources. Argo profile location data within the bounds of the New Zealand focus region came from the Ifremer-hosted Argo ERDDAP (Argo, 2020). Relevant real-time buoys, gliders, R/V CTDs, XBTs, and instrumented marine mammals were ingested from the INSITU_GLO_NRT_OBSERVATIONS_013_030 datasets (Copernicus in situ TAC, 2019). Additional XBT profiles came from the only regional data source: the Australian IMOS – SOOP XBT real-time dataset (IMOS, 2020).
For the global observations dataset, all platforms recording data at 20 m or below were removed in order to only include platforms that were recording sub-surface data. Setting this depth threshold at less than 20 m resulted in some platforms, such as surface drifters, being falsely included due to a mismatch between depth category metadata and the depth of actual measured data. Fixed platforms, such as moorings, are set in our analyses to contribute to filling a grid cell once per day. As analyses are conducted on a monthly basis, this means that any grid cell with a fixed platform is maximally covered. Platform types included in this analysis are Argo floats, profilers, moored buoys, mini loggers, marine mammals, XBTs, and sub-surface gliders, obtained from the designated metadata categorizations in the EMODnet data. Ifremer’s Recopesca monitored fishing vessels are part of the EMODnet dataset and are included under the broader “mini logger” platform classification. While Berring Data Collective vessels are now included in EMODnet, data collection began after 2018. There is ongoing work to ingest FOOS and eMOLT data into EMODnet.
Fishing Distribution Data
Global data on fishing distribution originates from Global Fishing Watch (GFW) in a 0.01° grid. GFW uses two Convolutional Neural Networks (CNN) to identify both fishing locations and fishing gear type from onboard Automatic Identification System (AIS) data (Global Fishing Watch, 2019). A more detailed description of the dataset can be found in Kroodsma et al. (2018). While GFW is the best available proxy, it does not include many fishing activities, as not all fishing vessels have AIS onboard. Generally, the vessels without AIS are smaller than the minimum size to require AIS or from nations with less maritime law enforcement. For example, in the Mediterranean and Black Seas, 83 and 91% of fishing vessels are below the 15 m length at which AIS is required (Food and Agriculture Organization of the United Nations, 2011). Recent analyses show that the majority of fishing vessels are small scale, and approximately 30% of the global fleet is still non-motorized (Rousseau et al., 2019). This means that the majority of fishing vessels in many regions, usually smaller vessels fishing closest to shore and in the developing world, are absent from our analyses. However, small vessels without electrical systems are more difficult to outfit as data collectors and are therefore less likely to be used for ocean measurement purposes.
In this analysis, we have not included all fishing activities, but only those from fishing gear types judged ideal for collecting complete top to bottom oceanographic data profiles, based upon bottom contacting behavior. The following gear types, as defined by GFW, were included in our analysis: fixed gear, pots and traps, trawlers, set longlines, dredge fishing, and set gillnets. Many additional fishing gear types could be, and are, utilized as ocean data collection platforms, such as purse-seines (Martinelli et al., 2012). However, the gear classifications selected are the simplest gear types to integrate sensors with in order to collect complete water column profiles. For the section “Method Validation,” New Zealand gear classifications were matched to the appropriate GFW classifications.
Mapping of Spatial Distributions and Quantification of Coverage
Both observations and fishing activity were gridded onto a 0.5° latitude and longitude grid, which is approximately equivalent to 56 km at the equator. A 0.5° degree grid is larger than most ocean modeling grids, but was chosen for visualization purposes to show the intended large-scale patterns of this study. Fishing distribution and observations are quantified as the number of fishing events or transmissions of data from platforms occurring in each grid rectangle over a 1-month period. The resulting maps display the mean of the monthly number of observations or fishing events for 2017 and 2018.
The coverage of both fishing distribution and current observations are grouped into to three bottom depth classes: 0 to 200 m, 200 to 500 m, and 500 m and deeper. A depth and corresponding depth class were assigned to each fishing and observational latitude-longitude location. The bathymetric depths were extracted on a 0.1° grid from the ETOPO1 database hosted by NOAA, which was accessed through the marmap package (Pante and Simon-Bouhet, 2013).
The percentage of the total area shown in each map for each depth class that was observed or fished for each month was calculated as follows:
This method was used for the different regions of interest and globally in 2017 and 2018. The mean percentage covered of each depth class are presented below with bar charts, with error bars quantifying the variability between months. All analyses and visualizations are done using RStudio (RStudio Team, 2015).
In the resulting maps, bathymetry is indicated via contours corresponding to three depth classes going from lighter (shallower) to darker (deeper) blue. These depth color classes, 200 m and shallower (shelf), 200 to 500 m (shelf-break), and 500 m and deeper (deep ocean) are the same depth classifications in both the bar and pie charts. In addition to maps showing both ocean observation and fishing coverage and corresponding number of occurrences of each, a third map shows grid cells with at least one ocean observation or fishing event, as well as grid points where there is overlap.
The mean, standard deviation (SD), and coefficient of variation (CV) of the percent coverage for each depth class, are calculated for both fisheries and observations for all focus regions and globally from the 24 monthly bins resulting from all months in 2017 and 2018. For each depth class, the means between fishing and observation percent coverage are compared with a paired T-test. P-values are the statistical significance assuming a two-tailed normal distribution. The tests were analyzed at a significance level of α = 0.05.
Results
Method Validation
The availability of fishing and ocean observation platform data from regional and operational New Zealand data sources enabled a comparison of New Zealand global to regional data sources that were used as a validation of the global proxy results from using GFW and global observation databases (Figure 3).
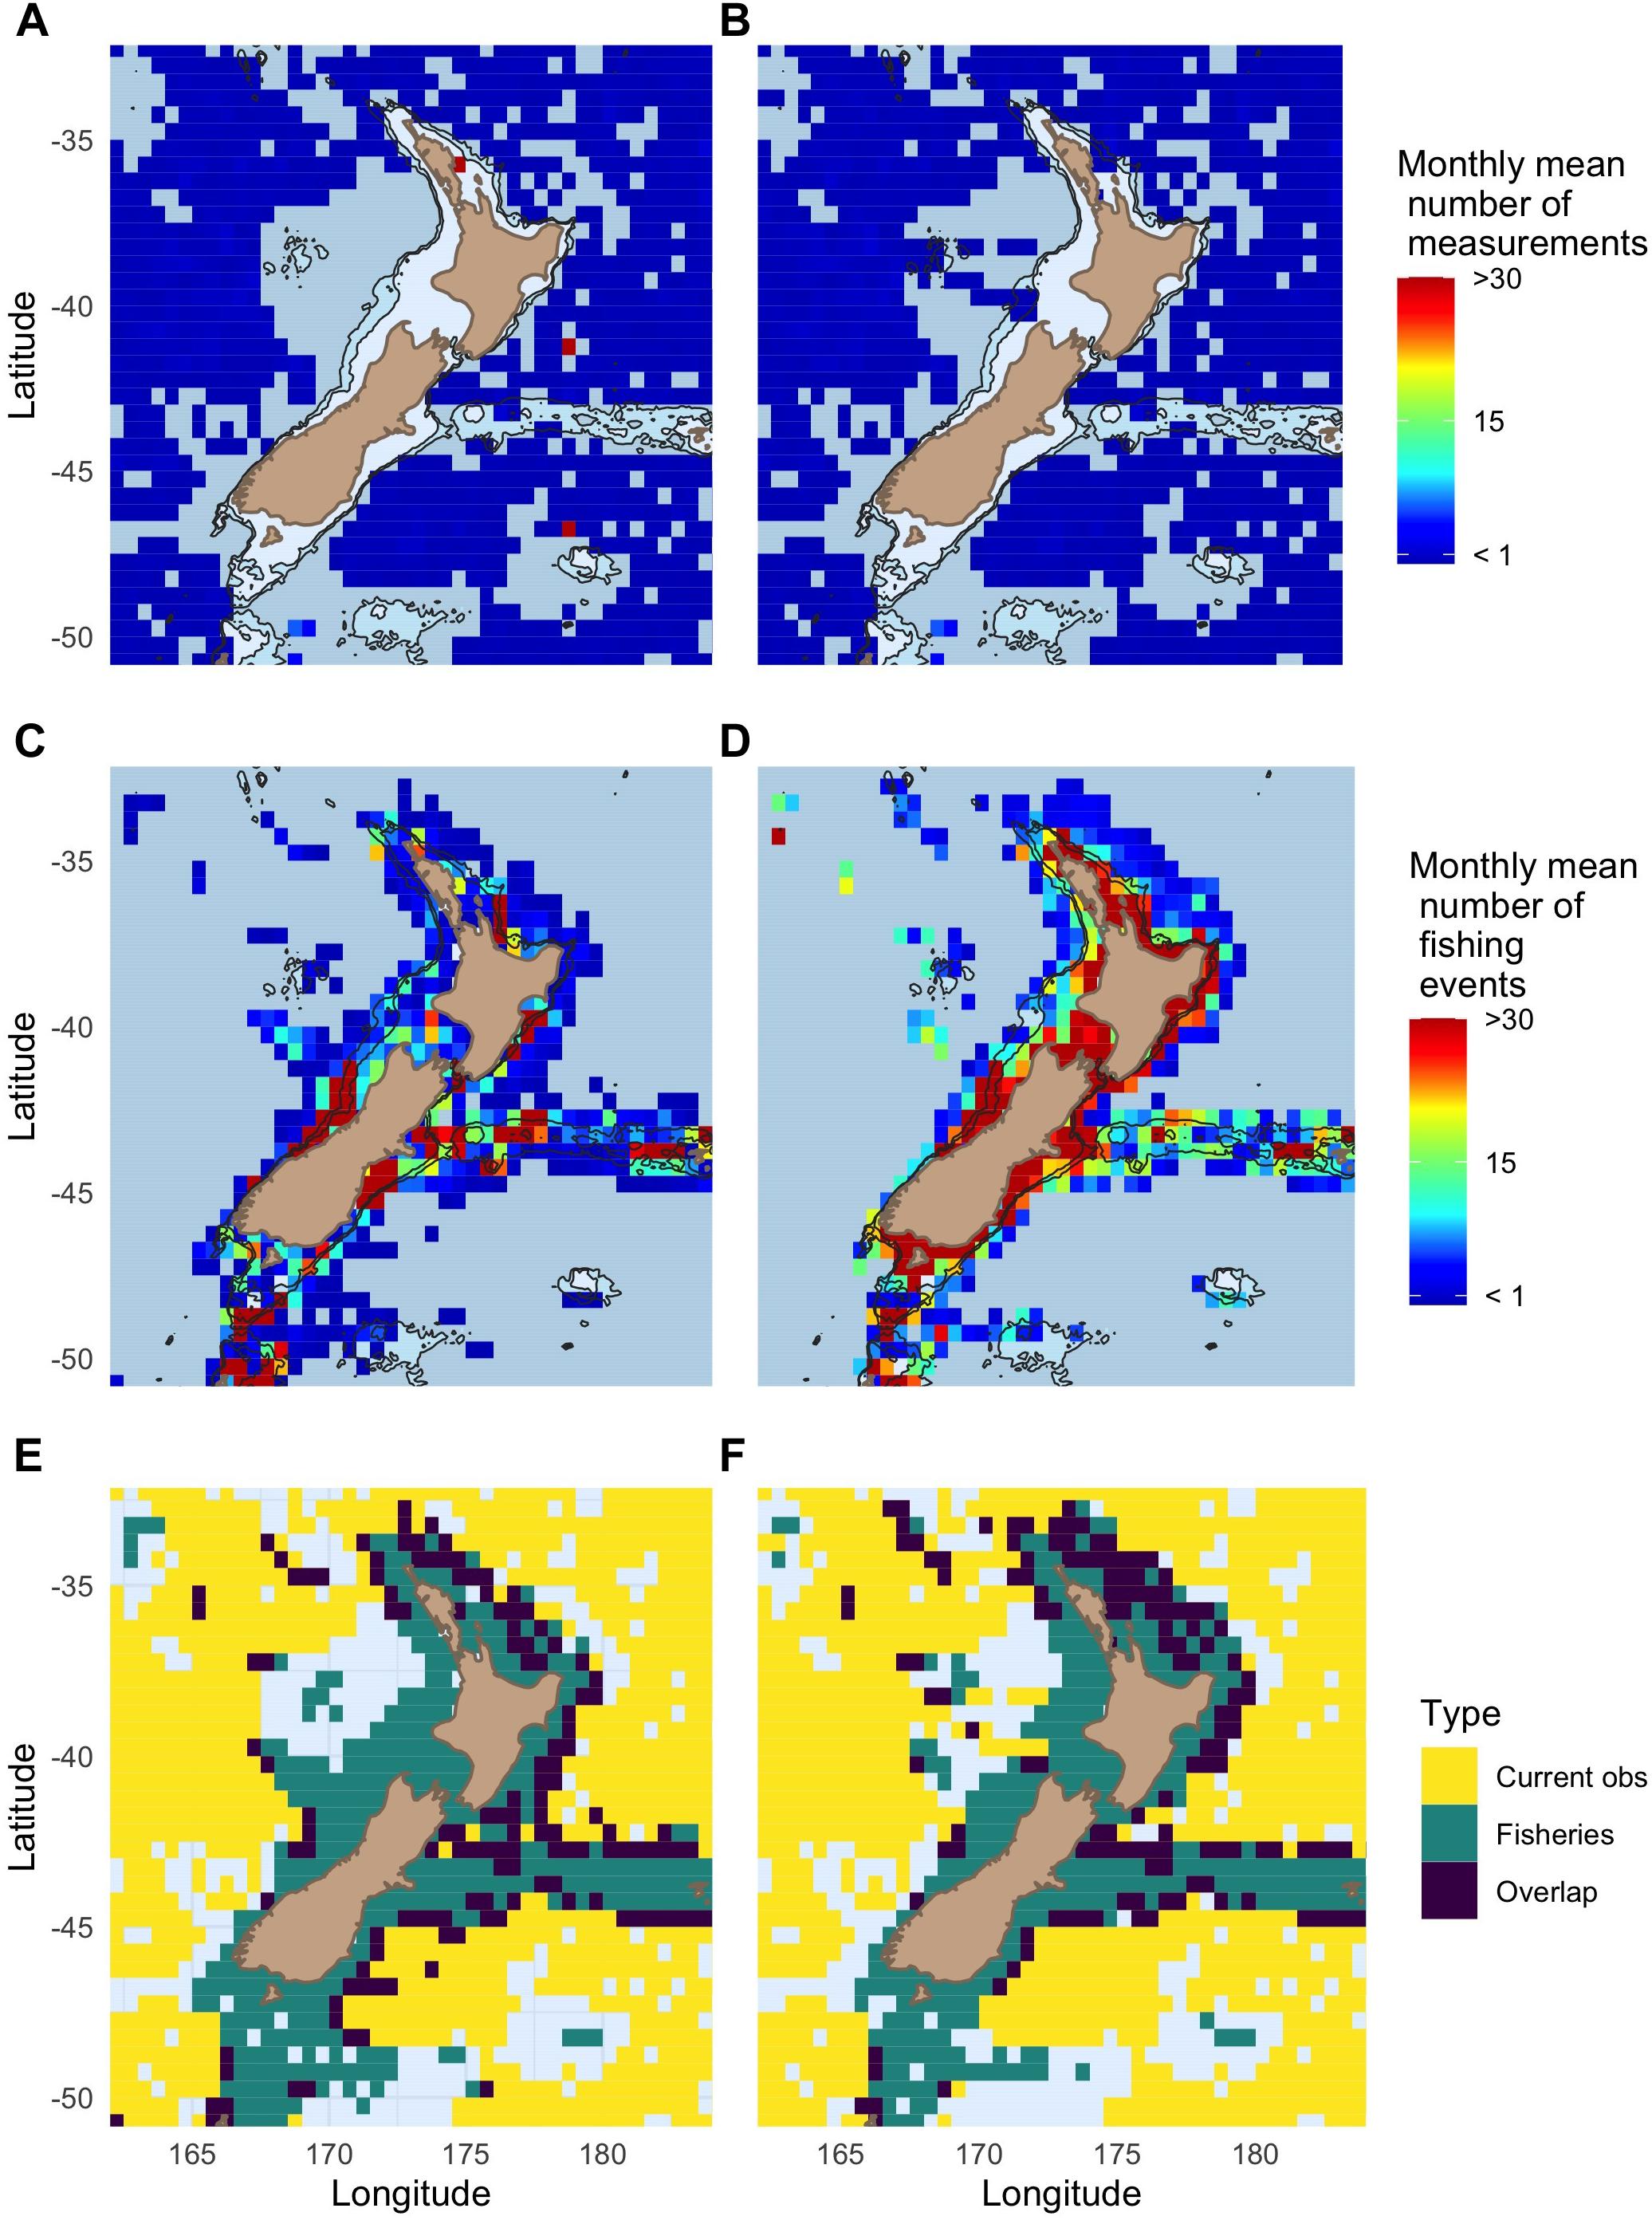
Figure 3. New Zealand comparison of global (A,C,E) and local data sources (B,D,F). (A) Mean monthly number of sub-surface observations from the global observation databases used in subsequent analyses. (B) Mean monthly number of sub-surface observations from local observation databases. (C) Mean monthly number of fishing events judged suitable for potential data collection from GFW data. (D) Mean monthly number of fishing events judged suitable for potential data collection from local databases. Data were provided by the New Zealand Ministry for Primary Industries (MPI) and prepared by David Middleton of Pisces Research Ltd. Bathymetry is indicated via contours corresponding to three depth classes going from lighter (shallower) to darker (deeper) blue matching the 200 m and shallower, 200 to 500 m, and 500 m and deeper depth classifications in other figures. (E,F) Corresponding to the data sources from the above maps, the grid cells with at least one fishing event or ocean observation, with overlap between the two plotted in purple.
The GFW fishing distribution map (Figure 3C) shows the same broad spatial pattern as the more precise New Zealand data set shown in Figure 3D. Similarly, the pattern shown by the global observation databases closely matches that shown by the local databases, with the majority of observations occurring in the deeper open oceans (maps A and B). An exception to this pattern is that there are observations originating from the OceanSites program (red points in map A) that are in the global databases but were not included in the local data bases. Additional exceptions occur from R/V CTD profiles that are included in Figure 3B but not Figure 3A. The coverage percentages divided into depth classes result in similar patterns using both global and local data sources for the New Zealand region (Figure 4).
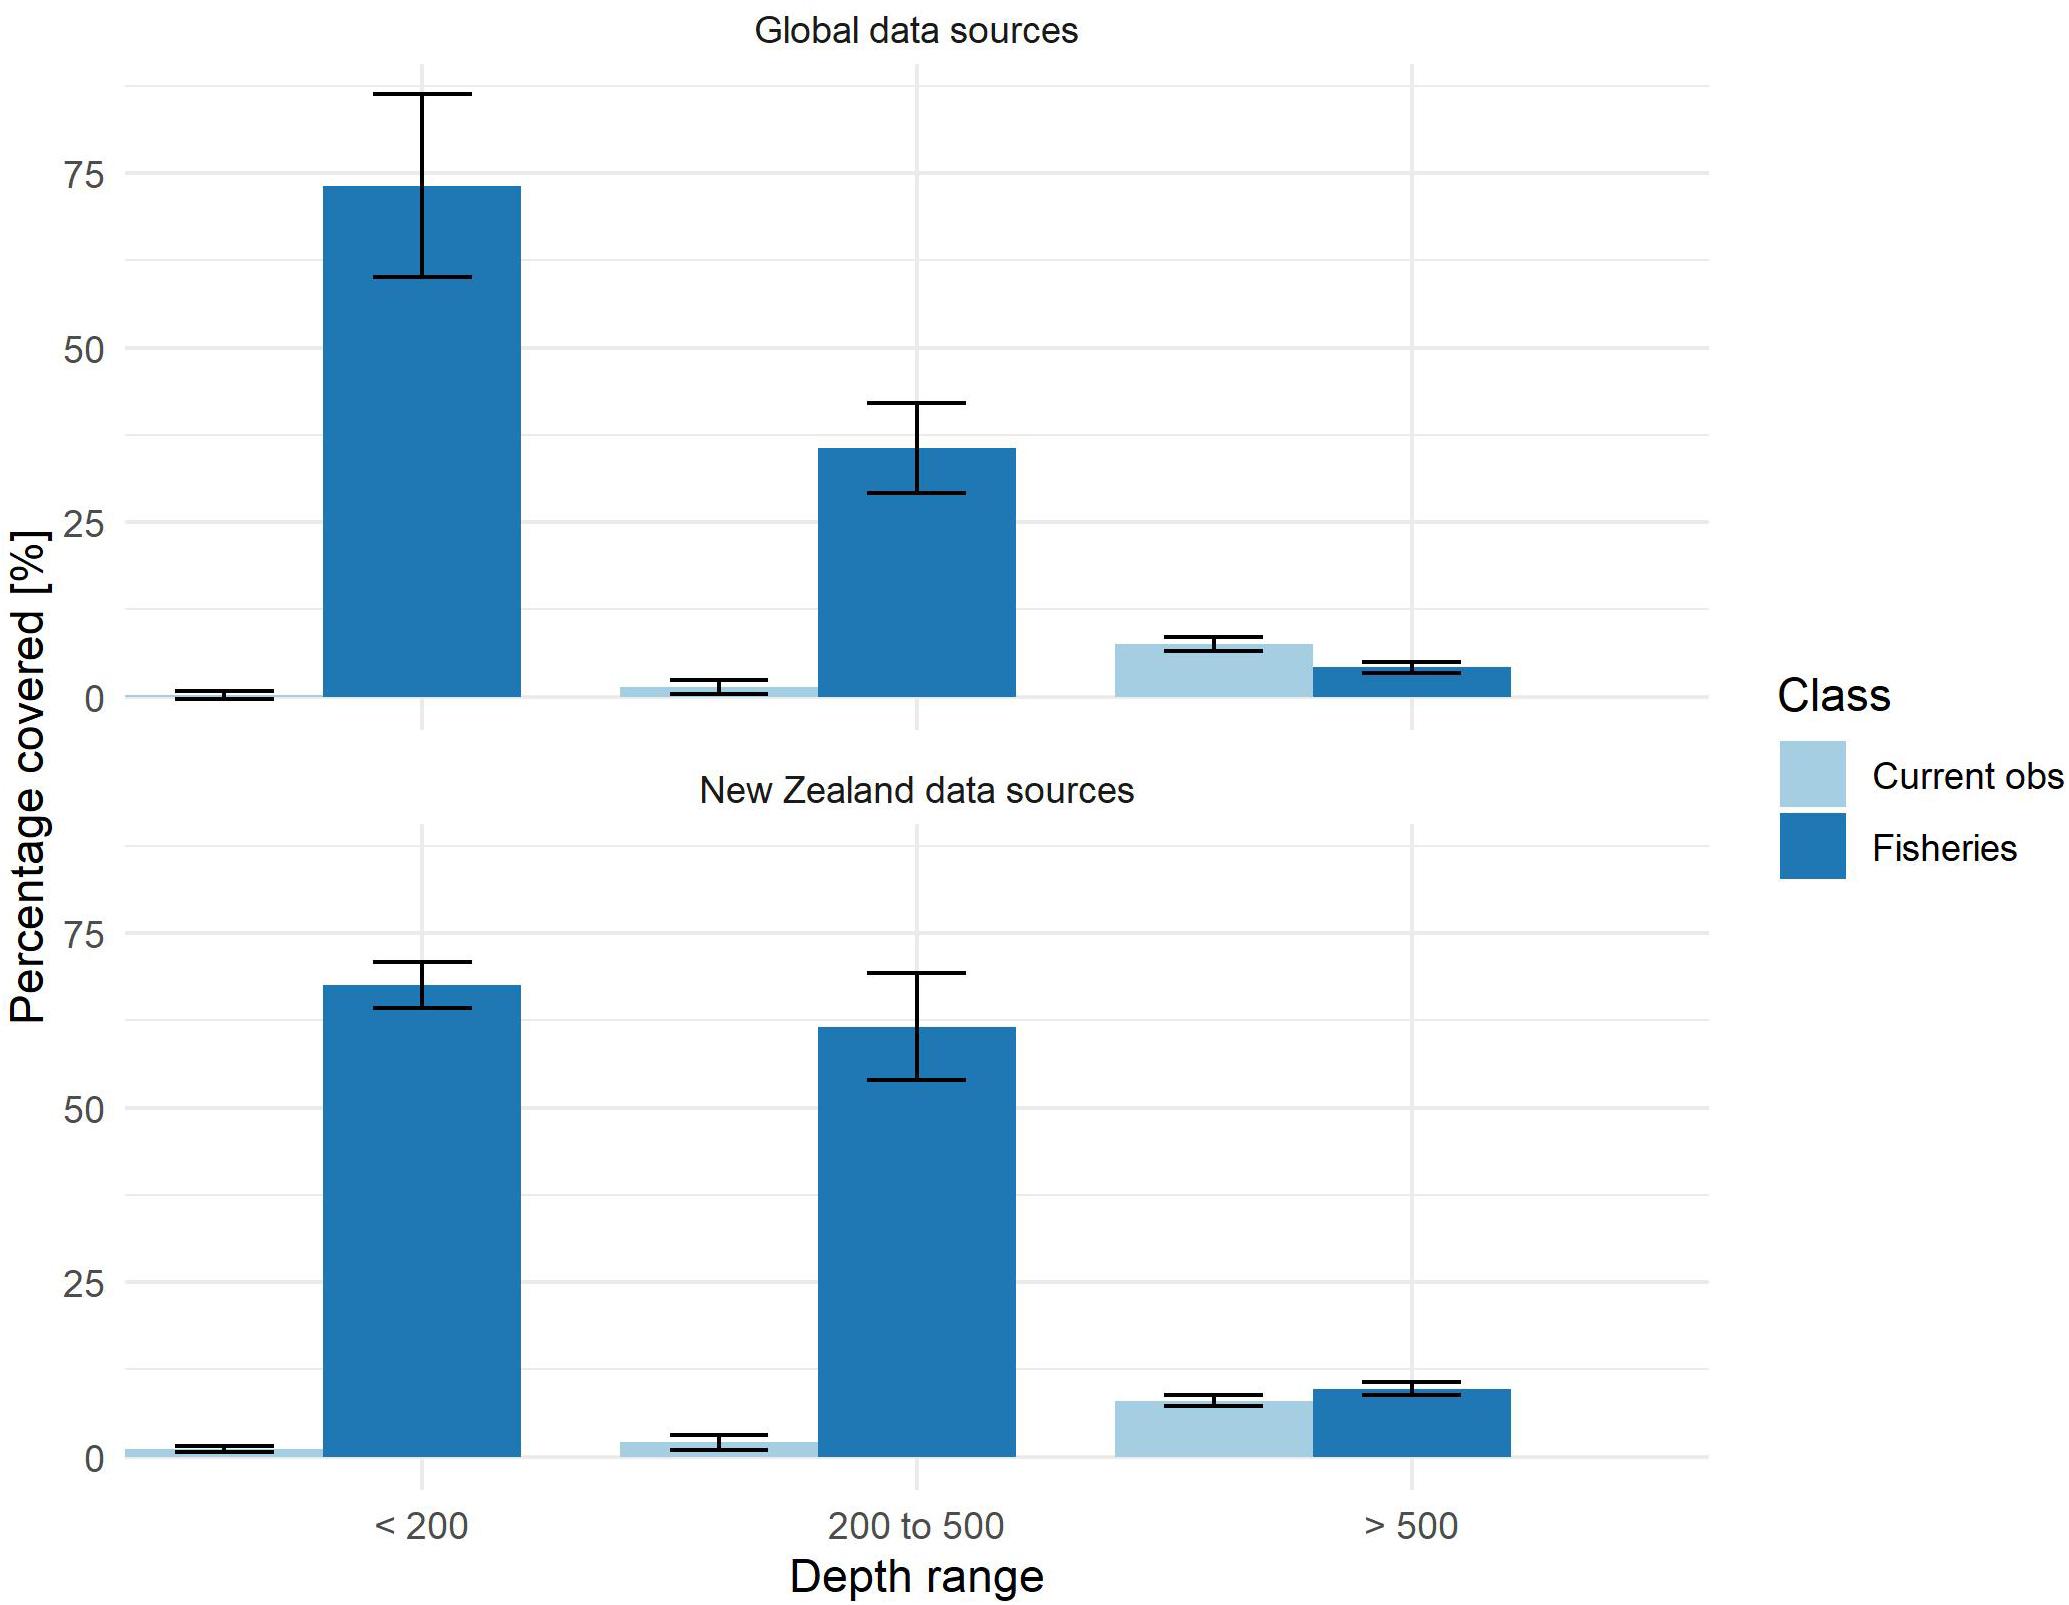
Figure 4. Comparison of mean monthly observation and fishing coverage, divided by depth category, between New Zealand local data sources (top) and the global data sources used in subsequent analyses (bottom). Existing observations (light blue) and Fisheries (dark blue) indicate the percentage of the ocean area within a depth class where data were collected or fishing activity occurred. Standard deviation error bars quantify temporal variability of coverage between months. Note: the secondary for fisheries percent coverage is 10× that for current observations.
In the New Zealand region (Figure 4), ocean observation coverage is the highest in the deep ocean (>500 m). The deep ocean is where fishing coverage is at its lowest for both local and GFW data sources. On the shelf-break (200–500 m) and shelf regions (>200 m), current observation coverage drops to less than 3% for both global and local data sources (Table 1). In contrast, fishing coverage increases to more than 35% on the shelf and shelf-break for both data sources.
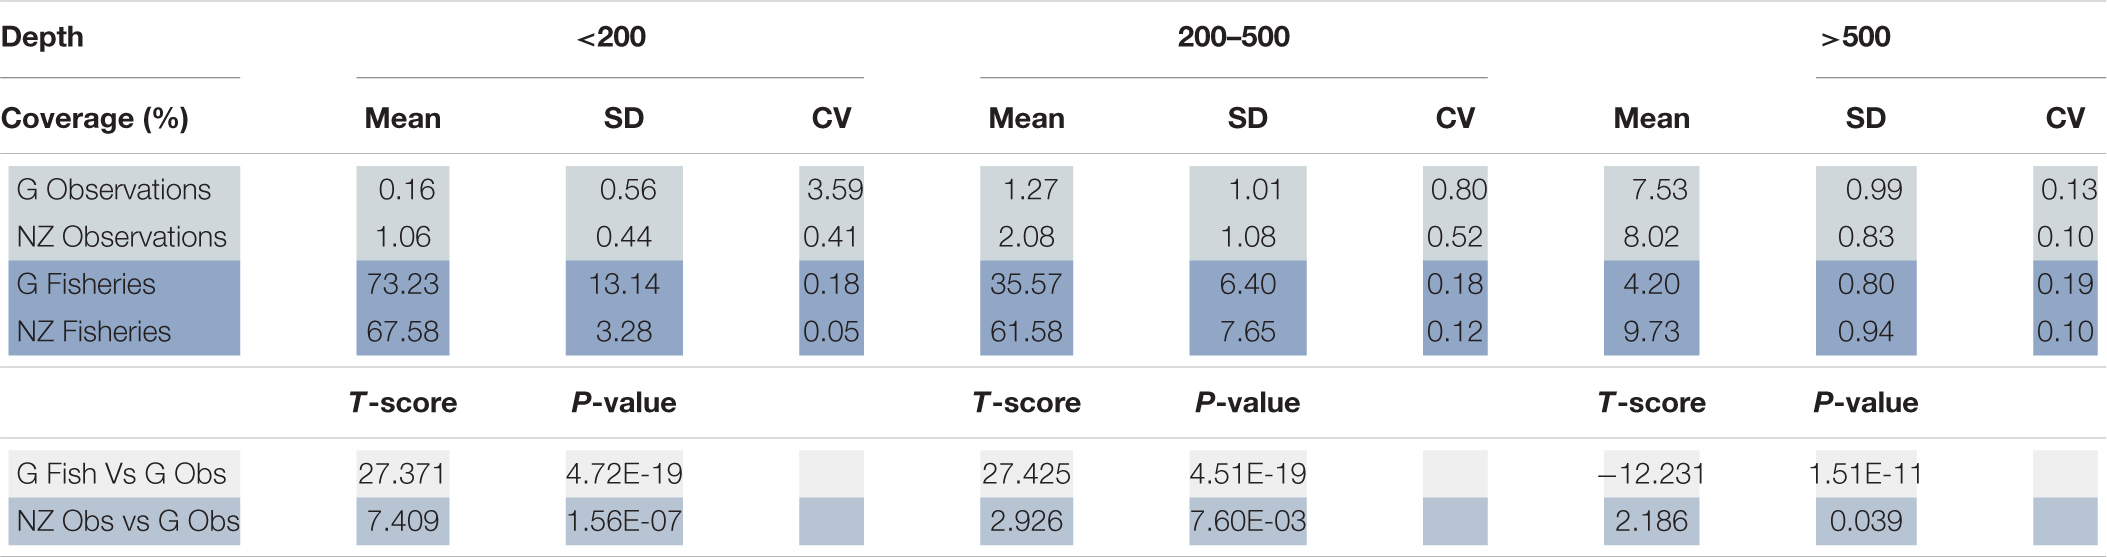
Table 1. Summary statistics comparing observation and fisheries coverage in the New Zealand focus region. Standard deviations (SD) correspond to (Figure 4) error bars, and CV is coefficient of variation. Raw, monthly New Zealand fisheries data were not available for T-test comparisons, with mean and SD calculated prior to the data delivery.
The differences between observation and fishing coverage are statistically significant in all depth classes (1), although the raw data was unavailable to use local fishing in T-tests. There are also lower magnitude yet significant differences between both sets of global and local observation data sources. On the observations side, the data set discrepancies are most significant in the shallow shelf depth class. One notable factor in this discrepancy is that many of the local shelf observations came from R/Vs (Supplementary Figure 6). However, this coverage difference is less than one percent, with fishing coverage greater by a factor of at least 63. The most notable difference in fishing coverage is in the middle depth shelf-break region (Figure 4 and Table 1), with GFW missing almost half of the fishing activity in this depth class. However, this discrepancy means that the subsequently presented results likely under-estimate the strength of the pattern of fishing activity being concentrated where observations are lacking.
Monthly variability in coverage for both fisheries and current observations is shown by the SD error bars (Figure 4) and CV (1). There is general agreement between the magnitude of the error bars comparing the local and global data sources, with the exception that local shelf fishing is 3.2% standard deviation while global shelf is 13% (Figure 4 and Table 1). This difference in standard deviation is likely related to spatial discrepancies which can be seen in the coastal waters when comparing the global and local fishing maps (Figures 3C,D). The GFW data has more strongly concentrated hotspots of coastal fishing, whereas, the local data shows a more evenly distributed coastal fishing effort. In all depth classes, the CV is lower for local fisheries coverage than from the GFW coverage (Table 1). The pattern shown by the New Zealand fisheries data of more evenly distributed and temporally consistent coverage is superior for integrated ocean observation than the pattern shown by the global GFW data that is used in subsequent analyses.
Additional Focus Regions
The pattern shown in New Zealand is repeated in the other two focus regions: fisheries are concentrated in shallower waters, while physical sub-surface observations are concentrated in the deeper waters.
Alaska
In Alaska, the majority of fishing effort is concentrated on the shallower Bering Shelf and Aleutian Ridge (Figure 5B). Subsurface ocean observations are mainly in the deep waters in the Gulf of Alaska (Figure 5A).
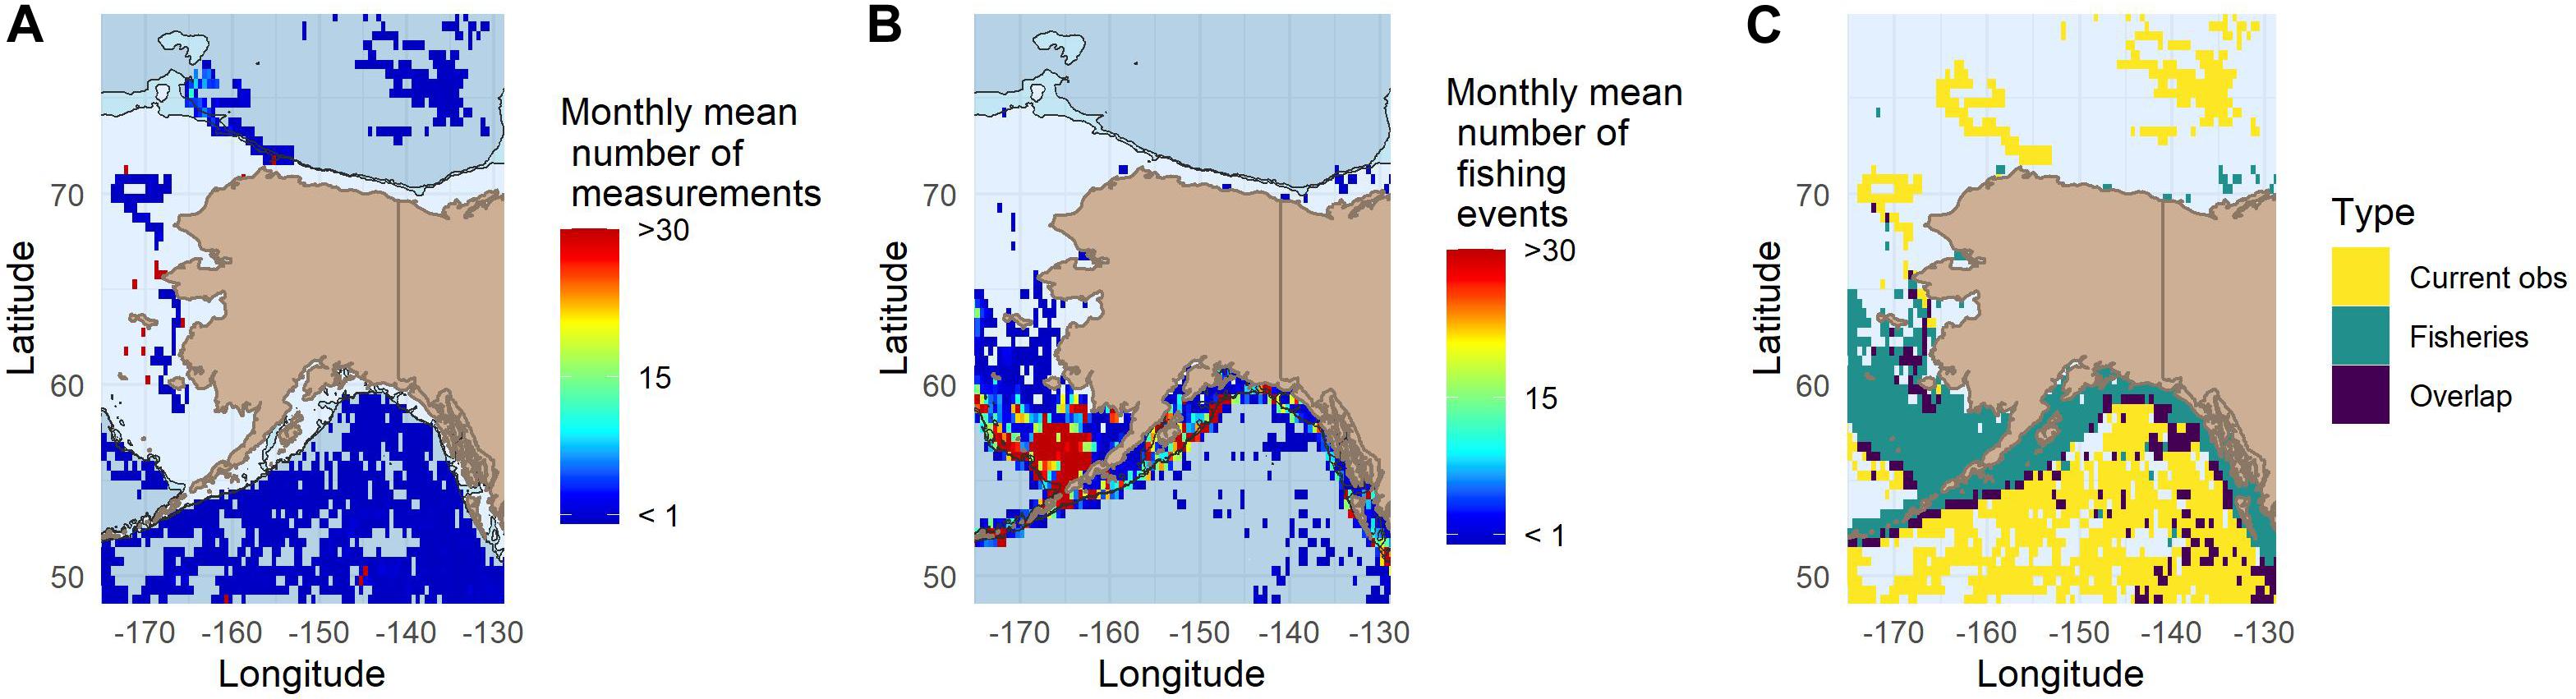
Figure 5. (A) Mean monthly number of sub-surface observations for the Alaska region. (B) Mean monthly number of fishing events for judged suitable for potential data collection. (C) Distribution of both fishing events and ocean observations, with overlap between the two plotted in purple. Note: waters north of 60° are often covered by sea ice, making difficult both fishing and ocean observation.
The northernmost observations in the Beaufort Sea are from XBTs. The upper half, latitudinally, of the ocean surface shown in Figure 5 can be covered by sea ice. The observations that are on the continental shelf are from two short-term shallow Argo missions, moored buoys, and marine mammals. Monthly maps for both observations and fisheries for all focus regions, in addition to maps plotting platform types are included in the Supplementary Material (Supplementary Figures 1–4, 7–9, 11–13).
In Alaska, observation coverage is the highest in the deep ocean at 4.2%, where fishing coverage is at its lowest at 3.9% (Figure 6, Table 2). In contrast, on the shelf-break, the observation mean coverage was 0.3%, while fishing coverage was 15%. The difference between observation and fishing event mean coverage percentages in the shelf and shelf-break (Figure 6) is substantial and statistically significant, while in the deep ocean it is not (Table 2).
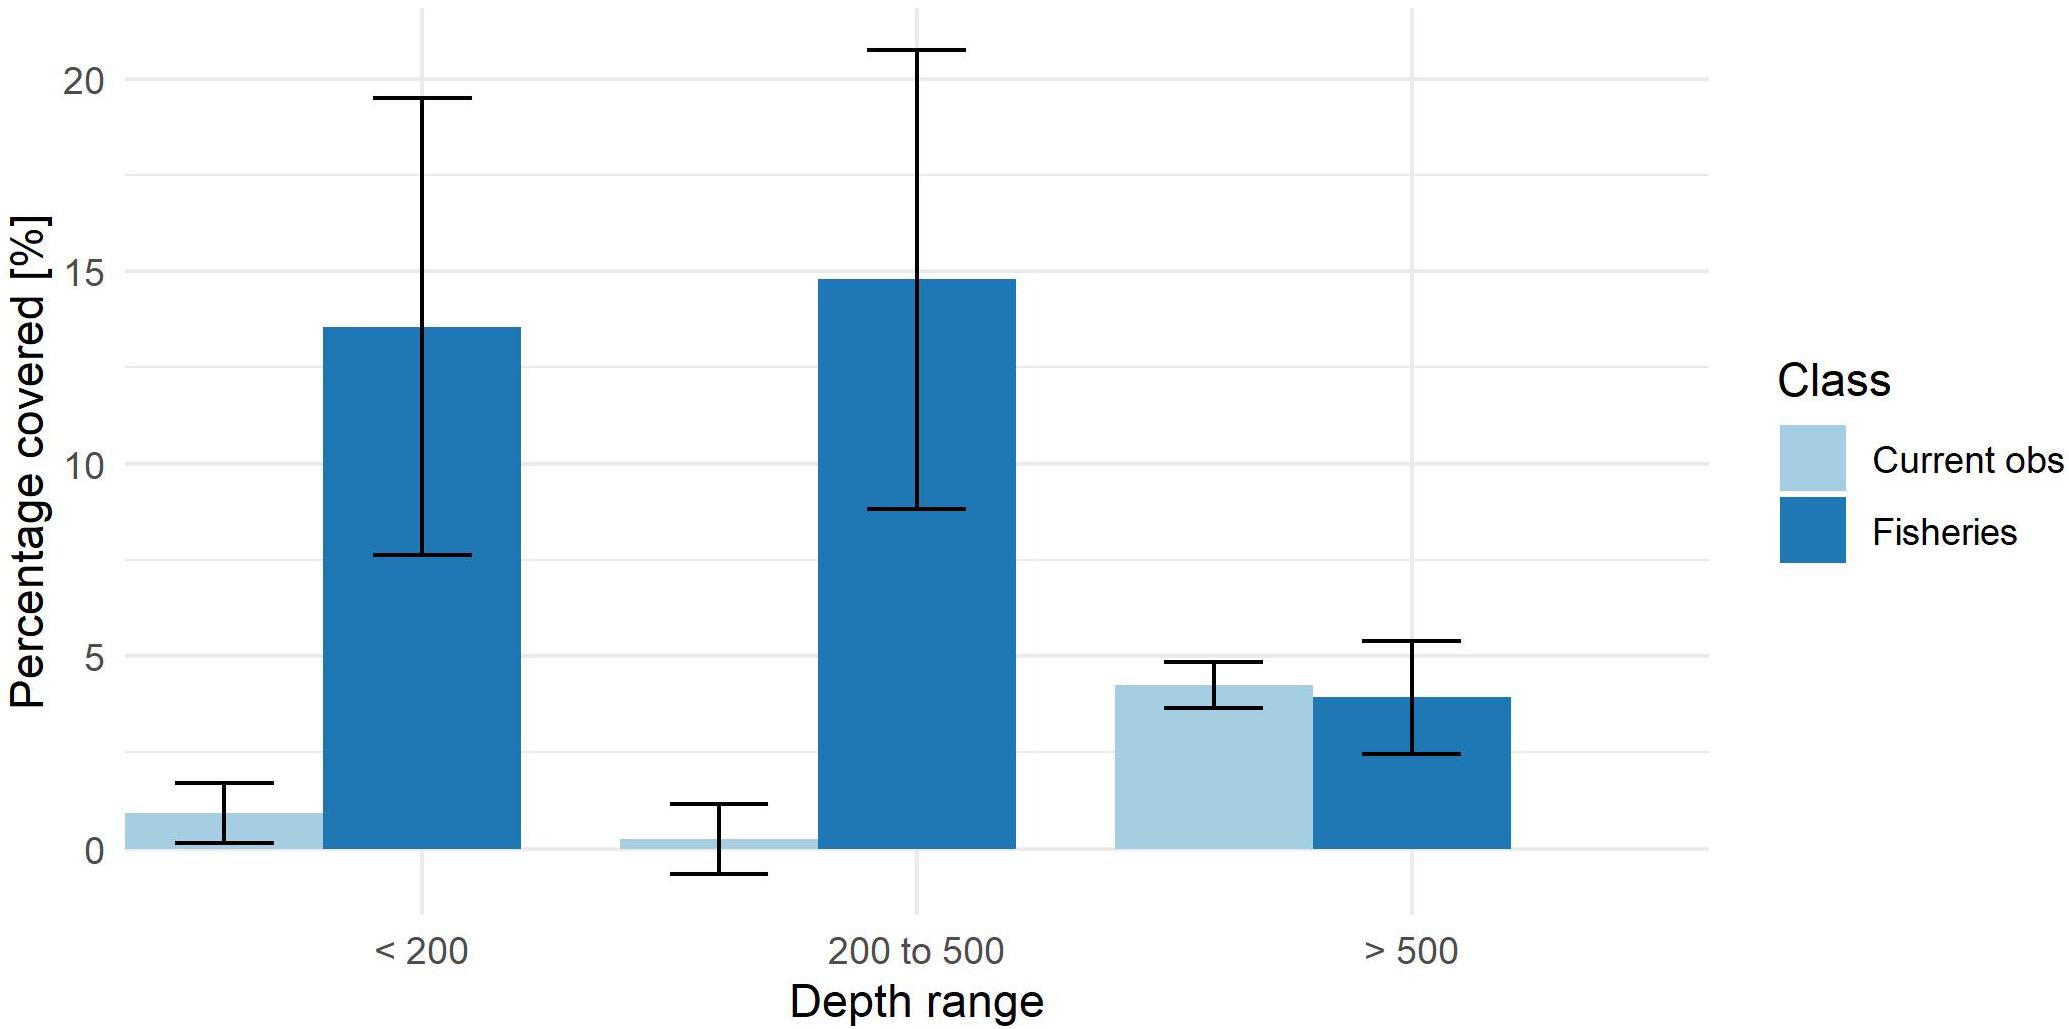
Figure 6. The Alaska region monthly mean global data sub-surface observation and fishing coverage per depth category. Existing observations (light blue) and Fisheries (dark blue) indicate the percentage of the ocean area within a depth class where data were collected or fishing activity occurred. Standard deviation is shown with the error bars to quantify temporal variability of coverage between months.
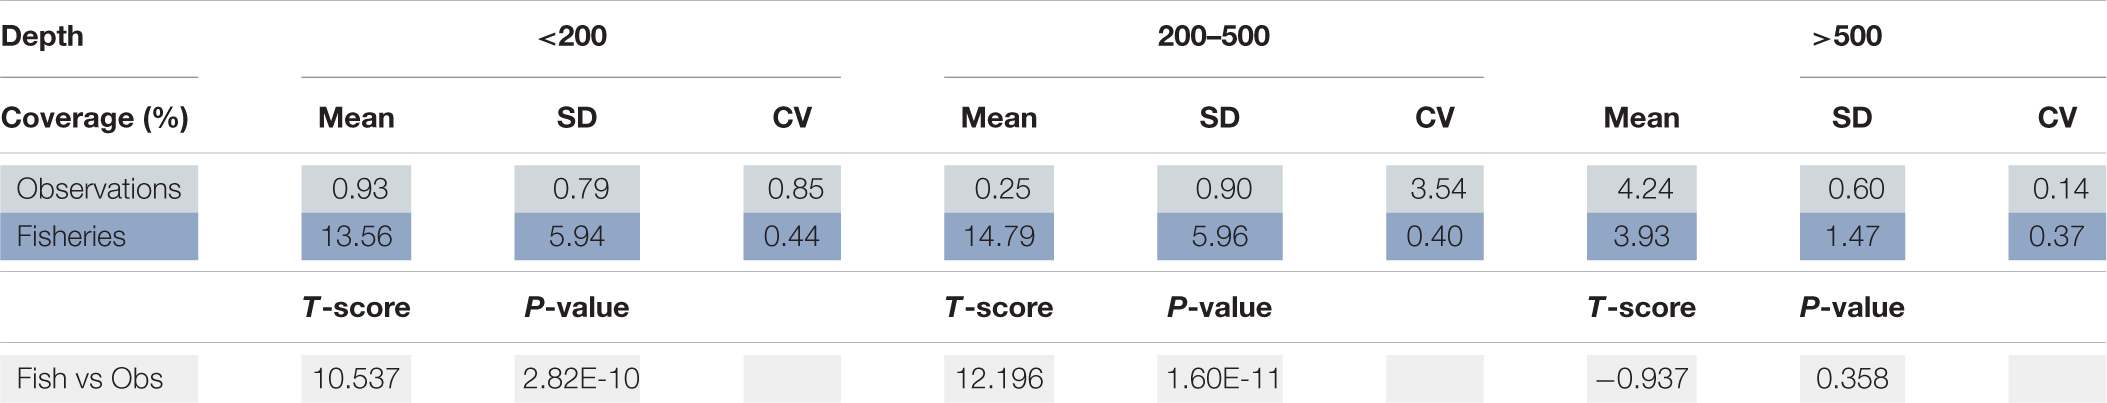
Table 2. Summary statistics comparing observation and fisheries coverage in the Alaska focus region. SD corresponds to (Figure 6) error bars.
Alaska exhibited the highest monthly variability in coverage for both fisheries and existing observations, as shown by the SD error bars (Figure 6), CV (Table 2). December has the lowest fishing coverage and June and July the highest (Supplementary Figure 8). Shallow water Argo deployments in the ice-free summer and early fall, as well as significant marine mammal observations, contributed to irregularity in observation coverage in the shallower depth classes in Alaska (Supplementary Figures 7, 9, 10).
North Atlantic
In the Northern Atlantic region, the majority of the existing observational network is in the deep ocean in the Labrador Sea, the Greenland Sea, the Norwegian Sea, and the deep areas of the North Atlantic Ocean (Figure 7A). The majority of the fishing effort is concentrated on the shallower shelf regions in the Barents Sea, Norwegian Shelf, and Icelandic Shelf (Figure 7B). The observations that are on the continental shelf include some shallow Argo missions, moored buoys, marine mammals, glider missions, and mini-loggers (Supplementary Figures 13, 14).
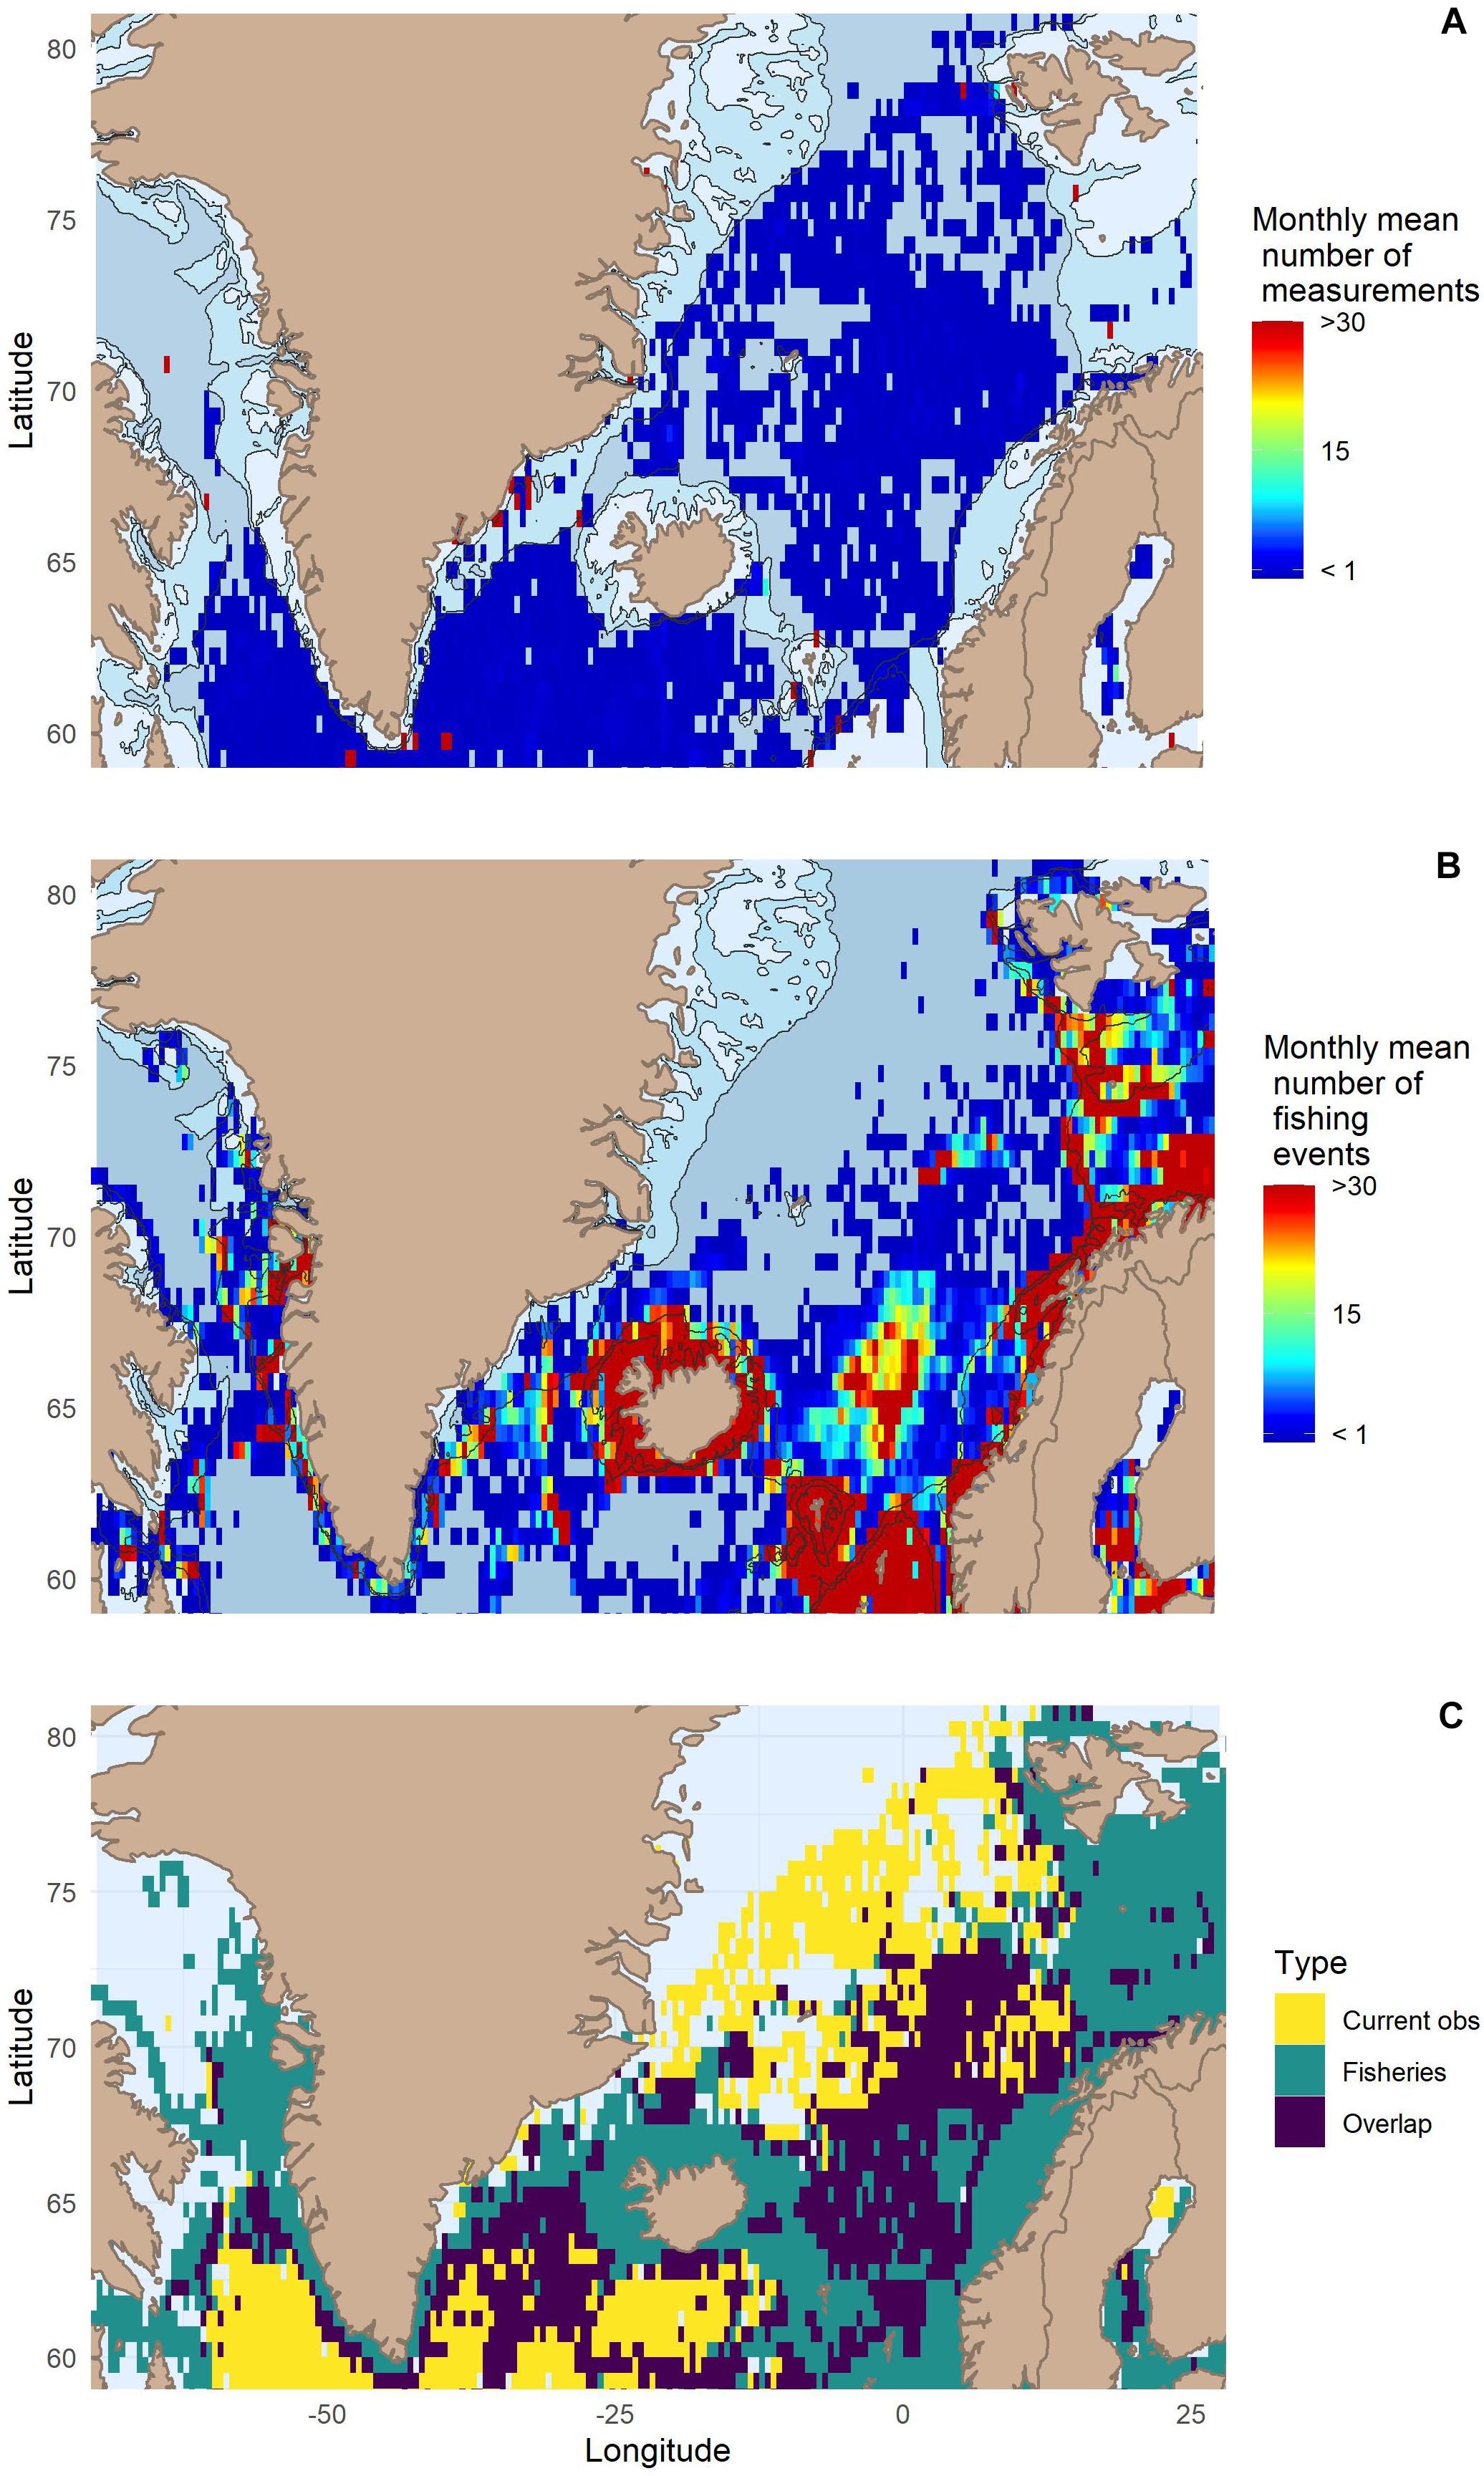
Figure 7. (A) Mean monthly number of sub-surface observations for the North Atlantic region. (B) Mean monthly number of fishing events for judged suitable for potential data collection. (C) Distribution of both fishing events and ocean observations, with overlap between the two plotted in purple. Note that Northeast Greenland, above 71° North, is a national park where fishing is not allowed. In addition, much of the water around Greenland and Baffin Island is covered by sea ice for at least part of the year, making difficult both fishing and ocean observation.
The North Atlantic has the highest overlap between observation and fishing distribution of any focus region (Figure 7C). However, highest concentrations of fishing activity are in regions where observation coverage is sparse.
In the North Atlantic focus region, monthly observation coverage is highest in the deep ocean at 6.5%, whereas fishing coverage is at its lowest at 8.8% (Figure 8, Table 3). In contrast, shelf observations had an observation mean coverage of 1.9%, while mean fishing had a coverage of 43%. The difference in mean coverage percentages in the shelf and shelf-break is substantial and statistically significant, while in the deep ocean it is significant but less substantial (Figure 8, Table 3).
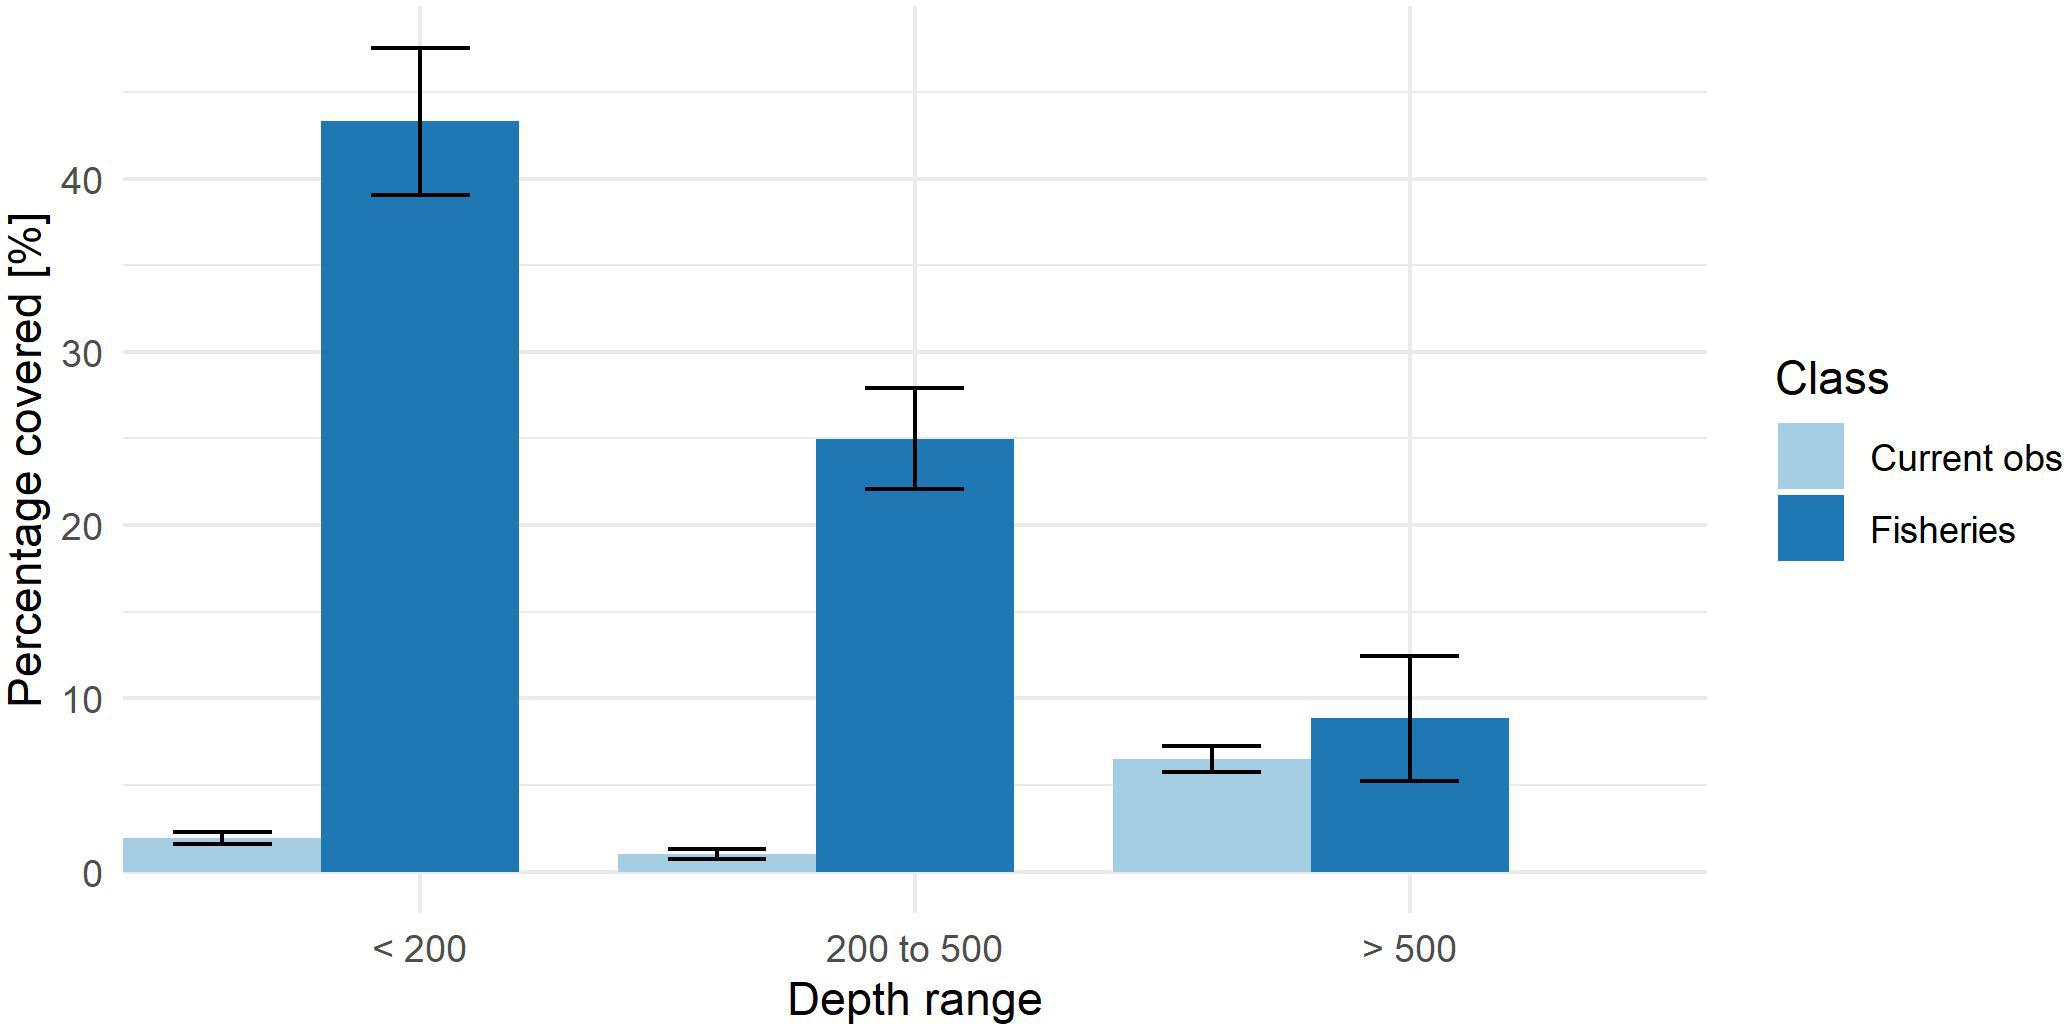
Figure 8. The North Atlantic region monthly mean sub-surface observation and fishing coverage per depth category.
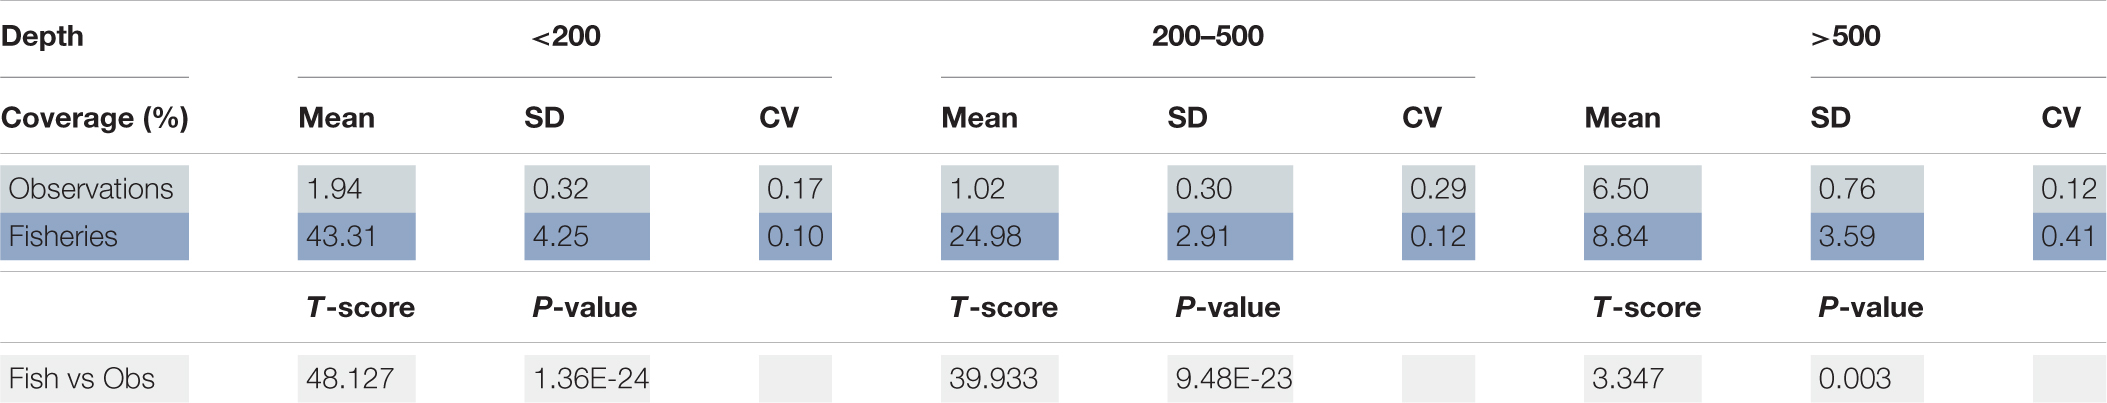
Table 3. Summary statistics comparing observation and fisheries coverage in the North Atlantic focus region.
The CV, indicative of relative monthly coverage variation, is higher for observations than for fishing, with the exception of the deep ocean (Table 3). The mean fishing coverage in the North Atlantic in the deep ocean of 8.8% is more than twice that of any other focus region, with the exception of New Zealand local data. The North Atlantic deep fishing coverage is associated with more seasonal variation indicated by a larger CV than shallower depth classes. This deep ocean fishing is responsible for the large areas of overlap between observation and fishing coverage (Figure 7C).
Global Ocean
The patterns of high fishing activity in areas with lower observation coverage shown above for New Zealand, Alaska, and the North Atlantic are repeated in shelf seas around the world (Figure 9).
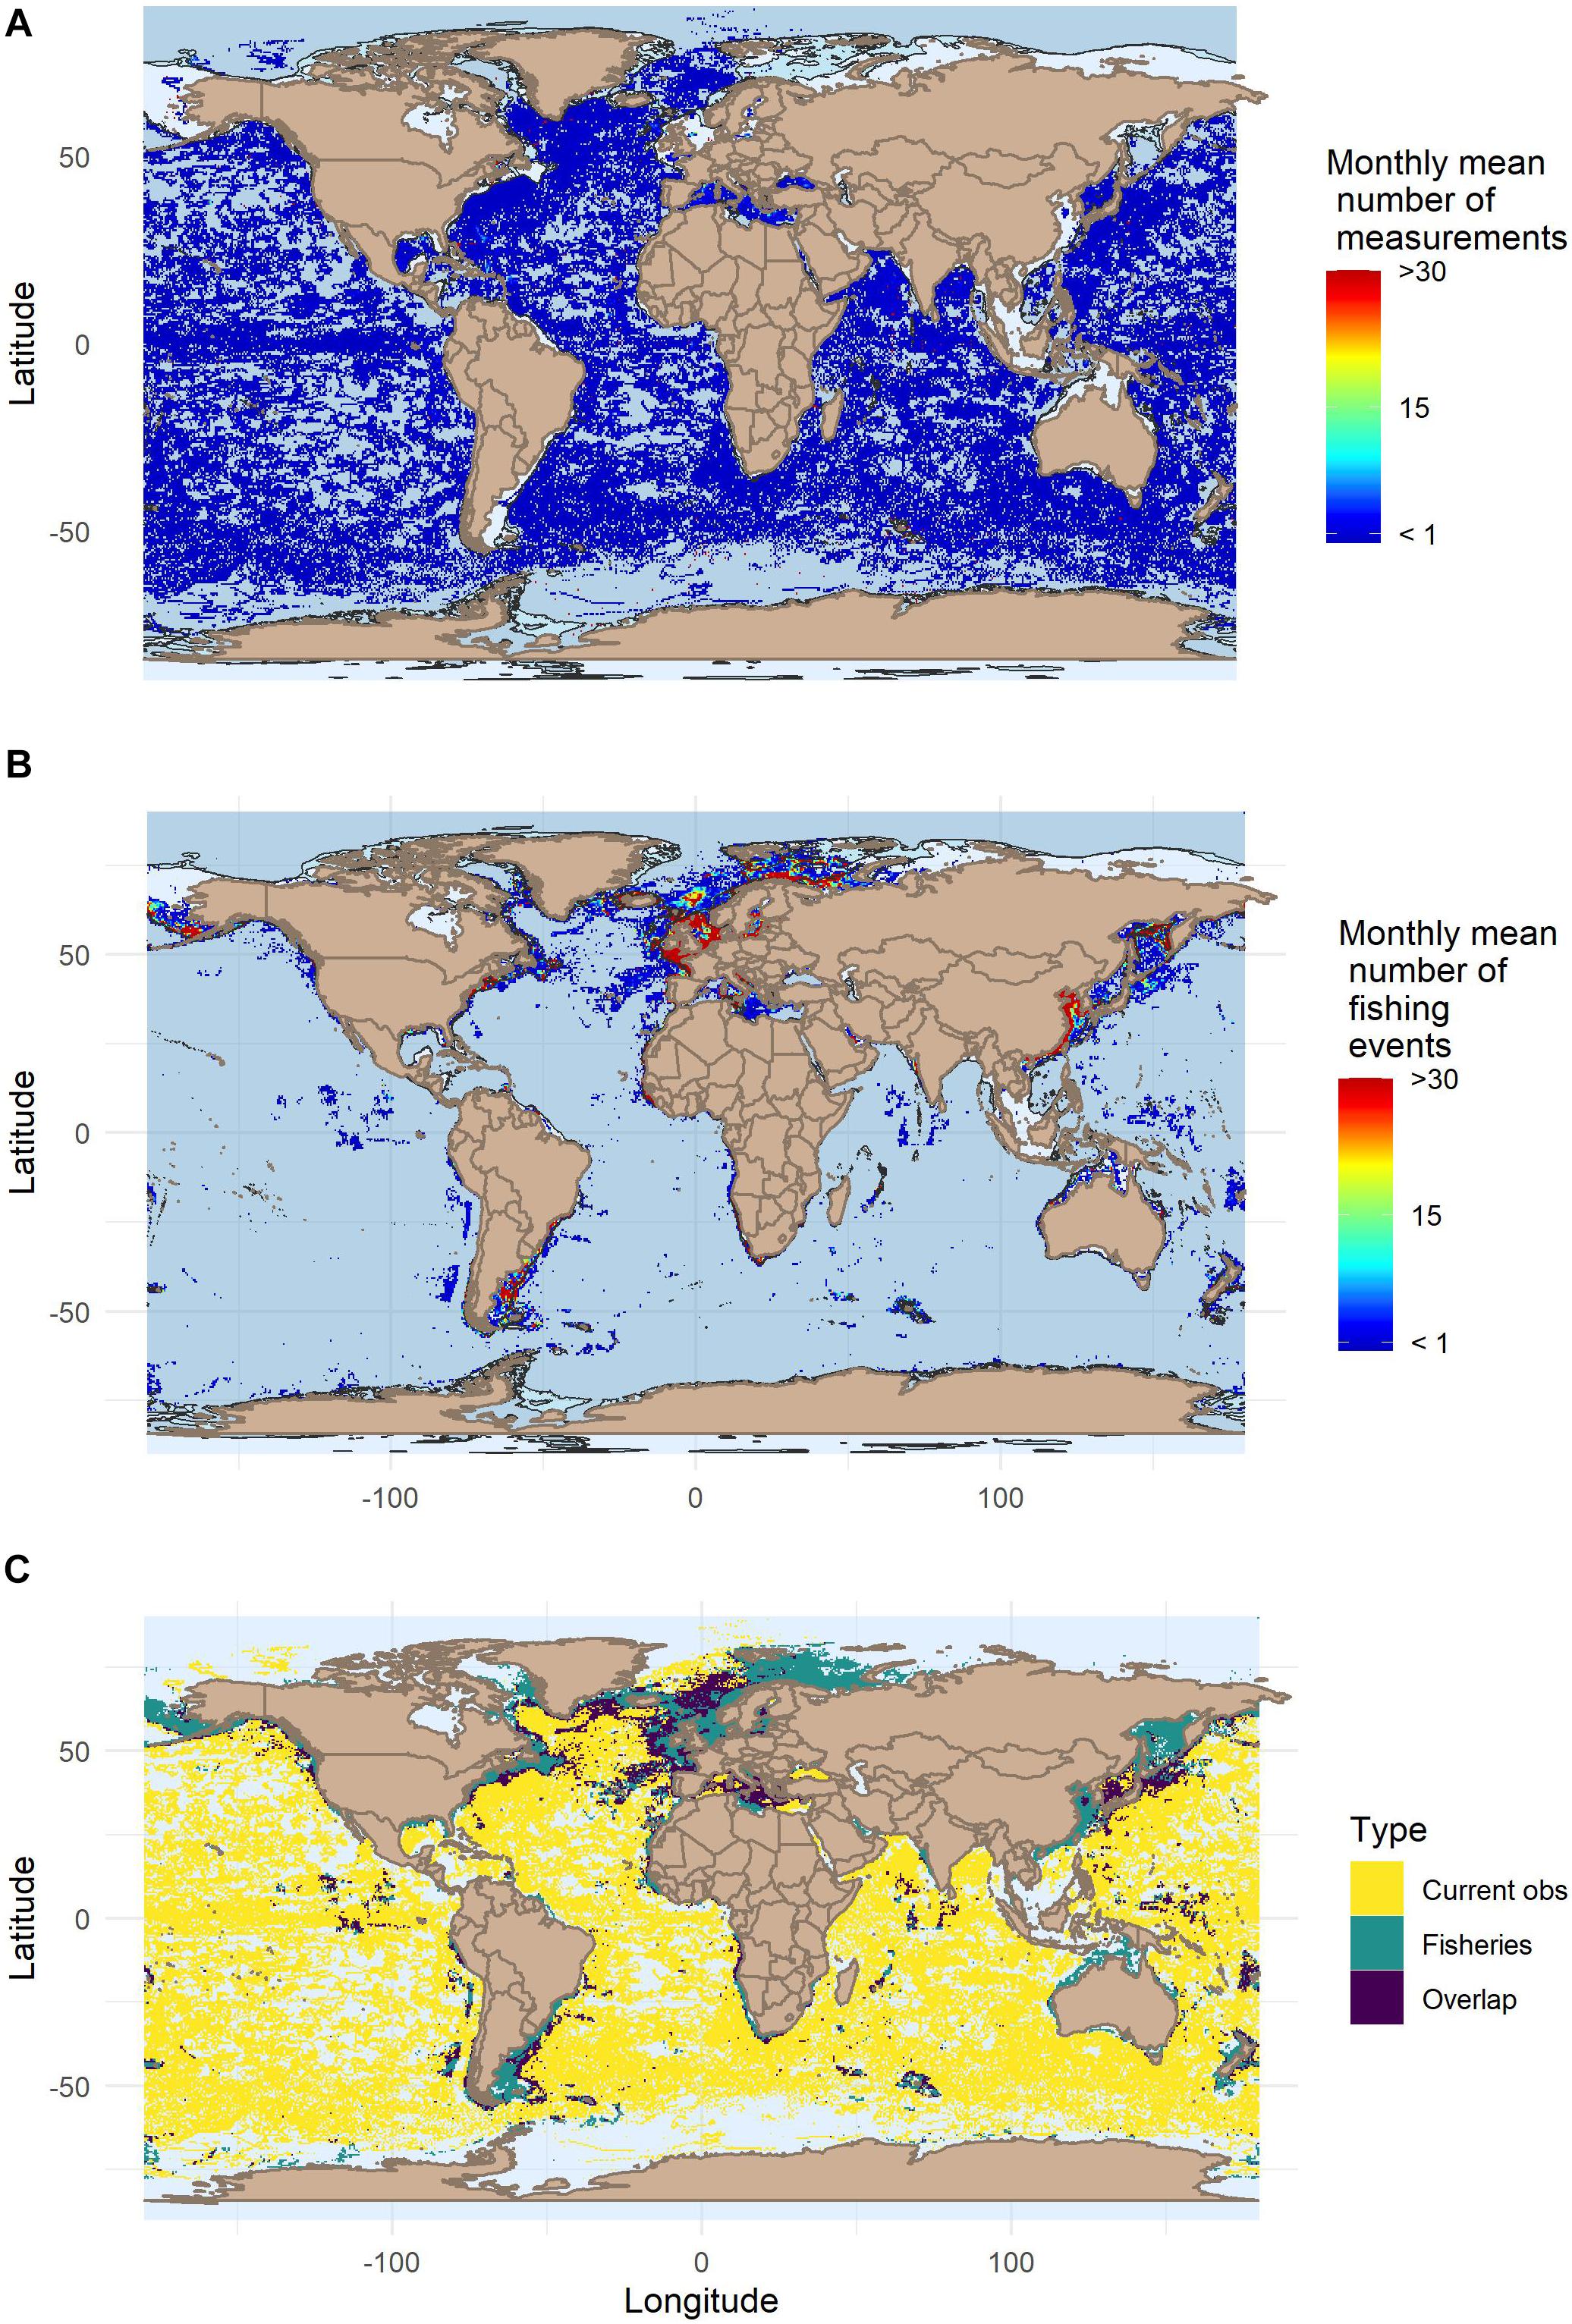
Figure 9. (A) Mean monthly number of sub-surface observations for the Global Ocean. (B) Mean monthly number of fishing events for judged suitable for potential data collection. (C) Distribution of both fishing events and ocean observations, with overlap between the two plotted in purple.
Inspection of the overlap between fishing events and ocean observations globally (Figure 9C) indicates that the North Atlantic focus region is one of the regions with highest overlap (Figure 7C). For future integration of fishing vessel-based ocean observation it will be important to identify where vessels and fleets operate in order to maximize complementarity with existing observation platform coverages. Notable exceptions to shelf seas being heavily fished can be seen in polar regions often covered by sea ice and the Indonesian archipelago. However, Indonesia is not actually a region of low fishing, but rather an area with low vessel AIS coverage (Kroodsma et al., 2018). Shelf or coastal regions will generally be associated with fishing, unless it is covered with sea ice, or fishing is prohibited.
The observation coverage percentages for the global ocean are similar to those shown in the previous focus regions with monthly observation coverage highest in the deep ocean at 6%. The deep ocean fishing coverage is lower than all focus regions at 1.5% (Figure 10, Table 4). In the shelf-break and shelf depth classes, fishing mean coverages are lower than New Zealand and the North Atlantic, but higher than Alaska. The differences in mean coverage percentages in all depth classes (Figure 10) are substantial and statistically significant (Table 4).
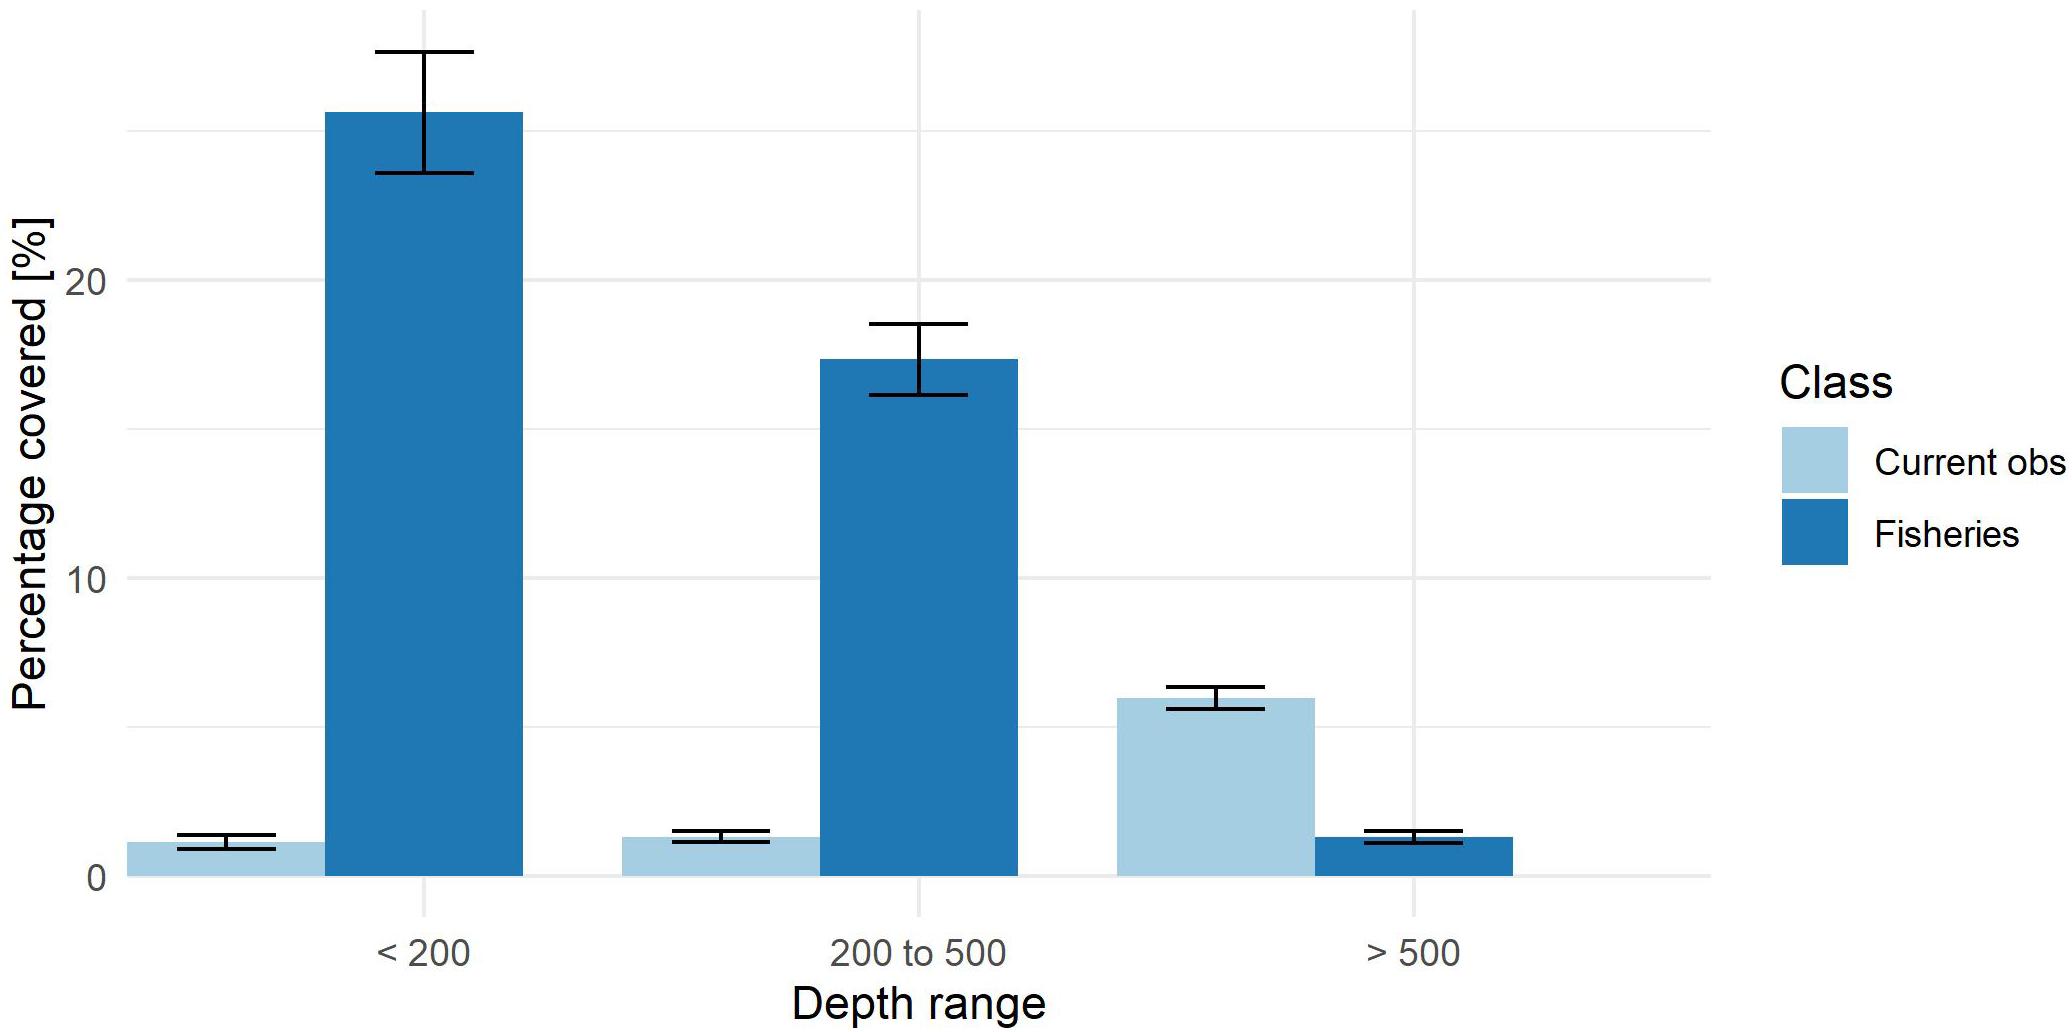
Figure 10. The Global Ocean monthly mean global sub-surface observation and fishing coverage per depth category.
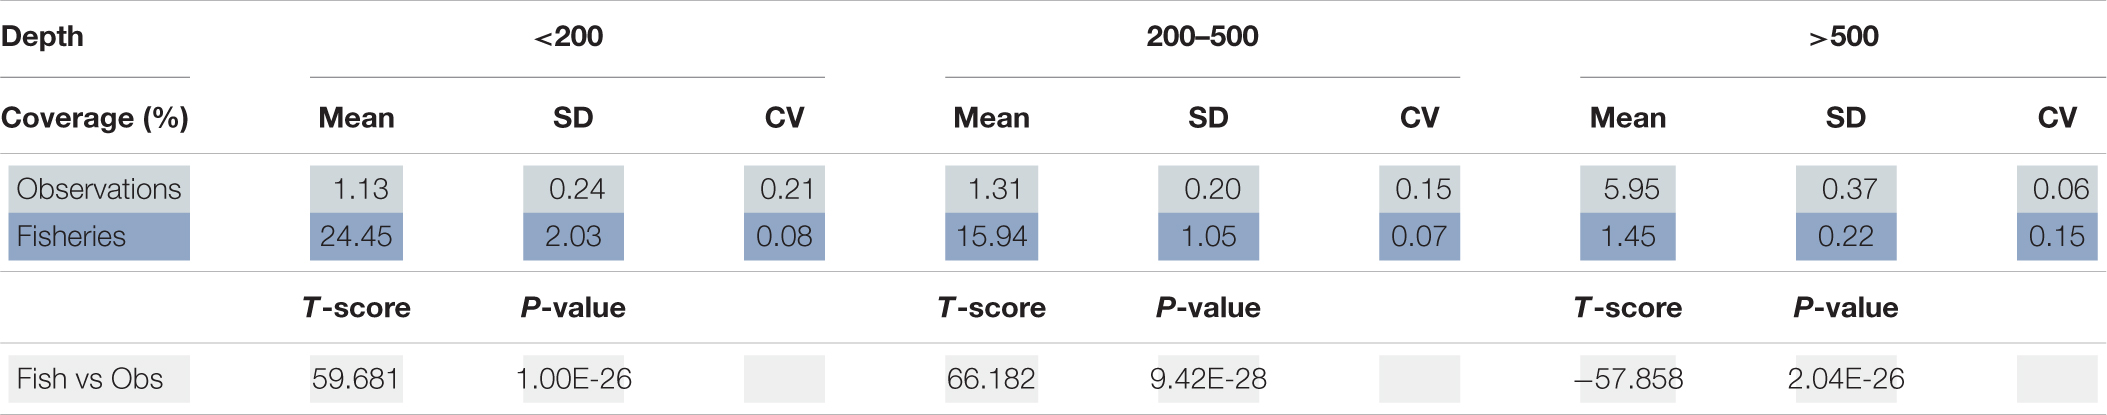
Table 4. Summary statistics comparing observation and fisheries coverage for the global ocean.
When spread across the globe, the monthly variability in coverage for both fisheries and observations shown by the SD error bars (Figure 10), and SD and CV (Table 4), is lower than any of the focus regions. All focus regions have a relatively high degree of seasonality that affects both ocean observation and fishing.
In the deep ocean with highest coverage percentage, sub-surface observation is dominated by Argo floats, while on the shelf and shelf-break there is a mixed contribution from other platform types, with XBTs dominating the shallowest shelf depth class observations; however, Argo floats allow the largest spatial coverage worldwide (Figure 11).
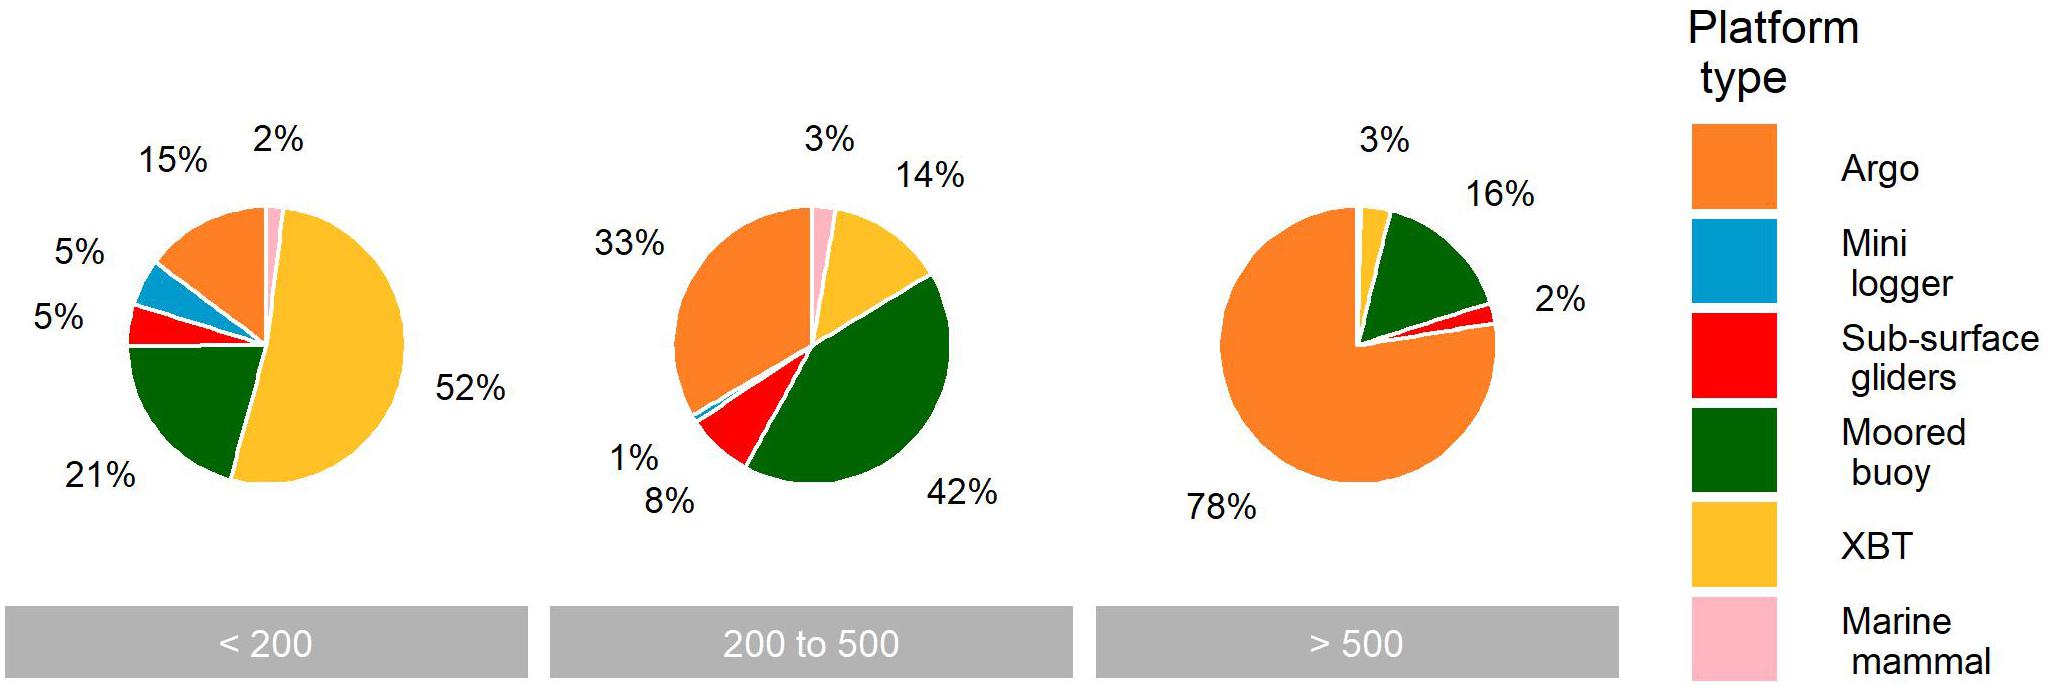
Figure 11. Percent contribution by each platform to total observational instances. Note: the number of observations a moored buoy delivers is capped by our methodology at once per day.
Pie charts for platform types, as well as fishing gear types globally, are included for all focus regions in the Supplementary Material (Supplementary Figures 5, 6, 10, 14, 16). Shallow shelf and coastal regions have less observation coverage due to a lack of Argo floats operating in these regions. Fishing activity well suited for oceanographic data collection takes place in these regions lacking sub-surface data.
Discussion
The spatial distribution of fishing activities that are well suited for sensor integration correspond to gaps in shelf and shelf-break sub-surface observation coverage. The results from New Zealand comparing local and global data sources indicate that estimates of existing observation coverage and fishing activity coverage from GFW is adequately accurate for presenting the intended large-scale coverage patterns when compared to local datasets. Indeed, the true opportunities for integrating ocean observation with fishing are likely underestimated in the presented analyses. When compared with GFW, the patterns shown by the local New Zealand fishing data are more spatially and temporally advantageous for ocean observation purposes.
Globally aggregated multi-platform databases, primarily EMODnet Physics, enable a wide range of large-scale gap analyses similar to those presented. An unexpected result of the global versus local New Zealand observation data was that there were two platforms present in the global data hubs, but not locally (Figure 3). Indeed, these two STM and SAM deep-ocean biophysical moorings used to exist (Nodder et al., 2016), but do not appear to have been sustained into 2017 or 2018. This possible false positive from JCOMMOPS is a testament to the importance of keeping meta-data updated for the coordination of global ocean observing.
Another interesting finding from the New Zealand comparison was that including the R/V CTD casts that were transmitted in near real-time did not substantially alter the resultant patterns (Figure 3). While these CTD casts did compose a significant fraction of the total shelf and coastal observations (Supplementary Figure 6), there were so few total observations here from either data set that they did not significantly alter the broader pattern.
The AIS based GFW data underestimated the fishing activity in both the shelf and deep seas in the New Zealand region (Figure 4). The fisheries in all three focus regions are often large scale and well monitored, with the majority of vessels being equipped with AIS. It is likely that the AIS based methods further underestimate fishing coverage in waters from the smaller scale fisheries especially of developing nations, such as Indonesia. Therefore, the presented opportunity of fishing activities to contribute to ocean observation is likely substantially under-estimated by analyses based upon GFW data.
The fishing industry varies substantially in scale, economy, and practices based upon location and fishery. Programs ranging from the Adriatic Sea to the Gulf of Maine indicate that using fishing gear as a platform for sensors has the potential to be applied to a diverse set of fisheries and regions. The pattern of coastal and shelf seas lacking in situ ocean observations, yet being heavily fished, is repeated beyond the three focus regions presented, throughout the world (Figure 9). Collaborative ocean observation systems are successfully demonstrated with a range of fisheries and diversity of locations (Manning and Pelletier, 2009; Leblond et al., 2010; Patti et al., 2016; Roughan et al., 2020). The spatial overlap of fishing with gaps in observation coverage shows a potential for data collection integrated with fishing to fill spatial gaps and compliment the observations from other platforms. Instrumented fishing vessels that fish close to a higher-resolution moored buoy or CTD could be used for instrument validation. In turn, fishing vessels could increase the effective observation range of higher resolution instruments. Gliders and fishing vessels are both well suited to observe shelf-break zones; however, vessels normally return to port with approaching storms. Coordination between glider and fishing vessel programs could enable gliders to be operated efficiently when their data would have the most impact in hazardous weather.
The spatial and temporal patterns of fishing will depend upon a range of factors including: weather, market forces (Little et al., 2009; Russo et al., 2015), ecosystem and biological factors (Gillis, 2001; Dickey-Collas et al., 2014), as well as management and regulations (Graham et al., 2007). Monthly maps of both fishing and observation coverage are included in the Supplementary Material (Supplementary Figures 1–3, 7, 8, 11, 12). In line with the conclusions of Kroodsma et al. (2018), we observed less seasonal fluctuation than expected. The relative seasonal consistency, especially in shallower water, was an unexpected finding that requires further vessel-by-vessel analysis to investigate the consistency of individual potential observation platforms.
On a global scale, the spatial distributions of fishing activities are an advantage, concentrating potential collection platforms where needed. Shallow shelf seas and near-coastal waters with variable benthic features and high maritime traffic put autonomous platforms and buoys at risk of bumping into the hazardous bottom (Siiriä et al., 2019). The physical irregularity of bathymetric features such as shelf edges disrupt water mass movement, often triggering mixing zones, oceanographic fronts and local upwelling (Cohen and Wright, 1979). Such areas are associated with high rates of primary production, forming the basis for productive ecosystems, which includes fish (Jennings et al., 2001; Scales et al., 2014). Since fish concentrates on these dynamic shelf seas and coastal waters, fishing efforts are focused here (Figures 3, 5, 7, 9). Frontal mixing zones, boundary currents, and other sub-mesoscale phenomena require more observations due to their compact spatial and short temporal scales (Schmidt et al., 2019). Resolving these interfaces is essential for physical ocean models, but a particular challenge in coastal waters (She et al., 2016, 2019).
Fishing vessels come into port at frequent intervals, offering opportunities for servicing and sensor calibration. Argo floats have an operational lifespan of four years, during and after which they are almost never recovered. Maintenance or calibration cannot be performed during deployment. Data accuracy, especially for parameters such as salinity, is problematic due to instrument drift (Ingleby and Huddleston, 2007). While this article has focused on subsurface temperature, regular trips back to ports suggest that fishing vessels and gears could also be suitable platforms for sensors requiring frequent calibration. Opportunities for regular calibration, combined with continued sensor developments, may enable fishing vessels to become cost-effective platforms for measuring biogeochemical parameters, as was examined during the NeXOS project (Martinelli et al., 2014, 2017; Memè et al., 2017; Sparnocchia et al., 2017). Experiments adding acoustic receivers to lobster traps in the eMOLT project for tagged animal telemetry yielded positive results (Goulette et al., 2014). Combining biogeochemical parameters with both the physical parameters discussed in this document and biological species catch data already recorded on fishing vessels means that fishing vessels can be a multidisciplinary platform for simultaneous observation of parameters in all three categories of Essential Ocean Variables (EOVs) as defined by the Global Ocean Observing System: Physics, Biogeochemistry, and Biology (Farcy et al., 2019). In a recent review, Farcy et al. (2019), identify developing an understanding of the dynamic coupling and feedback mechanisms between ocean physics, biogeochemistry, and biology as a key principle in guiding future coastal ocean observation technologies and programs. Both the FOOS and eMOLT programs add surface weather stations to some vessels, extending the data collection capabilities beyond EOVs to atmospheric Essential Climate Variables (Bojinski et al., 2014; Patti et al., 2016).
Directly coupling ocean data with catch data presents an array of opportunities to advance ecosystem-based fisheries management by correlating species distribution with oceanographic conditions (Carpi et al., 2015; Grüss et al., 2018; Jacox et al., 2020). The eMOLT bottom temperature data has recently been incorporated into lobster stock assessment to correct for temperature dependant changes in lobster catchability (Shank, 2020). Building mechanistic understandings of relationships between physical ocean conditions becomes increasingly important as a changing climate disrupts previous correlations between physics and biology (Schmidt et al., 2019; Litzow et al., 2020).
Integrated and multi-purpose data collection can improve communication and facilitate collaboration between marine sciences and the fishing industry, who despite sharing a range of common interests and goals, do not often directly interact. Commercial fishers live their lives subjected to the ocean conditions and weather and depend upon a healthy ocean ecosystem. Stakeholder involvement in collaborative research achieves a range of benefits beyond that of simply providing in situ marine data. These collaborations accomplish public outreach and education while helping to democratize the scientific process (Gawarkiewicz and Malek Mercer, 2019; Mackenzie et al., 2019). Fishers are often aware of phenomena and changes in the ocean before the scientific community (Gawarkiewicz et al., 2012; Stephenson et al., 2016) and can contribute to the process of developing new observing strategies and/or marine data products. Therefore, the benefits of engaging the fishing industry in the scientific process are not limited to simply using their gears and vessels as data collection platforms.
Conclusion
Commercial fishing vessels as oceanographic data collection platforms have been successful in a range of fisheries and locations. However, this approach is under-utilized. The results presented demonstrate that fishing activities are already taking place, not only where data are lacking, but also where it is needed by many ocean model and forecast users: in the dynamic shelf seas and coastal regions. While the deep oceans are best covered by autonomous Argo floats, fishing coverage is often over an order of magnitude higher than today’s observation coverage in shallower seas. Collaborative data collection with the fishing industry presents an opportunity to supplement the ocean observation systems of today. Data collection opportunities are not limited to sub-surface physical parameters, but they can be extended to co-locate a range of EOVs. Looking beyond physical oceanography, there are a host of potential multidisciplinary data uses and benefits to collaborative data collection with fisheries. Engaging the fishing industry as an ocean data collector is beneficial to both oceanographic and fisheries communities.
Data Availability Statement
New Zealand fisheries data were provided by the Ministry for Primary Industries (MPI) and prepared by David Middleton of Pisces Research Ltd. The resulting New Zealand specific figures were approved for release by the Fisheries New Zealand Data Management team. For all other analyses publicly available datasets were analyzed in this study. For section “Method Validation,” local current observation coverage data in New Zealand originate from: https://resources.marine.copernicus.eu/?option=com_csw&task=results?option=com_csw&view=details&product_id=INSITU_GLO_NRT_OBSERVATIONS, http://www.ifremer.fr/erddap/tabledap/ArgoFloats-index.html and https://researchdata.edu.au/imos-soop-expendable-real-time/476758. For all other analyses data are available here: http://www.emodnet-physics.eu/, http://www.soosmap.aq/#, http://www.jcommops.org/board, https://globalfishingwatch.org/.
Author Contributions
BV and CV conceived of the concept, performed analytics, and wrote much of the manuscript. KP-H advised on analytics and figures, as well as writing key sections on fisheries science, fisheries management, and the blue economy. MM, JJ, and JM wrote sections concerning existing programs and contributed to content on applications and utility in the scientific and oceanographic community. MM provided extensive guidance and revisions on data quality and validation, coastal ocean observation, and EU ocean observation frameworks. PG was primarily responsible for existing observation data sets, with additional input from JJ for New Zealand. BV and JJ produced all figures. All authors contributed to the article and approved the submitted version.
Funding
Some of the activities leading to this manuscript were partially funded by the Danish InnovationsFonden, Innobooster grant number: 8062-01143A. New Zealand analyses were supported the Moana Project, funded by New Zealand’s Ministry of Business, Innovation and Employment.
Conflict of Interest
CV and BV were employed by company Berring Data Collective, ApS.
The remaining authors declare that the research was conducted in the absence of any commercial or financial relationships that could be construed as a potential conflict of interest.
Acknowledgments
We are very grateful to EMODnet, and especially Marco Alba, for providing the global observation platform data necessary. As well as Global Fishing Watch, the New Zealand Ministry for Primary Industries (MPI), and David Middleton of Pisces Research Ltd. for supplying the fishing coverage data. New Zealand analyses were supported the Moana Project, funded by New Zealand’s Ministry of Business, Innovation and Employment. We would also like to thank Dr. Ole Eigaard, Dr. Hassan Moustahfid, Captain Joe Litchfeld, and Dr. Jun She for their expertise and perspectives on the different scientific areas covered in this research. Special thanks are given to Frank O’Hara Jr., Lynn Selboe, and Francis St Croix of the O’Hara Corporation fishing fleet as well as Richard Callow, and Tamme Bolt for their fishing industry perspectives. Lastly, we would like to thank Heidi Andreasen for her advice on fishing industry practices and for her continuous enthusiasm.
Supplementary Material
The Supplementary Material for this article can be found online at: https://www.frontiersin.org/articles/10.3389/fmars.2020.485512/full#supplementary-material
Footnotes
- ^ Data flows to and from EMODnet Physics include, but are not limited to: WMO/IOC/GOOS/IODE, JCOMMOPS, NOAA and IOOS, AODN and IMOS, EuroGOOS and regional affiliated OOSs, ODIN WESTPAC, GLOSS, Argo, Go-Ship, SOOP, Ocean Gliders, DBCP, Ocean Sites, VOS, ASAP, HFR, SOOS, DOOS, SAON, SailDrone, TMEDnet, ICES, CMEMS, and SeaDataNet (EMODnet, 2019). Acronyms defined in section “Glossary.”
References
Akpınar, A., and Charria, G. (2018). AtlantOS D4.5: Gap Analysis of Links Between Coastal and Open Ocean Networks. Brest. Available online at: https://www.atlantos-h2020.eu/download/deliverables/AtlantOS_D4.5.pdf
AOOS (2016). AOOS 101 | Alaska Ocean Observing System. Available online at: http://www.aoos.org/aoos-programs-projects/ (accessed November 19, 2019).
Argo (2019). Argo - Part of the Integrated Global Observation Strategy. Available online at: http://www.argo.ucsd.edu/ (accessed July 10, 2019).
Argo (2020). ArgoFloats Index. Available online at: http://www.ifremer.fr/erddap/tabledap/ArgoFloats-index.html (accessed April 5, 2020).
Astrolabe (2019). Astrolabe Expeditions. Available online at: http://www.astrolabe-expeditions.org/ (accessed December 1, 2019).
Aydoğdu, A., Pinardi, N., Pistoia, J., Martinelli, M., Belardinelli, A., and Sparnocchia, S. (2016). Assimilation experiments for the fishery observing system in the adriatic sea. J. Mar. Syst. 162, 126–136. doi: 10.1016/j.jmarsys.2016.03.002
Beamsley, B., Jakoboski, J., Roughan, M., de Souza, J. M. A. C., and Radford, J. (2020). “The moana project’s Tiro Moana (Eyes on the Sea): developing a sensor for ocean data collection by the seafood sector to improve ocean prediction in New Zealand,” in AGU Ocean Sciences Meeting. Available online at: https://agu.confex.com/agu/osm20/meetingapp.cgi/Paper/657359
Bojinski, S., Verstraete, M., Peterson, T. C., Richter, C., Simmons, A., and Zemp, M. (2014). The concept of essential climate variables in support of climate research, applications, and policy. Bull. Am. Meteorol. Soc. 95, 1431–1443. doi: 10.1175/BAMS-D-13-00047.1
Brewin, R. J. W., Hyder, K., Andersson, A. J., Billson, O., Bresnahan, P. J., Brewin, T. G., et al. (2017). Expanding aquatic observations through recreation. Front. Mar. Sci. 4:351. doi: 10.3389/fmars.2017.00351
Buch, E., Madsen, M. S., She, J., Stendel, M., Leth, O. K., Fjæraa, A. M., et al. (2019). Arctic in situ Data Availability. Available online at: https://insitu.copernicus.eu/library/reports/CopernicusArcticDataReportFinalVersion2.1.pdf (accessed December 12, 2020).
Calewaert, J. -B., Weaver, P., Gunn, V., Gorringe, P., and Novellino, A. (2016). The European Marine Data and Observation Network (EMODnet): Your Gateway to European Marine and Coastal Data. Cham: Springer, 31–46. doi: 10.1007/978-3-319-32107-3_4.
Carpi, P., Martinelli, M., Belardinelli, A., Russo, A., Arneri, E., Coluccelli, A., et al. (2015). Coupling an oceanographic model to a Fishery Observing System through mixed models: the importance of fronts for anchovy in the Adriatic Sea. Fish. Oceanogr. 24, 521–532. doi: 10.1111/fog.12126
Charria, G., Theetten, S., Vandermeirsch, F., Yelekçi, Ö., and Audiffren, N. (2017). Interannual evolution of (sub)mesoscale dynamics in the Bay of Biscay. Ocean Sci.13, 777–797. doi: 10.5194/os-13-777-2017
Cheng, L., Abraham, J., Hausfather, Z., and Trenberth, K. E. (2019). How fast are the oceans warming? Science 363, 128–129. doi: 10.1126/science.aav7619
Childress, J. L., Shearman, R. K., and Harte, M. (2010). Evaluation of Dungeness Crab Pots As Platforms Of Opportunity For Ocean-Observing Research. Seattle: Oregon State University. doi: 10.1109/OCEANS.2010.5664269.
Cohen, E. B., and Wright, W. R. (1979). Primary Poductivity on Gerorges Bank With an Explaination of Why its So High. Natl. Mar. Fish. Serv.
Copernicus in situ TAC (2019). Global Ocean- in-situ Near-Real-Time Observations. Available online at: https://resources.marine.copernicus.eu/?option=com_csw&task=results?option=com_csw&view=details&product_id=INSITU_GLO_NRT_OBSERVATIONS_013_030 (accessed June 30, 2020).
Dickey-Collas, M., Engelhard, G. H., Rindorf, A., Raab, K., Smout, S., Aarts, G., et al. (2014). Ecosystem-based management objectives for the North Sea: riding the forage fish rollercoaster. ICES J. Mar. Sci. 71, 128–142. doi: 10.1093/icesjms/fst075
Domingues, R., Kuwano-Yoshida, A., Chardon-Maldonado, P., Todd, R. E., Halliwell, G., Kim, H. -S., et al. (2019). Ocean observations in support of studies and forecasts of tropical and extratropical cyclones. Front. Mar. Sci.6:446. doi: 10.3389/fmars.2019.00446
EMODnet (2019). The European Marine Observation and Data Network. Available online at: http://www.emodnet.eu/physics (accessed July 10, 2019).
Falco, P., Belardinelli, A., Martinelli, M., Cingolani, N., Arneri, E., Russo, A., et al. (2011). A new observing system for the collection of fishery and oceanographic data. Mar. Res. CNR Fish. Sea Resour. 06, 1889–1895.
Falco, P., Belardinelli, A., Santojanni, A., Cingolani, N., Russo, A., and Arneri, E. (2007). An Observing System for the Collection of Fishery and Oceanographic Data. Available online at: www.ocean-sci.net/3/189/2007/ (accessed July 10, 2019).
Farcy, P., Durand, D., Charria, G., Painting, S. J., Tamminem, T., Collingridge, K., et al. (2019). Toward a European Coastal Observing Network to Provide Better Answers to Science and to Societal Challenges; The JERICO Research Infrastructure. Front. Mar. Sci.6:529. doi: 10.3389/fmars.2019.00529
Fedak, M. A. (2013). The impact of animal platforms on polar ocean observation. Deep Sea Res. Part II Top. Stud. Oceanogr. 88, 7–13. doi: 10.1016/J.DSR2.2012.07.007
Food and Agriculture Organization of the United Nations (2011). Fisheries Management. 4, Marine Protected Areas and Fisheries. Rome: Food and Agriculture Organization of the United Nations.
Freeman, E., Woodruff, S. D., Worley, S. J., Lubker, S. J., Kent, E. C., Angel, W. E., et al. (2017). ICOADS Release 3.0: a major update to the historical marine climate record. Int. J. Climatol. 37, 2211–2232. doi: 10.1002/joc.4775
Gaughan, P., Nolan, G., Puillat, I., Farcy, P., Mowlem, M., Seppala, J., et al. (2015). WP10 Deliverable 10.4 - Report on Potential New Sensors (Fishing Vessels and Voluntary Opportunity Ships). Brest. Available online at: https://www.jerico-ri.eu/download/filebase/jerico_fp7/deliverables/D10.4-Report-on-Potential-New-Sensors-Fishing-Vessels-and-Voluntary-Opportunity.pdf
Gawarkiewicz, G. G., Todd, R. E., Plueddemann, A. J., Andres, M., and Manning, J. P. (2012). Direct interaction between the Gulf Stream and the shelfbreak south of New England. Sci. Rep.2:553. doi: 10.1038/srep00553
Gawarkiewicz, G., and Malek Mercer, A. (2019). Partnering with fishing fleets to monitor ocean conditions. Ann. Rev. Mar. Sci.11, 391–411. doi: 10.1146/annurev-marine-010318-095201
Gillis, D. (2001). Influence of environment and fleet dynamics on catch rates of eastern Scotian Shelf cod through the early 1980s. ICES J. Mar. Sci. 58, 61–69. doi: 10.1006/jmsc.2000.0990
Global Fishing Watch (2019). Global Fishing Watch. Available online at: www.globalfishingwatch.org (accessed July 12, 2019).
Goni, G., Goni, G., Goni, G., Goni, G., Goni, G., Goni, G., et al. (2010). The Ship of Opportunity Program. in Proceedings of OceanObs’09: Sustained Ocean Observations and Information for Society. (Paris: European Space Agency), 366–383. doi: 10.5270/OceanObs09.cwp.35.
Goulette, G. S., Hawkes, J. P., Kocik, J. F., Manning, J. P., Music, P. A., Wallinga, J. P., et al. (2014). Opportunistic acoustic telemetry platforms: benefits of collaboration in the gulf of maine. Fisheries 39, 441–450. doi: 10.1080/03632415.2014.943740
Graham, N., Ferro, R. S. T., Karp, W. A., and MacMullen, P. (2007). Fishing practice, gear design, and the ecosystem approach - Three case studies demonstrating the effect of management strategy on gear selectivity and discards. ICES J. Mar. Sci. 64, 744–750. doi: 10.1093/icesjms/fsm059
Grüss, A., Drexler, M. D., Ainsworth, C. H., Babcock, E. A., Tarnecki, J. H., and Love, M. S. (2018). Producing distribution maps for a spatially-explicit ecosystem model using large monitoring and environmental databases and a combination of interpolation and extrapolation. Front. Mar. Sci. 5:16. doi: 10.3389/fmars.2018.00016
Haller, M., Janssen, F., Siddorn, J., Petersen, W., and Dick, S. (2015). Evaluation of numerical models by ferrybox and fixed platform data in the north sea. Ocean Sci. Discuss 12, 355–401. doi: 10.5194/osd-12-355-2015
Hussey, N. E., Kessel, S. T., Aarestrup, K., Cooke, S. J., Cowley, P. D., Fisk, A. T., et al. (2015). Aquatic animal telemetry: a panoramic window into the underwater world. Science 348, 1255642–1255642. doi: 10.1126/science.1255642
Ianelli, J. N., Gauvin, J., Stram, D. L., Haflinger, K., and Stabeno, P. (2010). Temperature / depth data collections on Bering Sea groundfish vessels to reduce bycatch. North Pacific Res. Board Final Rep. 731:56.
ICDC (2019). Expendable Bathythermograph (XBT). Available online at: https://icdc.cen.uni-hamburg.de/1/daten/ocean/xbt.html (accessed August 25, 2019).
IMOS (2020). IMOS - Soop Expendable Bathythermographs (xbt) Research Group - xbt Real-Time Data. Herford: IMOS
Ingleby, B., and Huddleston, M. (2007). Quality control of ocean temperature and salinity profiles — Historical and real-time data. J. Mar. Syst. 65, 158–175. doi: 10.1016/J.JMARSYS.2005.11.019
IOOS (2019). Integrated Ocean Observing System: Environmental Sensor Map. Available online at: https://sensors.ioos.us/ (accessed March 3, 2020).
Jacox, M. G., Alexander, M. A., Siedlecki, S., Chen, K., Kwon, Y. O., Brodie, S., et al. (2020). Seasonal-to-interannual prediction of North American coastal marine ecosystems: forecast methods, mechanisms of predictability, and priority developments. Prog. Oceanogr.183:102337. doi: 10.1016/j.pocean.2020.102307
JCOMMOPS (2019). JCOMMOPS - The WMO-IOC Joint Technical Commission for Oceanography and Marine Meteorology in-situ Observing Programmes Support Centre. Available online at: http://www.jcommops.org/board (accessed July 10, 2019).
Jennings, S., Kaiser, M. J., and Reynolds, J. D. (2001). Marine Fisheries Ecology. Blackwell Science Available online at: https://books.google.be/books?hl=en&lr=&id=Rz8z1ej-i3QC&oi=fnd&pg=PR5&dq=Marine+Fisheries+Ecology&ots=8LI79fsIkK&sig=C5Su544AEm-iaTgbTN6uIsrUU9c#v=onepage&q=Marine Fisheries Ecology&f=false (accessed July 10, 2019).
Karlson, B., Möller, K., Karlson, B., Artigas, F., Créach, V., Louchart, A., et al. (2017). D2.2 Report on the status of sensors used for measuring nutrients, biology-related optical properties, variables of the marine carbonate system, and for coastal profiling, within the JERICO network and, more generally, in the European context. in WP 2 (Harmonization of technologies and methodologies - technical strategy), H2020 JERICO – NEXT Project “Joint European Research Infrastructure network for Coastal Observatory – Novel European eXpertise for coastal observaTories,”. Available online at: http://www.jerico-ri.eu/download/jerico-next-deliverables/JERICO-NEXT-Deliverable-2.2.pdf (accessed December 8, 2019).
Killick, R. E., Rayner, N. A., Atkinson, C. P., and Kennedy, J. J. (2019). The EN4 dataset: temperature and salinity analyses and observations from 1900 to the present day. Ocean Obs.
Kroodsma, D. A., Mayorga, J., Hochberg, T., Miller, N. A., Boerder, K., Ferretti, F., et al. (2018). Tracking the global footprint of Fisheries. Science 908, 904–908. doi: 10.1126/science.aao5646
Lamouroux, J., Charria, G., De Mey, P., Raynaud, S., Heyraud, C., Craneguy, P., et al. (2016). Objective assessment of the contribution of the RECOPESCA network to the monitoring of 3D coastal ocean variables in the Bay of Biscay and the English Channel. Ocean Dyn. 66, 567–588. doi: 10.1007/s10236-016-0938-y
Leblond, E., Lazure, P., Laurans, M., Rioual, C., Woerther, P., Quemener, L., et al. (2010). The RECOPESCA Project: A New Example Of Participative Approach To Collect Fisheries And In Situ Environmental Data. Available online at: https://www.researchgate.net/publication/48382978 (accessed July 10, 2019).
Li, B., Tanaka, K. R., Chen, Y., Brady, D. C., and Thomas, A. C. (2017). Assessing the quality of bottom water temperatures from the finite-volume community ocean model (FVCOM) in the Northwest Atlantic Shelf region. J. Mar. Syst. 173, 21–30. doi: 10.1016/j.jmarsys.2017.04.001
Little, L. R., Punt, A. E., Mapstone, B. D., Begg, G. A., Goldman, B., and Williams, A. J. (2009). An agent-based model for simulating trading of multi-species fisheries quota. Ecol. Modell. 220, 3404–3412. doi: 10.1016/j.ecolmodel.2009.08.004
Litzow, M. A., Hunsicker, M. E., Bond, N. A., Burke, B. J., Cunningham, C. J., Gosselin, J. L., et al. (2020). The changing physical and ecological meanings of North Pacific Ocean climate indices. Proc. Natl. Acad. Sci. U.S.A. 117:201921266. doi: 10.1073/pnas.1921266117
López, A., Wilkin, J., and Levin, J. (2020). Doppio – A ROMS-based circulation model for the mid-atlantic bight and gulf of maine: configuration and comparison to integrated coastal observing network observations. Geosci. Model Dev.
Lozier, M. S., Li, F., Bacon, S., Bahr, F., Bower, A. S., Cunningham, S. A., et al. (2019). A sea change in our view of overturning in the subpolar North Atlantic. Science 363, 516–521. doi: 10.1126/science.aau6592
Lucchetti, A., Belardinelli, A., D’Andrea, L., Marèeta, B., Martinelli, M., Russo, T., et al. (2018). Small pelagic purse seines in the Adriatic Sea: a spatial analysis and technical overview in relation to mediterranean regulation provisions. Mar. Policy 98, 104–114. doi: 10.1016/J.MARPOL.2018.09.031
Mackenzie, B., Celliers, L., Assad, L. P. de F., Heymans, J. J., Rome, N., Thomas, J., et al. (2019). The role of stakeholders in creating societal value from coastal and ocean observations. Front. Mar. Sci. 6:137. doi: 10.3389/fmars.2019.00137
Manning, J., and Pelletier, E. (2009). Environmental monitors on lobster traps (eMOLT): long-term observations of New England’s bottom-water temperatures. J. Oper. Oceanogr. 2, 25–33. doi: 10.1080/1755876X.2009.11020106
March, D., Boehme, L., Tintoré, J., Vélez-Belchi, P. J., and Godley, B. J. (2019). Towards the integration of animal-borne instruments into global ocean observing systems. Glob. Chang. Biol.26, 586-596. doi: 10.1111/gcb.14902
Martinelli, M., Belardinelli, A., Penna, P., Croci, C., Domenichetti, F., Campanelli, A., et al. (2017). Next generation Low-Cost Multifunctional Web Enabled Ocean Sensor Systems Empowering Marine, Maritime and Fisheries Management. D 8.2 Validation Report. 170228-NXS-WP8_D.8.2 –v5.4, Brest, IEEE 57–64.
Martinelli, M., Campanelli, A., Sparnocchia, S., Ismar, C. N. R., Rolin, J., Quemener, L., et al. (2014). Deliverable D7.2– Preliminary studies and choice of new probes. in FP7 Ocean 2013 NeXOS project “Next generation Low-Cost Multifunctional Web Enabled Ocean Sensor Systems Empowering Marine, Maritime and Fisheries Management” Available online at: http://www.nexosproject.eu (accessed October 30, 2020).
Martinelli, M., Falco, P., Belardinelli, A., Cingolani, N., Arneri, E., Russo, A., et al. (2012). Fishery observing system (FOS): a tool for collecting oceanographic data and data on fish in the Adriatic. Oper. Oceanogr. Italy Towar. a Sustain. Manag. Sea 9, 277–284.
Martinelli, M., Guicciardi, S., Penna, P., Belardinelli, A., Croci, C., Domenichetti, F., et al. (2016). Evaluation of the oceanographic measurement accuracy of different commercial sensors to be used on fishing gears. Ocean Eng. 111, 22–33. doi: 10.1016/J.OCEANENG.2015.10.037
Mateus, M., Canelas, R., Pinto, L., and Vaz, N. (2020). When tragedy strikes: potential contributions from ocean observation to search and rescue operations after drowning accidents. Front. Mar. Sci.7:55. doi: 10.3389/fmars.2020.00055
Meinig, C., Burger, E. F., Cohen, N., Cokelet, E. D., Cronin, M. F., Cross, J. N., et al. (2019). Public private partnerships to advance regional ocean observing capabilities: a saildrone and NOAA-PMEL case study and future considerations to expand to global scale observing. Front. Mar. Sci. 6:448. doi: 10.3389/fmars.2019.00448
Memè, S., Delory, E., Felgines, M., Pearlman, J., Pearlman, F., del Rio, J., et al. (2017). “NeXOS - Next generation, Cost-effective, Compact, Multifunctional Web Enabled Ocean Sensor Systems,” in Proceedings of the OCEANS 2017 - Anchorage (Anchorage, AK: IEEE), 1–10. doi: 10.1109/OCE.
MetOcean Solutions (2020). Moana Project: Revolutionising Ocean Forecasting to Underpin New Zealand’s Blue Economy. Available online at: https://www.moanaproject.org/ (accessed January 10, 2020).
Möller, K. O., Petersen, W., Nair, R., Greenwood, N., Read, C., Laes-Huon, A., et al. (2019). D2.5 Report on Best Practice in the utilization of sensors used for measuring nutrients, biology related optical properties, variables of the marine carbonate system, and for coa. in WP 2 (Harmonization of technologies and methodologies - technical strategy), H2020 JERICO – NEXT Project “Joint European Research Infrastructure network for Coastal Observatory – Novel European eXpertise for coastal observaTories,”. Available online at: http://www.jerico-ri.eu/download/jerico-next-deliverables/JERICO_NEXT_Deliverable_2.5_Version 1.0.pdf (accessed December 8, 2020).
NERACOOS (2019). North Eastern Regional Association of Coastal Ocean Observing Systems: Real-time Data Products. Available online at: http://www.neracoos.org/datatools/realtime (accessed September 12, 2019).
Nodder, S. D., Chiswell, S. M., and Northcote, L. C. (2016). Annual cycles of deep-ocean biogeochemical export fluxes in subtropical and subantarctic waters, southwest Pacific Ocean. J. Geophys. Res. Ocean. 121, 2405–2424. doi: 10.1002/2015JC011243
Pante, E., and Simon-Bouhet, B. (2013). marmap: a package for importing, plotting and analyzing bathymetric and topographic data in R. PLoS One 8:e73051. doi: 10.1371/journal.pone.0073051
Patel, S. H., Barco, S. G., Crowe, L. M., Manning, J. P., Matzen, E., Smolowitz, R. J., et al. (2018). Loggerhead turtles are good ocean-observers in stratified mid-latitude regions. Estuar. Coast. Shelf Sci. 213, 128–136. doi: 10.1016/j.ecss.2018.08.019
Patti, B., Martinelli, M., Aronica, S., Belardinelli, A., Penna, P., Bonanno, A., et al. (2016). The fishery and oceanography observing system (FOOS): a tool for oceanography and fisheries science. J. Oper. Oceanogr. 9, s99-s118. doi: 10.1080/1755876X.2015.1120961
Puillat, I., Farcy, P., Durand, D., Karlson, B., Petihakis, G., Seppälä, J., et al. (2016). Progress in marine science supported by European joint coastal observation systems: the JERICO-RI research infrastructure. J. Mar. Syst. 162, 1–3. doi: 10.1016/J.JMARSYS.2016.06.004
Reddy, P. (2019). Fisheries (Reporting) Regulations 2017. Available online at: http://legislation.govt.nz/regulation/public/2017/0154/latest/096be8ed819197d0.pdf (accessed April 7, 2020).
Roughan, M., de Souza, J. M. A. C., and Jakoboski, J. (2020). The Moana Project: Crowd Sourcing Ocean Data Collection Through the Seafood Sector to Improve Ocean Models, Supporting the Blue Economy. San Diego, CA: AGU Ocean Sciences Meeting.
Rousseau, Y., Watson, R. A., Blanchard, J. L., and Fulton, E. A. (2019). Evolution of global marine fishing fleets and the response of fished resources. Proc. Natl. Acad. Sci. U.S.A. 116, 12238–12243. doi: 10.1073/pnas.1820344116
Russo, T., D’Andrea, L., Parisi, A., Martinelli, M., Belardinelli, A., Boccoli, F., et al. (2016). Assessing the fishing footprint using data integrated from different tracking devices: issues and opportunities. Ecol. Indic. 69, 818–827. doi: 10.1016/J.ECOLIND.2016.04.043
Russo, T., Pulcinella, J., Parisi, A., Martinelli, M., Belardinelli, A., Santojanni, A., et al. (2015). Modelling the strategy of mid-water trawlers targeting small pelagic fish in the Adriatic Sea and its drivers. Ecol. Modell. 300, 102–113. doi: 10.1016/J.ECOLMODEL.2014.12.001
Scales, K. L., Miller, P. I., Hawkes, L. A., Ingram, S. N., Sims, D. W., and Votier, S. C. (2014). On the front line: Frontal zones as priority at-sea conservation areas for mobile marine vertebrates. J. Appl. Ecol. 51, 1575–1583. doi: 10.1111/1365-2664.12330
Schmidt, J. O., Bograd, S. J., Arrizabalaga, H., Azevedo, J. L., Barbeaux, S. J., Barth, J. A., et al. (2019). Future ocean observations to connect climate, fisheries and marine ecosystems. Front. Mar. Sci.6:550. doi: 10.3389/fmars.2019.00550
Serreze, M. C., Walsh, J. E., Chapin III, F. S., Osterkamp, T., Dyurgerov, M., Romanovsky, V., et al. (2000). Observational evidence of recent change in the northern high-latitude environment. Clim. Change 46, 159–207. doi: 10.1023/A:1005504031923
Shank, B. (2020). “Lobster6f6; environmentally-mediated survey catchability,” in Lobster modelers meeting 2020 (New Castle, NH: NOAA North East Fisheries Science Center), 1–6.
She, J., Allen, I., Buch, E., Crise, A., Johannessen, J. A., Le Traon, P. -Y., et al. (2016). Developing European operational oceanography for blue growth, climate change adaptation and mitigation, and ecosystem-based management. Ocean Sci.12, 953–976. doi: 10.5194/os-12-953-2016
She, J., Muñiz Piniella, Á., Benedetti-Cecchi, L., Boehme, L., Boero, F., Christensen, A., et al. (2019). An integrated approach to coastal and biological observations. Front. Mar. Sci.6:314. doi: 10.3389/fmars.2019.00314
Siiriä, S., Roiha, P., Tuomi, L., Purokoski, T., Haavisto, N., and Alenius, P. (2019). Applying area-locked, shallow water Argo floats in Baltic Sea monitoring. J. Oper. Oceanogr. 12, 58–72. doi: 10.1080/1755876X.2018.1544783
Smith, S. R., Alory, G., Andersson, A., Asher, W., Baker, A., Berry, D. I., et al. (2019). Ship-based contributions to global ocean, weather, and climate observing systems. Front. Mar. Sci.6:434. doi: 10.3389/fmars.2019.00434
SOOS, and EMODnet (2019). SOOS Map. Available online at: http://www.soosmap.aq/# (accessed February 21, 2020).
Sparnocchia, S., Martinelli, M., del Rio, J., Belardinelli, A., Penna, P., Domenichetti, F., et al. (2017). Deliverable 9.3 Mediterranean Sea Demonstration Report: Report on Demonstration of Sensor Systems in The Mediterranean. Ancona. Available online at: http://www.nexosproject.eu/sites/default/files/170831-NXS-WPX_D.9.3-v.1.4_29082017_Final.pdf.
Sparnocchia, S., Nair, R., Petihakis, G., Aydoğdu, A., Dobricic, S., Farcy, P., et al. (2016). An interlinked coastal observatory network for Europe. J. Oper. Oceanogr. 9, s193-s201. doi: 10.1080/1755876X.2015.1114808
Stephenson, R. L., Paul, S., Pastoors, M. A., Kraan, M., Holm, P., Wiber, M., et al. (2016). Integrating fishers’ knowledge research in science and management. ICES J. Mar. Sci. 73, 1459–1465. doi: 10.1093/icesjms/fsw025
Szekely, T., Bezaud, M., Pouliquen, S., Reverdin, G., and Charria, G. (2017). CORA-IBI, Coriolis Ocean Dataset for Reanalysis for the Ireland-Biscay-Iberia region. SEANOE. doi: 10.17882/50360
Tanhua, T., McCurdy, A., Fischer, A., Appeltans, W., Bax, N., Currie, K., et al. (2019). What we have learned from the framework for ocean observing: evolution of the global ocean observing system. Front. Mar. Sci. 6:471. doi: 10.3389/fmars.2019.00471
Teng, C. -C., Cucullu, S., Mcarthur, S., Kohler, C., Burnett, B., and Bernard, L. (2009). Buoy vandalism experienced by NOAA national data buoy center. Oceans 2009, 1–8.
von Schuckmann, K., Palmer, M. D., Trenberth, K. E., Cazenave, A., Chambers, D., Champollion, N., et al. (2016). An imperative to monitor Earth’s energy imbalance. Nat. Clim. Chang. 6, 138–144. doi: 10.1038/nclimate2876
Wright, S., Hull, T., Sivyer, D. B., Pearce, D., Pinnegar, J. K., Sayer, M. D. J., et al. (2016). SCUBA divers as oceanographic samplers: The potential of dive computers to augment aquatic temperature monitoring. Sci. Rep. 6:30164. doi: 10.1038/srep30164
Glossary
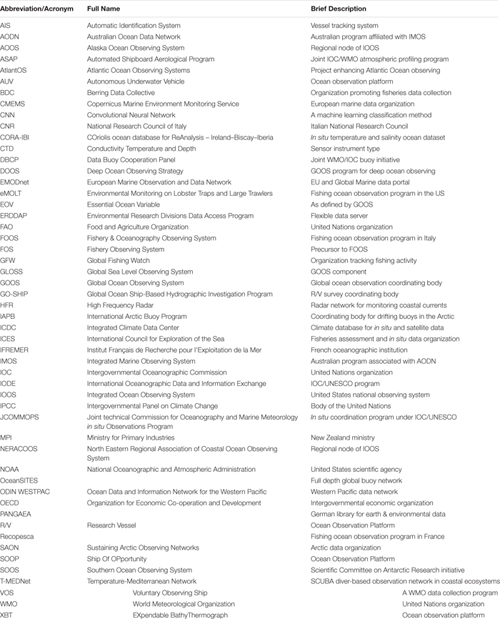
Keywords: Ocean observation networks, science-industry cooperation, data collection, vessels of opportunity, shelf seas, oceanography, fisheries, data gaps
Citation: Van Vranken C, Vastenhoud BMJ, Manning JP, Plet-Hansen KS, Jakoboski J, Gorringe P and Martinelli M (2020) Fishing Gear as a Data Collection Platform: Opportunities to Fill Spatial and Temporal Gaps in Operational Sub-Surface Observation Networks. Front. Mar. Sci. 7:485512. doi: 10.3389/fmars.2020.485512
Received: 17 July 2019; Accepted: 23 September 2020;
Published: 29 October 2020.
Edited by:
Gilles Reverdin, Centre National de la Recherche Scientifique (CNRS), FranceReviewed by:
Emanuele Organelli, CNRS, FranceGuillaume Charria, Institut Français de Recherche pour l’Exploitation de la Mer (IFREMER), France
Copyright © 2020 Van Vranken, Vastenhoud, Manning, Plet-Hansen, Jakoboski, Gorringe and Martinelli. This is an open-access article distributed under the terms of the Creative Commons Attribution License (CC BY). The use, distribution or reproduction in other forums is permitted, provided the original author(s) and the copyright owner(s) are credited and that the original publication in this journal is cited, in accordance with accepted academic practice. No use, distribution or reproduction is permitted which does not comply with these terms.
*Correspondence: Cooper Van Vranken, cooper@berringdatacollective.com