Modeling the Dynamics of Multispecies Fisheries: A Case Study in the Coastal Water of North Yellow Sea, China
 Jia Wo
 Chongliang Zhang
 Xindong Pan1
  Binduo Xu
 Ying Xue
- 1College of Fisheries, Ocean University of China, Qingdao, China
- 2Laboratory for Marine Fisheries and Aquaculture, Qingdao National Laboratory for Marine Science and Technology, Qingdao, China
Ecosystem models have been developed for detecting community responses to fishing pressure and have been widely applied to predict the ecological effects of fisheries management. Key challenges of ecosystem modeling lie in the insufficient quantity and quality of data, which is unfortunately common in the marine ecosystems of many developing countries. In this study, we aim to model the dynamics of multispecies fisheries under data-limited circumstances, using a multispecies size-spectrum model (MSSM) implemented in the coastal ecosystem of North Yellow Sea, China. To make most of available data, we incorporated a range of data-limited methods for estimating the life-history parameters and conducted model validation according to empirical data. Additionally, sensitivity analyses were conducted to evaluate the impacts of input parameters on model predictions regarding the uncertainty of data and estimating methods. Our results showed that MSSM could provide reasonable predictions of community size spectra and appropriately reflect the community composition in the studied area, whereas the predictions of fisheries yields were biased for certain species. Errors in recruitment parameters were most influential on the prediction of species abundance, and errors in fishing efforts substantially affected community-level indicators. This study built a framework to integrate parameter estimation, model validation, and sensitivity analyses altogether, which could guide model development in similar mixed and data-limited fisheries and promote the use of size-spectrum model for ecosystem-based fisheries management.
Introduction
The impacts of fisheries on marine ecosystems have attracted widespread concerns in recent decades (Plank et al., 2017). The situation is more severe for mixed fisheries, in which technical and trophic interactions have substantial impacts on dynamics of ecosystems (Jennings and Rice, 2011). This fact leads to increasing recognition that fisheries management should move toward comprehensive ecosystem considerations (Garcia, 2003; Hollowed et al., 2011), calling a shift from species-specific stock management to more general “ecosystem-based fisheries management” (EBFM) (Pitcher, 2008; Jennings and Rice, 2011). To make the idea of EBFM operational, ecosystem models are necessary to predict future changes in fisheries yields and ecosystem dynamics with respect to different fishing patterns and management regimes. Recent decades have witnessed growing interest and a bloom of ecosystem models (Blanchard et al., 2012; Jacobsen et al., 2013, 2017). However, ecosystem models usually include a multitude of parameters and require intense efforts in data collection and model validation (Garcia, 2003). Therefore, the application of ecosystem models is often restricted due to data limitation and technical complexity. For most developing countries, data of ecosystems are typically limited and poor in resolution due to lacking long-term, consistent observation programs. Meanwhile, it is in these regions that ecosystem models and EBFM are urgently needed, as their fisheries are often mixed in species and inadequate in management (Hollowed et al., 2011). Therefore, we advocate that substantial research efforts are needed to clarify the implementation of ecosystem models to deliver reliable fishery projections under insufficient data conditions.
Among the variety of marine ecosystem models, multispecies size-spectrum models (MSSMs) provide a feasible solution to simulate ecosystems in data-limited situations (Andersen and Beyer, 2006; Hartvig et al., 2011). Based on theoretical foundation of the notable regularity of size spectra hidden in the complexity of food webs, MSSM is characterized by a small number of parameters, low computational requirements, and solid mechanistic bases for simulating fisheries dynamics (Sheldon et al., 1972; de Roos and Persson, 2001; Jennings and Brander, 2010). The model relates the changes in size spectra to vital processes at the individual level, such as food intake, growth, and predation, which provides a conceptual foundation for emerging community characteristics (Andersen and Beyer, 2006; Andersen and Pedersen, 2010). MSSMs incorporate several critical ecological properties and provide a promising approach to fisheries research (Andersen and Pedersen, 2010; Andersen et al., 2016a). Many studies have used this model to investigate the ecosystem consequences of fisheries (Travers et al., 2007; Blanchard et al., 2017), for instance, to evaluate the responses of population and community to various fishing strategies (Guiet et al., 2016), the effects of fishing selectivity (Houle et al., 2012), and the balance of multiple objectives for management decisions (Blanchard et al., 2014).
In this study, we attempt to build the MSSM in a coastal ecosystem of the North Yellow Sea (NYS), China. The studied area represents a traditional fishing ground of multispecies fisheries with a long history of overexploitation (Wang et al., 1993). The intense fishing pressures have led to substantial change in species composition and decrease in fisheries yields (Tang et al., 2009). Multiple sources of evidence pointed to the degradation of the ecosystem, including the decline in average trophic levels of marine catches (Ye et al., 2014), diminishing fish sizes at maturity and at capture (Lin et al., 2007), declining marine biodiversity (Fu et al., 2018), and a shift toward forage species (Zhang et al., 2018). However, there are no formal management plans to restore the fishery populations in this area, while one notable challenge to such a conservation plan is the lack of understanding and evaluation of ecosystem dynamics. The mixed fisheries in the NYS have been rarely assessed except for occasional reports on biological traits of economically important species (Jin, 2004; Xue, 2005; Zhao et al., 2018). Without effective fisheries management, the future of the multiple stocks is vulnerable to further decline.
In order to implement the MSSMs to inform ecosystem-based fisheries management, this study considered multiple sources of data for the procedure of model parameterization. Although many parameters of MSSM can be derived from the metabolic theory and relevant biological studies, some parameters must be calibrated to the target ecosystem (Datta et al., 2016; Blanchard et al., 2017; Plank et al., 2017), e.g., recruitment dynamics and primary productivity. Model parameterization could raise substantial risk in management decisions if the data are biased or the methods of parameter estimation are inadequate (Pelletier and Gros, 1991; Guénette et al., 1998; Drouineau et al., 2008). The uncertainties associated with the large number parameters imposed a substantial burden in model applications and further restricted ecosystem-based management. In addition, different parameters are not equal in their influences on model predictions, i.e., a model may be sensitive to the changes of one parameter but less so to others, depending on its structural characteristics (Saltelli and Scott, 1997; Zhang C. et al., 2015). In this sense, parameter uncertainties associated with data quality need to be carefully examined (Dickey-Collas, 2014; Collie et al., 2016). For correct interpretation, sensitivity analyses on parameters are necessary to build trust within model users and stakeholders (Thorpe et al., 2015; Spence et al., 2016).
As we move toward EBFM, it is critical to understand fishing impacts in the ecosystem context. To this end, this study parameterized the MSSM based on marine surveys and simulated the ecological dynamics of fish community in the coastal ecosystem (Lehuta et al., 2010; Blanchard et al., 2014). Additionally, we conducted model validation by examining whether the model could reflect the composition and production of the community. In addition, sensitivity analyses were conducted to assess the influences of parameters on model predictions at the species and ecosystem level. We summarized the accuracy, variability, and accessibility of the parameter estimating approaches available in the data-limited circumstance. This study aims to develop a framework to build and interpret MSSMs in data-limited situations and promote the application of ecosystem models in the mixed fisheries of developing countries.
Materials and Methods
Size-Spectrum Model
The MSSM used in this study is developed by Andersen and Beyer (2006) and implemented by Hartvig et al. (2011). The model is rooted in the metabolic theory, which links species vital rates to individual bodyweight and connects energy balance at the individual level with population dynamics at community levels. The model reflects trophic interactions in the fish community based on three main assumptions: (1) Predatory preference is determined by a predator–prey mass ratio (PPMR); (2) energy obtained from background resources and other species are used to motivate metabolism, growth, and reproduction; (3) biological processes are determined by individual body weight following the allometric scaling law (Blanchard et al., 2014; Zhang C. et al., 2015).
The biological processes of the fish community are formulated by submodels, including (1) background resource models, which represent the dynamics of organisms that provide food items for the smallest individuals; (2) feeding models, which represent the relationships between predators and preys according to food preference, maximum intake, encounter, and consumption; (3) energy budget models, which describe the process that the energy obtained from assimilation is allocated to activity, growth, and production; (4) growth models, which characterize the species-specific changes in body shape and weight; (5) reproduction models, which describe the stock–recruitment relationship, according to the efficiency of reproduction (ε) and the maximum recruitment (rmax); and (6) mortality models, which cover three types of fish mortality, predation, fishing, and background mortality. Equations of the above submodels are shown in the Supplementary Materials (Table 1).
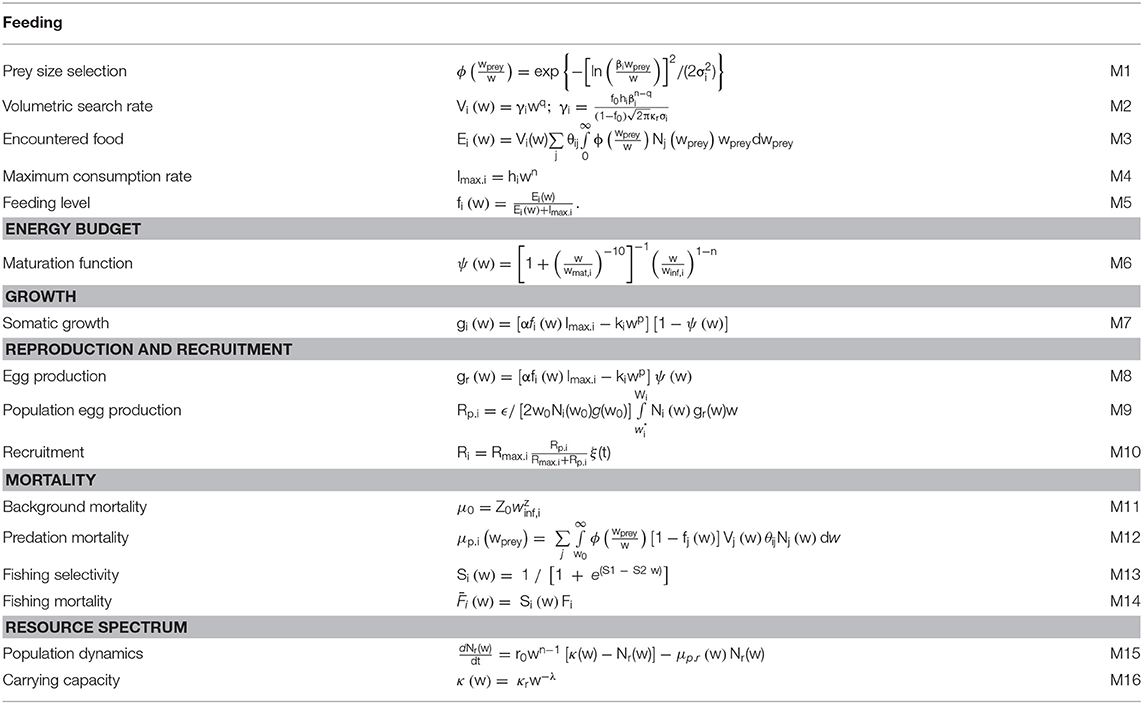
Table 1. Multispecies size spectrum model (SSM) equations, modified from Blanchard et al. (2014) and Zhang et al. (2016).
Model Parameterization
Data Sources
The size-spectrum model was parameterized according to the fish community in coastal NYS, a temperate ecosystem with heavy fishing pressure. The study area was located on the continental shelf adjacent to the Shandong Peninsula, China (Supplementary Figure 1), with water depth ranging from 5 to 40 m. As a traditional fishing ground of mixed fisheries, fishing production has been considerably high to maintain fishermen's livelihood and social welfare (Wang et al., 1993). The marine ecosystem has shown a decline in fisheries yields in recent years (Tang et al., 2011). Changes in species composition have been reported in the adjacent sea area, showing that low-valued, small-sized, and short-lived species have replaced the dominance of economically important species in the community (Jin, 2004; Zhao et al., 2018). Due to limited data and studies, stock status and many crucial biological and physiological parameters remain unknown, which created substantial challenges in fishery management. To stop resource degradation, intensive studies are urgently needed to clarify the ecosystem dynamics and the effects of fishing activities to guide effective management.
The data used for model building were obtained from several sources, including FishBase (Froese and Daniel, 2018), previous studies, reports (MARA, 1957–2018), and survey data, regarding their availability. Primarily, scientific surveys were conducted in four seasons during 2016–2017 to collect data of fish community composition and biology information. The survey adopted bottom trawling and investigated 118 sampling sites in each season, including 55 coastal sites and 63 offshore sites, respectively (Supplementary Figure 1). The trawl had a net width of 15 m and cod-end mesh of 20 mm, hauling for 1 h at a speed of 3 knots in each sampling station. The catch of each haul was sorted and weighted by species. A total of 278 species were identified in the scientific survey, including 124 fishes, 29 shrimps, and 32 crabs. The major species were measured by length and weight. Stomach content analysis and age identification were preformed when the samples were sufficient. For species in which samples were insufficient to estimate feeding preference, we obtained their predation relationships from relevant literature (Deng et al., 1986; Yang, 2001; Xue, 2005). In addition, FishBase provided references of biological parameters for the rare species (Froese and Daniel, 2018). Total yield and fishing effort were obtained from the China Fishery Statistical Yearbook, and a selection of fisheries statistics in Shandong Province was used in the analyses (MARA, 1957–2018). In the calibration procedure, biomass of each species was calibrated to the species-specific total biomass, which was estimated with corrected catch data following the swept area method (Fraser et al., 2009).
Estimation Methods
Our MSSM included 21 common and commercially important species, which accounted for over 90% of total fish biomass. A range of biological parameters, including growth, feeding, reproduction, and mortality, were estimated from various sources of data. The methods of parameter estimation used in this study were briefly introduced below, accorded and supplemented to Blanchard et al. (2014).
Growth Parameters
The infinite weight (winf/g) and growth rate (Kvb) in the von-Bertalanffy growth equation (VBGE) can be estimated from age and length data. When age data are not available (which is common in multispecies fisheries), length–frequency data with sufficient seasonal observations can be used to fit the growth equation (Thorson et al., 2016). In this study, most growth parameters were calculated from length–frequency data using the “ELEFAN” method in R package “TropfishR” (Mildenberger et al., 2017; Taylor and Mildenberger, 2017). The weight–length relationship parameters (a/cm and b/g) were estimated directly from regression analysis, using the biological measurement data of the NYS survey (sample size of each species was shown in Supplementary Table 4). For the species lacking sufficient samples, the information was obtained from FishBase (Froese and Daniel, 2018) and literatures in similar areas.
Feeding Parameters
The PPMRs were estimated from trophic analyses, using weighted average of relative prey proportion represented in a log-normal distribution. The relative proportion and mean size of prey species were derived from stomach content analyses, derived from the NYS survey and previous researches (Xue, 2005; Pinnegar and Platts, 2014). The PPMRs were adjusted by available size and abundance of prey, to reflect their “average” preferred mass ratio (beta, β). The width of selection (sigma, σ) was set to 1.3 for all species due to lack of data for estimation (Andersen and Pedersen, 2010). The interaction matrix (Supplementary Table 2) was estimated with the “Schooner's overlap index” (1970), which described the co-occurrences of species pairs with the proportion of overlapped biomass in each survey site (Schoener, 1970; Blanchard et al., 2014). The diagonal values were set to 0.1 to represent the spatial co-occurrence and cannibalism across different size stages of same species. The maximum consumption rate (M4) was calculated with the default average feeding level (f0) and the exponent of maximum consumption (n). The cutoff size of the resource spectrum (wcut) was set to 7.5 g, and the exponent for volumetric search rate (q) was set to 0.8 based on empirical knowledge.
Reproduction Parameters
Size at maturity (wmat) could be estimated directly from maturity observations or from published literature. For species lacking maturity information, a rule-of-thumb was used, i.e., wmat estimated as 0.25 times of winf (Beverton, 1992; Andersen and Pedersen, 2010; Houle et al., 2012). Energy allocated to reproduction was gained from food consumption, following the efficiency of reproduction (ε). The egg size (w0) was set to 0.5, and the proportion of spawning stocks was assumed to be 1/2 accounting that only females reproduced (Scott et al., 2014). The maximum recruitment for each species (rmax) was obtained from model calibration according to the observed biomass. An optimization algorithm, the Limited Memory Broyden–Fletcher–Goldfarb–Shanno with Boundaries (L-BFGS-B) in R package “optimParallel” (Gerber and Furrer, 2018), was used to minimize the sum of squared errors between the predicted and observed biomass in a log scale (Byrd et al., 1995). After calibration, a stochastic term was added to the recruitment model to mimic the variation of recruitment among years.
Mortality Parameters
Three types of mortality were included: predation, background mortality, and fishing mortality. Predation mortality was calculated as the food consumption by each species. Background mortality was assumed to exist throughout each species' lifespan, dependent on prefactor for background mortality (Z0) and exponent of background mortality (z) (Hartvig and Andersen, 2013). Fishing mortality could be estimated with different methods regarding available data. When length data of a single year and essential biological information were available, a length-based integrated mixed effects “LIME” (Rudd and Thorson, 2018) was used to estimate fishing mortality. When only size–frequency data were available within one survey, the “S6model” method (Kokkalis et al., 2015) was used with seasonal abundance at weight. When no size data were available, a stochastic Surplus production model in Continuous Time (“SpiCT”) method (Pedersen and Berg, 2017) was used with landings from fisheries statistical data. We averaged fishing mortality when multiple estimates were available after excluding abnormal values. The estimated fishing mortality was further used to specify selectivity (S), fishing effort (E), and catchability (Q) in the MSSM. The species-specific selection function was assumed to follow the knife-edge curve (Scott et al., 2014), in which knife-edge size was estimated from “LIME” and “S6model,” respectively. We assumed the same fishing effort (E) on multispecies fishery following the relative total power of fishing vessels in Shandong province reported by statistical data, and catchability (Q) was determined accordingly to achieve the estimated fishing mortality.
Resources and Physiological Parameters
The background resource included regeneration rate parameters (i.e., R0) and the carrying capacity (Savage et al., 2004). The first type parameters were set to default, and the constant resource carrying capacity (κr) was estimated following the same calibration procedure using L-BFGS-B.
The exponent of standard metabolism (p) and assimilation efficiency (α) could not be appropriately estimated with available cross-species data and was set as default in our model. The maximum consumption (hi) was calculated based on Kvb, f0, and winf (Blanchard et al., 2014).
We summarized the species-specific parameters in Supplementary Table 1 and ecosystem-specific parameters, including resources parameters and physiological parameters, in Supplementary Table 3. Some parameters such as sigma are easy to improve by extra investigation efforts (Mangin et al., 2018), whereas some parameters such as r_max are hard to improve, which present high uncertainty and poor understanding due to the knowledge gap (Datta et al., 2016; Blanchard et al., 2017; Plank et al., 2017). According to the data quality of major sources, we reviewed the parameter uncertainty, including accuracy, variability, and accessibility in Table 2 (Ckleijnen et al., 1986; Spence and Turtle, 2017).
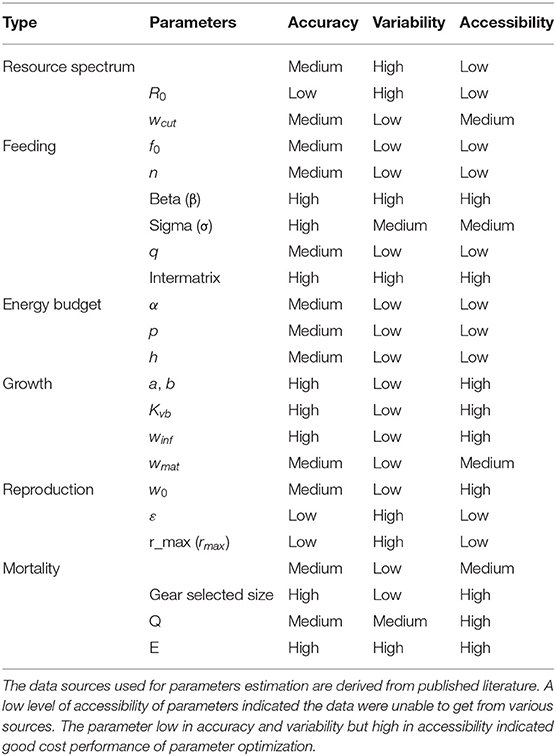
Table 2. Assessment of parameters uncertainty with different data quality.
Model Evaluation
Validation
To examine whether the MSSM could reflect the structure and dynamics of real fish community, both species- and community-level predictions were investigated for model validation. First, we compared the species-specific size spectra between predictions and observations. It should be noted that size spectra information was not used in the calibration procedure, thus could be considered as independent test data in model validation. Second, we predicted the fisheries yields of each species according to the total fishing efforts reported in fisheries statistics of Shandong providence and compared the predicted yields with observed landings from fisheries statistics. An explicit assumption of the evaluation was that the studied area matched with the fishery regions of the fleet managed by Shandong province. To ensure comparability, both predicted and observed yields were expressed relative to the average yield for a stable period, from 2010 to 2017 (MARA, 1957–2018).
Sensitivity Analysis
Sensitivity analyses were used to evaluate parameter uncertainty within the data-limited situations. As examples, we tested the influences of three parameters on model predictions considering their variability and accessibility in this study (Table 2). The first was maximum recruitment (rmax), which was highly uncertain and poorly understood. The second was the width of prey selection (sigma), which could be improved in future investigations (Mangin et al., 2018). The third was fishing efforts (E) because fishing impacts were primarily concerned in alternative management actions (Lane and Stephenson, 1999; Butterworth, 2007). To simulate the parameters' bias, an error term was randomly drawn from a normal distribution and multiplied to the original values (Andersen et al., 2016b; Blanchard et al., 2017). The different levels of uncertainty ranged from 0 to 30%, with an interval of 5%, which were commonly used to simulate parametric uncertainty (Houle et al., 2012; Zhang C. et al., 2015). The model was run 1,000 times for 40 years with each stochastic error items, respectively.
We used both species level and community level metrics to indicate the influence of parameter uncertainties. At the species level, multidimensional scaling (MDS) was adopted to investigate similarity in species composition (Clarke, 2010; Zhang C. et al., 2015), and the results were visualized in biplots, in which the distance among the dots reflected the relative similarity in composition (Clarke, 2010). Two dimensions could adequately represent the similarity as the stress level was <0.2. At the community level, a set of ecological indicators were used to monitor the state of the community (Shin et al., 2010; Houle et al., 2012), including total biomass and yield, large fish index (Shin et al., 2010), mean weight (Rochet and Rice, 2005), mean maximum weight (Link, 2005), and size-spectrum slope of community(Shin et al., 2005).
Results
Model Validation
The multispecies size-spectrum model was simulated to an equilibrium state in 200 years with a constant fishing effort. All species showed similar feeding levels in small body sizes and varied substantially in large body sizes (Figure 1A). Except for Eutaeniichthys gilli and Cleisthenes herzensteini, most species achieved equilibrium biomass in 50 years (Figure 1B). Predation mortality ranged from 0.1 to 2 year−1 for different species of small body size (0.001–1 g) and decreased toward zero when body weight was larger than 100 g (Figure 1C). Fishing mortality was shaped by the knife-edge selectivity, ranging from 0.5 to 1.5 year−1 (Figure 1D). The biomass spectra exhibited reasonable size composition of fish population and background resources (Figure 1E), and each species showed a sharp decrease around species-specific maturity sizes. In general, the model outputs were in line with typical patterns of the size spectrum theory.

Figure 1. A summary of the size-spectrum model outputs, including (A) feeding level, (B) species biomass through time, (C) predation mortality, (D) fishing mortality, and (E) community size spectra. The results were derived from the calibrated model in the coastal water of Shandong, projected for 200 years with constant fishing efforts. Each line denotes 1 of the 21 species included in the model.
The model prediction was first examined by comparing the species-specific size spectra to the observed pattern in survey data (Supplementary Figure 2). The predicted size spectra generally matched well with the observation of most species, especially Argyrosomus argentatus, Loliolus beka, Chaeturichthys stigmatias, Pholis fangi, and Pampus punctatissimus. Meanwhile, some species showed less consistency, such as Engraulis japonicus, Lophius litulon, Oratosquilla oratoria, and Saurida elongata. It should be noted that the poorly predicted species were generally pelagic, probably because the pelagic species were not well-sampled in the trawl survey. Despite this, the calibrated model was able to capture the size spectra of the real ecosystem.
We compared the predicted yields with that of landings reported in the statistics during the period 1970–2017 (Figure 2) (MARA, 1957–2018). Due to the lack of statistics and large change in the ecosystem, the model failed to reflect the historical trend pre-1999. The predicted yields in 1999–2017 were more congruous with records, after fishery activities was under management since 1999 (Zhao et al., 2018). We noted that the MSSM was limited in projecting the dynamics of single stock yields but more useful for total yield (Figure 2). Regarding single species, the results generally reflected the landing tendency of E. japonicus but largely overestimated the magnitude. Both observations and predictions of Paretroplus polyactis and Scomber japonicus showed fast increases in landing in the 1980–1990 and gradually became stable in the latter half of 2000s. On the contrary, the model failed to capture the drop of O. oratoria. Additionally, an unusual fluctuation was predicted in the yield of Scomberomorus niphonius, which was opposite to records. Nevertheless, compared with dynamics of single stock yields, the predicted total yield was more consistent with observed catch in statistics.
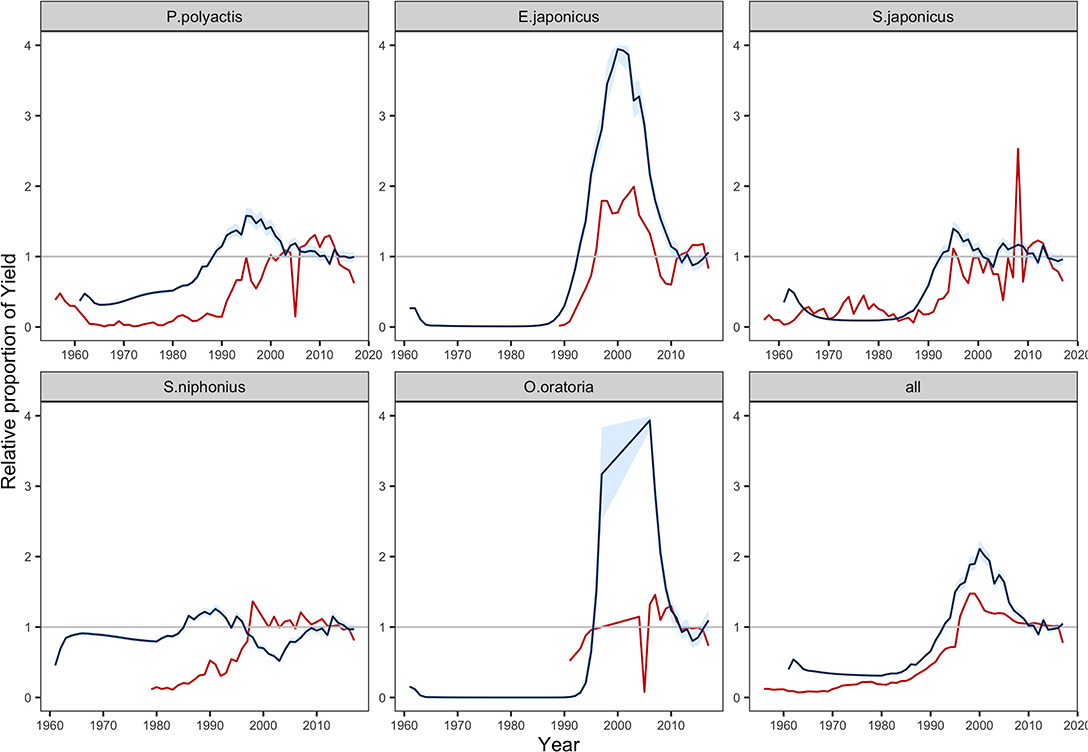
Figure 2. Change in yields relative to the calibrated value driven by the fishing efforts in fisheries statistics from 1970 to 2017 (MARA, 1957–2018). Red lines show the annual tendency of reported catch, and blue lines equal to the median; blue areas shows the predictions contained within 95% intervals. Stochastic simulations were run 1,000 times.
Sensitivity Analysis
The results showed that sensitivity with different parameters (fishing efforts, E; feeding selection width, sigma; and recruitment potential, r_max) were not equal in their influences on model predictions. At the species level, non-metric MDS displayed the similarity of species composition. With increasing levels of parameter errors (from 0.05 to 0.3), the variation in predictions tended to increase but to substantially different degrees. Compared to fishing efforts, the influence of sigma was minor at the same level of uncertainty. Meanwhile, recruitment uncertainty showed much larger impacts than the two above, dispersing the dots in the MDS plots. The results suggested that if the modeling objective was to evaluate fishing effects on community structure, the uncertainty of recruitment should be effectively controlled, whereas the concern on feeding parameters might be relieved.
At the community level, most ecological indicators (EIs) were more responsive to fishing effort than to others, denoted by the substantial increase in coefficient of variation (CV) of most indicators. An exception was the mean maximum weight, for which the results of the three parameters overlapped. Compared to the results of MDS, changes in EIs were mainly shaped by fishing efforts, and the effects of diet selection width was trivial. It should be noted that when the errors of parameters were zero, the variation in model prediction was small due to the annual recruitment variability in simulation. The results suggested that certain parameters might be more influential to specific community characteristics over species-level abundance.
Discussion
Given the urgent needs for fishery conservation plans, it is necessary to examine the effects of alternative management actions through predicting the dynamics of mixed fisheries, for which ecosystem models are desired because of the ability to handle complex species interactions. However, developing an ecosystem model is a data-intensive task, and cautions should be taken in model parameterization and validation. Regarding the requirement of model development in data-limited situations, we presented a framework for model parameterization, validation, and sensitivity analyses. Our case study found that the MSSM could capture the population demographics of most species and total fisheries productions in the local community. Additionally, we illustrated that different parameters were not equal in the influence on ecosystem characteristics. For example, fishing efforts had the largest impacts on community-level indicators, while the recruitment parameter had the greatest impacts on species-level composition and mean maximum weight. These results highlight the importance of correctly interpreting model outputs given unneglectable parameter uncertainties. Furthermore, the sensitivity analysis could guide the priority in data collection and model improvement, which is crucial for support community sustainability, fishery production, and fishermen's livelihoods (Shaeffer, 1980; Lehuta et al., 2013).
Our validation illustrated that the MSSM could reflect the size structures of population and fishery production of community in a data-limited situation. In terms of the population size spectra, the close results between prediction and observation built confidence in the parameterization of species-specific life-history traits. Meanwhile, some species were poorly predicted, such as E. japonicus, L. litulon, O. oratoria, and S. elongata (Supplementary Figure 2). The divergence might be attributed to the changing life-history parameters in recent decades. These knowledge gaps remain challenging for ecosystem models, e.g., juveniles taking less time to reach maturity due to species adaptions to the changing ecosystem (Houde, 2008; Le Pape and Bonhommeau, 2015). When these changes are considered, additional complex structures would introduce extra parameters and increase the level of uncertainty (Zaehle et al., 2005; Piou and Prévost, 2012; Spence and Turtle, 2017). In addition, for some species, the predicted yields are quite different from the reported catches (Figure 2). A possible reason is that we calibrated the model to the current status and ignored long-term changes in community composition, which might undermine the model retrospective ability. Therefore, a caveat at the species level should be highlighted when using the model in further studies.
We analyzed the sensitivities of key parameters to avoid misinterpretation of the multispecies model. It is widely accepted that the recruitment parameters are commonly imprecise, even for well-studied stocks (Shaeffer, 1980; Dowling et al., 2016). In our results, community structure is more sensitive to recruitment parameters (r_max) than to fishing efforts (E) (Figure 3), indicating that the effects of fishing may be concealed with considerable recruitment variability. Meanwhile, the fishing effects are more remarkable for ecological indicators, implying their potential use as ecosystem-level reference points. The impacts of recruitment parameters (r_max) on species and ecosystem levels are different due to the stochastic recruitment taking effect on species-specific biomass, whereas they are eliminated on the community level. Most metrics are less sensitive to the width of prey size preference (sigma), indicating that the model output is reliable, even with a bit of uncertainty in sigma. In general, if sufficient information is unavailable, modelers should explicitly acknowledge the potential risks with sensitivity analysis and interpret with caution (Lassalle et al., 2014; Pethybridge et al., 2019).
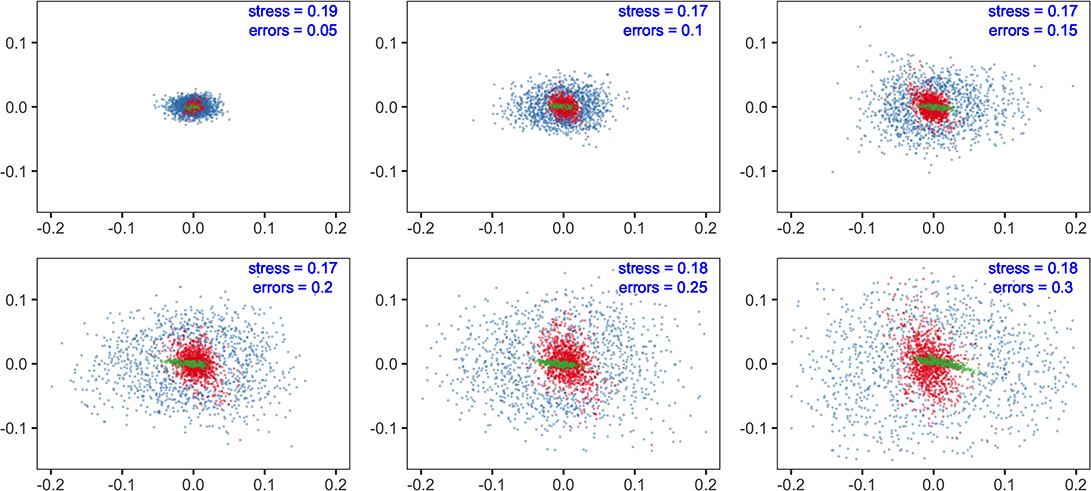
Figure 3. Multidimensional scaling (MDS) analysis of community structure predicted by multispecies size-spectrum model (MSSM). The errors in parameters of concern (fishing effort, E in red; the maximum recruitment, r_max in blue and; the diet selection width, sigma in green) are specified with a range of standard deviations (from 0.05 to 0.3).
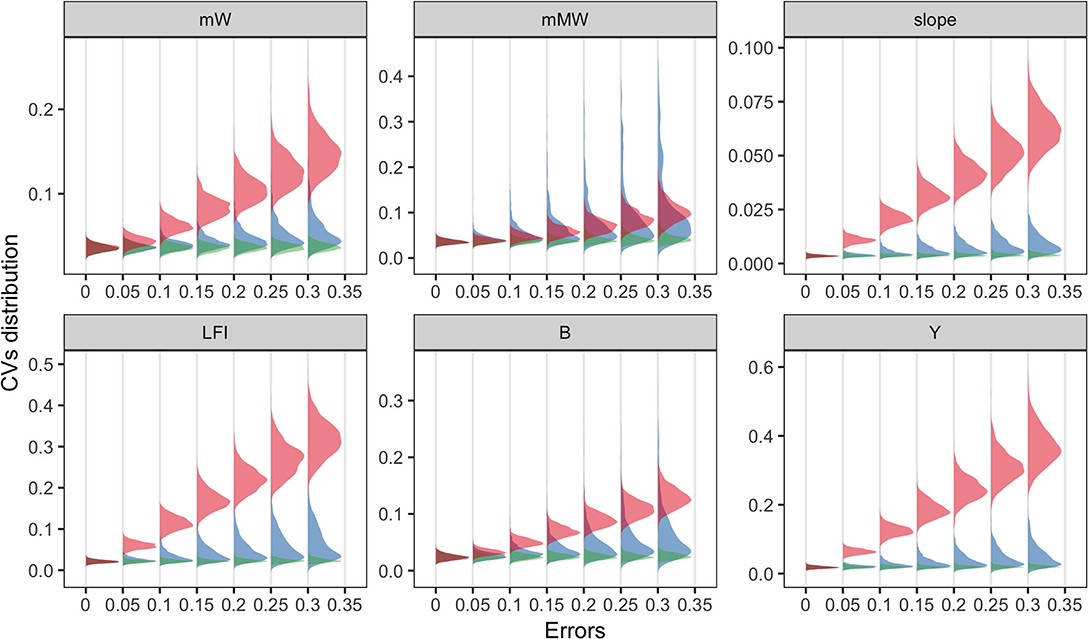
Figure 4. Coefficient of variations (CVs) of ecological indicators driven by the errors of three model parameters (fishing effort, E in red; the maximum recruitment, r_max in blue; and the diet selection width, sigma in green). Ecological indicators included the mean weight, mW; the mean maximum weight, mMW; the slope of size spectrum, slope; the large fish index, LFI; the total biomass, B; the total yield, Y. X-axis denoted the level of parameter uncertainty.
Model validation serves as a benchmark to permit model application, allowing informative prediction to support fisheries management (Fulton, 2010; Stock et al., 2011; Hoshino et al., 2018). As the less reliable predictions to individual species (Kempf et al., 2016; Corrales et al., 2018), the purpose of this multispecies model is to trace the community dynamics and promote single-species management strategies with ecosystem knowledge (Blanchard et al., 2017). For instance, the ecosystem responses to climate variability and anthropogenic drivers have been examined in Object-Oriented Simulator of Marine Ecosystems Exploitation (“OSMOSE”) (Fu et al., 2013, 2015). These ecosystem models provide a theoretical framework for testing the ecosystem effects of fishing (Andersen et al., 2016b), e.g., simulation scenarios could be designed to explore the influences of implementing conventional assessment and harvest strategies in mixed fisheries. Such applications are crucial in the NYS ecosystems, which have limited scientific studies across entire ecological communities (Ye et al., 2011). Toward sustainable fishery and health ecosystem, it is important to avoid unintended community consequences, including habitat destruction, decline in non-target species, and changes in the function and structure of ecosystems (Pikitch et al., 2004). Ecosystem models could be used to address the knowledge gaps, e.g., assessing the current state and changes of the ecosystem, examining the effects of human-induced and environmental changes (Blanchard et al., 2012; Jacobsen et al., 2013, 2017), clarifying species interactions (Blanchard et al., 2014), diversity-stability links (Zhang et al., 2013), and eco-evolutionary processes (Zhang, L. et al., 2015). Therefore, we highlight that the MSSM can contribute to the management of mixed fisheries because it could account for the species interactions and external disturbances and capture temporal changes across the community.
The predictions of MSSM should be deemed as qualitative rather than quantitative results, such as the case of setting catch quota. Our model was unable to reflect the historical catch accurately, particularly due to the weak representation of reported data in fisheries statistics. The China Fishery Statistical Yearbook reported the total catch and number of fleets of each province, and we assumed that the vessels managed by Shandong province fished in the province governed water. However, some vessels might fish outside this region, which caused additional fishing mortality and catches (Carr and Heyman, 2014; Johnson et al., 2018). Additionally, the MSSM implicitly assumed a closed ecosystem, and the assumptions of closed system, in addition to stochastic recruitment, might impede the model's ability to reflect the dynamics of biomass at the species level. Nevertheless, how ecosystems may react to the changes in fishing pressure would not be influenced by these assumptions, according to our evaluation with ecological indicators. With further improvements in data quality, the model can be updated over time to improve model performance.
This study could contribute to the management of mixed fisheries, given the urgent need to design appropriate management strategies in East and Southeast Asian fisheries. We highlight that, in the modeling process, the uncertainties of parameters should be clearly identified, and particular attentions are needed to clarify whether the data are accurate and accessible and whether certain parameters are variable or consistent across ecosystems. For data-limited fisheries, a certain level of compromise is inevitable, and starting with the data currently available is the most pragmatic approach (Ye et al., 2011). The data-limited methods we adopted here, such as the “ELEFAN” (Mildenberger et al., 2017; Taylor and Mildenberger, 2017), “LIME” (Rudd and Thorson, 2018), “S6model” (Kokkalis et al., 2015), and “SpiCT” (Pedersen and Berg, 2017) R packages, provide promising solutions for parameter estimation. By incorporating the data-limited methods, crucial parameters such as growth rates and fishery selectivity could be properly estimated, even without long time-series data, which promotes the efficient use of available data. The modeling experience of this study, particularly the parameterization approach, should be informative to studies of data-limited marine ecosystems.
The implementation of ecosystem models is crucial for multispecies fisheries management. Meanwhile, for fisheries without reliable statistics database, such as small-scale and recreational fisheries, particular cautions are required in the interpretation of modeling results, as uncertainty and variability are inherent within ecosystem models (Pethybridge et al., 2019). Although sensitivity analyses are helpful to understand model uncertainty, the real variability of ecosystems can be hardly quantified, especially when external pressures are involved. We highlight the challenges to develop MSSM in data-poor ecosystems (Wu et al., 2014; Thorpe et al., 2015) and the need to carefully interpret MSSM outcome with respect to parameter uncertainty. Nevertheless, our study illustrates the fishing consequences at the ecosystem level, which offers a chance to manage mixed fisheries with a multispecies approach.
Data Availability Statement
The datasets generated for this study are available on request to the corresponding author.
Author Contributions
JW: conceptualization, data curation, formal analysis, methodology, software, supervision, validation, visualization, writing—original draft, and writing—review and editing. CZ: conceptualization, data curation, methodology, and writing—review and editing. XP: software and writing—review and editing. BX: investigation. YX: supervision. YR: funding acquisition and project administration. All authors contributed to the article and approved the submitted version.
Funding
Funding for this study was provided by National Key R&D Program of China (2018YFD0900906) and National Natural Science Foundation of China (31802301).
Conflict of Interest
The authors declare that the research was conducted in the absence of any commercial or financial relationships that could be construed as a potential conflict of interest.
Supplementary Material
The Supplementary Material for this article can be found online at: https://www.frontiersin.org/articles/10.3389/fmars.2020.524463/full#supplementary-material
References
Andersen, K. H., and Beyer, J. E. (2006). Asymptotic size determines species abundance in the marine size spectrum. Am. Nat. 168, 54–61. doi: 10.1086/504849
Andersen, K. H., Blanchard, J. L., Fulton, E. A., Gislason, H., Jacobsen, N. S., and van Kooten, T. (2016a). Assumptions behind size-based ecosystem models are realistic. ICES J. Mar. Sci. 73, 1651–1655. doi: 10.1093/icesjms/fsv211
Andersen, K. H., Jacobsen, N. S., and Farnsworth, K. D. (2016b). The theoretical foundations for size spectrum models of fish communities. Can. J. Fish. Aquat. Sci. 73, 575–588. doi: 10.1139/cjfas-2015-0230
Andersen, K. H., and Pedersen, M. (2010). Damped trophic cascades driven by fishing in model marine ecosystems. Proc. R Soc. B Biol. Sci. 277, 795–802. doi: 10.1098/rspb.2009.1512
Beverton, R. J. H. (1992). Patterns of reproductive strategy parameters in some marine teleost fishes. J. Fish. Biol. 41, 137–160. doi: 10.1111/j.1095-8649.1992.tb03875.x
Blanchard, J. L., Andersen, K. H., Scott, F., Hintzen, N. T., Piet, G., Jennings, S., et al. (2014). Evaluating targets and trade-offs among fisheries and conservation objectives using a multispecies size spectrum model. J. Appl. Ecol. 51, 612–622. doi: 10.1111/1365-2664.12238
Blanchard, J. L., Heneghan, R. F., Everett, J. D., Trebilco, R., and Richardson, A. J. (2017). From bacteria to whales: using functional size spectra to model marine ecosystems. Trends Ecol. Evol. 32, 174–186. doi: 10.1016/j.tree.2016.12.003
Blanchard, J. L., Jennings, S., Holmes, R., Harle, J., Merino, G., Allen, J. I., et al. (2012). Potential consequences of climate change for primary production and fish production in large marine ecosystems. Philos. Trans. R. Soc. B 367, 2979–2989. doi: 10.1098/rstb.2012.0231
Butterworth, D. S. (2007). Why a management procedure approach? Some positives and negatives. ICES J. Mar. Sci. 64, 613–617. doi: 10.1093/icesjms/fsm003
Byrd, R. H., Lu, P., Nocedal, J., and Zhu, C. (1995). A limited memory algorithm for bound constrained optimization. Siam J. Sci. Comput. 16, 1190–1208. doi: 10.1137/0916069
Carr, L. M., and Heyman, W. D. (2014). Using a coupled behavior-economic model to reduce uncertainty and assess fishery management in a data-limited, small-scale fishery. Ecol. Econ. 102, 94–104. doi: 10.1016/j.ecolecon.2014.03.011
Ckleijnen, J. P., Karremans, P. C. A., Oortwijn, W. K., and van Groenendaal, W. J. H. (1986). Jackknifing estimated weighted least squares: JEWLS. Commun. Stat. Theor. Methods 16, 747–764. doi: 10.1080/03610928708829400
Clarke, K. R. (2010). Non-parametric multivariate analyses of changes in community structure. Austr. Ecol. 18, 117–143. doi: 10.1111/j.1442-9993.1993.tb00438.x
Collie, J. S., Botsford, L. W., Hastings, A., Kaplan, I. C., Largier, J. L., Livingston, P. A., et al. (2016). Ecosystem models for fisheries management: finding the sweet spot. Fish Fish. 17, 101–125. doi: 10.1111/faf.12093
Corrales, X., Coll, M., Ofir, E., Heymans, J. J., Steenbeek, J., Goren, M., et al. (2018). Future scenarios of marine resources and ecosystem conditions in the Eastern Mediterranean under the impacts of fishing, alien species and sea warming. Sci. Rep. 8:14284. doi: 10.1038/s41598-018-32666-x
Datta, S., Blanchard, J. L., and Giacomini, H. (2016). The effects of seasonal processes on size spectrum dynamics. Can. J. Fish. Aquat. Sci. 73, 598–610. doi: 10.1139/cjfas-2015-0468
de Roos, A. M., and Persson, L. (2001). Physiologically structured models–from versatile technique to ecological theory. Oikos 94, 51–71. doi: 10.1034/j.1600-0706.2001.11313.x
Deng, J., Meng, T., and Ren, S. (1986). Food web of fishs in Bohai sea. Acta Ecol. Sinica 6, 356–364.
Dickey-Collas, M. (2014). Why the complex nature of integrated ecosystem assessments requires a flexible and adaptive approach. ICES J. Mar. Sci. 71, 1174–1182. doi: 10.1093/icesjms/fsu027
Dowling, N. A., Punt, A. E., Little, L. R., Dichmont, C. M., Smith, D. C., Haddon, M., et al. (2016). Assessing a multilevel tier system: the role and implications of data quality and availability. Fish. Res. 183, 588–593. doi: 10.1016/j.fishres.2016.05.001
Drouineau, H., Mahévas, S., Bertignac, M., and Fertin, A. (2008). Assessing the impact of discretisation assumptions in a length-structured population growth model. Fish. Res. 91, 160–167. doi: 10.1016/j.fishres.2007.11.017
Fraser, H. M., Greenstreet, S. P. R., and Piet, G. J. (2009). Selecting MPAs to conserve groundfish biodiversity: the consequences of failing to account for catchability in survey trawls. ICES J. Mar. Sci. 66, 82–89. doi: 10.1093/icesjms/fsn181
Froese, R., and Daniel, P. (2018). FishBase. World Wide Web Electronic Publication. Available online at: www.fishbase.org
Fu, C., Large, S., Knight, B., Richardson, A. J., Bundy, A., Reygondeau, G., et al. (2015). Relationships among fisheries exploitation, environmental conditions, and ecological indicators across a series of marine ecosystems. J. Mar. Syst. 148, 101–111. doi: 10.1016/j.jmarsys.2015.01.004
Fu, C., Perry, R. I., Shin, Y. J., Schweigert, J., and Liu, H. (2013). An ecosystem modelling framework for incorporating climate regime shifts into fisheries management. Prog. Oceanogr. 115, 53–64. doi: 10.1016/j.pocean.2013.03.003
Fu, X. M., Mei, Q., Wang, Y. D., and Wang, N. (2018). The status and safety degree assessment of marine biodiversity in Qingdao offshore area. Mar. Environ. Sci. 37, 21–27. doi: 10.13634/j.cnki.mes.2018.01.004
Fulton, E. A. (2010). Approaches to end-to-end ecosystem models. J. Mar. Syst. 81, 171–183. doi: 10.1016/j.jmarsys.2009.12.012
Garcia, S. M. (2003). The ecosystem approach to fisheries. Fish Fish. 11:232. doi: 10.1111/j.1467-2979.2010.00358.x
Gerber, F., and Furrer, R. (2018). optimParallel: an R Package Providing Parallel Versions of the Gradient-Based Optimization Methods of optim(). Available online at: http://arxiv.org/abs/1804.11058
Guénette, S., Lauck, T., and Clark, C. (1998). Marine reserves: from Beverton and Holt to the present. Rev. Fish Biol. Fish. 8, 251–272. doi: 10.1023/A:1008859130275
Guiet, J., Poggiale, J.-C., and Maury, O. (2016). Modelling the community size-spectrum: recent developments and new directions. Ecol. Model. 337, 4–14. doi: 10.1016/j.ecolmodel.2016.05.015
Hartvig, M., and Andersen, K. H. (2013). Coexistence of structured populations with size-based prey selection. Theor. Popul. Biol. 89, 24–33. doi: 10.1016/j.tpb.2013.07.003
Hartvig, M., Andersen, K. H., and Beyer, J. E. (2011). Food web framework for size-structured populations. J. Theor. Biol. 272, 113–122. doi: 10.1016/j.jtbi.2010.12.006
Hollowed, A. B., Aydin, K. Y., Essington, T. E., Ianelli, J. N., Megrey, B. A., Punt, A. E., et al. (2011). Experience with quantitative ecosystem assessment tools in the Northeast Pacific. Fish Fish. 12, 189–208. doi: 10.1111/j.1467-2979.2011.00413.x
Hoshino, E., Pascoe, S., Hutton, T., Kompas, T., and Yamazaki, S. (2018). Estimating maximum economic yield in multispecies fisheries: a review. Rev. Fish Biol. Fish. 28, 261–276. doi: 10.1007/s11160-017-9508-8
Houde, E. D. (2008). Emerging from Hjort's shadow. J. Northwest Atlantic Fish. Sci. 41, 53–70. doi: 10.2960/J.v41.m634
Houle, J. E., Farnsworth, K. D., Rossberg, A. G., Reid, D. G., and Hilborn, R. (2012). Assessing the sensitivity and specificity of fish community indicators to management action. Can. J. Fish. Aquat. Sci. 69, 1065–1079. doi: 10.1139/f2012-044
Jacobsen, N. S., Burgess, M. G., and Andersen, K. H. (2017). Efficiency of fisheries is increasing at the ecosystem level. Fish Fish. 18, 199–211. doi: 10.1111/faf.12171
Jacobsen, N. S., Gislason, H., and Andersen, K. H. (2013). The consequences of balanced harvesting of fish communities. Proc. R. Soc. B 281:20132701. doi: 10.1098/rspb.2013.2701
Jennings, S., and Brander, K. (2010). Predicting the effects of climate change on marine communities and the consequences for fisheries. J. Mar. Syst. 79, 418–426. doi: 10.1016/j.jmarsys.2008.12.016
Jennings, S., and Rice, J. (2011). Towards an ecosystem approach to fisheries in Europe: a perspective on existing progress and future directions. Fish Fish. 12, 125–137. doi: 10.1111/j.1467-2979.2011.00409.x
Jin, X. (2004). Long-term changes in fish community structure in the Bohai Sea, China. Estuar. Coast. Shelf Sci. 59, 163–171. doi: 10.1016/j.ecss.2003.08.005
Johnson, D., Acott, T., and Urqart J. Stacey, N. E. (2018). Social Wellbeing and the Values of Small-Scale Fisheries. London: Springer.
Kempf, A., Mumford, J., Levontin, P., Leach, A., Hoff, A., Hamon, K. G., et al. (2016). The MSY concept in a multi-objective fisheries environment-lessons from the North sea. Mar. Policy 69, 146–158. doi: 10.1016/j.marpol.2016.04.012
Kokkalis, A., Thygesen, U. H., Nielsen, A., and Andersen, K. H. (2015). Limits to the reliability of size-based fishing status estimation for data-poor stocks. Fish. Res. 171, 4–11. doi: 10.1016/j.fishres.2014.10.007
Lane, D. E., and Stephenson, R. L. (1999). Fisheries-management science: a framework for the implementation of fisheries-management systems. ICES J. Mar. Sci. 56, 1059–1066. doi: 10.1006/jmsc.1999.0548
Lassalle, G., Bourdaud, P., Saint-Béat, B., Rochette, S., and Niquil, N. (2014). A toolbox to evaluate data reliability for whole-ecosystem models: application on the Bay of Biscay continental shelf food-web model. Ecol. Model. 285, 13–21. doi: 10.1016/j.ecolmodel.2014.04.002
Le Pape, O., and Bonhommeau, S. (2015). The food limitation hypothesis for juvenile marine fish. Fish Fish. 16, 373–398. doi: 10.1111/faf.12063
Lehuta, S., Mahévas, S., Le Floc'h, P., Petitgas, P., and Rose, K. (2013). A simulation-based approach to assess sensitivity and robustness of fisheries management indicators for the pelagic fishery in the Bay of Biscay. Can. J. Fish. Aquat. Sci. 70, 1741–1756. doi: 10.1139/cjfas-2013-0066
Lehuta, S., Mahévas, S., Petitgas, P., and Pelletier, D. (2010). Combining sensitivity and uncertainty analysis to evaluate the impact of management measures with ISIS–fish: marine protected areas for the Bay of Biscay anchovy (Engraulis encrasicolus) fishery. ICES J. Mar. Sci. 67, 1063–1075. doi: 10.1093/icesjms/fsq002
Lin, L. S., Cheng, J., and Ling, J. Z. (2007). Analysis on recent status of the bottom trawl fishery resources in the East China Sea region. Mar. Fish. 29, 371–374. doi: 10.13233/j.cnki.mar.fish.2007.04.016
Link, J. S. (2005). Translating ecosystem indicators into decision criteria. ICES J. Mar. Sci. 62, 569–576. doi: 10.1016/j.icesjms.2004.12.015
Mangin, T., Costello, C., Anderson, J., Arnason, R., Elliott, M., Gaines, S. D., et al. (2018). Are fishery management upgrades worth the cost? PLoS ONE 13:e0204258. doi: 10.1371/journal.pone.0204258
MARA (1957–2018). China Fishery Statistical Yearbook 1957-2018. Beijing: Agricultural Press Beijing.
Mildenberger, T. K., Taylor, M. H., and Wolff, M. (2017). TropFishR: an R package for fisheries analysis with length-frequency data. Methods Ecol. Evol. 8, 1520–1527. doi: 10.1111/2041-210X.12791
Pedersen, M. W., and Berg, C. W. (2017). A stochastic surplus production model in continuous time. Fish Fish. 18, 226–243. doi: 10.1111/faf.12174
Pelletier, D., and Gros, P. (1991). Assessing the impact of sampling error on model-based management advice: comparison of equilibrium yield per recruit variance estimators. Can. J. Fish. Aquat. Sci. 48, 2129–2139. doi: 10.1139/f91-252
Pethybridge, H. R., Weijerman, M., Perrymann, H., Audzijonyte, A., Porobic, J., McGregor, V., et al. (2019). Calibrating process-based marine ecosystem models: an example case using Atlantis. Ecol. Model. 412:108822. doi: 10.1016/j.ecolmodel.2019.108822
Pikitch, E. K., Santora, C., Babcock, E. A., Bakun, A., Bonfil, R., Conover, D. O., et al. (2004). Ecosystem-based fishery management. Science 305, 346–347. doi: 10.1126/science.1098222
Pinnegar, J. K., and Platts, M. (2014). DAPSTOM-an integrated database & portal for fish stomach records. Lowestoft, UK: Centre for Environment FAS.
Piou, C., and Prévost, E. (2012). A demo-genetic individual-based model for Atlantic salmon populations: Model structure, parameterization and sensitivity. Ecol. Model. 231, 37–52. doi: 10.1016/j.ecolmodel.2012.01.025
Pitcher, T. J. (2008). The sea ahead: challenges to marine biology from seafood sustainability. Hydrobiologia 606:161. doi: 10.1007/s10750-008-9337-9
Plank, M. J., Kolding, J., Law, R., Gerritsen, H. D., and Reid, D. (2017). Balanced harvesting can emerge from fishing decisions by individual fishers in a small-scale fishery. Fish Fish. 18, 212–225. doi: 10.1111/faf.12172
Rochet, M. J., and Rice, J. C. (2005). Do explicit criteria help in selecting indicators for ecosystem-based fisheries management? ICES J. Mar. Sci. 62, 528–539. doi: 10.1016/j.icesjms.2005.01.007
Rudd, M. B., and Thorson, J. T. (2018). Accounting for variable recruitment and fishing mortality in length-based stock assessments for data-limited fisheries. Can. J. Fish. Aquat. Sci. 75, 1019–1035. doi: 10.1139/cjfas-2017-0143
Saltelli, A., and Scott, M. (1997). Guest editorial: the role of sensitivity analysis in the corroboration of models and itslink to model structural and parametric uncertainty. Reliab. Eng. Syst. Safe 57, 1–4. doi: 10.1016/S0951-8320(97)00022-7
Savage, V. M., Gillooly, J. F., Brown, J. H., West, G. B., and Charnov, E. L. (2004). Effects of body size and temperature on population growth. Am. Nat. 163, 429–441. doi: 10.1086/381872
Schoener, T. W. (1970). Nonsynchronous spatial overlap of lizards in patchy habitats. Ecology 51, 408–418. doi: 10.2307/1935376
Scott, F., Blanchard, J. L., and Andersen, K. H. (2014). mizer: an R package for multispecies, trait-based and community size spectrum ecological modelling. Methods Ecol. Evol. 5, 1121–1125. doi: 10.1111/2041-210X.12256
Shaeffer, D. L. (1980). A model evaluation methodology applicable to environmental assessment models. Ecol. Model. 8, 275–295. doi: 10.1016/0304-3800(80)90042-3
Sheldon, R. W., Prakash, A., and Sutcliffe, W. H. Jr. (1972). The size distribution of particles in the ocean 1. Limnol. Oceanogr. 17, 327–340. doi: 10.4319/lo.1972.17.3.0327
Shin, Y. J., Rochet, M. J., Jennings, S., Field, J. G., and Gislason, H. (2005). Using size-based indicators to evaluate the ecosystem effects of fishing. ICES J. Mar. Sci. 62, 384–396. doi: 10.1016/j.icesjms.2005.01.004
Shin, Y. J., Shannon, L. J., Bundy, A., Coll, M., Aydin, K., Bez, N., et al. (2010). Using indicators for evaluating, comparing, and communicating the ecological status of exploited marine ecosystems. 2. Setting the scene. ICES J. Mar. Sci. 67, 692–716. doi: 10.1093/icesjms/fsp294
Spence, M. A., Blackwell, P. G., Blanchard, J. L., and Shuter, B. (2016). Parameter uncertainty of a dynamic multispecies size spectrum model. Can. J. Fish. Aquat. Sci. 73, 589–597. doi: 10.1139/cjfas-2015-0022
Spence, M. A., and Turtle, A. J. (2017). Making the most of survey data: Incorporating age uncertainty when fitting growth parameters. Ecol. Evol. 7, 7058–7068. doi: 10.1002/ece3.3280
Stock, C. A., Alexander, M. A., Bond, N. A., Brander, K. M., Cheung, W. W. L., Curchitser, E. N., et al. (2011). On the use of IPCC-class models to assess the impact of climate on living marine resources. Prog. Oceanogr. 88, 1–27. doi: 10.1016/j.pocean.2010.09.001
Tang, F., Shen, X., and Wang, Y. (2011). Dynamics of fisheries resources near Haizhou Bay waters. Fisheries Sci. 30, 335–341. doi: 10.16378/j.cnki.1003-1111.2011.06.002
Tang, Y., Zou, W. H., and Hu, Z. M. (2009). An analysis of utilization status and management of marine fisheries resources in China based on statistics data. Resour. Sci. 31, 1061–1068. doi: 10.3321/j.issn:1007-7588.2009.06.023
Taylor, M. H., and Mildenberger, T. K. (2017). Extending electronic length frequency analysis in R. Fish. Manag. Ecol. 24, 330–338. doi: 10.1111/fme.12232
Thorpe, R. B., Le Quesne, W. J. F., Luxford, F., Collie, J. S., Jennings, S., and Spencer, M. (2015). Evaluation and management implications of uncertainty in a multispecies size-structured model of population and community responses to fishing. Methods Ecol. Evol. 6, 49–58. doi: 10.1111/2041-210X.12292
Thorson, J. T., Fonner, R., Haltuch, M. A., Ono, K., and Winker, H. (2016). Accounting for spatiotemporal variation and fisher targeting when estimating abundance from multispecies fishery data. Can. J. Fish. Aquat. Sci. 74, 1794–1807. doi: 10.1139/cjfas-2015-0598
Travers, M., Shin, Y. J., Jennings, S., and Cury, P. (2007). Towards end-to-end models for investigating the effects of climate and fishing in marine ecosystems. Rev. Cogn. Sci. 75, 751–770. doi: 10.1016/j.pocean.2007.08.001
Wang, W., Xia, D., and Gao, X. (1993). Bays in China: The Bay of Sourthern Shandong Peninsula and Jiangsu Province (in chinese). Beijing: China Ocean Press.
Wu, Y., Liu, S., Huang, Z., and Yan, W. (2014). Parameter optimization, sensitivity, and uncertainty analysis of an ecosystem model at a forest flux tower site in the United States. J. Adv. Model Earth Syst. 6, 405–419. doi: 10.1002/2013MS000298
Xue, Y. (2005). Studies on the Feeding Ecology of Dominant Fishes and Food Web of Fishes in the Central and Southern Yellow Sea. [dissertation]. Qingdao: Ocean University of China.
Yang, J. (2001). A study on food and trophic levels of Bohai Sea fish. Modern Fish. Inform. 16, 10–19. doi: 10.3969/j.issn.1004-8340.2001.10.002
Ye, G., Chen, B., and Zheng, X. (2014). Changes in the marine trophic index of Chinese marine area. Biodivers. Sci. 22, 532–538. doi: 10.3724/SP.J.1003.2014.13200
Ye, Y., Cochrane, K., and Qiu, Y. (2011). Using ecological indicators in the context of an ecosystem approach to fisheries for data-limited fisheries. Fish. Res. 112, 108–116. doi: 10.1016/j.fishres.2011.06.004
Zaehle, S., Sitch, S., Smith, B., and Hatterman, F. (2005). Effects of parameter uncertainties on the modeling of terrestrial biosphere dynamics. Glob. Biogeochem. Cycles 19, 1–16. doi: 10.1029/2004GB002395
Zhang, C., Chen, Y., and Ren, Y. (2015). Assessing uncertainty of a multispecies size-spectrum model resulting from process and observation errors. ICES J. Mar. Sci. 72, 2223–2233. doi: 10.1093/icesjms/fsv086
Zhang, C., Chen, Y., Thompson, K., and Ren, Y. (2016). Implementing a multispecies size-spectrum model in a data-poor ecosystem. Acta Oceanol. Sin. 35, 63–73. doi: 10.1007/s13131-016-0822-0
Zhang, K., Zhang, J., Xu, Y., Sun, M., Chen, Z., and Yuan, M. (2018). Application of a catch-based method for stock assessment of three important fisheries in the East China Sea. Acta Oceanol. Sin. 37, 102–109. doi: 10.1007/s13131-018-1173-9
Zhang, L., Andersen, K. H., Dieckmann, U., and Brännström, Å. (2015). Four types of interference competition and their impacts on the ecology and evolution of size-structured populations and communities. J. Theor. Biol. 380, 280–290. doi: 10.1016/j.jtbi.2015.05.023
Zhang, L., Thygesen, U. H., Knudsen, K., and Andersen, K. H. (2013). Trait diversity promotes stability of community dynamics. Theor. Ecol. 6, 57–69. doi: 10.1007/s12080-012-0160-6
Keywords: parameter uncertainty, sensitivity analysis, multispecies fisheries, model validation, data-limited methods, Yellow Sea (YS), size-spectrum model
Citation: Wo J, Zhang C, Pan X, Xu B, Xue Y and Ren Y (2020) Modeling the Dynamics of Multispecies Fisheries: A Case Study in the Coastal Water of North Yellow Sea, China. Front. Mar. Sci. 7:524463. doi: 10.3389/fmars.2020.524463
Received: 04 January 2020; Accepted: 16 October 2020;
Published: 23 November 2020.
Edited by:
Scott Large, National Oceanic and Atmospheric Administration (NOAA), United StatesReviewed by:
Tommaso Russo, University of Rome Tor Vergata, ItalyBeatriz Dos Santos Dias, University of Washington, United States
Copyright © 2020 Wo, Zhang, Pan, Xu, Xue and Ren. This is an open-access article distributed under the terms of the Creative Commons Attribution License (CC BY). The use, distribution or reproduction in other forums is permitted, provided the original author(s) and the copyright owner(s) are credited and that the original publication in this journal is cited, in accordance with accepted academic practice. No use, distribution or reproduction is permitted which does not comply with these terms.
*Correspondence: Yiping Ren, renyip@ouc.edu.cn