Environmental Drivers of Habitat Use by Hawksbill Turtles (Eretmochelys imbricata) in the Arabian Gulf (Qatar)
 Christopher D. Marshall1,2*
  Joshua A. Cullen2
  Mehsin Al-Ansi3 Shafeeq Hamza4 Mohamed A. R. Abdel-Moati5†
- 1Gulf Center for Sea Turtle Research, Department of Marine Biology, Texas A&M University at Galveston, Galveston, TX, United States
- 2Department of Ecology and Conservation Biology, Texas A&M University, College Station, TX, United States
- 3Department of Biological and Environmental Science, Qatar University, Doha, Qatar
- 4Environmental Science Center, Qatar University, Doha, Qatar
- 5Ministry of Municipality and Environment, Doha, Qatar
Understanding the environmental drivers of movement patterns are critical to the protection, management and recovery of endangered species. The Arabian Gulf is considered to be the hottest marine system in the world and is known for its extreme environmental conditions that pose substantial physiological stress on marine organisms living there. Satellite tags were deployed on hawksbill turtles in the Arabian Gulf and quantitative ecological modeling (i.e., Bayesian state-space models and GAMMs) was used to provide new insights into the ecological basis of observed hawksbill movement and behavior. Hawksbills used a relatively large core area in the southeast Arabian Gulf when transit and area-restricted search behaviors were included. The numerous hotspots identified suggest that important habitat occurs along a large area of the Qatari eastern coastline and into Saudi Arabia. Offshore islands with fringing reef habitat and deep-water habitats near the 30–50 m isobaths were intensely used. Hawksbills made seasonal migrations to deep-water habitat during summer months, typically once SST reached ∼33°C and bottom temperature reached ∼32°C. These data provide valuable information to managers seeking to conserve hawksbills in the region. Our data also provide a context to understand the underlying physiological, energetic and behavioral drivers of hawksbill movement in the Arabian Gulf. Future studies should include the use of biologging devices, benthic surveys, and dietary biomarkers to better understand the seasonal migrations of Arabian Gulf hawksbills to this deep-water region.
Introduction
The characterization of movement patterns and environmental drivers of space-use are critical to the management and recovery of endangered species. The combination of satellite telemetry data with quantitative ecological modeling is facilitating new insights into the natural history and ecology of endangered species, which can also provide new insights into their conservation. In addition to providing valuable information to managers for conservation purposes, these modern tools aid in understanding the underlying physiological, energetic and behavioral drivers of marine megafauna movement patterns (Hays et al., 2016). Such information is particularly important in the context of climate change.
Hawksbill marine turtles are listed as critically endangered by the International Union for Conservation of Nature (IUCN1). Yet despite an 80% reduction in many hawksbill populations (Meylan and Donnelly, 1999), the at-sea ecology of hawksbill turtles still remains insufficiently understood compared to that of other marine turtles. Data that characterizes the ecological drivers of habitat and space-use of hawksbills are even more sparse. Furthermore, hawksbills exhibit a broad range of ecological patterns globally. Classically known as a spongivore (Meylan, 1988; van Dam and Diez, 1996; Blumenthal et al., 2009b) that occupies open ocean coral reef habitats of the tropics and subtropics, hawksbills are known to use seagrass (Bjorndal and Bolten, 2010) and mangrove habitat (Gaos et al., 2012a). They feed upon a variety of species such as corallimorphs, hydroids, sea urchins, jellyfish, anemone and algae, in addition to sponges (e.g., Carr et al., 1966; Rincon-Diaz et al., 2011). Studies investigating new populations of hawksbills are just as important as ever.
The Arabian Gulf hosts several nesting populations of hawksbills. Hawksbills are known to nest on the islands off Saudi Arabia (Al-Merghani et al., 2000), Iran (Mobaraki, 2004; Hesni et al., 2019), the UAE (Abdessalaam, 2007), and Kuwait (Meakins and Al-Mohanna, 2004). Qatar, a small peninsular country that juts into the Arabian Gulf, has one of the largest and most important hawksbill nesting habitats in the region; hawksbills are the only marine turtle that nests in Qatar (Pilcher et al., 2014a, b, 2015; Chatting et al., 2018). Approximately 200 hawksbills nest in Qatar each year (Tayab and Quiton, 2003; SCENR, 2007; Chatting et al., 2018). The marine ecosystems of Qatar and the Arabian Gulf are regionally and globally significant to the global conservation of hawksbill turtles (Pilcher et al., 2014a, b, 2015; Chatting et al., 2018).
The Arabian Gulf, an extension of the tropical Indo-Pacific Ocean, is the most enclosed marine basin globally (Sheppard et al., 2010; Coles and Riegl, 2013). This ecosystem is known for its extreme environmental conditions and poses substantial physiological stress on the marine organisms living there. It is considered to be the hottest marine system in the world (Feary et al., 2010; Riegl and Purkis, 2012; Hume et al., 2015) and a laboratory of climate change studies (e.g., Pal and Eltahir, 2015). The ambient air temperature typically ranges from 17 to 50°C. The combination of high air temperature and Shamal (northerly) winds results in an evaporation rate as great as 2 m/yr (Meshal and Hassan, 1986; Sheppard et al., 2010). Consequently, salinities range from 40 ppt up to 70 ppt in some regions of the Gulf. Sea surface temperatures (SST) range from 16–35°C; the high end of this range is close to the thermal physiological tolerance of most marine organisms and the lower limit likely poses challenges to marine turtles such as hawksbills. The region is experiencing rapid coastal development as well as broad oil and natural gas exploration. Much of the hard benthic marine habitats, especially corals, have experienced widespread decline from both natural and potentially anthropogenic causes (Riegl, 1999; Wilson et al., 2002; Riegl and Purkis, 2012; Burt et al., 2016).
Despite recent studies, the at-sea ecology of all marine turtles in Qatar and the Arabian Gulf still requires further attention. Considering the widespread loss of habitat, rapid coastal expansion, concerns regarding climate change, the critically endangered status of hawksbills, and the need for additional ecological data for marine turtles in the region, the objectives of this study were to (1) characterize behavioral patterns of post-nesting hawksbills, (2) estimate seasonal patterns of space-use for these hawksbills, (3) generate seasonal habitat suitability models to determine possible areas of greatest conservation effort and (4) determine environmental drivers of offshore summer migrations. Our use of quantitative ecological modeling provides new insights into post-nesting hawksbill movement patterns, behavior of hawksbill turtle habitat use, and drivers of habitat use that builds upon previous studies (Pilcher et al., 2014a, b, 2015).
Methodology
Capture Sites
Post-nesting female hawksbill turtles were captured at 3 sites in Qatar: Fuwairit Beach (26.028153°N, 51.379095°E), Ras Laffan Industrial City (25.951165°N, 51.509297°E) and Halul Island (25.672343°N, 52.411753°E) from April 2013 to June 2015 (Table 1). Halul Island is located ∼85 km offshore the eastern coast of Qatar within its EEZ.
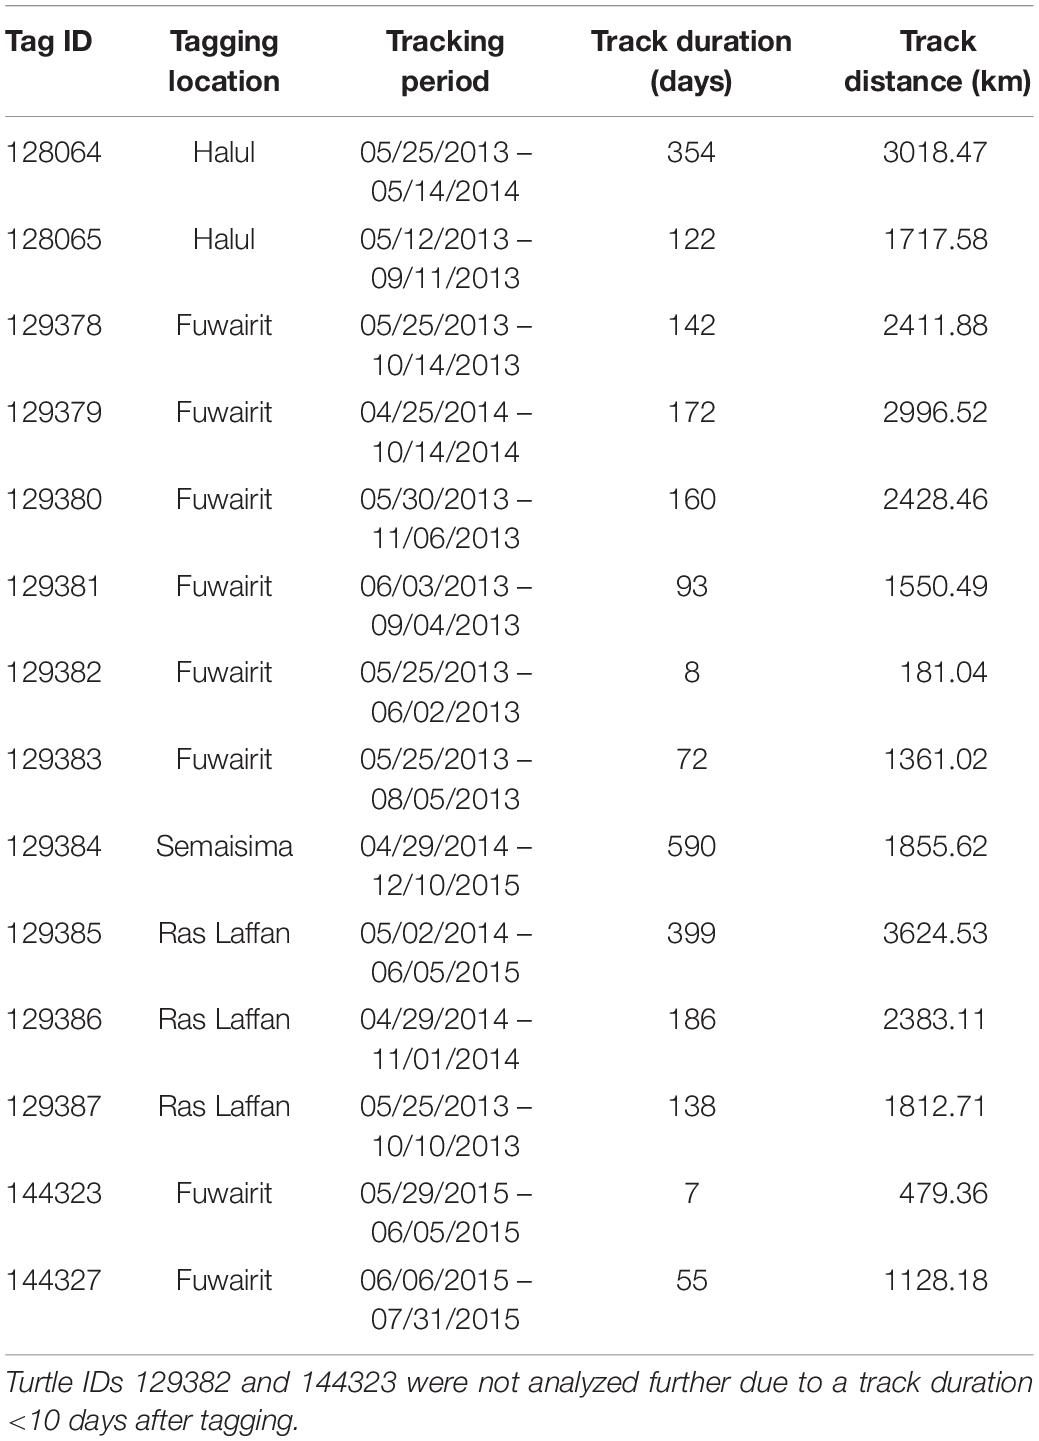
Table 1. Biometric data for the 14 hawksbill turtles that were tagged and evaluated.
Data Collection and Tagging Protocols
Working with the Qatar University Turtle Nesting Monitoring Program and Qatar Petroleum on Halul Island, we participated in beach surveys (motorized and walking) to locate tracks of nesting hawksbills (nesting season in Qatar occurs April–June; Chatting et al., 2018). Once detected, post-nesting individuals were captured by hand as they returned to the sea. Upon capture, each individual underwent a physical health assessment. Mass was recorded by lifting each individual in a net suspended from a Salter-Brecknell spring scale (Fairmont, MN, United States; ±0.1 kg). Standard straight and curved morphometrics were recorded following Wyneken (2001). Flippers were inspected for prior tags and passive integrated transponder (PIT) tags. If no flipper tags were present, two inconel tags with unique identification numbers, one to each front flipper, were applied. A single PIT tag was injected into the right front flipper (Biomark, Boise, ID, United States). Unless indicated otherwise, all protocols follow NMFS (2008) Sea Turtle Research Techniques Manual.
The preparation of turtles for satellite tagging and satellite tag attachment followed Hart et al. (2013). The site near the first and second vertebral scutes was cleaned by removing epibonts, followed by light sanding using 80 grit wet/dry sandpaper. After sanding, the surface will be dried then cleaned with isopropyl alcohol. A two-part marine epoxy known for low exothermic reaction and quick curing time (SuperBond; Hart et al., 2013) was used. Initially, 18 hawksbill turtles were tagged with KiwiSat101 (Lotek, formerly Sir Track, NZ) and Spot Tags (Wildlife Computers, Redmond, WA, United States) satellite platform transmitter terminals (PTTs).
Satellite Telemetry Data Analysis
The Argos system provides Kalman filtering to increase the number of location estimates and improve accuracy of these positions (Lopez and Malardé, 2011; Lopez et al., 2014). Each transmitted Argos location was assigned a location quality class (LC; 3, 2, 1, 0, A, B, Z), where 3 has the lowest error and Z has the greatest error. However, observations with an LC of Z are not assigned an error radius. All duplicates and highly aberrant geolocations on land were removed from further analyses, as were positions with an LC of Z quality class. Additionally, four individuals were excluded from further analyses since they transmitted few locations (<10) and/or had gaps of many days between successive observations. This resulted in a total sample size of 14 hawksbill turtles.
To improve location accuracy and estimate the latent behavioral state at each position, all Argos-derived hawksbill tracks were fitted with Bayesian switching state-space models (SSSMs) via the bsam package (Jonsen et al., 2005; Jonsen, 2016). A hierarchical Bayesian SSSM was implemented at first, but did not reach convergence (per trace and autocorrelation plots, as well as Gelman-Rubin diagnostics). Therefore, SSSMs were fit per individual. Model parameters of these SSSMs were estimated using Markov chain Monte Carlo (MCMC) via JAGS (Just Another Gibbs Sampler; Plummer, 2003) to draw from the joint posterior distribution. Since individuals varied in the number of observations and in their movement patterns, the values for total iterations of the MCMC chains (range: 50,000 – 100,000), burn-in (range: 100,000 – 200,000), and (range: 50 – 100) differed among turtles (see Supplementary Table S1). Model parameters were estimated from a posterior distribution of at least 2000 total MCMC samples. Time steps for each SSSM were selected to closely match the mean interval between successive Argos positions (range: 3.6 – 6 h), which is expected to be appropriate for model inference (Jonsen, 2016). Convergence of the SSSM was evaluated by observation of stationarity and mixing of the MCMC chains, in addition to low autocorrelation and Gelman-Rubin potential scale reduction factors that were ≤ 1.1 (Gelman and Rubin, 1992).
The SSSM applied a state-switching first-difference correlated random walk (DCRWS) for the process model, which allows individuals to switch between two behavioral states. These behaviors are identified as either fast, directed movements reflective of a transit behavior, or as slow, tortuous movements indicative of an area-restricted search (ARS) behavior. While transit behavior typically occurs during long-distance migration between locations, ARS is presumed to include foraging, resting, or exploratory behaviors (Kareiva and Odell, 1987; Bailey et al., 2009; Martins et al., 2014). Behavioral states were classified as either 1 (transit) or 2 (ARS) for each modeled location, for which mean values of behavioral state fell somewhere on this continuum. To take the uncertainty of this estimate into account, values ≤ 1.25 were identified as transit, values ≥ 1.75 were identified as ARS, and all other estimates were unclassified (Jonsen et al., 2007; Bailey et al., 2009).
Pseudo-absences were generated as a measure of habitat availability against known presences (turtle relocations) since presence-absence models (or here, presence-availability models) outperform presence-only models in species distribution modeling (Elith et al., 2006; Barbet-Massin et al., 2012). Pseudo-absences were generated by simulating 10 correlated random walks (CRWs) for each turtle track from their first transmitted location using the adehabitatLT package in R (Calenge, 2006). These trajectories were time-matched to the SSSM tracks, traveled the same total distance, and used step-lengths and turning angles randomly sampled from the empirical distributions (Scales et al., 2015; Hazen et al., 2017, 2018). Simulated CRWs were constrained to only move across aquatic habitats and an equal number of points to the empirical track were selected at random from the 10 simulations for inclusion in further analyses (Barbet-Massin et al., 2012). Locations of all presence and pseudo-absence data are shown within a map in Supplementary Figure S1.
Environmental Data
A combination of static and dynamic remotely sensed environmental variables were matched to SSSM presence and CRW pseudo-absence data and extracted for species distribution modeling (Table 2). These variables were downloaded directly from the provider and extracted using custom scripts in R (ncdf4 and raster R packages; Hijmans, 2019; Pierce, 2019) with the exception of bottom temperature data from the HYbrid Coordinate Ocean Model (HYCOM2), which was accessed via Google Earth Engine (Chassignet et al., 2007; Gorelick et al., 2017) and used specifically to investigate drivers of seasonal migration to deep-water habitats. Static variables included depth (Z) and its standard deviation (Z_sd), which serves as a proxy of bathymetric rugosity. To calculate Z_sd, a 3 × 3 pixel moving window was used across the dataset of Z. Dynamic variables included sea surface height anomaly (SSHa) and its standard deviation (SSHa_sd), eddy kinetic energy (EKE), SST and its standard deviation (SST_sd), as well as bottom temperature (BT). SSHa_sd and SST_sd were calculated by the same method used for Z_sd. SSHa and SSHa_sd were used as proxies for mesoscale features (e.g., eddies) and variability, respectively. EKE was calculated from the u and v geostrophic current components following Cayula and Cornillon (1992), where EKE = 1/2(u2 + v2). SST and SST_sd served as measures of surface thermal regimes throughout the study area and as a measure of variability indicative of thermal fronts, respectively. BT served as a thermal regime of benthic zones across the range of depths. All dynamic variables were downloaded at a daily temporal resolution (Scales et al., 2017a), but spatial resolution varied by product (Table 2). Histograms of extracted static and dynamic environmental variables were explored to determine whether variables needed to be transformed to achieve normality. Square root transformations were required for Z_sd, EKE, and SST_sd since they were highly right skewed.
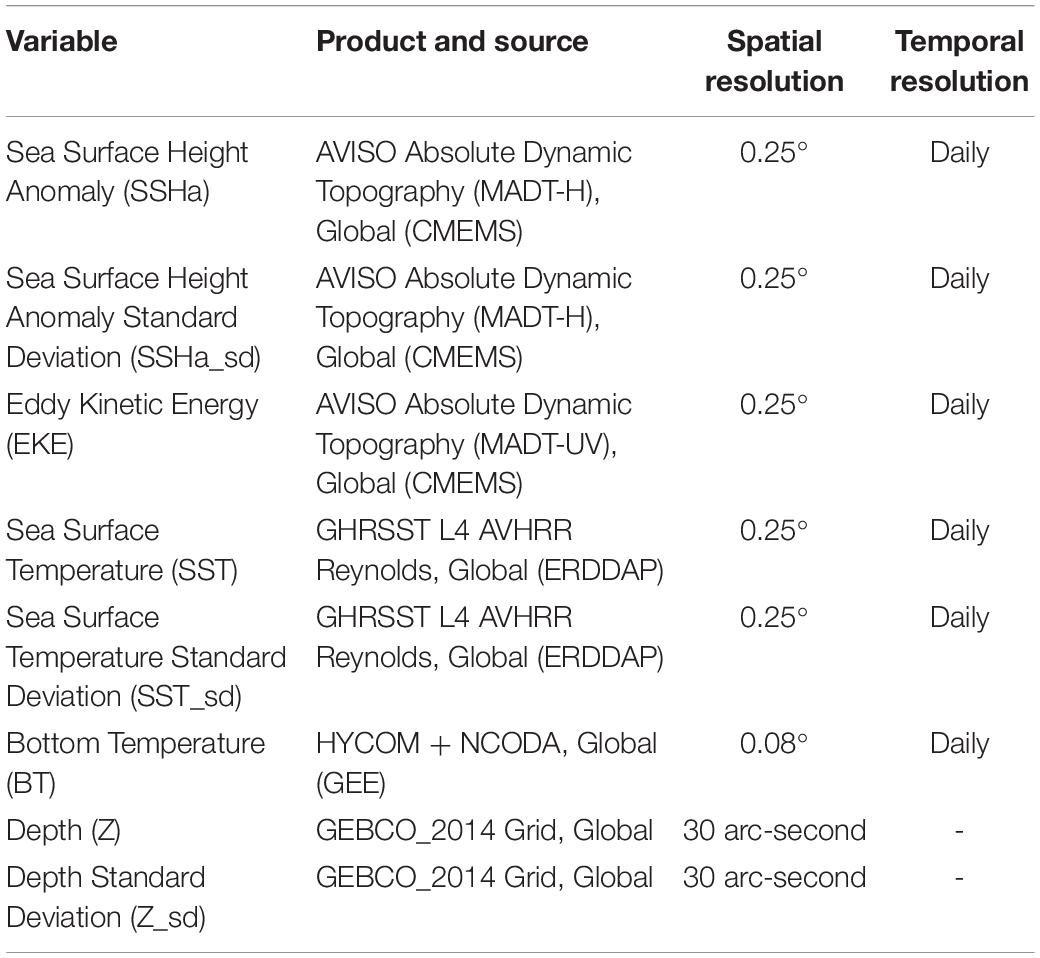
Table 2. List of environmental variables used, the specific product and source, as well as spatial and temporal resolution.
Utilization Distributions
Seasonal utilization distributions (UDs) were measured to determine the areas used by hawksbill turtles and to compare seasonal differences in space-use that were possibly driven by changes in environmental variables. Seasons (spring, summer, fall, winter) were defined using dates for the respective solstices and equinoxes. The UDs were calculated by kernel density estimation (KDE) at a spatial scale of 2 km using the adehabitatHR package (Calenge, 2006) in R and aggregated across all years. The kernel density smoothing parameter was selected using the reference bandwidth (href) for each UD (Kie, 2013; Scales et al., 2017b). After standardizing kernel volume for each KDE, 95 and 50% UD isopleths (km2) were calculated for each turtle as measures of home range and core area of use, respectively. To reduce the bias of the release location after tagging, the first 10 days of geolocations were excluded from each individual track. By following this procedure, two individuals (IDs 129382 and 144323) were removed since positions were not transmitted beyond 10 days (N = 12). Due to their short tracking durations, these two individuals were removed from all further analyses. Additionally, the remaining turtles were required to have ≥30 relocations for the effective estimate of UDs. This method precluded the inclusion of individuals during certain seasons, primarily fall and winter. Seasonal UDs of individuals were compared by Kruskal–Wallis test since data were non-normal (even after log-transformation), sample size by season was uneven, and residuals were heteroscedastic. Significant results were followed by a post hoc Dunn test using Holm-adjusted p-values to control the family wise error rate.
Species Distribution Modeling
Habitat preferences of post-nesting female hawksbill turtles were evaluated using SSSM tracks (presences) and the pseudo-absences generated from the CRW simulations. Habitat suitability was evaluated by a generalized additive mixed model (GAMM) with a binomial error family and a logit link function that used residual maximum likelihood estimation (mgcv R package; Wood, 2011). A model of predictor variables was initially fit using unconstrained smooths of thin plate regressions splines and included turtle ID as a random effect. Smooths were then restricted to five knots to prevent overfitting. However, this model did not include EKE since it showed a strong linear correlation with SSHa_sd during data exploration and had many more missing values than SSHa_sd. Subsequently, variance inflation factors (VIFs) and estimates of concurvity of the smoothed terms were used to ensure that predictor variables were not linearly or non-linearly correlated, respectively. All six predictor variables (SSHa, SSHa_sd, SST, SST_sd, Z, Z_sd) were retained for further prediction since they had low VIFs (VIF < 2), low concurvity (concurvity < 0.40), and all were significant. The relative importance of these variables was assessed by measuring the differences in AIC (ΔAIC) and percent deviance explained (ΔDE) upon the removal of each variable from the final model (Rooker et al., 2012; Wells et al., 2018).
Predictive performance of the habitat suitability GAMM was evaluated using k-fold cross validation over each of five-folds of the randomly partitioned presence-availability data, which maintained equal numbers of presences and pseudo-absences. The area under the receiver operating characteristic (ROC) curve (AUC) and true skill statistic (TSS) were used to evaluate the accuracy of model predictions and are considered to be useful metrics for species distribution models (Allouche et al., 2006; Elith et al., 2006). AUC statistics discriminate between true- and false-positive rates ranging from 0 to 1, where AUC > 0.50 indicates predictive performance greater than random (Hanley and McNeil, 1982; Swets, 1988; Araújo et al., 2005). TSS serves as an alternative metric of model accuracy by incorporating average measures of model sensitivity and specificity (TSS = sensitivity + specificity -1) where values range from −1 to 1 (Allouche et al., 2006). Values of zero or less indicate that the model has no predictive capacity greater than random. AUC and TSS metrics were evaluated using the dismo package in R (Hijmans et al., 2017).
Spatial predictions of habitat suitability (HSI) were based on the GAMM response curves and were scaled from 0 to 1, where 0 represented the least suitable and 1 represented the most suitable habitat. These predictions were made on a seasonal basis (spring, summer, fall, winter) at the resolution of the most-coarse environmental data (0.25°) to discern intra-annual changes in habitat preference. This was performed by taking the mean seasonal conditions over the tracking period (May 2013 – December 2015) for each of the gridded environmental variables. Variables at a spatial resolution finer than 0.25° were resampled using bilinear interpolation in the raster package in R (Hijmans, 2019). Standard errors of spatial predictions are shown as maps in Supplementary Figure S2.
Drivers of Offshore Migrations
Since seven (of twelve) individuals underwent migrations from shallow coastal habitats to deeper pelagic regions, a GAMM was used to evaluate which environmental drivers may be influencing this phenomenon. The depth occupied by hawksbill turtles during the period of these migrations was treated as the response variable using a Gaussian error family and identity link function (mgcv R package; Wood, 2011). Similar to the process used to fit the previous GAMM, VIF and concurvity were tested on all of the predictor variables that were included in the initial model (SSHa, SSHa_sd, SST, SST_sd, Z_sd) with unconstrained smooths. Afterward, smooths were restricted to five knots for each variable and this resulted in the removal of SSHa_sd and Z_sd since their responses were close to zero across the range of values. In the updated model, all remaining terms significantly explained depth of turtle occurrence. SST appears relatively homogenous during the summer months in core areas used by hawksbills. Therefore, BT was included in this GAMM to further investigate temperature (both SST and BT) as a potential driver of migratory movement to offshore habitats during the summer months.
All analyses were performed using R statistical software (ver. 3.5.1; R Core Team, 2018) and significance was assessed at α = 0.05. This study was carried out in accordance with, and approval from, the Institutional Animal Care and Use Committees (IACUC) from Texas A&M University and Qatar University.
Results
Space-Use Within the Arabian Gulf
Post-nesting females used the offshore region between Qatar and Bahrain, as well as the majority of the southeast Arabian Gulf (Figure 1a). None of the individuals in the study (N = 18) were recorded leaving the Gulf. Instead they displayed directed movements away from beach habitat to nearby shallow (5–7 m), patchy coral rubble habitat that is presumably used to forage. Movement outside of the typical nesting-foraging habitat occurred on a seasonal basis for 12 individuals and seven of these turtles exhibited a looping migration in late summer/early fall where they would move from shallow water to deep water and back over the span of a few weeks to 8 months (Figure 1b). Additionally, four of these seven individuals actually performed two separate migratory loops to either the same pelagic location or to one with similar depth. Fall and winter seasons showed the highest levels of site fidelity and ARS behavior, although data were only available for eight and three turtles, respectively (Figures 1c, 2c,d). For many individuals, foraging habitat was in close proximity to nesting beaches, at least for some portion of the year.
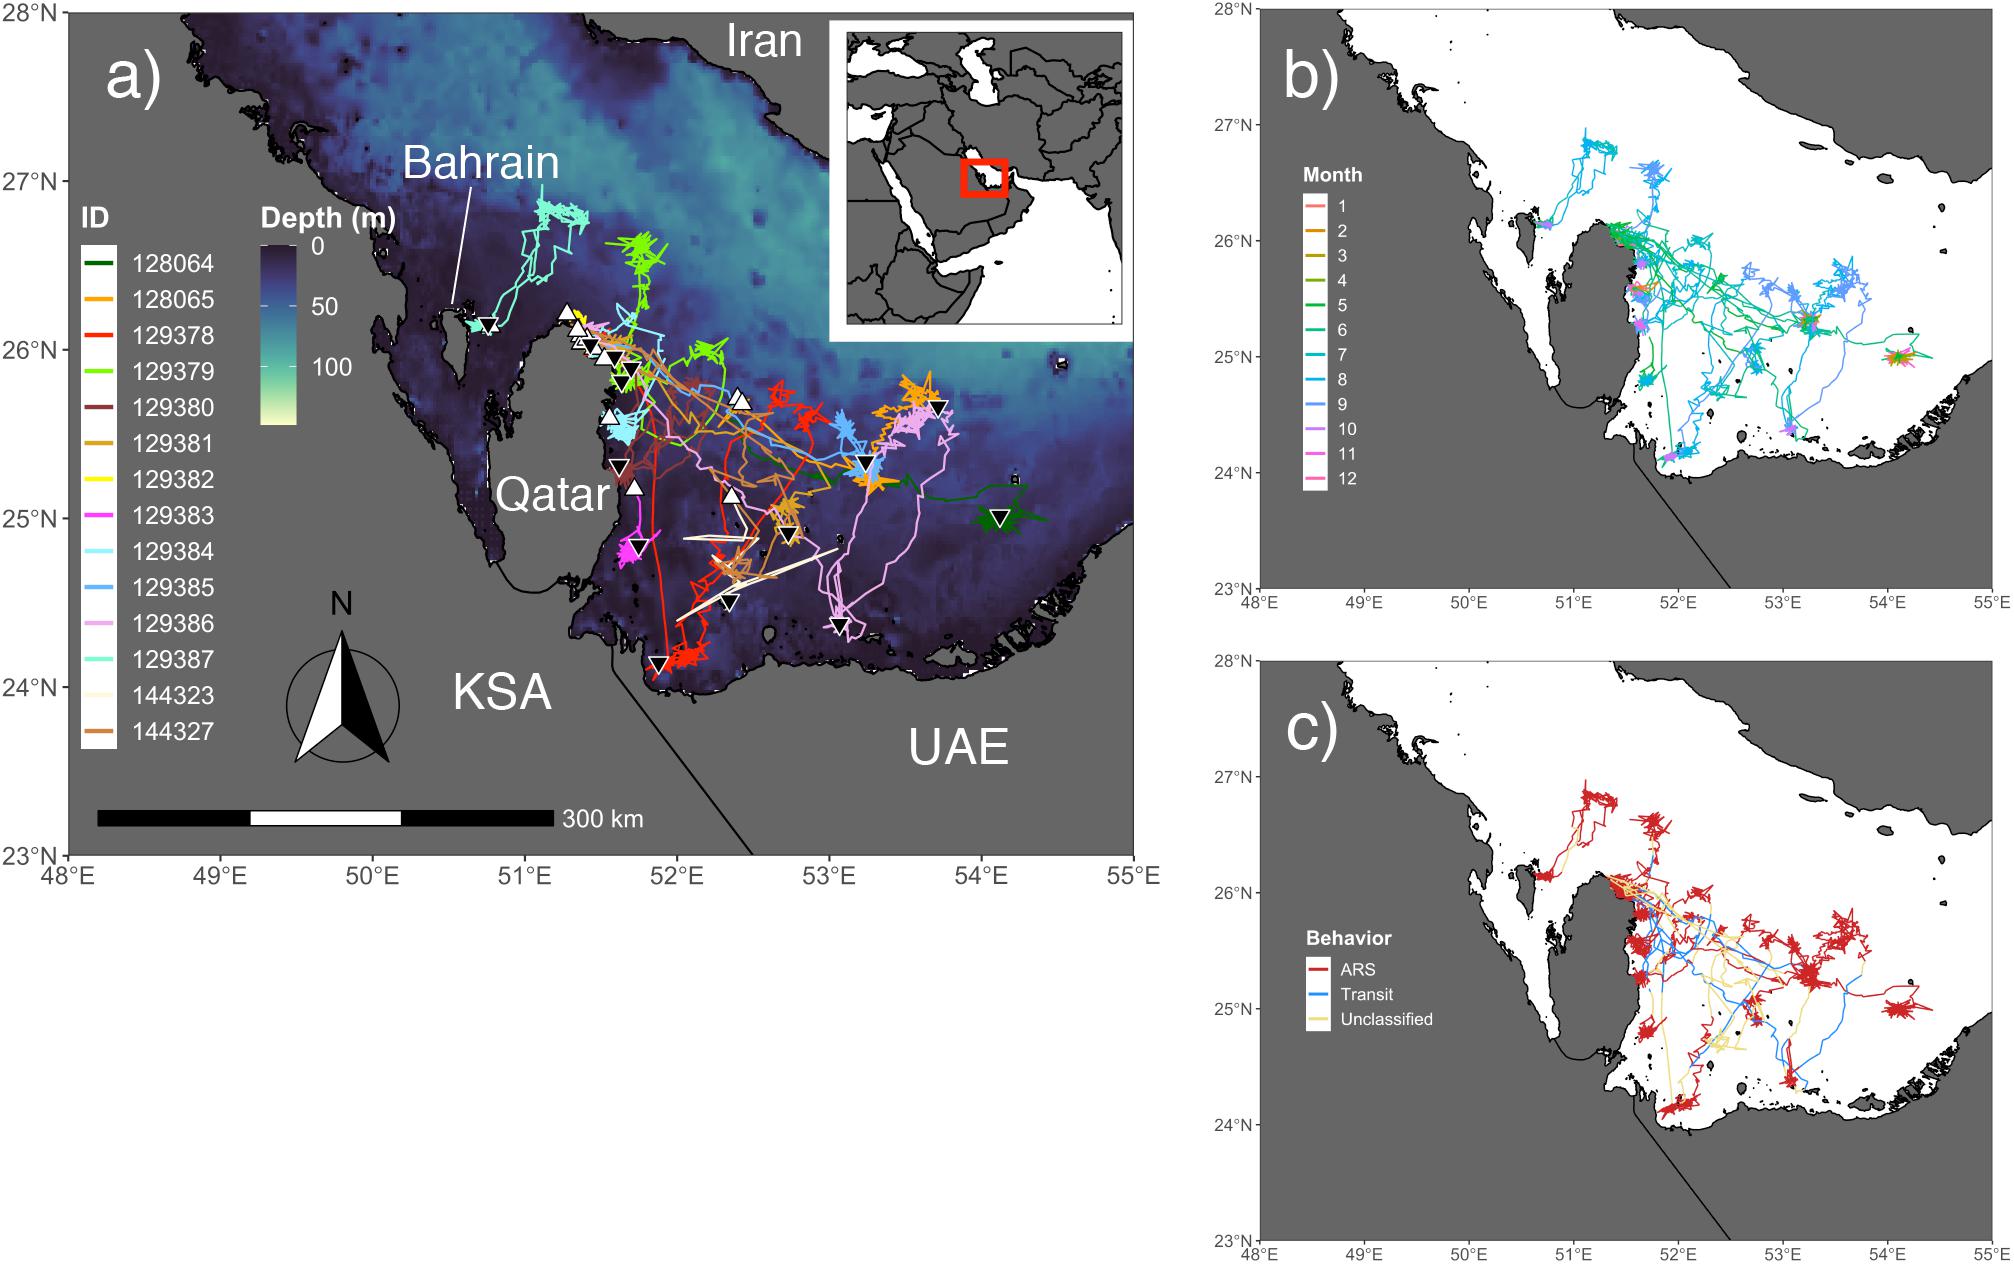
Figure 1. Output from the behavior-switching state-space models (SSSMs) for hawksbills within the Arabian Gulf. (a) Study area for tagging and movements of hawksbill turtles with bathymetry shown (GEBCO_2014; 30 arc-second). White triangles denote the tagging location and black upside down triangles indicate the location of final transmission. (b) Colors of hawksbill relocations display the monthly pattern of turtle movement throughout the region. (c) Area-restricted search (ARS), transit, and unclassified latent behavioral states from the SSSMs are displayed for each relocation, showing the migration corridors and regions of intense use by these individuals.
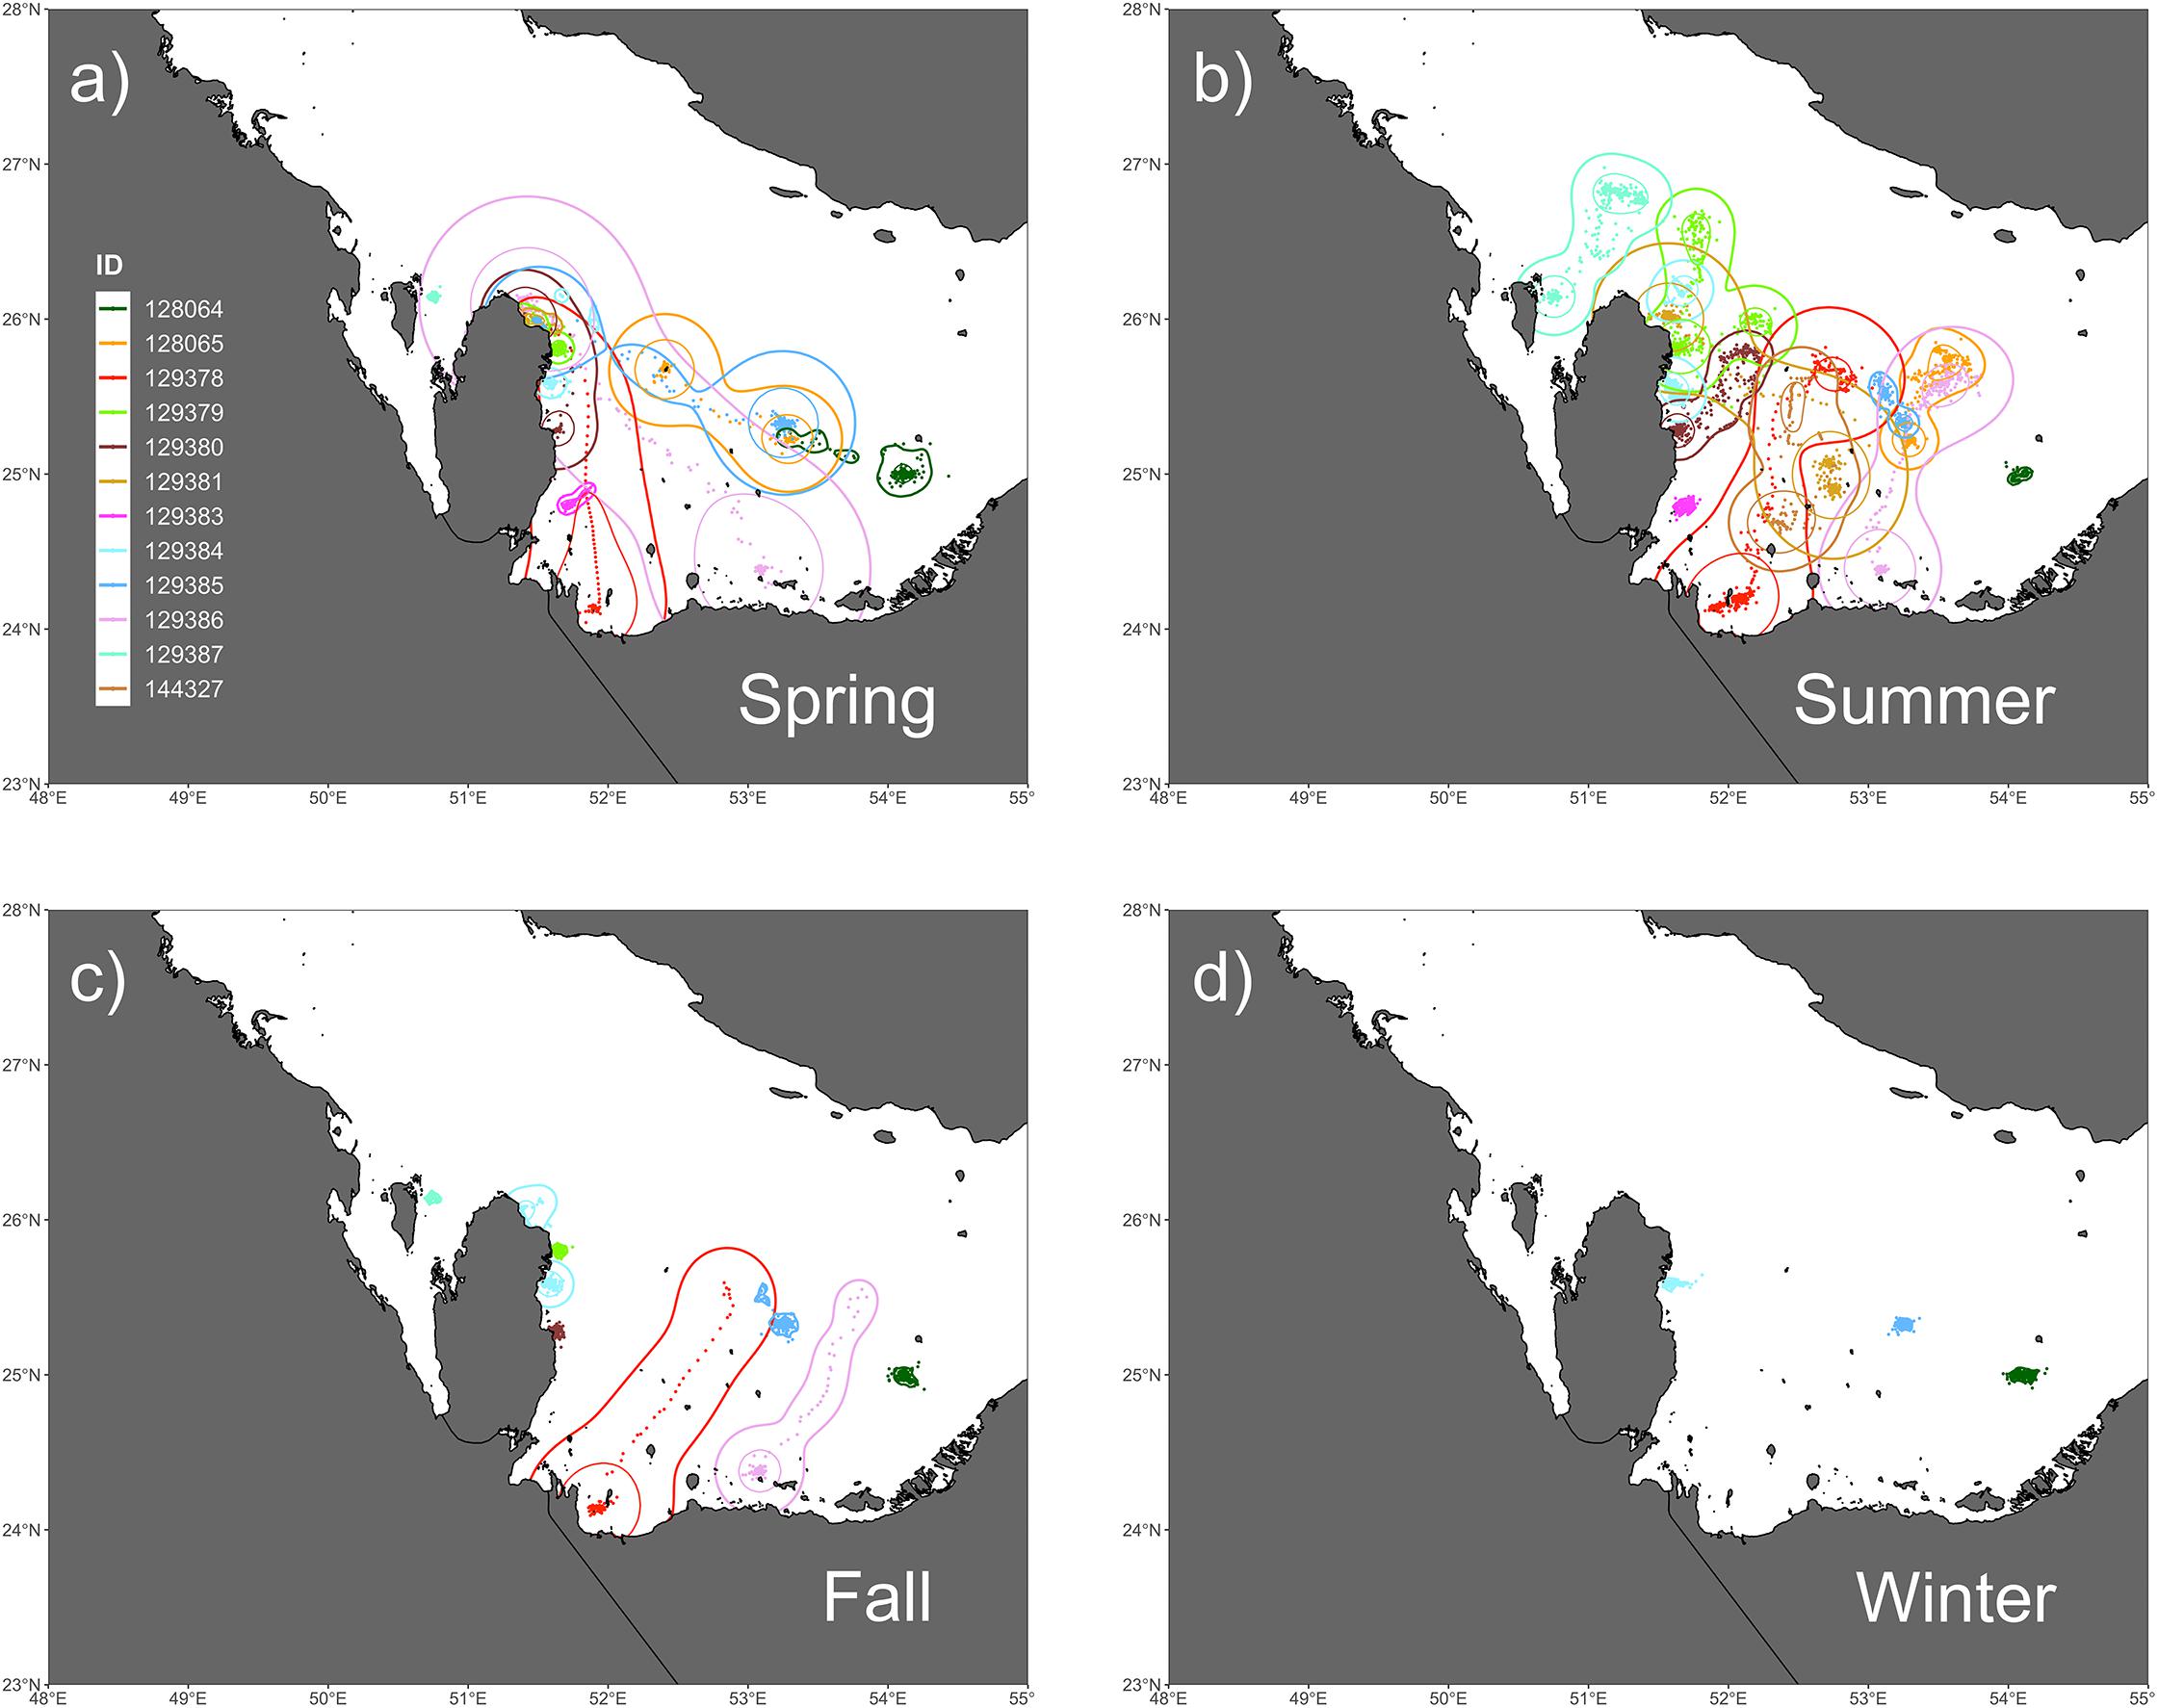
Figure 2. Seasonal trends in space-use as measured by utilization distributions (UDs) by kernel density estimation (KDE) for (a) spring, (b) summer, (c) fall, and (d) winter. Spring UDs encompassed the greatest collective area of any season and primarily shows post-nesting movements to foraging sites. In the summer, the majority of hawksbills undergo migrations to deeper waters in the middle of the Gulf. Movements in the fall are much more restricted when compared to spring and summer, where the return migrations by two individuals (129378, 129386) can be seen at the start of the season. Winter movements are the most restricted and show little no movement.
The kernel density estimation of UDs was conducted on a seasonal basis to calculate the home range (95% UD) and core area of use of individual turtles (50% UD; Figure 2). At their greatest extent, post-nesting female hawksbills in the study used ∼ 59,000 km2 of the southeast Arabian Gulf, which occurred during the spring. Although, the comparison of 95% and 50% UD size by season did not show significant differences (95% UD Kruskal–Wallis: χ2 = 8.12, p = 0.044, Dunn: p > 0.05; 50% UD Kruskal–Wallis: χ2 = 9.80, p = 0.020, Dunn: p > 0.05) (Table 3) this is likely due to the low sample size of track observations recorded during the winter and migrations completing in early fall. Over the course of the study, individuals exhibited high site fidelity that manifested as numerous hotspots within the southeastern Arabian Gulf. The core area of these hotspots varied greatly by individual and ranged from 80 to 11,000 km2. This is also reflected in the frequency of ARS vs. transit behavior. ARS behavior comprised 98.2% (N = 10,334) of all behaviors classified compared to 1.8% frequency of transit behavior (N = 187; Figure 1c). Shallow, coastal habitats on the east coast of Qatar were important for many individuals. However, fringing reef habitat around the islands of Halul, Das, Sir Abu, Nu’Ay, Marawah, and Abu Al Abyad were also important (Figure 2). Fringing reef habitat was used most often by hawksbills directly tagged on Halul Island (IDs 128064 and 128065).
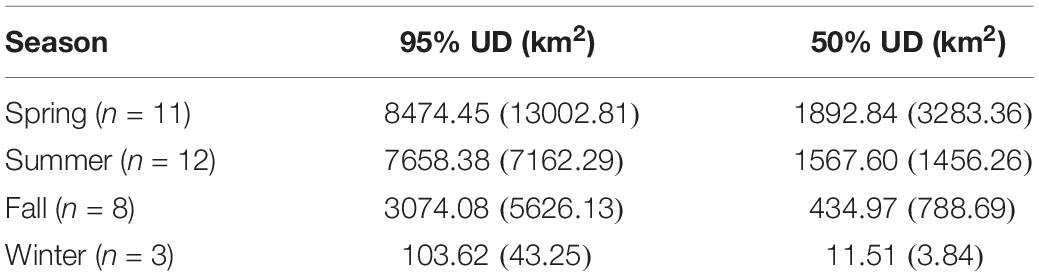
Table 3. Mean (±SD) area of hawksbill turtle UDs by season across all years (2013–2015), where the sample size by season (n) is shown.
Habitat Preferences of Hawksbills
Of the variables included in the species distribution model (SSHa, SSHa_sd, SST, SST_sd, Z, Z_sd), all were significant drivers of hawksbill movement (Table 4). The deviance explained by the model was 30.1%, which is a descriptive measure of model performance. SSHa, SSHa_sd, and Z_sd all exhibited weak linear relationships with hawksbill habitat selection, where suitable habitat was found at SSHa > 0.10 m, very low SSHa_sd indicative of no mesoscale variability, and low values of seafloor rugosity as measured by Z_sd (Figure 3). SST and SST_sd both showed non-linear relationships with hawksbill habitat preference, where these turtles were more likely to occupy habitat with SST warmer than ∼32°C and in areas with little to no thermal fronts as indicated by preference for low values of SST_sd (Figure 3). A strong non-linear relationship between probability of presence and Z was found for hawksbills in this study, where presence was likely to occur at depths of 20 m or shallower (Figure 3). Of these variables, Z was the major driver followed by SST and SSHa/SST_sd (Table 5). Seasonal predictive surfaces of habitat suitability clearly show the importance of shallow depths for hawksbills in this study (Figure 4). However, depth of habitat used by individuals changed seasonally, and data demonstrate that both shallow and deep habitats were important to hawksbills. With regard to the predictive performance of this model, five-fold cross validation showed “good” predictive accuracy (mean AUC = 0.845 ± 0.002 SD) as classified by Swets (1988; 0.80 < AUC < 0.90). Additionally, predictive skill of the model showed better discrimination than random (mean TSS = 0.548 ± 0.005 SD).
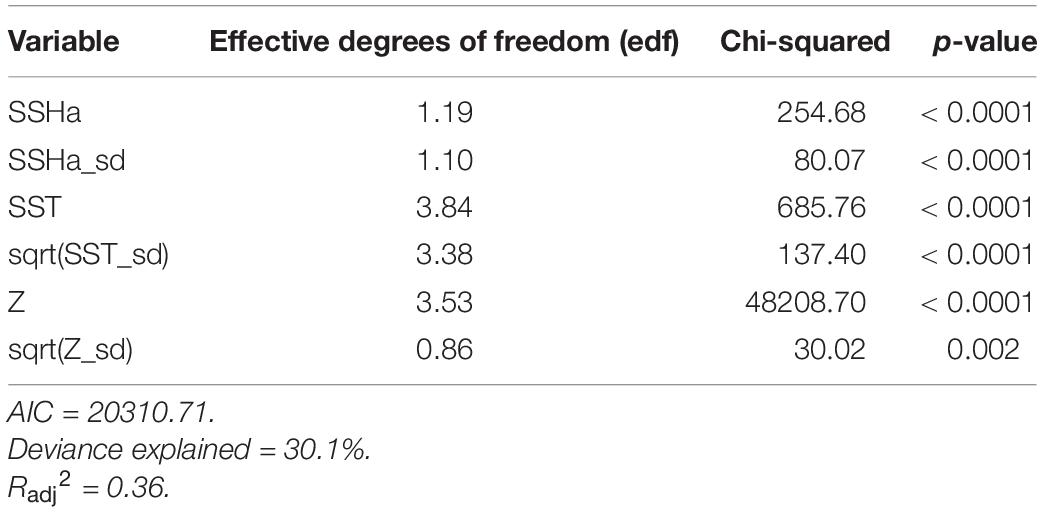
Table 4. Summary statistics from the final GAMM model of habitat suitability for hawksbill turtles in the Arabian Gulf from presence-availability data (n = 20909).
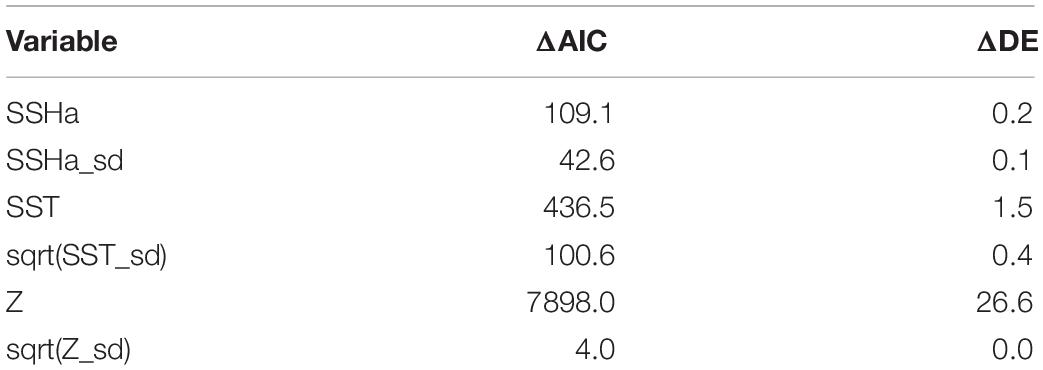
Table 5. Variable importance for the GAMM of habitat suitability was assessed by comparing the difference in AIC (ΔAIC) and the difference in percent deviance explained (ΔDE) following variable removal from the model. Larger values indicate greater variable importance.
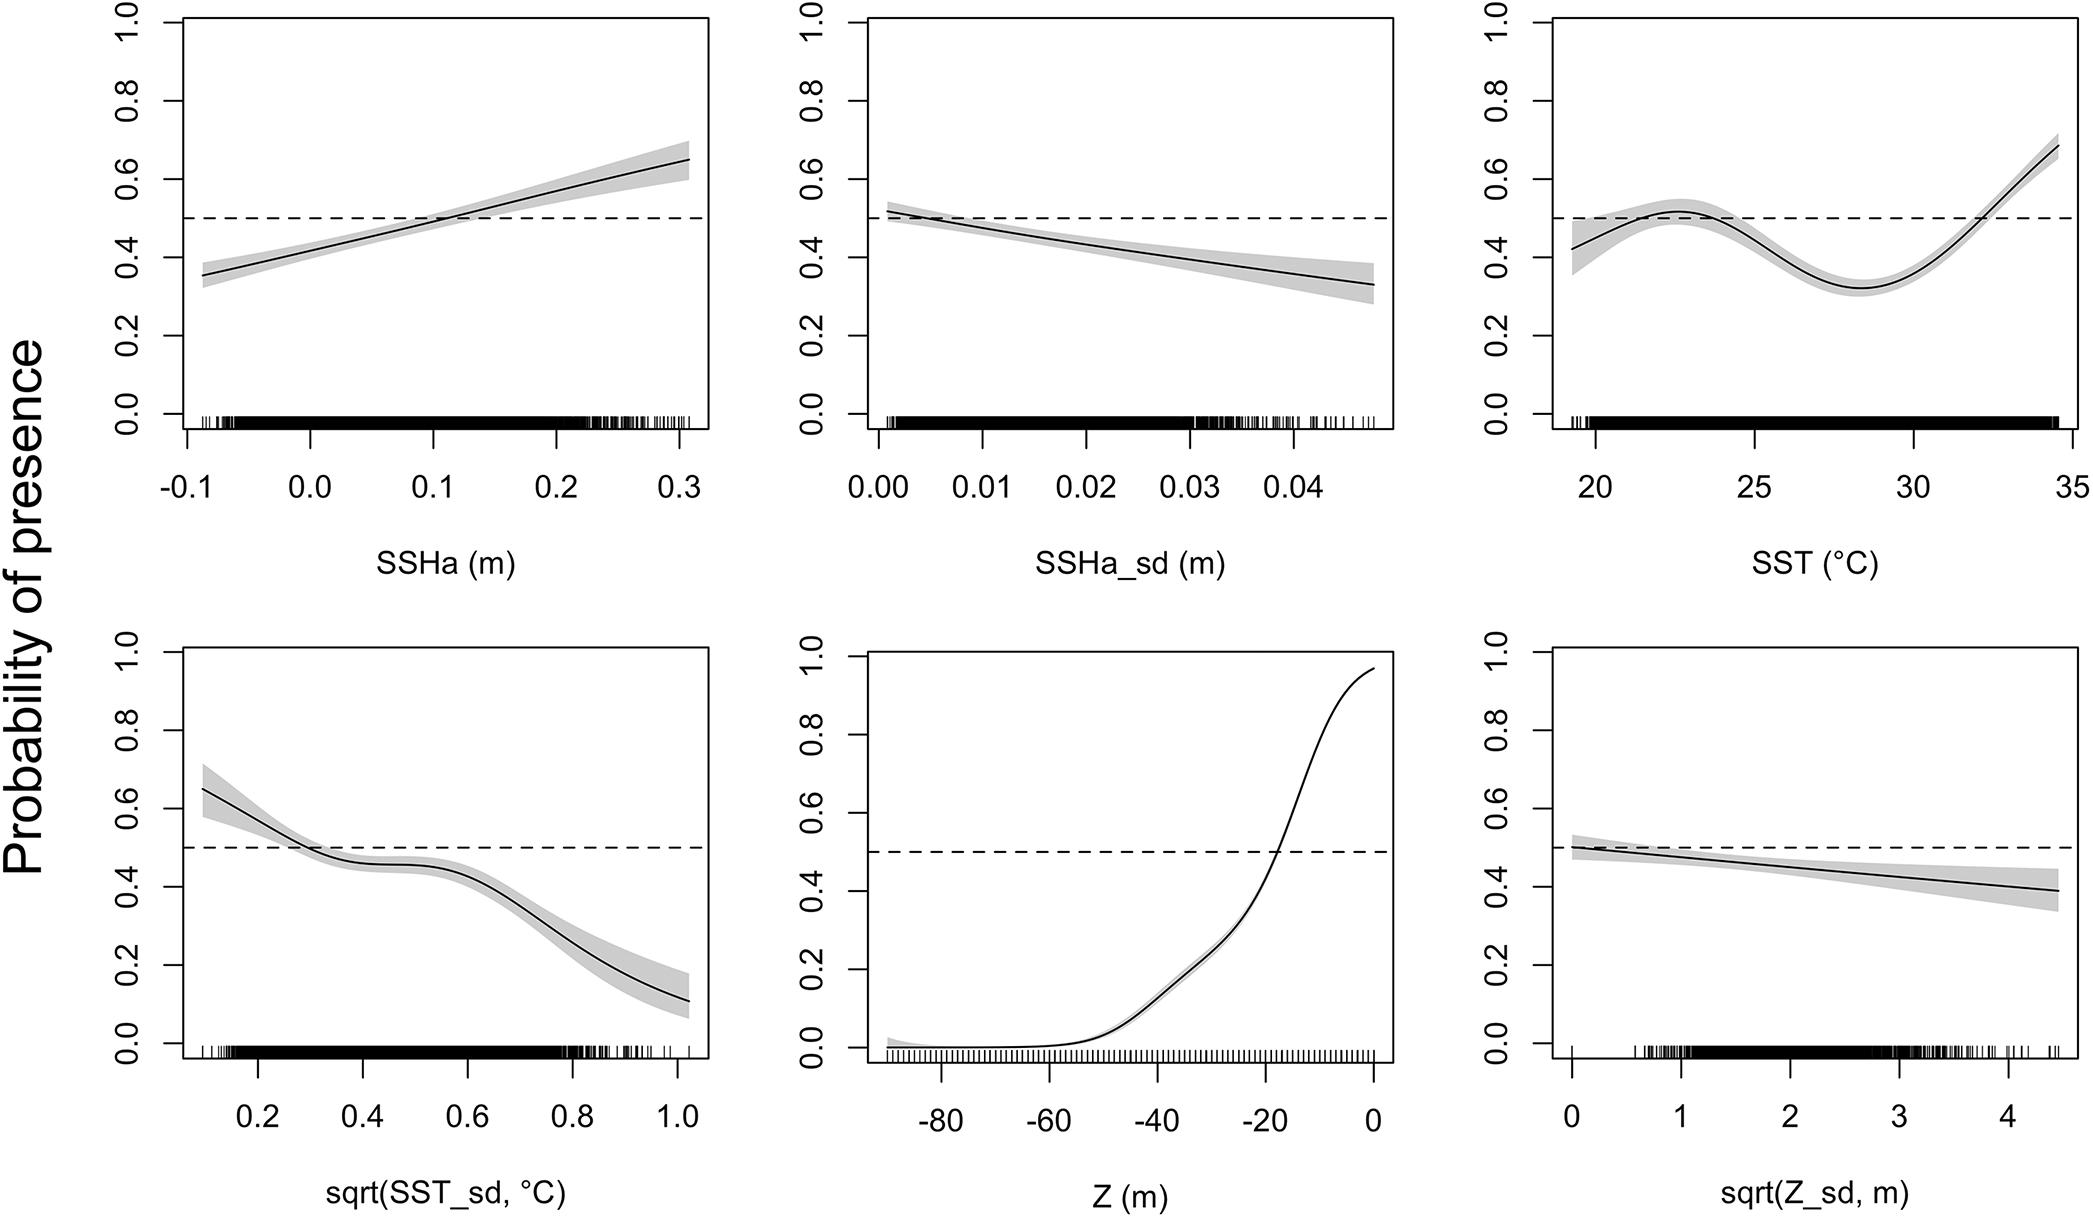
Figure 3. Response curves of the presence-availability species distribution model as analyzed by a generalized additive mixed model (GAMM). Environmental covariates acronyms represent sea surface height anomaly (SSHa), SSHa standard deviation (SSHa_sd), sea surface temperature (SST), square-root transformation of SST standard deviation [sqrt(SST_sd)], depth (Z), and square-root transformation of Z standard deviation [sqrt(Z_sd)]. Shaded regions indicate the 95% confidence interval and tick marks on the bottom indicate all presence and pseudo-absence values for the environmental variable.
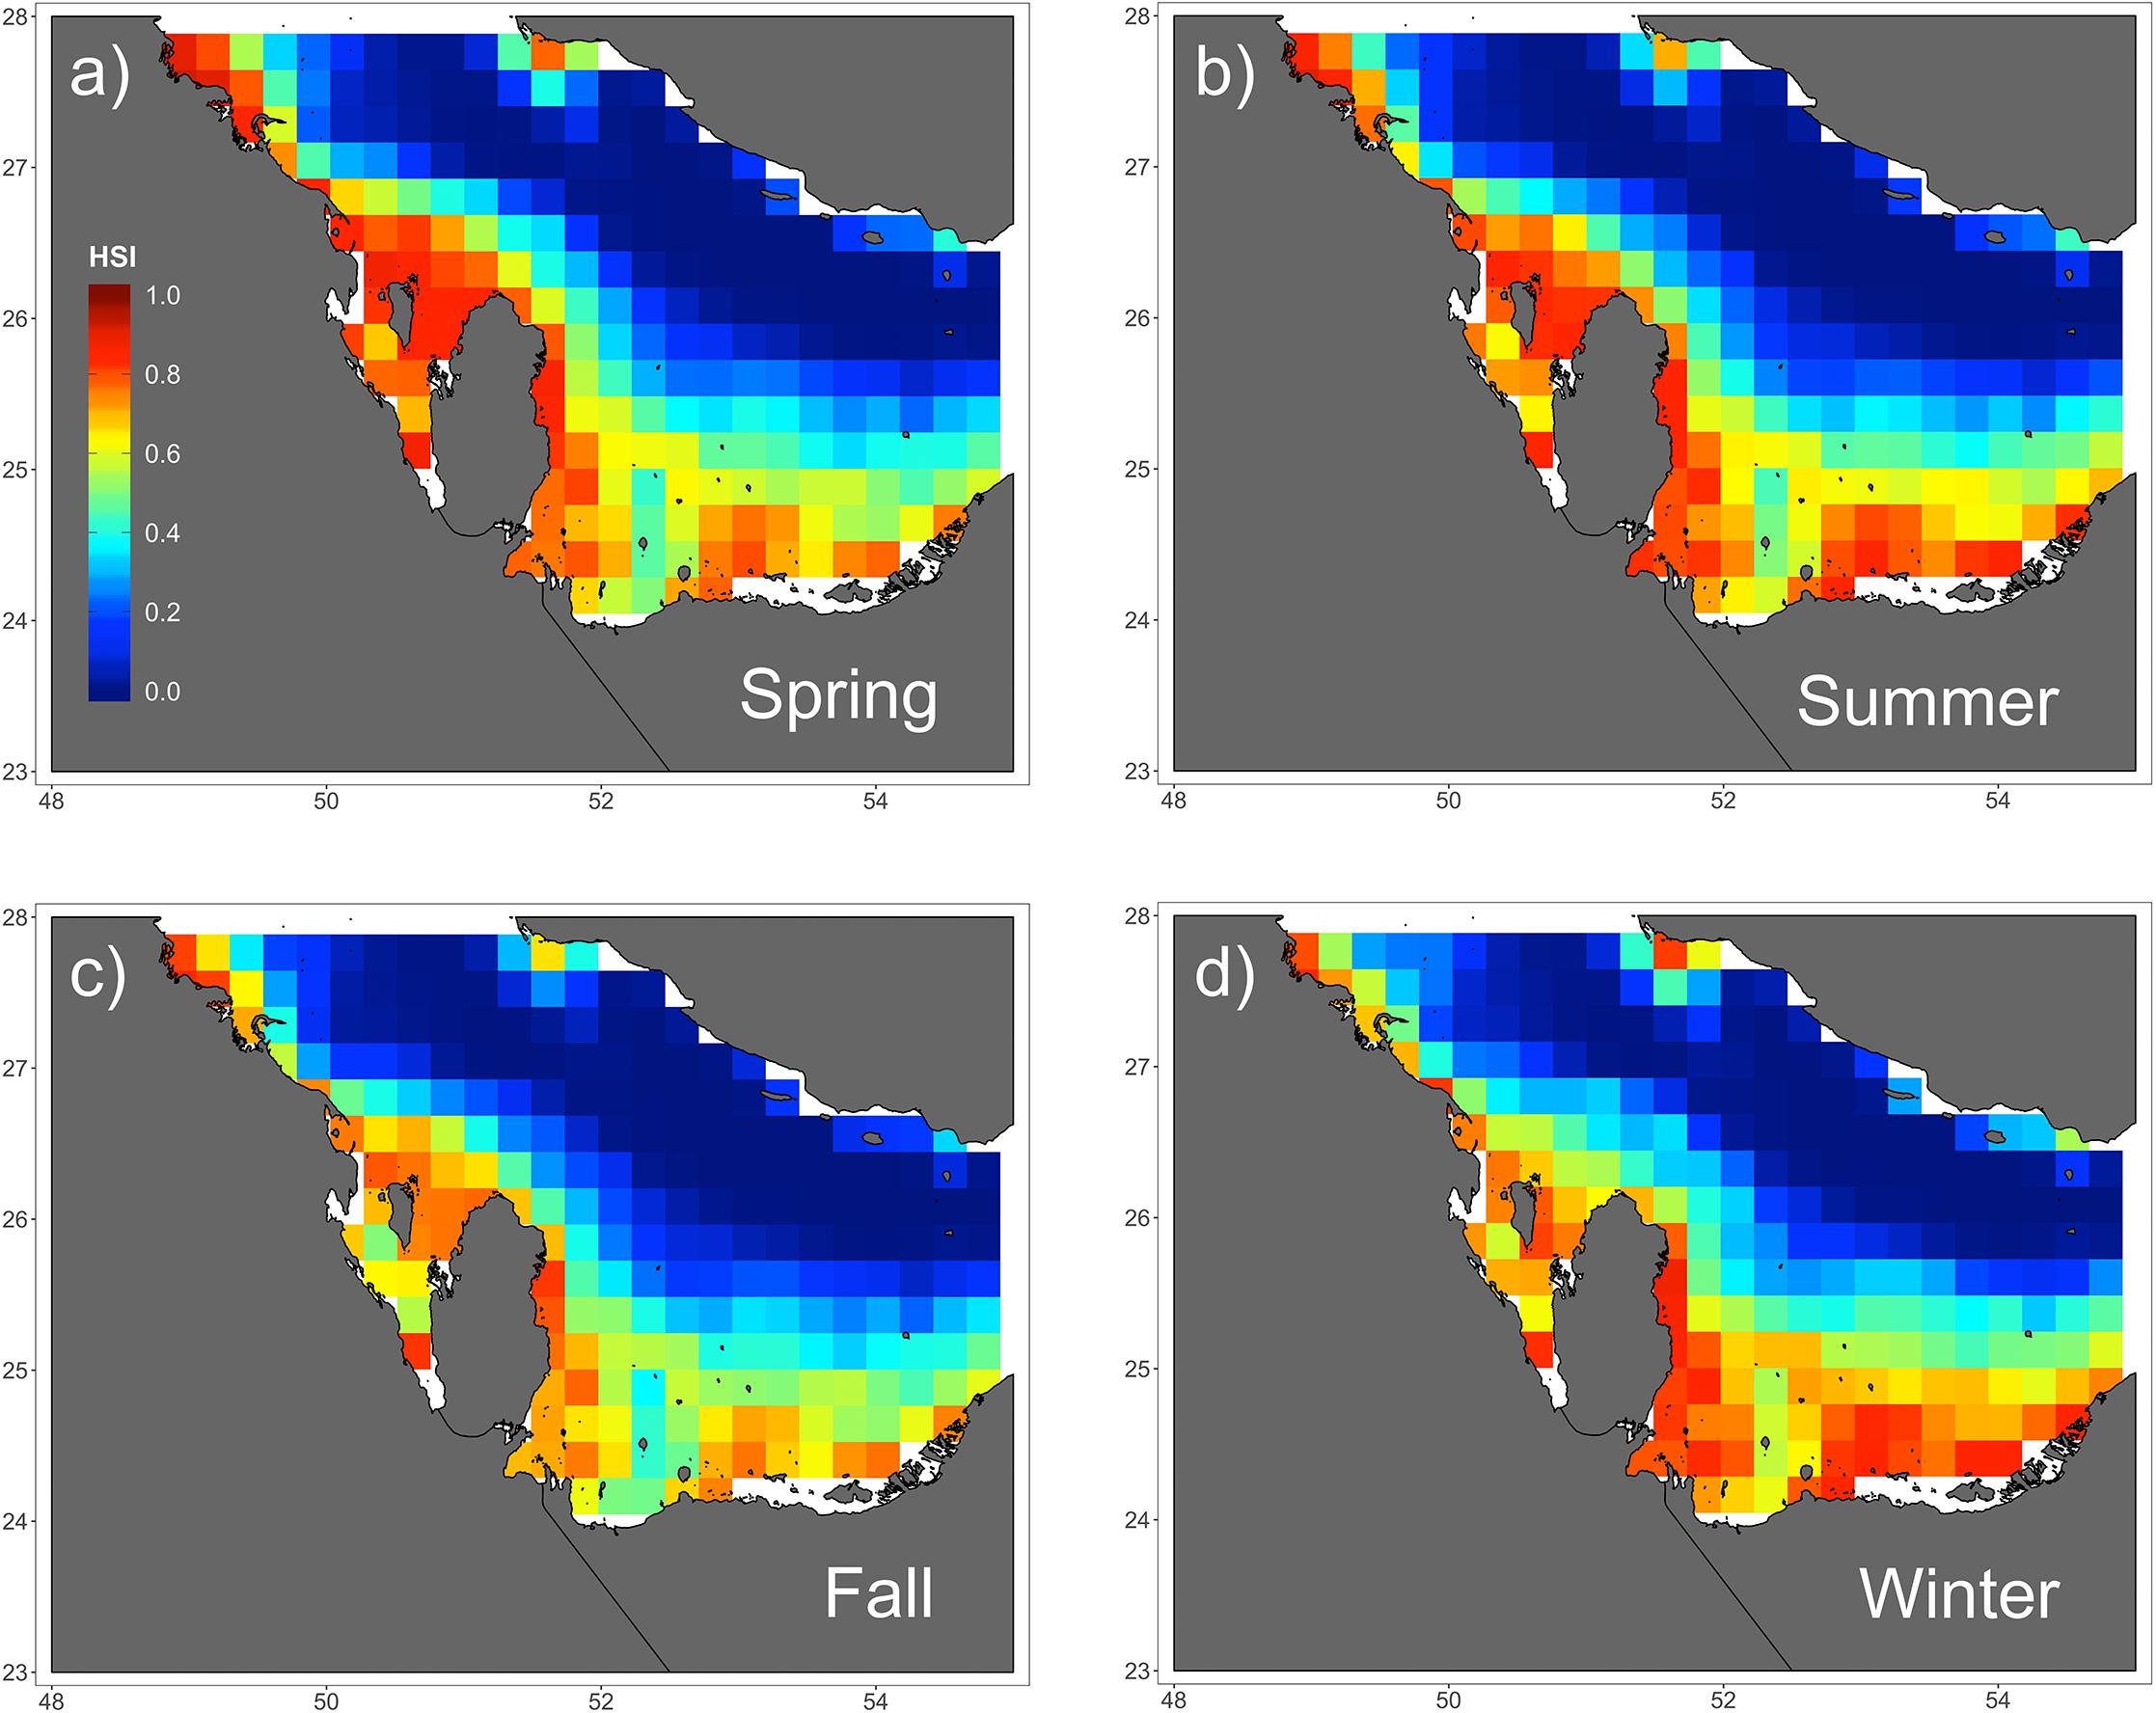
Figure 4. Seasonal predictions of habitat suitability (range: 0–1) for hawksbill turtles in the Arabian Gulf for (a) spring, (b) summer, (c) fall, and (d) winter. Spatial predictions of habitat suitability index (HSI) is shown across seasons based on the species distribution GAMM. There are slight variations among seasons, but all show high suitability along the southern coastline where there is shallow water.
Drivers of Offshore Migration
The four variables used in the final GAMM that characterized environmental drivers of depth occupied by hawksbills during summer migrations were all significant (Table 6). These migrations to regions of greater depth were associated with SSHa < 0 m, SST > 33°C, more pronounced thermal fronts, and BT < 32°C (Figure 5). These marginal effects plots are interpreted as the opposite to what is often standard (<0 indicates positive response) since depth was analyzed as increasingly negative values. The marginal effects from these variables indicate that bottom temperature (BT) was the most influential variable in predicting occupied depth, followed by SST, thermal fronts (SST_sd), and mesoscale eddies (SSHa) during this seasonal migration. These results were supported by comparisons of SST and BT at bathymetric depths occupied over time (Figure 6), as well as geographic patterns of movement with respect to the 30–50 m isobaths and water temperature (Figure 7). Additionally, seven individuals in the study moved toward deep-water habitat (30–50 m isobaths) on a seasonal basis (summer). SST collected from a representative location during 1 year of the study period (2015) ranged from ∼16°C to near 35°C, which is also typical for the region (Pilcher et al., 2014b; Marshall et al., 2018). SST began to significantly rise in June-July, peaked in August, and began to decline in September (Supplementary Table S2). Hawksbill turtle movement to the 30-50 m isobaths coincided with this rise in SST and BT. As SST temperature declined at the end of summer and at the onset of fall, most individuals moved back to shallow-water or fringe-reef habitat by the end of September.
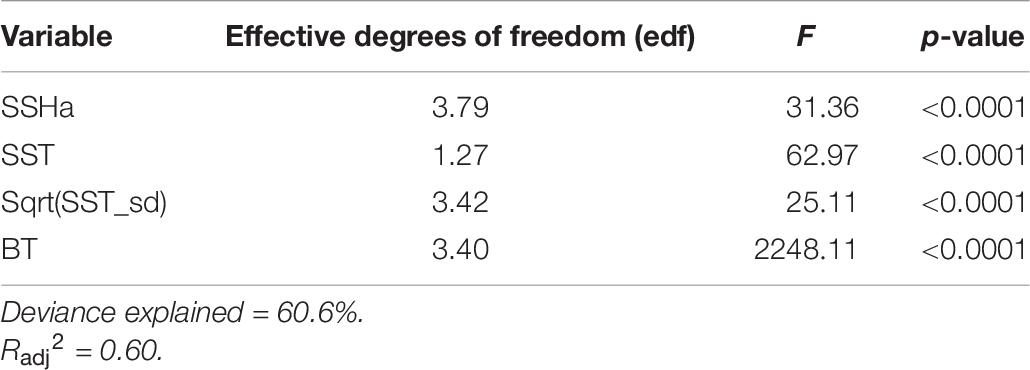
Table 6. Summary statistics from the final GAMM model that characterizes the environmental drivers of summer offshore migrations by hawksbill turtles (n = 1599).
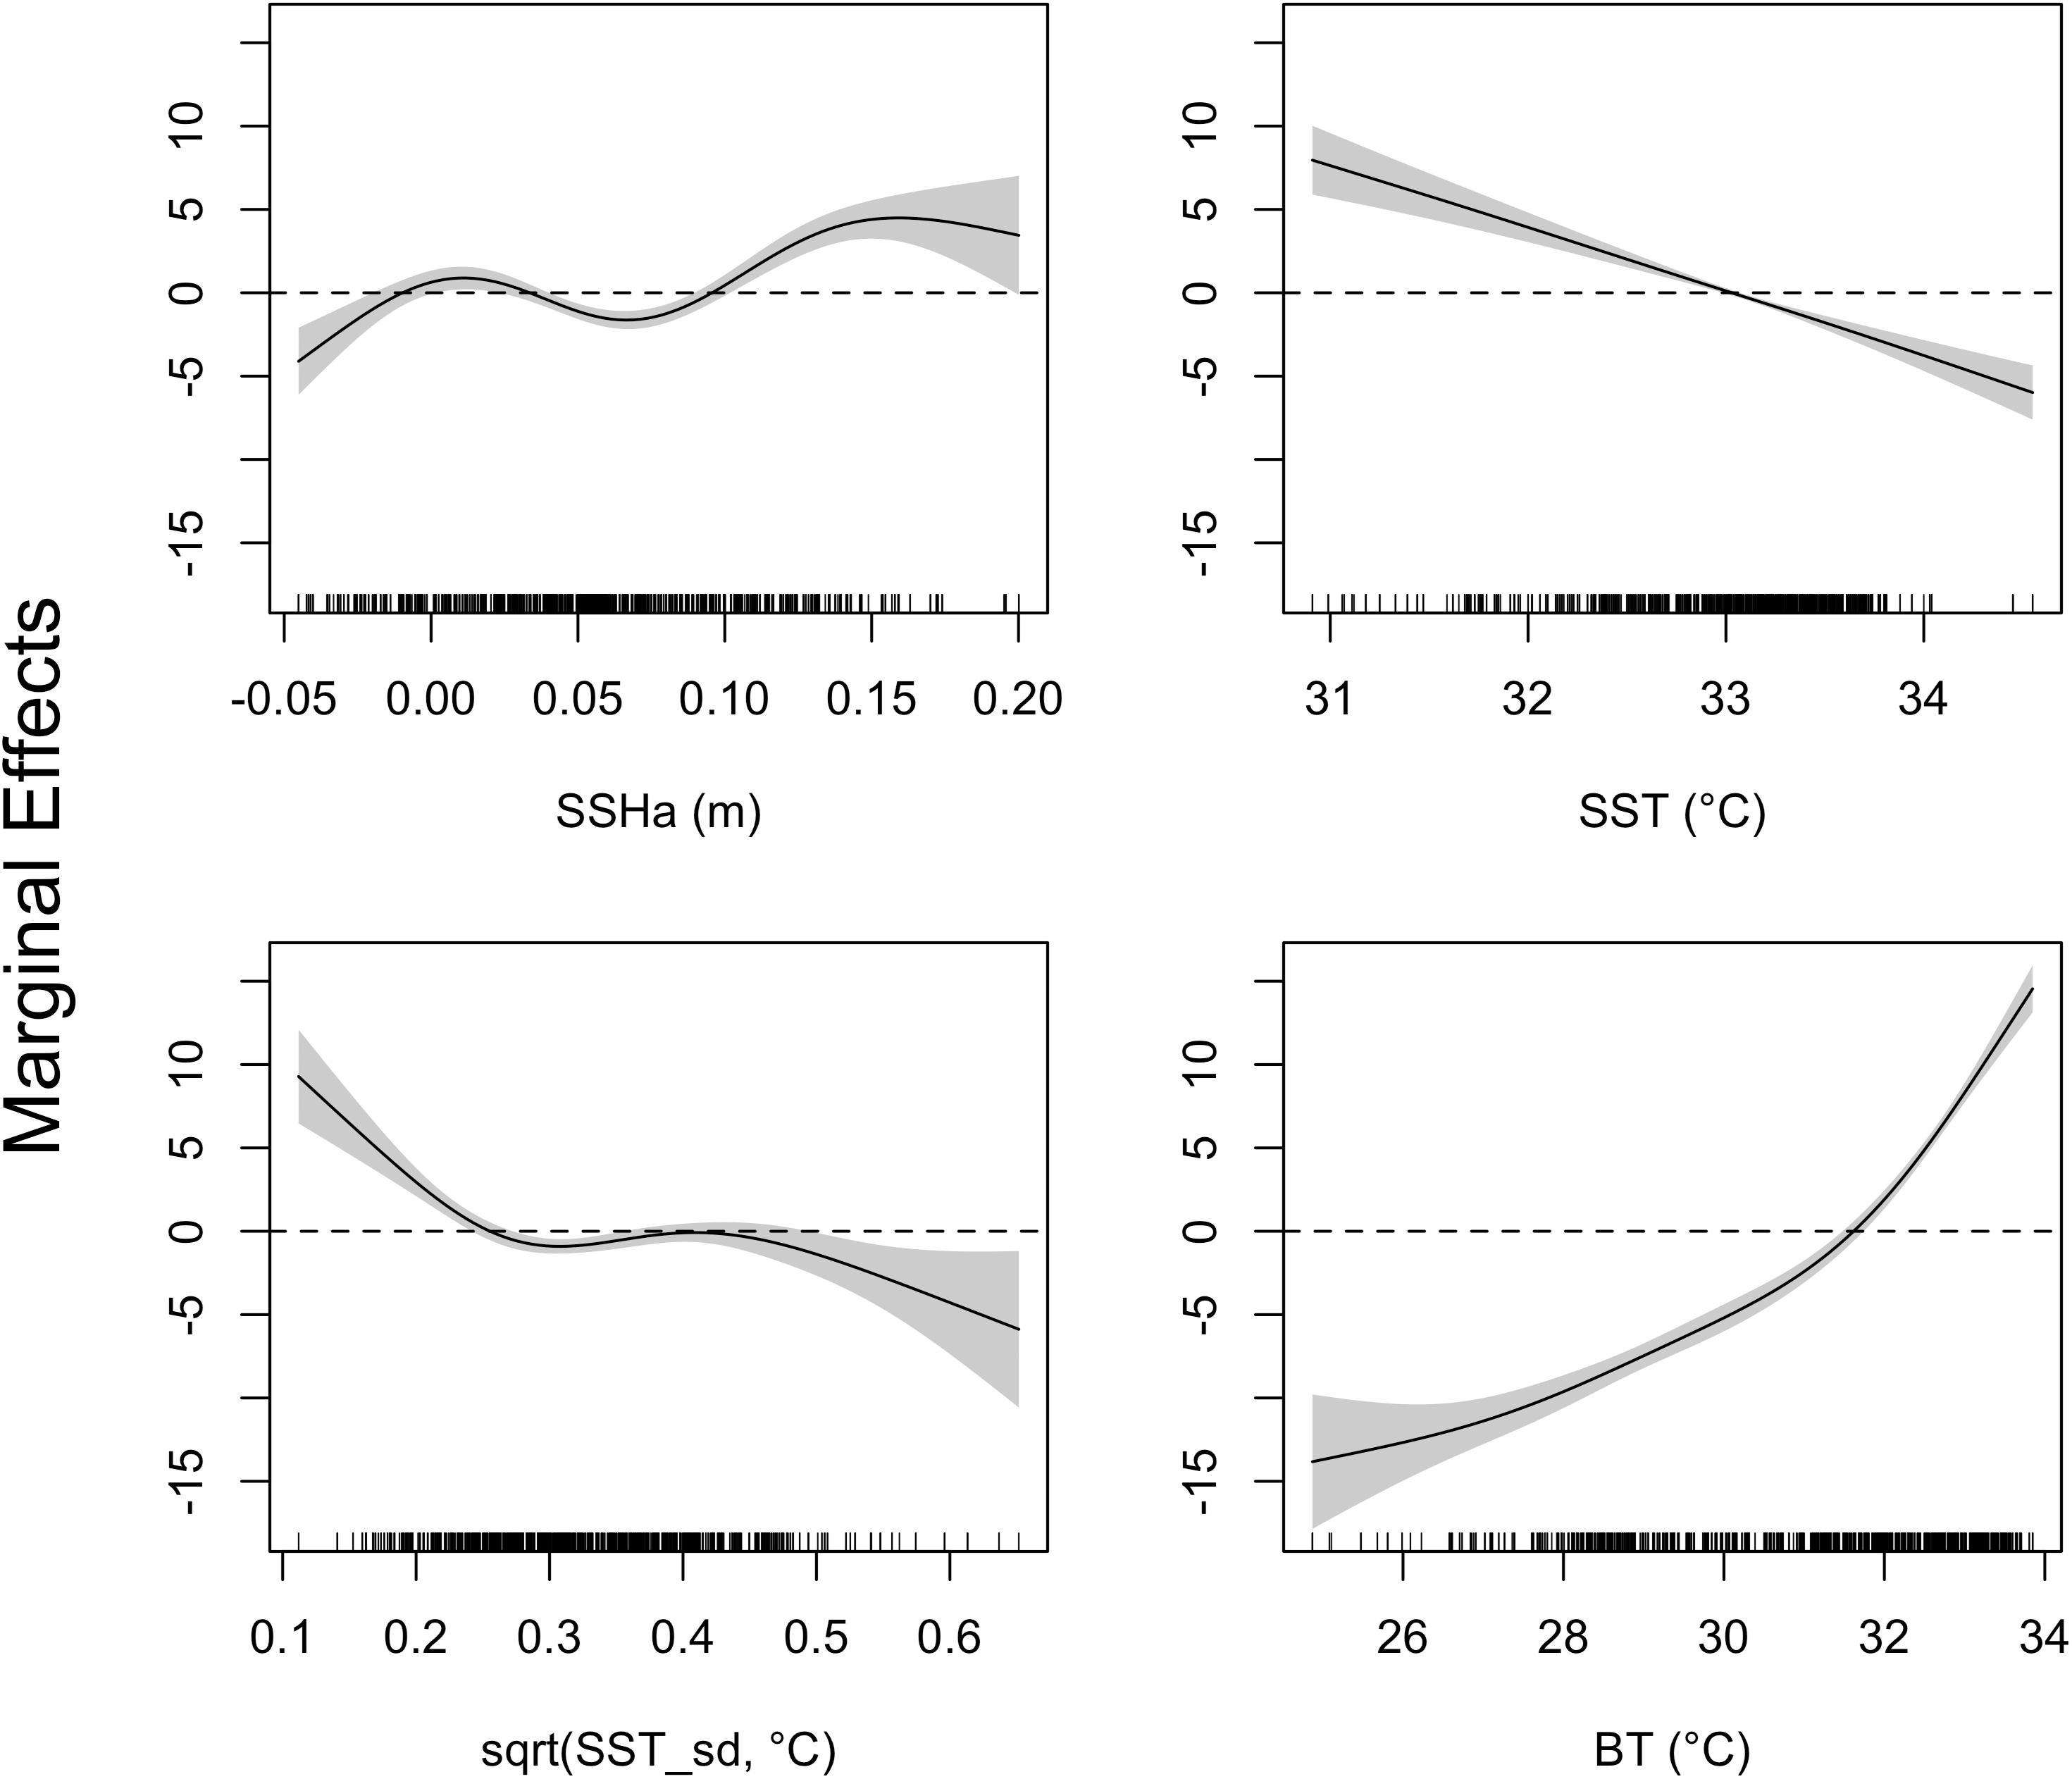
Figure 5. Response curves of the GAMM investigating environmental drivers of turtle migrations to deeper water. Environmental covariates acronyms represent sea surface height anomaly (SSHa), sea surface temperature (SST), square-root transformation of SST standard deviation [sqrt(SST_sd)], and bottom temperature (BT). Shaded regions indicate the 95% confidence interval and tick marks on the bottom indicate all values for each environmental variable. Compared to the typical interpretation of GAMM response plots, the inverse is done here since depth (Z) was analyzed as negative values.
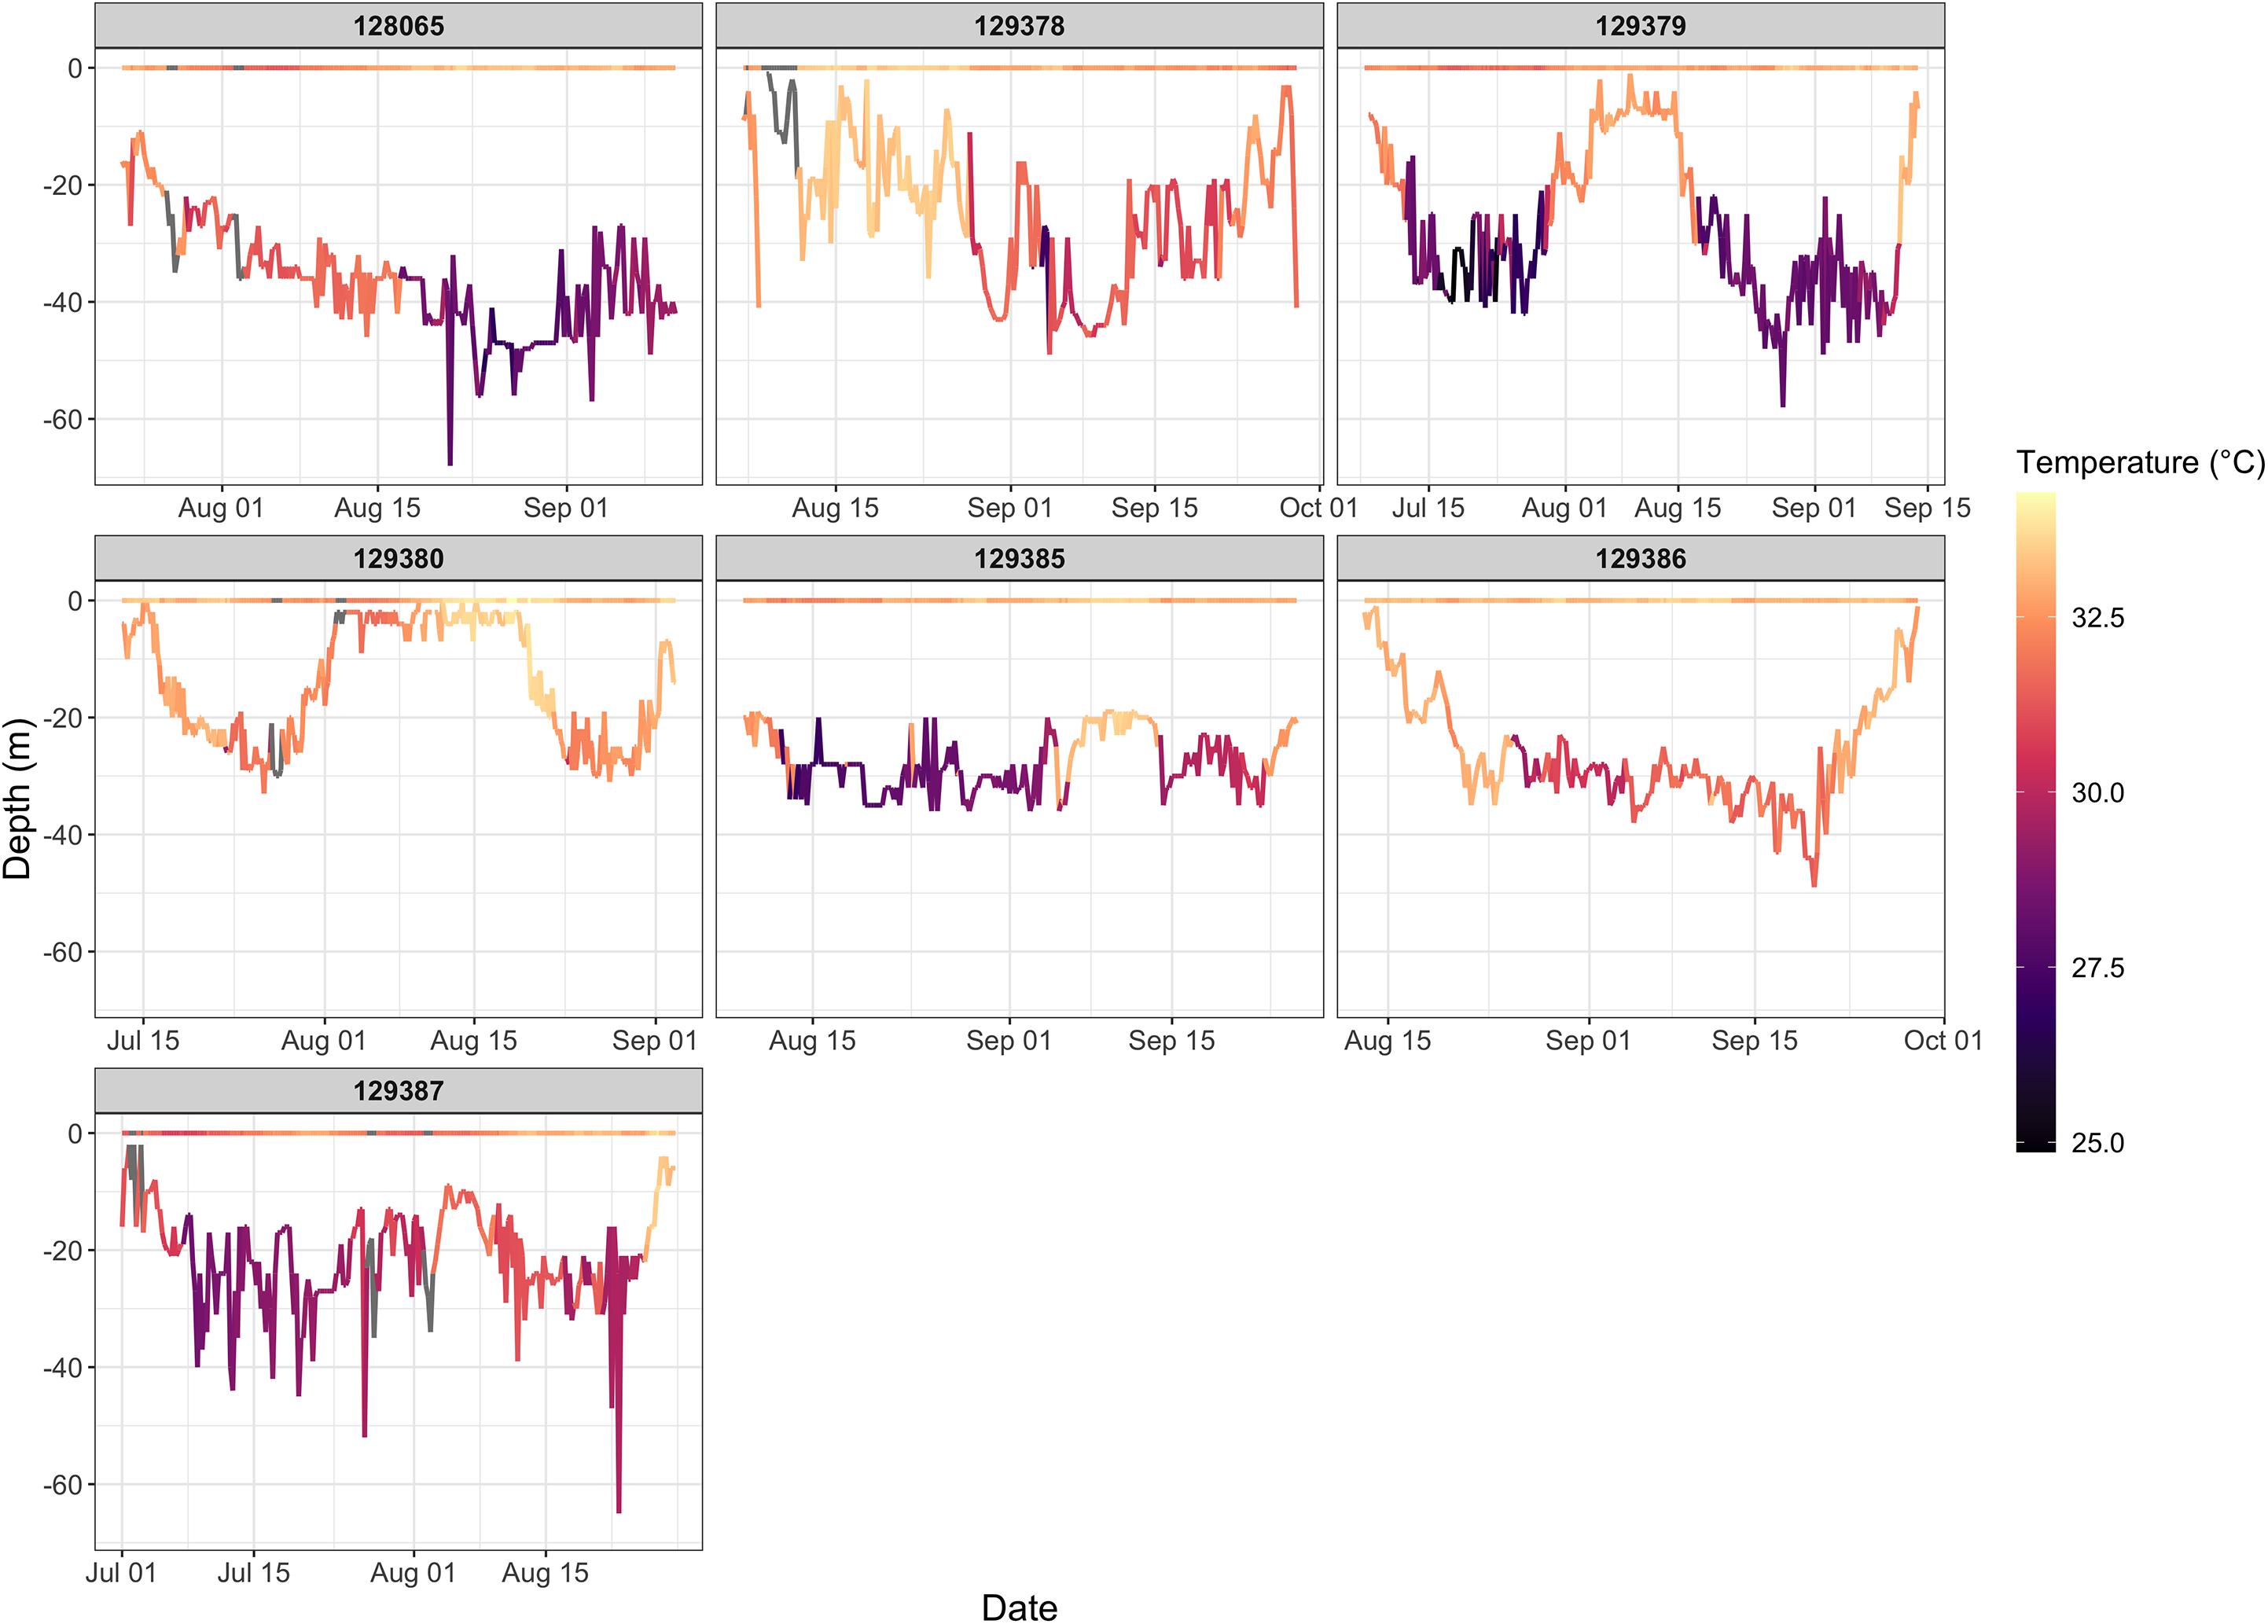
Figure 6. Time series of water temperature shown for all hawksbills that performed summer migrations. Temperatures are shown for both the surface and bathymetric depth at which the turtles were located. Hawksbills 129379, 129380, 129385, and 129387 display two separate migration periods as can be discerned from changes in depth and bottom temperature.
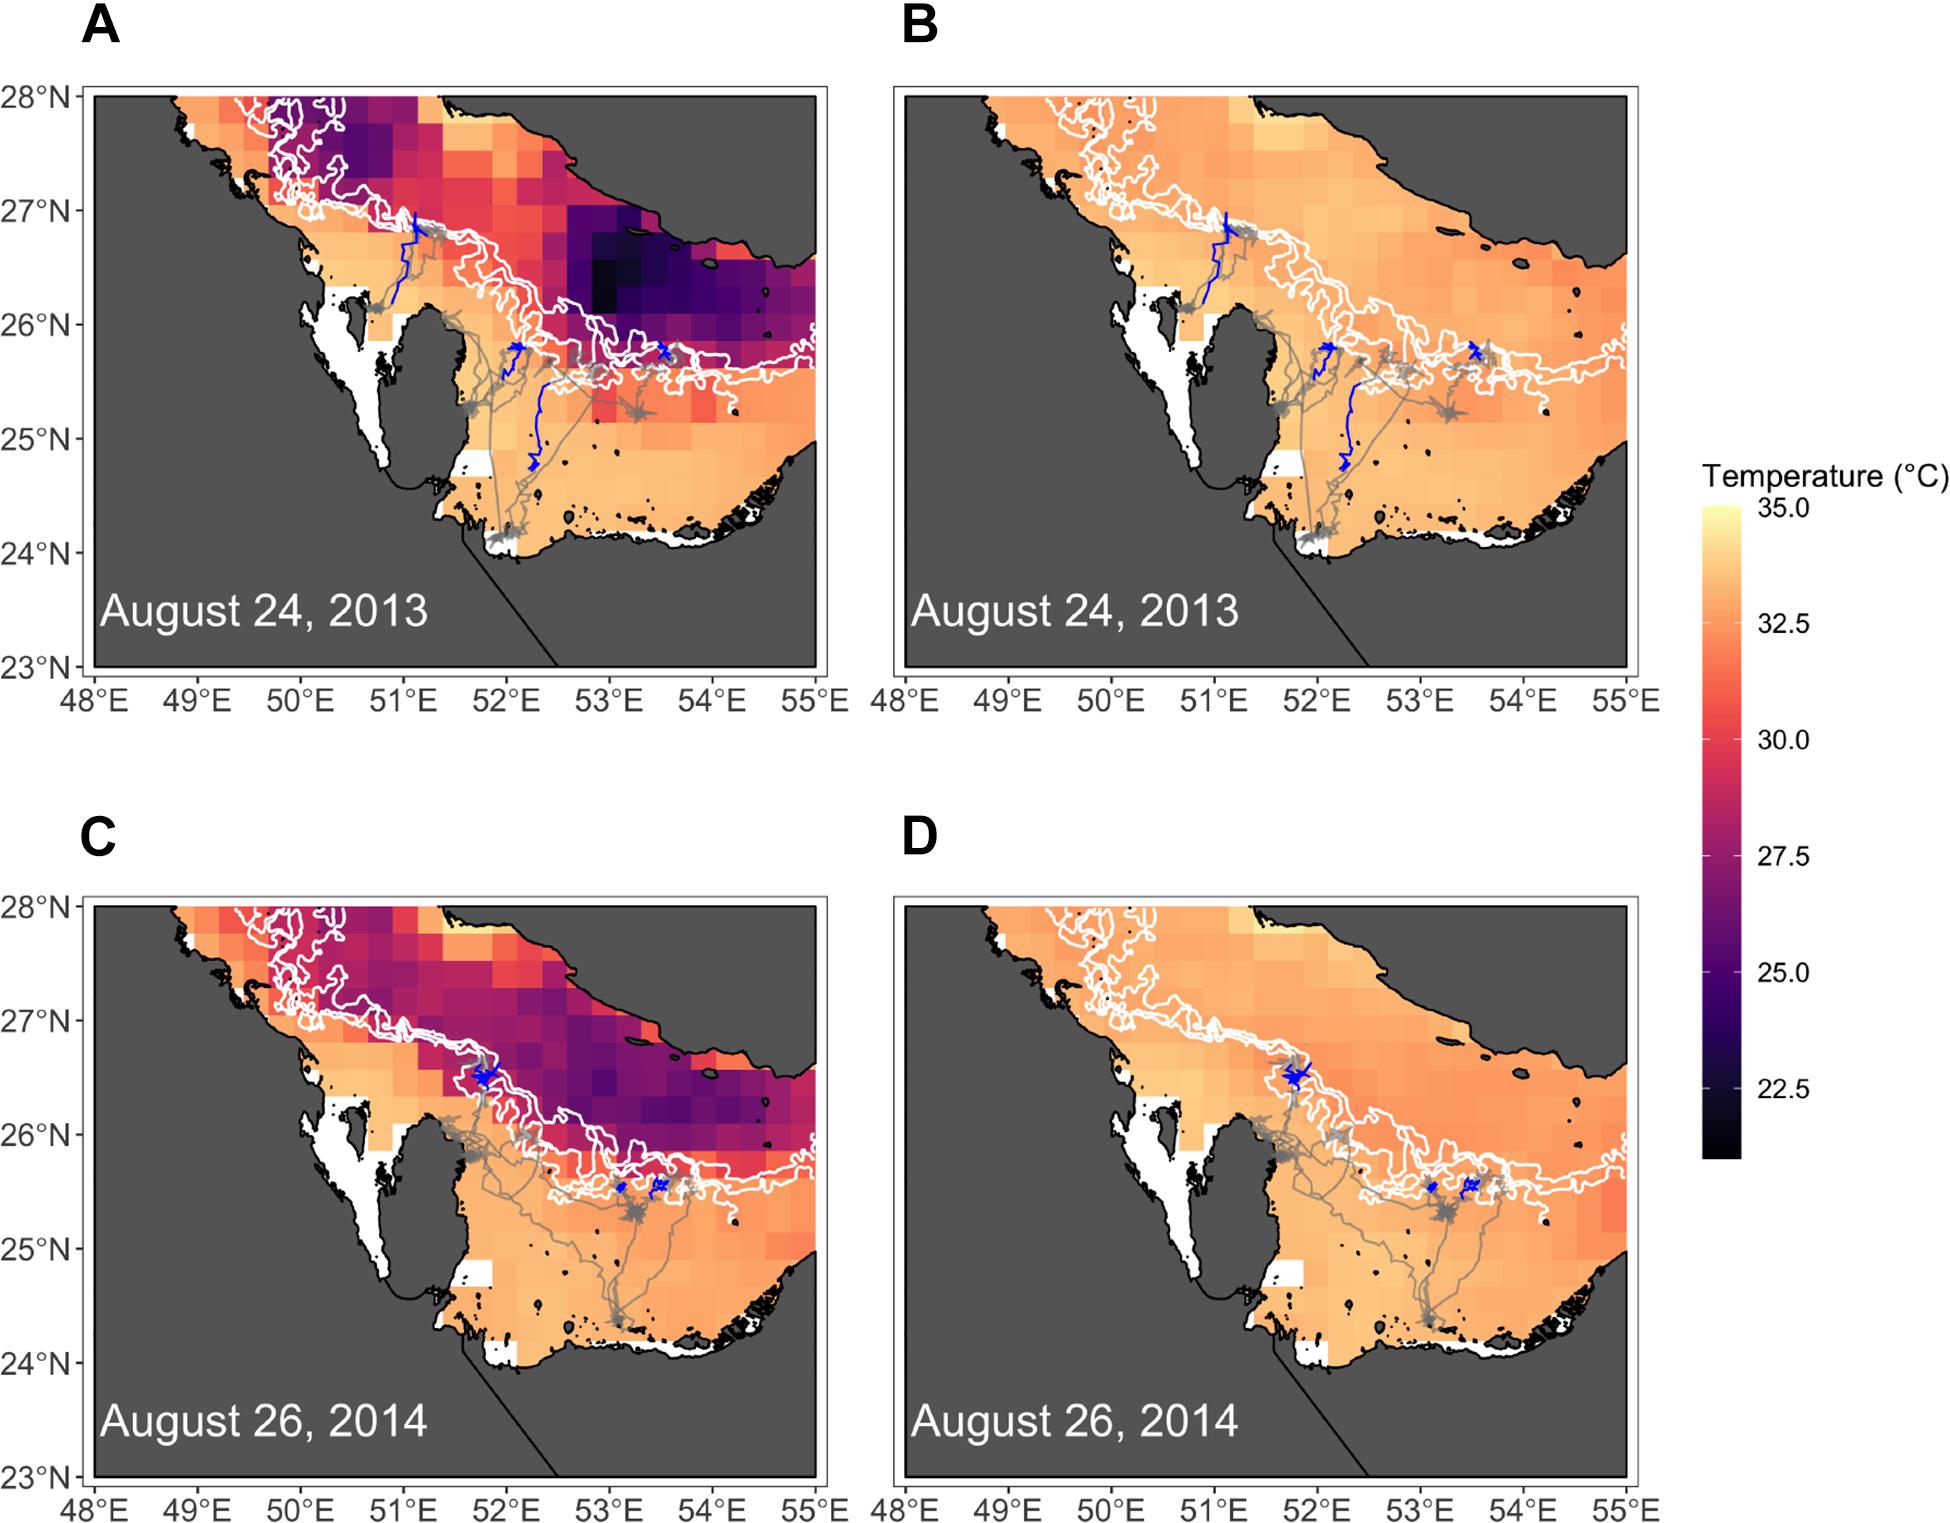
Figure 7. Maps show positions of hawksbills near the peak of their migratory movements in each year where migrations were detected (2013, 2014). Bottom temperatures (A,C) and surface temperatures (B,D) are shown, where white lines denote the 30, 40, and 50 m isobaths. The entirety of hawksbill tracks for each year are shown, but only the relocations from the week of each date are highlighted (blue).
Discussion
Space-Use
The use of state-space models to improve location estimates and make inference on animal behavioral states is now widespread within conservation studies across marine and terrestrial realms; these analytical tools for space-use and habitat suitability studies are considered to be essential analyses. While utilization distributions are sensitive to sample size (Sequeira et al., 2019), the data in this study begin to describe regions of hawksbill space-use (via KDE) over all movements after tagging. This differs from Pilcher et al. (2014b) where KDE during summer migration events was reported, but not for all movements. The wide region of habitat use by post-nesting hawksbills within and outside of the Qatari EEZ makes conservation efforts challenging. However, the use of SSSMs (to improve location estimates and classify latent behavioral states) and UDs (to determine space-use) facilitate the identification of hotspots that will be of importance to wildlife managers. This study identified several habitats that are highly used by Qatari hawksbills. At least five shallow hotspots (as indicated by the UDs and high ARS activity) are distributed along the eastern coast of Qatar from Al Ruwais in the north to Masaieed in the south, and further south into Saudi Arabia (south of Ras Abu Gamys and into Khor Dweihin near Ghagha Island) near the Saudi-UAE border. This likely translates to the entire north and east coast of Qatar (and into Saudi Arabia and the UAE), which averages 3–5 m in depth, as being important hawksbill habitat, and is supported by our species distribution modeling. The numerous offshore islands (particularly those with fringing reef habitat) were also important hotspots of intense habitat use by hawksbills in this study, as were deep-water habitats near the 30–50 m isobaths. Corridors between shallow and deep-water habitats should be considered equally important.
The core area of these hotspots varied greatly by individual and ranged from 80 to 11,000 km2, primarily due to differences in the number of relocations observed. This is a large area compared to other studies of core area use (i.e., van Dam and Diez, 1998; León and Diez, 1999; Cuevas et al., 2007; Blumenthal et al., 2009a; Hart et al., 2012; Wood et al., 2013, 2017; Hawkes et al., 2014) but is in line with similar data from the Dominican Republic (Hawkes et al., 2012). Within the Arabian Gulf, Pilcher et al. (2014a) reported a smaller foraging area for hawksbill turtles, but also documented some hawksbills that originated in Qatar that traveled to the Qatari west coast and north to the Saudi Arabia and even Kuwaiti coasts.
The relatively large core areas of use in the Arabian Gulf is likely related to the extreme SST, as well as BT in shallow waters (<5 m) and habitat loss. Extreme water temperatures and habitat loss may impose physiological constraints on hawksbills, where turtles in coastal areas must travel further to find thermal refugia in deeper water in addition to expanding their core areas of use to fulfill nutritional requirements as a result of scarce dietary resources. However, additional data are needed to substantiate these hypotheses. The Arabian Gulf has been experiencing a reduction in coral reef habitat (i.e., cover, diversity and survival) due to bleaching events (Riegl, 1999; Wilson et al., 2002; Riegl and Purkis, 2012; Burt et al., 2016) as well as rapid coastal development and expansion. In particular, large areas of hard corals along the northeast coastal area of Qatar (Al Ruwais to Ras Ashairij) are now dead and are just one indication of the widespread decline in coastal coral habitat (Riegl, 2019). The dynamics of the benthic ecology of this habitat has changed dramatically and is dominated by benthic macroalgae (personal observation). Offshore islands such as Halul still have viable fringing coral reef habitat, but even those reefs are beginning to degrade (Dupont, personal communication). Additionally the large core area of use reported here is not restricted to coastal areas but also includes offshore areas over deeper water at the terminus of summer looping migrations (as demonstrated in Figures 2, 6).
Deep-water habitats near the 30–50 m isobaths and those corridors from shallow, coastal hotspots are important to Qatari hawksbills. Seven individuals moved to this deep-water region seasonally when SST appeared to reach 33°C and BT reached 32°C. This SST phenomenon was reported by Pilcher et al. (2014b), substantiated in this study, and additional evidence is presented here that suggests it may be a more widespread phenomenon. Although the current movement patterns to deep-water habitats are seasonal, it is possible that time spent in deep-water habitats will lengthen as air and ocean temperatures increase over time. The 30–50 m isobath in the Arabian Gulf north and east of Qatar aligns with the location of a relatively steep bathymetric slope and increased bathymetric rugosity. If nutritional resources in this deep-water habitat are few, this could have negative consequences for hawksbill population sustainability in the Arabian Gulf. In the future, hawksbills may have to face a tradeoff between thermal refuge and foraging if indeed foraging opportunities in this deep-water habitat are fewer. However, the composition of the benthic community in this deep-water vertical habitat is not well documented and needs to be assessed in the context of hawksbill trophic ecology and foraging habitat quality.
The major counter-clockwise oceanographic current moving around and past the peninsula of Qatar is likely affected by this bathymetric slope. Although the Arabian Gulf has no upwelling analogous to that off the coast of Oman in the Arabian Sea and near the Strait of Hormuz (Nezlin et al., 2007), evidence suggests that the central region of the Arabian Gulf experiences an increase in primary productivity during the summer (i.e., high chlorophyll concentrations; Nezlin et al., 2007). This productivity event coincides with the migration of hawksbills to deeper water habitats in this region during the late summer and hawksbills may be exploiting resources rather than being nutritionally challenged. It is not known whether hawksbills in this deep-water habitat are diving to the bottom to forage, although it is likely. Hawksbills in the Pacific Ocean typically dive < 10 m but may go as deep as a 20 m (Gaos et al., 2012b). In the Atlantic Ocean, hawksbills appeared to preferentially forage on “deep ridge complex” reefs off of southeast Florida, United States (Wood et al., 2013, 2017) at 20–35 m in depth. Within the Caribbean, hawksbills have been reported to dive as deep as 47 m (Blumenthal et al., 2009c) and regularly forage at a median water depth of 54 m in offshore locations near the Dominican Republic (Hawkes et al., 2012). It has been suggested that large hawksbills in other parts of the world should be able to exploit a “benthic sponge belt” at 80–120 m (Blumenthal et al., 2009c) and that such foraging behavior may allow this species to mitigate the impact of climate change. Foraging in the deep-water habitat of the Arabian Gulf is well within the capability of hawksbills both ecologically and physiologically (Lutcavage and Lutz, 1997). Since body mass and size are correlated with dive depth (Blumenthal et al., 2009c), it is may be that only the largest adult hawksbills can exploit the deepest part of this habitat. This depth may be challenging for some Arabian Gulf hawksbills since they are among the smallest in body size in the world (Chatting et al., 2018). If hawksbills are successfully foraging at these greater depths, the vertical rugose habitat may serve to stratify foraging individuals by size (and age) and partition resources as suggested by Blumenthal et al. (2009c). Due to the relatively steep slope in this area, movement from depths of 50 m back to 30 m or shallower, where there may be additional foraging resources, could be accomplished within a short horizontal distance by hawksbills and make this deep-water habitat more nutritionally valuable.
Environmental Drivers of Hawksbill Movement
The timing of seasonal movements to deep-water habitats by turtles in this study appears to be correlated with the weakening of wind stress (Shamal winds) and seasonal high chlorophyll concentrations from late summer to early fall for the central Arabian Gulf (Nezlin et al., 2007). Our environmental data generally agree with Pilcher et al. (2014b) in that SST is a likely driver of turtle migration to deep-water habitats. However, this study also found that depth (Z), SST and sea surface height anomaly (SSHa) were the main environmental drivers of hawksbill habitat preference and that bottom temperature (BT) is also an important driver of migratory movement to deep-water habitats. Since the evidence suggest that vertical benthic habitat in this area is important to hawksbill turtles, future studies should target nesting females on offshore islands that are more likely to use deep-water habitats and incorporate the use of Time-Depth (TDR) or Conductivity-Temperature-Depth (CTD) biologging tags that also collect additional oceanographic data in real-time. In addition, surveys should be conducted to determine the composition of the benthic community in these rugose, slope areas to understand the importance of these vertical habitats to hawksbills and the ecological drivers of vertical habitat use.
Hawksbills in Qatar and throughout the southern Arabian Gulf are exploiting various habitats. For many it appears that adult hawksbills are using hard benthic habitats near the coast on a seasonal basis and that these habitats may or may not be viable coral heads. It is clear that many hawksbills are moving seasonally to offshore deep-water habitat during summer months (Pilcher et al., 2014b, this study), and individuals tagged on Halul Island are staying offshore and using fringing reef habitat and deep-water slope habitat (this study). Another viable alternative is that hawksbills may be using seagrass habitat as well. Although the northwest region of Qatar has extensive seagrass habitat, seagrasses are also found throughout the Qatari EEZ (SCENR, 2007) and specifically along Qatar’s east coast where this study identified numerous hotspots. Bjorndal and Bolten (2010) compared hawksbill habitat use of hard benthic substrate vs. seagrass habitat in the Bahamas. Although seagrass was considered a peripheral habitat, the variables of residence time, body condition and growth were similar between the two habitats in a comparison of habitat use size distribution. It was concluded that peripheral seagrass habitats could support hawksbill populations that where healthy and productive (Bjorndal and Bolten, 2010). In an extreme marine environment (broad range of SST, increased salinity) that is experiencing the decline of preferred coral reef habitat it is possible that Qatar and Arabian Gulf hawksbills are using, or may use, peripheral seagrass habitat as well. Indeed, the numerous hotspots identified in this study along the east coast of Qatar are just as likely to be pastures of seagrass or hard rocky substrate (SCENR, 2007).
In summary, SSSM corrected tracks demonstrate that hawksbills in the Arabian Gulf use a large core area. Movement data demonstrated that the entire east coast of Qatar, offshore islands with fringing reef habitat, deep-water habitats near the 30–50 m isobaths and those corridors connecting these hotspots were important to hawksbills. Our model of habitat suitability identified SSHa, SSHa_sd, SST, SST_sd, Z, Z_sd as important drivers of hawksbill movement. Of these variables, Z was the major driver followed by SST and SSHa/SST_sd with depth (Z) as the strongest indicator of habitat suitability. Our model of environmental drivers of offshore migration identified SSHa, SST, SST_sd, and BT as significant variables with BT as the most important driver followed by SST. Most individuals tracked over the hottest time of year did exhibit a migration. These data provide valuable information to managers seeking to conserve hawksbills in the region. Our data also provide a context to understand the underlying physiological, energetic (cost vs. benefits) and behavioral drivers of hawksbill movement in the Arabian Gulf. Future studies should incorporate TDR and CTD biologging tags and focus on hawksbill use of deep water habitat in the 30–50 m bathymetric slope region to understand the value of vertical habitat for hawksbills foraging, assess the benthic composition and begin to integrate nutritional ecology and energetic analyses to better understand the cost-benefit of movement patterns.
Data Availability Statement
The raw data supporting the conclusions of this article can be accessed at the Texas A&M University at Galveston Digital Repository: https://hdl.handle.net/1969.3/29781.
Ethics Statement
The animal study was reviewed and approved by Texas A&M University IACUC and Qatar University IACUC.
Author Contributions
CM wrote the QNRF grant, conducted the field work, assisted in data analyses, and wrote the manuscript. JC conducted the field work, led the modeling data analyses, and wrote the methods section regarding the modeling component of the manuscript. MA-A assisted in the writing of the QNRF grant, conducted the field work, lead the in-country field logistics, and assisted in writing the manuscript. SH conducted the field work and assisting in editing of the manuscript. MA-M assisted in writing the QNRF grant, assisted in obtaining Ministry of Environment permitting, and consulted on in-country logistical field work and research priorities for the State of Qatar prior to his early passing. All the authors contributed to manuscript revision, read and approved the submitted version.
Funding
This work was funded by the Qatar National Research Fund, National Priorities Research Program 5-642-1-110. The open access publishing fees for this article have been covered by the Texas A&M University Open Access to Knowledge Fund (OAKFund), supported by the University Libraries.
Conflict of Interest
The authors declare that the research was conducted in the absence of any commercial or financial relationships that could be construed as a potential conflict of interest.
Acknowledgments
We appreciate the additional support of the Department of Marine Biology at Texas A&M University at Galveston, the Environmental Science Center at Qatar University and the Qatar Ministry of Environment (now the Ministry of Municipality and Environment) rangers. We thank the following individuals for their assistance during the project: Azenith Castillo, Gil Rowe, Nick Pilcher, Salman Fahad Al-Mohanady, Ahmed Chikhi, Brian Kot, Julie Marie Anne Camo, and Wes Highfield.
Supplementary Material
The Supplementary Material for this article can be found online at: https://www.frontiersin.org/articles/10.3389/fmars.2020.549575/full#supplementary-material
Footnotes
References
Abdessalaam, T. (2007). Marine Environment and Re- Sources of Abu Dhabi. Abu Dhabi: Motivate Publishing.
Allouche, O., Tsoar, A., and Kadmon, R. (2006). Assessing the accuracy of species distribution models: prevalence, kappa and the true skill statistic (TSS). J. Appl. Ecol. 43, 1223–1232. doi: 10.1111/j.1365-2664.2006.01214.x
Al-Merghani, M., Miller, J. D., and Pilcher, N. (2000). The green and hawksbill turtles in the Kingdom of Saudi Arabia: synopsis of nesting studies 1986-1997. Fauna Arabia 18, 369–384.
Araújo, M. B., Pearson, R. G., Thuiller, W., and Erhard, M. (2005). Validation of species-climate impact models under climate change. Glob. Chang. Biol. 11, 1504–1513. doi: 10.1111/j.1365-2486.2005.01000.x
Bailey, H., Mate, B. R., Palacios, D. M., Irvine, L., Bograd, S. J., and Costa, D. P. (2009). Behavioural estimation of blue whale movements in the Northeast Pacific from state-space model analysis of satellite tracks. Endang. Sp. Res. 10:1. doi: 10.3354/esr00239
Barbet-Massin, M., Jiguet, F., Albert, C. H., and Thuiller, W. (2012). Selecting pseudo-absences for species distribution models: how, where and how many? Methods Ecol. Evol. 3, 327–338. doi: 10.1111/j.2041-210x.2011.00172.x
Bjorndal, K. A., and Bolten, A. B. (2010). Hawksbill sea turtles in seagrass pastures: success in a peripheral habitat. Mar. Biol. 157, 135–145. doi: 10.1007/s00227-009-1304-0
Blumenthal, J. M., Abreu-Grobois, F. A., Austin, T. J., Broderick, A. C., Bruford, M. W., Coyne, M. S., et al. (2009a). Turtle groups or turtle soup: dispersal patterns of hawksbill turtles in the Caribbean. Mol. Ecol. 18, 4841–4853. doi: 10.1111/j.1365-294x.2009.04403.x
Blumenthal, J. M., Austin, T. J., Bell, C. D. L., Bothwell, J. B., Broderick, A. C., Ebanks-Petrie, G., et al. (2009b). Ecology of hawksbill turtles, Eretmochelys imbricata, on a western Caribbean foraging ground. Chelon. Conserv. Biol. 8, 1–10. doi: 10.2744/ccb-0758.1
Blumenthal, J. M., Austin, T. J., Bothwell, J. B., Broderick, A. C., Ebanks-Petrie, G., Olynik, J. R., et al. (2009c). Diving behavior and movements of juvenile hawksbill turtles Eretmochelys imbricata on a Caribbean coral reef. Coral Reefs 28:5. doi: 10.1007/s00338-008-0416-1
Burt, J. A., Smith, E. G., Warren, C., and Dupont, J. (2016). An assessment of Qatar’s coral communities in a regional context. Mar. Poll. Bull. 105, 473–479. doi: 10.1016/j.marpolbul.2015.09.025
Calenge, C. (2006). The package adehabitat for the R software: a tool for the analysis of space and habitat use by animals. Ecol. Model. 197, 516–519. doi: 10.1016/j.ecolmodel.2006.03.017
Carr, A., Hirth, H., and Ogren, L. (1966). The ecology and migrations of sea turtles. 6. The hawksbill turtle in the Caribbean Sea. Am. Mus. Novit. 28, 1–29.
Cayula, J. F., and Cornillon, P. (1992). Edge detection algorithm for SST images. J. Atmos. Ocean. Technol. 9, 67–80. doi: 10.1175/1520-0426(1992)009<0067:edafsi>2.0.co;2
Chassignet, E. P., Hurlburt, H. E., Smedstad, O. M., Halliwell, G. R., Hogan, P. J., Wallcraft, A. J., et al. (2007). The HYCOM (HYbrid Coordinate Ocean Model) data assimilative system. J. Mar. Syst. 65, 60–83. doi: 10.1016/j.jmarsys.2005.09.016
Chatting, M., Smyth, D., Al-Maslamani, I., Obbard, J., Al-Ansi, M., Hamza, S., et al. (2018). Nesting ecology of hawksbill turtles, Eretmochelys imbricata, in an extreme environmental setting. PLoS One 13:e0203257. doi: 10.1371/journal.pone.0203257
Coles, S. L., and Riegl, B. M. (2013). Thermal tolerances of reef corals in the Gulf: a review of the potential for increasing coral survival and adaptation to climate change through assisted translocation. Mar. Poll. Bull. 72, 323–332. doi: 10.1016/j.marpolbul.2012.09.006
Cuevas, E., Liceaga-Correa, M., and Garduño-Andrade, M. (2007). Spatial characterization of a foraging area for immature hawksbill turtles (Eretmochelys imbricata) in Yucatan, Mexico. Amphib. Rep. 28, 337–346. doi: 10.1163/156853807781374683
Elith, J., Graham, C. H., Anderson, R. P., Dudík, M., Ferrier, S., Guisan, A., et al. (2006). Novel methods improve prediction of species’ distributions from occurrence data. Ecography 29, 29–151. doi: 10.1111/j.2006.0906-7590.04596.x
Feary, D. A., Burt, J. A., Bauman, A. G., Usseglio, P., Sale, P. F., and Cavalcante, G. H. (2010). Fish communities on the world’s warmest reefs: what can they tell us about the effects of climate change in the future? J. Fish Biol. 77, 1931–1947. doi: 10.1111/j.1095-8649.2010.02777.x
Gaos, A. R., Lewison, R. L., Yanez, I. L., and Wallace, B. P. (2012a). Shifting the life-history paradigm: discovery of novel habitat use by hawksbill turtles. Biol. Lett. 8, 54–56. doi: 10.1098/rsbl.2011.0603
Gaos, A. R., Lewison, R. R., Wallace, B. P., Yañez, I. L., Liles, M. J., Baquero, A., et al. (2012b). Dive behaviour of adult hawksbills (Eretmochelys imbricata, Linnaeus 1766) in the eastern Pacific Ocean highlights shallow depth use by the species. J. Exp. Mar. Biol. Ecol. 432, 171–178. doi: 10.1016/j.jembe.2012.07.006
Gelman, A., and Rubin, D. B. (1992). Inference from iterative simulation using multiple sequences. Statist. Sci. 7, 457–472. doi: 10.1214/ss/1177011136
Gorelick, N., Hancher, M., Dixon, M., Ilyushchenko, S., Thau, D., and Moore, R. (2017). Google earth engine: planetary-scale geospatial analysis for everyone. Remote Sens. Environ. 202, 18–27. doi: 10.1016/j.rse.2017.06.031
Hanley, J. A., and McNeil, B. J. (1982). The meaning and use of the area under a receiver operating characteristic (ROC) curve. Radiology 143, 29–36. doi: 10.1148/radiology.143.1.7063747
Hart, K. M., Sartain, A. R., Fujisaki, I., Pratt, H. L. Jr., Morley, D., and Feeley, M. W. (2012). Home range, habitat use, and migrations of hawksbill turtles tracked from Dry Tortugas National Park, Florida, USA. Mar. Ecol. Progr. Ser. 457, 193–207. doi: 10.3354/meps09744
Hart, K. M., Zawada, D. G., Fujisaki, I., and Lidz, B. H. (2013). Habitat use of breeding green turtles Chelonia mydas tagged in Dry Tortugas National Park: making use of local and regional MPAs. Biol. Cons. 161, 142–154.
Hawkes, L. A., McGowan, A., Broderick, A. C., Gore, S., Wheatley, D., White, J., et al. (2014). High rates of growth recorded for hawksbill sea turtles in Anegada, British Virgin Islands. Ecol. Evol. 4, 1255–1266. doi: 10.1002/ece3.1018
Hawkes, L. A., Tomás, J., Revuelta, O., León, Y. M., Blumenthal, J. M., Broderick, A. C., et al. (2012). Migratory patterns in hawksbill turtles described by satellite tracking. Mar. Ecol. Progr. Ser. 461, 223–232. doi: 10.3354/meps09778
Hays, G. C., Ferreira, L. C., Sequeira, A. M., Meekan, M. G., Duarte, C. M., Bailey, H., et al. (2016). Key questions in marine megafauna movement ecology. Trends Ecol. Evol. 31, 463–475. doi: 10.1016/j.tree.2016.02.015
Hazen, E. L., Palacios, D. M., Forney, K. A., Howell, E. A., Becker, E., Hoover, A., et al. (2017). WhaleWatch: a dynamic management tool for predicting blue whale density in the California current. J. Appl. Ecol. 54, 1415–1428. doi: 10.1111/1365-2664.12820
Hazen, E. L., Scales, K. L., Maxwell, S. M., Briscoe, D. K., Welch, H., Bograd, S. J., et al. (2018). A dynamic ocean management tool to reduce bycatch and support sustainable fisheries. Sci. Adv. 4:eaar3001. doi: 10.1126/sciadv.aar3001
Hesni, M. A., Rezaie-Atagholipour, M., Zangiabadi, S., Tollab, M. A., Moazeni, M., Jafari, H., et al. (2019). Monitoring hawksbill turtle nesting sites in some protected areas from the Persian Gulf. Acta Oceanol. Sin. 38, 43–51. doi: 10.1007/s13131-019-1514-3
Hijmans, R. J. (2019). raster: Geographic Data Analysis and Modeling. R Package Version 2.9-5. Available online at: https://CRAN.R-project.org/package=raster (accessed September 17, 2020).
Hijmans, R. J., Phillips, S., Leathwick, J., and Elith, J. (2017). dismo: Species Distribution Modeling. R Package Version 1.1-4. Available online at: https://CRAN.R-project.org/package=dismo (accessed September 17, 2020).
Hume, B. C., D’Angelo, C., Smith, E. G., Stevens, J. R., Burt, J., and Wiedenmann, J. (2015). Symbiodinium thermophilum sp. nov. a thermotolerant symbiotic alga prevalent in corals of the world’s hottest sea the Persian/Arabian Gulf. Sci. Rep. 5:8562. doi: 10.1038/srep08562 (accessed September 17, 2020).
Jonsen, I. (2016). Joint estimation over multiple individuals improves behavioural state inference from animal movement data. Sci. Rep. 6:20625. doi: 10.1038/srep20625
Jonsen, I. D., Flemming, J. M., and Myers, R. A. (2005). Robust state-space modeling of animal movement data. Ecololgy 86, 2874–2880. doi: 10.1890/04-1852
Jonsen, I. D., Myers, R. A., and James, M. C. (2007). Identifying leatherback turtle foraging behaviour from satellite telemetry using a switching state-space model. Mar. Ecol. Progr. Ser. 33, 255–264. doi: 10.3354/meps337255
Kareiva, P., and Odell, G. (1987). Swarms of predators exhibit “preytaxis” if individual predators use area-restricted search. Am. Nat. 130, 233–270. doi: 10.1086/284707
Kie, J. G. (2013). A rule-based ad hoc method for selecting a bandwidth in kernel home-range analyses. Ann. Biotelem. 1:13. doi: 10.1186/2050-3385-1-13
León, Y. M., and Diez, C. E. (1999). Population structure of hawksbill turtles on a foraging ground in the Dominican republic. Chelon. Conserv. Biol. 3, 230–236.
Lopez, R., and Malardé, J. P. (2011). Improving ARGOS Doppler Location using Kalman Filtering. France: Ramonville Saint-Agne.
Lopez, R., Malarde, J. P., Royer, F., and Gaspar, P. (2014). Improving Argos doppler location using multiple-model Kalman filtering. IEEE Trans. Geosci. Remote Sens. 52, 4744–4755. doi: 10.1109/tgrs.2013.2284293
Lutcavage, M. E., and Lutz, P. L. (1997). “Diving physiology,” in The Biology of Sea Turtles, eds P. L. Lutz, and J. A. Musick (Boca Raton, FL: CRC press).
Marshall, C. D., Al-Ansi, M., Dupont, J., Warren, C., Al-Shaikh, I., and Cullen, J. (2018). Large dugong (Dugong dugon) aggregations persist in coastal Qatar. Mar. Mamm. Sci. 34, 1154–1163. doi: 10.1111/mms.12497
Martins, E. G., Gutowsky, L. F., Harrison, P. M., Flemming, J. E. M., Jonsen, I. D., Zhu, D. Z., et al. (2014). Behavioral attributes of turbine entrainment risk for adult resident fish revealed by acoustic telemetry and state-space modeling. Biotelemetry 2:13. doi: 10.1186/2050-3385-2-13
Meakins, R. H., and Al-Mohanna, S. Y. (2004). Sea Turtles of Kuwait. Kuwait City: Centre for Research and Studies on Kuwait.
Meshal, A. M., and Hassan, H. M. (1986). Evaporation from the coastal water of the central part of the Gulf. Arab. Gulf J. Sci. Res. 4, 649–655.
Meylan, A. (1988). Spongivory in hawksbill turtles: a diet of glass. Science 239, 393–395. doi: 10.1126/science.239.4838.393
Meylan, A. B., and Donnelly, M. (1999). Status justification for listing the hawksbill turtle (Eretmochelys imbricata) as critically endangered on the 1996 IUCN red list of threatened animals. Chelon. Conserv. Biol. 3, 200–224.
Nezlin, N. P., Polikarpov, I. G., and Al-Yamani, F. (2007). Satellite-measured chlorophyll distribution in the Arabian Gulf: spatial, seasonal and inter-annual variability. Internat. J. Oceans Oceanogr. 2, 139–156.
NMFS (2008). Sea Turtle Research Techniques Manual. NOAA Technical Memorandum NMFS-SEFSC-579. Miami, FL: National Marine Fisheries Service.
Pal, J. S., and Eltahir, E. A. B. (2015). Future temperature in southwest Asia projected to exceed a threshold for human adaptability. Nat. Clim. Chang. 6, 197–200. doi: 10.1038/nclimate2833
Pierce, D. (2019). ncdf4: Interface to Unidata netCDF (Version 4 or Earlier) Format Data Files. R Package Version 1.16.1. Available online at: https://CRAN.R-project.org/package=ncdf4 (accessed September 17, 2020).
Pilcher, N. J., Al-Maslamani, I., Williams, J., Gasang, R., and Chikhi, A. (2015). Population structure of marine turtles in coastal waters of Qatar. Endang. Sp. Res. 28, 163–174. doi: 10.3354/esr00688
Pilcher, N. J., Antonopoulou, M., Perry, L., Abdel-Moati, M. A., Al Abdessalaam, T. Z., Albeldawi, M., et al. (2014a). Identification of important sea turtle areas (ITAs) for hawksbill turtles in the Arabian region. J. Exp. Mar. Biol. Ecol. 460, 89–99. doi: 10.1016/j.jembe.2014.06.009
Pilcher, N. J., Perry, L., Antonopoulou, M., Abdel-Moati, M. A., Al-Abdessalaam, T. Z., Albeldawi, M., et al. (2014b). Short term behavioural responses to thermal stress by hawksbill turtles in the Arabian region. J. Exp. Mar. Biol. Ecol. 457, 190–198. doi: 10.1016/j.jembe.2014.04.002
Plummer, M. (2003). JAGS: A Program for Analysis of Bayesian Graphical Models Using Gibbs Sampling. Available online at: http://sourceforge.net/projects/mcmc-jags/ (accessed September 17, 2020).
R Core Team (2018). R: A Language and Environment for Statistical Computing. Vienna: R Foundation for Statistical Computing.
Riegl, B. (1999). Corals in a non-reef setting in the southern Arabian Gulf (Dubai, UAE): fauna and community structure in response to recurring mass mortality. Coral Reefs 18, 63–73. doi: 10.1007/s003380050156
Riegl, B. M., and Purkis, S. J. (2012). “Coral reefs of the gulf: adaptation to climatic extremes in the World’s Hottest Sea,” in Coral Reefs of the Gulf. Coral Reefs of the World, Vol. 3, eds B. Riegl, and S. Purkis (Dordrecht: Springer), doi: 10.1007/978-94-007-3008-3_1
Rincon-Diaz, M. P., Diez, C. E., van Dam, R. P., and Sabat, A. M. (2011). Foraging selectivity of the hawksbill sea turtle (Eretmochelys imbricata) in the Culebra Archipelago, Puerto Rico. J. Herpetol. 45, 277–282. doi: 10.1670/10-120.1
Rooker, J. R., Simms, J. R., Wells, R. D., Holt, S. A., Holt, G. J., Graves, J. E., et al. (2012). Distribution and habitat associations of billfish and swordfish larvae across mesoscale features in the Gulf of Mexico. PLoS One 7:e34180. doi: 10.1371/journal.pone.034180
Scales, K. L., Hazen, E. L., Jacox, M. G., Edwards, C. A., Boustany, A. M., Oliver, M. J., et al. (2017a). Scale of inference: on the sensitivity of habitat models for wide-ranging marine predators to the resolution of environmental data. Ecography 40, 210–220. doi: 10.1111/ecog.02272
Scales, K. L., Schorr, G. S., Hazen, E. L., Bograd, S. J., Miller, P. I., Andrews, R. D., et al. (2017b). Should I stay or should I go? Modelling year-round habitat suitability and drivers of residency for fin whales in the California current. Div. Distr. 23, 1204–1215. doi: 10.1111/ddi.12611
Scales, K. L., Miller, P. I., Varo-Cruz, N., Hodgson, D. J., Hawkes, L. A., and Godley, B. J. (2015). Oceanic loggerhead turtles Caretta caretta associate with thermal fronts: evidence from the canary current large marine ecosystem. Mar. Ecol. Prog. Ser. 519, 195–207. doi: 10.3354/meps11075
Sequeira, A. M. M., Heupel, M. R., Lea, M.-A., Eguíluz, V. M., Duarte, C. M., Meekan, M. G., et al. (2019). The importance of sample size in marine megafauna tagging studies. Ecol. Appl. 29:e01947. doi: 10.1002/eap.1947
Sheppard, C., Al-Husiani, M., Al-Jamali, F., Al-Yamani, F., Baldwin, R., Bishop, J., et al. (2010). The Gulf: a young sea in decline. Mar. Poll. Bull. 60, 13–38. doi: 10.1016/j.marpolbul.2009.10.017
Swets, J. A. (1988). Measuring the accuracy of diagnostic systems. Science 240, 1285–1293. doi: 10.1126/science.3287615
Tayab, M. R., and Quiton, P. (2003). Marine turtle conservation initiatives at Ras Laffan Industrial City, Qatar (Arabian Gulf). Mar. Turtle Newsl. 99, 14–15.
van Dam, R. P., and Diez, C. E. (1998). Home range of immature hawksbill turtles (Eretmochelys imbricata (Linnaeus)) at two Caribbean islands. J. Exp. Mar. Biol. Ecol. 220, 15–24. doi: 10.1016/s0022-0981(97)00080-4
van Dam, R. P., and Diez, C. F. (1996). Diving behavior of immature hawksbills (Eretmochelys imbricata) in a Caribbean cliff-wall habitat. Mar. Biol. 127, 171–178. doi: 10.1007/bf00993657
Wells, R. J., TinHan, T. C., Dance, M. A., Drymon, J. M., Falterman, B., Ajemian, M. J., et al. (2018). Movement, behavior, and habitat use of a marine apex predator, the scalloped hammerhead. Front. Mar. Sci. 5:321. doi: 10.3389/fmars.2018.00321
Wilson, S., Fatemi, S. M. R., Shokri, M. R., and Claereboudt, M. (2002). “Status of coral reefs of the Persian/Arabian Gulf and Arabian Sea region,” in Status of Coral Reefs of the World, ed. C. R. Wilkinson (Townsville: AIMS).
Wood, L. D., Brunnick, B., and Milton, S. L. (2017). Home range and movement patterns of subadult hawksbill sea turtles in Southeast Florida. J. Herpetol. 51, 8–67. doi: 10.1670/15-133
Wood, L. D., Hardy, R., Meylan, P. A., and Meylan, A. B. (2013). Characterization of a hawksbill turtle (Eretmochelys imbricata) foraging aggregation in a high-latitude reef community in southeastern Florida, USA. Herpetol. Cons. Biol. 8, 258–275.
Wood, S. N. (2011). Fast stable restricted maximum likelihood and marginal likelihood estimation of semiparametric generalized linear models. J. R. Stat. Soc. Ser. B 73, 3–36. doi: 10.1111/j.1467-9868.2010.00749.x
Keywords: movement ecology, environmental drivers, sea turtles, thermal refuge, space use
Citation: Marshall CD, Cullen JA, Al-Ansi M, Hamza S and Abdel-Moati MAR (2020) Environmental Drivers of Habitat Use by Hawksbill Turtles (Eretmochelys imbricata) in the Arabian Gulf (Qatar). Front. Mar. Sci. 7:549575. doi: 10.3389/fmars.2020.549575
Received: 06 April 2020; Accepted: 20 October 2020;
Published: 06 November 2020.
Edited by:
Michele Thums, Australian Institute of Marine Science (AIMS), AustraliaReviewed by:
Jeanne A. Mortimer, Independent Researcher, SeychellesMariana M. P. B. Fuentes, Florida State University, United States
Mark Hamann, James Cook University, Australia
Copyright © 2020 Marshall, Cullen, Al-Ansi, Hamza and Abdel-Moati. This is an open-access article distributed under the terms of the Creative Commons Attribution License (CC BY). The use, distribution or reproduction in other forums is permitted, provided the original author(s) and the copyright owner(s) are credited and that the original publication in this journal is cited, in accordance with accepted academic practice. No use, distribution or reproduction is permitted which does not comply with these terms.
*Correspondence: Christopher D. Marshall, marshalc@tamug.edu
†Deceased