A Synthesis of Marine Monitoring Methods With the Potential to Enhance the Status Assessment of the Baltic Sea
 Leoni Mack1*
  Jenni Attila2
  Eva Aylagas3
  Arne Beermann1
  Angel Borja4 Daniel Hering1 Maria Kahlert5
  Florian Leese1
  Robin Lenz6
  Maiju Lehtiniemi2 Antonia Liess7
  Urmas Lips8
  Olli-Pekka Mattila2
  Kristian Meissner2 Timo Pyhälahti2 Outi Setälä2 Jennifer S. Strehse9
  Laura Uusitalo2 Anna Willstrand Wranne10
  Sebastian Birk1
- 1Faculty of Biology, University of Duisburg-Essen, Essen, Germany
- 2Finnish Environment Institute (SYKE), Helsinki, Finland
- 3Red Sea Research Center, King Abdullah University of Science and Technology, Thuwal, Saudi Arabia
- 4AZTI, Marine Research Division, Pasaia, Spain
- 5Department of Aquatic Sciences and Assessment, Swedish University of Agricultural Sciences, Uppsala, Sweden
- 6Leibniz Institute for Baltic Sea Research Warnemünde, Rostock, Germany
- 7Rydberg Laboratory of Applied Science, Halmstad University, Halmstad, Sweden
- 8Department of Marine Systems, Tallinn University of Technology, Tallinn, Estonia
- 9Institute of Toxicology and Pharmacology for Natural Scientists, University Medical School Schleswig-Holstein Campus Kiel, Kiel, Germany
- 10Swedish Meteorological and Hydrological Institute, Gothenburg, Sweden
A multitude of anthropogenic pressures deteriorate the Baltic Sea, resulting in the need to protect and restore its marine ecosystem. For an efficient conservation, comprehensive monitoring and assessment of all ecosystem elements is of fundamental importance. The Baltic Marine Environment Protection Commission HELCOM coordinates conservation measures regulated by several European directives. However, this holistic assessment is hindered by gaps within the current monitoring schemes. Here, twenty-two novel methods with the potential to fill some of these gaps and improve the monitoring of the Baltic marine environment are examined. We asked key stakeholders to point out methods likely to improve current Baltic Sea monitoring. We then described these methods in a comparable way and evaluated them based on their costs and applicability potential (i.e., possibility to make them operational). Twelve methods require low to very low costs, while five require moderate and two high costs. Seventeen methods were rated with a high to very high applicability, whereas four methods had moderate and one low applicability for Baltic Sea monitoring. Methods with both low costs and a high applicability include the Manta Trawl, Rocket Sediment Corer, Argo Float, Artificial Substrates, Citizen Observation, Earth Observation, the HydroFIA®pH system, DNA Metabarcoding and Stable Isotope Analysis.
Highlights
- We rated novel methods regarding their ability to improve the Baltic Sea monitoring.
- Methods were assessed with respect to their costs and applicability.
- All methods can potentially increase data resolution or monitor novel ecosystem elements.
- We recommend several novel methods for the Baltic status assessment.
Introduction
The unique Baltic Sea ecosystem is in critical condition due to strong anthropogenic pressures, therefore, it urgently requires protection and restoration (Andersen et al., 2015; HELCOM, 2017). As one of the largest brackish water bodies worldwide, the Baltic Sea’s most distinguishing feature is a pronounced salinity gradient. Marine and freshwater species coexist and interact, creating a unique but sensitive biological community (HELCOM, 2016). The Baltic Sea is shallow with a low water exchange rate with other marine water bodies, which makes it especially vulnerable to human impacts (Szymczychta et al., 2019). Due to effluents draining from nine countries into its basin, main environmental pressures include eutrophication and contamination. In consequence, areas with low oxygen or even anoxic conditions are expanding (Gustafsson et al., 2012; Carstensen et al., 2014). In addition, the ecosystem is highly impaired by marine litter, non-indigenous species, underwater noise, fishing, as well as habitat disturbance and loss (Andersen et al., 2015). Climate change already reduces the extent and duration of ice cover in the Northern parts, as well as increases riverine freshwater inflow (HELCOM, 2018a). The critical condition of the Baltic Sea calls for profound mitigation actions as stipulated by the present environmental legislation.
Several European directives and international conventions address the protection of the Baltic Sea. The most important directives are the Marine Strategy Framework Directive (MSFD; European Commission, 2008) and the Water Framework Directive (WFD; European Commission, 2000). The common aim of these directives is to achieve a good status of the Baltic Sea. “Status” refers to the qualitative condition of the ecosystem, which is classified as good if it deviates only slightly from near-natural conditions (European Commission, 2000, 2008). Further relevant legislations are the Habitats Directive (92/43/EEC), the Birds Directive (2009/147/EC), the Common Fisheries Policy (Regulation EU No 1380/2013) and the regulation on invasive alien species (Regulation EU No 1143/2014). The implementation of the directives is regionally coordinated by the Baltic Marine Environment Protection Commission HELCOM (i.e., “Helsinki Commission”). This intergovernmental organisation has the aim to protect the Baltic Sea, conserve its habitats and biodiversity and ensure sustainable use of its resources (HELCOM, 2018a). Working with an ecosystem-based approach, the understanding of anthropogenic pressures and their impacts on the marine environment and human well-being are fundamental (Söderström and Kern, 2017). HELCOM established the Baltic Sea Action Plan (BSAP; Backer et al., 2010) as a joint programme to protect the Baltic Sea and restore the good status of its marine environment by 2021 (HELCOM, 2007).
For an efficient protection and restoration of the Baltic Sea, comprehensive monitoring of all its ecosystem elements is of fundamental importance. Monitoring comprises the acquisition of biological, chemical, physical, hydrological and morphological data of the ecosystem to assess its status (Mack et al., 2019). The assessment of the Baltic Sea’s status is following an indicator-based approach (HELCOM, 2018a). Indicators address specific measurable attributes of selected ecosystem elements, allowing to monitor spatial or temporal changes of these elements. Several indicators are defined and grouped into eleven thematic categories addressing characteristic ecosystem features and functions, so-called “descriptors” within the MSFD (Zampoukas et al., 2012).
The current monitoring of the Baltic Sea, however, reveals significant gaps, which conceivably prevent a holistic assessment and impede adequate conservation of the Baltic Sea. Five main gaps were identified by Emmerson et al. (2019) and Kahlert et al. (2020), three of which relate to insufficiently monitored and lacking indicators (i–iii), while two relate to regulation and coordination (iv–v):
(i) Insufficient monitoring of existing indicators in space and time, which especially applies to oxygen conditions, phytoplankton, zooplankton, benthic habitats and species, and the monitoring of mobile species.
(ii) The lack of indicators that adequately reflect the descriptors of the MSFD, including food webs, sea-floor integrity, contaminants, marine litter, and underwater noise/energy.
(iii) Ecosystem elements and drivers of change, which are not monitored so far, including climate change and ecosystem services.
(iv) Insufficient regulations on data handling or storage, in particular regarding some descriptors such as biodiversity (i.e., benthic habitats and species), non-indigenous species, bycatch, hazardous substances, and marine litter.
(v) The lack in coordination of the monitoring between countries, which especially applies for the descriptors mentioned in the previous gap.
These gaps arise from various circumstances: Traditional methods require relatively high efforts regarding costs and time, and therefore cannot be conducted as often as necessary to meet the data requirements regarding spatio-temporal resolution and coverage. These traditional methods include manual water/sediment sampling from research vessels, sampling and observation by trained divers, manned aircraft surveys or the morphological identification of sampled organisms. An insufficient development of measurable attributes of existing and emerging ecosystem threats leads to a lack in indicators, ecosystem elements or descriptors monitoring. For instance, food webs are currently assessed by proxies like nutritional state, growth rate and size structure of specific organisms, but a straightforward indicator describing the food web length and stability was not developed so far. Technological advances and associated high data volumes evolve faster than data management strategies, resulting in the lack of central data management systems. Furthermore, a lack of coordination results from differing national and international legislation (Birk et al., 2012).
To fill these gaps, novel monitoring methods can be implemented. In this investigation, we define as “novel” those methods which are not yet in general use or applied to some Baltic Sea regions, as well as methods which have been developed recently. Several novel methods have been developed to facilitate autonomous acquisition of real-time data, increased spatial and temporal data resolution and the assessment of novel indicators, ecosystem elements or descriptors (Danovaro et al., 2016). A good example for the integration of novel methods is the use of the HELCOM chlorophyll-a indicator for the assessment of eutrophication status (HELCOM, 2018b). The indicator combines data from traditional research vessel-based sampling with Earth Observation and FerryBox systems. It was used in the latest status report to assess the eutrophication effects in the off-shore areas of the Baltic Sea (HELCOM, 2018c). Another example is Earth Observation (EO) that provides near real-time information on water quality parameters and surface water temperature. Some Baltic countries, e.g. Finland, already utilise these observations on daily level in monitoring programmes and also as complementary material for WFD reporting (Attila et al., 2018). The efforts by several EU countries for advancing the use of EO for WFD were summarised in a recent White Paper (Papathanaopoulou et al., 2019). However, to make a monitoring method operational, it should be operationally feasible and at a reasonable cost. Yet, sometimes a new method is not always transferable to routine monitoring contexts due to several constraints such as the inaccessibility to the equipment required for sample collection or preservation. Also, the study of the cost-efficiency of monitoring methods is not very usual (Abramic et al., 2014; Bellanger and Levrel, 2017; Aylagas et al., 2018).
In this context, as part of the BONUS FUMARI project (”Future marine assessment and monitoring of the Baltic”; 2018–2020)1, which aims to propose a renewed monitoring system of the Baltic Sea marine environment, we reviewed novel methods with the potential to enhance the HELCOM monitoring of the Baltic. We identified methods suited to fill the monitoring gaps (i)– (iii) listed above (as these gap types are directly related to monitoring practices) and rated their costs and applicability potential (i.e., possibility to make them operational) for the Baltic Sea monitoring. The methods offer an improvement in comparison to the traditional methods and might replace or supplement them in a future monitoring system. In the methodology section, we describe the procedure of method identification and rating. In the results and discussion section, each method is classified, shortly described and rated based on its costs and applicability for the marine monitoring. In conclusion, the ability of methods to fill the main gaps is assessed. The results from this research can be applied to other regional seas worldwide.
Materials and Methods
Identification of Novel Methods
To increase the overall impact, our BONUS FUMARI project follows an end-user-centric approach, integrating suggestions from key stakeholders in environmental management (i.e., academic researchers, monitoring coordinators or field biologists). Novel monitoring methods were identified by scanning scientific projects, publications and conducting stakeholder surveys. This comprehensive collation was then examined to retain only methods, which fulfilled the following five criteria: (1) technology readiness level of seven or higher (European Commission, 2014), (2) comprehensive and stand-alone techniques (excluding sensors or analysers depending on a deployment system), (3) filling a gap in the current monitoring, (4) “novel” and not in general use, and (5) evaluated as cost-efficient in terms of their cost-benefit-ratio. For this compilation we considered scientific research projects [all BONUS projects since 2010 and the finished and ongoing projects listed in the Technical guidance on monitoring for the MSFD (JRC, 2014)], scientific publications (JRC, 2013; Danovaro et al., 2016; Filipe et al., 2019; Lehikoinen et al., 2019), and stakeholder suggestions. Stakeholders working in the field of environmental management and research in the Baltic countries were asked for shortcomings in the Baltic monitoring to assess the good status of the region regarding the directives MSFD, WFD and BSAP, and for novel methods with the potential to fill these. This was done during two enquiries from October 2018 to May 2019 and we received 42 responses (see Supplementary Material A).
Description and Rating of Novel Methods
All methods were described and evaluated in a standardised way. We specified their potential to add to a reference framework/programme (MSFD, BSAP and WFD), the monitored quality elements and the traditional methods potentially replaced or supplemented by the novel method. Furthermore, we described the general operating principle of the method and its application for the routine monitoring.
For evaluating the costs of a method, we differentiated between investment costs and monitoring costs. For evaluating a methods’ applicability, we assessed reliability, environmental impact, added value, limitations and required expertise. These criteria were developed including approaches of JRC (2013), Nygård et al. (2016), and Hering et al. (2018). The novel methods were rated by assigning scores ranging from “−−2.” i.e., “very low” to “++2,” i.e., “very high” to each of the evaluation criteria. It should be notes that different evaluation criteria were rated using a different range of these scores, depending on their feasibility (Table 1). For instance, the criterion “added value” could not score negative and “limitations” could not score positive. Overall cost and applicability rating was done by averaging the grades for the single ratings. Monitoring costs were given a higher weight (2:1) than investment costs to emphasise annual running costs over one-time investments. The final rating of the methods can be found in Table 2.
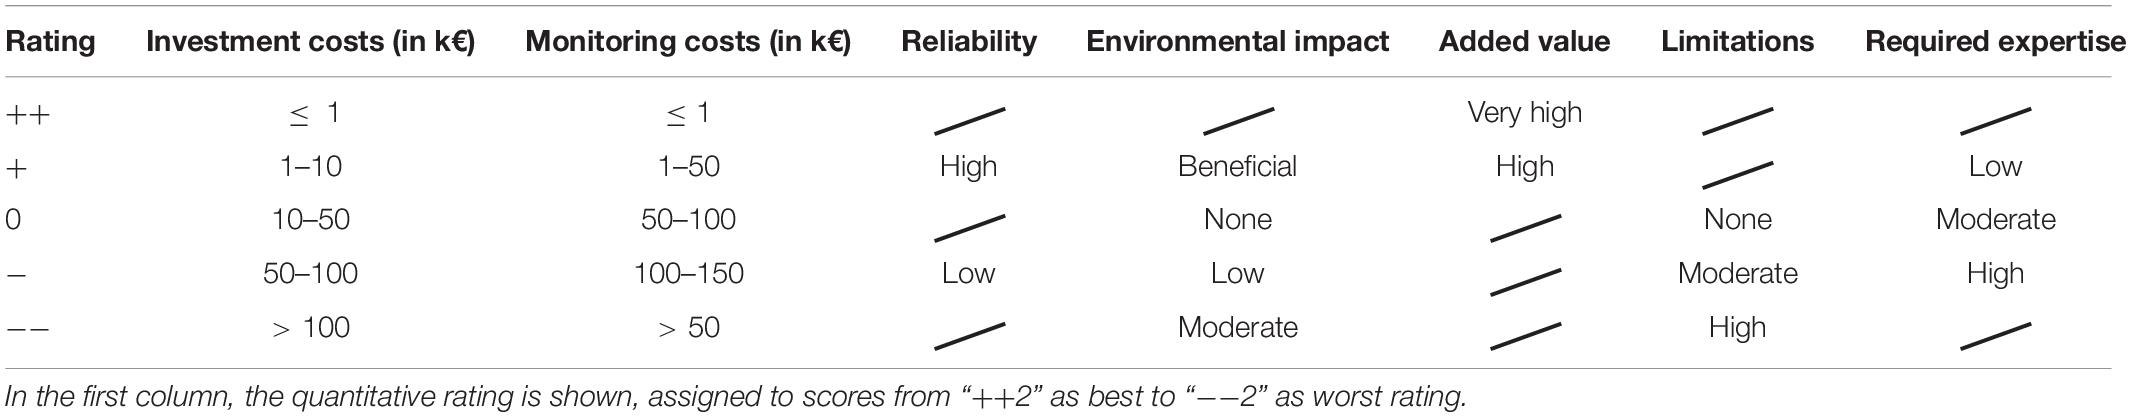
Table 1. Evaluation criteria and rating scores of the novel methods.
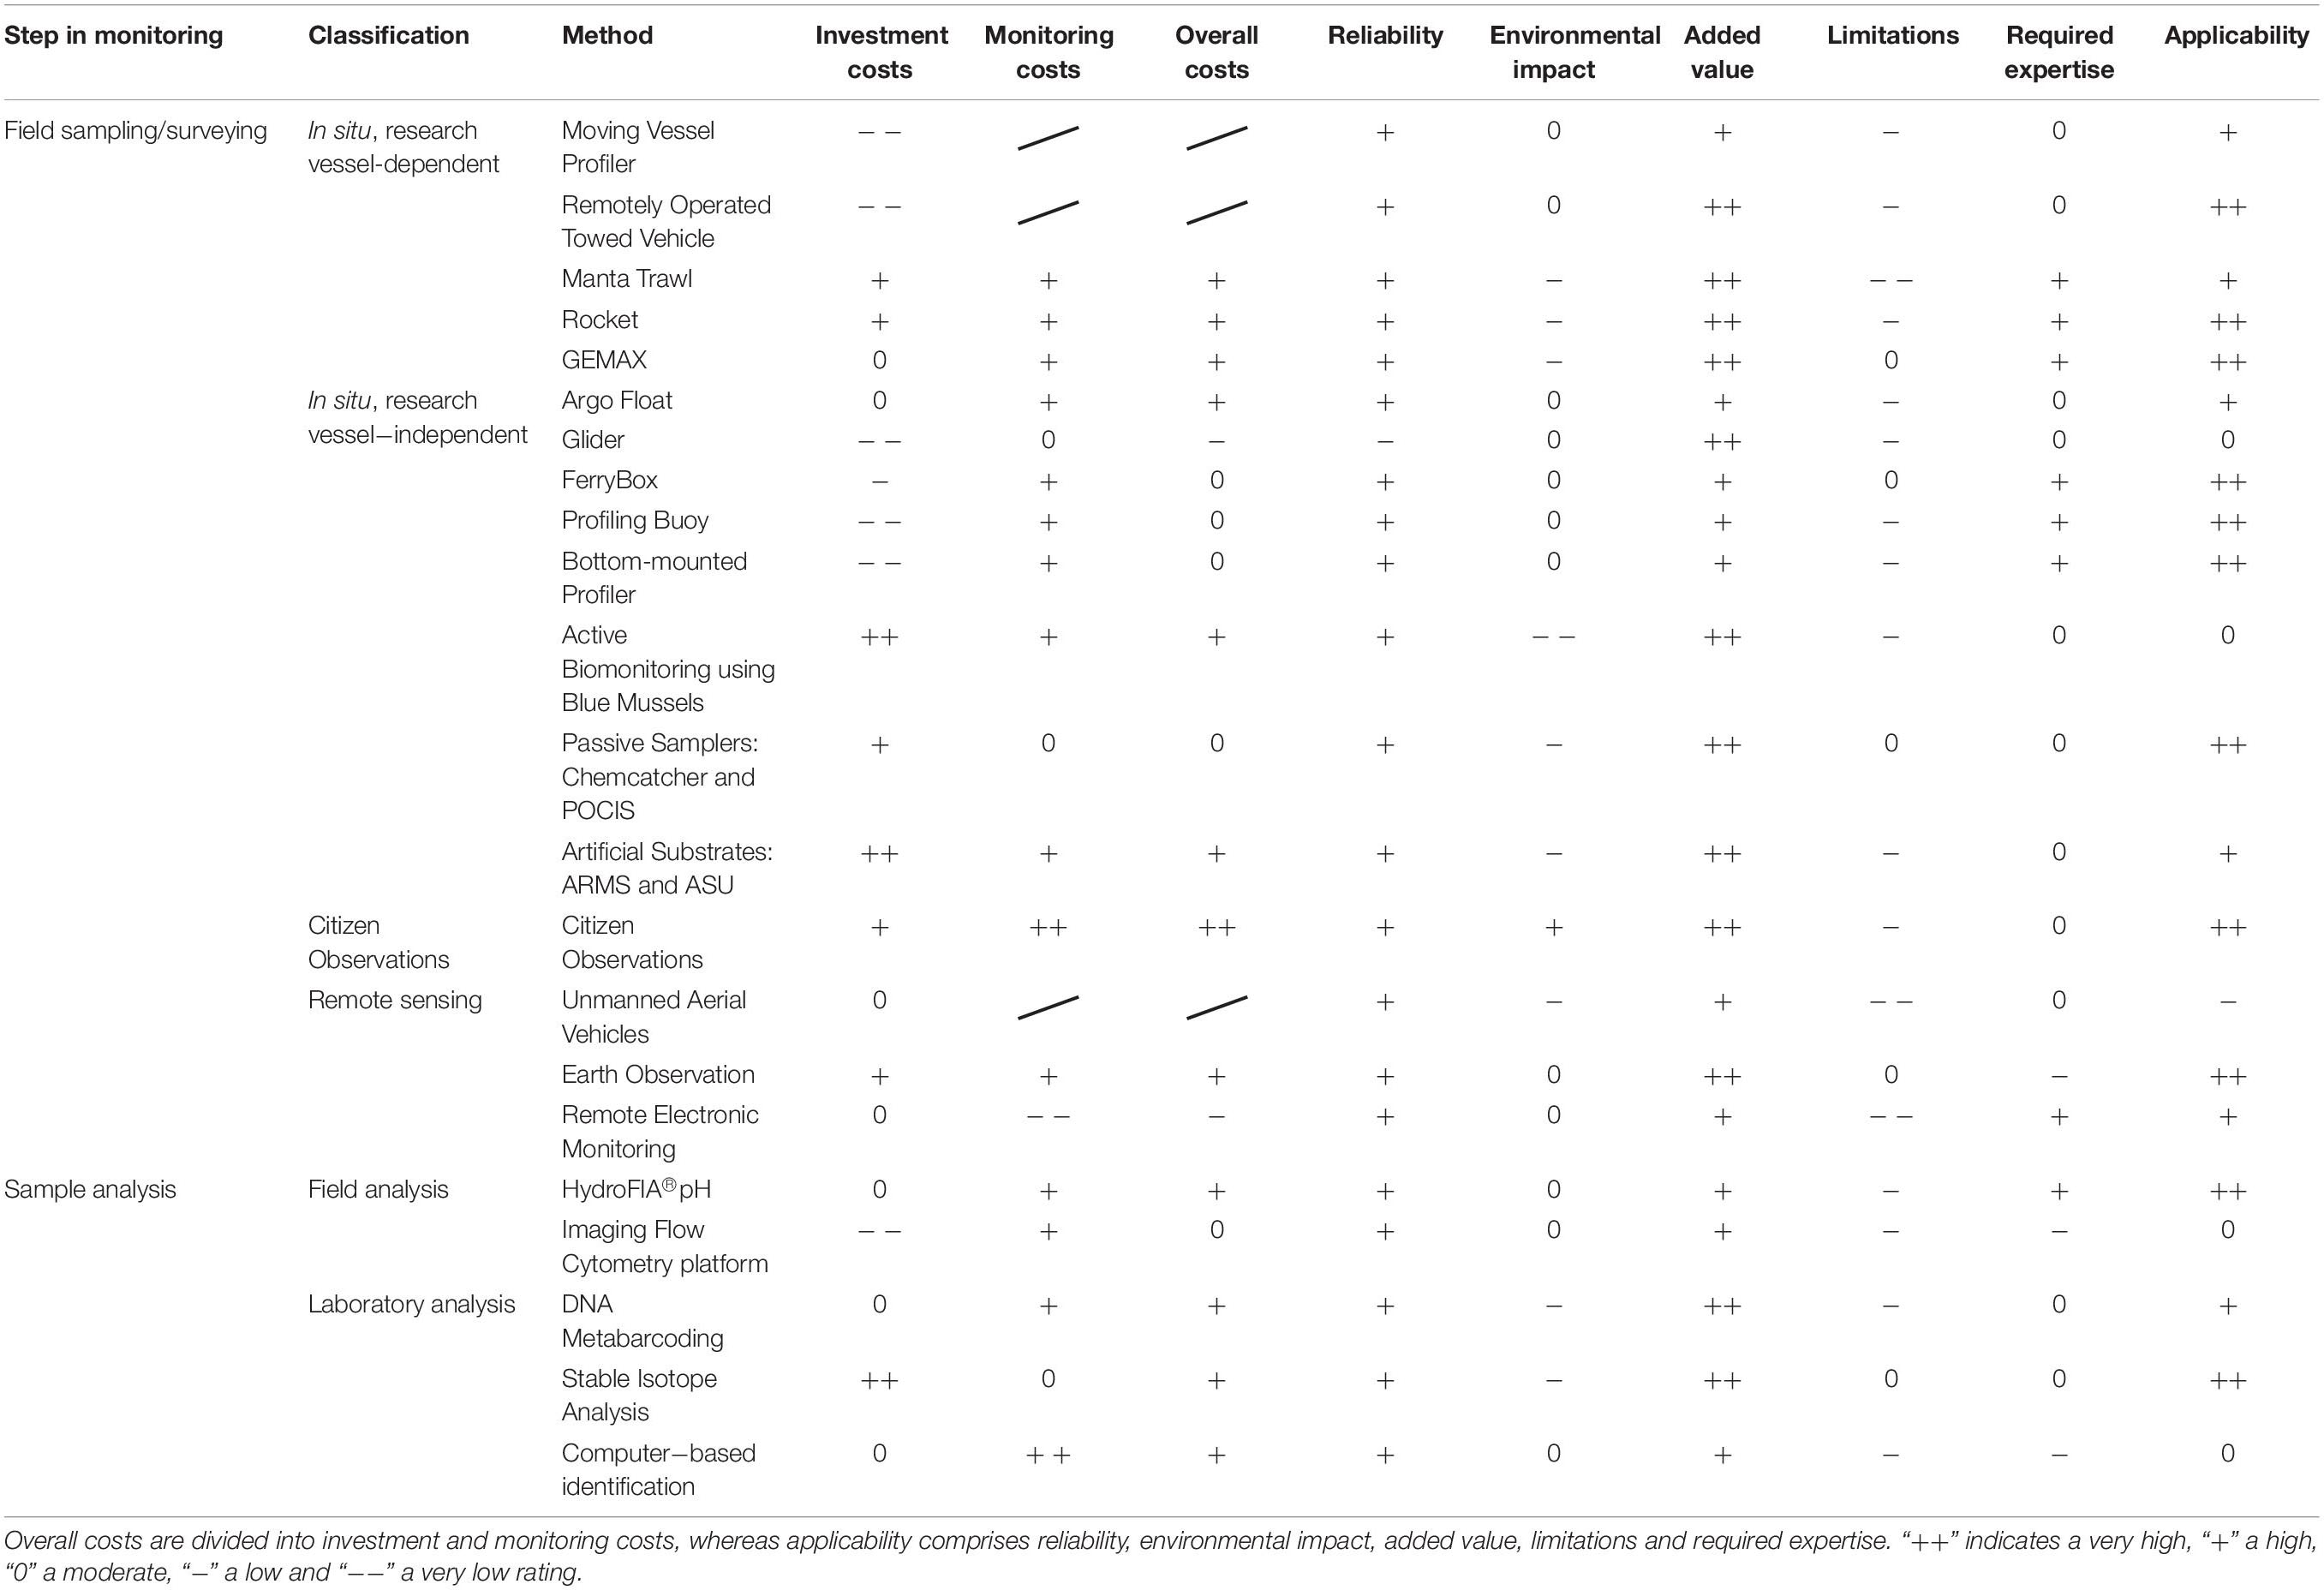
Table 2. Overall rating of the costs and applicability of novel methods.
Investment costs were defined as one-time investments for equipment and personnel training. This comprised the costs for the monitoring device or deployment system, including necessary equipment like standard sensors or sampling devices, and the expenses for personnel training (personnel costs were set to 70 € per hour). For citizen observations this included costs to start web services and management activities. For remote sensing methods, we also included the costs for the development of a data management system. Since the investment costs of most methods depended on several parameters, like number and type of included sensors or the place of application, the costs were mainly estimated based on expert knowledge. Cost assignments followed criteria put forth by the Joint Research Centre (JRC, 2013; Table 1).
Monitoring costs were defined as the running costs of monitoring, i.e., costs incurring after the initial set up. They include consumables, personnel working time, maintenance and, in case of citizen observations and remote sensing methods, data handling. Due to data availability, we first collected monitoring costs in various dimensions, ranging from the costs for a single monitoring campaign to the costs for an annual monitoring of a specific transect/area. Based on these, we estimated the annual monitoring costs for the whole Baltic Sea. These depend on the monitoring objective and therefore, the costs are given under specific assumptions (see Supplementary Material B). Since most of the methods collect data on multiple quality elements at the same time, we calculated the monitoring costs for a single quality element to allow for cost comparisons between methods. For research vessel-dependent methods, we did not include ship costs like fuel or rent.
In our cost analysis, we did not take the possibility of sharing facilities/instruments or cooperating the execution among institutes into account. This can potentially reduce investment and monitoring costs and efforts by maximising the use of resources. Furthermore, analysis protocols can be homogenised, which reduces the need for interlaboratory calibrations (JRC, 2013).
Reliability was assessed based on the failure safety of the method itself and the precision of acquired data in comparison to the traditional methods (see Supplementary Material B). Reliability of the methods was “high,” when resulting data had an improved reliability. This also applied, when the precision of acquired data is comparable to data acquired with the traditional method, but due to the greater amount of data, the reliability can be regarded higher. A high default rate and therefore low reliability of the method was assessed as “low.”
Environmental impact of the methods was rated ranging from “beneficial” to “moderate.” Hereby, “beneficial” means a positive impact on the environment, e.g., by removing litter from the beaches. A “low” impact is caused by small organismic sample sizes and damages to the physical habitats, e.g., by anchoring devices to the sea floor. Methods causing damages of the physical habitats or/and lethal sample treatment of a relatively big sample size were rated with a “moderate” impact.
Added value describes the type of novelty, which a method adds to the routine monitoring. It was rated as “high” for methods with higher spatial and/or temporal data resolution, e.g., due to their autonomous measurement, and therefore, filling gap (i). A “very high” added value was assigned to methods including the monitoring of novel quality elements, ecosystem elements or descriptors and therefore, filling gaps (ii) and (iii). Furthermore, methods with an added social or environmental value, e.g., by rising the environmental awareness of the population, were rated as “very high.”
Limitations describe disadvantages and shortcomings of a method. We rated limitations as “none,” i.e., having no or an easily manageable effect on method applicability, or “moderate,” i.e., causing slight restrictions to method applicability. Methods that scored “high,” i.e., limited method applicability, require further research to improve method applicability.
Required expertise describes the level of expertise needed to conduct field sampling/surveying or sample analysis. It was rated following categories proposed by JRC (2013): “Low” indicates the need for trained personnel without specific professional education, “moderate” requires trained personnel with specific professional education and “high” requires special skills.
Results and Discussion
Method Classification
Monitoring typically comprises three steps: (1) field sampling/surveying in which in situ or remote samples/data are gathered; (2) sample analysis, which refers to the treatment of gathered samples/data to extract quantitative or qualitative information; and (3) data analysis, the treatment of quantitative and qualitative information to interpret the resulting data, e.g., by calculating metrics or applying class boundaries. We classify methods for field sampling/surveying as either in situ research vessel-dependent (sampling within the water, the whole deployment time is depending on the operation of a (research) vessel), in situ research vessel-independent (operation is independent of a research vessel, though devices may be deployed and recovered using one), citizen observation or remote sensing. Methods for sample analysis comprise both field and laboratory analysis. Methods for data analysis were not included in this work.
Method Descriptions
We identified twenty-two methods to be reviewed, half of the methods were mentioned in both the stakeholder survey and literature, half by stakeholders only. In the following, we give a short description of each novel monitoring method. Furthermore, we list the MSFD descriptor(s), as they can provide information on and highlight the gaps the respective methods can fill (Table 3). Comprehensive method descriptions can be found in the Supplementary Material B or on the BONUS FUMARI methods database2.
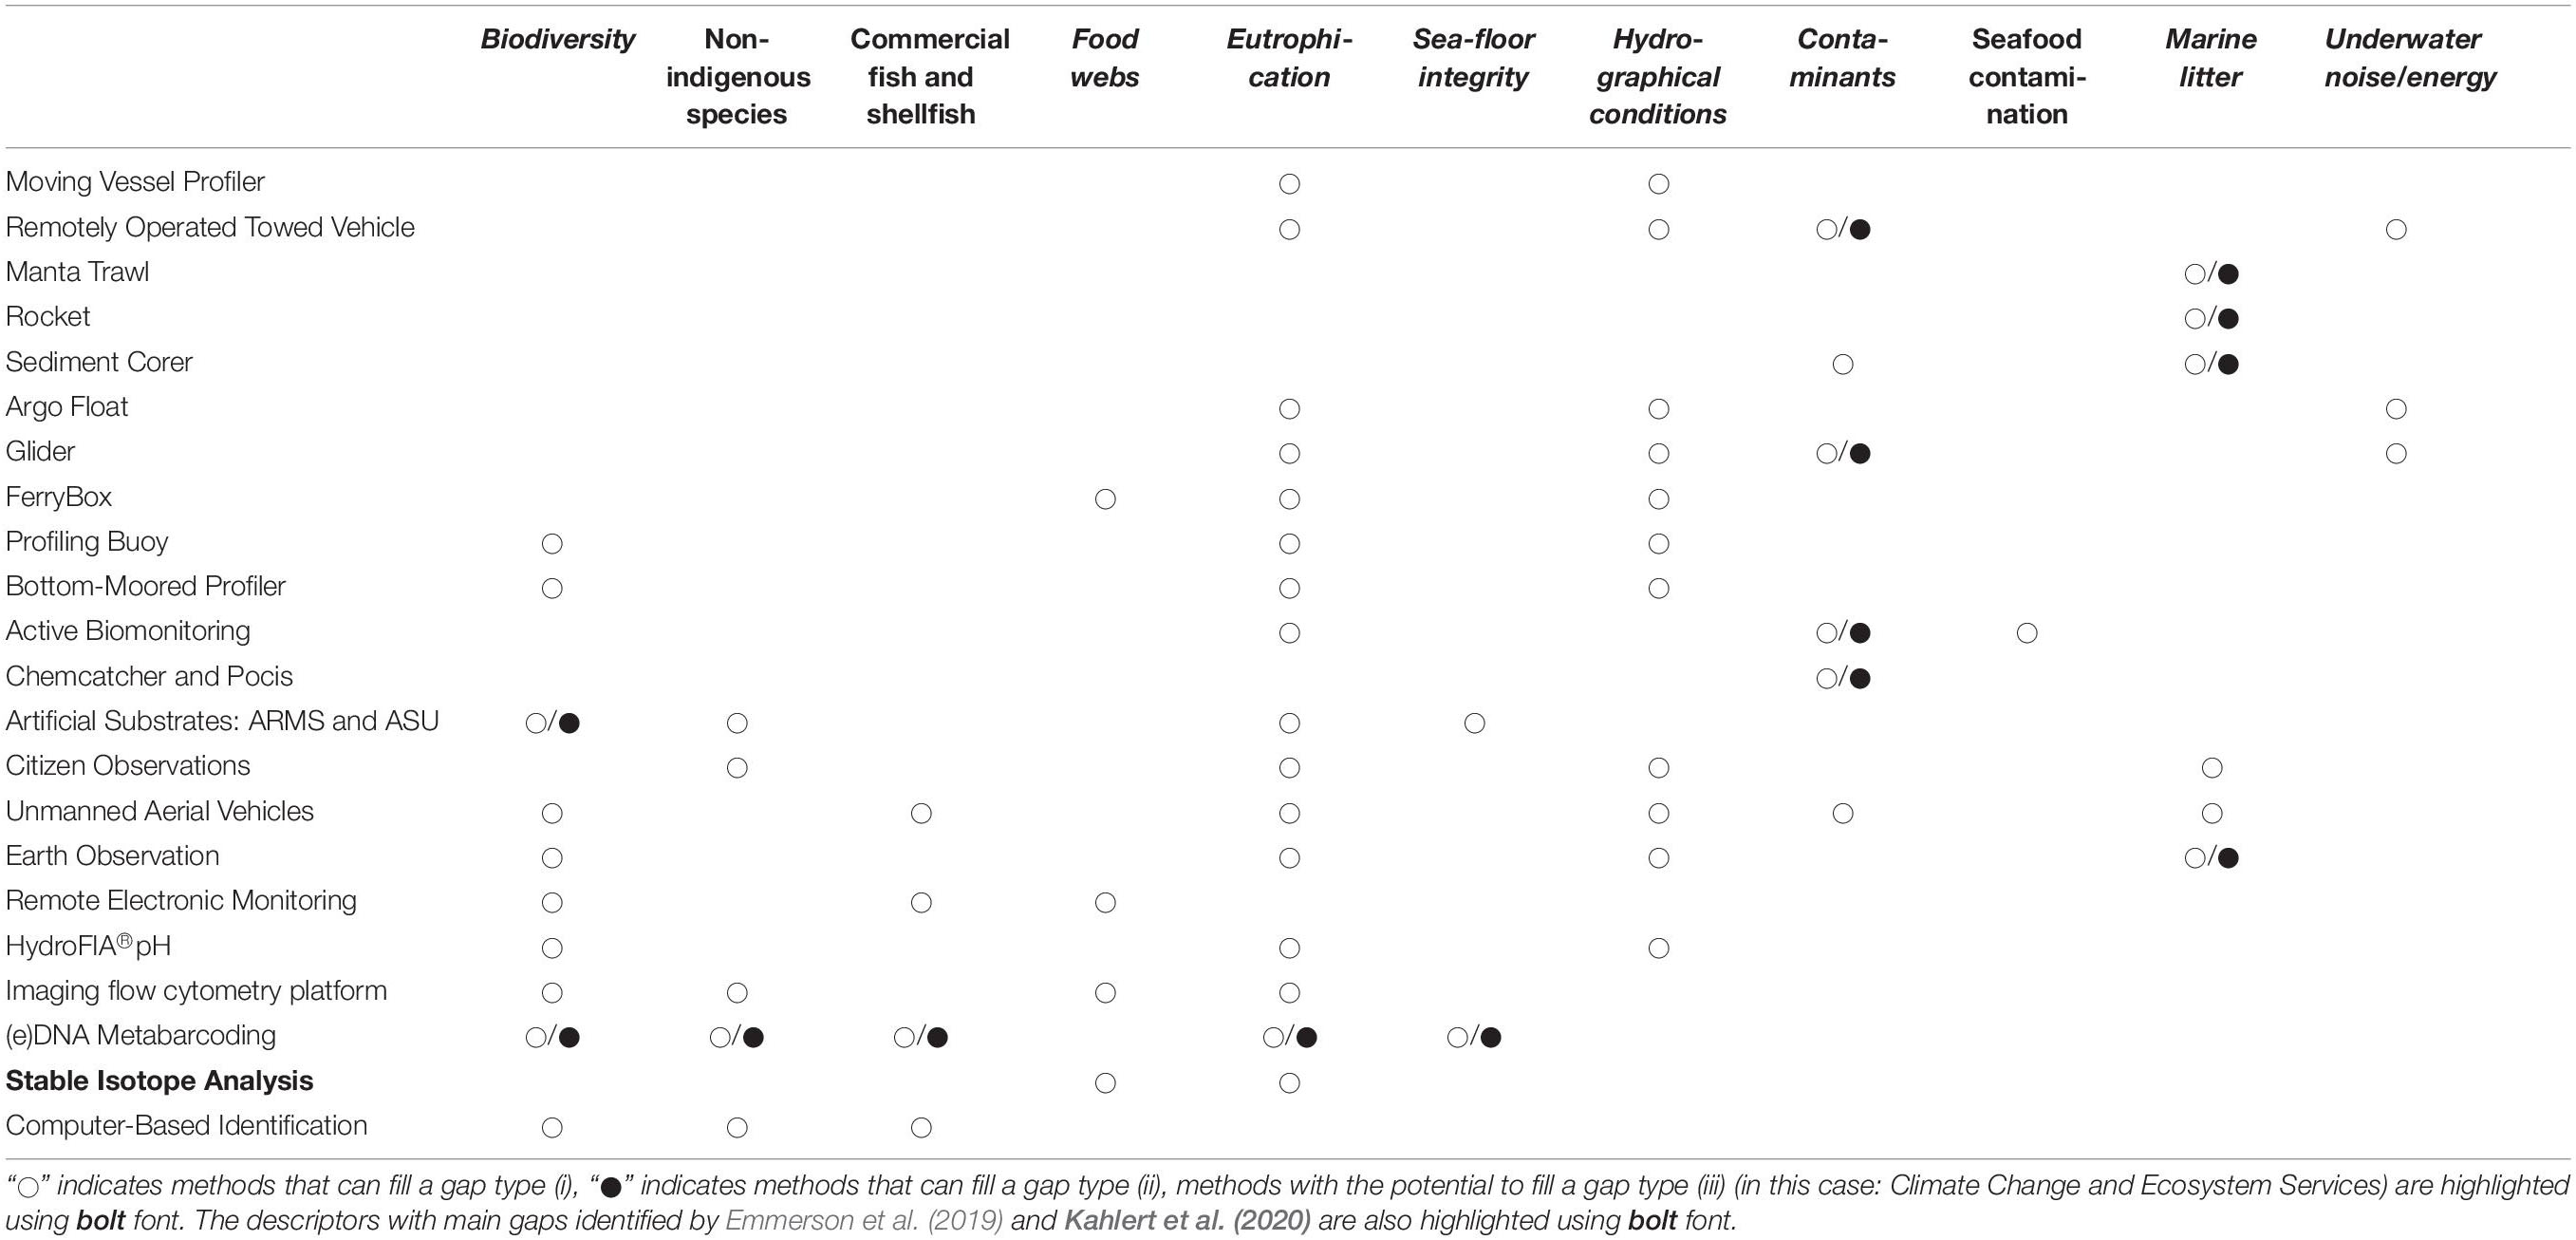
Table 3. Novel methods and the Marine Strategy Framework Directive descriptor(s), which these methods can be used to monitor.
Methods for Field Sampling/Surveying
In situ, Research Vessel-Dependent
The Moving Vessel Profiler (MVP) is a free-falling “fish,” which generates near-vertical high-resolution profiles of the watercolumn. The fish is attached to a winch on board of a research vessel and operated while the vessel is moving (Figure 1A; Furlong et al., 2006). In marine monitoring the MVP can be operated between stations, and therefore increase the number of profiles generated during a monitoring cruise. These additional data can be used for a more comprehensive assessment of eutrophication and hydrographical conditions due to the enhanced spatio-temporal resolution and coverage of monitoring data.
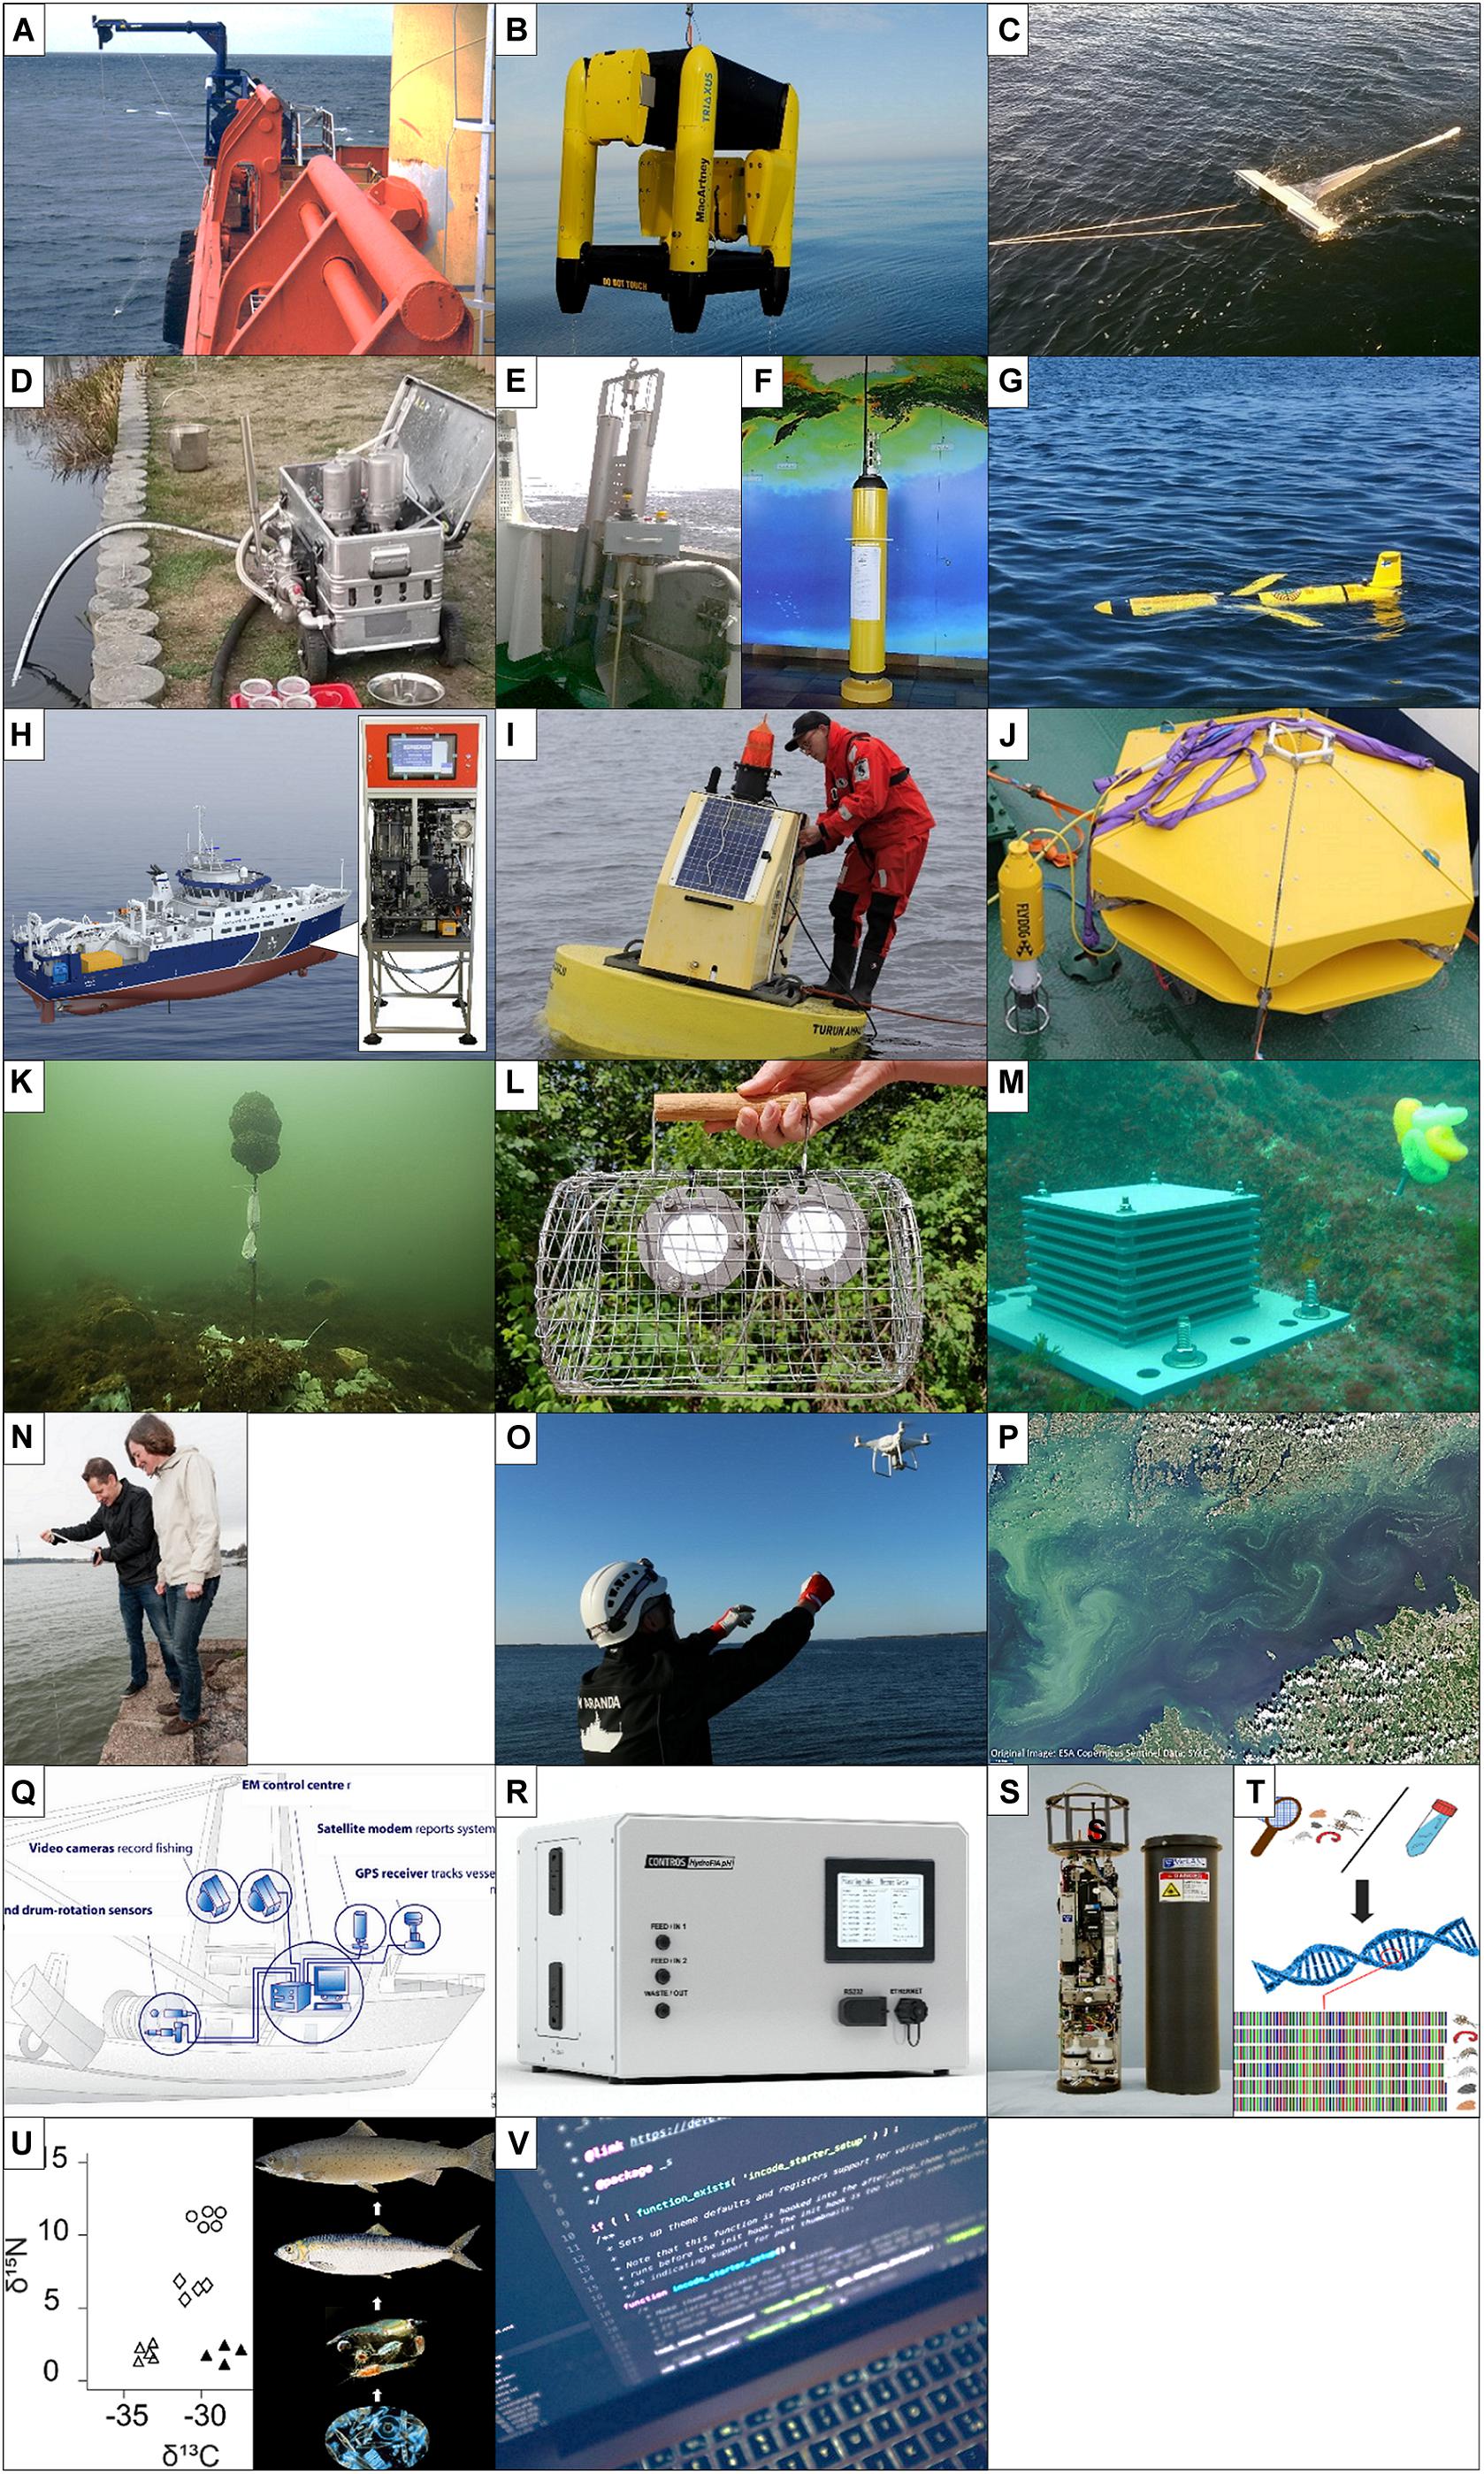
Figure 1. (A) Moving Vessel Profiler © AML Oceanographic; (B) Remotely Operated Towed Vehicle © MacArtney; (C) Manta Trawl © Maiju Lehtiniemi, SYKE; (D) Rocket © Robin Lenz, IOW; (E) GEMAX Corer © Maiju Lehtiniemi, SYKE; (F) Argo Float © www.argo.uscd.edu; (G) Glider © Kimmo Tikka, FMI; (H) FerryBox © modified after 4HJena and SLU; (I) Profiling Buoy © Tiina Sojakka, UTU; (J) Bottom-mounted Profiler © Siim Juuse; (K) Active Biomonitoring using Blue Mussels © Jana Ulrich, CAU; (L) POCIS © Heidi Ahkola, SYKE; (M) ARMS (left) and ASU (right) © AZTI Tecnalia; (N) Citizen Observations © Vanessa Riki, SYKE; (O) Unmanned Aerial Vehicle © Jan Eric Bruun, SYKE; (P) Earth Observation © ESA Copernicus Sentinel Data (Q) Remote Electronic Monitoring © Archipelago Marine Research; (R) HydroFIA®pH © Kongsberg Maritime Contros; (S) Imaging Flow CytoBot © McLane Research Laboratories; (T) DNA metabarcoding © Leoni Mack, UDE; (U) Stable Isotope Analysis © Leoni Mack, UDE; (V) Computer-based identification of organisms © Luca Bravo.
The Remotely Operated Towed Vehicle (ROTV) is a towed profiler, which is deployed from a research vessel and can be operated in three dimensions in the water column (Figure 1B; Floeter et al., 2017). In marine monitoring ROTVs enhance the spatio-temporal resolution and coverage of monitoring data used to assess eutrophication and hydrographical conditions. Furthermore, it can be used to obtain high-resolution data or additional information in a specific area of interest, when steered manually. For instance, ROTVs can be operated for the detection and identification of warfare relicts dumped in the sea, and sampling of contaminated water and sediment (Beldowski et al., 2018).
A Manta Trawl is a net-based sampling device to collect marine surface microlitter bigger than 300 μm (Figure 1C). While being dragged on the water surface, it collects water with its opening. The water is filtered through a fine net and the litter is stored in the cod end, a removable collecting bag (Setälä et al., 2016; Tamminga et al., 2018). In marine monitoring the Manta Trawl can be deployed between monitoring stations to routinely collect data on microlitter in surface waters. In particular, the possibility for a standardised monitoring of microplastics, which is not included in the current monitoring directives (HELCOM, 2018a; Kahlert et al., 2020), gives the Manta a high relevance for the Baltic Sea monitoring.
The Rocket is an example for an encapsulated through-flow filtration device used to sample waterborne microplastics in the upper water layers (Figure 1D; Lenz and Labrenz, 2018). The concept is based on suction of water through fine stainless-steel cartridge filters to retain any suspended particulate matter larger than the applied pore size (i.e., 10 μm). The mobile design allows for application at field sites, as well as application aboard a vessel to take open water samples. The Rocket is a valuable tool for addressing monitoring needs for pollution of smaller microplastic particles (i.e., < 300 μm) and to cover locations where the application of trawling systems is impractical or impossible.
A Sediment Corer like the GEMAX is a gravity corer to sample soft sediments (Figure 1E). It is deployed from a research vessel and when released, the corer falls down the water column and vertically cuts into the sediment (Charrieau et al., 2018). A closing mechanism automatically locks the sediment in the system when recovering the corer. The GEMAX is an efficient sampler for monitoring purposes as it takes two sediment cores at the same time doubling the sampled volume of the sediment compared to the more common single-core corers. In marine monitoring it can be deployed at sampling stations with soft sediment to sample microlitter deposited in sediments. The Corer is especially valuable since it offers a standardised method for the monitoring of microplastics.
In situ, Research Vessel-Independent
The Argo Float is a free-floating platform, which generates vertical profiles of the water column (Figure 1F). Since it floats freely, its horizontal range and path is defined by the currents. It frequently surfaces by changing buoyancy due to an oil filled bladder. In general, an Argo Float profiles at 10-day intervals, but intervals can also be programmed to generate, for instance, multiple profiles a day (Roiha et al., 2018; Siiriä et al., 2019). In marine monitoring Argo Floats can be deployed to autonomously obtain high-resolution vertical profiles of the water column to assess eutrophication and hydrographical conditions.
The Glider is an autonomous underwater vehicle used to generate horizontal profiles of the physico-chemical and biological state variables along its route being defined by an operator (Figure 1G). It can move down to 1,500 m by changing buoyancy due to an oil-filled bladder (Liblik et al., 2016). Since Gliders can autonomously move underwater, they can also be operated in ice-covered areas and under harsh conditions (Brito et al., 2014; Meyer et al., 2018). Obtained water quality data can be used for a more comprehensive assessment of eutrophication and hydrographical conditions and Gliders can also be used for the detection of warfare relicts dumped in the sea.
A FerryBox is an automatic flow-through system for the continuous measurement of water parameters (Figure 1H). This system is specifically developed for the permanent operation on non-research vessels like ferries, which regularly ship their transit routes (Petersen, 2014; EuroGOOS, 2017). Regarding the marine monitoring, the FerryBox enables the acquisition of long-term time series on a constant route and, therefore, the monitoring of temporal changes in food webs, eutrophication and hydrographical conditions like ocean acidification (Lips and Lips, 2017; Schneider and Müller, 2018).
Profiling Buoys for the automatic measurement of water quality profiles are moored platforms, floating on the water surface (Figure 1I). For profiling, a multi-parameter probe is lowered in the water column to conduct measurements either continuously or stopping at specific heights. Profiling frequency, intermediate profiling steps and the maximal depth can be programmed (Liu et al., 2019; Venkatesan et al., 2019). Due to the generation of frequent profiles at a given station, the changes in water conditions within the day can be recorded over long periods and, therefore, Profiling Buoys can be used to assess biodiversity, eutrophication and hydrographical conditions (Lips et al., 2011).
Bottom-mounted Profilers for the automatic measurement of water quality profiles are platforms moored to the sea bed (Figure 1J). For profiling, either the whole platform or the multi-parameter probe is rising. With profiling frequencies of 3–8 h, the changes in biological and physico-chemical water conditions within the day can be recorded over long periods. Thus, bottom-mounted profilers can be used for an enhanced assessment of biodiversity, eutrophication and hydrographical conditions (Prien and Schulz-Bull, 2016; Stoicescu et al., 2019).
For Active Biomonitoring with Blue Mussels, the bivalves are used as sentinel species in the monitoring of bioavailable pollutants (Figure 1K). Mussels enable monitoring the pollution of a specific location, as they accumulate environmental chemicals in their tissues. Therefore, mussels without former pollution are translocated to a specific area of interest (Schöne and Krause, 2016; Strehse et al., 2017). For marine monitoring purposes, this method enables a more comprehensive monitoring of eutrophication and contamination due to the collection of time-weighted average concentrations of bioavailable pollutants, including nutrient and carbon isotopes (Briant et al., 2018) and dumped munitions (Strehse et al., 2017; Appel et al., 2018).
Passive Samplers like the Chemcatcher® and Polar Organic Chemical Integrative Sampler (POCIS) are collecting contaminants based on molecular diffusion and sorption to a binding agent (Figure 1L). They are deployed at a specific location and accumulate the contaminants in the surrounding environment over time (Vrana et al., 2005). The Chemcatcher® collects in-/organic substances of polar or non-polar nature (Charriau et al., 2016), while the POCIS is selective for polar organic chemicals (Harman et al., 2012). Passive Samplers can be used to enhance the monitoring of contaminants, including dumped munitions, due to the collection of time-weighted water concentrations of pollutants (Belden et al., 2015; Lotufo et al., 2019).
Artificial Substrates are sampling devices mimicking complex habitats to collect biological communities over years (Figure 1M). The Autonomous Reef Monitoring Structure (ARMS) mimics the complex structure of hard benthic habitats like rocks or coral reefs, while the Artificial Substrate Unit (ASU) resembles soft corals or sponges (DEVOTES, 2013; Cahill et al., 2018). The analysis for community characterisation can be coupled to molecular techniques such as DNA metabarcoding. The applicability of both ARMS and ASUS in marine monitoring is highly valuable, since they enable a standardised sampling of the hard-bottom benthic communities across countries and therefore comparable monitoring data (DEVOTES, 2013).
Citizen Observations
In Citizen Observations, voluntary observations are made by non-professional observers (Figure 1N). Coordinated by researchers, engaged citizens are integrated into environmental science, including the observation of various environmental phenomena, which are transmitted to specific platforms using the smartphone or computer. Several programmes have been established at local scale (Palacin-Silva et al., 2016), including the monitoring of Secchi depth3, non-indigenous species4, phytoplankton5, and several local, national and European wide campaigns for the prevention of marine litter near the shore and in the coastal waters6,7. Besides added value for the acquisition of monitoring data, the integration of citizens into the environmental monitoring can strongly increase the societal environmental awareness.
Remote Sensing
Unmanned Aerial Vehicles (UAVs), commonly known as “drones,” are measurement platforms collecting data while flying over the area of interest (Figure 1O). For operations in marine and coastal environments, different types of UAVs are used with varying flight duration and modes of operation (autonomous or manual; Colefax et al., 2017; Setlak and Kowalik, 2019). In marine monitoring UAVs can be used to increase the spatio-temporal resolution and coverage of monitoring data for parameters used to assess biodiversity, eutrophication, commercial fish and shellfish, hydrological conditions, contaminants and marine litter.
In a monitoring context, Earth Observation means the use of satellites for the remote sensing of biological and physico-chemical properties of the upper water layer (Figure 1P). Europe-wide satellite missions are performed by the European and North American Space Agencies, which are offering free access to their satellite images (Harvey et al., 2015; Attila et al., 2018). In marine monitoring Earth Observation profoundly increases the temporal resolution and spatial coverage of data on water quality parameters, giving a more comprehensive picture on environmental conditions related to biodiversity, eutrophication and hydrographical conditions (Anttila et al., 2018; Attila et al., 2018).
In Remote Electronic Monitoring (REM), video and sensor technology are combined to provide a comprehensive overview on the fishing activity and catch handling on fishing trawlers (Figure 1Q; WWF, 2015, 2017). The analysis of the REM data can be coupled to computer-based identification and quantification of organisms. In marine monitoring REM can be used to enhance data acquisition on all activities of fishing trawlers, enabling a more comprehensive monitoring of biodiversity, commercial fish and shellfish, and food webs (Kindt-Larsen et al., 2012). Furthermore, fishing practices might become more sustainable due to the continuous surveillance on board of the trawlers (WWF, 2017).
Methods for Sample Analysis
Field Analysis
The CONTROS HydroFIA®pH system is autonomously conducting flow injection analysis (FIA) to determine the pH of water (Müller et al., 2018; Figure 1R). The system was developed for the continuous long-term measurement of pH of the surface water and is therefore suitable for both the operation on research vessels and non-research vessels like ferries (Aßmann et al., 2011; Müller et al., 2018). In marine monitoring the system can be deployed independently or in combination with a FerryBox to obtain long pH time series for locations along a set route. This enables spatial and temporal monitoring of ocean acidification (Müller et al., 2018).
Imaging Flow Cytometry (IFC) platforms are used to analyse phytoplankton communities (Figure 1S) by combining traditional flow cytometry and automated imaging to analyse large sample sizes with high speed (Karlson et al., 2016). The different instruments include laboratory applications, instruments included into a FerryBox, or autonomous in situ platforms at fixed stations. Machine learning algorithms can be used for analysing the acquired images (González et al., 2019). IFC platforms enhance the assessment of biodiversity, non-indigenous species, food webs and eutrophication, and can also be important components early-warning-systems for harmful algal blooms (Anderson et al., 2019).
Laboratory Analysis
(e)DNA Metabarcoding is a molecular-based methodology that allows the simultaneous identification of several species within a sample using high-throughput sequencing technologies (Figure 1T). To attain species lists of complete biological communities simultaneously, DNA metabarcoding can be applied. In addition, metabarcoding can be used to detect species inhabiting a certain habitat using environmental DNA (eDNA) extracted from water or sediments (Pawlowski et al., 2018; Zhang et al., 2020). In marine monitoring, DNA metabarcoding has the potential to improve the monitoring of biodiversity, non-indigenous species, commercial fish and shellfish and eutrophication indicators (Jeunen et al., 2019).
Stable Isotope Analysis (SIA) can be performed to derive food web structures and energy pathways within communities (Michener and Kaufman, 2007; Figure 1U). The stepwise enrichment of 15N compared to 14N with increasing trophic level enables the estimation of the food chain lengths (of number of trophic transfer steps within the food web). The stability of the food web can be monitored by comparing the 13C/12C isotopic ratios of predatory fish among years (Michener and Kaufman, 2007; Jardine et al., 2017). So far, parameters to assess food webs are still under development (Rombouts et al., 2013) and the monitoring of food webs can be improved using the proposed novel indicator “food web length and stability” and assessed using SIA. Furthermore, the assessment of eutrophication can be supported by identifying anthropogenic nitrogen and carbon inputs (Briant et al., 2018; Ziółkowska et al., 2018).
For the computer-based identification and quantification of organisms, computer systems are trained to autonomously identify and count sampled organisms using algorithms (“Machine Learning”; Figure 1V; Kelleher et al., 2015). For the identification of larger organisms (e.g., fish), an algorithm can be trained based on an image recognition system. After successful training, the algorithm can be used to identify and quantify caught species/bycatch (Williams et al., 2012) or evaluate indicator-related metrics (Uusitalo et al., 2016). For marine monitoring, computer-based identification of organisms offers an automated method to increase the speed and accuracy of data acquisition (Osterloff et al., 2019).
Rating of Methods
Costs of Novel Monitoring Methods
Two thirds of the analysed novel methods require very low to low overall costs, while four methods require moderate and two high overall costs (Table 2). There is no clear pattern between the different categories of monitoring methods. Citizen Observations is the only method with very low overall costs. This is due to the voluntary field sampling of citizens (data acquisition at no cost) with only the web services and management activities requiring personnel time. Gliders and REM have high overall costs. For Gliders, this is due to very high investment costs (100,000 € for purchasing a Glider). Regarding REM, the installation and maintenance of the system on a single trawler is of low costs with 17,000 €. However, to create equal economic conditions between the trawlers, according to WWF (2017) the system needs to be installed on at least all big sized (> 12 m) trawlers of the Baltic Sea. In the whole area, there are 558 registered big sized trawlers (ICES, 2018), resulting in the high overall costs of REM. It should be noted that the sharing of facilities and instruments offers the possibility to reduce investment and monitoring costs. For instance, Gliders are such instruments, and their investment costs could be reduced by splitting them between institutions.
There is a broad range of costs across the different methods, which also reflects the diversity of methods addressed. Investment costs of 80,000 € on average are required for the initial set up of a novel method. With about 500 €, the Artificial Substrates require the lowest investments, while the ROTV and MVP require about 350,000 and 400,000 €, respectively. This wide range in costs is also reflected in the monitoring costs: Based on the assumptions made (see Supplementary Material B), the use of a method for the annually monitoring of the whole Baltic Sea requires on average 93,000 €. Using computer-based identification and Citizen Observations have the lowest costs with 300 and 600 € annually, while the use of Gliders and REM require 85,000 and 1,116,000 €, respectively.
Monitoring costs could not be assessed for three methods. For the MVP, the extrapolation of monitoring costs on Baltic-wide coverage could not be estimated. These costs depend on the total number of installed devices on research vessels, as well as the frequency, at which these are deployed. Other methods can be used for various different applications, including the ROTV and UAV. The ROTV can be deployed automatically to receive profiles, or in manual mode, steering it in three dimensions to monitor a small area at a very high resolution. Especially the manual deployment is very specific in its time, area and frequency. In case of UAVs, the monitoring costs heavily depend on the kind of vehicle (fixed-wing or multi-rotor and size of vehicle), the place of deployment (open sea or coastal), the mode of operation (manual or automatic operation) and monitoring objective (long-term deployment of a specific area or occasional snapshots). All these variables cannot be estimated for all countries of the Baltic Sea.
We could compare the monitoring costs using novel methods to the costs using traditional methods only for DNA metabarcoding and REM. Regarding metabarcoding, the costs for the molecular identification per sample are decreasing with an increasing number of samples, while the morphological approach has a fixed price (and waiting time) per sample (Aylagas et al., 2018). Metabarcoding is thus most cost-efficient when a sufficiently high number of samples is analysed, which is met under the assumptions made (Supplementary Material B). This also applies when identifying hard-bottom benthic macroinvertebrate communities sampled by ARMS and ASU in the Baltic Sea. Assuming that three replicates of ARMSs and ASUs are deployed per southern sub-basin (11 stations, since in the southern Baltic mainly soft bottom is prevalent) and three replicates per northern WFD water body (32 stations, since in the northern Baltic hard substrate is more common), this adds up to 43 sites and 260 samples. Based on these assumptions, the annual costs for DNA metabarcoding sum up to about 45,000 €. The traditional morphological identification of ARMS and ASU samples costs 455 € per sample, summing up to about 118,000 €. See Aylagas et al. (2018) for a detailed calculation of the costs for metabarcoding and traditional identifications. If eDNA metabarcoding is applied rather than bulk sample analysis, the whole costs decrease further for eDNA because no sorting is needed but DNA is directly extracted from water or sediment. Furthermore, WWF (2017) made comprehensive analyses on different methods for the monitoring of fisheries and concluded that REM is the most cost-efficient method for this purpose.
For the remaining methods, the costs could not be compared to the traditional methods due to various reasons. For traditional methods that are research-vessel based, monitoring costs could not be determined due to the case-specific costs (e.g., number of sampled stations per cruise; length of cruise; personnel on board). Methods like ROTV, MVP, FerryBox, or EO collect data on multiple parameters and, therefore, could replace or supplement more than one traditional method. Methods like the Manta Trawl, Sediment Corer or SIA collect data on novel quality parameters and, therefore, there is no traditional method to be compared to. This is a common problem when assessing cost efficiency of novel methods (Hyvärinen et al., Submitted).
Applicability of Novel Monitoring Methods
Twelve methods are rated with very high and five with high applicability, while four methods are rated as moderate and one as low. The applicability rating showed no patterns among monitoring method categories. The methods with very high and high ratings can be recommended for Baltic routine monitoring. Here, single disadvantages in monitoring methods (e.g., a moderate environmental impact or a high expertise required) are overruled by their specific advantages. The Glider, Active Biomonitoring using Blue Mussels, IFC platforms and computer-based identification of organisms gained an overall “moderate” rating, while UAVs gained an overall “low” rating. These methods can be recommended for specific monitoring tasks and/or need further technical development to achieve a higher applicability.
Most of the methods are rated with respect to a specific monitoring objective or application and therefore, the rating is dependent on specific assumptions. Regarding DNA metabarcoding, the rating refers to the analysis of the species composition in bulk samples. The approach is limited as it does not allow storage of samples and does not reveal absolute abundances of the organisms (Leese et al., 2018). However, some studies have demonstrated relationships between the number of reads and species abundance when calculating DNA-based indices (Aylagas et al., 2018; Ushio et al., 2018; Schenk et al., 2019). In general, molecular methods have the potential to enhance the monitoring of several MSFD descriptors and thus are a promising approach for future marine monitoring (Danovaro et al., 2016; Valentini et al., 2016; Weigand et al., 2019; Filipe et al., 2019).
In case of Gliders, the technology seems not advanced enough for a cost-efficient monitoring so far, but due to the high potential of this method, research is conducted to further enhance its applicability (e.g., Meyer, 2016; Alenius et al., 2017). The method needs further improvement, since about 41% of the missions in shallow water currently fail due to platform loss or technical defects (like leakages or failures in the power supply or buoyancy; Brito et al., 2014). But due to their high spatio-temporal resolution and coverage in data acquisition, the Gliders offer a high potential to improve the marine monitoring, which cannot be achieved by conventional underwater vehicles or research vessel-based methods (Brito et al., 2014). Furthermore, Gliders can be used to detect warfare relicts dumped in the sea, increasing the importance of further technical development.
In case of the UAVs, limitations such as relatively short operating times and civil aviation restrictions cause the low applicability rating. But UAVs have a high potential to sample small areas with high spatio-temporal resolution, also in remote areas. The sampling is less time consuming and less infrastructure is needed compared to research vessel-based sampling. Currently, there is a lot of research to improve the technology of the platforms and available sensors and in turn improve the cost-efficiency and applicability (e.g., Colefax et al., 2017). In conclusion, all the methods included in this analysis were identified as promising novel monitoring methods by stakeholders and therefore each method may have specific advantages for use in a novel monitoring system.
Coverage of Gaps by the Novel Methods
The novel methods can be used to fill gaps of type (i)–(iii) regarding all MSFD descriptors except seafood contamination (Table 3). The main gaps of type (i) can be compensated using several of the reviewed methods, which partly allow for a higher spatial and/or temporal resolution of monitoring data due to their autonomous measurement (Table 3). We want to emphasize the use of earth observation to facilitate the observation of the entire assessment area in the open sea, which is a highly relevant topic in the MSFD.
The lack of indicators, and therefore gaps of type (ii), can be addressed for all descriptors but underwater noise/energy. Using (e)DNA metabarcoding, the monitoring of several descriptors can be enhanced, since new indicator species are made accessible. A promising method for an improved monitoring of food webs is SIA, using the novel indicator “food web length and stability.” Regarding sea-floor integrity, the Artificial Substrates ARMS and ASU can be used to generate a more comprehensive data basis by monitoring the presence of particularly sensitive and/or tolerant species, but still, indicators for a better reflection of the descriptor remain to be developed. The monitoring of dumped munitions was addressed by several recently finished and ongoing research projects (e.g., MODUM—Towards the Monitoring of Dumped Munitions Threat, 2013–2016; Buenos Aires, 2016—Environmental monitoring for the delaboration of munitions on the seabed, 2016–2019; DAIMON—Decision Aid for Marine Munition, 2019–2021). For the detection and identification of dumped warfare relicts, ROTV and Gliders can be deployed, while the concentrations of leaking contaminants in the water can be monitored employing Active Biomonitoring using Blue Mussels or Passive Samplers. Regarding microplastics, the constant fragmentation and the large diversity within types of particles cannot be adequately addressed by a single method (Potthoff et al., 2017). Therefore, novel methods can be combined, e.g., by sampling larger particles using the Manta Trawl and complement these data by Rocket filtration samples and Sediment Corers. The applicability of the Earth Observation techniques to measure marine litter have been under study in recent years and methodologies are evolving (Martinez-Vicente et al., 2019).
Ecosystem services and climate change were also identified as missing descriptors and are addressed in recent research (HELCOM, 2013). The monitoring of these descriptors is a wide and complex field and therefore, was not addressed in this work. However, in the course of the BONUS FUMARI project, indicators for the monitoring of ecosystem services and novel methods to measure these were collected on the novel methods website http://freshwaterplatform.eu/fumari/.
The Need for Adaptable Monitoring Practices
With this overview and evaluation of monitoring methods, we strive to support the decision making and implementation of environmental monitoring. Even though the focus of this study is on filling the gaps in the Baltic monitoring, the addressed methods can also be applied for specific research questions and in other marine regions worldwide. An in-depth comparative analysis of the methods for the environmental status assessment was not envisaged by this study and is not necessarily feasible, due to their heterogeneous nature and the wide range of applications possible. Furthermore, the cost-efficiency of the addressed novel methods was not compared to the traditional methods they might replace or supplement. This is due to the wide applicability of the novel methods that can address several ecosystem elements and indicators, the high number of factors influencing the costs, and the lack of cost analyses regarding the specific methods. An alternative option for the cost evaluation, which is not addressed here, would be using depreciation costs rather than investment costs. We defined investment costs as the costs for the monitoring device or deployment system, including the necessary equipment, and personnel training; this limits the application of depreciation costs.
New game-changing or more effective novel methods may produce high value data that are not fully comparable to these produced by traditional methods and, thus, may fail to meet current legislative demands. Very often the suggested implementation of such novel methods may be dismissed due to a lack of full comparability, but it seems unreasonable to assume a full comparability of novel methods with old ones. The current legislation driving routine monitoring of the Baltic Sea was drafted against the backdrop of the scientific knowledge and the methods available at the time of drafting. In fact, such a tacit prerequisite may hinder both scientific progress as well as effective future management of the Baltic Sea.
While we do not advocate abrupt changes in monitoring or the replacement of old by novel methods in Baltic monitoring per se, we stress the need to review whether there is a need to re-examine and adapt our current monitoring. With this contribution, we want to highlight the need for adaptable monitoring practices. For this, parallel and standardised comparisons are of central importance (Blackman et al., 2019). However, such novel methods need to be mature enough to have gained considerable consensus within the scientific community as well as HELCOM and also to have resulted in standardised and replicable devices and process chains. In order to implement novel methods as parts of monitoring programmes, their applicability and cost-efficiency needs to be demonstrated in the considered ecosystem, the operational practices and data flows need to be managed, and guidance for the interpretation of the acquired data needs to be given (preferably including indicators that can use the data to assess the ecosystem status). The use of the novel method should be calibrated and standardised internationally to allow for comparison between different areas or deployments.
Data Availability Statement
All datasets presented in this study are included in the article/Supplementary Material.
Ethics Statement
Written informed consent was obtained from the individuals for the publication of any potentially identifiable images or data included in this article.
Author Contributions
LM designed the approach to conduct this study, coordinated the data acquisition, carried out the rating of methods, and wrote the manuscript. SB supervised the approach and data acquisition, and contributed to the rating of methods and the writing of the manuscript. KM and DH contributed to the design of the study, the coordination of data acquisition, and revised the manuscript. JA, EA, ABe, ABo, MK, FL, RL, ML, AL, UL, O-PM, TP, OS, JS, LU, and AW provided data and knowledge about specific methods and revised the manuscript. All authors contributed to the article and approved the submitted version.
Conflict of Interest
The authors declare that the research was conducted in the absence of any commercial or financial relationships that could be construed as a potential conflict of interest.
Funding
This work resulted from the BONUS FUMARI project in collaboration with BONUS SEAM project, funded by BONUS (Art. 185), which is jointly funded by the EU, the Academy of Finland and the Swedish Research Council Formas. Furthermore, funding was received from the BmBF project MicroCatch_Balt, grant number 03F0788A and EA was supported by the Red Sea Research Center at KAUST. Data on ARMS and ASUs were obtained by DEVOTES (DEVelopment Of innovative Tools for understanding marine biodiversity and assessing good Environmental Status) project, funded by the European Union under the 7th Framework Programme, “The Ocean of Tomorrow” Theme (grant agreement no. 308392), www.devotes-project.eu.
Acknowledgments
We thank Heidi Ahkola (SYKE), Matthias Labrenz (IOW), Jari Hänninen (UTU), Helena Filipsson (LU), Joanna Norkko (UH), Bengt Karlson (SMHI), and Eoin O’Gorman (Essex) for their help to collate information on the addressed methods. We are also grateful for the providers of the images to display the methods. We thank the stakeholders, which took part in the survey and shared their experiences and suggestions for an improved monitoring. We thank Jörg Strackbein (UDE) for establishing the online database of novel monitoring methods.
Supplementary Material
The Supplementary Material for this article can be found online at: https://www.frontiersin.org/articles/10.3389/fmars.2020.552047/full#supplementary-material
Footnotes
- ^ https://www.syke.fi/BONUS_FUMARI/
- ^ http://freshwaterplatform.eu/fumari/
- ^ https://www.havaintolahetti/
- ^ https://www.invasive-alien-species-finland
- ^ https://Leväbarometri
- ^ https://www.siistibiitsi.fi/
- ^ https://www.eea.europa.eu/marine-litterwatch
References
Abramic, A., Martínez-Alzamora, N., González, del Rio, Rams, J., Barrachina, T., et al. (2014). New methodology for analysing and increasing the cost-efficiency of environmental monitoring networks. Mar. Pollut. Bull. 86, 161–173. doi: 10.1016/j.marpolbul.2014.07.029
Alenius, P., Tikka, K., Lips, U., Tuomi, L., Purokoski, T., Roiha, P., et al. (2017). “Euro-Argo in work and new potential of gliders in the Baltic Sea BOOS,” in Operational Oceanography Serving Sustainable Marine Development. eds E, V. Fernández, D. Eparkhina, P. Gorringe, and G. Nolan (Bergen: Scandic Bergen City Hotel)143–148.
Andersen, J. H., Halpern, B. S., Korpinen, S., Murray, C., and Reker, J. (2015). Baltic Sea biodiversity status vs. cumulative human pressures. Estuar. Coast. Shelf Sci. 161, 88–92. doi: 10.1016/j.ecss.2015.05.002
Anderson, C. R., Berdalet, E., Kudela, R. M., Cusack, C. K., Silke, J., O’Rourke, E., et al. (2019). Scaling up from regional case studies to a global harmful algal bloom observing system. Front. Mar. Sci. 6:250. doi: 10.3389/fmars.2019.00250
Anttila, S., Fleming-Lehtinen, V., Attila, J., Junttila, S., Alasalmi, H., Hällfors, H., et al. (2018). A novel cyanobacterial surface accumulation indicator for the Baltic Sea. A novel earth observation based ecological indicator for cyanobacterial blooms. Int. J. Appl. Earth Observ. Geoinform. 64, 145–155. doi: 10.1016/j.jag.2017.09.007
Appel, D., Strehse, J. S., Martin, H. J., and Maser, E. (2018). Bioaccumulation of 2,4,6-trinitrotoluene (TNT) and its metabolites leaking from corroded munition in transplanted blue mussels (M. edulis). Mar. Pollut. Bull. 135, 1072–1078. doi: 10.1016/j.marpolbul.2018.08.028
Attila, J., Kauppila, P., Alasalmi, H., Kallio, K., Keto, V., and Bruun, E. (2018). Applicability of Earth Observation chlorophyll-a data in assessment of water status via MERIS – with implications for the use of OLCI sensors. Rem. Sens. Environ. 212, 273–287. doi: 10.1016/j.rse.2018.02.043
Aylagas, E., Borja, A., Muxika, I., and Rodríguez-Ezpeleta, N. (2018). Adapting metabarcoding-based benthic biomonitoring into routine marine ecological status assessment networks. Ecol. Indic. 95, 194–202. doi: 10.1016/j.ecolind.2018.07.044
Aßmann, S., Frank, C., and Körtzinger, A. (2011). Spectrophotometric high-precision seawater pH determination for use in underway measuring systems. Ocean Sci. 7, 597–607. doi: 10.5194/os-7-597-2011
Backer, H., Leppänen, J.-M., Brusendorff, A. C., Forsius, K., Stankiewicz, M., Mehtonen, J., et al. (2010). HELCOM baltic sea action plan - A regional programme of measures for the marine environment based on the ecosystem approach. Mar. Pollut. Bull. 60, 642–649. doi: 10.1016/j.marpolbul.2009.11.016
Belden, J., Lotufo, G., Biedenbach, J., Sieve, K., and Rosen, G. (2015). Application of POCIS for exposure assessment of munitions constituents during constant and fluctuation exposure. Environ. Toxicol. Chem. 34, 959–967. doi: 10.1002/etc.2836
Beldowski, J., Jakacki, J., Grabowski, M., Lang, T., Weber, K., Kotwicki, L., et al. (2018). “Chapter 9: Best Practices in Monitoring,” in Towards the Monitoring of Dumped Munitions Threat (MODUM), eds J. Beldowski, R. Been, and E. K. Turmus (Berlin: Springer Science and Business Media), 213–240. doi: 10.1007/978-94-024-1153-9
Bellanger, M., and Levrel, H. (2017). A cost-effectiveness analysis of alternative survey methods used for the monitoring of marine recreational fishing in France. Ocean Coast. Manag. 138, 19–28. doi: 10.1016/j.ocecoaman.2017.01.007
Birk, S., Bonne, W., Borja, A., Brucet, S., Courrat, S., Poikane, S., et al. (2012). Three hundred ways to assess Europe’s surface waters: an almost complete overview of biological methods to implement the water framework directive. Ecol. Indic. 18, 31–41. doi: 10.1016/j.ecolind.2011.10.009
Blackman, R. C., Mächler, E., Altermatt, F., Arnold, A., Beja, P., Boets, P., et al. (2019). Advancing the use of molecular methods for routine freshwater macroinvertebrate biomonitoring – the need for calibration experiments. Metabarcod. Metagenom. 3, 49–57. doi: 10.3897/mbmg.3.34735
Briant, N., Savoye, N., Chouvelon, T., David, V. R., Rodriguez, S., Charlier, K., et al. (2018). Carbon and nitrogen elemental and isotopic ratios of filter-feeding bivalves along the French coasts: an assessment of specific, geographic, seasonal and multi-decadal variations. Sci. Total Environ. 61, 196–207. doi: 10.1016/j.scitotenv.2017.08.281
Brito, M., Smeed, D., and Griffiths, G. (2014). Underwater glider reliability and implications for survey design. J. Atmosph. Ocean. Technol. 31, 2858–2870. doi: 10.1175/JTECH-D-13-00138.1
Buenos Aires (2016). Environmental Monitoring for the Delaboration of Munitions on the Seabed, 2016-2019.
Cahill, A. E., Pearman, J. K., Borja, A., Carugati, L., Carvalho, S., Danovaro, R., et al. (2018). A comparative analysis of metabarcoding and morphology-based identification of benthic communities across different regional seas. Ecol. Evol. 8, 8908–8920. doi: 10.1002/ece3.4283
Carstensen, J., Andersen, J. H., Gustafsson, B. G., and Conley, D. J. (2014). Deoxygenation of the Baltic Sea during the last century. Proc. Natl. Acad. Sci. U.S.A. 111, 5628–5633. doi: 10.1073/pnas.1323156111
Charriau, A., Lissalde, S., Poulier, G., Mazzella, N., and Buzier, N. (2016). Overview of the Chemcatcher® for the passive sampling of various pollutants in aquatic environments Part A: principles, calibration, preparation and analysis of the sampler. Talanta 148, 556–571. doi: 10.1016/j.talanta.2015.06.064
Charrieau, L. M., Filipsson, H. L., Ljung, K., Chierici, M., Knudsen, K. L., and Kritzberg, E. (2018). The effects of multiple stressors on the distribution of coastal benthic foraminifera: a case study from the Skagerrak-Baltic Sea region. Mar. Micropaleontol. 139, 42–56. doi: 10.1016/j.marmicro.2017.11.004
Colefax, A. P., Butcher, P. A., and Kelaher, B. P. (2017). The potential for unmanned aerial vehicles (UAVs) to conduct marine fauna surveys in place of manned aircraft. ICES J. Mar. Sci. 75, 1–8. doi: 10.1093/icesjms/fsx100
Danovaro, R., Carugati, L., Berzano, M., Cahill, A. E., Carvalho, S., Chenuil, A., et al. (2016). Implementing and innovating marine monitoring approaches for assessing marine environmental status. Front. Mar. Sci. 3:213. doi: 10.3389/fmars.2016.00213
DEVOTES (2013). Deliverable 5.1. Innovative Monitoring Techniques. Report on the Set up of the Field and Experimental Activities. Research Report of the EU Research Project DEVOTES. Rome: CONISMA.
Emmerson, R., Nygård, H., Grimvall, A., Storr-Paulsen, M., Dinesen, G., Ritzau Eigaard, O., et al. (2019). Deliverable 2.1: Holistic Synthesis of Reviews and Analysis of Current Baltic Sea Monitoring and Assessment. Technical report of the EU Research Project BONUS SEAM. Gothenburg: University of Gothenburg.
EuroGOOS (2017). Ferrybox Whitebook. Technical and Scientific Report of the European Global Ocean Observing System (EuroGOOS). Brussels: EuroGOOS AISBL.
European Commission (2000). Directive 2000/60/EC of the European Parliament and of the Council of 23 October 2000 establishing a framework for community action in the field of water policy. Off. J. Eur. Commun. 327, 1–72.
European Commission (2008). Directive 2008/56/EC of the European Parliament and of the Council of 17 June 2008 establishing a framework for community action in the field of marine environmental policy (Marine Strategy Framework Directive). Off. J. Eur. Commun. 164, 19–49.
European Commission (2014). Technology Readiness Levels (TRL); Extract From Part 19 - Commission Decision C (2014) 4995. https://ec.europa.eu/research/participants/data/ref/h2020/wp/2014_2015/annexes/h2020-wp1415-annex-g-trl_en.pdf. (accessed March 26, 2019).
Filipe, A. F., Feio, M. J., Garcia-Raventós, A., Ramião, J. P., Pace, G., Martins, F. M. S., et al. (2019). The European Water Framework Directive facing current challenges: recommendations for a more efficient biological assessment of inland surface waters. Inland Waters 9:10. doi: 10.1080/20442041.2018.1494973
Floeter, J., van Beusekomb, J. E. E., Auch, D., Callies, U., Carpenter, J., Dudeck, T., et al. (2017). Pelagic effects of offshore wind farm foundations in the stratified North Sea. Prog. Oceanogr. 156, 154–173. doi: 10.1016/j.pocean.2017.07.003
Furlong, A., Osler, J., Christian, H., Cunningham, D., and Pecknold, S. (2006). The Moving Vessel Profiler (MVP) - a Rapid Environmental Assessment Tool for the Collection of Water Column Profiles and Sediment Classification. Technical Report AD1005165. Fairfax: Defense Technical Information Center.
González, P., Castaño, A., Peacock, E. E., Díez, J., Del Coz, J. J., and Sosik, H. M. (2019). Automatic plankton quantification using deep features. J. Plankton Res. 41, 449–463. doi: 10.1093/plankt/fbz023
Gustafsson, B. G., Schenk, F., Blenckner, T., Eilola, K., Meier, H. E. M., Müller-Karulis, B., et al. (2012). Reconstructing the development of baltic sea eutrophication 1850-2006. Ambio 41, 534–548. doi: 10.1007/s13280-012-0318-x
Harman, C., Allan, I. J., and Vermeirssen, E. L. M. (2012). Calibration and use of polar organic chemical integrative sampler – a critical review. Environ. Toxicol. Chem. 31, 2724–2739. doi: 10.1002/etc.2011
Harvey, E. T., Kratzer, S., and Philipson, P. (2015). Satellite-based water quality monitoring for improved spatial and temporal retrieval of chlorophyll-a in coastal waters. Remote Sens. Environ. 158, 417–430. doi: 10.1016/j.rse.2014.11.017
HELCOM (2007). Baltic Sea Action Plan. Adopted at HELCOM Ministerial Meeting in Krakow, Poland. Helsinki: HELCOM.
HELCOM (2013). Climate change in the Baltic Sea Area: HELCOM thematic assessment in 2013. Baltic Sea Environment Proceedings 137. Helsinki: HELCOM.
HELCOM (2016). Hydrography and Oxygen in the Deep Sea Basins. HELCOM Baltic Sea Environment Fact Sheets. Helsinki: HELCOM.
HELCOM (2017). HELCOM Monitoring and Assessment Strategy, Attachment 4. HELCOM Ministerial Declaration from the 2013 Ministerial Meeting, updated in 2017 following the STATE & CONSERVATION meeting. Copenhagen: HELCOM.
HELCOM (2018a). State of the Baltic Sea – Second HELCOM holistic assessment 2011-2016. Baltic Sea Environmental Proceedings 155. Helsinki: HELCOM.
HELCOM (2018c). HELCOM Thematic Assessment of Eutrophication 2011-2016. Baltic Sea Environment Proceedings No. 156. Helsinki: HELCOM.
Hering, D., Borja, A., Jones, J. I., Pont, D., Boets, P., Bouchez, A., et al. (2018). Implementation options for DNA-based identification into ecological status assessment under the European Water Framework Directive. Water Res. 138, 192–205. doi: 10.1016/j.watres.2018.03.003
ICES (2018). 4.2 Baltic Sea Ecoregion - Fisheries Overview. Report of the International Council for the Exploration of the Sea (ICES). Copenhagen: ICES, 23. doi: 10.17895/ices.pub.4648
Jardine, T. D., Hobson, K. A., and Soto, D. X. (2017). “Introduction to Stable Isotopes in Food Webs,” in Food Forensics – Stable Isotopes as a Guide to Authenticity and Origin, eds J. F. Carter and L. A. Chesson (Boca Raton, FL: CRC Press), 63–94. doi: 10.1201/9781315151649
Jeunen, G.-J., Knapp, M., Spencer, H. G., Lamare, M. D., Taylor, H. R., Stat, M., et al. (2019). Environmental DNA (eDNA) metabarcoding reveals strong discrimination among diverse marine habitats connected by water movement. Mol. Ecol. Res. 19, 426–438. doi: 10.1111/1755-0998.12982
JRC (2013). Guidance on Monitoring of Marine Litter in European Seas. A guidance document within the Common Implementation Strategy for the Marine Strategy Framework Directive. Scientific and Policy Report EUR 26113 of the MSFD Technical Subgroup on Marine Litter. Ispra: Joint Research Centre, 128.
JRC (2014). Technical Guidance on Monitoring for the Marine Strategy Framework Directive. Scientific and Policy Report EUR 26499 EN. Ispra: Joint Research Centre, 175.
Kahlert, M., Eilola, K., Mack, L., Meissner, K., Sandin, L., Strömberg, H., et al. (2020). Gaps in current Baltic Sea environmental monitoring Science versus management perspectives. Mar. Pollut. 160:111669. doi: 10.1016/j.marpolbul.2020.111669
Karlson, B., Andersson, L. S., Kaitala, S., Kronsell, J., Mohlin, M., Seppälä, J., et al. (2016). A comparison of FerryBox data vs. Monitoring data from research vessels for near surface waters of the Baltic Sea and the Kattegat. J. Mar. Syst. 162, 98–111. doi: 10.1016/j.jmarsys.2016.05.002
Kelleher, J. D., Mac Namee, B., and D’Arcy, A. (2015). Fundamentals of Machine Learning for Predictive Data Analytics. Cambridge: The MIT Press, 624.
Kindt-Larsen, L., Dalskov, J., Stage, B., and Larsen, F. (2012). Observing incidental harbour porpoise Phocoena bycatch by remote electronic monitoring. End. Species Res. 19, 75–83. doi: 10.3354/esr00455
Leese, F., Bouchez, A., Abarenkov, K., Altermatt, F., Borja, A., Bruce, K., et al. (2018). Why we need sustainable networks bridging countries, disciplines, cultures and generations for aquatic biomonitoring 2.0: A perspective derived from the DNAqua-Net COST Action. Adv. Ecol. Res. 58, 63–99. doi: 10.1016/bs.aecr.2018.01.001
Lehikoinen, A., Olsson, J., Bergström, L., Bergström, U., Bryhn, A., Fredriksson, R., et al. (2019). Evaluating complex relationships between ecological indicators and environmental factors in the Baltic Sea: a machine learning approach. Ecol. Indic. 101, 117–125. doi: 10.1016/j.ecolind.2018.12.053
Lenz, R., and Labrenz, M. (2018). Small microplastic sampling in water: development of an encapsulated filtration device. Water 10:1055. doi: 10.3390/w10081055
Liblik, T., Karstensen, J., Testor, P., Alenius, P., Hayes, D., Ruiz, S., et al. (2016). Potential for an underwater glider component as part of the global ocean observing system. Methods Oceanogr. 17, 50–82. doi: 10.1016/j.mio.2016.05.001
Lips, I., and Lips, U. (2017). The importance of Mesodinium rubrum at post-spring bloom nutrient and phytoplankton dynamics in the vertically stratified Baltic Sea. Front. Mar. Sci. 4:1–16. doi: 10.3389/fmars.2017.00407
Lips, I., Lips, U., Liblik, T., Kikas, V., Altoja, K., Buhhalko, N., et al. (2011). Vertical dynamics of summer phytoplankton in a stratified estuary (Gulf of Finland. Baltic Sea). Ocean Dyn. 61, 903–915. doi: 10.1007/s10236-011-0421-8
Liu, M., Zhang, Y., Shi, K., Zhu, G., Wu, Z., Liu, M., et al. (2019). Thermal stratification dynamics in a large and deep subtropical reservoir revealed by high-frequency buoy data. Sci. Total Environ. 651, 614–624. doi: 10.1016/j.scitotenv.2018.09.215
Lotufo, G. R., George, R. D., Belden, J. B., Woodley, C., Smith, D. L., and Rosen, G. (2019). Release of munitions constituents in aquatic environments under realistic scenarios and validation of polar organic chemical integrative samplers for monitoring. Environ. Toxicol. Chem. 38, 2383–2391. doi: 10.1002/etc.4553
Mack, L., Birk, S., and Hering, D. (2019). Deliverable 2.1: Structure of the Review on Novel Monitoring Methods. Research Report of the EU Research Project BONUS FUMARI. Essen: University of Duisburg-Essen.
Martinez-Vicente, V., Clark, J. R., Corradi, P., Aliani, S., Arias, M., Bochow, M., et al. (2019). Measuring marine plastic debris from space: initial assessment of observation requirements. Rem. Sens. 11:2443. doi: 10.3390/rs11202443
Meyer, D. (2016). Glider technology for ocean observations: a review. Ocean Sci. Discuss.. 2016, 1–26. doi: 10.5194/os-2016-40
Meyer, D., Lips, U., Prien, R. D., Naumann, M., Liblik, T., Schuffenhauer, I., et al. (2018). Quantification of dissolved oxygen dynamics in a semi-enclosed sea - a comparison of observational platforms. Cont. Shelf Res. 169, 34–45. doi: 10.1016/j.csr.2018.09.011
Michener, R. H., and Kaufman, L. (2007). “Stable Isotope Ratios in Marine Food Webs: An Update,” in Stable Isotopes in Ecology and Environmental Science, eds R. H. Michener and K. Lajtha (Malden: Blackwell Publishing), 202–230. doi: 10.1002/9780470691854
Müller, J. D., Schneider, B., Aßmann, S., and Rehder, G. (2018). Spectrophotometric pH measurements in the presence of dissolved organic matter and hydrogen sulfide. Limnol. Oceanogr. 16, 68–82. doi: 10.1002/lom3.10227
Nygård, H., Oinonen, S., Hällfors, H. A., Lehtiniemi, M., Rantajärvi, E., and Uusitalo, L. (2016). Price vs. value of marine monitoring. Front. Mar. Sci. 3:205. doi: 10.3389/fmars.2016.00205
Osterloff, J., Nilssen, I., Järnegren, J., van Engeland, T., Buhl-Mortensen, P., and Nattkemper, T. W. (2019). Computer vision enables short- and long-term analysis of Lophelia pertusa polyp behaviour and colour from an underwater observatory. Sci. Rep. 9:6578. doi: 10.1038/s41598-019-41275-1
Palacin-Silva, M., Seffah, A., Heikkinen, K., Porras, J., Pyhälahti, T., Sucksdorff, Y., et al. (2016). State-of-the art study in citizen observatories: technological trends, development challenges and research avenues. Rep. Finn. Environ. Instit. 28:100.
Papathanaopoulou, E., Simis, S., Alikas, K., Ansper, A., Anttila, S., Attila, J., et al. (2019). Satellite-assisted monitoring of water quality to support the implementation of the Water Framework Directive. EOMORES white paper 28. doi: 10.5281/zenodo.3463051
Pawlowski, J., Kelly-Quinn, M., Altermatt, F., Apothéloz-Perret-Gentil, L., Beja, P., Boggero, A., et al. (2018). The future of biotic indices in the ecogenomic era: Integrating (e)DNA metabarcoding in biological assessment of aquatic ecosystems. Sci. Total Environ. 63, 1295–1310. doi: 10.1016/j.scitotenv.2018.05.002
Petersen, W. (2014). FerryBox systems: state-of-the-art in europe and future development. J. Mar. Syst. 140, 4–12. doi: 10.1016/j.jmarsys.2014.07.003
Potthoff, A., Oelschlägel, K., Schmitt-Jansen, M., Rummel, C. D., and Kühnel, D. (2017). From the sea to the laboratory: characterization of microplastic as prerequisite for the assessment of ecotoxicological impact. Integr. Environ. Assess. Manag. 13, 500–504. doi: 10.1002/ieam.1902
Prien, R. D., and Schulz-Bull, D. E. (2016). Technical note: GODESS: a profiling mooring in the Gotland Basin. Ocean Sci. 12, 899–907. doi: 10.5194/os-12-899-2016
Roiha, P., Siiriä, S.-M., Haavisto, N., Alenius, P., Westerlund, A., and Purokoski, T. (2018). Estimating currents from argo trajectories in the Bothnian Sea, Baltic Sea. Front. Mar. Sci. 5:308. doi: 10.3389/fmars.2018.00308
Rombouts, I., Beaugrand, G., Fizzala, X., Gaill, F., Greenstreet, S. P. R., Lamare, S., et al. (2013). Food web indicators under the Marine Strategy Framework Directive: From complexity to simplicity? Ecological Indicators 29, 426–254. doi: 10.1016/j.ecolind.2012.12.021
Schenk, J., Geisen, S., Kleinboelting, N., and Traunspurger, W. (2019). Metabarcoding data allow for reliable biomass estimates in the most abundant animals on earth. MBMG 3:e46704. doi: 10.3897/mbmg.3.46704
Schneider, B., and Müller, J. D. (2018). Biogeochemical Transformations in the Baltic Sea. Observations Through Carbon Dioxide Glasses. London: Springer International Publishing, 110. doi: 10.1007/978-3-319-61699-5
Schöne, B. R., and Krause, R. A. Jr. (2016). Retrospective environmental biomonitoring – MusselWatch expanded. Global and Planetary Change 144, 228–251. doi: 10.1016/j.gloplacha.2016.08.002
Setälä, O., Magnusson, K., Lehtiniemi, M., and Norén, F. (2016). Distribution and abundance of surface water microlitter in the Baltic Sea: A comparison of two sampling methods. Mar. Pollut. Bull. 110, 177–183. doi: 10.1016/j.marpolbul.2016.06.065
Setlak, L., and Kowalik, R. (2019). Examination of the Unmanned Aerial Vehicle. ITM Web of Conferences 24, 01006. doi: 10.1051/itmconf/20192401006
Siiriä, S., Roiha, P., Tuomi, L., Purokoski, T., Haavisto, N., and Alenius, P. (2019). Applying area-locked, shallow water Argo floats in Baltic Sea monitoring. J. Operat. Oceanogr. 12, 58–72. doi: 10.1080/1755876X.2018.1544783
Söderström, S., and Kern, K. (2017). The ecosystem approach to management in marine Environmental governance: institutional interplay in the Baltic Sea Region. Environ. Pol. Govern. 27, 619–631. doi: 10.1002/eet.1775
Stoicescu, S.-T., Lips, U., and Liblik, T. (2019). Assessment of eutrophication status based on Sub-surface oxygen conditions in the gulf of Finland (Baltic Sea). Front. Mar. Sci. 19:54. doi: 10.3389/fmars.2019.00054
Strehse, J. S., Appel, D., Geist, C., Martin, H.-J., and Maser, E. (2017). Biomonitoring of 2,4,6-trinitrotoluene and degradation products in the marine environment with transplanted blue mussels (M. edulis). Toxicology 390, 117–123. doi: 10.1016/j.tox.2017.09.004
Szymczychta, B., Zaborska, A., Bełdowski, J., Kuliñski, K., Beszczyñska-Möller, A., Kêdra, M., et al. (2019). “Chapter 4: The Baltic Sea,” in World Seas: An Environmental Evaluation, Volume One: Europe, The Americas and West Africa, ed. C. Sheppard (Oxford: Academic Press), 85–111. doi: 10.1016/B978-0-12-805068-2.00005-X
Tamminga, M., Hengstmann, E., and Fischer, E. K. (2018). Microplastic analysis in the South Funen Archipelago. Baltic Sea, implementing manta trawling and bulk sampling. Mar. Pollut. Bull. 128, 601–608. doi: 10.1016/j.marpolbul.2018.01.066
Ushio, M., Murakami, H., Masuda, R., Sado, T., Miya, M., Sakurai, S., et al. (2018). Quantitative monitoring of multispecies fish environmental DNA using high-throughput sequencing. MBMG 2:e23297. doi: 10.1101/113472
Uusitalo, L., Fernandes, J. A., Bachiller, E., Tasala, S., and Lehtiniemi, M. (2016). Semi-automated classification method addressing marine strategy framework directive (MSFD) zooplankton indicators. Ecol. Indic. 71, 398–405. doi: 10.1016/j.ecolind.2016.05.036
Valentini, A., Taberlet, P., Miaud, C., Civade, R., Herder, J., Thomsen, P. F., et al. (2016). Next-generation monitoring of aquatic biodiversity using environmental DNA metabarcoding. Mol. Ecol. 25, 929–942. doi: 10.1111/mec.13428
Venkatesan, R., Ramesh, K., Muthiah, M. A., Thirumurugan, K., and Atmanand, M. A. (2019). Analysis of drift characteristic in conductivity and temperature sensors used in Moored buoy system. Ocean Eng. 171, 151–156. doi: 10.1016/j.oceaneng.2018.10.033
Vrana, B., Mills, G. A., Allan, I. J., Dominiak, E., Svensson, K., Knutsson, J., et al. (2005). Passive sampling techniques for monitoring pollutants in water. Trends Anal. Chem. 24, 845–868. doi: 10.1016/j.trac.2005.06.006
Weigand, H., Beermann, A. J., Čiampor, F., Costa, F. O., Csabai, Z., Duarte, S., et al. (2019). DNA barcode reference libraries for the monitoring of aquatic biota in Europe: Gap-analysis and recommendations for future work. Sci. Total Environ. 678, 499–524. doi: 10.1016/j.scitotenv.2019.04.247
Williams, K., Rooper, C., and Harms, J. (2012). Report of the National Marine Fisheries Service Automated Image Processing Workshop. NOAA Technical Memorandum NMFS-F/SPO-121, U.S. Seattle: Department of Commerce, NOAA, 48.
WWF (2015). Electronic Monitoring in Fisheries Management. Report Commissioned and Published by Worldwide Fund for Nature (WWF). Gland: WWF.
WWF (2017). Remote Electronic Monitoring – Why camera technology is a cost-effective and robust solution to improving UK fisheries management. Report Commissioned and Published by Worldwide Fund for Nature (WWF). Gland: WWF.
Zampoukas, N., Piha, H., Bigagli, E., Hoepffner, N., Hanke, G., and Cardoso, A. C. (2012). Monitoring for the Marine Strategy Framework Directive: Requirements and Options. Technical report EUR 25187 EN. Luxembourg: JRC Scientific and Policy Reports, 42.
Keywords: Baltic Sea Action Plan, Marine Strategy Framework Directive, Water Framework Directive, data acquisition, marine management
Citation: Mack L, Attila J, Aylagas E, Beermann A, Borja A, Hering D, Kahlert M, Leese F, Lenz R, Lehtiniemi M, Liess A, Lips U, Mattila O-P, Meissner K, Pyhälahti T, Setälä O, Strehse JS, Uusitalo L, Willstrand Wranne A and Birk S (2020) A Synthesis of Marine Monitoring Methods With the Potential to Enhance the Status Assessment of the Baltic Sea. Front. Mar. Sci. 7:552047. doi: 10.3389/fmars.2020.552047
Received: 15 April 2020; Accepted: 07 September 2020;
Published: 12 November 2020.
Edited by:
Michelle Jillian Devlin, Centre for Environment, Fisheries and Aquaculture Science (CEFAS), United KingdomReviewed by:
Bo Gustafsson, Stockholm University, SwedenThanos Dailianis, Institute of Marine Biology, Biotechnology & Aquaculture, Greece
Agnes M. L. Karlson, Stockholm University, Sweden
Copyright © 2020 Mack, Attila, Aylagas, Beermann, Borja, Hering, Kahlert, Leese, Lenz, Lehtiniemi, Liess, Lips, Mattila, Meissner, Pyhälahti, Setälä, Strehse, Uusitalo, Willstrand Wranne and Birk. This is an open-access article distributed under the terms of the Creative Commons Attribution License (CC BY). The use, distribution or reproduction in other forums is permitted, provided the original author(s) and the copyright owner(s) are credited and that the original publication in this journal is cited, in accordance with accepted academic practice. No use, distribution or reproduction is permitted which does not comply with these terms.
*Correspondence: Leoni Mack, leoni.mack@uni-due.de