A Robust Métier-Based Approach to Classifying Fishing Practices Within Commercial Fisheries
 Mahdi Parsa
 Timothy J. Emery
 Ashley J. Williams
 Simon Nicol
- 1Australian Bureau of Agricultural and Resource Economics and Sciences, Department of Agriculture, Water and the Environment, Canberra, ACT, Australia
- 2Institute for Applied Ecology, University of Canberra, Bruce, ACT, Australia
- 3Oceanic Fisheries Programme, Pacific Community, Noumea, New Caledonia
Developing a typology of heterogeneous fishing practices through the use of métier analysis is a useful step in understanding the dynamics of fishing fleets and enabling effective implementation of management outcomes. We develop a non-hierarchical clustering framework to quantitatively categorize individual fishing events to a particular métier based on corresponding catch composition, gear configuration, and spatial and temporal references. Our clustering framework has several innovations over predecessors including: (i) introducing alternative methods for encoding and transforming fisheries data; (ii) variable (feature) selection methods; (iii) complementary metrics and methods for internal métier validation; and (iv) use of a network science method to model and analyze fishing practices. To demonstrate applicability, we apply this framework to the Australian Eastern Tuna and Billfish Fishery (ETBF), a multispecies pelagic longline fishery with a diversity of fishing practices. We identified a total of seven stable métiers within the ETBF. While each métier was characterized by a predominant target species, they were differentiated more by seasonal and temporal references (e.g., time of set, month, latitude) than gear configuration (e.g., hooks per basket) or target species. By collapsing a large amount of high-dimensional operational data into a relatively uniform and limited number of components, decision-makers can more easily evaluate the likely consequences of management and design policies that target a particular métier.
Introduction
Effective fisheries management requires an understanding of human behavior (Hilborn, 2007; Davie and Lordan, 2011; Fulton et al., 2011; O’Farrell et al., 2019). Evidence has shown that when this is ignored it can lead to unexpected and undesirable outcomes from management decision-making (Fulton et al., 2011). In recent years, there has been a greater focus on understanding and classifying fisher behavior based on socio-demographic and psychological characteristics (e.g., Nielsen and Christensen, 2006; Abernathy, 2010; Boonstra and Hentati-Sundberg, 2016). Improved prediction of the behavioral response of fishers to management measures and policy can be obtained through understanding both their short- and long-term drivers including: motivations (e.g., market price), moral and social norms, values, perceptions, personal goals, and emotions (Boonstra and Hentati-Sundberg, 2016; O’Farrell et al., 2019). These drivers often manifest a diversity of individual fishing practices and operations within a specific fleet or fishery (Boonstra and Hentati-Sundberg, 2016).
Developing a typology of these individual fishing practices and operations allows large amounts of high-dimensional data from a fleet or fishery to be collapsed into a relatively uniform and limited number of components for analysis (O’Farrell et al., 2019). These components, clusters, or units have been termed “métiers” (Marchal and Horwood, 1996; Moore et al., 2019), “fishing strategies” (He et al., 1997; Holley and Marchal, 2004; Nielsen and Christensen, 2006; Abernathy, 2010), “fishing tactics” (Pelletier and Ferraris, 2000; Maynou et al., 2011), “fishing modes” (Purcell et al., 2018), or “fishing styles” (Boonstra and Hentati-Sundberg, 2016) and reflect similarities at the fishing event (but also trip or vessel) level in inter alia, species targeted, type of gear utilized, as well as the location and time of fishing (Nielsen and Christensen, 2006; Ziegler, 2012). Hereafter, we use the term “métiers” to reflect these units of fishing practices, which have been defined by the European Commission (EC) Data Collection Framework as “a group of fishing operations targeting a similar (assemblage of) species, using similar gear, during the same period of the year and/or within the same areas and which are characterized by a similar exploitation pattern” (EU, 2016).
Multivariate cluster (métier) analysis is an exploratory analysis that identifies structures within the data to quantitatively categorize individual fishing events (or trips) to a métier, thereby allowing segregation of the data at a finer resolution (Pelletier and Ferraris, 2000; Holley and Marchal, 2004). Various methodologies have been employed through time to identify and define métiers within global fishing fleets (Deporte et al., 2012). The majority of these have been developed within the European Union (EU). This is because the European Common Fisheries Policy (CFP) has increasingly recognized the importance of fleet-based approaches to management, through accounting for heterogeneity in fishing practices. In the EU, métier analysis is viewed as an approach that can facilitate the formulation of integrated mixed-fisheries management plans (Deporte et al., 2012; Ulrich et al., 2012). Examples of the types of published métier analyses include variants of hierarchical clustering algorithms (HCA) such as hierarchical agglomerative clustering (HAC), which Lewy and Vinther (1994) used to classify métiers in Danish North Sea trawl fisheries and principal component analysis (PCA) combined with visual inspection, which Biseau and Gondeaux (1988) used to define métiers in a Celtic Sea fishery. Pelletier and Ferraris (2000) used HAC after running a PCA on the original data to identify métiers within an artisanal Senegalese fishery and Celtic Sea fishery, a methodology that has since proven popular among their contemporaries (Ulrich and Andersen, 2004; Tzanatos et al., 2006; Campos et al., 2007; Ziegler, 2012). Lastly, non-hierarchical clustering methods, including partitioning around medoids (PAM) (Kaufman and Rousseeuw, 1990), were used by Duarte et al. (2009) to define clusters of vessels in a Portuguese purse-seine fishery, while its variant, Clustering Large Applications (CLARA) (Kaufman and Rousseeuw, 1990), was used by Castro et al. (2010, 2011) to identify métiers in the Spanish bottom pair trawl and longline fleets, respectively. The main advantages of non-hierarchical clustering methods, such as PAM, over traditional approaches, such as HAC, are that they are less computationally expensive to run when using a large dataset and less sensitive to outliers (Reddy and Vinzamuri, 2014).
Most of the aforementioned métier analyses have either been undertaken using primarily catch composition data (see, e.g., Lewy and Vinther, 1994; He et al., 1997; Marchal, 2008) or both catch composition and fishing effort data with spatial and temporal references (see, e.g., Pelletier and Ferraris, 2000; Maynou et al., 2011; Ziegler, 2012). While métier analysis is often applied using solely quantitative catch composition and effort data from fishery logbooks (e.g., He et al., 1997; Marchal et al., 2006), some analyses have also incorporated qualitative information using direct interviews with fishers and questionnaires to develop a typology of individual fishing practices (e.g., Neis et al., 1999; Nielsen and Christensen, 2006; Boonstra and Hentati-Sundberg, 2016). While métier analysis is commonly used in mixed fisheries with multiple gear types, it is possible to be equally useful in single-gear type fisheries as inherent spatial heterogeneity and temporal variability in the marine environment promotes the diversification of fishing practices (Maynou et al., 2011; Zhou et al., 2019).
Following a comprehensive review of the classical clustering approaches for métier analysis, we developed a novel multivariate non-hierarchical clustering framework that improves upon these methodologies through the use of: (i) alternative methods for encoding and transforming fisheries data; (ii) variable (feature) selection methods; (iii) complementary metrics and methods for internal métier validation; and (iv) use of a network science method to model and analyze vessels’ fishing practices. To illustrate function and pertinence, we create a typology of fishing practices within the Eastern Tuna and Billfish Fishery (ETBF) between 2010 and 2017. The ETBF is a single-gear (pelagic longline) Australian Commonwealth fishery targeting multiple species, including yellowfin tuna (Thunnus albacares), bigeye tuna (Thunnus obesus), albacore tuna (Thunnus alalunga), broadbill swordfish (Xiphias gladius), and striped marlin (Tetrapturus audux) off Cape York, east and south to the Victorian—South Australian border, including waters around Tasmania and the high seas of the Pacific Ocean (Figure 1). Despite being a single-gear fishery, there is a diversity of fishing practices (Campbell et al., 2017). Differences pertain, in particular, to the structural composition of the fleet, geographic mobility, access to quota, targeting practices, and specific gear configurations (see Campbell et al., 2017 for more information). Despite these differences, management decision-making has often treated vessels in the ETBF as fixed elements, which ignores the inherent heterogeneity in the fishery and the likely different responses to regulations and policy. Consequently, we use a novel non-hierarchical clustering framework to describe the dynamics of fishing practices within the ETBF between 2010 and 2017 to facilitate the incorporation of fisher and fleet-wide behavioral information in management decision-making.
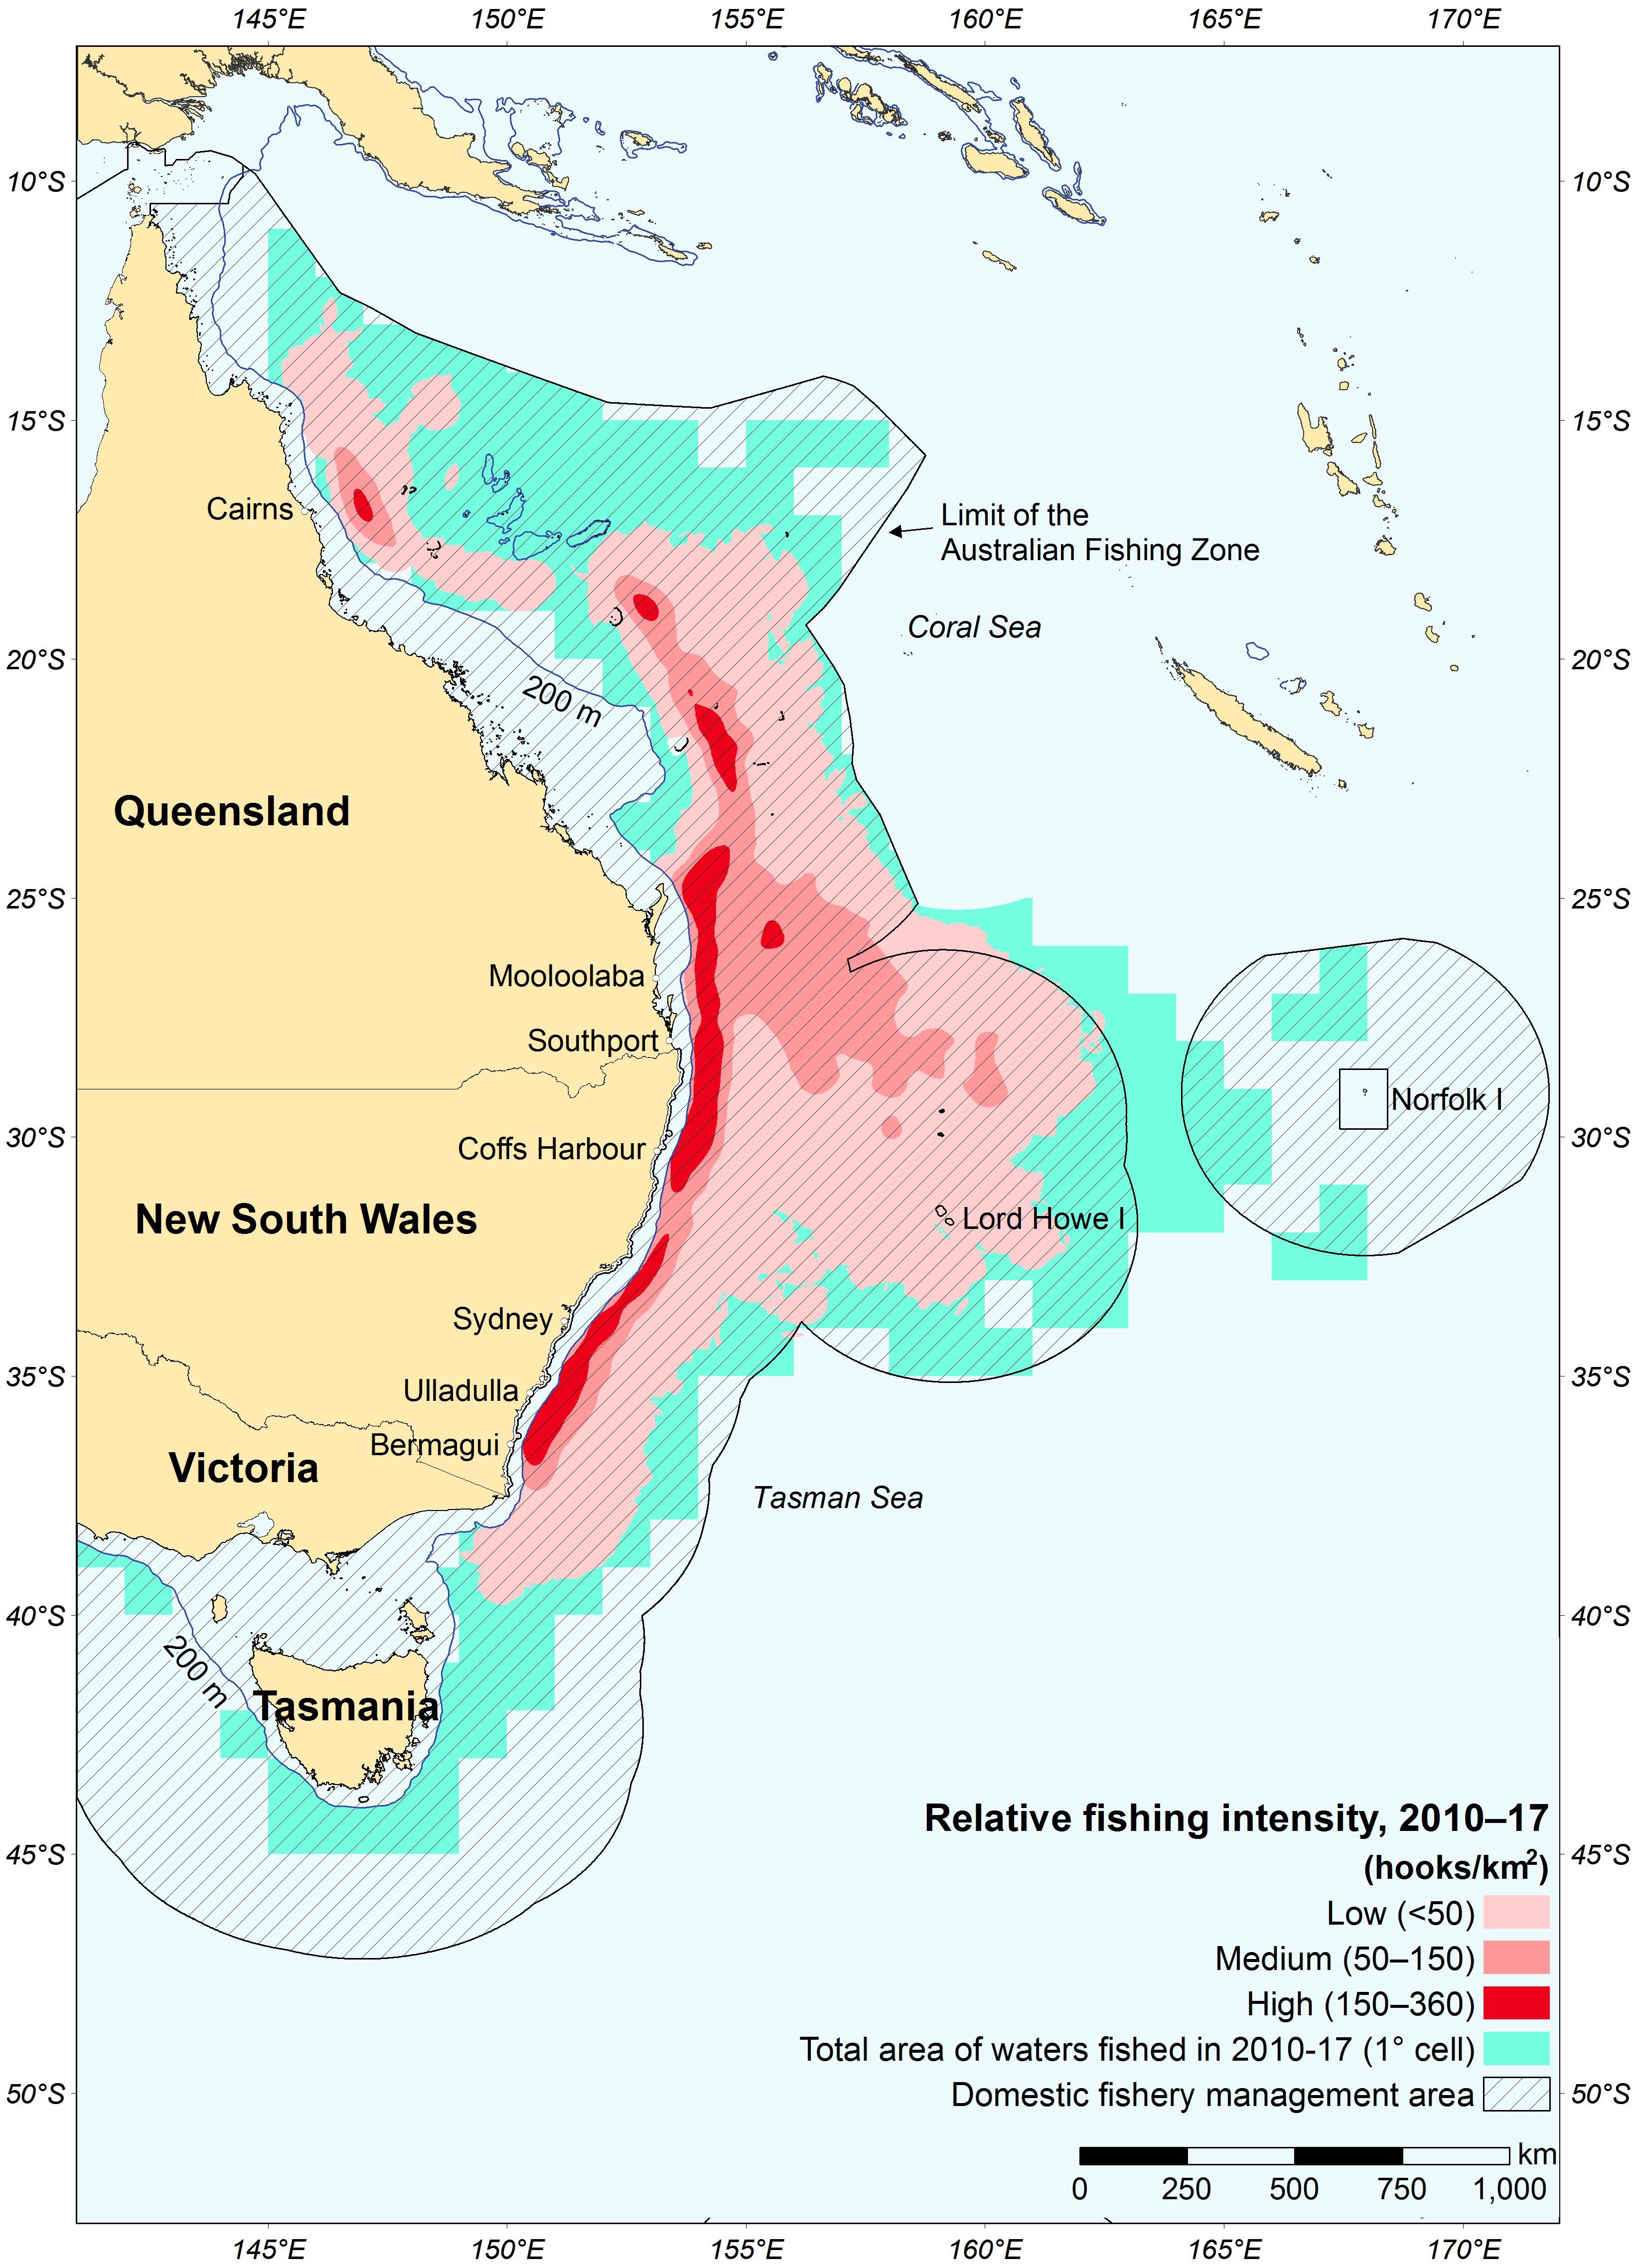
Figure 1. Area and relative fishing intensity in the Eastern Tuna and Billfish Fishery (ETBF) between 2010 and 2017 calendar years.
Materials and Methods
A Métier Analysis Applied to the Eastern Tuna and Billfish Fishery
A multivariate non-hierarchical clustering framework was applied to the ETBF logbook catch and effort data to identify métiers that describe fishing activity, behavior, and decision-making between 2010 and 2017 based on the proportions of species in retained catch (i.e., number of species) and fisher decision variables (e.g., hooks per basket, time of set). This was undertaken at the individual set level rather than trip level as previous research has shown that multiple targeting strategies can be utilized within individual trips (Campbell et al., 2017). The general sequence of analyses is presented in a flowchart (Figure 2), depicting our clustering framework, which was based upon best practices from the machine learning literature and those applied specifically to fisheries by Pelletier and Ferraris (2000); Duarte et al. (2009), and Campbell et al. (2017). All analyses were performed using the statistical computing program R (R Core Team, 2019) and WEKA (Hall et al., 2009). The list of relevant R packages is provided in the Supplementary Material (see Supplementary Table S1a). WEKA was only used for the implementation of feature selection methods (see Supplementary Table S1b for a description), which was not available in R.

Figure 2. Flowchart of our clustering framework illustrating the inputs/outputs, decisions, and processes undertaken. The light blue shading represents a step we consider novel in our clustering framework. Key: ellipse = start of process; parallelogram = input/output point; diamond = decision point; rectangle = process; oval = end of process.
Initial Variable Selection
First, catch profiles or target species were identified and defined based on the catch composition data. Second, fishing métiers were described based on the similarities between sets considering catch and fisher decision variables such as fishing location, set time, and month for each fishing set.
Out of the 28 species reported in the commercial logbooks, a total of nine were selected, where each one individually made up more than 1% of retained catch and collectively accounted for 97.5% of the total retained catch numbers (see Table 1 and Supplementary Figure S1). This included: yellowfin tuna, bigeye tuna, albacore tuna, broadbill swordfish, striped marlin, southern bluefin tuna (Thunnus maccoyii) mahi mahi (Coryphaena hippurus), Ray’s bream (Brama australis), and oilfish (Lepidocybium flavobrunneum). Ideally, métiers should reflect the fishing intention (e.g., species targeted) (Marchal, 2008) but in the ETBF, fishers often report more than one species as “targeted” in their logbook, with only 35% of all sets reporting a single targeted species. Nevertheless, when reporting a single target species, fishers were very effective at catching this species, particularly when targeting either broadbill swordfish or southern bluefin tuna (Supplementary Table S2).
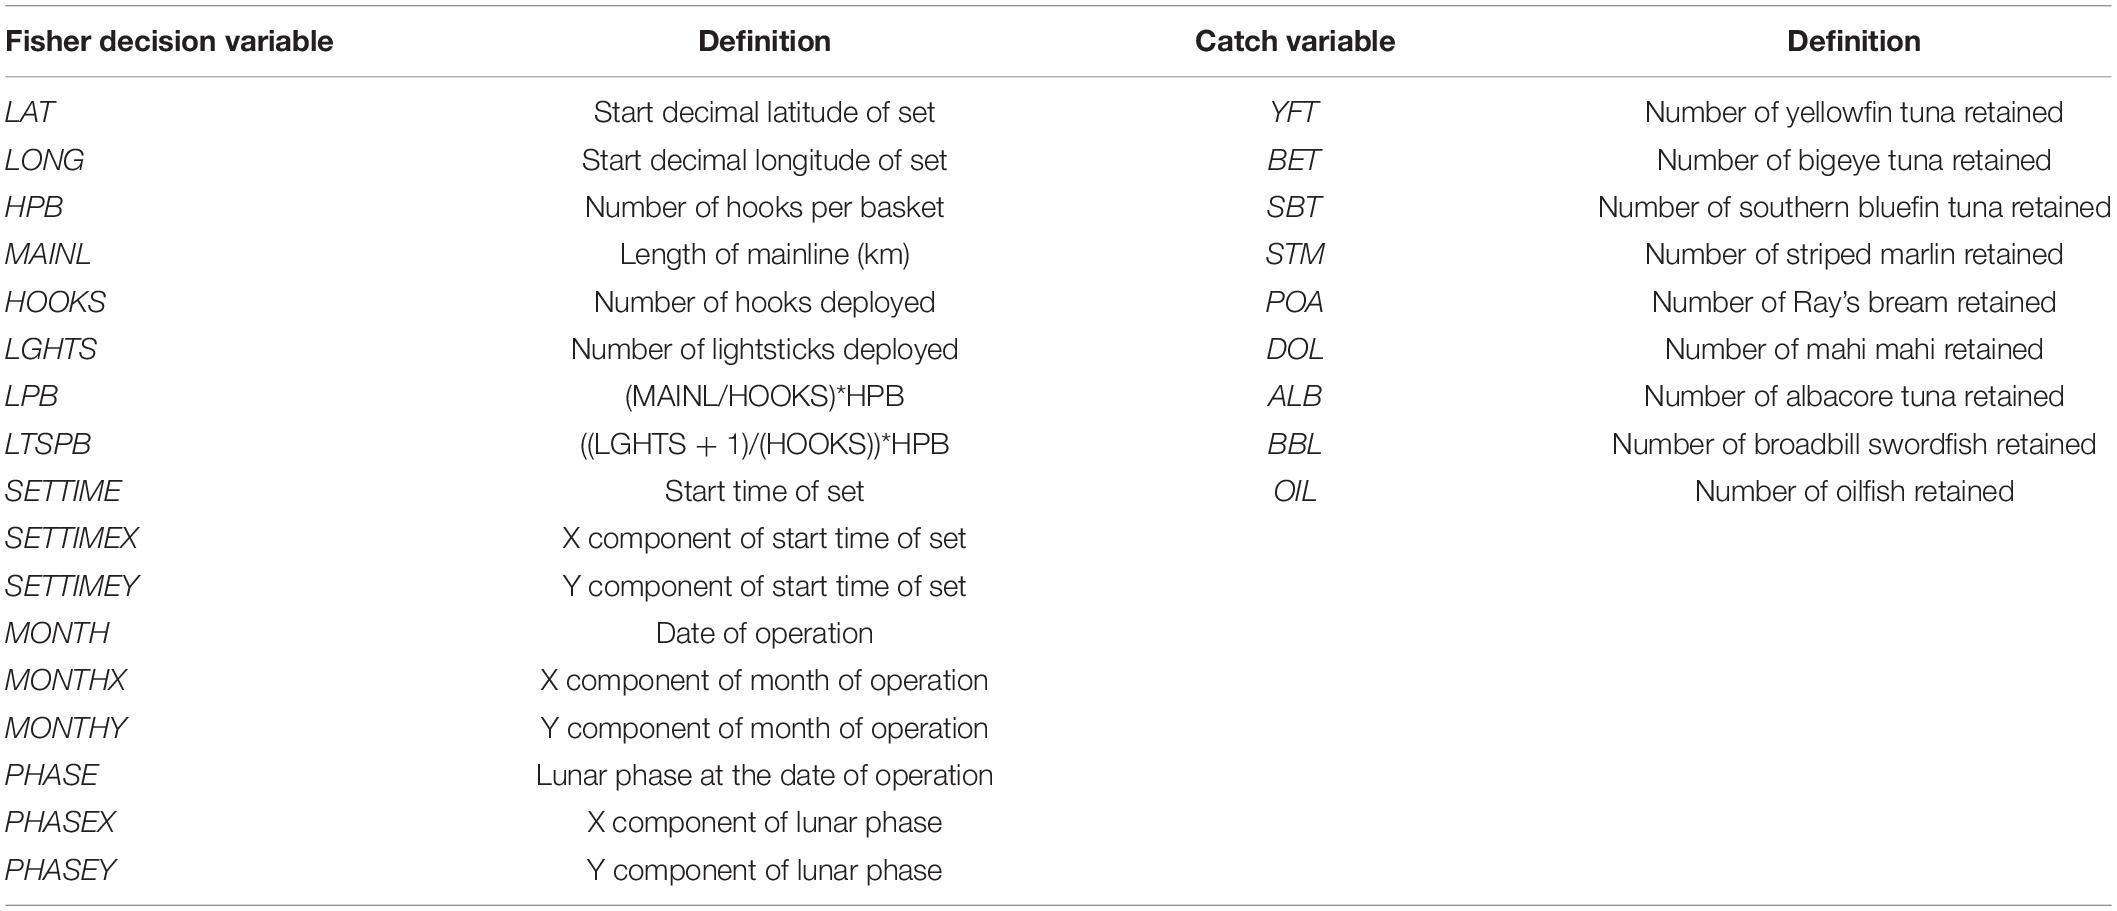
Table 1. The set of 26 fisher decision and catch variables that were derived from the ETBF logbook data for the métier analysis and their corresponding definition.
A total of 17 fisher decision variables were derived from the logbook data (Table 1). These included date and time of set, lunar phase, location, and gear configuration variables such as length of mainline, number of hooks set, number of hooks per basket, and number of light-sticks. Location variables included latitude and longitude of set. Time and date variables included set start time and date as well as month, while the lunar phase variables included the lunar phase at the time of set. We also included additional gear configuration variables that were proxies for light density and depth by combining and/or transforming existing variables to improve the analysis (see LPB and LTSPB in Table 1 for a description of acronyms). Lastly, bait was not included in the gear configuration variables because the majority of sets used mixed bait types and we were able to conduct subsequent internal métier validation analysis by excluding it (i.e., due to it being the only nominal variable).
Compositional Data
Catch compositional data that are converted into proportions are often used in métier analysis, with a common approach being to use either a logit transformation or an arcsine square-root transformation of the data to normalize the distributions, followed by a calculation of the Euclidean distance (He et al., 1997; Campbell et al., 2017). However, the logit transformation is not possible when there are too many zeros present in the dataset (as removing records with zero values leads to significant information loss). The arcsine square-root transformation can also be unsuitable, as it may not result in a normalized distribution (see Supplementary Figure S2 for example from ETBF data). Martín-Fernández et al. (1998) suggested that the best practice for compositional data analysis is to use a variant of a logarithmic transformation where the natural logarithm is applied to each component of a compositional vector scaled to its geometric mean. Since our compositional data at the set level contained many zeros, we needed to manage these zeros before conducting a variant of logarithmic transformation.
Replacing Zero Values in the Compositional Data
The common practice for the treatment of zeros is replacing them with a small positive value. This replacement can be implemented in various ways, including replacing the zeros by a constant or adding a constant to all values in the dataset. These ad hoc methods are not suitable for compositional data as it may distort the relationship between zero and non-zero observations (Pawlowsky-Glahn and Buccianti, 2011). In a fisheries context, these zeros are either true zeros (i.e., absence of species in the area fished or selective nature of the fishing gear) or false zeros (i.e., not recorded, misreported or underreported in logbook by the fisher). While different methods are available for replacing zeros in compositional data, our framework caters for zero observations through the use of a geometric Bayesian-multiplicative estimation method proposed by Martín-Fernández et al. (2014) to impute the probable value of these zeros. This method performs Bayesian estimation of the zero values, assuming a Dirichlet prior for the multinomial distribution. Then, a multiplicative modification of the non-zero values was applied, so that the ratios between parts and the total of the initial vector before the replacement were preserved. Theoretical and empirical studies show that the geometric Bayesian-multiplicative estimation using a Dirichlet prior outperforms other Bayesian multiplicative replacements when the hyper parameter of the prior is the geometric mean of the compositional vector (Martín-Fernández et al., 2014).
Cyclical Data Transformation
Cyclical data (e.g., month, set start time) are commonly encoded in métier analysis as either nominal or ordinal variables (see, e.g., Pelletier and Ferraris, 2000; Deporte et al., 2012) but this does not capture their similarities appropriately. For example, an encoding system that orders set start time from 1 to 24 incorrectly implies that 1:00 is furthest away from 24:00, when in reality (from the perspective of the fishing activity) they are very close. To represent these data more appropriately, set start time (and other cycling data such as month) were graphed onto a two-dimensional space and given x and y values so that they were modeled as a circle with 12 points.
Selecting Distance and Clustering Algorithm
Once the catch and gear composition as well as cyclical data were processed, we defined a distance measure between the data points in order to conduct the métier analysis. For data with a similar component type (e.g., discrete or continuous), a simple Euclidean distance metric would be sufficient for grouping and is often used (e.g., Holley and Marchal, 2004; Castro et al., 2011). However, our fisheries data were mixed with both discrete (time) and continuous (location) data at different scales. Therefore, we used Gower distance (Gower, 1971) to measure dissimilarities between data points for grouping as:
where wijk is the weight for variable k between observations i and j and dijk is the distance between i and j on variable k. Essentially, Gower distance is a weighted average of the distances on the different variables. The advantage of this distance metric is that in contrast to traditional distance metrics, dijk does not apply the same equation to all variables. For example, for discrete variables, an equal/not equal comparison is used, while for numeric variables, absolute difference was scaled to [0 −1] range that is the distance between k components of matrix x is equal to () where rk is the range across all observations in the k component (Gower, 1971).
We used non-HCA (i.e., PAM method) to conduct the métier analysis for the ETBF. Our decision was mainly informed by the computational efficiency of PAM and the fact that it is less sensitive to outliers compared to variants of HCA. The most computationally efficient HCA (bottom-up) requires O(n3) time (where n is the number of records). This algorithm groups the data using a sequence of nested partitions from singleton clusters to a cluster including all individual records. In contrast, our choice of algorithm only requires O(n2k2) time (where k is the number of clusters, ranging from five to 10 in our study). The k-means (MacQueen, 1967) and k-medoids algorithms (Kaufman and Rousseeuw, 1987) are well-known non-hierarchical algorithms for determining métiers that cluster the dataset of n objects into k clusters with k known a priori. k-means clustering finds the k centroids iteratively and assigns every point to the closest centroid, where the coordinate of each centroid is the mean of the coordinates of the points in the cluster. In contrast, k-medoids clustering relies on the most centrally located point in a cluster, making it preferable over k-means clustering because it is less sensitive to outliers.
Choosing k and Cluster Validation
The use of the k-medoids algorithm (i.e., PAM method) to conduct the métier analysis required k as an a priori specification of the number of métiers. Consequently, we used the silhouette concept (Rousseeuw, 1987) as a heuristic to guide our selection of the number of métiers. Silhouette width (a value ranging from −1 to +1) is a measure that aims to combine two metrics to take into account internal homogeneity within each métier and external separation between them. It facilitates a more objective selection of the most appropriate number of clusters compared to simple visual inspection (Rousseeuw, 1987). One popular technique for selecting the most appropriate number of métiers is to maximize the average silhouette width across all métiers (e.g., Castro et al., 2010, 2011; Cambiè et al., 2020). However, due to the high dimensionality and inherent disorder of our fisheries dataset and the fact that the optimal solution may still exhibit strong biases toward one or the other metrics, we were cautious to not solely select the k value that resulted in the maximum average silhouette width across all métiers. Instead, we examined a range of values close to the proposed k guided by the maximum average silhouette width to choose the final k and subset of variables that satisfy our internal cluster validation requirements.
In our iterative internal métier validation process, we used a bootstrapping method and the Jaccard coefficient concept (Jaccard, 1901), which measures the similarities between sets, as a measure of cluster stability. Given a candidate k-métier with a set of catch and fisher decision variables, we sampled the data 100 times from the underlying distribution of these variables with replacement, and then made a cluster-wise comparison. For each métier from the sampled data, we found the most similar métiers in our candidate clustering and if these two métiers matched less than 50% (Jaccard coefficient value < 0.5) of the time, we labeled the métier as “dissolved.” Hennig (2007) suggested that a valid stable cluster should yield a mean Jaccard similarity value of ≥0.75 and a highly stable métier should yield a mean Jaccard similarity value of ≥0.85.
Feature Selection
After each clustering attempt for a given k and nominated set of variables, we determined which subset of catch and fisher decision variables efficiently represented the input data to ensure only the highest stable clusters were selected. To do so, we used 11 different (feature) selection methods to rank the variables according to their contribution to the métiers after each clustering attempt (see Supplementary Table S1b). This approach is different from the commonly used approach in métier analysis (e.g., Pelletier and Ferraris, 2000) where data are mapped to lower dimension spaces by a linear or non-linear combination of the variables [e.g., principal components analysis (PCA)] which may result in information loss, weakly supported conclusions, and loss of readability and interpretability of the transformed variables. These selection methods can be categorized into three main feature selection methods: correlation-based, information gain-based, and learner-based (Hall, 2000; Karegowda et al., 2010; Chandrashekar and Sahin, 2014). Each selection method ranks the variables according to their contribution to the clusters. We then nominated the variables that appeared in the top 10 in each method and used the majority rule to find the subset of catch and fisher decision variables that ranked highest among all feature selection methods to inform our decision about what variables to retain and discard. The main advantage of our majority selection rule is that it reduces the biases of choosing variables using a particular selection method. Ultimately, a subset of 11 (out of 26) catch and fisher decision variables were retained including: YFT, BBL, and SBT from catch composition, location (LAT, LON), proxies for light stick densities (LTSPB), gear depth (HPB and LPB), and one axis of projected cyclical data (STIMEX, MONTHY, PHASEX) from the fisher decision variables (Table 2), which led to the selection of seven internally validated clusters.
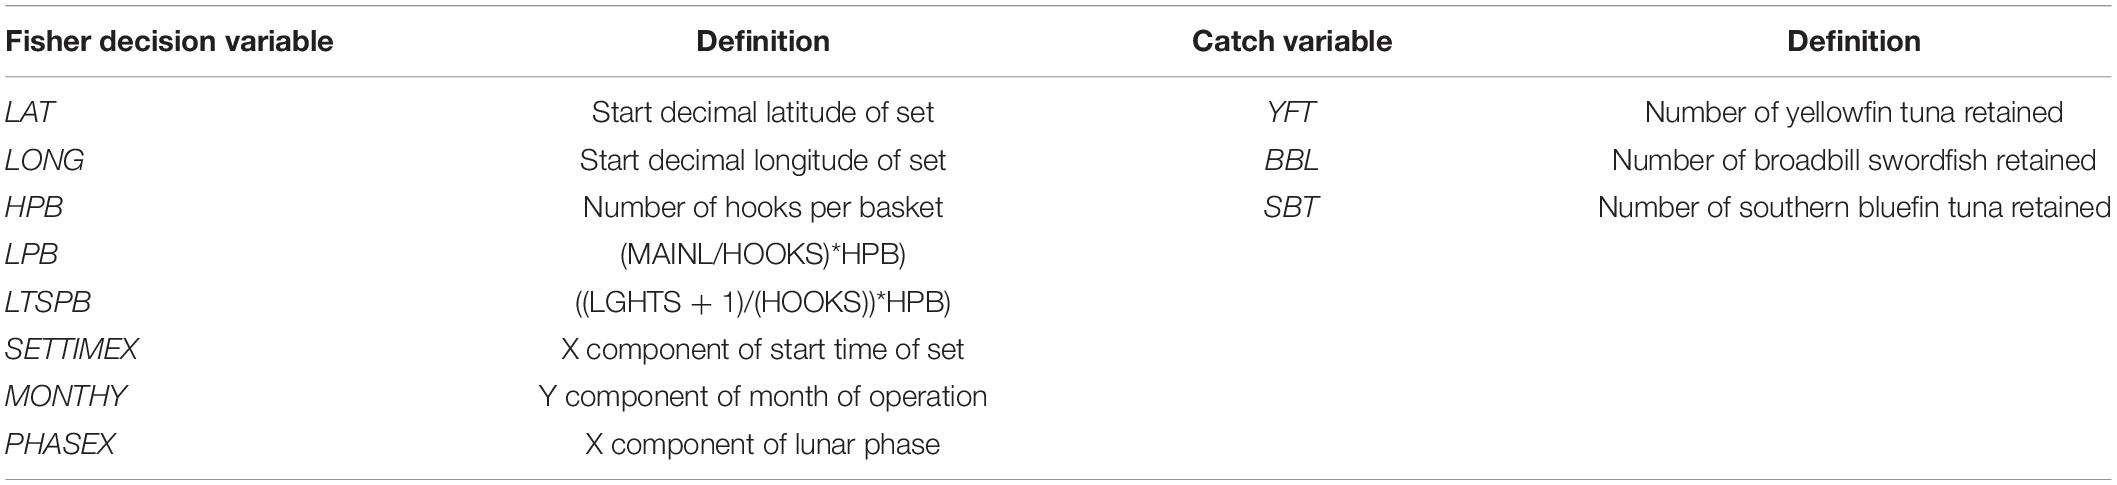
Table 2. The set of 11 fisher decision and catch variables that were retained following the analysis of their contribution to the métiers using feature selection methods.
Summarizing the Clustering Results
To provide a graphical summary of the final métier selection for the ETBF, we transformed all catch and fisher decision variables to a scale between zero and one and generated heat map dendograms using hierarchical clustering considering the Manhattan distance as the metric for grouping similar métiers. The color density in each cell represented the mean value of each variable included in the final métier selection with dark (light) shading representing a relatively higher (lower) value.
Lastly, we borrowed the concept of community structure from network science theory to construct a network of individual fishing practices in the ETBF between 2010 and 2017 before grouping the network into a smaller number of sub-groups (communities). The network contains vertices that represent both vessels that fished all years and the final métier selection for the ETBF. If a vessel was active in a métier, then we connect the vessel’s node to the corresponding métier. This defines the edges between vessels and corresponding métiers. We also define a second group of edges between métiers. For example, if there is a vessel that was active in two métiers, then we connect these two métier vertices with an edge. This represents a weighted network where the weight of each edge is the frequency of interrelation between the vertices. Several definitions and algorithms for detecting community structure have been reported in the literature (Clauset et al., 2004; Estivill-Castro and Parsa, 2016). For our purposes, we used the modularity maximization algorithm developed by Clauset et al. (2004) to find the community structure of ETBF vessels, which does not require, a priori, the number of clusters.
Results
General Summary of the Eastern Tuna and Billfish Fishery Data Used in the Métier Analysis
There were a total of 58.4 million hooks deployed by 63 individual vessels across 38,710 sets in the period of analysis from 2010 to 2017 in the ETBF (Table 3). There was minimal variation in the number of sets and fishing trips between years. In contrast, the number of active vessels declined from 52 in 2010 to 40 in 2013 before remaining relatively stable, while the number of hooks have gradually increased from 6.5 million in 2013 to 8.6 million in 2017.
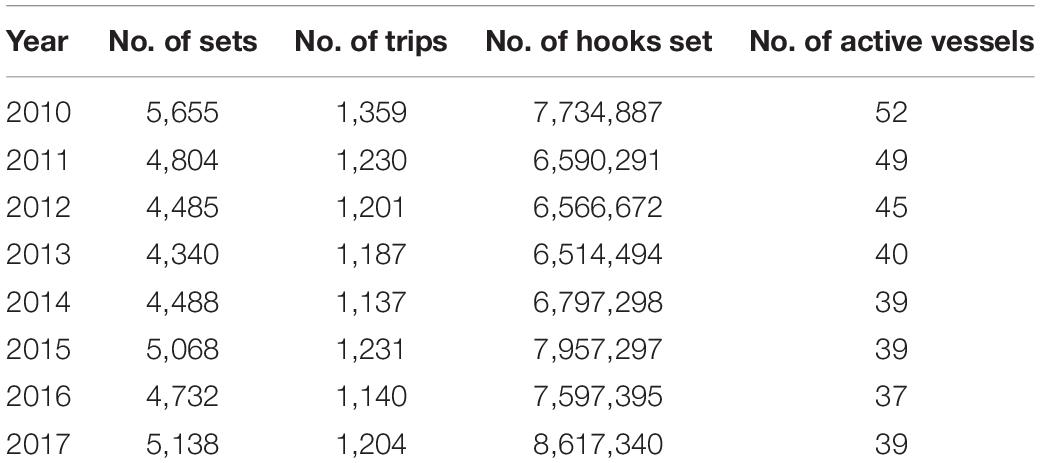
Table 3. Summary of Eastern Tuna and Billfish Fishery (ETBF) operational fishing data for period 2010–2017.
The ETBF was a year-round fishery from 2010 to 2017 (see Supplementary Figure S3) with sets generally distributed evenly across the year. In contrast to the relative stability in seasonal effort through time, the set starting time varied annually with a bimodal distribution from 2010 to 2015 where sets were conducted around 5–9 am or 1–5 pm but in 2016 and 2017 the majority of the sets started in the early afternoon between 1–3 pm (see Supplementary Figure S4). Overall, the majority of sets in the ETBF between 2010 and 2017 were deployed between 5 am and 7 pm and occurred between the second and third quarters of the lunar phase (moon position), or in other words pre and post full moon (see Supplementary Figure S5).
Catch data from logbooks indicated that albacore and yellowfin tuna were the species caught in greatest numbers between 2010 and 2017, with albacore tuna catch increasing through time and a variable yellowfin tuna catch (Supplementary Figure S6). Annual catches of broadbill swordfish, bigeye tuna, striped marlin and oilfish were relatively constant between 2010 and 2017, while catch of southern bluefin tuna has increased since 2012.
Results of the Eastern Tuna and Billfish Fishery Métier Analysis
A total of seven métiers were identified for the ETBF when considering the catch and fisher decision variables during the period 2010–2017. The size of the métiers was variable, with métier 4 having the greatest number of attributed sets and métier 1 the least (Figure 3). There were different temporal patterns among métiers, with the number of sets classified as métiers 1 and 4 increasing through time, métiers 2 and 6 decreasing through time and métiers 3 and 5 remaining relatively stable (Figure 4). Since 2012, the number of sets classified in métier 7 has been slowly increasing through time. The average Jaccard coefficient values for the seven métiers were 0.98, 0.92, 0.82, 0.86, 0.81, 0.92, and 0.98 respectively, indicating that all métiers are stable (i.e., >0.75).
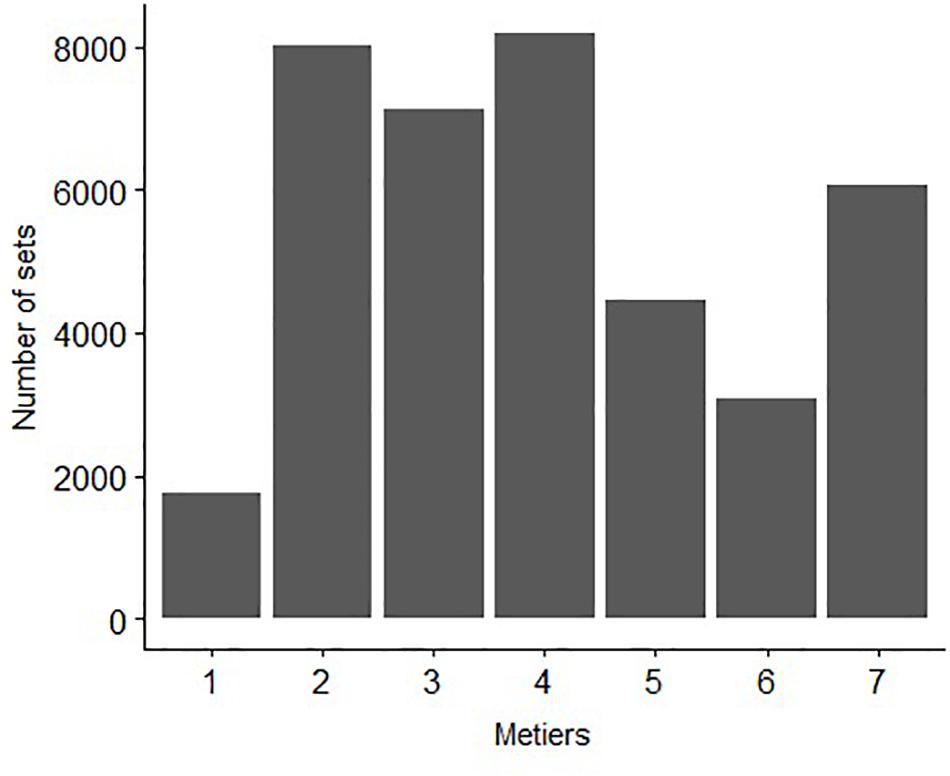
Figure 3. Number of sets attributed to each métier in the Eastern Tuna and Billfish Fishery (ETBF) for the period 2010–2017.
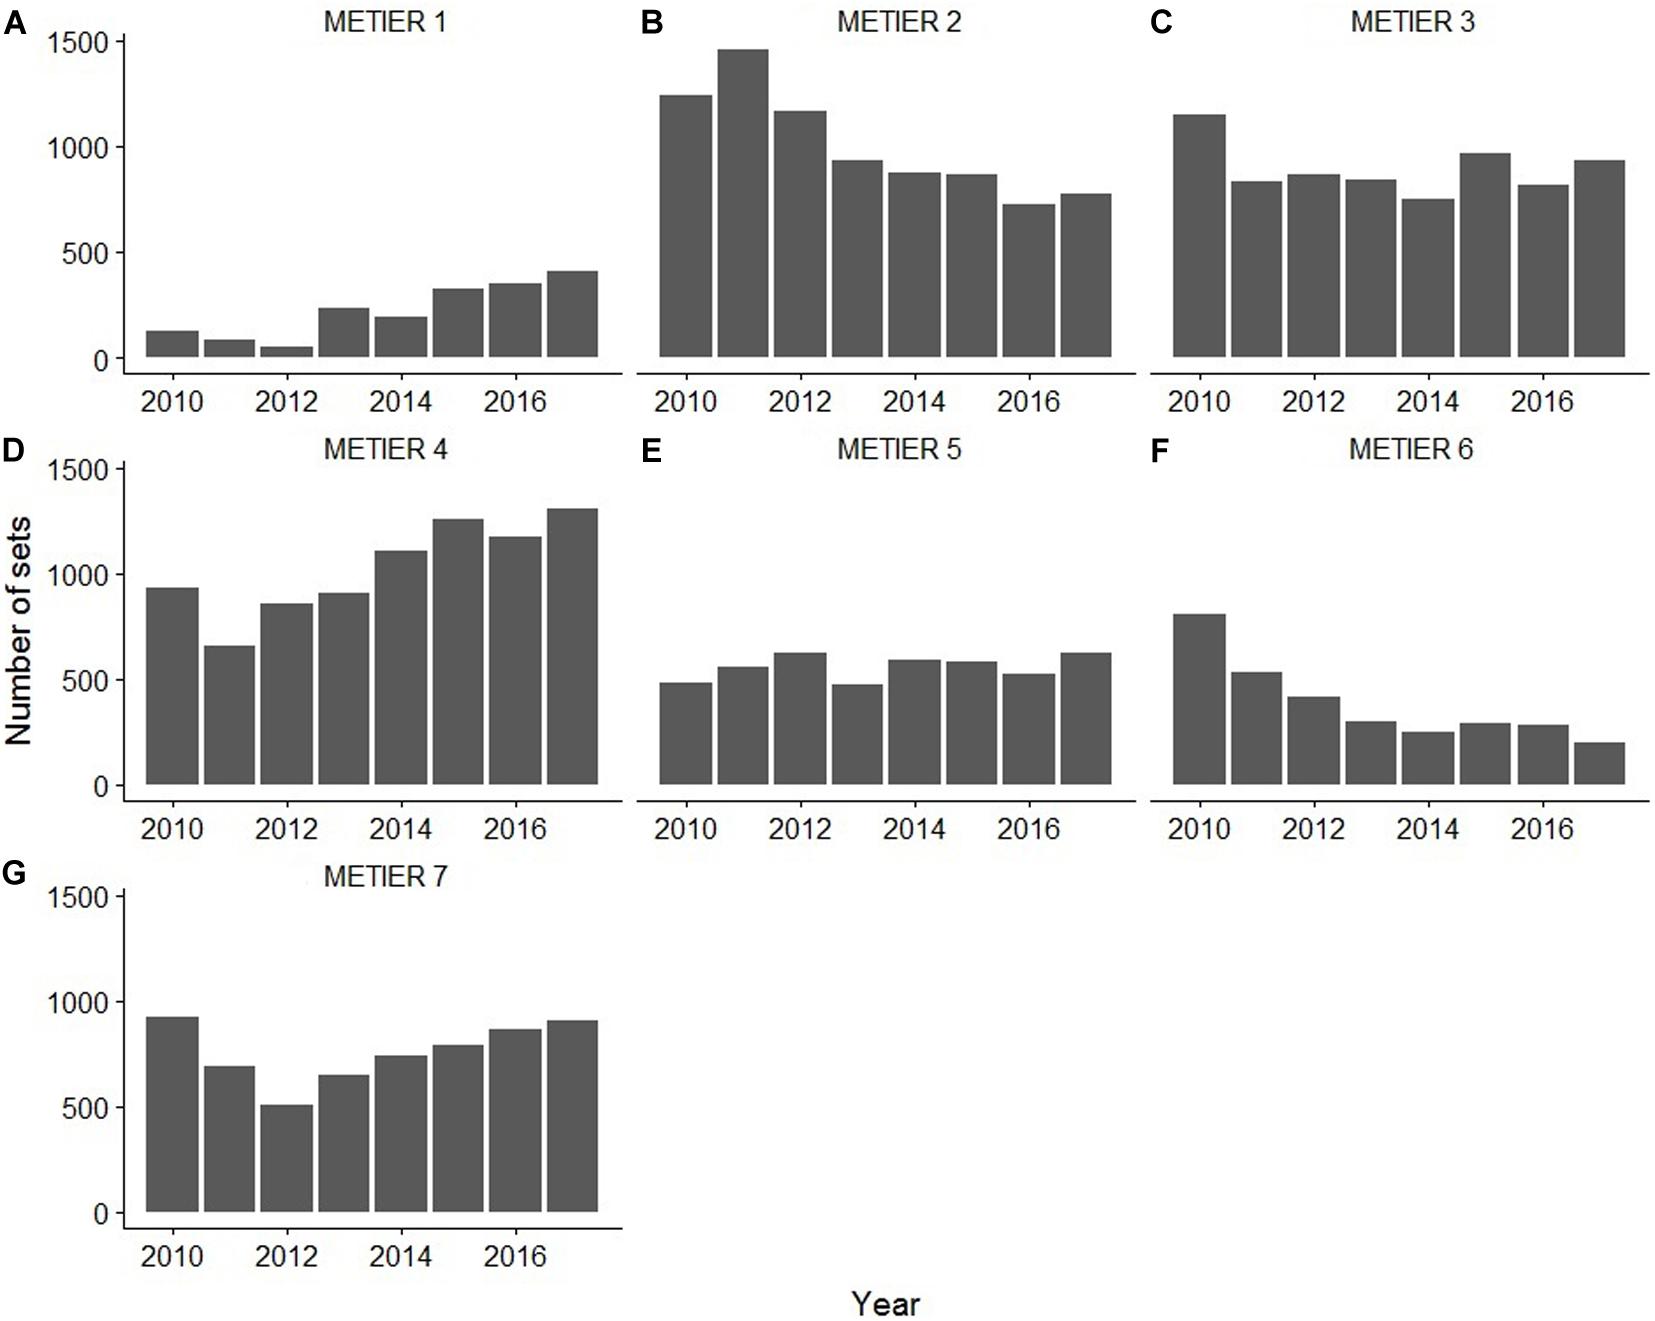
Figure 4. The distribution of sets attributed to each métier annually in the Eastern Tuna and Billfish Fishery (ETBF) between 2010 and 2017.
Métiers 3 and 5 were the most similar, according to the non-hierarchical clustering analysis using the Manhattan distance, while métier 1 was the most distinctive (Figure 5). A highly characteristic target or dominant species was identified for all métiers. Métiers 2 and 7 primarily target yellowfin tuna year-round (Figure 5) using comparable gear configurations but set their gear at different depths and latitudes. Métier 7 sets are further north, while métier 2 sets are further south off eastern Australia (Figure 6). Furthermore, sets in métier 2 occur frequently between 7 and 9 am, while those in métier 7 were bi-modal, occurring either late afternoon or early morning (Supplementary Figure S7). Métier 6 also targets yellowfin tuna (Figure 5) but at different set times (early morning 5–7 am) and with a greater number of hooks per basket than métiers 2 and 7 (Supplementary Figure S7). Métiers 3, 4, and 5 are also similar in that they primarily target broadbill swordfish (Figure 5) with variations in season and lunar phase (Supplementary Figures S8, S9). Métier 3 sets are primarily in autumn/winter before and on the full moon (Supplementary Figures S8, S9). In contrast, métier 5 sets are primarily in summer/spring before and on the full moon (Supplementary Figures S8, S9). Métier 4 sets occur year-round on and after the full moon (Supplementary Figures S8, S9). Métier 1 solely targets southern bluefin tuna (Figure 5) with a distinctive gear configuration during the winter months of the year (Supplementary Figure S8).
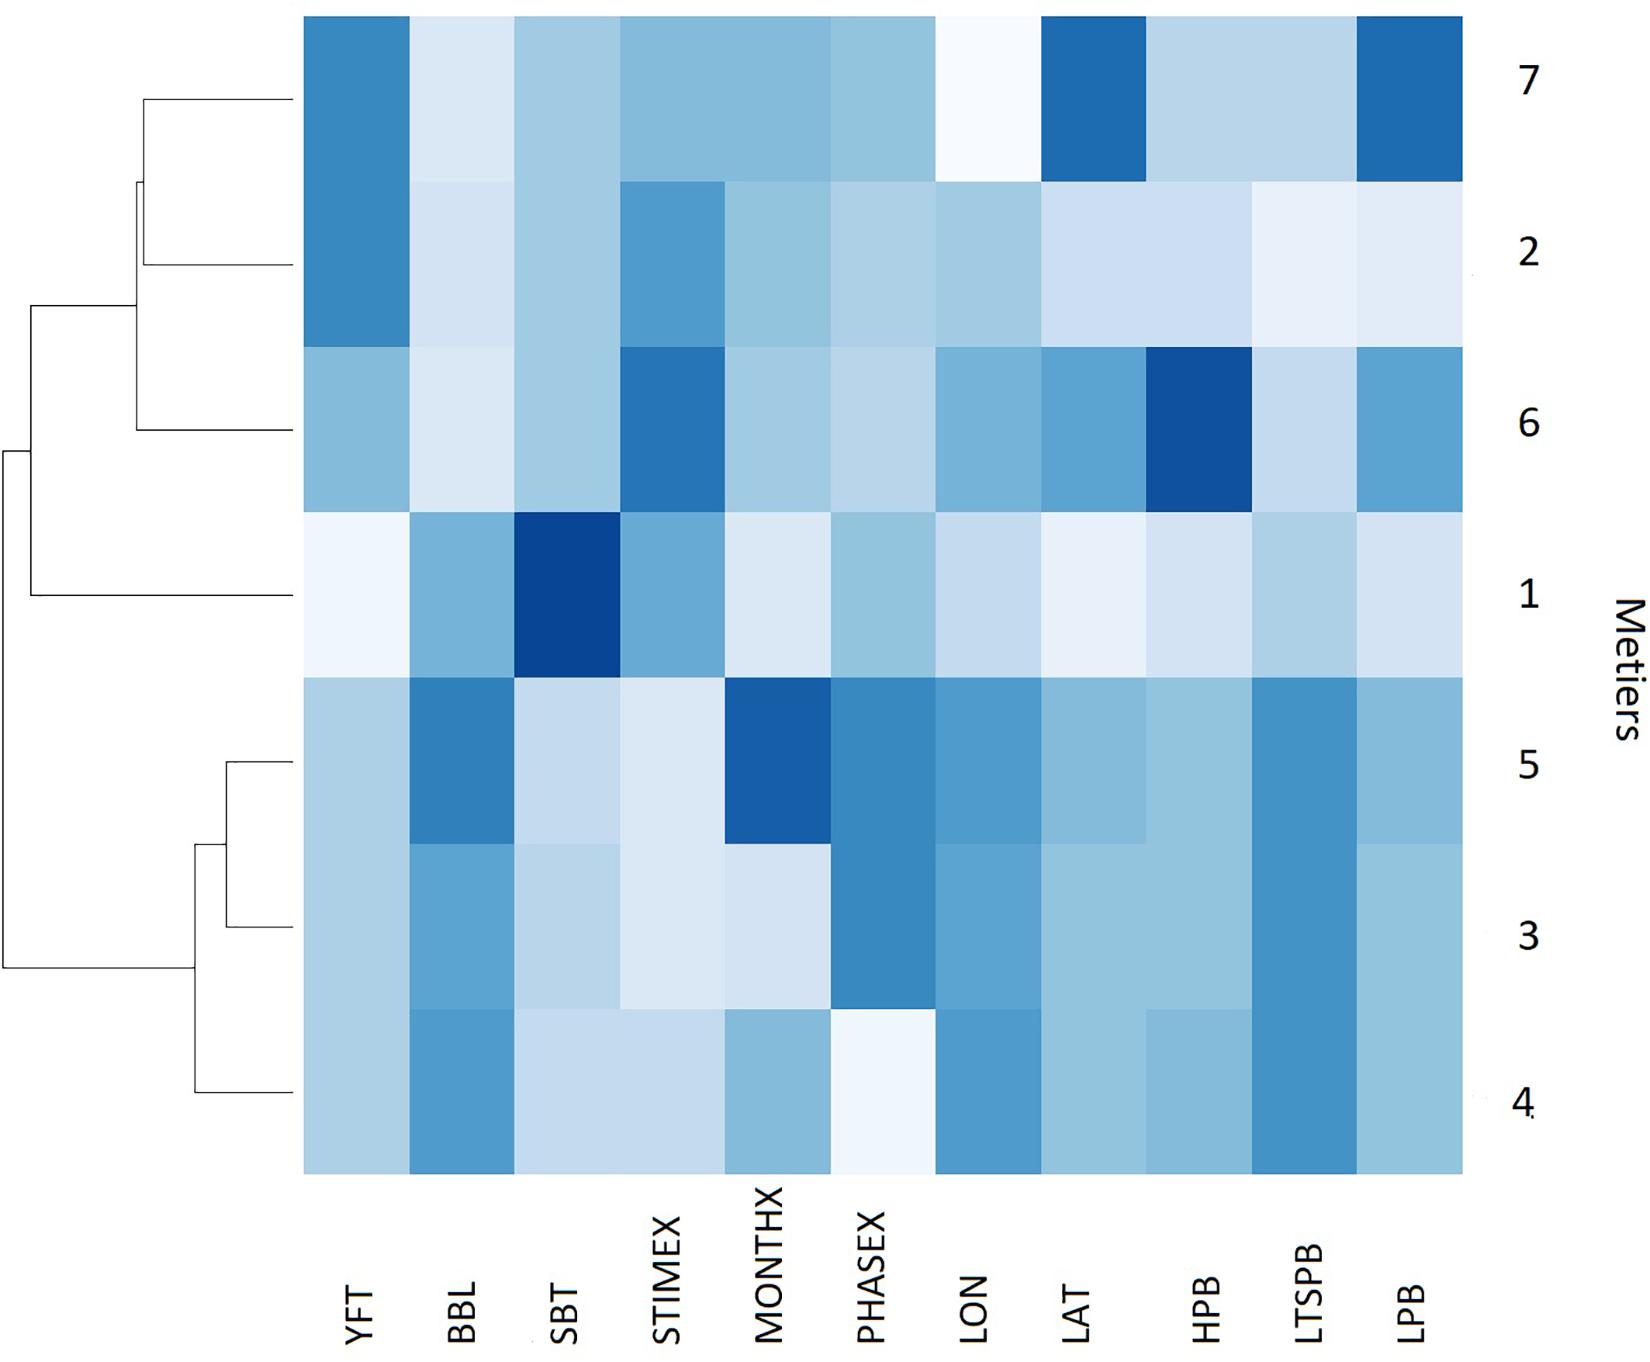
Figure 5. Heat map dendrogram of the similarity [based on color density with dark (light) shading meaning high (low) relative value] between the seven métiers in the Eastern Tuna and Billfish Fishery (ETBF) for the selected fisher decision and catch variables between 2010 and 2017. See Table 1 for description of acronyms.

Figure 6. Area and relative fishing intensity of the seven métiers identified in the Eastern Tuna and Billfish Fishery (ETBF) between 2010 and 2017 calendar years.
Five sub-fisheries were distinguished (Figure 5) based on their location (latitude and longitude variables, see Figure 6) and targeting practices (catch variables) including: (i) a northern yellowfin tuna sub-fishery (métier 7); (ii) a north-eastern swordfish sub-fishery (métiers 3, 4, and 5); (iii) albacore and yellowfin sub-fishery (métier 6); (iv) a south-eastern yellowfin tuna sub-fishery (métier 2); and (v) south-eastern southern bluefin tuna sub-fishery (métier 1) (see Figure 6 for spatial distribution of métiers).
The proportion of each targeted species within each métier, rescaled to a range between zero and one, is shown in Figure 7. Métier 1 has the highest proportion of southern bluefin tuna, while métiers 2, 6, and 7 have the highest proportion of yellowfin tuna and métiers 3, 4, and 5 have the highest proportion of broadbill swordfish. Métier 6 also has a high proportion of albacore tuna and métier 3 has a high proportion of bigeye tuna.
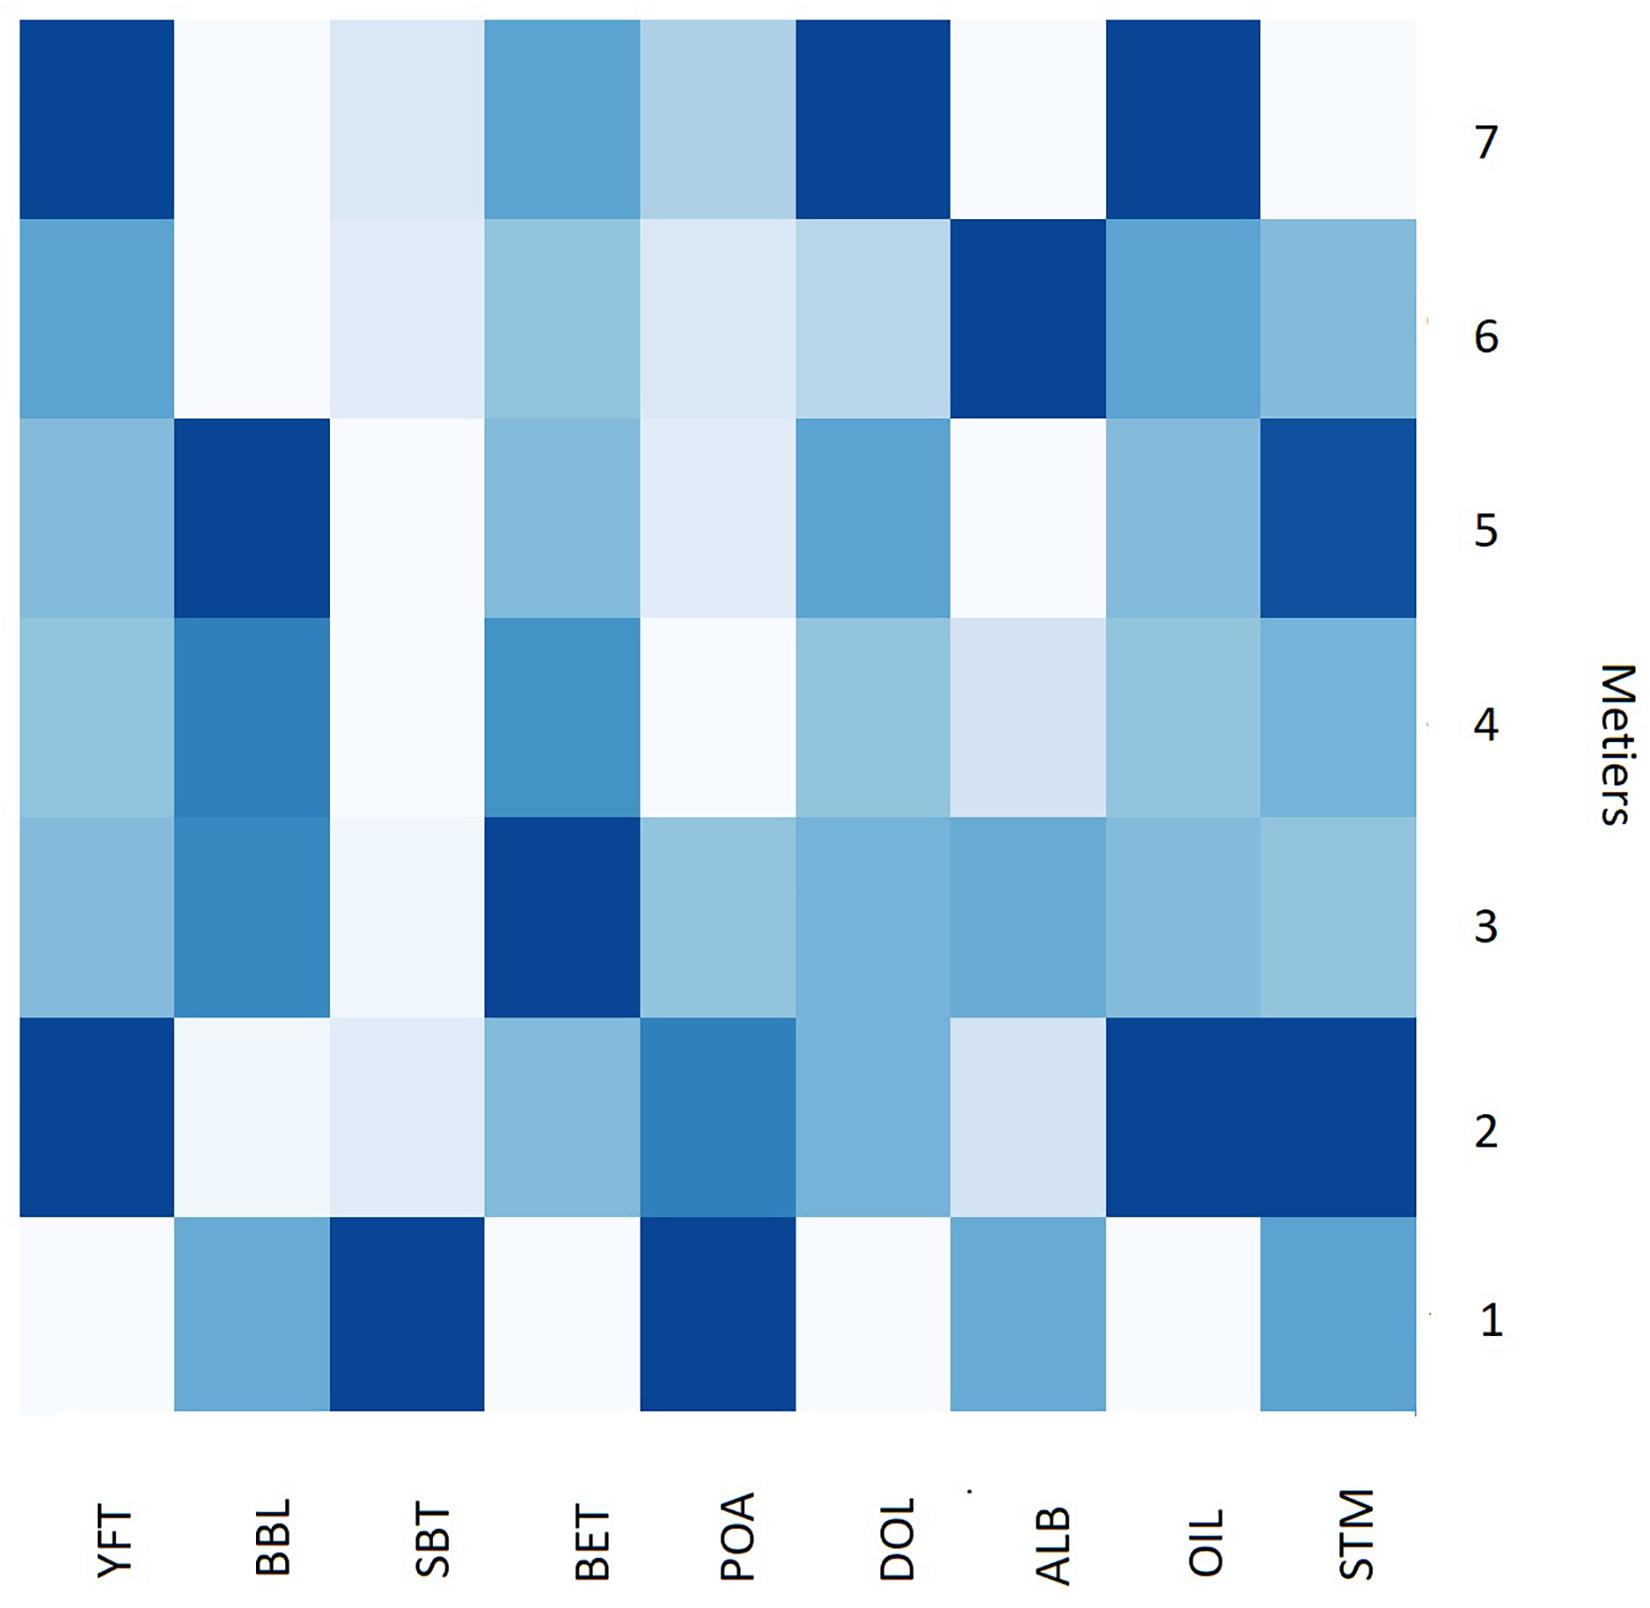
Figure 7. Heat map dendrogram of the proportion of each catch variable [based on color density with dark (light) shading meaning high (low) relative value] within the seven métiers in the Eastern Tuna and Billfish Fishery (ETBF). See Table 1 for description of acronyms.
The network of individual fishing practices in the ETBF defined three clear vessel groups (i.e., communities) within the data (Figure 8). The results suggest there is a clear exchange between ETBF vessels fishing in métiers 1 (targeting southern bluefin tuna) and 2 (targeting yellowfin tuna) along the south-east and east coast and similarly for those vessels fishing in métiers 3, 4, and 5 (targeting swordfish) off the north-east coast and six (targeting albacore) off the north-east coast (Figure 8). In contrast, there were two vessels that fished exclusively in métier 7 (targeting yellowfin tuna) in the north and one vessel in this sub-group that also fished in métiers 5 and 6 (Figure 8).
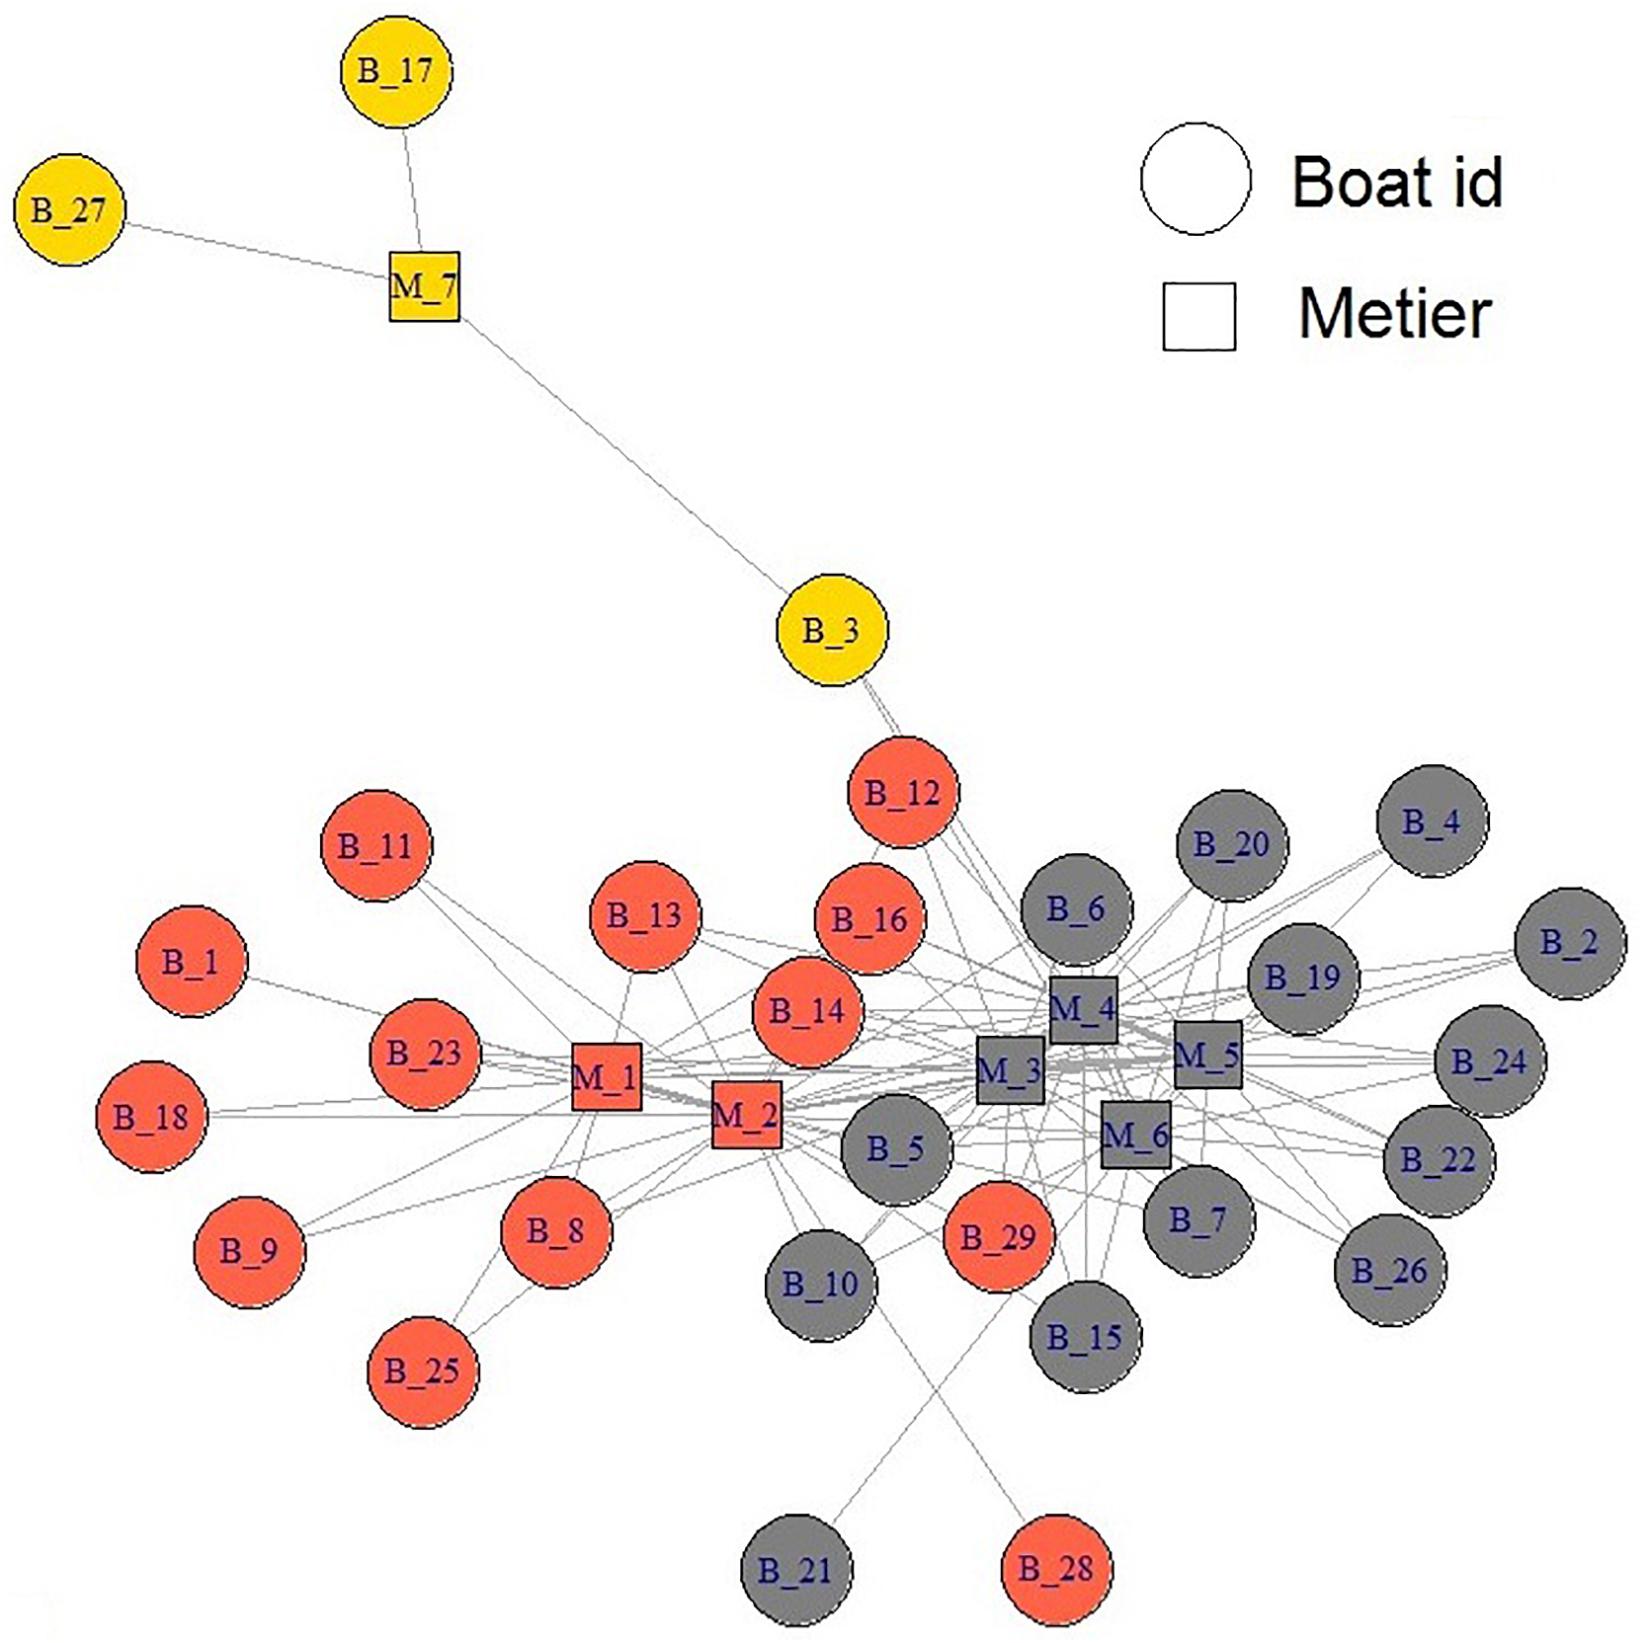
Figure 8. Network of vessels and métier interaction in the Eastern Tuna and Billfish Fishery (ETBF). Circles represent individual vessels and the squares represent individual métiers. The color scheme represents a community of vessels (groups).
Discussion
A Robust Framework for Clustering Commercial Fisheries Data
Our framework of encoding and transforming fisheries data involved: (i) application of a Bayesian-multiplicative method to impute zero values and (ii) mapping cyclical data into a two-dimensional Euclidean space to represent closeness. While conventional methods for transforming fisheries catch data in métier analyses involve either log (when zero values are absent) or arcsine square-root transformation (when zero values are present), our analysis suggests that the arcsine square-root transformation does not necessarily ensure the data are normalized and the replacement of zeros with some small constant value to perform a log transformation can distort the relation between zero and non-zero values. The mixed Bayesian-multiplicative estimation method applied in this study minimizes the possibility of distortion. Moreover, we encourage the use of a simple method of mapping cyclical data (e.g., time of set) into a two-dimensional Euclidean space to overcome the closeness of such data, which is not often captured in other métier analyses that treat the data as either ordinal or categorical variables (see, e.g., Pelletier and Ferraris, 2000; Deporte et al., 2012).
Our use of 11 different (feature) selection methods, to rank the fisher decision and catch variables according to their contribution to the métiers after each clustering attempt, reduces the biases of choosing variables using a selection method. The variable selection in métier analysis is usually undertaken by mapping the dataset to a new space with lower dimensions using a linear or non-linear transformation, such as PCA and extracting a subset of the principal components that explain most of variability in the data (e.g., Pelletier and Ferraris, 2000). A limitation of this approach is this new space cannot be linked to the variables in the original space. Therefore, any further analysis of the new space becomes problematic, as there is no interpretable meaning for the transformed variables obtained from these methods. Our feature selection method, however, retains readability and interpretability as it preserves the original variable values in a reduced space.
As noted by Jain and Dubes (1988), “validation of clustering structures is the most difficult and frustrating part of cluster analysis,” but is necessary for ensuring the clusters accurately reflect the “real-world” data (O’Farrell et al., 2019). We note that suitable computational internal validation methods are available in the machine learning literature but have been given only a fraction of attention in métier analysis. In our internal validation method, we iteratively resample the dataset at random, re-clustering them and verifying that the same clusters are found for different subsets. In contrast, most studies that use non-hierarchical clustering frameworks (Duarte et al., 2009; Castro et al., 2010, 2011; Winker et al., 2013) determine the final number of valid métiers based on the maximum average silhouette width across clusters. While this facilitates a more objective selection of the most appropriate number of clusters compared to simple visual inspection (Rousseeuw, 1987), we examined a range of values close to the proposed k guided by the maximum average silhouette width through the use of an internal validation method taken from the machine learning literature (Hennig, 2007). This provides additional robustness for validating the results because it does not consider the sensitivity to the algorithm of choice (e.g., PAM, HAC) but relies solely on the structure in the data, which can reduce associated bias. Furthermore, to externally validate our métier selection, we provided initial results of the métier analysis to the applicable management authority—the Australian Fisheries Management Authority (AFMA), who confirmed that they were credible and reflective of the fishing operations in the ETBF across that study period (Bromhead, D., pers. comm., 2018).
Finally, we introduced the concept of community structure from network science to construct an undirected network to graphically represent vessel-métier interrelations and detect the community structures within the networks. Through this process, we were able to quantitatively determine which métiers a vessel was highly associated with, rather than make a subjective decision based on the number of sets associated with a particular métier. Membership to a particular vessel group meant that these vessels had a high probability of targeting the same group of species and employed similar fishing tactics. The advantage of this type of analysis is that it can provide a basis for investigating whether the disclosed vessel groups are reflective of social (e.g., market demand, cultural issues) and ecological (e.g., fish abundance and behavior) components of the fishery.
Fishing Practices in the Eastern Tuna and Billfish Fishery
For a single-gear, mixed species fishery, the ETBF has a diversity of fishing practices, with our study identifying a total of seven métiers, five sub-fisheries, and three clear vessel groups in the period 2010–2017. Each métier was defined by a characteristic target species as was found in métier analyses by both Ziegler (2012) for the Tasmanian Scalefish fishery and Maynou et al. (2011) for the Mediterranean small-scale coastal fishery. Similar to Pelletier and Ferraris (2000), fishing location appeared to be central in defining both the number of métiers and subsequent sub-fisheries in the ETBF, comprising of a northern yellowfin tuna sub-fishery (one métier), a north-eastern swordfish sub-fishery (three métiers) and albacore sub-fishery (one métier), a south-eastern yellowfin tuna sub-fishery (one métier), and south-eastern southern bluefin tuna sub-fishery (one métier).
Within the north-eastern broadbill swordfish sub-fishery (métiers 3, 4, and 5), gear configuration and set start times were similar. Set start times were mainly in the afternoon and early evening, for soak times stretching across the night, with 12–13 hooks deployed per basket and the use of lightsticks. According to Campbell and Young (2012), the number of hooks per basket is a proxy for fishing depth, with less than 15 hooks per basket reflective of fishing at shallow depths. These fishing practices were not too dissimilar to the Hawaiian-based U.S. longline fishery targeting broadbill swordfish (He et al., 1997). This is because they reflect the daily availability of swordfish (and striped marlin), which is typically high during the night at depths less than 100 m (peaking around 50 m) and low during the day for all depths (Sepulveda et al., 2010; Dewar et al., 2011; Campbell et al., 2017). Importantly, it seems that seasonal availability of target species is central in defining the selection of métiers in the north-eastern broadbill swordfish sub-fishery. Campbell et al. (2017) had previously identified that availability of the key target species in the ETBF may change on a seasonal basis and for the north-eastern broadbill swordfish sub-fishery it seems there is an autumn-winter métier (métier 3), which is juxtaposed with a spring-summer métier (métier 5) with the former targeting bigeye tuna and the latter striped marlin before and after the full moon with similar gear configuration and fishing depths. There is also a year-round métier (métier 4) which also targets bigeye tuna after the full moon with similar gear configuration and fishing depth. The variances in métiers 3 and 5, however, are driven by availability of target species, with Campbell et al. (2017) highlighting that nominal CPUE for bigeye tuna is higher in the autumn and winter months but lower over summer, while striped marlin is higher over the spring and summer months.
The northern-eastern broadbill swordfish sub-fishery also has linkages with the north-eastern albacore sub-fishery, with the same vessels fishing in both sub-fisheries throughout the period 2010–2017. There are clear differences, however, in gear configuration between these sub-fisheries, with fishing in métier 6 characterized by a greater number of hooks and hooks per basket (26) as well as set start times mainly in the early morning with fewer lightsticks. According to Campbell and Young (2012), deploying more than 15 hooks per basket is reflective of fishing at deeper depths, consistent with albacore targeting. This gear configuration also reflects the daily availability of albacore, which is relatively low at shallow depths during the day and highest at greater depths between 150 and 200 m, while availability at night is considerably lower for all depths (Campbell and Young, 2012). Seasonal and lunar phase availability of the target species is also reflected in the results for métier 6. Nominal CPUE for albacore tuna is higher in the autumn and winter months but lower over summer (Campbell et al., 2017), while CPUE is higher in the week preceding and following the new moon (Campbell, unpublished).
Many vessels fished in the south-east yellowfin tuna sub-fishery (métier 2) during the period 2010–2017, with clear linkages to the south-east southern bluefin tuna sub-fishery (métier 1). For example, there were clear similarities in gear configuration (hooks per basket, depth fished, use of lightsticks), which is probably a reflection of vessels switching from targeting yellowfin tuna to southern bluefin tuna during the winter months. However, the fishing practices in relation to set start times, lunar phase, and seasonality were divergent. Métier 1 had no obvious patterns in relation to set start time or lunar phase, with the majority of sets occurring in winter. While in contrast, métier 2 was characterized by early morning set start times, around the new moon occurring in all seasons. These fishing practices were similar to the Hawaiian-based U.S. longline fishery targeting yellowfin tuna (He et al., 1997) and are again a reflection of the daily availability of yellowfin tuna, which is highest in depths less than 50 m during the day and lowest at night (Campbell and Young, 2012). Although métier 2 was fished all year round in our dataset, the nominal CPUE for yellowfin tuna is highest in the late autumn to early spring and higher in the week preceding and following the new moon (Campbell, unpublished), which may explain the majority of sets being deployed in the autumn months around the new moon during the period 2010–2017. Similarly, southern bluefin tuna CPUE (and hence availability) is highest in the winter months when they make annual winter migrations to the Tasman Sea, off south-eastern Australia and interact with the fishery (Hobday and Hartmann, 2006).
In contrast to the south-east yellowfin tuna sub-fishery (métier 2), the northern yellowfin tuna sub-fishery (métier 7) was fished by fewer vessels during the period 2010–2017 and used a unique gear configuration. Fishing in métier 7 was characterized by sets using a lower number of total hooks with no clear trends in set time. This was the only métier in the ETBF where a dissimilar number of total hooks were used (∼500 compared to average 1000–1200). Nevertheless, there were some similarities in seasonal availability between métiers 7 and 2, with the majority of fishing sets deployed in autumn, when nominal CPUE is highest (Campbell et al., 2017), as well as number of hooks per basket.
The overarching results of our métier analysis align with those of Campbell et al. (2017) and highlight that spatial and temporal references (e.g., fishing location, season, lunar phase) influenced métier delineation more than gear configuration in the ETBF. This is due to changes in the spatial and temporal availability of species, which is closely linked to the movement of fish (Campbell et al., 2017). Consequently, oceanographic conditions (e.g., chlorophyll, sea surface temperature) could be included as variables in any future ETBF métier analysis as they may influence species availability and subsequent fishing practices. As the identified métiers are based on a time period (2010–2017) when landing profiles and fishing practices were influenced by species availability, the next logical step is to use this baseline to develop dynamic models that may allow predictions about the likely future behavior of fishers and métiers when species availability, management arrangements or socio-economic factors (e.g., market demands) change (Holland and Sutinen, 1999; Wilen et al., 2002; Ziegler, 2012). Lastly, periodic review of our métier analysis using the same framework as outlined would be appropriate, with a review period of 5–10 years considered suitable by Davie and Lordan (2011) in the absence of significant socio-economic or environmental changes, which would require a shorter review period.
Conclusion
While we consider the application of our multivariate non-hierarchical clustering framework to the ETBF provides an improved framework for understanding the structure and complexity of fishing practices, it is important to remain cognizant of the fact that there remains no unified, agreed method for conducting a métier analysis and defining the optimal number of units within a fleet (Holley and Marchal, 2004). The subjective element of métier identification has led some authors to contend that métiers are an analytical, human-made concept that may not reflect the true dynamics of fishing practices and targeting intentions of the fisher (Wilson and Jacobsen, 2009; Ulrich et al., 2012; Boonstra and Hentati-Sundberg, 2016). This is particularly the case in the absence of discards in many métier analyses (including ours), due to a lack of in situ reporting in logbooks, which may create a source of bias (Marchal, 2008; Ulrich et al., 2012). Nevertheless, we contend that our clustering framework offers several advantages, but particularly regarding data validation. In the absence of objective benchmarks for métier analysis (Holley and Marchal, 2004) and subsequent extensive involvement of stakeholders to determine true fishing intentions on a set basis (Boonstra and Hentati-Sundberg, 2016), we advocate for the use of internal validation methods (e.g., Hennig, 2007). By iteratively resampling the dataset at random, re-clustering and verifying that the same clusters are found for the different subsets, the level of subjectivity in métier selection often associated with visual exploration is reduced and is more robust than the standard non-hierarchical clustering approach of using simply the maximum average silhouette width (O’Farrell et al., 2019).
By separating many heterogeneous fishing sets into homogenous métiers, whose definitions persist throughout the period 2010–2017, our analysis has succeeded in creating a typology of fishing practices for the ETBF. The results of this study can be used as a baseline to monitor and assess how the identified seven métiers respond to future changes in regulations, policies, or other changes, while also facilitating a more accurate estimation of relative stock size, the impact of fishing mortality on the stock, and the consequences of management measures on stock dynamics through stock assessment and modeling (Pelletier and Ferraris, 2000). By identifying differences in fishing tactics when targeting different species in the ETBF, the results of our métier analysis can identify the “effective effort” directed at any single species and improve overall CPUE standardization (Zhou et al., 2019). Furthermore, the development of a typology of fishing practices provides decision-makers with additional insights into which métiers are the most important to consider when addressing a management issue (e.g., seabird bycatch, see Parsa et al., 2020), while also avoiding over-stratification and improving the design of fishery sampling programs (e.g., at-sea observer, discard, or catch) (Davie and Lordan, 2011; Moore et al., 2019).
Data Availability Statement
The datasets presented in this article are not readily available because they are not publicly available due to being commercial in-confidence. Requests to access the datasets should be directed to MP, mahdi.parsa@awe.gov.au.
Author Contributions
MP, AW, and SN conceived the idea for the research and manuscript. MP undertook all the data analysis. TE and MP wrote sections of the manuscript. All authors contributed to manuscript revision, read, and approved the submitted version.
Funding
This work was primarily funded by the Australian Government Department of Agriculture, Water and the Environment.
Conflict of Interest
The authors declare that the research was conducted in the absence of any commercial or financial relationships that could be construed as a potential conflict of interest.
Acknowledgments
We would like to acknowledge the Australian Fisheries Management Authority (AFMA) for providing the commercial catch and effort data for the Eastern Tuna and Billfish Fishery (ETBF). We would also like to thank Don Bromhead (AFMA) and James Larcombe (ABARES) for fruitful discussions on the analysis and manuscript. We appreciate the scoping work for this study undertaken by Macgregor Todd (CSIRO) during his summer internship at ABARES. Lastly, we thank Rupert Summerson (ABARES) for producing the map of the fishery, Patricia Hobsbawn (ABARES) for data curation, and John Sims (ABARES) for facilitating the computational resources for this study.
Supplementary Material
The Supplementary Material for this article can be found online at: https://www.frontiersin.org/articles/10.3389/fmars.2020.552391/full#supplementary-material
References
Abernathy, K. E. (2010). Fishing for What? Understanding Fisher Decision-Making in Southwest England, Doctoral thesis, University of East Anglia, Norwich.
Biseau, A., and Gondeaux, E. (1988). Apport des méthodes d’ordination en typologie des flottilles. ICES J. Mar. Sci. 44, 286–296. doi: 10.1093/icesjms/44.3.286
Boonstra, W. J., and Hentati-Sundberg, J. (2016). Classifying fishers’ behaviour. An invitation to fishing styles. Fish. Fish. 17, 78–100. doi: 10.1111/faf.12092
Cambiè, G., Jribi, I., Cambera, I., Vagnoli, G., Freggi, D., and Casale, P. (2020). Intra-gear variation in sea turtle bycatch: implications for fisheries management. Fish. Res. 221:105405. doi: 10.1016/j.fishres.2019.105405
Campbell, R., Zhou, S., Hoyle, S., Hillary, R., Haddon, M., and Auld, S. (2017). Developing Innovative Approaches to Improve CPUE Standardisation for Australia’s Multispecies Pelagic Longline Fisheries. Final report for project 2014-021. Canberra: The Fisheries Research Development Corporation.
Campbell, R. A., and Young, J. W. (2012). Monitoring the behaviour of longline gears and the depth and time of fish capture in the Australian Eastern Tuna and Billfish Fishery. Fish. Res. 119–120, 48–65. doi: 10.1016/j.fishres.2011.12.006
Campos, A., Fonseca, P., Fonseca, T., and Parente, J. (2007). Definition of fleet components in the Portuguese bottom trawl fishery. Fish. Res. 83, 185–191. doi: 10.1016/j.fishres.2006.09.012
Castro, J., Marín, M., Pierce, G. J., and Punzón, A. (2011). Identification of métiers of the Spanish set-longline fleet operating in non-Spanish European waters. Fish. Res. 107, 100–111. doi: 10.1016/j.fishres.2010.10.013
Castro, J., Punzón, A., Pierce, G. J., Marín, M., and Abad, E. (2010). Identification of métiers of the Northern Spanish coastal bottom pair trawl fleet by using the partitioning method CLARA. Fish. Res. 102, 184–190. doi: 10.1016/j.fishres.2009.11.011
Chandrashekar, G., and Sahin, F. (2014). A survey on feature selection methods. Comput. Electr. Eng. 40, 16–28. doi: 10.1016/j.compeleceng.2013.11.024
Clauset, A., Newman, M. E. J., and Moore, C. (2004). Finding community structure in very large networks. Phys. Rev. E 70:066111.
Davie, S., and Lordan, C. (2011). Examining changes in Irish fishing practices in response to the cod long-term plan. ICES J. Mar. Sci. 68, 1638–1646. doi: 10.1093/icesjms/fsr052
Deporte, N., Ulrich, C., Mahévas, S., Demanèche, S., and Bastardie, F. (2012). Regional métier definition: a comparative investigation of statistical methods using a workflow applied to international otter trawl fisheries in the North Sea. ICES J. Mar. Sci. 69, 331–342. doi: 10.1093/icesjms/fsr 197
Dewar, H., Prince, E. D., Musyl, M. K., Brill, R. W., Sepulveda, C., Luo, J., et al. (2011). Movements and behaviors of swordfish in the Atlantic and Pacific Oceans examined using pop-up satellite archival tags. Fish. Oceanogr. 20, 219–241. doi: 10.1111/j.1365-2419.2011.00581.x
Duarte, R., Azevedo, M., and Afonso-Dias, M. (2009). Segmentation and fishery characteristics of the mixed-species multi-gear Portuguese fleet. ICES J. Mar. Sci. 66, 594–606. doi: 10.1093/icesjms/fsp019
Estivill-Castro, V., and Parsa, M. (2016). “Hardness and tractability of detecting connected communities,” in Proceedings of the Australasian Computer Science Week Multiconference, New York, NY.
EU (2016). Commission Implementing Decision (EU) 2016/1251 of 12 July 2016 Adopting a Multiannual Union Programme for the Collection, Management and use of Data in the Fisheries and Aquaculture Sectors for the Period of 2019-2019 (Notified under Document C(2016) 4329). Available online at: https://eur-lex.europa.eu/legal-content/EN/TXT/?uri=uriserv:OJ.L_.2016.207.01.0113.01.ENG (accessed January 10, 2020).
Fulton, E. A., Smith, A. D. M., Smith, D. C., and van Putten, I. E. (2011). Human behaviour: the key source of uncertainty in fisheries management. Fish. Fish. 12, 2–17. doi: 10.1111/j.1467-2979.2010.00371.x
Gower, J. C. (1971). A general coefficient of similarity and some of its properties. Biometrics 27, 857–871. doi: 10.2307/2528823
Hall, M., Frank, E., Holmes, G., Pfahringer, B., Reutemann, P., and Witten, I. H. (2009). The WEKA data mining software: an update. SIGKDD Explor. Newsl. 11, 10–18. doi: 10.1145/1656274.1656278
Hall, M. A. (2000). “Correlation-based feature selection for discrete and numeric class machine learning,” in Proceedings of the Seventeenth International Conference on Machine Learning, ed. P. Langley (San Francisco, CA: Morgan Kaufmann), 359–366.
He, X., Bigelow, K. A., and Boggs, C. H. (1997). Cluster analysis of longline sets and fishing strategies within the Hawaii-based fishery. Fish. Res. 31, 147–158. doi: 10.1016/s0165-7836(96)00564-4
Hennig, C. (2007). Cluster-wise assessment of cluster stability. Comput. Stat. Data Ann. 52, 258–271. doi: 10.1016/j.csda.2006.11.025
Hilborn, R. (2007). Managing fisheries is managing people: what has been learned? Fish. Fish. 8, 285–296. doi: 10.1111/j.1467-2979.2007.00263_2.x
Hobday, A., and Hartmann, K. (2006). Near real-time spatial management based on habitat predictions for a longline bycatch species. Fish. Manag. Ecol. 13, 365–380. doi: 10.1111/j.1365-2400.2006.00515.x
Holland, D. S., and Sutinen, J. G. (1999). An empirical model of fleet dynamics in New England trawl fisheries. Can. J. Fish. Aquat. Sci. 56, 253–264. doi: 10.1139/f98-169
Holley, J. F., and Marchal, P. (2004). Fishing strategy development under changing conditions: examples from the French offshore fleet fishing in the North Atlantic. ICES J. Mar. Sci. 61, 1410–1431. doi: 10.1016/j.icesjms.2004.08.010
Jaccard, P. (1901). Distribution de la flore alpine dans le bassin des Dranses et dans quelques régions voisines. Bull. Soc. Vaud. Sci. Nat. 37, 241–272.
Jain, A. K., and Dubes, R. C. (1988). Algorithms for Clustering Data. New Jersey: Prentice-Hall Inc.
Karegowda, A., Jayaram, M. A., and Manjunath, A. S. (2010). Feature subset selection problem using wrapper approach in supervised learning. Int. J. Comput. Appl. 7, 13–17. doi: 10.5120/169-295
Kaufman, L., and Rousseeuw, P. J. (1987). “Clustering by means of medoids,” in Statistical Data Analysis Based on the L1-Norm and Related Methods, ed. Y. Dodge (Switzerland: Birkhauser Verlag Basel), 405–416.
Kaufman, L., and Rousseeuw, P. J. (1990). “Partitioning around medoids (Program PAM),” in Finding Groups in Data: An Introduction to Cluster Analysis, eds L. Kaufman and P. J. Rousseeuw (Hoboken, NJ: John Wiley & Sons Inc), 68–125. doi: 10.1002/9780470316801.ch2
Lewy, P., and Vinther, M. (1994). Identification of Danish North Sea trawl fisheries. ICES J. Mar. Sci. 51, 263–272. doi: 10.1006/jmsc.1994.1027
MacQueen, J. (1967). “Some methods for classification and analysis of multivariate observations,” in Proceedings of the Fifth Berkeley Symposium on Mathematical Statistics and Probability, Volume 1: Statistics, eds L. M. Le Cam and J. Neyman (Berkeley, CA: University of California Press), 281–297.
Marchal, P. (2008). A comparative analysis of métiers and catch profiles for some French demersal and pelagic fleets. ICES J. Mar. Sci. 65, 674–686. doi: 10.1093/icesjms/fsn044
Marchal, P., Andersen, B., Bromley, D., Iriondo, A., Mahévas, S., Quirijns, F., et al. (2006). Improving the definition of fishing effort for important European fleets by accounting for the skipper effect. Can. J. Fish. Aquat. Sci. 63, 510–533. doi: 10.1139/f05-238
Marchal, P., and Horwood, J. (1996). Long-term targets for the Celtic Sea mixed-species multi-métiers fisheries. Aquat. Living Resour. 9, 81–94. doi: 10.1051/alr:1996011
Martín-Fernández, J., Barceló-Vidal, C., and Pawlowsky-Glahn, V. (1998). “Measures of difference for compositional data and hierarchical clustering methods,” in Proceedings of IAMG’98, The Fourth Annual Conference of the International Association for Mathematical Geology, Vol. 2, eds A. Buccianti, G. Nardi, and R. Potenza (Naples: De Frede), 526–531.
Martín-Fernández, J., Hron, K., Templ, M., Filzmoser, P., and Palarea-Albaladejo, J. (2014). Bayesian-multiplicative treatment of count zeros in compositional data sets. Stat. Model. 15:524. doi: 10.1177/1471082X14535524
Maynou, F., Recasens, L., and Lombarte, A. (2011). Fishing tactics dynamics of a Mediterranean small-scale coastal fishery. Aquat. Living Resour. 24, 149–159. doi: 10.1051/alr/2011131
Moore, C., Davie, S., Robert, M., Pawlowski, L., Dolder, P., and Lordan, C. (2019). Defining métier for the Celtic Sea mixed fisheries: a multiannual international study of typology. Fish. Res. 219:105310. doi: 10.1016/j.fishres.2019.105 310
Neis, B., Schneider, D. C., Felt, L., Haedrich, R. L., Fischer, J., and Hutchings, J. A. (1999). Fisheries assessment: what can be learned from interviewing resource users? Can. J. Fish. Aquat. Sci. 56, 1949–1963. doi: 10.1139/f99-115
Nielsen, J. R., and Christensen, A. S. (2006). Sharing responsibilities in Danish fisheries management—experiences and future directions. Mar. Pol. 30, 181–188. doi: 10.1016/j.marpol.2004.12.002
O’Farrell, S., Chollett, I., Sanchirico, J. N., and Perruso, L. (2019). Classifying fishing behavioral diversity using high-frequency movement data. Proc. Natl. Acad. Sci. U.S.A. 116, 16811–16816. doi: 10.1073/pnas.1906766116
Parsa, M., Emery, T. J., Williams, A. J., and Nicol, S. (2020). An empirical Bayesian approach for estimating fleet and vessel-level bycatch rates in fisheries with effort heterogeneity and limited data: a prospective tool for measuring bycatch mitigation performance. ICES J. Mar. Sci. 77, 921–929. doi: 10.1093/icesjms/fsaa020
Pawlowsky-Glahn, V., and Buccianti, A. (2011). Compositional Data Analysis: Theory and Applications. Hoboken, NJ: John Wiley & Sons Ltd.
Pelletier, D., and Ferraris, J. (2000). A multivariate approach for defining fishing tactics from commercial catch and effort data. Can. J. Fish. Aquat. Sci. 57, 51–65. doi: 10.1139/f99-176
Purcell, S. W., Fraser, N. J., Tagica, S., Lalavanua, W., and Ceccarelli, D. M. (2018). Discriminating catch composition and fishing modes in an artisanal multispecies fishery. Front. Mar. Sci. 5:243. doi: 10.3389/fmars.2018.00 243
R Core Team (2019). R: A Language and Environment for Statistical Computing. Vienna: R Foundation for Statistical Computing.
Reddy, C. K., and Vinzamuri, B. (2014). “A survey of partitional and hierarchical clustering algorithms,” in Data Clustering: Algorithms and Applications, eds C. C. Aggarwal and C. K. Reddy (Boca Raton FL: Chapman and Hall), 87–110. doi: 10.1201/9781315373515-4
Rousseeuw, P. J. (1987). Silhouettes: a graphical aid to the interpretation and validation of cluster analysis. J. Comput. Appl. Math. 20, 53–65. doi: 10.1016/0377-0427(87)90125-7
Sepulveda, C. A., Knight, A., Nasby-Lucas, N., and Domeier, M. L. (2010). Fine-scale movements of the swordfish Xiphias gladius in the Southern California Bight. Fish. Oceanog. 19, 279–289. doi: 10.1111/j.1365-2419.2010.00543.x
Tzanatos, E., Somarakis, S., Tserpes, G., and Koutsikopoulos, C. (2006). Identifying and classifying small-scale fisheries métiers in the Mediterranean: a case study in the Patraikos Gulf, Greece. Fish. Res. 81, 158–168. doi: 10.1016/j.fishres.2006.07.007
Ulrich, C., and Andersen, B. S. (2004). Dynamics of fisheries, and the flexibility of vessel activity in Denmark between 1989 and 2001. ICES J. Mar. Sci. 61, 308–322. doi: 10.1016/j.icesjms.2004.02.006
Ulrich, C., Wilson, D. C. K., Nielsen, J. R., Bastardie, F., Reeves, S. A., Andersen, B. S., et al. (2012). Challenges and opportunities for fleet- and métier-based approaches for fisheries management under the European Common Fishery Policy. Ocean Coast. Manag. 70, 38–47. doi: 10.1016/j.ocecoaman.2012.06.002
Wilen, J. E., Smith, M. D., Lockwood, D., and Botsford, L. W. (2002). Avoiding surprises: incorporating fisherman behavior into management models. Bull. Mar. Sci. 70, 553–575.
Wilson, D. C., and Jacobsen, R. B. (2009). Governance Issues in Mixed-Fisheries Management: An Analysis of Stakeholder Views. Available online at: https://vbn.aau.dk/ws/portalfiles/portal/18596166/download.pdfDW.pdf (accessed March 20, 2020).
Winker, H., Kerwath, S. E., and Attwood, C. G. (2013). Comparison of two approaches to standardize catch-per-unit-effort for targeting behaviour in a multispecies hand-line fishery. Fish. Res. 139, 118–131. doi: 10.1016/j.fishres.2012.10.014
Zhou, S., Campbell, R. A., and Hoyle, S. D. (2019). Catch per unit effort standardization using spatio-temporal models for Australia’s Eastern Tuna and Billfish Fishery. ICES J. Mar. Sci. 76, 1489–1504. doi: 10.1093/icesjms/fsz034
Keywords: behavior, Eastern Tuna and Billfish Fishery, fishing styles, fishing fleets, fisheries management, fishing tactics
Citation: Parsa M, Emery TJ, Williams AJ and Nicol S (2020) A Robust Métier-Based Approach to Classifying Fishing Practices Within Commercial Fisheries. Front. Mar. Sci. 7:552391. doi: 10.3389/fmars.2020.552391
Received: 16 April 2020; Accepted: 22 October 2020;
Published: 12 November 2020.
Edited by:
Steven W. Purcell, Southern Cross University, AustraliaReviewed by:
Henning Winker, Department of Agriculture, Forestry and Fisheries (South Africa), South AfricaJon Brodziak, Pacific Islands Fisheries Science Center (NOAA), United States
Copyright © 2020 Parsa, Emery, Williams and Nicol. This is an open-access article distributed under the terms of the Creative Commons Attribution License (CC BY). The use, distribution or reproduction in other forums is permitted, provided the original author(s) and the copyright owner(s) are credited and that the original publication in this journal is cited, in accordance with accepted academic practice. No use, distribution or reproduction is permitted which does not comply with these terms.
*Correspondence: Mahdi Parsa, mahdi.parsa@awe.gov.au