The Cumulative Effects of Fishing, Plankton Productivity, and Marine Mammal Consumption in a Marine Ecosystem
 Caihong Fu1*
  Yi Xu2
  Chuanbo Guo1† Norm Olsen1 Arnaud Grüss3† Huizhu Liu4
  Nicolas Barrier5 Philippe Verley6
  Yunne-Jai Shin5
- 1Pacific Biological Station, Fisheries and Oceans Canada, Nanaimo, BC, Canada
- 2Fraser River and Interior Area Stock Assessment Division, Fisheries and Oceans Canada, Delta, BC, Canada
- 3School of Aquatic and Fishery Sciences, University of Washington, Seattle, WA, United States
- 4Department of Computer Science, Vancouver Island University, Nanaimo, BC, Canada
- 5IRD, Univ Montpellier, Ifremer, CNRS, MARBEC, Montpellier, France
- 6AMAP, Univ Montpellier, CIRAD, CNRS, INRAE, IRD, Montpellier, France
The marine ecosystem off British Columbia (BC), Canada, has experienced various changes in the last two decades, including reduced lipid-rich zooplankton biomass, increased marine mammals, and deteriorated commercial fisheries, particularly those targeting pelagic species such as Pacific Herring (Clupea pallasii). Understanding how stressors interactively and cumulatively affect commercially important fish species is key to moving toward ecosystem-based fisheries management. Because it is challenging to assess the cumulative effects of multiple stressors by using empirical data alone, a dynamic, individual-based spatially explicit ecosystem modeling platform such as Object-oriented Simulator of Marine Ecosystems (OSMOSE) represents a valuable tool to simulate ecological processes and comprehensively evaluate how stressors cumulatively impact modeled species. In this study, we employed OSMOSE to investigate the cumulative effects of fishing, plankton biomass change, and marine mammal consumption on the dynamics of some fish species and the BC marine ecosystem as a whole. We specifically simulated ecosystem dynamics during the last 20 years under two sets of scenarios: (1) unfavorable conditions from the perspective of commercial fish species (i.e., doubling fishing mortality rates, halving plankton biomass, and doubling marine mammal biomass, acting individually or collectively); and (2) favorable conditions with the three factors having opposite changes (i.e., halving fishing mortality rates, doubling plankton biomass, and halving marine mammal biomass, acting individually or collectively). Our results indicate that, under unfavorable conditions, the degree to which species biomass was reduced varied among species, and that negative synergistic and negative dampened effects were dominant under historical and doubled fishing mortality rates, respectively. Under favorable conditions, species biomasses did not increase as much as expected due to the existence of complex predator-prey interactions among fish species, and positive synergistic and positive dampened effects were prevailing under historical and halved fishing mortality rates, respectively. The ecosystem total biomass and the biomass to fisheries yield ratio were found to be good ecological indicators to represent ecosystem changes and track the impacts from the multiple drivers of change. Our research provides insights on how fisheries management should adapt to prepare for potential future impacts of climate change.
Introduction
Marine ecosystems have been increasingly impacted by both climate- and human-induced drivers that have caused drastic changes in the ecosystems at multiple trophic levels and spatial scales, potentially resulting in species redistributions, altered biodiversity, ecosystem resilience and integrity, and affecting the reference points that are critical for effective resource management (e.g., Stenseth et al., 2002; Fulton, 2011; García-Reyes et al., 2013; Quetglas et al., 2013; Feld et al., 2016; Samhouri et al., 2017; Bonebrake et al., 2018; Le Bris et al., 2018; Ortega-Cisneros et al., 2018; Ramírez et al., 2018; Guo et al., 2019). The cumulative impacts from multiple drivers of change can also cause significant disturbances in socio-economic systems (Bograd et al., 2019).
In marine ecosystems, multiple drivers of change may interact and generate synergistic, dampened or antagonistic combined effects with respect to the sum of their individual effects (Crain et al., 2008; Griffith et al., 2011, 2012, 2019; Travers-Trolet et al., 2014; Piggott et al., 2015; Fu et al., 2018). Addressing these interacting drivers of change jointly and understanding how they affect different ecosystem components and ecosystem functioning are important to natural resource managers (Planque et al., 2010; Hidalgo et al., 2011; Giakoumi et al., 2015; Halpern et al., 2015; Feld et al., 2016). Since the review by Crain et al. (2008), studies analyzing the cumulative and interactive effects of drivers of change have moved from species-level research to ecosystem-level research (e.g., Micheli et al., 2013; Feld et al., 2016; Schinegger et al., 2016; Teichert et al., 2016; Mach et al., 2017; Lercari et al., 2018; Ramírez et al., 2018). Nevertheless, a deep understanding of the cumulative effects of drivers of change is often impossible when analysts rely only on statistical analyses of empirical data, which hampers a comprehensive prediction of responses to multiple drivers and, thus, the proper mitigation of cumulative impacts of multiple drivers on marine ecosystems and restoration projects (Segurado et al., 2018). In particular, statistical analyses are generally unable to provide information at the scale of entire ecosystems and for long time periods despite the fact that the consideration of large spatial and temporal scales is critical for reliable projections of the potential future effects of drivers of change (Boyd et al., 2018; Hodgson and Halpern, 2019).
In contrast to statistical analyses, simulation experiments using ecosystem models can easily consider the large spatial and temporal scales at which the cumulative effects of multiple drivers of change manifest (Griffith et al., 2011; Fu et al., 2018). Simulation experiments employing ecosystems models have been increasingly conducted during the past 10 years to provide a mechanistic understanding of the impacts of natural and human-induced drivers of changes on marine ecosystems (Griffith et al., 2011, 2012, 2019; Travers-Trolet et al., 2014; Weijerman et al., 2015; Fu et al., 2018, 2019; Ortega-Cisneros et al., 2018). In this study, we applied the ecosystem modeling platform Object-oriented Simulator of Marine Ecosystems (OSMOSE) Shin and Cury, 2004; Fu et al., 2017) to the British Columbia (BC) marine ecosystem (Figure 1) to understand the cumulative impacts of multiple drivers on this ecosystem.
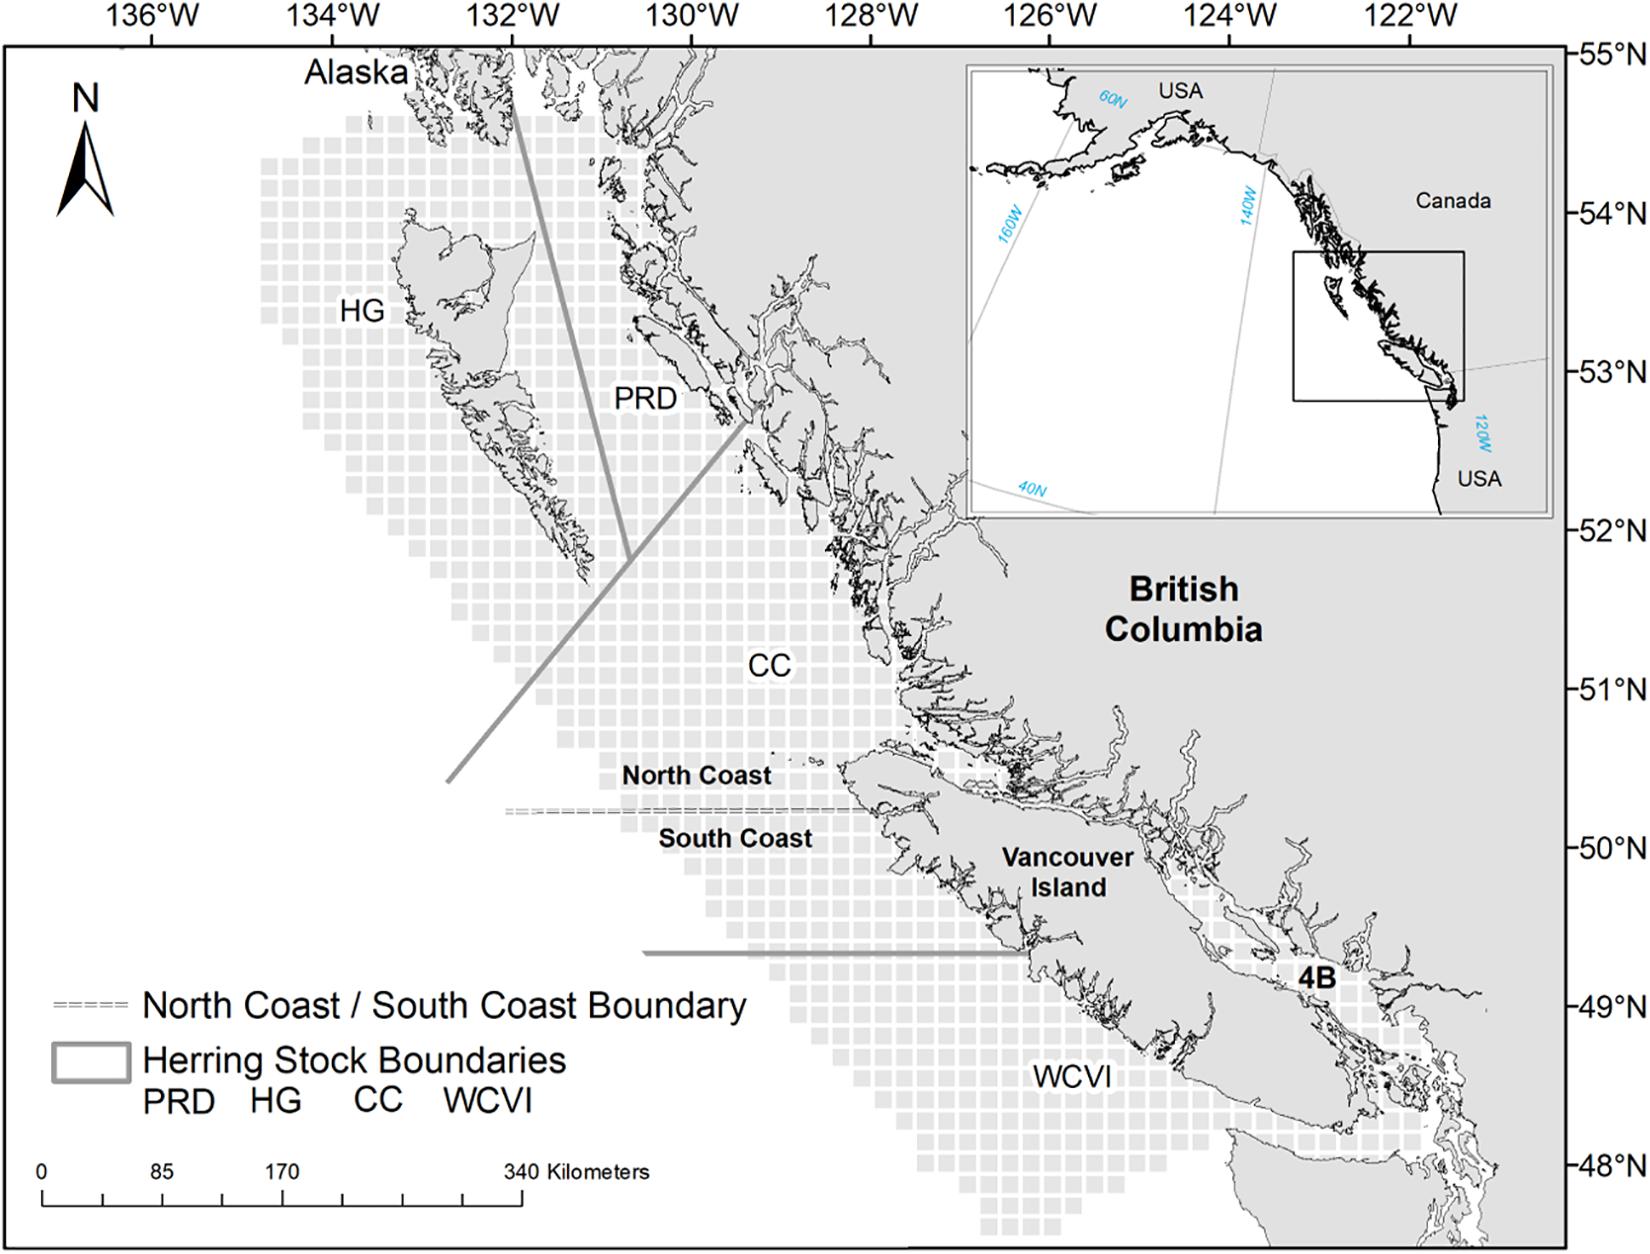
Figure 1. Map of the British Columbia marine ecosystem showing the spatial grid of the OSMOSE-BC model (light gray cells), the four management areas (delineated by solid lines) of Pacific Herring (C. pallasii) [Prince Rupert District (PRD), Haida Gwaii (HG), and Central Coast (CC), and West Coast of Vancouver Island (WCVI)], as well as the two management areas (separated by dashed lines) of Pacific Cod (G. macrocephalus), Lingcod (O. elongatus), and Walleye Pollock (G. chalcogrammus) (North and South Coasts).
Object-oriented Simulator of Marine Ecosystems is an individual-based model that simulates species dynamics in a spatiotemporally explicit fashion. One key characteristic of OSMOSE is that it does not predefine species interactions; rather, species interactions are emerging properties that depend on the degree of spatiotemporal overlap between predator and prey species, their size ratios, and their relative abundances (Shin and Cury, 2004), as well as on the accessibility of prey to the predators due to the morphology and vertical distribution patterns of the prey (Fu et al., 2013). Because modeling with OSMOSE necessitates extensive information on entire life cycles of the modeled species, typically no more than 10–15 species are focused. By limiting the number of focus species included in an OSMOSE model, the computation time and memory capacity can be kept reasonable while the complex interactions within the study ecosystem are simplified. However, this limited number of species can cause the OSMOSE model to miss important, and even sometimes major, prey and predators when the study ecosystem is characterized by a relatively high biodiversity. Fu et al. (2017) enhanced the OSMOSE model to allow explicit consideration of nearly all the taxa of a given ecosystem without compromising much of the computation time and without requiring extensive information on whole life cycles. This enhancement was done through the inclusion of “background” taxa, that is, taxa that are of secondary importance for the study but have the potential to be important prey or predators of the modeled focus species. The inclusion of background taxa has allowed OSMOSE to provide a more comprehensive understanding of species interactions within an ecosystem and their implications when management measures are implemented (Fu et al., 2017).
The BC marine ecosystem is located within a dynamic transition zone where the Pacific Ocean Current bifurcates into the northward-flowing Alaska Current and the southward-flowing California Current, and the variability of the bifurcation location influences the species composition of plankton communities and the productivity of higher-trophic-level fish species (Keister et al., 2011; Malick et al., 2017). In the last two decades, the BC marine ecosystem has experienced measurable changes in its structure and functioning, potentially due to the spatial redistributions of some marine species in response to changes in climatic conditions. Firstly, the zooplankton community, which used to be dominated by abundant lipid-rich large boreal copepods, has become dominated by gelatinous zooplankton with lower nutritional quality for juvenile fishes (Boldt et al., 2019). Secondly, marine mammals, such as pinnipeds and cetaceans, many of which have experienced a dramatic increase in numbers in the last few decades (Ford, 2014) and may have negatively impacted some commercial fish species (Fu et al., 2017), are increasingly contributing to shaping the functioning of the BC marine ecosystem. Thirdly, some fisheries, particularly those targeting Pacific Herring (Clupea pallasii), have contracted or been in moratorium for nearly two decades (Cleary et al., 2018).
In light of the above-mentioned changes, we attempted to understand how fishing pressure, plankton productivity and mammal consumption may have interacted and impacted the BC marine ecosystem, and how fisheries management should be adapted to meet the challenge of climate change. The primary objectives of this study are three-fold. First, at the species level, particularly from the perspectives of commercially and ecologically important species such as Pacific Herring, Pacific Cod (Gadus macrocephalus), Lingcod (Ophiodon elongatus) and Pacific Halibut (Hippoglossus stenolepis), we investigate the impacts on their dynamics of three key drivers, i.e., fishing, change in plankton biomass as suitable food for planktivorous fish, and change in marine mammal biomass as a measure of predatory consumption. Second, at the ecosystem level and from the standpoint of ecological indicators, we examine how these three key drivers influence ecosystem dynamics. Third, from the viewpoint of ecosystem-based fisheries management, we discuss how fisheries management should be adapted to better prepare for potential future climate change.
Materials and Methods
Study Area and OSMOSE Model Components
The BC marine ecosystem extends along 27,000 km of the temperate northeast Pacific coastline, and from the coastal watersheds to the outer limit of the continental slope (Figure 1). The focus species included in the OSMOSE model for the BC ecosystem (“OSMOSE-BC”) are commercially and ecologically important fishes and include Pacific Herring, Pacific Cod, Lingcod, Arrowtooth Flounder (Atheresthes stomias), Walleye Pollock (Gadus chalcogrammus), and Pacific Halibut (H. stenolepis). An additional species group, Euphausiids (Thysanoessa spp. and Euphausia spp.), is modeled as a focus taxon in the OSMOSE-BC model, as Euphausiids represent an abundant and important food source for higher-trophic-level fish species (Haigh et al., 2015) and baleen whales (Ford, 2014). Following Fu et al. (2017), the focus fish species are modeled either as a single stock (i.e., Arrowtooth Flounder, Pacific Halibut) or multiple stocks in different geographic regions in accordance with the current stock assessment practices (Figure 1). Specifically, Pacific Herring has been assessed and managed as four separate stocks in four distinct areas: Prince Rupert District (PRD), Haida Gwaii (HG), Central Coast (CC), and West Coast of Vancouver Island (WCVI). Pacific Cod, Lingcod, and Walleye Pollock are assessed as two separate stocks in two distinct areas: North and South Coasts (Figure 1).
In the OSMOSE-BC model, plankton (phytoplankton and zooplankton) are included as spatially distributed biomass pools serving as food for planktivorous fishes. Their biomass time series, minimum and maximum body sizes, trophic levels, and distribution maps at different time steps were set up according to Fu et al. (2017).
Marine mammals are included in the OSMOSE-BC model as background taxa that exert different degrees of predation mortality on other modeled species depending on their abundance, predator-prey size ratio, and spatial distribution (Fu et al., 2017). Included in the OSMOSE-BC model are also 16 additional background taxa (Table 1). For some background taxa (e.g., Pacific Hake Merluccius productus; Humpback Whale Megaptera novaeangliae, and Fin Whale Balaenoptera physalus) that are migratory, they do not interact with other modeled taxa when they migrate out of the model spatial domain. Therefore, a map of empty value is used for the out-of-model-domain season.
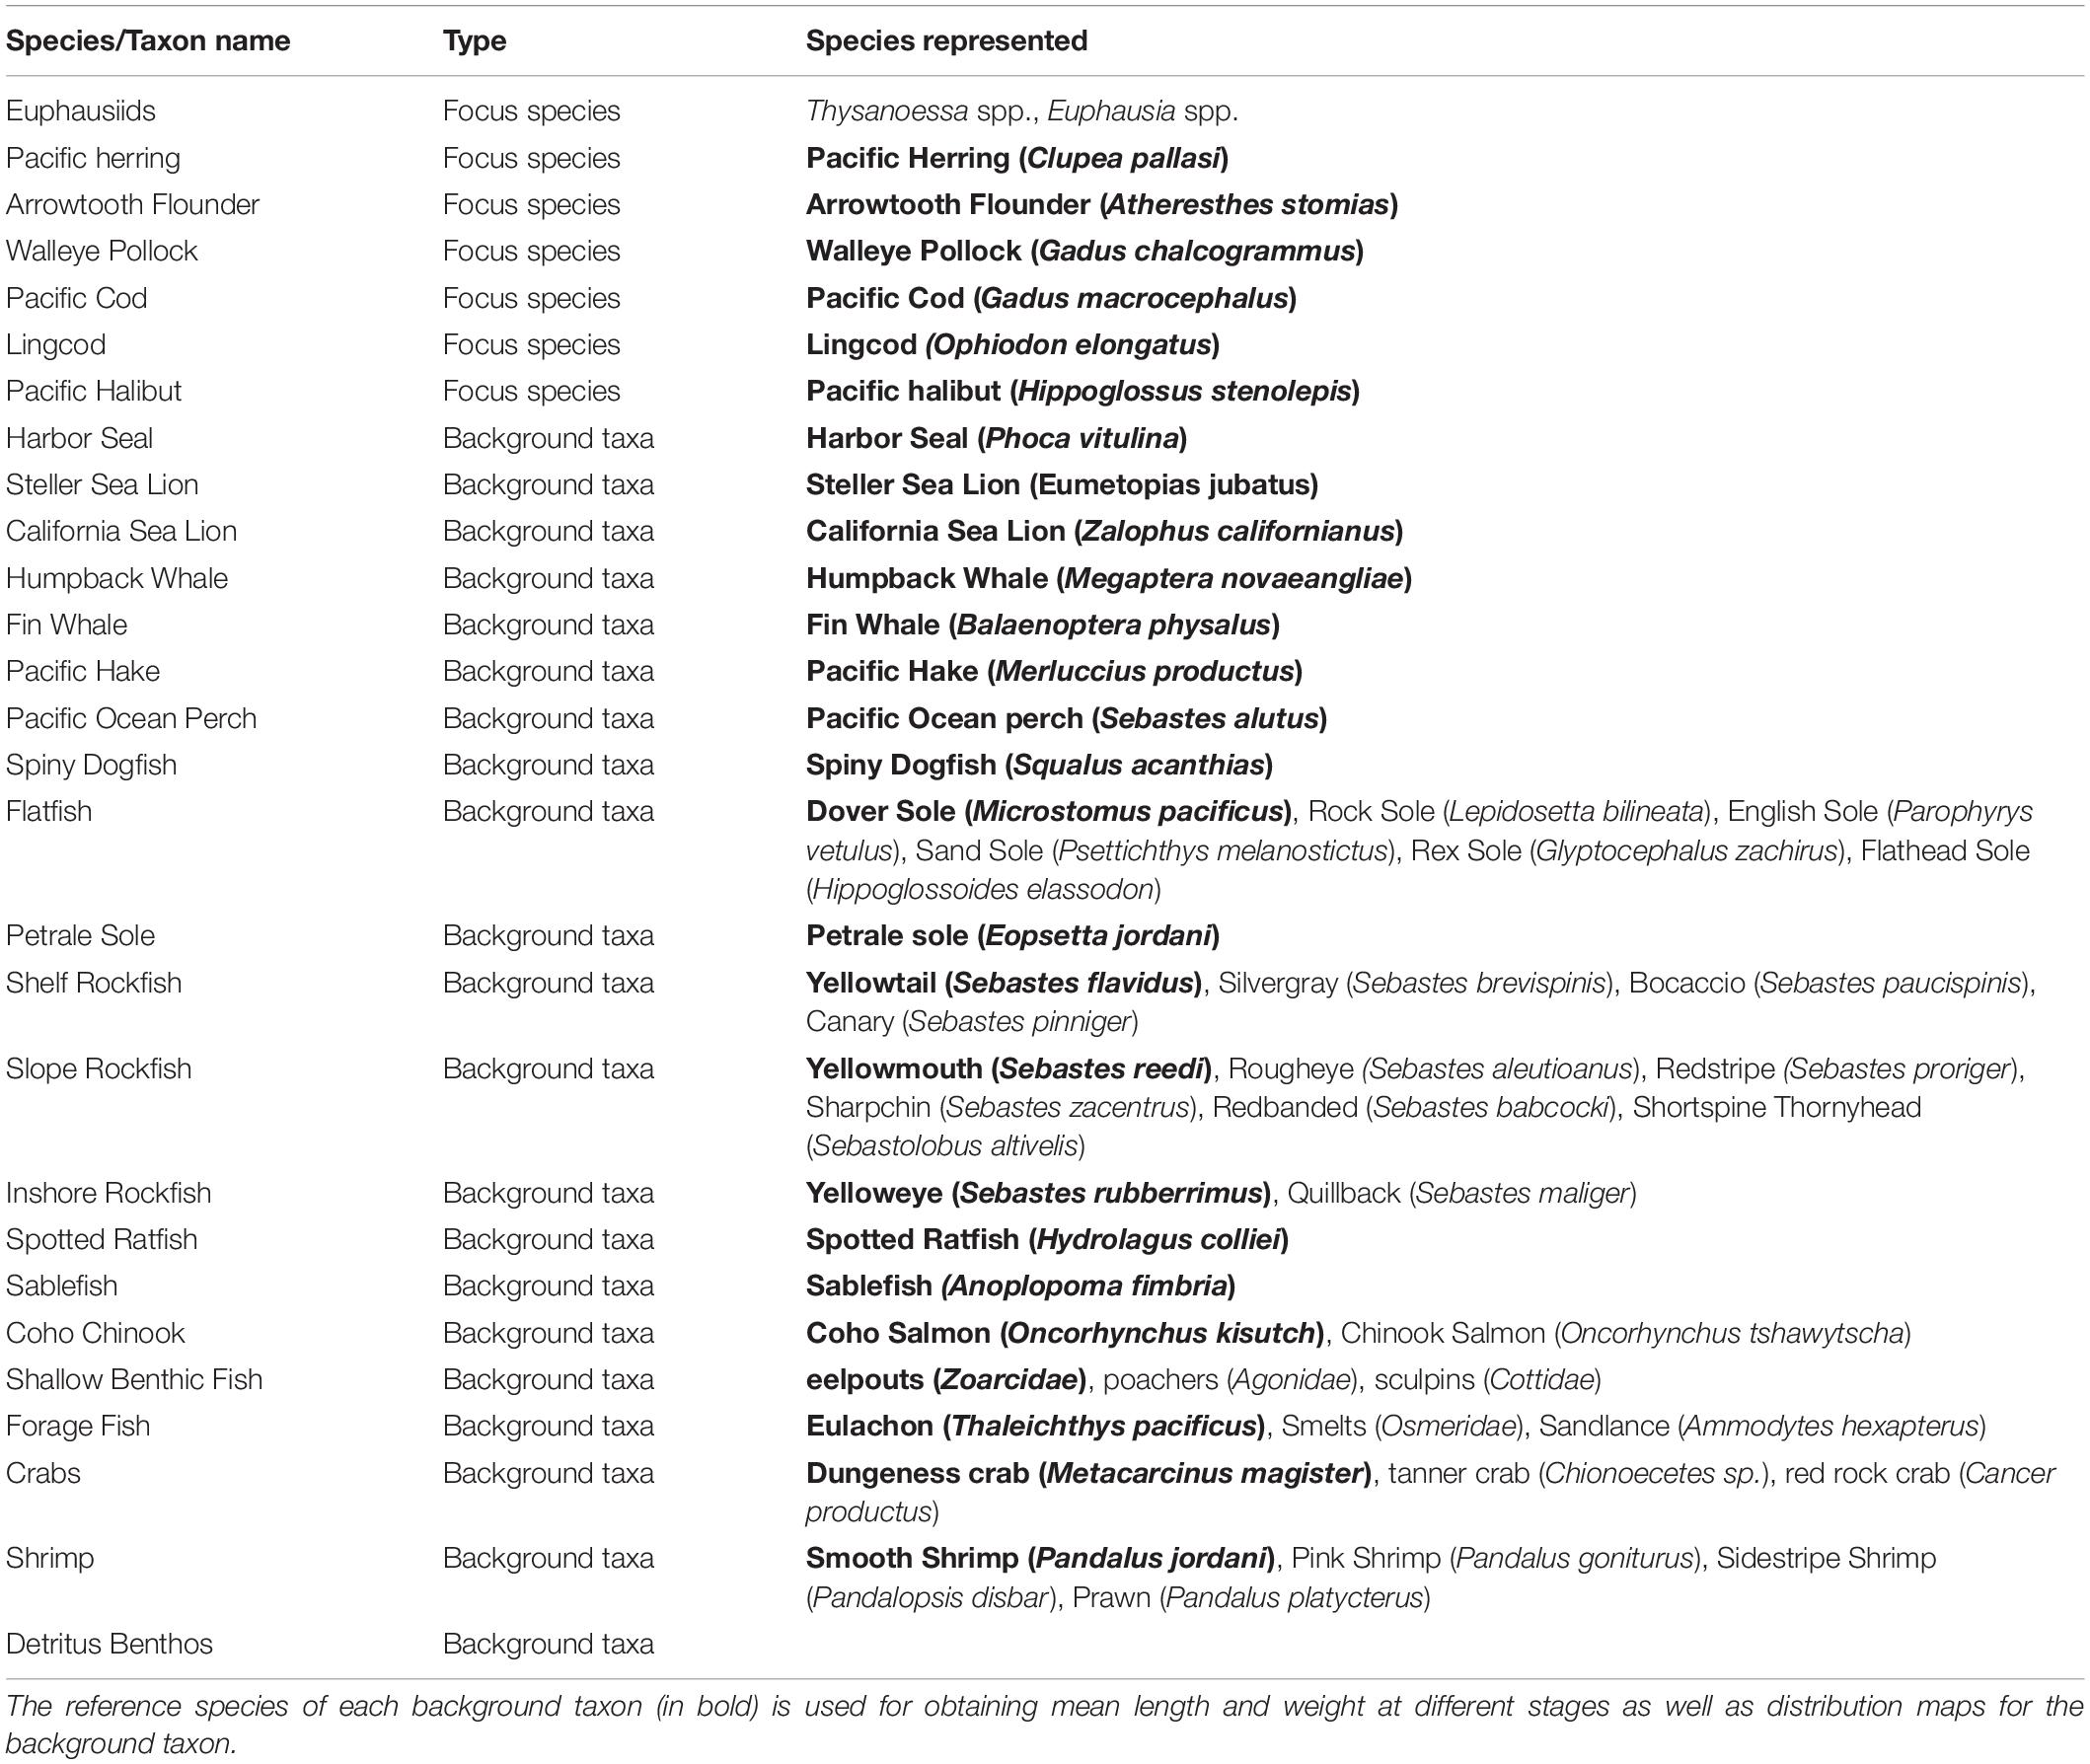
Table 1. Focus species and background taxa included in the OSMOSE-BC ecosystem simulation model.
The OSMOSE-BC model simulates the life cycle of the focus species, from the egg stage to the terminal age, at a time step of 4 months, each representing one season (Winter: December to next March; Summer: April to July; Fall: August to November). At the time step immediately following the production of eggs, the total number of eggs of each population is split into super-individuals called “schools,” which are distributed spatially according to input distribution maps (Fu et al., 2017). The distribution maps (15 km × 15 km) are density-based and obtained from geo-referenced data of both commercial fisheries and research surveys (the data archives being maintained by Fisheries and Oceans Canada, Pacific Biological Station, Nanaimo, BC, Canada). The spatial resolution of the distribution maps was set to adequately capture the spatial dynamics of modeled species while also keeping the computation time and memory capacity within reasonable ranges. At each time step, OSMOSE simulates the biological and ecological processes of these schools, including growth, predation, starvation, other natural mortality due to causes unaccounted for by the model, fishing, reproduction, and spatial movement (including migration). The biological information needed for the focus species including growth, reproduction and mortality parameters were obtained from previous studies (Fu et al., 2013, 2017) and stock assessments (Forrest et al., 2015; Holt et al., 2016; Grandin and Forrest, 2017; Cleary et al., 2018; Table 2). The rest of the information needed for focus species, including feeding size ranges expressed as minimum and maximum predator/prey size ratios, annual fishing mortality time series obtained from stock assessments, fishing and reproduction seasonality, and distribution maps for different life stages and time steps, was set up following Fu et al. (2017).
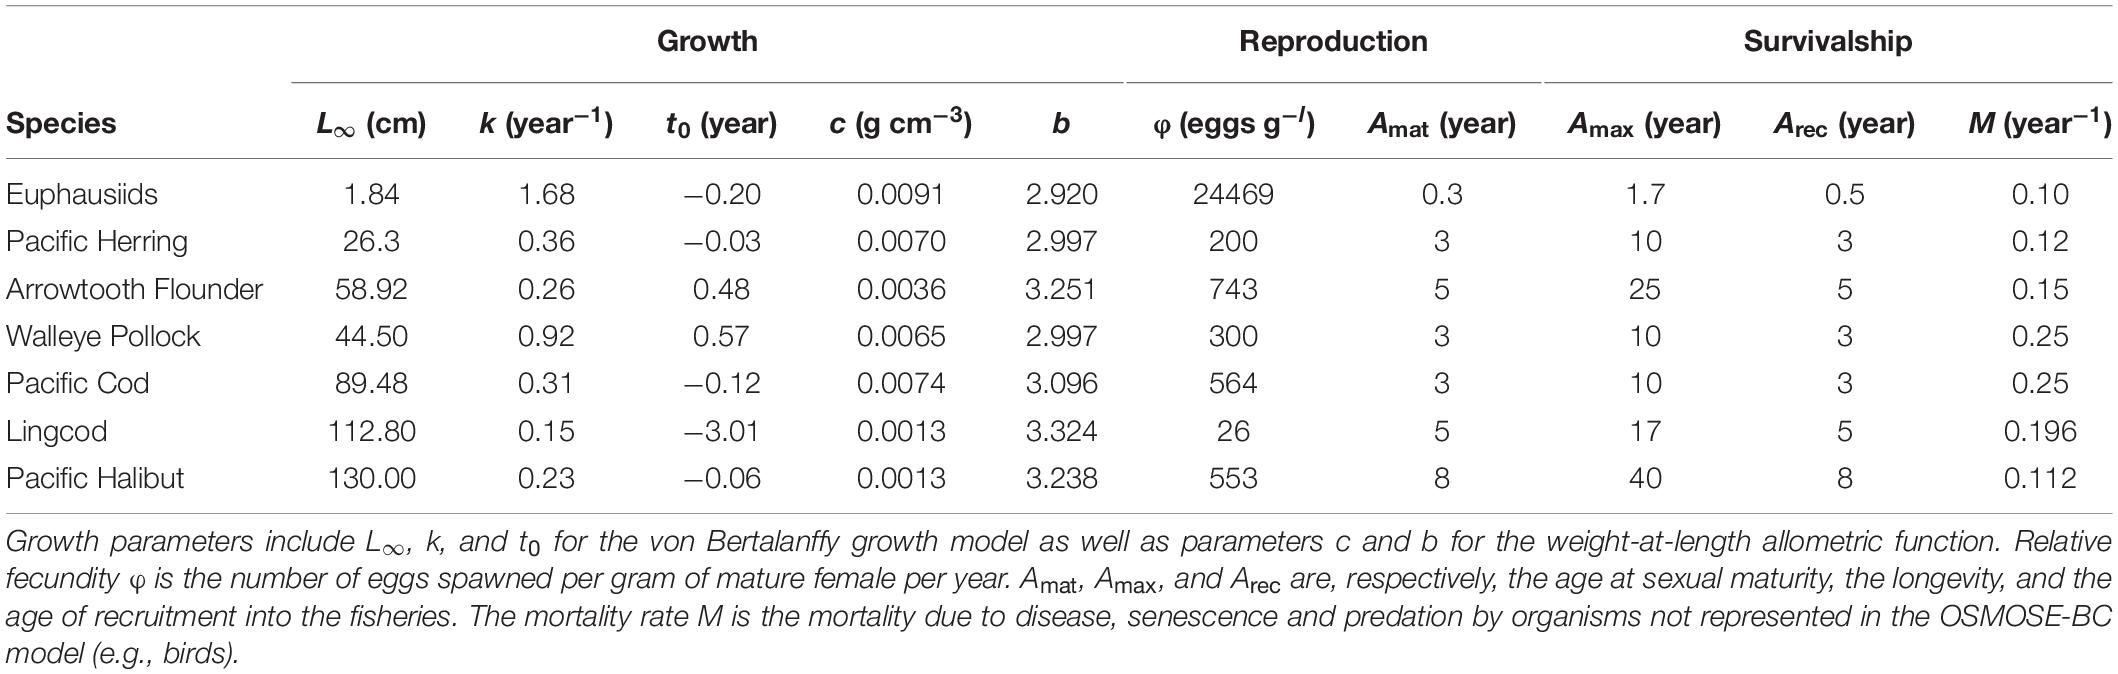
Table 2. Growth, reproduction and mortality parameters for each of the focus species considered in the OSMOSE-BC model.
For the background taxa, only the predation, spatial distribution and movement processes are simulated. At the beginning of each year, the biomass of background taxa is separated into young-of-the-year, juveniles, and adults. The biomass in each life stage is then converted to abundance based on the average weight of each life stage and subsequently divided into schools. At each time step, these schools for the different life stages interact with schools of the focus species and other background taxa through predator-prey relationships by exerting predation mortality and/or representing a food source. Mortality other than predation mortality, growth, and reproduction are not modeled for the background taxa. Input information of biomass time series, mean length and weight at different stages, minimum and maximum predator/prey size ratios and distribution maps for different life stages and time steps was set up following Fu et al. (2017).
Model Calibration and Simulation Scenarios
The period considered in the OSMOSE-BC model is the period 1940–2018 (including a burn-in period from 1940 to 1950). The natural mortality rate of the first life stage (eggs and first-feeding larvae), i.e., larval mortality rate, is due to different causes (e.g., non-fertilization of eggs, starvation of first feeding larvae, advection, and sinking) and is usually very hard to quantify. Therefore, the first step with the OSMOSE-BC model consisted of estimating the larval mortality rate of the focus species, as in Fu et al. (2017), so that the simulated biomass time series of the populations were as close as possible to those from stock assessments or those reconstructed from survey data. The best calibrated OSMOSE-BC model (i.e., representing historical conditions) was used to derive biomass time series for the focus species, which were then used as baseline scenario such that there was comparability between the scenarios and past realistic projections (Niiranen et al., 2013).
Previous ecosystem simulation studies have explored the cumulative effects of ocean warming and acidification on the dynamics of fish species, communities, and ecosystems (e.g., Griffith et al., 2011, 2012, 2019; Ortega-Cisneros et al., 2018). The long-term warming trend in the BC marine ecosystem has been only 0.08°C per decade for sea surface temperature since recordings started in 1917 and even weaker (0.07°C) for the subsurface (100–150 m) waters (Greenan et al., 2018). Such a slow long-term change in temperature is likely within the optimal temperature range of the studied focus species. In addition, ocean acidification has not been found to have a measurable effect on fish species in the BC marine ecosystem (Haigh et al., 2015). By contrast, the climate-induced variability of the location of the Pacific Ocean Current bifurcation has resulted in region-specific enrichment or impoverishment of suitable plankton food for fish species (Keister et al., 2011). Such changes in the plankton community along with increased marine mammals that tend to undergo extensive climate-induced migrations (Sprogis et al., 2018) are two primary drivers of change in the BC marine ecosystem (Fu et al., 2017; Godefroid et al., 2019). The bottom-up forcing of plankton productivity and top-down forcing of predation pressure are also considered to be critical components of ecosystem-based fisheries management (Cury et al., 2011; Weijerman et al., 2015; Ortega-Cisneros et al., 2018).
Therefore, in this study, we specifically investigated how changes in the plankton production and marine mammal consumption may affect the dynamics of other species and the whole marine ecosystem. Considering that plankton and marine mammal biomasses within the BC marine ecosystem can either decrease or increase rapidly as a result of climate-induced spatial redistributions, we carried out simulations under two contrasting sets of scenarios (i.e., favorable and unfavorable from the perspectives of commercial fish species) related to three drivers (i.e., fishing, change in plankton biomass, and change in marine mammal biomass). Under the favorable condition scenarios, fish population biomasses were expected to be higher than under the historical baseline scenario by manipulating the three drivers individually or collectively, including halving fishing mortality rate (HalfF), doubling plankton biomass (DoubPl), and halving marine mammal biomass (HalfMam) during the last 20 years of the simulation period. By contrast, under the unfavorable condition scenarios, fish population biomasses were expected to be lower than under the historical baseline scenario, as fishing mortality rate was doubled (DoubF), plankton biomass was halved (HalfPl), and marine mammal biomass was doubled (DoubMam), separately or simultaneously, during the last 20 years of the simulation. In total, seven (three with a single driver and four with multiple drivers) favorable condition scenarios and seven unfavorable condition scenarios were considered in the present study; these 14 scenarios are detailed in Table 3.
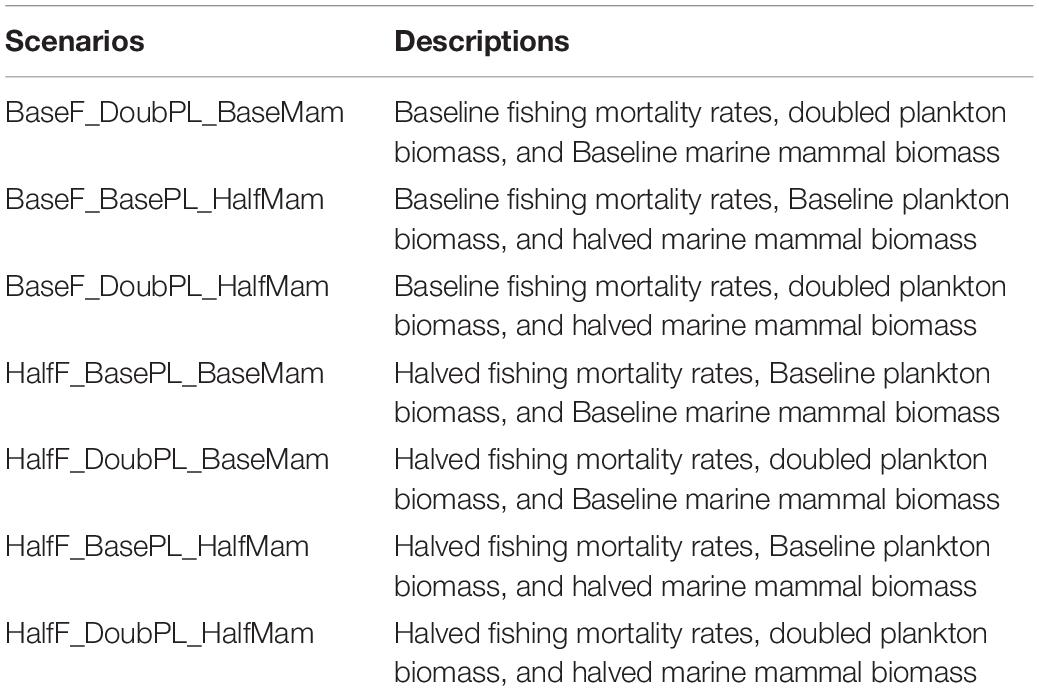
Table 3. Acronyms and descriptions of seven simulation scenarios.
Ecological Indicators
Aside from the dynamics of modeled focus species, the three drivers also interactively and cumulatively impact the dynamics of the ecosystem as a whole. Therefore, we also employed nine ecological indicators to help reveal how the 12 stocks of focus fish species as a whole responded to the drivers that cannot be inferred from species-specific indicators (e.g., Fu et al., 2019). The nine indicators include: the biomass to fisheries yield ratio (B/Y); the proportion of predatory fishes (Pred: the proportion of biomass at trophic levels ≥4.0); the large fish indicators LFI20 and LFI40, i.e., the proportions (by weight) of fish >20 and >40 cm, respectively; the mean trophic level of the community (TLco: calculated as , where TL is for trophic level); the total fish biomass of all-trophic-level species (B); the biomass of lower-trophic-level fish species (B_LTL: the biomass at trophic levels ≤3.25); the biomass of higher-trophic-level fish species (B_HTL: the biomass at trophic levels >3.25); and the ratio of B_LTL to B_HTL (B_L2H). All the ecological indicators were calculated based on the OSMOSE-BC model outputs of the 12 fish stocks of the focus fish species (Table 1).
Relative Changes and Combined Effects
For each scenario k, the change in a response variable R (i.e., the biomass of a species or the value of an ecological indicator) relative to the baseline scenario b was calculated as: . To understand the cumulative impacts of the three drivers (fishing mortality, plankton biomass, and marine mammal biomass) on the dynamics of the focus species and the whole BC ecosystem, we specifically used the biomasses of the individual focus species and the total biomass of the ecosystem as the response variable, following the Global Ocean Observing System (GOOS) Biology and Ecosystems Panel that identified biomasses as Fish Essential Ocean Variables (Miloslavich et al., 2018). Under an additive effect, the combined effect of multiple drivers is the sum of ΔRk with each of the three drivers varying independently. Following Fu et al. (2018), we defined the additive effect as the 1:1 line, but added a range of ±0.05 (shown as dashed lines around the 1:1 line in Figure 2) to allow for a broadened definition of the additive effect (Ortega-Cisneros et al., 2018). The zones below the additive effect are considered as ecologically risky effects, including negative synergism, negative antagonism, and positive dampened effects (Figure 2). By contrast, the zones above the additive effect, including positive synergism, positive antagonism, and negative dampened effects, result in higher fish biomasses than expected under the additive effect and, therefore, there is no ecological risk associated with them (Fu et al., 2018).
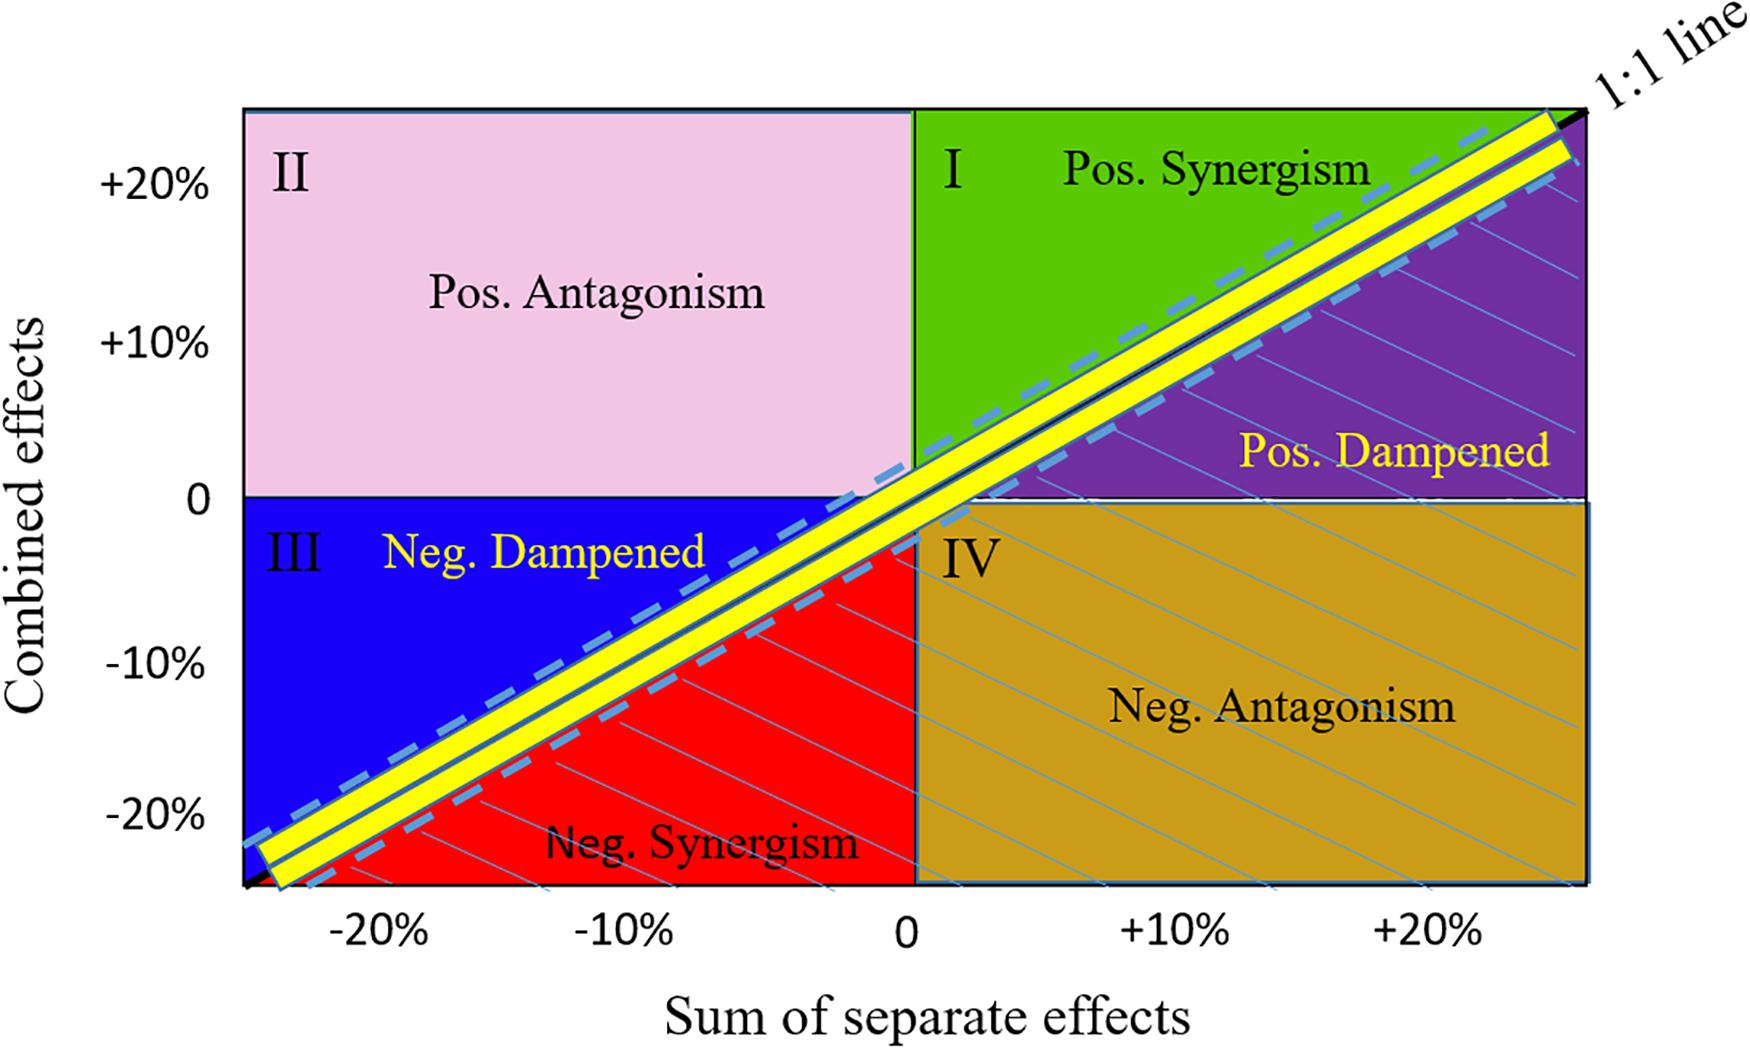
Figure 2. Schematic comparison of the combined versus additive separate effects. Effects are presented as relative change in biomass occurring when fishing and changes in plankton and mammal biomasses act simultaneously (combined effect, y-axis) versus separately (x-axis). The 1:1 line with a range of ±0.05 (dashed lines) represents combined effects being equal to additive effects. The zones below the lower dashed line are considered as risk zones, including negative synergistic (Neg. Synergism), negative antagonistic (Neg. Antagonism), and positive dampened (Pos. Dampened) effects. The zones above the upper dashed line are considered as not being risky, including positive synergistic (Pos. Synergism), positive antagonistic (Pos. Antagonism), and negative dampened (Neg. Dampened) effects.
Results
Relative Changes in Biomasses and the Ecological Indicators
Under unfavorable conditions, relative biomass changes were negative for all scenarios except DoubF_BasePl_BaseMam for two species: Walleye Pollock and Arrowtooth Flounder (Figure 3). As time progressed from the first to the second 10 years of simulation, relative biomass changes tended to become more negative for all species. During the first 10 years, the scenario BaseF_HalfPl_BaseMam resulted in larger biomass reductions than the scenario BaseF_BasePl_DoubMam for Pacific Herring, but not for Pacific Cod, Lingcod, and Walleye Pollock (Figure 3A), suggesting that Pacific Herring were more sensitive to plankton biomass halving, while Pacific Cod, Lingcod, and Walleye Pollock were more vulnerable to mammal biomass doubling. Compared to the baseline situation where fishing mortality rates were at historical levels, the scenario DoubF_BasePl_BaseMam resulted in larger biomass reductions for Pacific Cod, Lingcod, and Pacific Halibut, suggesting that these three species were susceptible to the increase in fishing pressure. By contrast, this scenario resulted in the smallest biomass reductions for Pacific Herring, and in biomass increase for Walleye Pollock, and Arrowtooth Flounder contrary to what may be expected. This result may be due to the fact that the depleted predator populations resulting from doubled fishing mortality rates may have led to a reduction of the predation pressure exerted on Pacific Herring, Walleye Pollock, and Arrowtooth Flounder. As time progressed to the second 10 years of simulation, biomass reduction under the scenario BaseF_HalfPl_DoubMam worsened for all species, and resulted in only slightly higher biomass levels than the scenario DoubF_HalfPl_DoubMam where the three drivers of change acted collectively (Figure 3B).
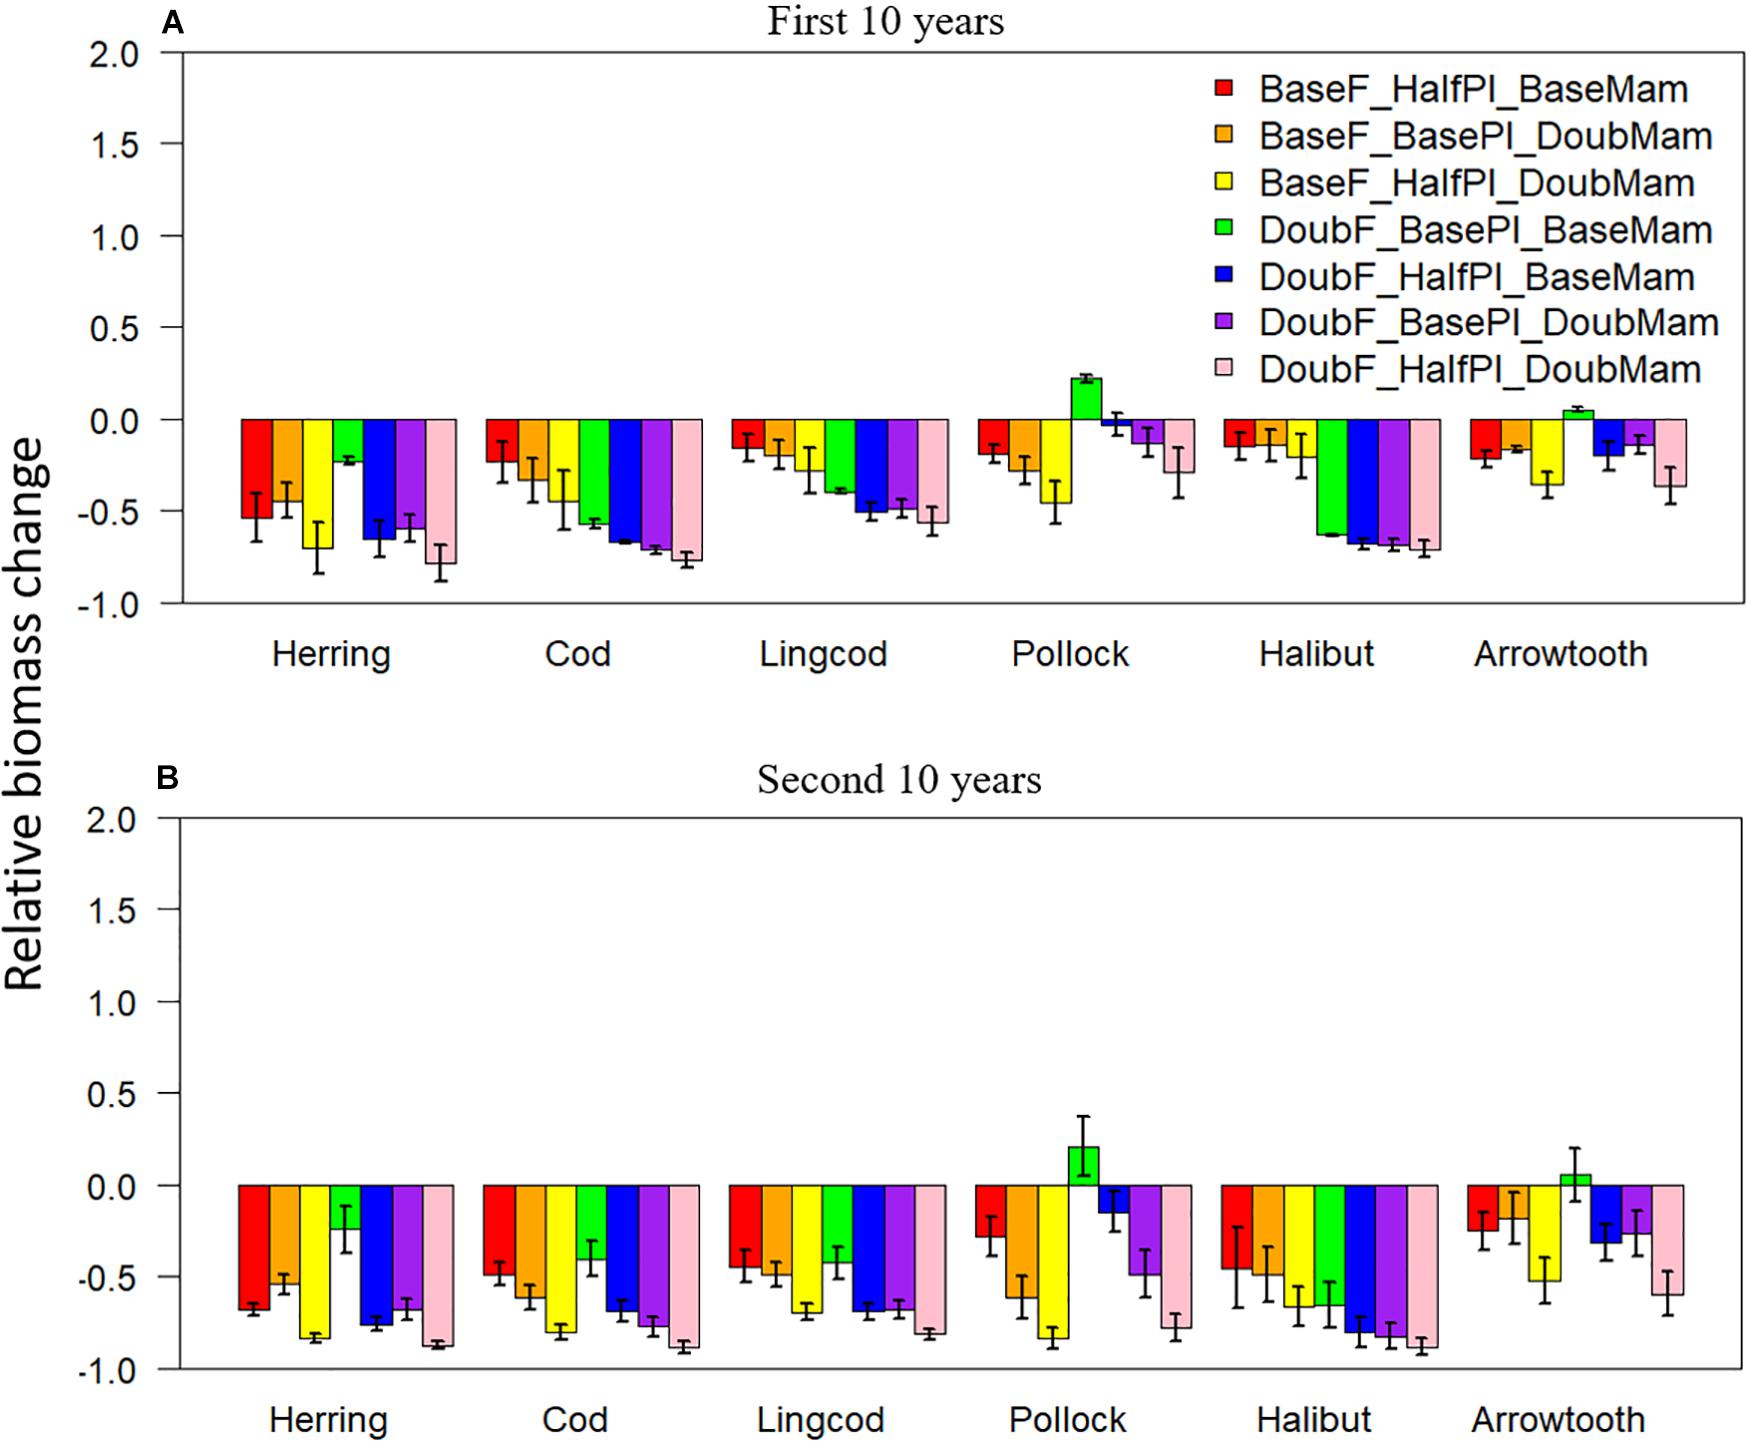
Figure 3. Biomass change relative to the baseline scenario (where fishing mortality rates, plankton biomass, and marine mammal biomass are all set to their historical levels) for six fish species [Herring: Pacific Herring (Clupea pallasii), Cod: Pacific Cod (Gadus macrocephalus), Lingcod (Ophiodon elongatus), Pollock: Walleye Pollock (Gadus chalcogrammus), Halibut: Pacific Halibut (Hippoglossus stenolepis), and Arrowtooth: Arrowtooth Flounder (Atheresthes stomias)] under seven unfavorable condition scenarios where stressors act individually or simultaneously. The acronyms of the seven unfavorable condition scenarios are provided here and their definition can be found in Table 3. Panels (A,B) are for the first and second 10 years of the 20-year simulation experiment period, respectively.
Among all the ecological indicators, total biomass was the only indicator that showed significantly negative responses (with 95% confidence intervals all below zero) to the seven unfavorable scenarios during both the first and the second 10 years of simulation (Figure 4). In comparison, the biomasses of lower- or higher-trophic-level fish species showed large variability during one of the two 10-year periods (with confidence intervals encompassing zero), suggesting that biomasses are more variable at the functional group level than at the ecosystem level. As a result, the biomass ratio of lower and higher-trophic-level fish species (B_L2H) also showed high variability, particularly during the second 10 years of simulation (Figure 4B). The biomass to yield ratio, similar to the total biomass, was generally negative and showed relatively small variability, suggesting that it can appropriately track unfavorable conditions. Contrary to most indicators, the large fish indicator LFI20 increased relative to the baseline scenario under all seven unfavorable scenarios during both the first and the second 10 years. The increases were even greater for the large fish indicator LFI40 (except under the scenario DoubF_BasePl_BaseMam), implying that halving plankton biomass and/or doubling mammal biomass increased the proportion of large fish, particularly those >40 cm. Mean trophic level was largely unaffected by the unfavorable conditions; however, the confidence intervals were large, revealing the strong variability of this indicator, particularly during the first 10 years of simulation.
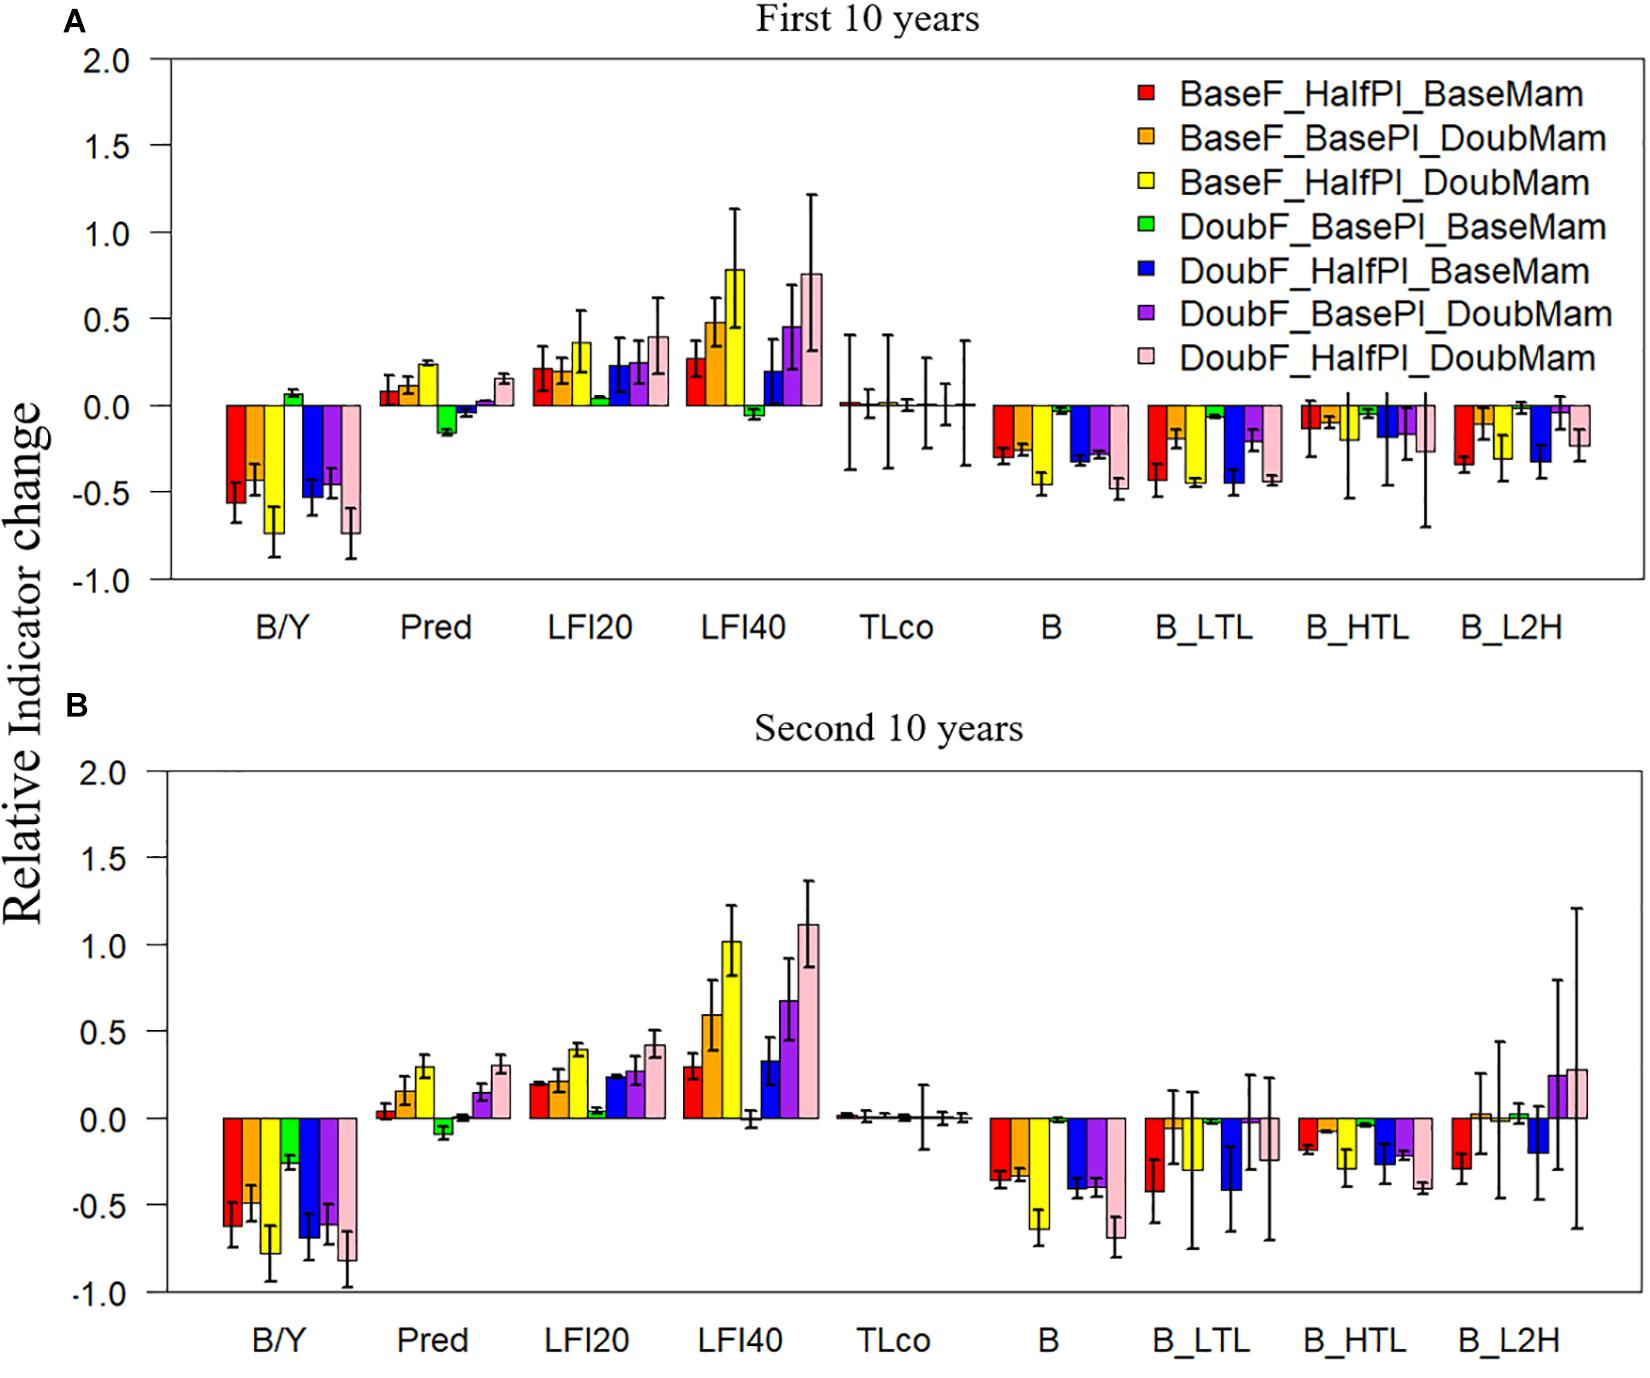
Figure 4. Changes in ecological indicators (B/Y: biomass to fisheries yield ratio, Pred: proportion of predatory fishes, LFI20: proportion of large fish (>20 cm) indicator, LFI40: proportion of large fish (>40 cm) indicator, TLco: mean trophic level of the community, B: total biomass of all-trophic-level taxa, B_LTL: biomass of lower-trophic-level taxa, B_HTL: biomass of higher-trophic-level taxa, and B_L2H: ratio of B_LTL to B_HTL) relative to the baseline scenario (where fishing mortality rates, plankton biomass, and marine mammal biomass are all set to their historical levels) under seven unfavorable condition scenarios where stressors act individually or simultaneously. The acronyms of the seven unfavorable condition scenarios are provided here and their definition can be found in Table 3. Panels (A,B) are for the first and second 10 years of the 20-year simulation experiment period, respectively.
Biomass changes relative to the baseline scenario were positive under the seven favorable condition scenarios for all six species, and they also tended to be greater during the second 10 years of simulation for most species, especially Pacific Herring and Pacific Cod (Figure 5). During the first 10 years, the scenario BaseF_DoubPl_HalfMam tended to produce the largest biomass increases for all species except for Pacific Cod, which had the largest biomass increase under the scenario HalfF_DoubPl_HalfMam (Figure 5A). This result indicates that Pacific Cod may benefit the most from halved fishing mortality rates. The biomass of all species except Pacific Cod was virtually unchanged under the scenario HalfF_BasePl_BaseMam, implying that the fishing mortality rates for all species except Pacific Cod in the last 20 years of simulation were so small that halving fishing mortality rates had no impact on the status of fish populations. During the first 10 years, the scenario BaseF_DoubPl_BaseMam generally showed larger biomass increases than the scenario BaseF_BasePl_HalfMam, suggesting that doubling plankton biomass had a greater effect on species biomasses than halving mammal biomass. However, this was not true anymore for Pacific Herring during the second 10 years of simulation (Figure 5B), suggesting that the effect of reduced mammal predation resulting from halving mammal biomass became incrementally larger as time progressed. During the second 10 years, the scenario HalfF_DoubPl_HalfMam did not result in the largest biomass increases for all species except for Pacific Cod, which entails that the dramatic increase in Pacific Cod biomass may have largely affected all other species either through predation or competition for food.
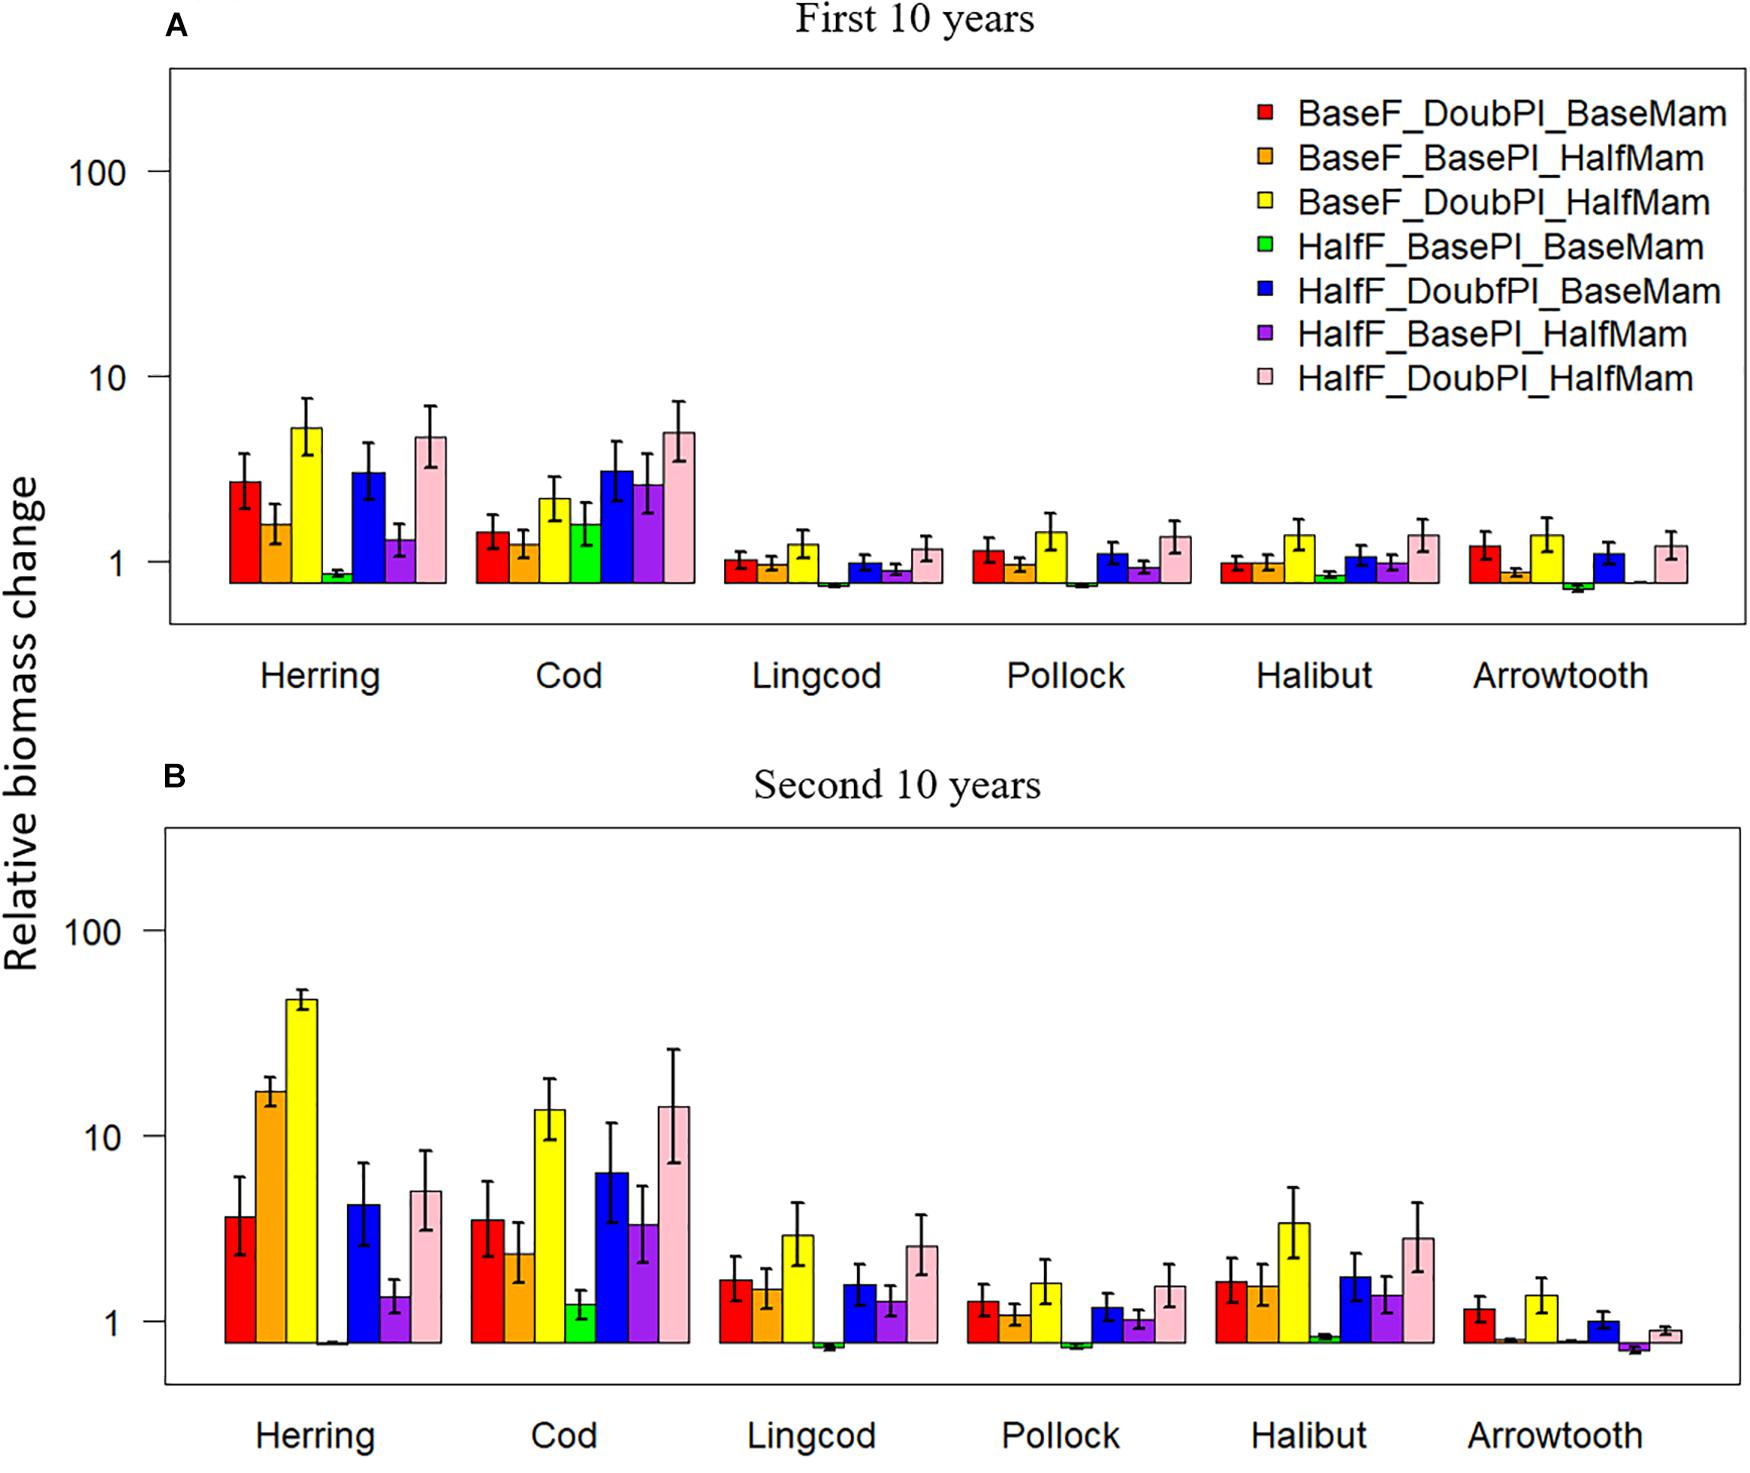
Figure 5. Biomass changes (at a log-10 scale) relative to the baseline scenario (where fishing mortality rates, plankton biomass, and marine mammal biomass are all set to their historical levels) for six fish species [Herring: Pacific Herring (Clupea pallasii), Cod: Pacific Cod (Gadus macrocephalus), Lingcod (Ophiodon elongatus), Pollock: Walleye Pollock (Gadus chalcogrammus), Halibut: Pacific Halibut (Hippoglossus stenolepis), and Arrowtooth: Arrowtooth Flounder (Atheresthes stomias)] under seven favorable condition scenarios where stressors act individually or simultaneously. The acronyms of the seven favorable condition scenarios are provided here and their definition can be found in Table 3. Panels (A,B) are for the first and second 10 years of the 20-year simulation experiment period, respectively.
Under favorable conditions, the biomass to yield ratio, total biomass, and the biomasses of lower- and higher-trophic-level fish species all displayed positive changes relative to the baseline scenario under the seven favorable condition scenarios (Figure 6). By contrast, the proportion of predatory fish exhibited either negative or positive changes, implying its unpredictable responses to different favorable drivers. Contrary to most indicators, the large fish indicators LFI20 and LFI40 were reduced under all favorable condition scenarios, particularly under the scenarios where fishing mortality rates were at baseline levels, which was primarily due to the disproportional increase of Pacific Herring, the smallest among the focus key species, as well as density-dependent reduction in somatic growth. Again, mean trophic level was largely unaffected by the drivers of change yet exhibited large variability, revealing the strong variability of this indicator, particularly during the second 10 years of simulation.
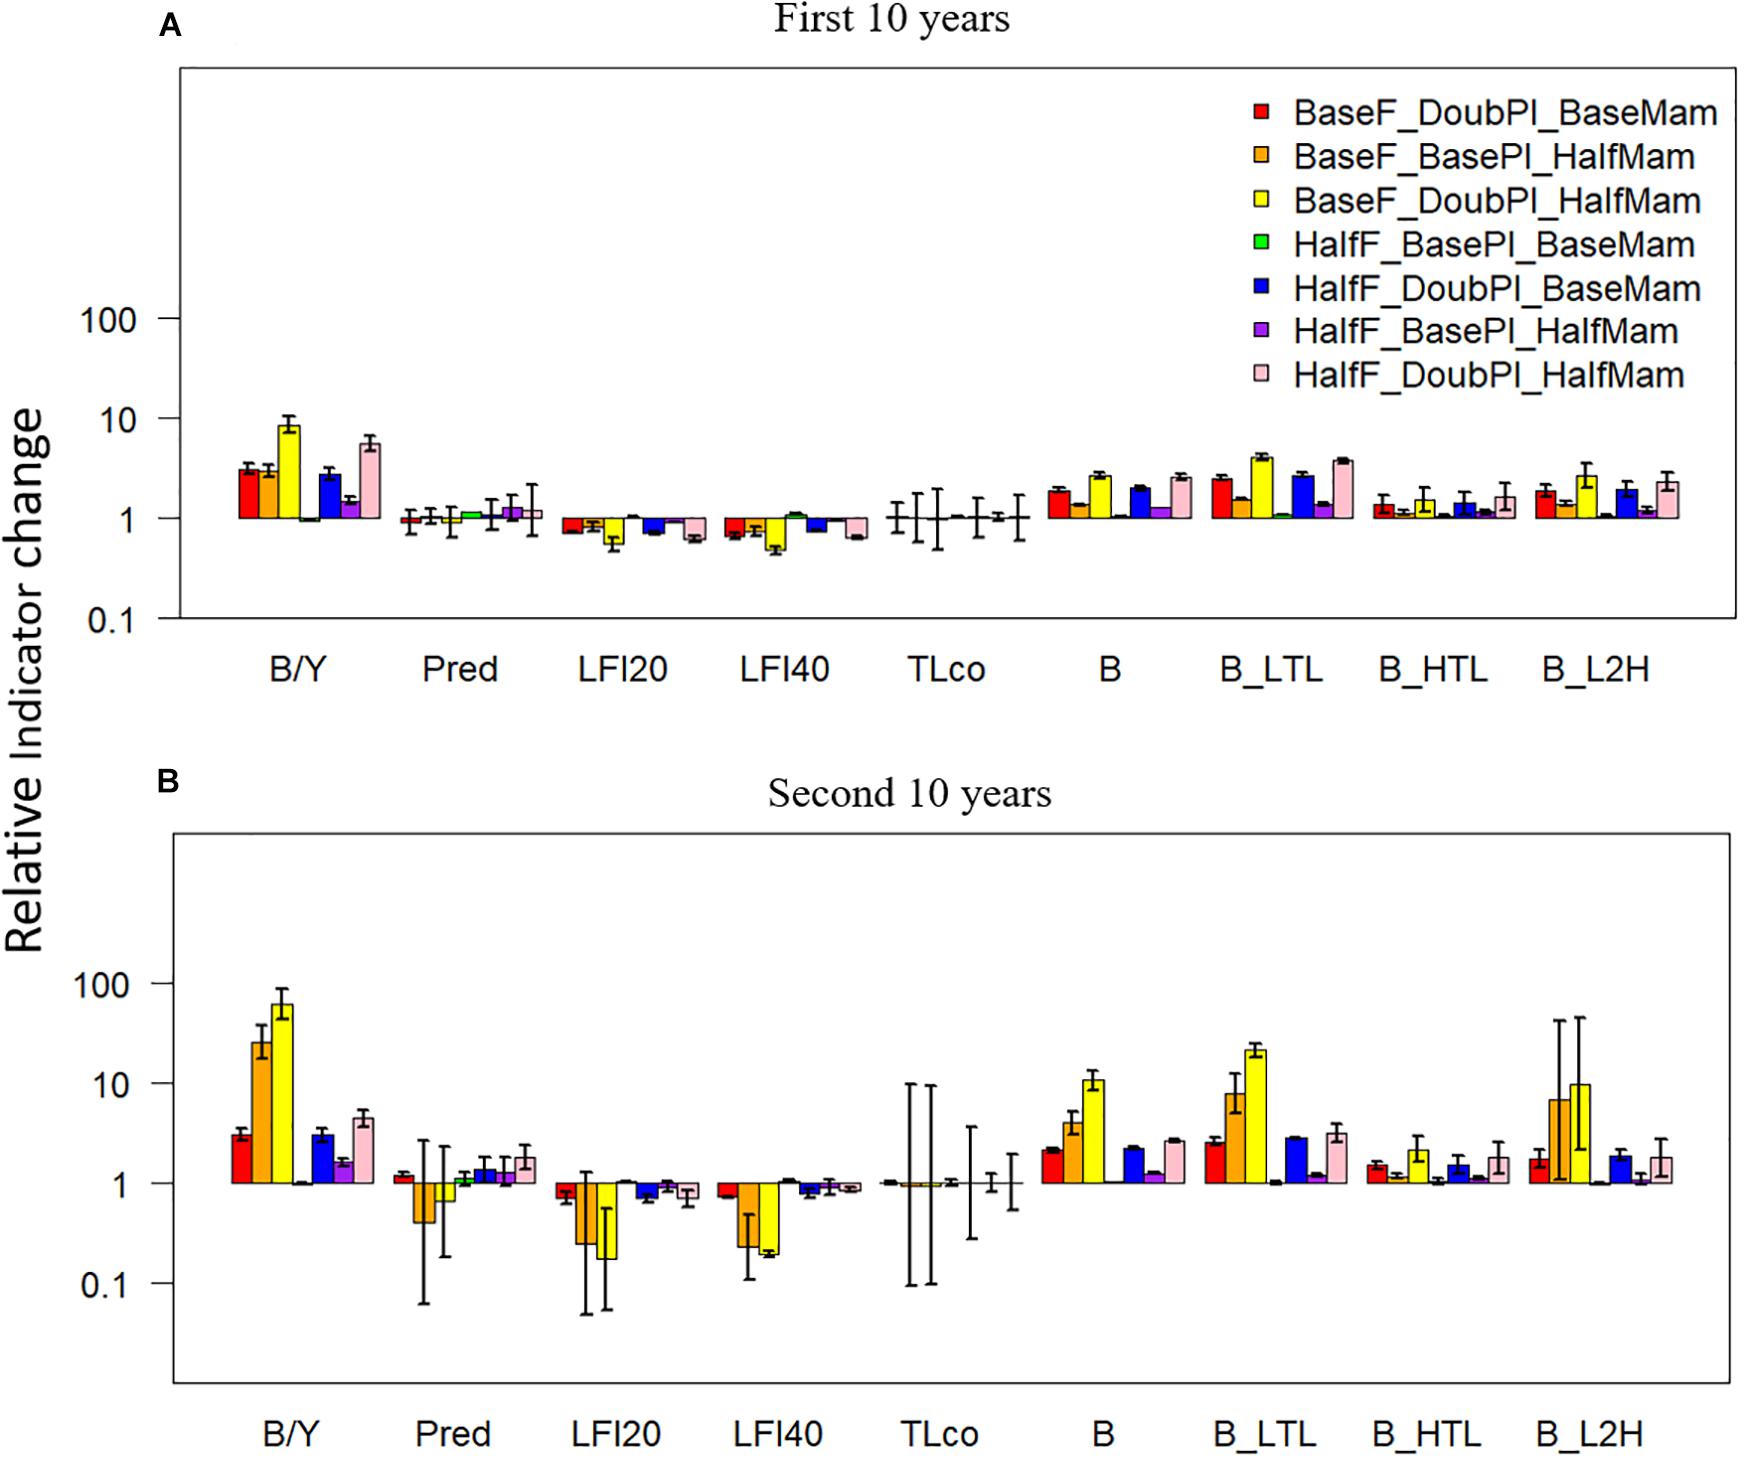
Figure 6. Changes (at a log-10 scale) in ecological indicators (B/Y: biomass to fisheries yield ratio, Pred: proportion of predatory fishes, LFI20: proportion of large fish (>20 cm) indicator, LFI40: proportion of large fish (>40 cm) indicator, TLco: mean trophic level of the community, B: total biomass of all-trophic-level taxa, B_LTL: biomass of lower-trophic-level taxa, B_HTL: biomass of higher-trophic-level taxa, and B_L2H: ratio of B_LTL to B_HTL) relative to the baseline scenario (where fishing mortality rates, plankton biomass, and marine mammal biomass are all set to their historical levels) under seven favorable condition scenarios where stressors act individually or simultaneously. The acronyms of the seven favorable condition scenarios are provided here and their definition can be found in Table 3. Panels (A,B) are for the first and second 10 years of the 20-year simulation experiment period, respectively.
Combined Effects
Under unfavorable conditions, the responses to the combined effects of two or three factors varied among the different species (Figure 7). During the first 10 years of simulation, Pacific Herring and all species combined showed nearly 100% negative synergism under the scenario BaseF_HalfPl_DoubMam, while Pacific Cod demonstrated nearly 100% negative antagonism (Figure 7A). Other species, including Lingcod, Walleye Pollock, and Arrowtooth Flounder, were also affected by negative synergism under this scenario. However, when fishing mortality rates were doubled, regardless of whether mammal biomass was doubled (DoubF_BasePl_DoubMam), plankton biomass was halved (DoubF_HalfPl_BaseMam) or both whether mammal and plankton biomasses were altered (DoubF_HalfPl_DoubMam), negative dampened effects became dominant for all species except Walleye Pollock and Arrowtooth Flounder. For all species combined, additive effects contributed to around 50% when doubled fishing mortality rates were combined with either halved plankton biomass or doubled mammal biomass. During the second 10 years of simulation, additive effects were reduced under the four above-mentioned scenarios (BaseF_HalfPl_DoubMam, DoubF_BasePl_DoubMam, DoubF_ HalfPl_BaseMam, and DoubF_HalfPl_DoubMam) (Figure 7B). Under the scenario BaseF_HalfPl_DoubMam, all species were predominantly influenced by negative synergism. When fishing mortality rates were doubled (i.e., under the scenarios DoubF_BasePl_DoubMam, DoubF_HalfPl_BaseMam, and DoubF_HalfPl_DoubMam), negative dampened effects became even more prevailing for Pacific Herring, Pacific Cod, Lingcod, and Pacific Halibut. For Walleye Pollock and Arrowtooth Flounder, however, negative synergism became more prevailing during the second 10 years of simulation than during the first 10 years. For all species combined, negative synergism became more dominant during the second 10 years of simulation when doubled fishing mortality rates were combined with either halved plankton biomass or doubled mammal biomass. However, when all three drivers interacted together, additive effects became dominant while negative synergism largely diminished.
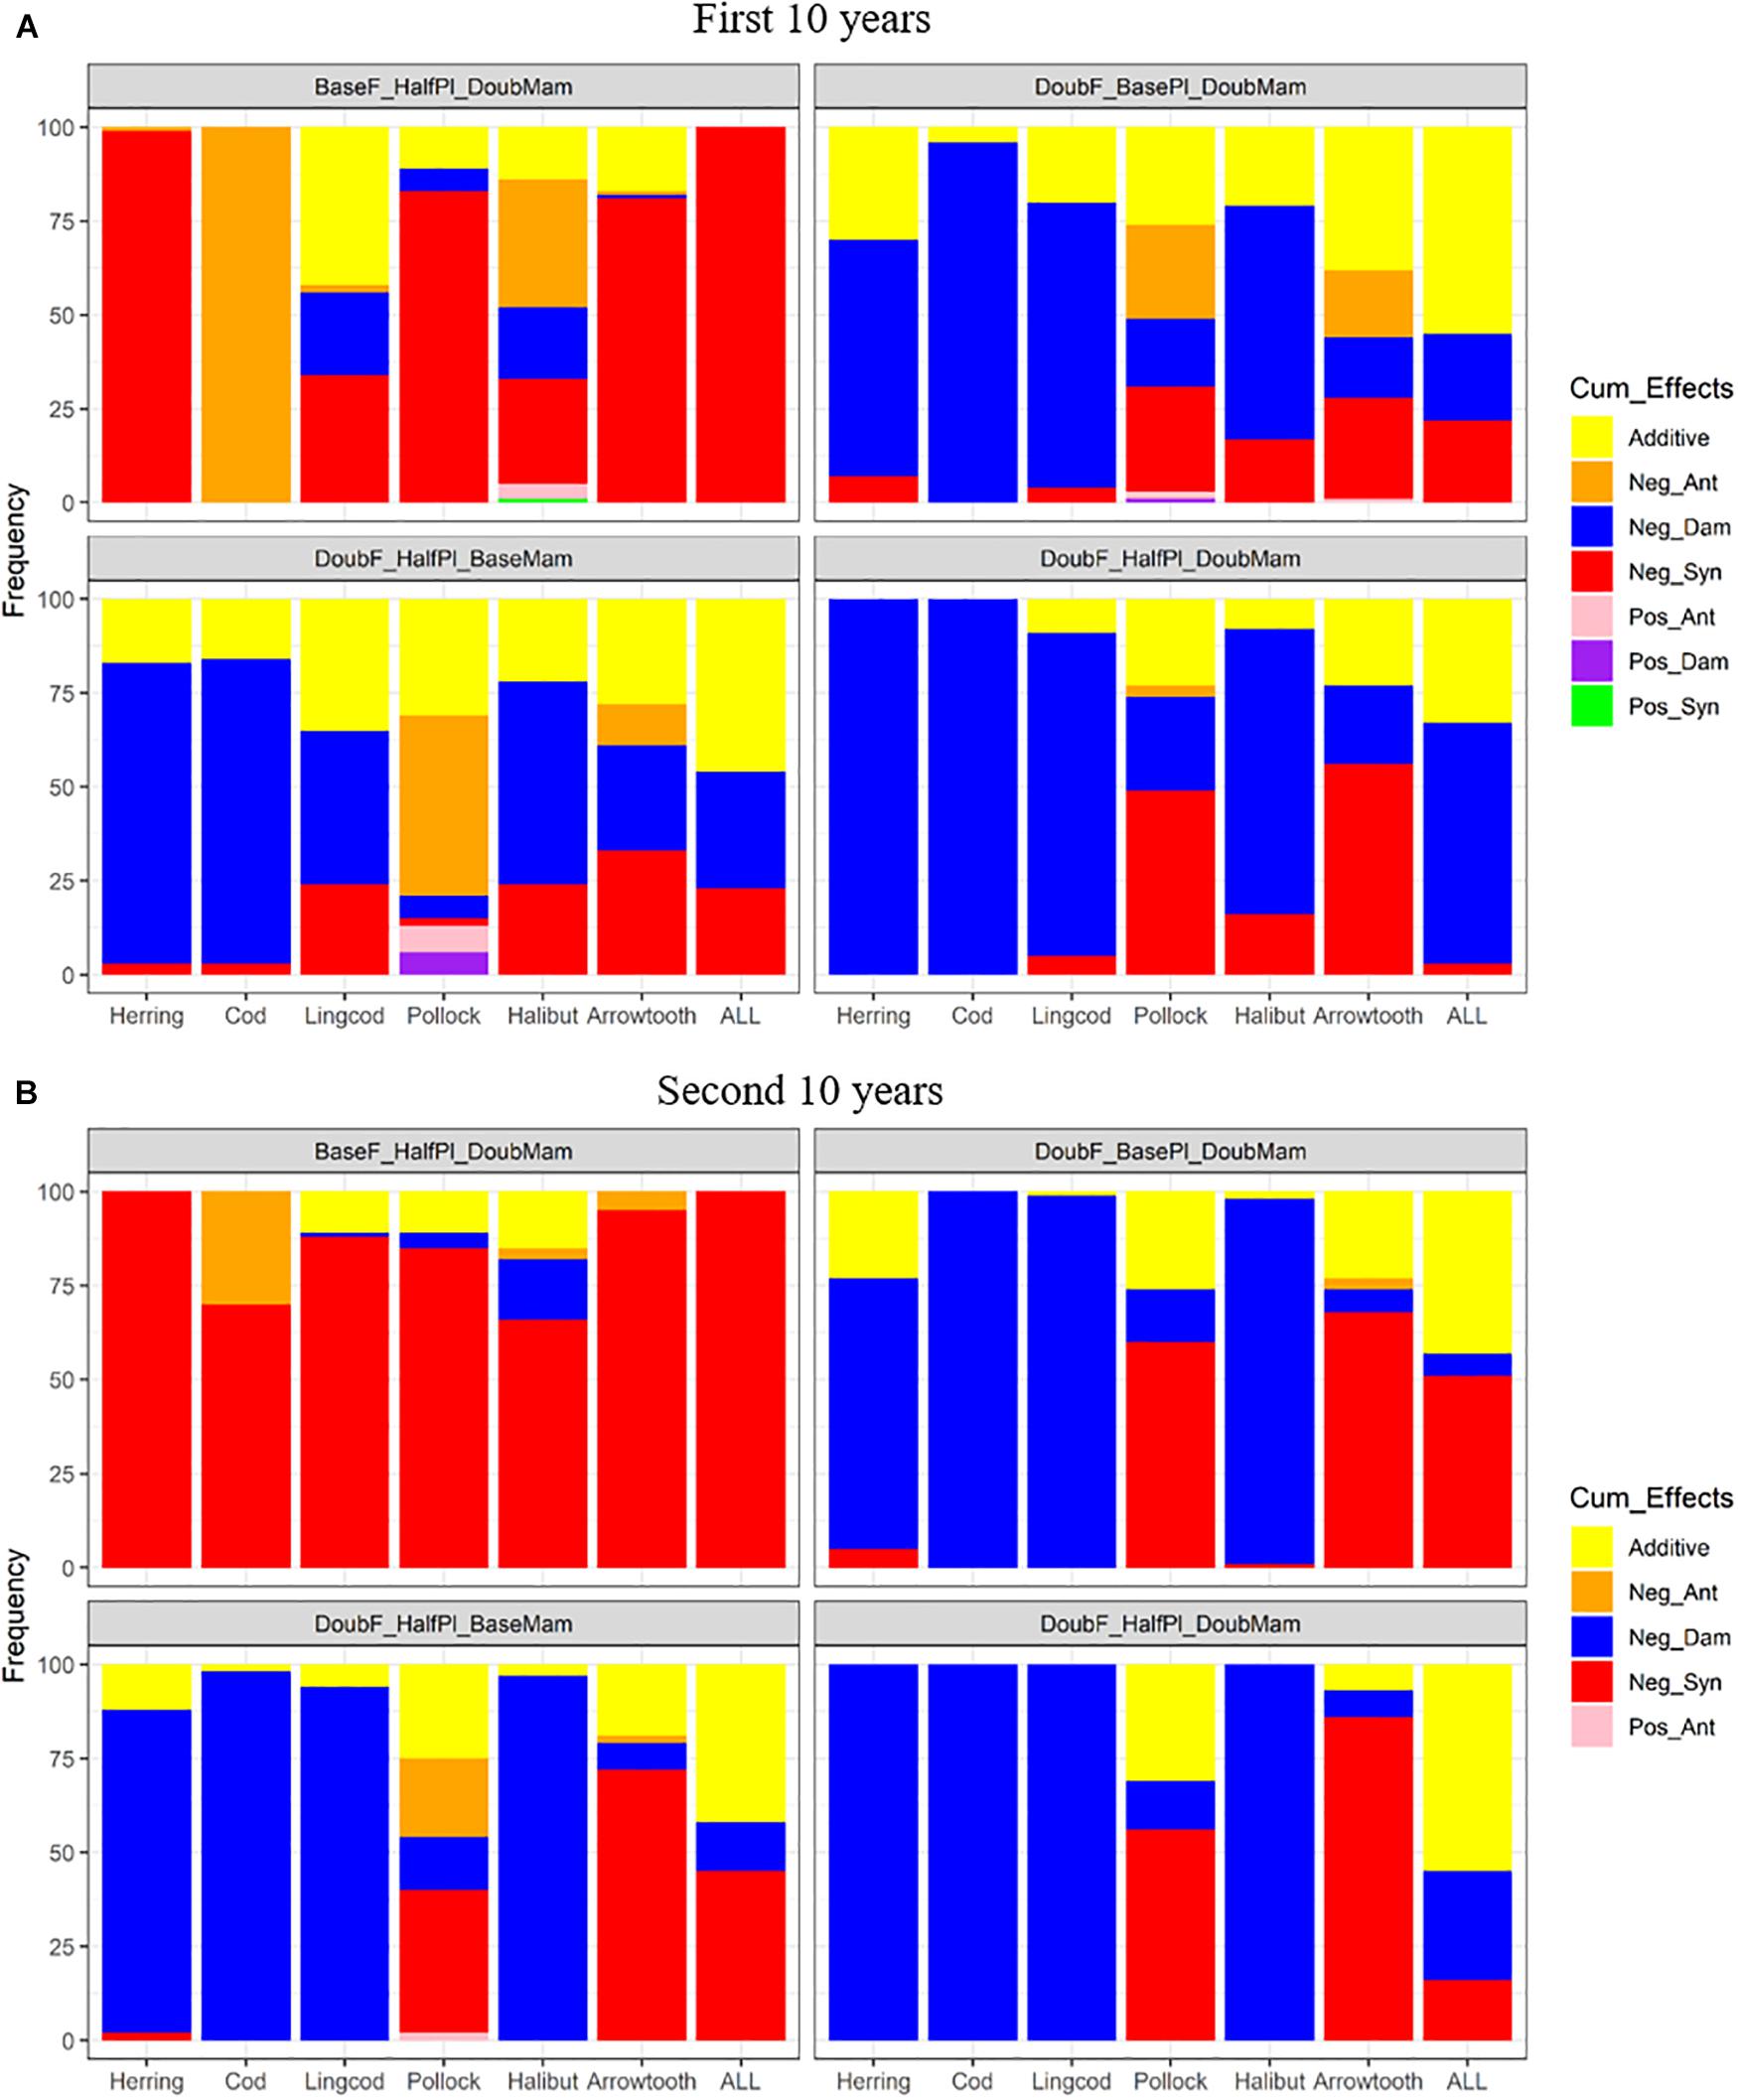
Figure 7. Stacked bar plots of seven combined effects (Additive: additive effect, Nag_Ant: negative antagonism, Neg_Dam: negative dampened, Neg_Syn: negative synergism, Pos_Ant: positive antagonism, Pos_Dam: positive dampened, and Pos_Syn: positive synergism) for the biomasses of six fish species (Herring: Pacific Herring (Clupea pallasii), Cod: Pacific Cod (Gadus macrocephalus), Lingcod (Ophiodon elongatus), Pollock: Walleye Pollock (Gadus chalcogrammus), Halibut: Pacific Halibut (Hippoglossus stenolepis), and Arrowtooth: Arrowtooth Flounder (Atheresthes stomias) and the total biomass of all species (ALL) under four unfavorable condition scenarios where stressors act simultaneously. The acronyms of the unfavorable condition scenarios are provided here and their definition can be found in Table 3. Panels (A,B) are for the first and second 10 years of the 20-year simulation experiment period, respectively.
Under favorable conditions, the responses to the combined effects of two or three factors also varied among the different species (Figure 8). Pacific Cod benefited the most from all combinations of two or three factors, showing predominantly positive synergism. While Pacific Herring showed largely positive synergism for three of the four combinations during the first 10 years of simulation (Figure 8A), the scenario HalfF_BasePl_HalfMam produced predominantly positive dampened effects, which was also true for all species combined. This result suggests that the benefits of halving fishing mortality rates and mammal biomass were compromised when plankton biomass was not increased to meet the food requirement of the increasing Pacific Herring populations and the increased total biomass. Compared to the scenario BaseF_DoubPl_HalfMam, all the scenarios where fishing mortality rates were halved while the biomass of plankton and/or marine mammals was doubled produced less positive synergism for all species except for Pacific Cod. Under the scenario HalfF_DoubPl_HalfMam, positive synergism was dominant for Pacific Herring, Pacific cod, and all species combined. As time progressed to the second 10 years, the relative frequencies of various combined effects for each species were generally unchanged except that there were less additive effects under all four above-mentioned scenarios (HalfF_BasePl_HalfMam, BaseF_DoubPl_HalfMam, HalfF_DoubPl_BaseMam, and HalfF_DoubPl_HalfMam) (Figure 8B). For all species combined and for Pacific Herring, there were relatively more positive dampened effects under all four scenarios compared to the first 10 years. Under the scenarios HalfF_DoubPl_BaseMam and HalfF_DoubPl_HalfMam, positive dampened effects tended to be greater for most species (except for Pacific Cod) during the second 10 years of simulation, implying that the benefits of halved fishing mortality rates combined with doubled plankton biomass or even with halved mammal biomass were less than expected under additive effects as time progressed.
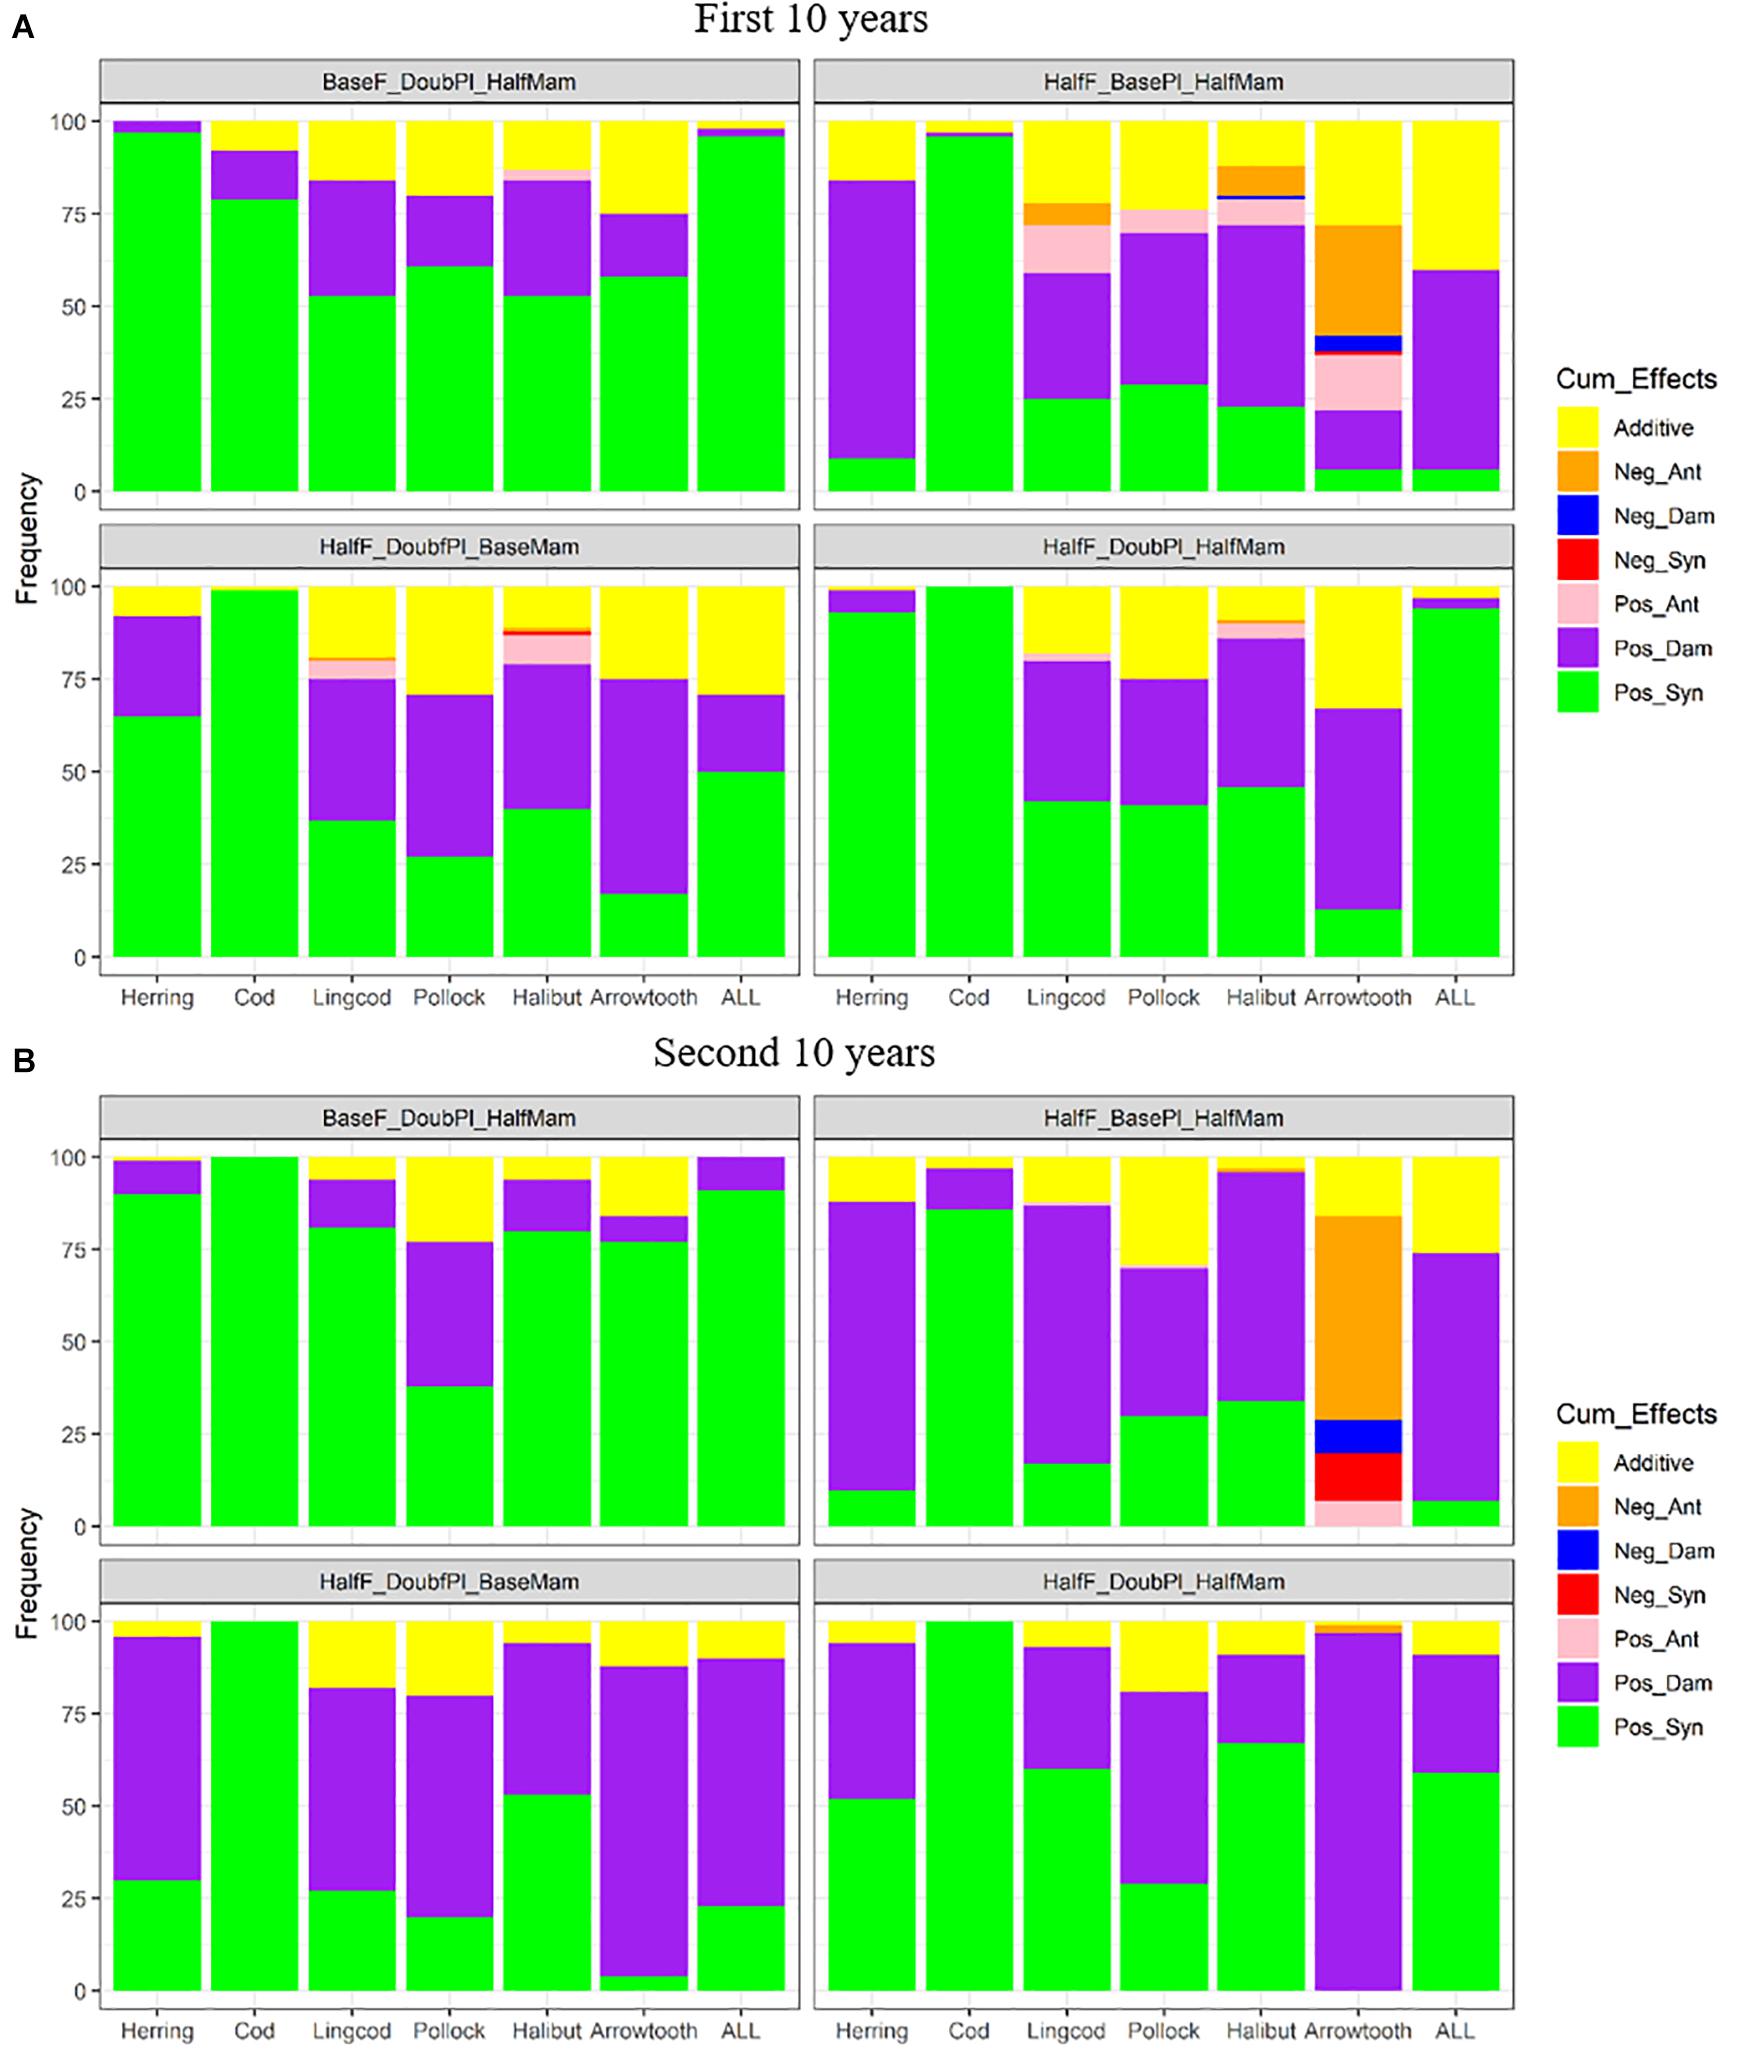
Figure 8. Stacked bar plots of seven combined effects (Additive: additive effect, Nag_Ant: negative antagonism, Neg_Dam: negative dampened, Neg_Syn: negative synergism, Pos_Ant: positive antagonism, Pos_Dam: positive dampened, and Pos_Syn: positive synergism) for the biomasses of six fish species (Herring: Pacific Herring (Clupea pallasii), Cod: Pacific Cod (Gadus macrocephalus), Lingcod (Ophiodon elongatus), Pollock: Walleye Pollock (Gadus chalcogrammus), Halibut: Pacific Halibut (Hippoglossus stenolepis), and Arrowtooth: Arrowtooth Flounder (Atheresthes stomias) and the total biomass of all species (ALL) under four favorable condition scenarios where stressors act simultaneously. The acronyms of the favorable condition scenarios are provided here and their definition can be found in Table 3. Panels (A,B) are for the first and second 10 years of the 20-year simulation experiment period, respectively.
Discussion
The plankton community and marine mammal biomass within the BC marine ecosystem have changed over the last decades partially due to species redistributions as a result of climate change (Keister et al., 2011; Boldt et al., 2019). Such spatial redistributions of marine species are believed to serve as a way of adapting to environmental changes (Miller et al., 2018) and their ecological consequences need to be investigated from an ecosystem perspective, as ecosystem components at different trophic levels interact actively and impact the entire food web (Stenseth et al., 2002; Bonebrake et al., 2018). Using the individual-based ecosystem simulation model OSMOSE-BC, we were able to investigate how fish species biomass and ecological indicators would change relative to the historical (baseline) scenario when the BC ecosystem was hypothetically subjected to changes in three drivers: fishing mortality rates, plankton biomass, and marine mammal biomass. We were also able to examine the cumulative impacts of the three drivers on the dynamics of the focus species as well as the whole BC ecosystem.
We arrived at the following findings. First, under unfavorable conditions for the focus fish species (i.e., doubling fishing mortality rates, halving plankton biomass, and doubling mammal biomass), the total biomass and biomass to yield ratio were reduced consistently, while other indicators had mixed responses and the different focus species exhibited different degrees of biomass reduction among different scenarios. When both plankton biomass was halved and mammal biomass doubled, negative synergistic effects dominated for most species under the historical fishing mortality rates, while negative dampened effects became more prevalent under doubled fishing mortality rates. Second, when all factors were favorable from the perspective of sustaining commercial fish biomasses (i.e., halving fishing mortality rates, doubling plankton biomass, and halving mammal biomass), the biomasses of the focus species did not increase as much as would be expected under additive effects, as a result of the complex predator-prey interactions occurring in the modeled system. Total biomass showed consistently positive responses and was most stable during the first and second 10 years of simulation. While the combined effects of doubling plankton biomass and halving mammal biomass were largely positive synergistic, halving fishing mortality rates tended to produce more positive dampened effects when it was combined with doubling plankton biomass and/or halving mammal biomass.
Implications for Ecosystem-Based Fisheries Management
Fishing, climate change, particularly in the form of extreme climate conditions (Smale et al., 2019; Ainsworth et al., 2020), and trophic interactions, are important factors that act together, resulting in profound changes in many marine ecosystems (Corrales et al., 2017; Foley et al., 2017). Understanding the cumulative impacts of multiple drivers of change on individual fish species, as well as on the studied ecosystem as a whole, is key to moving toward ecosystem-based fisheries management (Rosenberg and McLeod, 2005; Leslie and McLeod, 2007; Ban et al., 2014). This topic has become even more heated in recent years as the entire globe is facing an unprecedented situation where climate change, species distribution shifts, and more intense anthropogenic activities such as increased fisheries exploitation are all interactively affecting the structure and functioning of marine ecosystems (e.g., Kirby et al., 2009; Schinegger et al., 2016; Bonebrake et al., 2018; Ramírez et al., 2018).
Considerable knowledge gaps remain in understanding the interactive and cumulative effects of multiple stressors (Ban et al., 2014; Corrales et al., 2017). Such a lack of understanding may largely be driven by the complexity of marine ecosystems, where interacting components can either propagate or counter the effects of environmental change on individual species and communities (Goldenberg et al., 2018). Therefore, ecological complexities, particularly in the form of climate-induced species redistributions, multi−species interactions, and long−term dynamics at multiple trophic levels, should be considered in forecasting the likely outcomes of different management actions in the context of ecosystem-based fisheries management (Bonebrake et al., 2018). The individual-based ecosystem modeling platform OSMOSE is well-suited to explicitly account for these ecological complexities for assessing the impacts of multiple environmental and anthropogenic drivers at the species, community, and ecosystem levels. The results presented in this study complement a previous study where OSMOSE was used to provide strategic perspectives on ecosystem-based management actions in the face of climate change (Guo et al., 2020). Below, we discuss specific issues that are essential to effective ecosystem-based fisheries management, including properly understanding the species-specific effects of drivers of change, temporal considerations, and the response of ecological indicators.
Properly Understanding the Species-Specific Effects of Drivers of Change
Previous research has indicated that when and how a species responds to multiple drivers depends on its biological characteristics (e.g., life-history traits, trophic level), exploitation history, and the ecosystem being considered (Fuller et al., 2015; Fu et al., 2017, 2018; Serpetti et al., 2017; Miloslavich et al., 2018; Ortega-Cisneros et al., 2018; Rilov et al., 2019). Our simulations indicated that Pacific Herring, an important prey to both predatory fish species and marine mammals, was more sensitive to plankton biomass halving compared to the other modeled species, while other focus species, including Pacific Cod, Lingcod, and Walleye Pollock, were more vulnerable to mammal doubling when fishing mortality rates were set at the baseline levels. This result is consistent with the findings of Fu et al. (2017) regarding the potential factors responsible for the declines of Pacific Herring and Pacific Cod in the BC marine ecosystem (Fu et al., 2017). As fishing mortality rates were doubled for all focus species, biomass reductions were smaller for Pacific Herring, Walleye Pollock, and Arrowtooth Flounder, and greater for Pacific Cod, Lingcod, and Pacific Halibut, suggesting that the latter three species were susceptible to the increase of fishing pressure. This result also suggests that the depleted populations of Pacific Cod, Lingcod, and Pacific Halibut resulting from doubled fishing mortality rates may exert a reduced predation pressure on Pacific Herring, Walleye Pollock, and Arrowtooth Flounder, thereby resulting in less pronounced biomass reductions or even biomass increases for these species. This result is also consistent with findings from many other studies (e.g., Travers-Trolet et al., 2014; Ortega-Cisneros et al., 2018) that suggest that fish species at higher trophic levels are more responsive to fishing, while those at lower trophic levels are primarily affected by plankton biomass changes.
The combined effects of different drivers are also species-specific, and they can be either dampened or amplified through food competition and trophic interactions with bottom-up and top-down processes acting simultaneously (Planque et al., 2010; Boyd et al., 2018). Pacific Herring was the only species that experienced 100% negative synergistic effects when both plankton biomass halved and mammal biomass doubled under the baseline fishing mortality rates. Such negative synergistic effects may explain why some Pacific Herring stocks have never recovered even after the implementation of fishery moratorium for nearly two decades now (Cleary et al., 2018). Both the lack of food and increased consumption by top predators were indeed found to be detrimental to Pacific Herring (Fu et al., 2017). Interestingly, when fishing mortality rates were doubled, negative dampened effects became dominant for most species, including Pacific Herring, Pacific Cod, Lingcod, and Pacific Halibut, regardless of the changes in plankton biomass (halving) or mammal biomass (doubling). From the perspective of Pacific Herring, this phenomenon is due to the fact that doubling fishing mortality rates for other predatory species including Pacific Cod, Lingcod, and Pacific Halibut resulted in reductions of their biomass and subsequent predation on Pacific Herring, while doubling fishing mortality rates for the Pacific Herring stocks did not inflict further harm to Pacific Herring because of the nearly zero baseline levels that had been reached for some Pacific Herring stocks.
In contrast to Pacific Herring, Pacific Cod had 100% negative antagonistic effects when both plankton biomass was halved and mammal biomass was doubled under baseline fishing mortality rates. All other species experienced antagonism less frequently than other combined effects (i.e., synergistic and dampened effects). The rarity of antagonism is consistent with the finding in Fu et al. (2018), akin to the “ecological surprises” reported in natural systems (Lindenmayer et al., 2010). Antagonistic effects may become more prevalent under heightened interactions among climate change and other stressors (Lindenmayer et al., 2010), may tend to be large (Fu et al., 2018), and may warrant extreme vigilance from resource managers to prepare for undesirable ecological surprises. Interestingly, the negative antagonistic effect noted for Pacific Cod totally disappeared when fishing mortality rates were doubled, and negative dampened effects became dominant for Pacific Cod along with other species. Such a drastic shift for Pacific Cod from one combined effect to another may be due to the unique trophic position that Pacific Cod occupies in the ecosystem that result in its biomass being greatly impacted by changes in the biomass of other species as a result of changes in fishing pressure. This points to the importance of considering species-specific exploitation history in formulating information for resource managers (Leslie and McLeod, 2007), and also supports the conclusion from other studies that particular combinations of fishing pressure and climate change may affect different species in different ways (e.g., Fuller et al., 2015). Such species-specific responses to multiple drivers of change and how they impact the ecosystem structure and functioning through complex species interactions need to be explicitly integrated through ecosystem modeling in order to develop ecosystem-based fisheries management and appropriate adaptation strategies for fisheries.
Temporal Considerations
Temporal changes are important considerations when studying cumulative effects (Halpern et al., 2015). We specifically compared the occurrences of different cumulative effects between the first and second 10 years of simulation. In particular, the number of occurrences of antagonism decreased during the second 10 years of simulation, implying that ecological surprises may be less likely as time progresses after an ecosystem shift happened. Under unfavorable conditions, the cumulative effects were increasingly dominated by negative synergism under the baseline fishing mortality rates, and by negative dampened effects under the doubled fishing mortality rates, as we moved from the first decade to the second decade of simulation. Similarly, under favorable conditions, the cumulative effects became increasingly dominated by positive synergism under the baseline fishing mortality rates, and by positive dampened effects under the doubled fishing mortality rates as we moved from the first decade to the second decade of simulation. These results also point to the importance of carefully considering the specific exploitation histories of the different modeled species. Although our experimental design can be deemed reasonable as climatic and ecosystem oscillations typically occur over decadal time scales (Lindegren et al., 2018), we encourage future research to consider additional scenarios combining multiple stressors and also investigate the effects of increasingly long periods of simulation on the responses of species and the whole ecosystem to the combination of multiple stressors. We specifically encourage future research to explore the consequences of altering fishing mortality rates and plankton and mammal biomasses more frequently than every 10 or 20 years.
Ecological Indicators
Ecological indicators, particularly food-web indicators such as the ones presented in this study, are essential metrics that are indicative of ecosystem changes caused by multiple drivers, such as fishing and environmental change (e.g., Fu et al., 2019). These ecological indicators are key to the move toward ecosystem-based fisheries management and the development of appropriate resource management measures to maintain healthy ecosystems and restore degraded ecosystems (Thompson et al., 2020). Over the past 25 years, a large number of ecological indicators has been produced (Jennings, 2005; Shin et al., 2012; Shannon et al., 2014). However, there is no one-size-fit-all, and ecological indicators need to be carefully chosen based on their sensitivity, specificity and/or responsiveness, to properly understand how drivers of change may impact particular marine ecosystems under specific exploitation and environmental conditions. In particular, the sensitivity of indicators, i.e., their capacity to vary significantly in response to a given driver, and their responsiveness, i.e., their capacity to respond rapidly to drivers, are properties that are highly desirable for ecological indicators (Fu et al., 2019).
Recently, the GOOS Biology and Ecosystems Panel considered biomass indicators as being Fish Essential Ocean Variables (Miloslavich et al., 2018). Previous multi-ecosystem comparisons based on either empirical data (Fu et al., 2012) or ecosystem simulation data (Fu et al., 2019) revealed that biomass indicators tended to be more environmentally driven but less sensitive to fishing pressure. Comparisons among the nine ecological indicators in the present study identified total biomass as the most consistent indicator over time and the best indicator for tracking the response of ecosystem components to the three drivers of change (fishing mortality, plankton biomass, and marine mammal biomass). This result was due to the fact that fishing pressure was considerably smaller than the other two drivers of change (plankton biomass and marine mammal biomass). In the BC marine ecosystem with the particular exploitation history of various fisheries and the notable changes in plankton and marine mammal biomasses, total biomass appears to be a prime ecological indicator to assess the response of the BC marine ecosystem to drivers of change and facilitate the move toward ecosystem-based fisheries management. Moreover, the biomass to yield ratio was identified as a second best indicator for tracking drivers of change. This indicator was also found to be most useful for indicating changes in fishing pressure across multiple ecosystems (Fu et al., 2019).
The large fish indicators, size-based metrics that reflect the size structure and life history composition of a fish community, serve as a basis for the North Sea Ecological Quality Objective and are key ecosystem state metrics (Greenstreet et al., 2011). However, we found that, under the unfavorable conditions of halved plankton biomass and/or doubled mammal biomass, the large fish indicators LFI20 or LFI40 generally increased, contrary to the biomass indicators. The increases in the large fish indicators in response to unfavorable conditions may be due to the reduction in small-fish biomasses which led to a decrease in total biomass. Moreover, under the favorable condition scenarios, the two large fish indicators decreased in contrast to the biomass indicators, particularly under the scenarios where fishing mortality rates were at baseline levels. Therefore, we concur with Greenstreet et al. (2012) that using the large fish indicator as a sole indicator of ecosystem health is not sufficient to accurately track changes in marine ecosystems. On the other hand, total biomass and the biomass to fisheries yield ratio are two useful indicators that fisheries managers can employ to move toward ecosystem-based fisheries management in the BC marine ecosystem in a context of climate change.
The response of total biomass to the unfavorable (from the perspective of commercial fish species) conditions of halving plankton biomass and doubling marine mammals was 100% negative synergism under the historical fishing mortality rates. This suggests that under this historical fishing pressure, the BC marine ecosystem as a whole could have been subjected to negative synergistic effects. However, a large portion of the negative synergistic effect turned to additive or negative dampened effects when fishing mortality rates were doubled. This implies that the ecological risk of negative synergism could be reduced if fishing pressure was increased for some predatory fishes. This result highlights the importance of managing fisheries in an ecosystem context, rather than on a single-species basis. By contrast, the response of total biomass to the favorable conditions of doubling plankton biomass but halving marine mammal biomass was largely positive synergism, regardless of fishing pressure. Therefore, when conditions were favorable, fishing pressure was not as critical from the perspective of maintaining ecosystem health. However, when plankton biomass was at the baseline level, a large portion of the positive synergism shifted to positive dampened effects under halved fishing mortality rates and mammal biomass, implying that the benefits of reduced fishing pressure and mammal consumption were compromised when plankton biomass was too low. This points to the necessity of evaluating and projecting the dynamics of plankton productivity in the BC marine ecosystem in the face of climate change.
Conclusion
By employing the individual-based spatially explicit ecosystem modeling platform OSMOSE, we were able to draw conclusions on the cumulative effects of fishing, plankton biomass change, and marine mammal consumption on the dynamics of some fish species and the BC marine ecosystem as a whole. It was concluded that the degree to which species biomass was reduced under unfavorable conditions varied among species, and species biomasses did not increase as much as expected under favorable conditions due to the existence of complex predator-prey interactions among fish species. From an ecosystem perspective, the response of ecosystem total biomass to the unfavorable conditions was 100% negative synergism under the historical fishing mortality rates but largely turned to additive or negative dampened effects when fishing mortality rates were doubled, implying that the ecological risk of negative synergism could be reduced if fishing pressure was increased for some predatory fishes. By contrast, the response of ecosystem total biomass to the favorable conditions of doubling plankton biomass but halving marine mammal biomass was largely positive synergism, regardless of fishing pressure. However, when plankton biomass was at the baseline level, a large portion of the positive synergism shifted to positive dampened effects under halved fishing mortality rates and mammal biomass, implying that the benefits of reduced fishing pressure and mammal consumption were compromised when plankton biomass was too low. Both species-specific response and ecosystem response to multiple drivers of change highlight the importance of managing fisheries on an ecosystem basis accounting for external drivers of change as well as complex predator-prey interactions among various species. In addition, our research identified the ecosystem total biomass and the biomass to fisheries yield ratio as two good ecological indicators for tracking ecosystem changes and the impacts from the multiple drivers of change. To conclude, our research provides insights on the cumulative effects of multiple drivers of change and helps fisheries management to prepare for potential future impacts of climate change.
Data Availability Statement
The data analyzed in this study is subject to the following licenses/restrictions: the databases contain sensitive information. Requests to access these datasets should be directed to Bruce Patten (Bruce.Patten@dfo-mpo.gc.ca).
Author Contributions
CF designed and conducted simulations, and drafted the manuscript. YX and CG produced some R code to conduct analyses and generate figures. NO conducted analyses on commercial catch and survey data and produced species distribution maps. HL, NB, PV, Y-JS, AG, and CF contributed to the development of the ecosystem modeling platform. AG and Y-JS made important contributions to the final version of the manuscript. All authors contributed to the article and approved the submitted version.
Conflict of Interest
The authors declare that the research was conducted in the absence of any commercial or financial relationships that could be construed as a potential conflict of interest.
The handling editor declared a past co-authorship with several of the authors CF, AG, and Y-JS.
Funding
This research is funded by the Strategic Program for Ecosystem-Based Research and Advice in Fisheries and Oceans Canada. Y-JS, NB, and PV were supported by the Biodiversa and Belmont Forum project SOMBEE (BiodivScen program, ANR contract n°ANR-18-EBI4-0003-01).
Acknowledgments
We are extremely grateful to the following colleagues (listed alphabetically) who have generously provided different types of data: Leslie Barton, Jennifer Boldt, Jaclyn Cleary, Kristen Daniel, Thomas Doniol-Valcroze, John Ford, Robyn Forrest, Moira Galbraith, Chris Grandin, Kendra Holt, Jim Irvine, Sheena Majewski, John Morris, R. Ian Perry, Ian Stewart, Matt Thompson, Marc Trudel, and Strahan Tucker.
References
Ainsworth, T. D., Hurd, C. L., Gates, R. D., and Boyd, P. W. (2020). How do we overcome abrupt degradation of marine ecosystems and meet the challenge of heat waves and climate extremes? Glob. Change Biol. 26, 343–354. doi: 10.1111/gcb.14901
Ban, S. S., Graham, N. A. J., and Connolly, S. R. (2014). Evidence for multiple stressor interactions and effects on coral reefs. Glob. Change Biol. 20, 681–697. doi: 10.1111/gcb.12453
Bograd, S. J., Kang, S., Di Lorenzo, E., Horii, T., Katugin, O. N., King, J. R., et al. (2019). Developing a social–ecological–environmental system framework to address climate change impacts in the North Pacific. Front. Mar. Sci. 6:333. doi: 10.3389/fmars.2019.00333
Boldt, J. L., Leonard, J., and Chandler, P. C. (eds) (2019). State of the Physical, Biological and Selected Fishery Resources of (Pacific) Canadian Marine Ecosystems in 2018. Can. Tech. Rep. Fish. Aquat. Sci. 3314. Sidney, BC: Fisheries and Oceans Canada, vii+248.
Bonebrake, T. C., Brown, C. J., Bell, J. D., Blanchard, J. L., Chauvenet, A., Champion, C., et al. (2018). Managing consequences of climate-driven species redistribution requires integration of ecology, conservation and social science. Biol. Rev. 93, 284–305. doi: 10.1111/brv.12344
Boyd, P. W., Collins, S., Dupont, S., Fabricius, K., Gattuso, J. P., Havenhand, J., et al. (2018). Experimental strategies to assess the biological ramifications of multiple drivers of global ocean change—A review. Glob. Change Biol. 24, 2239–2261. doi: 10.1111/gcb.14102
Cleary, J. S., Hawkshaw, S., Grinnell, M. H., and Grandin, C. (2018). Status of B.C. Pacific Herring (Clupea pallasii) in 2017 and forecasts for 2018. DFO Can. Sci. Advis. Sec. Res. Doc. 2018/028. Sidney, BC: Fisheries and Oceans Canada, vii+273.
Corrales, X., Coll, M., Ofir, E., Piroddi, C., Goren, M., Edelist, D., et al. (2017). Hindcasting the dynamics of an eastern Mediterranean marine ecosystem under the impacts of multiple stressors. Mar. Ecol. Prog. Ser. 580, 17–36. doi: 10.3354/meps12271
Crain, C. M., Kroeker, K., and Halpern, B. S. (2008). Interactive and cumulative effects of multiple human stressors in marine systems. Ecol. Lett. 11, 1304–1315. doi: 10.1111/j.1461-0248.2008.01253.x
Cury, P., Boyd, I. L., Bonhommeau, S., Anker-Nilssen, T., Crawford, R. J., Furness, R. W., et al. (2011). Global seabird response to forage fish depletion — one-third for the birds. Science 334, 1703–1706. doi: 10.1126/science.1212928
Feld, C. K., Birk, S., Eme, D., Gerisch, M., Hering, D., Kernan, M., et al. (2016). Disentangling the effects of land use and geo-climatic factors on diversity in European freshwater ecosystems. Ecol. Ind. 60, 71–83. doi: 10.1016/j.ecolind.2015.06.024
Foley, M. M., Mease, L. A., Martone, R. G., Prahler, E. E., Morrison, T. H., Murray, C. C., et al. (2017). The challenges and opportunities in cumulative effects assessment. Environ. Impact Assess. Rev. 62, 112–134. doi: 10.1016/j.eiar.2016.06.008
Forrest, R. E., Rutherford, K. L., Lacko, L., Kronlund, A. R., Starr, P. J., and McClelland, E. K. (2015). Assessment of Pacific Cod (Gadus macrocephalus) for Hecate Strait (5CD) and Queen Charlotte Sound (5AB) in 2013. DFO Can. Sci. Advis. Sec. Res. Doc. 2015/052. Sidney, BC: Fisheries and Oceans Canada, xii+197.
Fu, C., Gaichas, S., Link, J. S., Bundy, A., Boldt, J. L., Cook, A. M., et al. (2012). Relative importance of fishing, trophodynamic and environmental drivers in a series of marine ecosystems. Mar. Ecol. Prog. Ser. 459, 169–184. doi: 10.3354/meps09805
Fu, C., Olsen, N., Taylor, N., Grüss, A., Batten, S., Liu, H., et al. (2017). Spatial and temporal dynamics of predator-prey species interactions off western Canada. ICES J. Mar. Sci. 74, 2107–2119. doi: 10.1093/icesjms/fsx056
Fu, C., Perry, R. I., Shin, Y.-J., Schweigert, J., and Liu, H. (2013). An ecosystem modelling framework for incorporating climate regime shifts into fisheries management. Prog. Oceanogr. 115, 53–64. doi: 10.1016/j.pocean.2013.03.003
Fu, C., Travers-Trolet, M., Velez, L., Grüss, A., Bundy, A., Shannon, L. J., et al. (2018). Risky business: the combined effects of fishing and changes in primary productivity on fish communities. Ecol. Modelling 368, 265–276. doi: 10.1016/j.ecolmodel.2017.12.003
Fu, C., Xu, Y., Bundy, A., Grüss, A., Coll, M., Heymans, J. J., et al. (2019). Making ecological indicators management ready: assessing their ability to detect impacts of fishing and environmental change. Ecol. Ind. 105, 16–28. doi: 10.1016/j.ecolind.2019.05.055
Fuller, E., Brush, E., and Pinsky, M. L. (2015). The persistence of populations facing climate shifts and harvest. Ecosphere 6, 1–16. doi: 10.1890/ES14-00533.1
Fulton, E. A. (2011). Interesting times: winners, losers, and system shifts under climate change around Australia. ICES J. Mar. Sci. 68, 1329–1342. doi: 10.1093/icesjms/fsr032
García-Reyes, M., Sydeman, W. J., Thompson, S. A., Black, B. A., Rykaczewski, R. R., Thayer, J. A., et al. (2013). Integrated assessment of wind effects on central California×s pelagic ecosystem. Ecosystems 16, 722–735. doi: 10.1007/s10021-013-9643-6
Giakoumi, S., Halpern, B. S., Michel, L. N., Gobert, S., Sini, M., Boudouresque, C. F., et al. (2015). Towards a framework for assessment and management of cumulative human impacts on marine food webs. Conserv. Biol. 29, 1228–1234. doi: 10.1111/cobi.12468
Godefroid, M., Boldt, J. L., Thorsonb, J. T., Forrest, F., Gauthier, S., Flostrand, L., et al. (2019). Spatio-temporal models provide new insights on the biotic and abiotic drivers shaping Pacific Herring (Clupea pallasi) distribution. Prog. Oceanogr. 178:102198. doi: 10.1016/j.pocean.2019.102198
Goldenberg, S. U., nagelkerken, I., Marangon, E., Bonnet, A., Ferreira, C. M., and Connell, S. D. (2018). Ecological complexity buffers the impacts of future climate on marine consumers. Nat. Clim. Change 8, 229–233. doi: 10.1038/s41558-018-0086-0
Grandin, C., and Forrest, R. (2017). Arrowtooth Flounder (Atheresthes stomias) Stock Assessment for the West Coast of British Columbia. DFO Can. Sci. Advis. Sec. Res. Doc. 2017/025. Sidney, BC: Fisheries and Oceans Canada, v+87.
Greenan, B. J. W., James, T. S., Loder, J. W., Pepin, P., Azetsu-Scott, K., Ianson, D., et al. (2018). “Changes in oceans surrounding Canada,” in Canada’s Changing Climate Report, eds E. Bush and D. S. Lemmen (Ottawa, ON: Government of Canada), 343–423.
Greenstreet, S. P. R., Fraser, H. M., Rogers, S. I., Trenkel, V. M., Simpson, S. D., and Pinnegar, J. K. (2012). Redundancy in metrics describing the composition, structure, and functioning of the North Sea demersal fish community. ICES J. Mar. Sci. 69, 8–22. doi: 10.1093/icesjms/fsr188
Greenstreet, S. P. R., Rogers, S. I., Rice, J. C., Piet, G. J., Guirey, E. J., Fraser, H. M., et al. (2011). Development of the EcoQO for fish communities in the North Sea. ICES J. Mar. Sci. 68, 1–11. doi: 10.1093/icesjms/fsq156
Griffith, G. P., Fulton, E. A., Gorton, R., and Richardson, A. J. (2012). Predicting Interactions among fishing, ocean warming, and ocean acidification in a marine system with whole-ecosystem models. Conserv. Biol. 26, 1145–1152. doi: 10.1111/j.1523-1739.2012.01937.x
Griffith, G. P., Fulton, E. A., and Richardson, A. J. (2011). Effects of fishing and acidification-related benthic mortality on the southeast Australian marine ecosystem. Glob. Change Biol. 17, 3058–3074. doi: 10.1111/j.1365-2486.2011.02453.x
Griffith, G. P., Strutton, P. G., Semmens, J. M., and Fulton, E. A. (2019). Identifying important species that amplify or mitigate the interaction effects of human impacts on marine food webs. Cons. Biol. 33, 403–412. doi: 10.1111/cobi.13202
Guo, C., Fu, C., Forrest, R., Olsen, N., Liu, H., Verley, P., et al. (2019). Ecosystem-based reference points under varying plankton productivity states and fisheries management strategies. ICES J. Mar. Sci. 76, 2045–2059. doi: 10.1093/icesjms/fsz120
Guo, C., Fu, C., Olsen, N., Xu, Y., Grüss, A., Liu, H., et al. (2020). Incorporating environmental forcing in developing ecosystem-based fisheries management strategies. ICES J. Mar. Sci. 77, 500–514. doi: 10.1093/icesjms/fsz246
Haigh, R., Ianson, D., Holt, C. A., Neate, H. E., and Edwards, A. M. (2015). Effects of ocean acidification on temperate coastal marine ecosystems and fisheries in the Northeast Pacific. PLoS One 10:e0117533. doi: 10.1371/journal.pone.0117533
Halpern, B. S., Frazier, M., Potapenko, J., Casey, K. S., Koenig, K., Longo, C., et al. (2015). Spatial and temporal changes in cumulative human impacts on the world’s ocean. Nat. Commun. 6:7615. doi: 10.1038/ncomms8615
Hidalgo, M., Rouyer, T., Molinero, J. C., Massutí, E., Moranta, J., Guijarro, B., et al. (2011). Synergistic effects of fishing-induced demographic changes and climate variation on fish population dynamics. Mar. Ecol. Prog. Ser. 426, 1–12. doi: 10.3354/meps09077
Hodgson, E. E., and Halpern, B. S. (2019). Investigating cumulative effects across ecological scales. Conserv. Biol. 33, 22–32. doi: 10.1111/cobi.13125
Holt, K., King, J. R., and Krishka, B. A. (2016). Stock Assessment for Lingcod (Ophiodon elongatus) in the Strait of Georgia, British Columbia in 2014. DFO Can. Sci. Advis. Sec. Res. Doc. 2016/013. Sidney, BC: Fisheries and Oceans Canada, xi+186.
Jennings, S. (2005). Indicators to support an ecosystem approach to fisheries. Fish Fish. 6, 212–232. doi: 10.1111/j.1467-2979.2005.00189.x
Keister, J. E., Di Lorenzo, E., Morgan, C. A., Combes, V., and Peterson, W. T. (2011). Zooplankton species composition is linked to ocean transport in the Northern California Current. Glob. Change Biol. 17, 2498–2511. doi: 10.1111/j.1365-2486.2010.02383.x
Kirby, R., Beaugrand, G., and Lindley, J. (2009). Synergistic effects of climate and fishing in a marine ecosystem. Ecosystems 12, 548–561. doi: 10.1007/s10021-009-9241-9
Le Bris, A., Mills, K. E., Wahle, R. A., Chen, Y., Alexander, M. A., Allyn, A. J., et al. (2018). Climate vulnerability and resilience in the most valuable North American fishery. Proc. Natl. Acad. Sci. U.S.A. 115, 1831–1836. doi: 10.1073/pnas.1711122115
Lercari, D., Defeo, O., Ortega, L., Orlando, L., Gianelli, I., and Celentano, E. (2018). Long-term structural and functional changes driven by climate variability and fishery regimes in a sandy beach ecosystem. Ecol. Modelling 368, 41–51. doi: 10.1016/j.ecolmodel.2017.11.007
Leslie, H. M., and McLeod, K. L. (2007). Confronting the challenges of implementing marine ecosystem based management. Front. Ecol. Environ. 5:540–548. doi: 10.1890/060093
Lindegren, M., Checkley, D. M., Koslow, J. A., Goericke, R., and Ohman, M. D. (2018). Climate-mediated changes in marine ecosystem regulation during El Niño. Glob. Change Biol. 24, 796–809. doi: 10.1111/gcb.13993
Lindenmayer, D. B., Likens, G. E., Krebs, C. J., and Hobbs, R. J. (2010). Improved probability of detection of ecological “surprises”. Proc. Natl. Acad. Sci. U.S.A. 107, 21957–21962. doi: 10.1073/pnas.1015696107
Mach, M. E., Wedding, L. M., Reiter, S. M., Micheli, F., Fujita, R. M., and Martone, R. G. (2017). Assessment and management of cumulative impacts in California’s network of marine protected areas. Ocean Coast. Manag. 137, 1–11. doi: 10.1016/j.ocecoaman.2016.11.028
Malick, M. J., Cox, S. P., Mueter, F. J., Dorner, B., and Peterman, R. M. (2017). Effects on the North Pacific Current on the productivity of 163 Pacific salmon stocks. Fish. Oceanogr. 26, 268–281. doi: 10.1111/fog.12190
Micheli, F., Halpern, B. S., Walbridge, S., Ciriaco, S., Ferretti, F., Fraschetti, S., et al. (2013). Cumulative human impacts on Mediterranean and Black Sea marine ecosystems: assessing current pressures and opportunities. PLoS One 8:e79889. doi: 10.1371/journal.pone.0079889
Miller, D. D., Ota, Y., Sumaila, U. R., Cisneros-Montemayor, A. M., and Cheung, W. W. L. (2018). Adaptation strategies to climate change in marine systems. Glob. Change Biol. 24, e1–e14. doi: 10.1111/gcb.13829
Miloslavich, P., Bax, N. J., Simmons, S. E., Klein, E., Appeltans, W., Aburto-Oropeza, O., et al. (2018). Essential ocean variables for global sustained observations of biodiversity and ecosystem changes. Glob. Change Biol. 24, 2416–2433. doi: 10.1111/gcb.14108
Niiranen, S., Yletyinen, J., Tomczak, M. T., Blenckner, T., Hjerne, O., Mackenzie, B. R., et al. (2013). Combined effects of global climate change and regional ecosystem drivers on an exploited marine food web. Glob. Change Biol. 19, 3327–3342. doi: 10.1111/gcb.12309
Ortega-Cisneros, K., Cochrane, K. L., Fulton, E. A., Gorton, R., and Popova, E. (2018). Evaluating the effects of climate change in the southern Benguela upwelling system using the Atlantis modelling framework. Fish. Oceanogr. 27, 489–503. doi: 10.1111/fog.12268
Piggott, J. J., Townsend, C. R., and Matthaei, C. D. (2015). Reconceptualizing synergism and antagonism among multiple stressors. Ecol. Evol. 5, 1538–1547. doi: 10.1002/ece3.1465
Planque, B., Fromentin, J.-M., Cury, P., Drinkwate, K. F., Jennings, S., Perry, R. L., et al. (2010). How does fishing alter marine populations and ecosystems sensitivity to climate? J. Mar. Syst. 79, 403–417. doi: 10.1016/j.jmarsys.2008.12.018
Quetglas, A., Ordines, F., Hidalgo, M., Monserrat, S., Ruiz, S., Amores, A., et al. (2013). Synchronous combined effects of fishing and climate within a demersal community. ICES J. Mar. Sci. 70, 319–328. doi: 10.1093/icesjms/fss181
Ramírez, F., Coll, M., Navarro, J., Bustamante, J., and Green, A. J. (2018). Spatial congruence between multiple stressors in the Mediterranean Sea may reduce its resilience to climate impacts. Sci. Rep. 8:14871. doi: 10.1038/s41598-018-33237-w
Rilov, G., Mazaris, A. D., Stelzenmüller, V., Helmuth, B., Wahl, M., Guy-Haim, T., et al. (2019). Adaptive marine conservation planning in the face of climate change: what can we learn from physiological, ecological and genetic studies? Glob. Ecol. Conserv. 17:e00566. doi: 10.1016/j.gecco.2019.e00566
Rosenberg, A. A., and McLeod, K. L. (2005). Implementing ecosystem-based approaches to management for the conservation of ecosystem services. Mar. Ecol. Prog. Ser. 300, 270–274. doi: 10.3354/meps300270
Samhouri, J. F., Andrews, K., Fay, G., Harvey, C. J., Hazen, E. L., Hennessy, S. M., et al. (2017). Defining ecosystem thresholds for human activities and environmental pressures in the California Current. Ecosphere 8:e01860. doi: 10.1002/ecs2.1860
Schinegger, R., Palt, M., Segurado, P., and Schmutz, S. (2016). Untangling the effects of multiple human stressors and their impacts on fish assemblages in European running waters. Sci. Total Environ. 573, 1079–1088. doi: 10.1016/j.scitotenv.2016.08.143
Segurado, P., Almeida, C., Neves, R., Ferreira, M. T., and Branco, P. (2018). Understanding multiple stressors in a Mediterranean basin: combined effects of land use, water scarcity and nutrient enrichment. Sci. Total Environ. 624, 1221–1233. doi: 10.1016/j.scitotenv.2017.12.201
Serpetti, N., Baudron, A. R., Burrows, M. T., Payne, B. L., Helaouët, P., Fernandes, P. G., et al. (2017). Impact of ocean warming on sustainable fisheries management informs the ecosystem approach to fisheries. Sci. Rep. 7:3438. doi: 10.1038/s41598-017-13220-7
Shannon, L. J., Coll, M., Bundy, A., Gascuel, D., Heymans, J. J., Kleisner, K., et al. (2014). Trophic level-based indicators to track fishing impacts across marine ecosystems. Mar. Ecol. Prog. Ser. 512, 115–140. doi: 10.3354/meps10821
Shin, Y.-J., Bundy, A., Shannon, L. J., Blanchard, J. L., Chuenpagdee, R., Coll, M., et al. (2012). Global in scope and regionally rich: an IndiSeas workshop helps shape the future of marine ecosystem indicators. Rev. Fish Biol. Fish. 22, 835–845. doi: 10.1007/s11160-012-9252-z
Shin, Y.-J., and Cury, P. (2004). Using an individual-based model of fish assemblages to study the response of size spectra to changes in fishing. Can. J. Fish. Aquat. Sci. 61, 414–431. doi: 10.1139/f03-154
Smale, D. A., Wernberg, T., Oliver, E. C. J., Thomsen, M., Harvey, B. P., Straub, S. C., et al. (2019). Marine heatwaves threaten global biodiversity and the provision of ecosystem services. Nat. Clim. Change 9, 306–312. doi: 10.1038/s41558-019-0412-1
Sprogis, K. R., Christiansen, F., Wandres, M., and Bejder, L. (2018). El Niño Southern Oscillation influences the abundance and movements of a marine top predator in coastal waters. Glob. Change Biol. 24, 1085–1096. doi: 10.1111/gcb.13892
Stenseth, N. C., Mysterud, A., Ottersen, G., Hurrell, J. W., Chan, K. S., and Lima, M. (2002). Ecological effects of climate fluctuations. Science 297, 1292–1296. doi: 10.1126/science.1071281
Teichert, N., Borja, A., Chust, G., Uriarte, A., and Lepage, M. (2016). Restoring fish ecological quality in estuaries: implication of interactive and cumulative effects among anthropogenic stressors. Sci. Total Environ. 542, 383–393. doi: 10.1016/j.scitotenv.2015.10.068
Thompson, M. S. A., Pontalier, H., Spence, M. A., Pinnegar, J. K., Greenstreet, S., Moriarty, M., et al. (2020). A feeding guild indicator to assess environmental change impacts on marine ecosystem structure and functioning. J. Appl. Ecol. 57, 1769–1781. doi: 10.1111/1365-2664.13662
Travers-Trolet, M., Shin, Y.-J., Shannon, L. J., Moloney, C. L., and Field, J. G. (2014). Combined fishing and climate forcing in the southern benguela upwelling ecosystem: an end-to-end modelling approach reveals dampened effects. PLoS One 9:e94286. doi: 10.1371/journal.pone.0094286
Keywords: cumulative effect, ecosystem-based fisheries management, ecological indicator, ecosystem modeling, synergism
Citation: Fu C, Xu Y, Guo C, Olsen N, Grüss A, Liu H, Barrier N, Verley P and Shin Y-J (2020) The Cumulative Effects of Fishing, Plankton Productivity, and Marine Mammal Consumption in a Marine Ecosystem. Front. Mar. Sci. 7:565699. doi: 10.3389/fmars.2020.565699
Received: 26 May 2020; Accepted: 15 September 2020;
Published: 30 September 2020.
Edited by:
Alida Bundy, Bedford Institute of Oceanography (BIO), CanadaReviewed by:
Tommaso Russo, University of Rome Tor Vergata, ItalyNor Azman Kasan, University of Malaysia Terengganu, Malaysia
Robert Gamble, National Oceanic and Atmospheric Administration (NOAA), United States
Copyright © 2020 Fu, Xu, Guo, Olsen, Grüss, Liu, Barrier, Verley and Shin. This is an open-access article distributed under the terms of the Creative Commons Attribution License (CC BY). The use, distribution or reproduction in other forums is permitted, provided the original author(s) and the copyright owner(s) are credited and that the original publication in this journal is cited, in accordance with accepted academic practice. No use, distribution or reproduction is permitted which does not comply with these terms.
*Correspondence: Caihong Fu, Caihong.Fu@dfo-mpo.gc.ca
†Present address: Chuanbo Guo, State Key Laboratory of Freshwater Ecology and Biotechnology, Institute of Hydrobiology, Chinese Academy of Sciences, Wuhan, China; Arnaud Grüss, National Institute of Water and Atmospheric Research, Wellington, New Zealand